Article

Thermo-Fluid Dynamic Effects of the Radial Location of the Baffle Installed in a Solar Updraft Tower

1
Department of Mechanical System Engineering, Graduate School, Chung-Ang University 84 Heukseok-ro, Dongjak-gu, Seoul 06974, Korea
2
Department of Mechanical Engineering, Graduate School, Chung-Ang University 84 Heukseok-ro, Dongjak-gu, Seoul 06974, Korea
3
School of Mechanical Engineering, Chung-Ang University, Seoul 09674, Korea
*
Author to whom correspondence should be addressed.
Energies 2019, 12(7), 1340; https://doi.org/10.3390/en12071340
Submission received: 12 March 2019 / Revised: 29 March 2019 / Accepted: 4 April 2019 / Published: 8 April 2019
(This article belongs to the Special Issue Solar Energy Harvesting, Storage and Application)

Abstract

:
The solar updraft tower (SUT) is a renewable power generation system that uses the natural convection phenomenon of the ground’s air heated by solar radiation. The baffle is a thermo-fluid dynamic structure that improves the heat exchange efficiency and has been recently reported to be a useful tool to increase the output of the SUT. However, one of the less well-known issues is the relationship between the thermo-fluid dynamic characteristics of the flow in the collector of the SUT and the installation location of the baffle and how this affects the power output and SUT efficiency. In this study, the positive and negative thermo-fluid dynamic effects of the baffle, which vary depending on the installation location, are quantitatively analyzed, and the best location is predicted where the overall kinetic power generated by the SUT is maximized. The target SUT model consists of a chimney (12 m height and 0.25 m diameter) and a collector (1 m height and 10 m diameter), and a total of eight model cases are calculated. The results confirm that the kinetic power is lower or higher than that of the control model having no baffle, depending on the baffle installation location. When the position of the baffle is 4.5 m from the center, the increase in kinetic power is maximized by 8.43%. Two important conclusions are that the baffle should interfere minimally with the progress of the main flow into the chimney, generating kinetic power, and at the same time, the baffle should isolate the inner recirculating flow in order to accumulate the heat in the collector so that the natural convection strength is maximized. The perspective gained from the resulting data is useful for SUT design and for pursuing a higher efficiency in the future.

1. Introduction

Interest in renewable energy is growing around the world as the Paris Agreement was signed in 2015 to reduce global greenhouse gas emissions, the cause of global warming [1]. As this trend develops, various methods of power generation from natural resources with little greenhouse gas emission, such as biomass [2,3], wind power generation [4], and geothermal power generation [5], are being studied. Regarding solar energy, the annual amount of solar radiation reaching Earth’s surface is approximately 3,400,000 EJ (exajoule, 1 × 10¹⁸ J), which is more than 7500 times the annual world primary energy consumption of 450 EJ [6]. This is a very considerable source of energy and is expected to be utilized as an abundant renewable resource. Therefore, various solar energy applications such as solar water heaters, solar cookers, solar dryers, and solar ponds are being studied [6]. Among them, the solar updraft tower (SUT) is a power generation system that uses thermal updraft air flow caused by the natural convection phenomenon of the ground’s air heated by solar radiation. In general, the SUT consists of a chimney located at the center, a collector that receives solar radiation, and an absorber that forms the bottom of the SUT (Figure 1a). The collector passes the short wavelength solar radiation, delivering energy into the SUT. When this absorbed energy is reflected on the absorber, its wavelength becomes longer and does not pass through the collector. This is the basic principle of the greenhouse effect by which the SUT operates. The air inside the SUT receives thermal energy from the absorber, which eventually causes the density difference with the outside air, and the air is buoyant and rises through the chimney. The kinetic energy of the rising air flow is used to generate power by operating a wind turbine near the entrance of the chimney.
Since the initial concept of the SUT was first proposed in the late 1970s [7], various studies have been conducted on the operating conditions (such as weather condition in Saudi Arabia [8]) and geometries of the SUT (such as diverging chimney [9,10] and sloped collector [11]). In addition, research studies have been conducted that address the topic of combining a SUT with another system or installing various types of devices. For example, an experimental investigation was performed where the floor of a SUT was covered with a phase change material that stored heat during the day and released it at night [12]. Furthermore, papers on the effects of installing a baffle in the collector of a SUT have been reported [13,14]. A baffle is a flow-directing panel that is commonly installed in heat exchangers [15] for maximizing the thermal efficiency of a system; alternative types of baffles include the segmental type [16], the donut type [17], and the helical type [18]. It was reported that a baffle installed in a SUT generated a vortex and increased the Nusselt number (the ratio of convection heat transfer to conduction heat transfer on the surface of an object), enhancing the heat transfer and, thus, the power output of the SUT [13]. More recently, opposing effects caused by the baffle shape (height) changes have been reported [14]. The positive effect is due to the increased amount of heat transfer to the air in the collector by the vortex occurring behind the baffle, and the negative effect is due to the reduced cross-sectional area of the flow path blocked by the baffle. This implies that the baffle can cause various thermo-fluid dynamic phenomena and effects, and thus, a more diverse analysis is needed on the design parameters (such as shape, number, and position) of the baffle.
In the present study, a numerical analysis is carried out on the appropriate positions of baffles in the SUT. The thermo-fluid dynamic effects of the baffle are examined by varying the position of the baffle in the collector. The position of the baffle affects both the downstream recirculating flow area and the upstream cold air inflow from the outside. The enhancement of the greenhouse effect by the downstream recirculating flow is a positive effect on the thermal efficiency point of view (Figure 1b). On the other hand, the baffle also reduces flow area and increases flow resistance. This is a negative effect of the baffle, which causes a decrease in the total flow rate (Figure 1b). According to the position of the baffle, both the size of the gap through which the flow passes and the vortex generation location are also changed, so that the magnitudes of the abovementioned two effects and the flow characteristics are also to be changed (Figure 1c). In order to quantify these conflicting effects, computational fluid dynamics (CFD) models for eight baffle positions were analyzed in order to propose an appropriate baffle position with the maximum net thermo-fluid dynamic effect. The results presented in this paper will be useful not only to verify the thermal usefulness of the baffle applied to the SUT but also to guide SUT designs for an improved performance in the future.

2. Materials and Methods

2.1. Geometry

The geometry of the SUT analyzed in this study is basically the same as two previous studies of the SUT with the baffle mentioned above [13,14]. The total height of the SUT is 13 m, the chimney height is 12 m, the collector diameter is 10 m, the inlet of the collector has a height of 0.15 m, and the chimney diameter is 0.25 m (Figure 2a). We used 2-D axisymmetric models with the axis set to the center of the SUT. The dimensions of the baffle were 0.08 m wide and 0.15 m high (Figure 2b). For the numerical analysis, a quadrilateral grid was applied and the grid density near the walls and baffles was made higher for an accurate analysis (Figure 2c). After performing grid tests, 123,720 grids were assigned for the models without baffle and approximately 130,000 grids were used for the models with a baffle, taking into account both the accuracy and the efficiency of analysis.
We analyzed eight cases by changing the locations of the baffle installation (from 1.0 m to 4.5 m at 0.5 m intervals, measured from the central axis) alongside the base case, which had no baffle (Figure 2b). Each case was named “BL_1.0”, “BL_1.5”, etc. with the “BL” prefix representing “baffle location”, followed by its distance value in meters (Table 1).

2.2. Computational Models and Boundary Conditions

The turbulence model used in this study is the standard k-ε model which has been reported to be suitable for predicting thermo-fluid dynamic phenomena occurring in the SUT [19] (see Section A of the Supplementary Materials for a more detailed description of the numerical model). In the boundary layer near the absorber and baffle of SUT, the laminar sublayer was estimated by the enhanced wall treatment, which has been verified for its predictability in combination with the standard k-ε model [20]. The Boussinesq approximation was applied to realize a natural convection. To calculate the buoyancy force (the driving force of natural convection) in the Boussinesq model, the density in the governing equations was treated as a constant value except for the buoyancy term of the momentum equations. The density was estimated by the following equation:
(ρρ0)g ≈ −ρ0β(TT0)g
where ρ0 is the density of the working fluid, β is the thermal expansion coefficient, and T0 is the operating temperature. The density and thermal expansion coefficient of the air were assumed to be 1.1543 kg/m3 and 3.2805 × 10⁻³ /K, respectively. Due to the simplified density calculations, the convergence of this approximation was improved when compared with the ideal gas model or the incompressible ideal gas model [21].
Assuming thermal equilibrium inside the SUT, the time condition is set to the steady state and the boundary conditions of the inlet and outlet are assumed to be 1 atm at 300 K, which is a typical atmospheric state similar to the standard ambient temperature and pressure (SATP) conditions. Considering the radiative energy of the ground due to the greenhouse effect, it is assumed that there is a heat flux of 13 W/m2. The chimney, roof, and baffle are assumed to be adiabatic (Table 2). The abovementioned boundary conditions refer to our previous model study [14]. The reason for setting the chimney and roof to the adiabatic condition is to assume no heat loss for that part. The reason for setting the baffle to the adiabatic conditions is to focus on the change of the thermo-fluid dynamics due to the baffle. Note that if heat flux boundary conditions are applied to the baffle, the amount of heat supplied by the baffle increases proportionally to the distance (location) of the baffle due to the increase in the heat transfer area (circumferential length of the baffle is 2πr, where r is the distance). We concluded that this is not the purpose of this study which only examines the influence of location of the baffle. The numerical model used in this study is based on the previous study of our group [14], and the validation of the model is described in Section B of the Supplementary Materials.
The number of iterations was determined by monitoring the convergence of residuals of the mass flow rate of the chimney outlet and the temperature of the chimney inlet. The calculation was continued for twice the iteration number for which the first convergence was achieved. Approximately 20,000 iterations were needed for most models in our study.

3. Results and Discussion

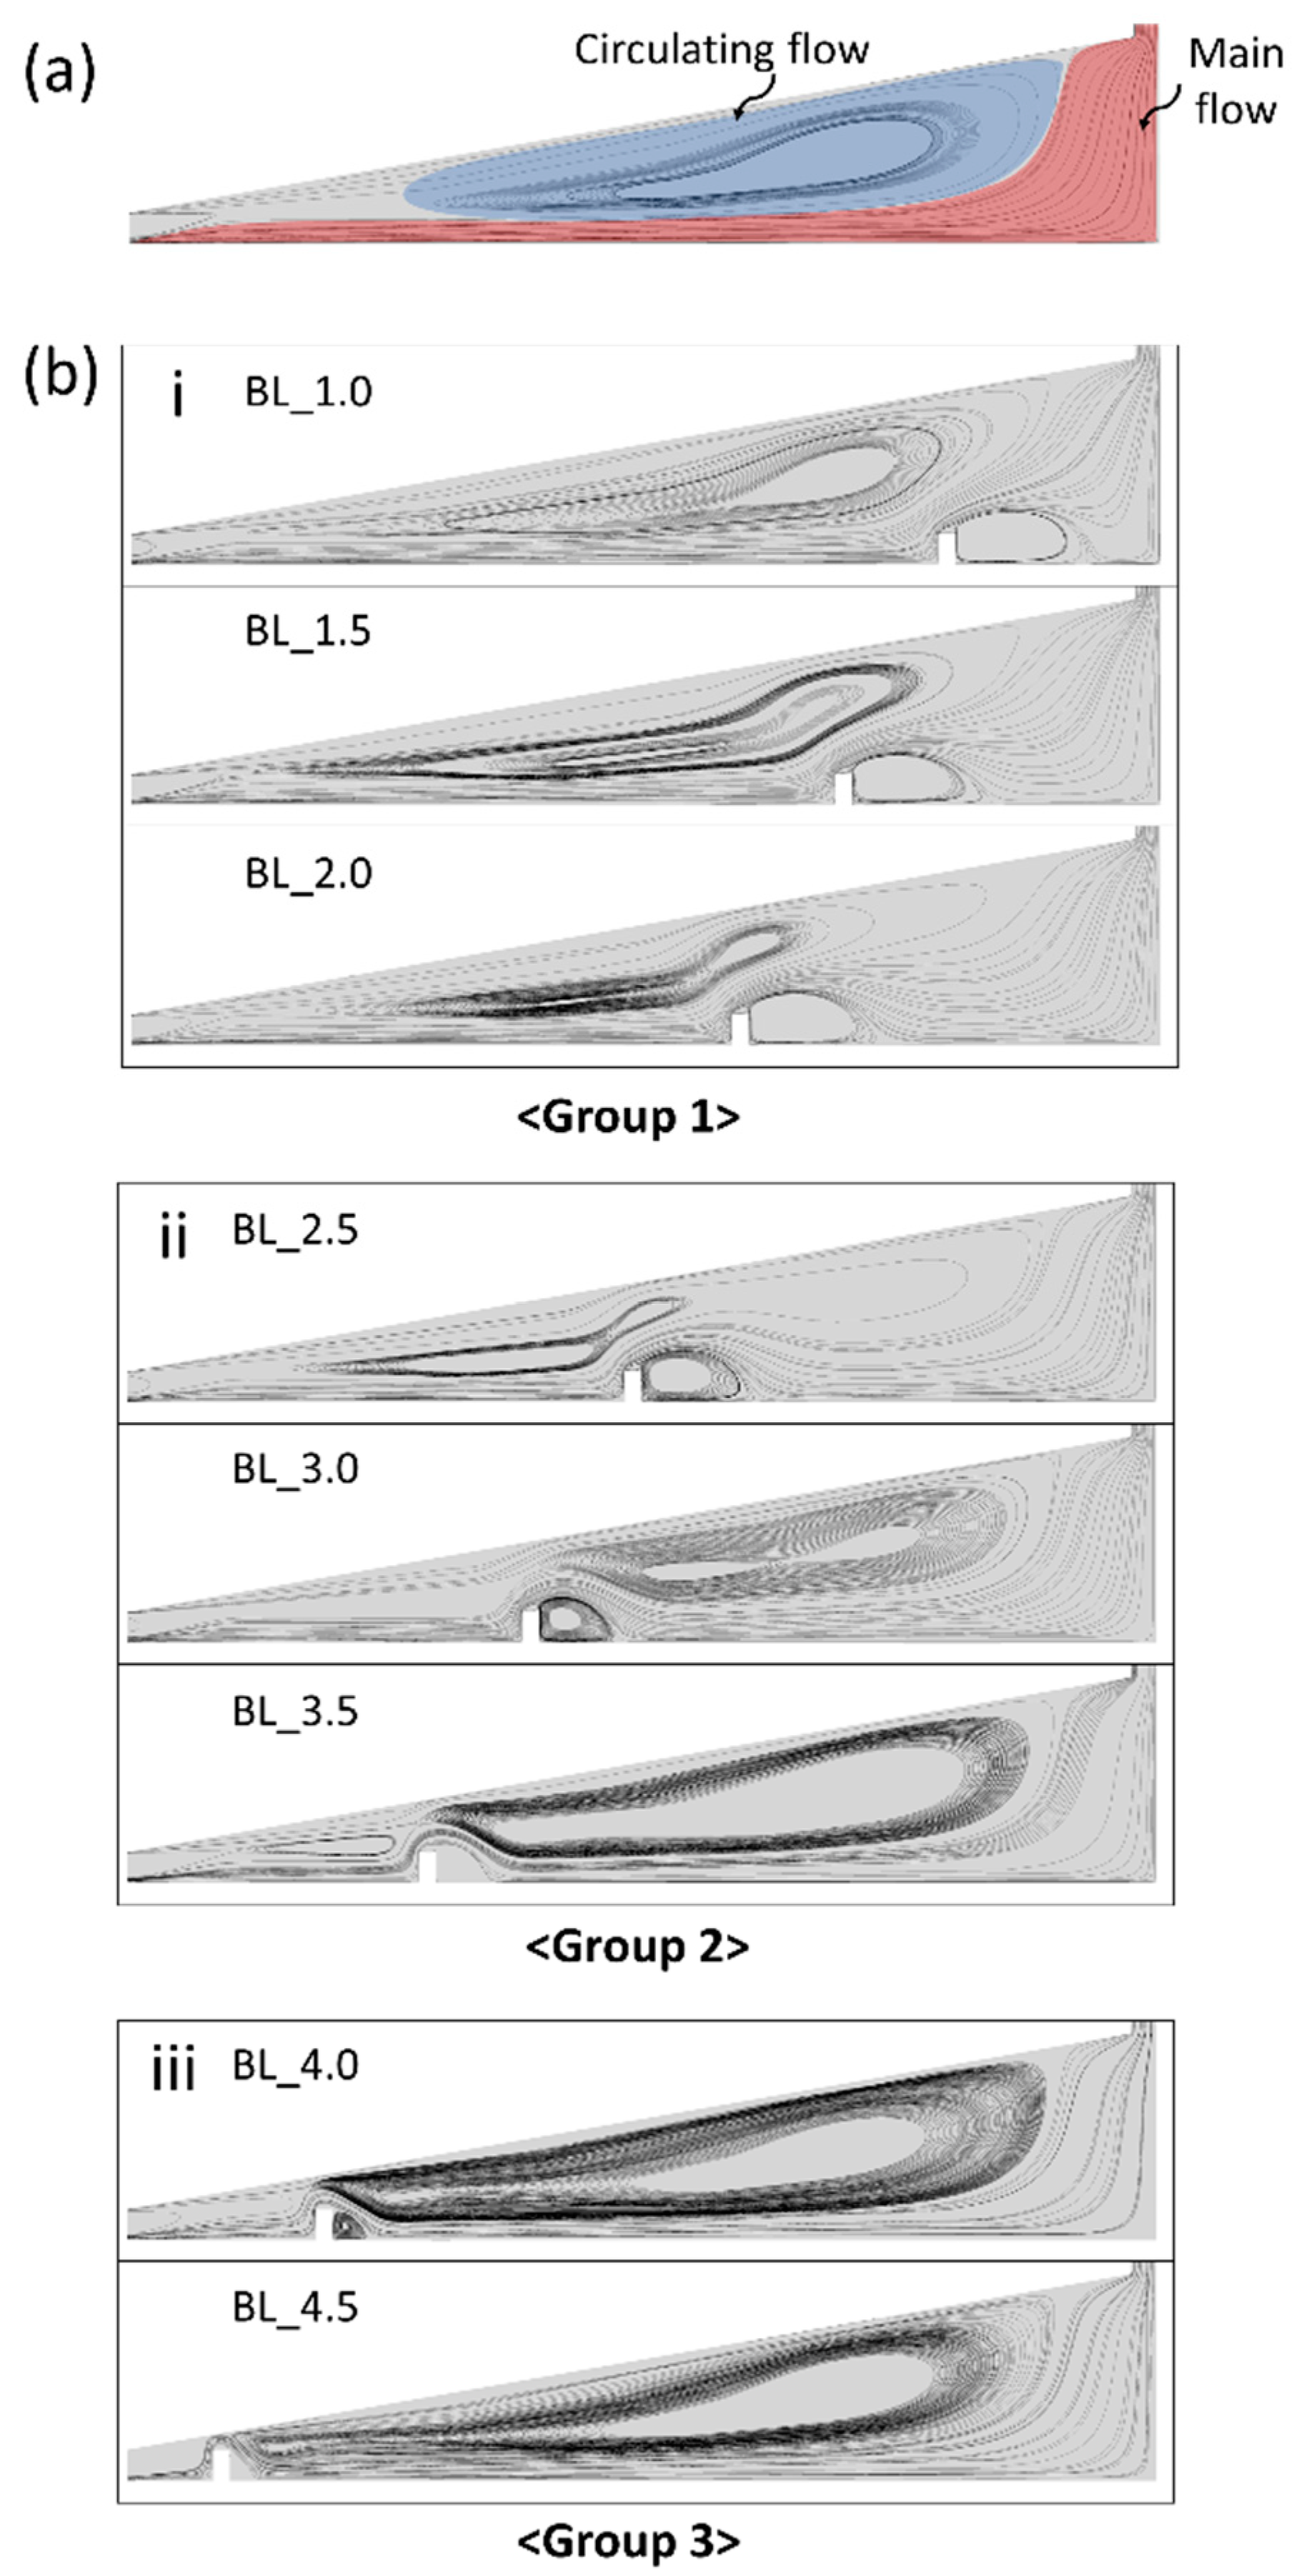
By scrutinizing the streamlines of the flow in the collector, it was found that two major flows were developed—the “main flow” directed to the chimney and the “circulating flow” (Figure 3a). The most prominent difference between the control model (base case, without baffle) and the other models with a baffle is an additional vortex formed immediately behind the baffle in the main flow. The circulating flow in the base model is formed throughout the collector (see the blue region in Figure 3a); this flow pattern, however, is changed by the small vortex generated behind the baffle. For convenience, we classified them into three groups according to the location of the baffle (Figure 3). First, the circulating flow in Group 1 (BL_1.0, BL_1.5, and BL_2.0; Figure 3(bi)), where the baffle is located relatively close to the chimney (axis), is formed between the inlet and the baffle contacting directly with the inlet flow from the outside. In Group 2 (BL_2.5 BL_3.0, and BL_3.5; Figure 3(bii)) for which a baffle is located in the middle of the collector, the shape of the circulating flow becomes narrower and is divided in the middle by the baffle (and the corresponding vortex generated behind it), creating two circulating flows in the upstream and downstream regions of the baffle. The circulating flow formed at the upstream of the baffle of Group 2 is in direct contact with the external flow introduced into the collector inlet (the same as in the circulating flows observed in the models of Group 1); however, the circulating flow formed in the downstream of the baffle is isolated. In Group 3 (BL_4.0 and BL_4.5; Figure 3(biii)) for which a baffle is adjacent to the inlet of the collector, the circulating flow is not in direct contact with the inlet flow since it is secured by the baffle, which protects the circulating flow from mixing with the inlet flows.
Such changes in the flow pattern also lead to temperature distribution changes in each model. To confirm this, we examined the temperature profiles at some specific locations. Note that we selected BL_1.0 for Group 1, BL_2.5 for Group 2, and BL_4.0 for Group 3 as the representative model cases of each group). First, the temperature profiles of the absorber surface (h = 0 m) of the represented models showed a rapid rise around the baffle and a relatively low temperature just behind the baffle (Figure 4(ai)). This was due to the vortex formed in the main flow at the rear of the baffle. In the model without a baffle (the base case), it was observed that the temperature “gradually” increased as the temperature approached the chimney without any fluctuation. This was because the flow that acted as a heat transfer medium in the base case proceeded without any hindrance that caused abrupt changes (Figure 3a). On the other hand, in the models with baffles, a vortex was formed behind the baffle, delaying the overall flow of the collector (Figure 3b) and enhancing the heat transfer inside the vortex. This is explained more clearly by the Nusselt number (the ratio of convection heat transfer to conduction heat transfer on the surface of an object), which is relatively higher as the flow passes over the baffle (Figure 4(aii)). It also implied that the vortex behind each baffle carried away the locally heated air, resulting in a higher convective heat transfer rate and a higher Nusselt number. Contrarily, the Nusselt number graph before each baffle was meaningfully low because the flow was stagnated by the baffle structure, minimizing the convective heat transfer. Also, as the baffle approached the center of the collector, the temperature rise at the baffle position tended to be even higher. The temperature profile of the tip height (h = 0.15 m) of the baffle was a position slightly away from the absorber where the heat flux was generated (where the heat exchange of the main flow and the circulation flow was more advanced). The temperature distribution in this area showed the influence of the flow, depending on the baffle position on the temperature distribution in the collector (Figure 4b). In all cases, the temperature downstream of the baffle was generally higher than the temperature upstream. This tendency was more apparent when the baffle was located closer to the collector inlet. In other words, the temperatures upstream and downstream of the baffle had a larger gap. This shows that the baffle prevented the heat in the downstream space from flowing out upstream of the baffle and that the function of this baffle was more effective when the baffle was closer to the collector inlet. The extent to which the internal heat flows out could be seen through the temperature distribution at the inlet of the SUT is shown in Figure 5a. The inlet injects air mainly from the outside, but due to the action of circulation flow, some air may leak out to the outside. The flow from the bottom (absorber) of the inlet to a height of approximately 0.094 m inflows to the collector, and the flow above a height of approximately 0.094 m is an outflow from collector to the outside. This can be seen from the radial velocity profile of the inlet with the x-axis set to height (Figure 5b). The high temperature of this outflow relative to ambient air (300 K) means that the outflow effuses the internal heat from the absorber. Therefore, the outlet temperature is, preferably, as low as possible to preserve the internal heat, and the closer the baffle is to the collector inlet, the lower this temperature is. The effect of this baffle affects the temperature distribution of the entire SUT as well as the temperature distribution of the specific location. First, the temperature contour of the representative models of each group (BL_1.0 of Group 1, BL_2.5 of Group 2, and BL_4.0 of Group 3) shows that the temperature is generally high at BL_4.0, where the baffle is located far from the center. In addition, the temperature of BL_2.5 and BL_1.0, where the distance gradually decreases (Figure 6a), decreases in order. This tendency of the temperature to change is also observed near the central axis where the “main flow” rises through the chimney (Figure 6b). This is an important position where the ascending “main flow” is located, and the high temperature at the center means that the heat flux generated from the absorber is well preserved in the SUT.
These changes in the flow and temperature distribution affect the rising air flow in the SUT and are directly related to the kinetic power of the fluid. When the turbine is located at the entrance of the chimney, the kinetic power of the fluid at the location is transferred to the turbine to produce power, so that the kinetic power of the fluid can be used to confirm the power generation performance [22]. The kinetic power, P, was calculated using the following equation.
P = 1 2 ρ A V 3 [ kg   m 2 / s ]
where ρ is the density, which is a constant due to the Boussinesq approximation; Ac,in is the cross section of the chimney; and V is the volume flow through the chimney inlet. Both the kinetic power calculated from this equation and the central axis temperature at a height of 1 m of the chimney inlet have the same tendency to increase as the baffle moves away from the center (Figure 7). Since the central axis at a height of 1 m is the position where the rising air current is generated, the relationship between the temperature and the kinetic power at this point can confirm whether the heat transfer of the SUT affects the performance of the SUT. Since the two values show the same tendency, the temperature distribution of the SUT is an important factor in the performance. The change of the temperature distribution according to the position of the baffle is also an important factor in the performance determination. In the case of BL_1.0 and BL_1.5 (located close to the center), the temperature distribution and kinetic power were lower than those of the baffle-free base case (BL_1.0 had a lower kinetic power by –2.04% and BL_1.5 had a lower kinetic power by –1.5%), and BL_2.0 is also very slightly higher than the base case (a slightly higher kinetic power by 0.22%) (Figure 7). This suggests that changes in heat and flow due to the baffle may not lead to an overall performance improvement of the SUT unless the vortex formation is made at the proper location. As the baffle is located further from the center than the BL_2.0, both the temperature and the kinetic power increase (Figure 7) by 0.97 K (temperature) and 8.43% (kinetic power) for BL_4.5. Therefore, the proper position of the baffle to increase the temperature of the central part by preserving the internal heat increases the kinetic power. As a result, the farther the baffle is from the center, the better the internal heat is preserved, and the rising air current can be actively generated. The efficiency was calculated by using the following equation:
η = P Q = 1 2 ρ A c , i n V 3 q A a
where η is the efficiency of SUT, Q is the heat supplied to the absorber, Ac,in is the chimney inlet area, V is the flow velocity, q is the heat per unit area, and Aa is the absorber area excluding the baffle. The calculated efficiency of each SUT model shows the same trend as the kinetic power (see Section C in the Supplementary Materials). As the baffle is located farther from the center of the SUT, it shows that the efficiency improvement rate (11.67% for BL_4.5) surpasses the increased rate of kinetic power (8.43% for BL_4.5).
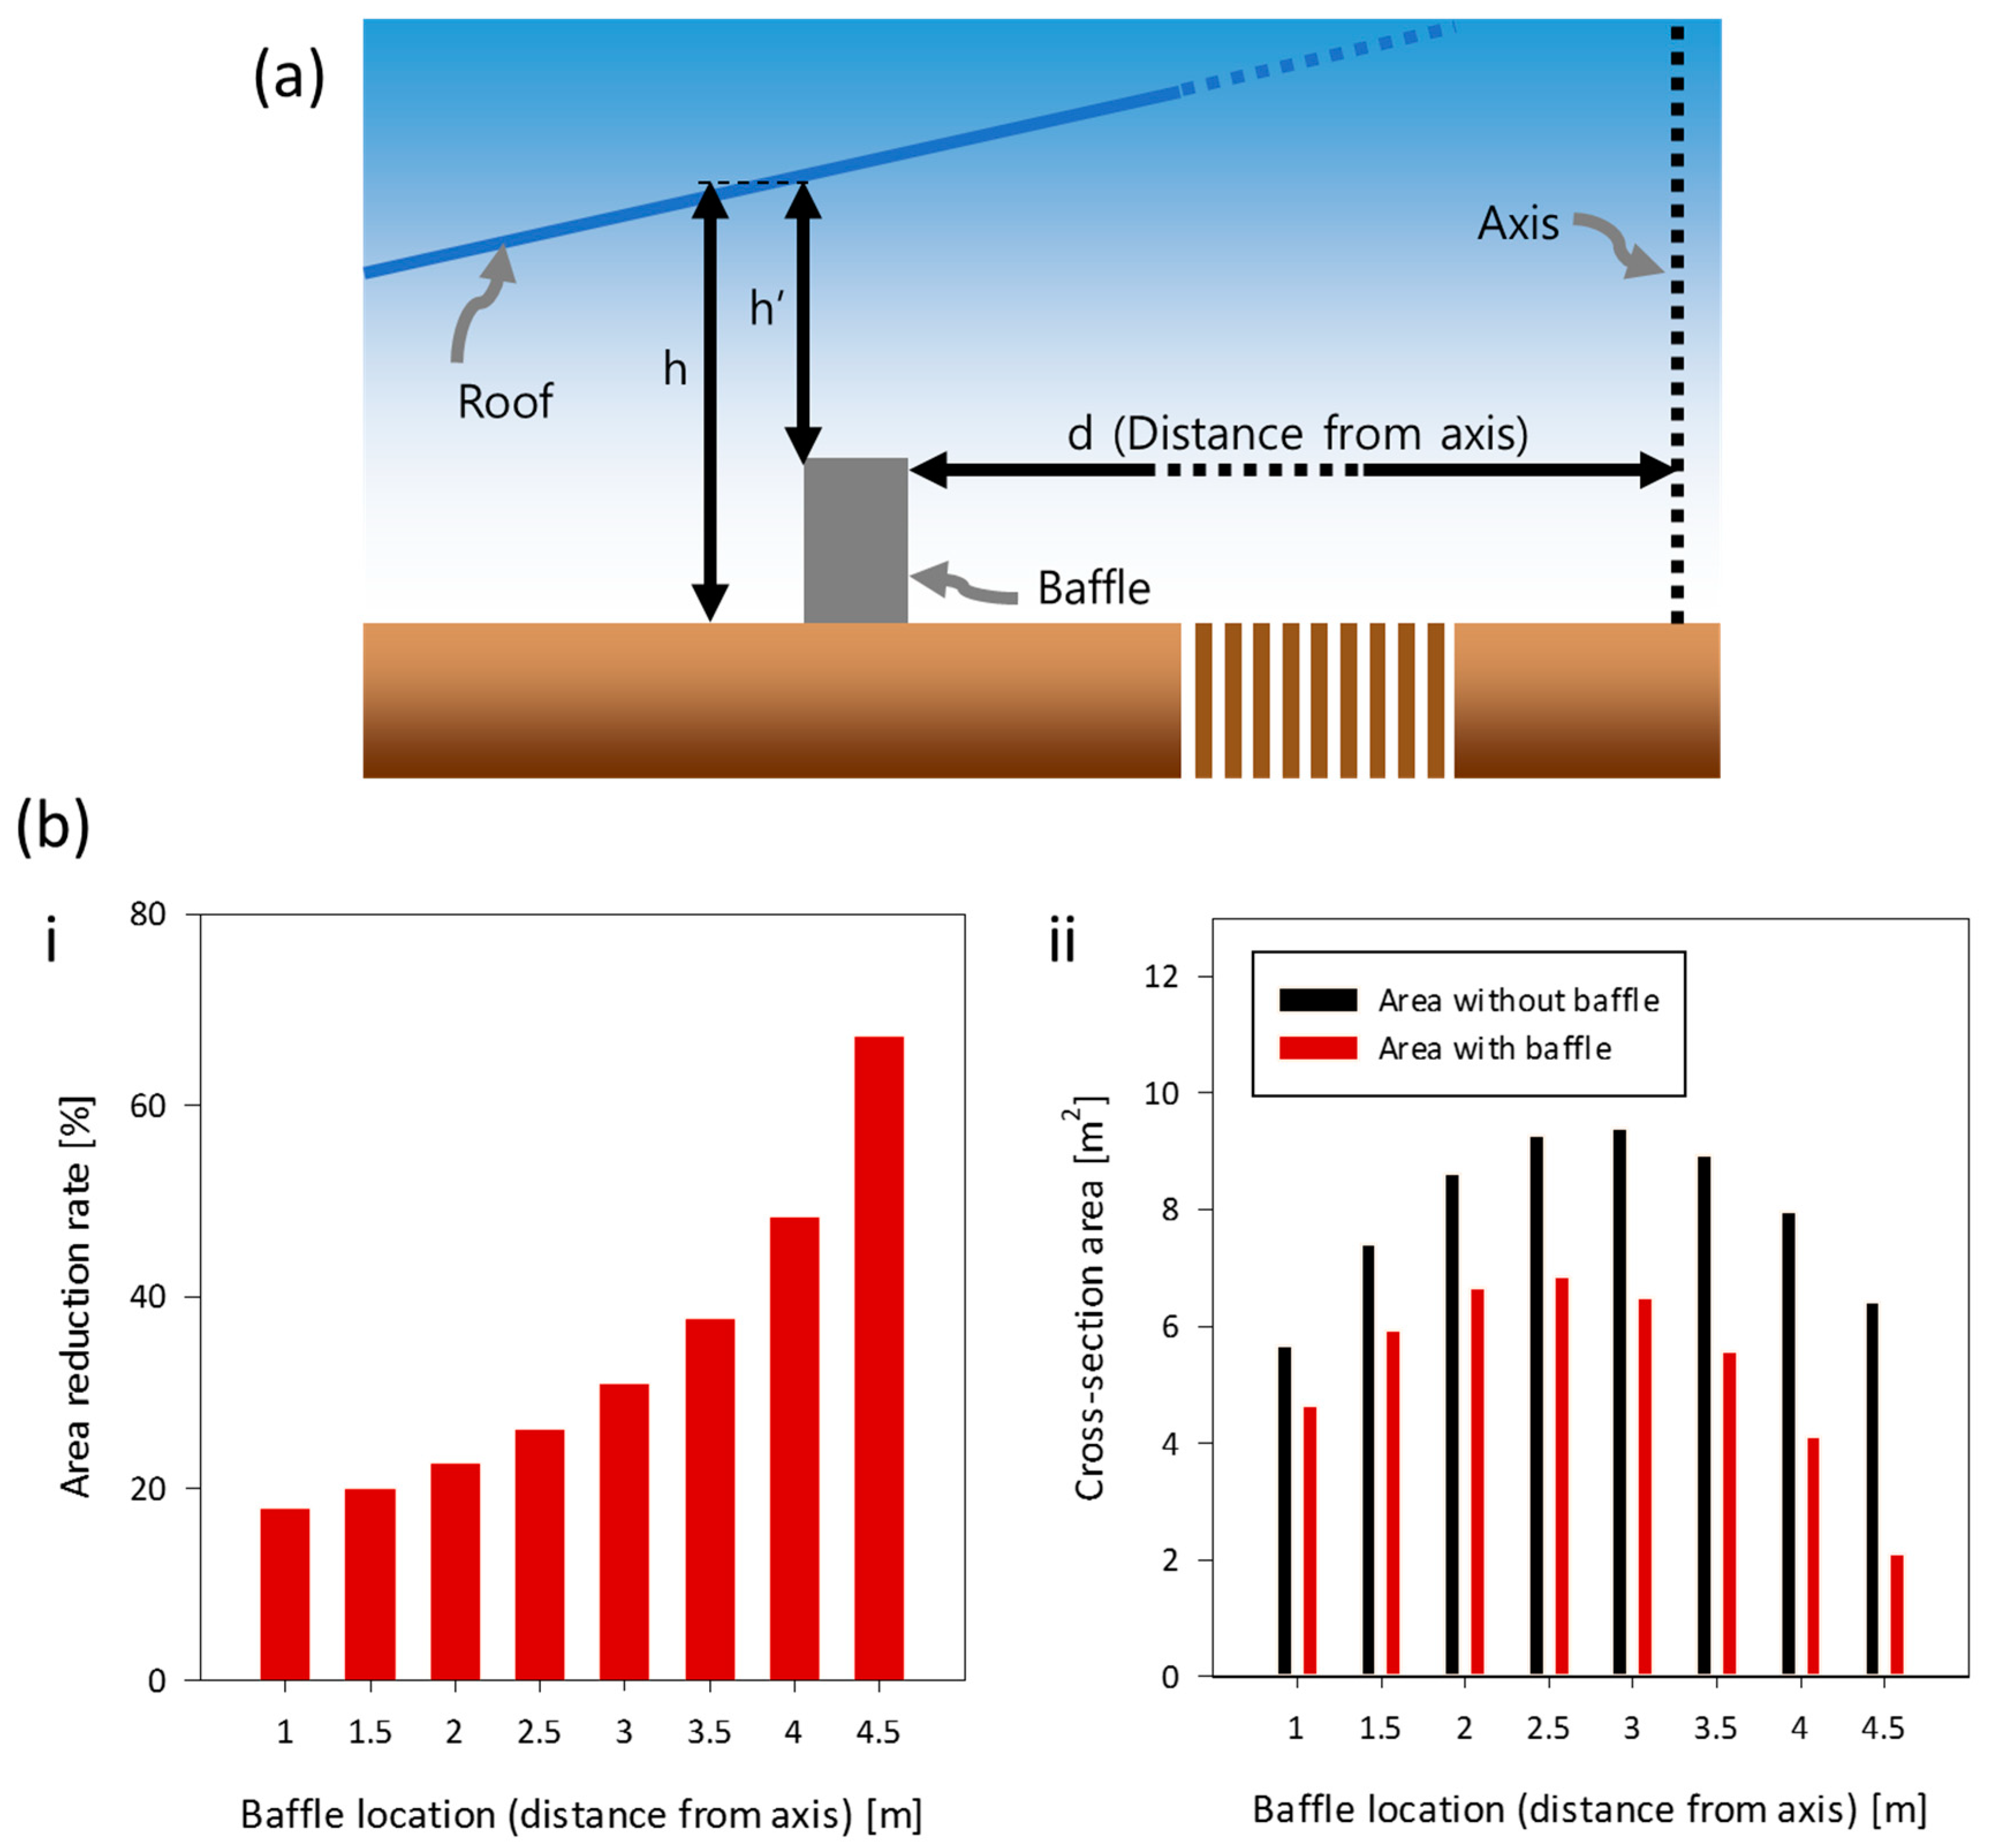
However, the closer the baffle is to the inlet (the farther away from the center of the collector), the less the cross-sectional area and the larger the negative effect that hinders fluid passage. This negative effect is not directly proportional to the distance of the baffle, and it largely affects the performance of the SUT when the baffle is very close to the inlet. Considering the shape of the collector, the cross-sectional area reduction rate due to the baffle (calculated by 1−h/h′ in Figure 8a) and the actual flow pass area (calculated by 2πh’(d+0.08) in Figure 8a) can be easily calculated. The calculated area reduction rate, AR, increases as the distance increases along the function, which can be expressed as AR = −15/(0.174 x − 1.008) (%) where x is the distance of the baffle location (0 < x < 5 m, Figure 8(bi)). According to this expression, as the distance (x) approaches 5 m, the increase rate of AR becomes significantly high. That is, the farther the baffle is from the center, the larger the difference of the cross-sectional areas of the flow between the case without a baffle (black bars, Figure 8(bii)) and the cases with a baffle (red bars). If the fluid flow disruption effect of the baffle influences the kinetic power according to the tendency of this area to decrease, the kinetic power would not show a tendency to be proportional to the internal temperature. Despite such a reduction of the cross section, in the model with eight baffles analyzed in this study, the kinetic power increases as the internal temperature rises as the baffle moves farther away, and the negative effect due to the reduced flow area does not appear. These results show that the reduced fluid passage area does not have a proportional effect on kinetic power. However, before the baffle reaches the inlet completely, there will definitely be some effect of the flow disturbance. To confirm this effect, we set up an additional analysis model assuming extreme conditions. In this additional model, the distance of the baffle is 4.9 m, and it is an extreme case where the baffle is very close to the inlet, considering the width of the baffle (0.08 m). The cross-sectional area reduction rate of BL_4.9 is 97.73%, and the cross-sectional area is 0.11 m2, which is 94.82% smaller than BL_4.5. This is a drastic change in contrast to BL_4.5 (its reduction rate is 67.195%, and cross-sectional area is 2.11 m2). This is because the area reduction rate increases more as the distance approaches the inlet (Figure 8b). The numerical results show that the internal temperature of the BL_4.9 model is much higher than those of the conventional eight models (0.11% higher than BL_4.5 of 307.43 K and 0.50% higher than BL_1.0 of 306.26 K, based on the temperature of the central axis at a height of 1 m), but the kinetic power is 0.3529 W, which is 8.61% lower than that of BL_4.5, which is 0.3861 W (Figure 9a). The velocity profile at the inlet is also very different from the other existing models (Figure 9b). This is because the effect of the flow resistance mainly affects the shape of the circulation flow rather than the “main flow” at a distance of up to 4.5 m. In fact, the shape of the “circulation flow” varies greatly depending on the distance of the baffle, and the slight difference of the velocity value of each model of BL_1.0–BL_4.5 causes a difference in the mass flow rate. However, the distance of the baffle does not affect the radial velocity profile divided into inflow and outflow based on a height of approximately 0.094 m (Figure 5b). However, if the area is too small to resist the entrance of the “main flow” into the SUT, the profile will change, the inflow will decrease, and the kinetic power of the rising airflow will vary. This can be seen as a negative result of the resistance due to the reduction of the cross-sectional area by the baffle.
The claims raised in this study should not be directly extrapolated to the SUTs of different scales. It is, therefore, necessary to conduct case-by-case investigations on the effects of the baffle installation for larger scale SUTs. We believe, however, that the optimized baffle design can meaningfully improve the efficiency of SUTs in any scales, and the related research is in progress in our group.

4. Conclusions

This study analyzed the variation of the flow and heat transfer trend according to the installation position when installing a baffle on the floor inside the collector of a SUT. The main circuit flow, “circulating flow”, which occupies the largest area within the SUT, varies in shape depending on the position of the baffle (Figure 3), and this change in shape changes the heat transfer tendency. As the baffle is located away from the center, the “circulating flow” tends to be located inward and is more blocked from the effects of the ambient air. Thus, the farther the baffle is from the center, the more heat is saved by the “circulating flow” in the collector, which contributes to the rise in temperature of the rising flow (main flow). The temperature rise of this “main flow” improves the kinetic power and performance of the SUT. However, if the baffle is not positioned in a proper location, this effect cannot be achieved and the purpose of introducing the baffle to the SUT is diminished. The first type of unsuitable position is a position close to the center, which is too far from the inlet, so that it is difficult to expect the effect of the baffle blocking the ambient air. The second type is a position too close to the inlet, which results in an excessive reduction of the cross-sectional area, resulting in a greater increase in the flow resistance. This negative effect counterbalances the positive effect caused by the rise in temperature.
When introducing a baffle in the design of a SUT, it is very important to consider these positive and negative effects. In conclusion, the baffle should not interfere with the progress of the main flow, and at the same time, it is necessary to locate it in the optimal position to block the effects of outside air. In order to find this optimal point, the shape of the collector (such as the angle of the loop) and the dimension scale of the SUT are important considerations.

Supplementary Materials

The following are available online at https://www.mdpi.com/1996-1073/12/7/1340/s1, A: Detail description of the flow dynamics model, B: Results of “BL_4.9”.

Author Contributions

Conceptualization, S.K. and J.Y.P.; Methodology, S.K. and J.Y.P.; Software, S.K. and S.L.; Formal Analysis, S.K. and S.L.; Writing-Original Draft Preparation, S.K.; Writing-Review & Editing, S.K., S.L., and J.Y.P.; Supervision, J.Y.P.

Funding

This research was supported by the Korea Institute of Energy Technology Evaluation and Planning (KETEP) grant (No. 20163010024690) and the Korea Institute for Advancement of Technology (KIAT) grant (No. N0001075) funded by the Ministry of Trade, Industry, and Energy, Republic of Korea.

Conflicts of Interest

On behalf of all authors, the corresponding author states that there is no conflict of interest.

References

  1. Kim, J.; Park, S.Y.; Lee, J. Do people really want renewable energy? Who wants renewable energy?: Discrete choice model of reference-dependent preference in South Korea. Energy Policy 2018, 120, 761–770. [Google Scholar] [CrossRef]
  2. Johansson, V.; Lehtveer, M.; Göransson, L. Biomass in the electricity system: a complement to variable renewables or a source of negative emissions? Energy 2018, 168, 532–541. [Google Scholar] [CrossRef]
  3. Bonechi, C.; Consumi, M.; Donati, A.; Leone, G.; Magnani, A.; Tamasi, G.; Rossi, C. Biomass: An overview. Bioenergy Syst. Future 2017, 3–42. [Google Scholar] [CrossRef]
  4. Sun, X.; Huang, D.; Wu, G. The current state of offshore wind energy technology development. Energy 2012, 41, 298–312. [Google Scholar] [CrossRef]
  5. Moya, D.; Aldás, C.; Kaparaju, P. Geothermal energy: Power plant technology and direct heat applications. Renewable Sustainable Energy Rev. 2018, 94, 889–901. [Google Scholar] [CrossRef]
  6. Thirugnanasambandam, M.; Iniyan, S.; Goic, R. A review of solar thermal technologies. Renewable Sustainable Energy Rev. 2010, 14, 312–322. [Google Scholar] [CrossRef]
  7. Haaf, W.; Friedrich, K.; Mayr, G.; Schlaich, J. Part I: Principle and Construction of the Pilot Plant in Manzanares. Int. J. Solar Energy 1983, 2, 3–20. [Google Scholar] [CrossRef]
  8. Abdelmohimen, M.A.H.; Algarni, S.A. Numerical investigation of solar chimney power plants performance for Saudi Arabia weather conditions. Sustainable Cities Soc. 2018, 38, 1–8. [Google Scholar] [CrossRef]
  9. Xu, Y.; Zhou, X. Performance of divergent-chimney solar power plants. Solar Energy 2018, 170, 379–387. [Google Scholar] [CrossRef]
  10. Motoyama, M.; Sugitani, K.; Ohya, Y.; Karasudani, T. Improving the Power Generation Performance of a Solar Tower Using Thermal Updraft Wind. Energy Power Eng. 2014, 6, 362–370. [Google Scholar] [CrossRef]
  11. Koonsrisuk, A. Comparison of conventional solar chimney power plants and sloped solar chimney power plants using second law analysis. Solar Energy 2013, 98, 78–84. [Google Scholar] [CrossRef]
  12. Fadaei, N.; Kasaeian, A.; Akbarzadeh, A.; Hashemabadi, S.H. Experimental investigation of solar chimney with phase change material (PCM). Renewable Energy 2018, 123, 26–35. [Google Scholar] [CrossRef]
  13. Nia, E.S.; Ghazikhani, M. Numerical investigation on heat transfer characteristics amelioration of a solar chimney power plant through passive flow control approach. Energy Convers. Manage. 2015, 105, 588–595. [Google Scholar] [CrossRef]
  14. Lee, S.; Kim, Y.; Park, J. Numerical Investigation on the Effects of Baffles with Various Thermal and Geometrical Conditions on Thermo-Fluid Dynamics and Kinetic Power of a Solar Updraft Tower. Energies 2018, 11, 2230. [Google Scholar] [CrossRef]
  15. Bichkar, P.; Dandgaval, O.; Dalvi, P.; Godase, R.; Dey, T. Study of Shell and Tube Heat Exchanger with the Effect of Types of Baffles. Procedia Manuf. 2018, 20, 195–200. [Google Scholar] [CrossRef]
  16. Gaddis, E.S.; Gnielinski, V. Pressure drop on the shell side of shell-and-tube heat exchangers with segmental baffles. Chem. Eng. Process. Process Intensif. 1997, 36, 149–159. [Google Scholar] [CrossRef]
  17. Li, H.; Kottke, V. Analysis of local shellside heat and mass transfer in the shell-and-tube heat exchanger with disc-and-doughnut baffles. Int. J. Heat Mass Transfer 1999, 42, 3509–3521. [Google Scholar] [CrossRef]
  18. Lutcha, J.; Nemcansky, J. Performance improvement of tubular heat exchangers by helical baffles. Chem. Eng. Res. Des. 1990, 68, 263–270. [Google Scholar]
  19. Ayadi, A.; Nasraoui, H.; Bouabidi, A.; Driss, Z.; Bsisa, M.; Abid, M.S. Effect of the turbulence model on the simulation of the air flow in a solar chimney. Int. J. Therm. Sci. 2018, 130, 423–434. [Google Scholar] [CrossRef]
  20. Ahsan, M. Numerical analysis of friction factor for a fully developed turbulent flow using k–ε turbulence model with enhanced wall treatment. Beni-Suef Univ. J. Basic Appl. Sci. 2014, 3, 269–277. [Google Scholar] [CrossRef] [Green Version]
  21. ANSYS FLUENT User’s Guide; ANSYS Inc.: Canonsburg, PA, USA, 2013.
  22. Zhou, X.; Xu, Y. Solar updraft tower power generation. Solar Energy 2016, 128, 95–125. [Google Scholar] [CrossRef]
Figure 1. A schematic of the effects by baffle distance from the center in a solar updraft tower (SUT): (a) The overall view of the SUT showing each component and the basic principles of the SUT. (b) Two major effects of baffle in the SUT: disturbed flow and heat accumulation by vortex. (c) A comparison of the effects in terms of the baffle distance: (i) the case where the baffle is far from the center and (ii) the case where baffle is near the center.
Energies 12 01340 g001
Figure 2. The 2-D axisymmetric geometry of the computational domain used in this study: (a) The base 2-D axisymmetric geometry of SUT. (b) A detailed view of the baffle models with different baffle locations, which are measured from the center (axis). (c) A quadrilateral grid system applied for meshing the whole computational domain and zoomed inset images showing the grids near the inlet and baffle (for the BL_2.5 model).
Energies 12 01340 g002
Figure 3. The internal flow field of SUT models with different baffle distances from the center: (a) A streamline of the SUT without a baffle, with a flow field classified as “circulating flow” for the circulation streamline and “main flow” for the streamline to the chimney. (b) The classification of models with a baffle based on the change of the “circulating flow”: (i) Group 1 includes the “BL_1.0”, “BL_1.5”, and “BL_2.0” models, and its representative model is “BL_1.0”; (ii) Group 2 includes the “BL_2.5”, “BL_3.0”, and “BL_3.5” models, and its representative model is “BL_2.5”; and (iii) Group 3 includes the “BL_4.0”, and “BL_4.5” models, and its representative model is “BL_4.0”.
Energies 12 01340 g003
Figure 4. The effect of the installation location of the baffle. (a) The profiles at the absorber (h = 0 m, marked as a red line in the inset above): (i) The temperature profile and (ii) the Nusselt number profile. (b) The temperature profiles at the tip height of the baffle (h = 0.15 m, marked as a red line in the inset above) changed significantly near the baffle and its downstream.
Energies 12 01340 g004
Figure 5. The effect of the baffle blocking the outside air: The temperature and the velocity profiles are measured at the red line marked in the inset below. (a) The temperature profiles at the inlet show significant changes in the outward flows depending on the installation location of the baffle; however, (b) the radial velocity profiles at the inlet are not different meaningfully. Above the height of 0.094 m, the radial directional flow has a positive value, which indicates that the flow is directed to the outside. This flow reduces the efficiency by discharging the heat inside the collector to the outside.
Energies 12 01340 g005
Figure 6. The temperature contours of the base case and the represented cases of each group (BL_1.0 of group 1, BL_2.5 of group 2, and BL_4.0 of group 3). (a) The contour of 20 compartments from 300 K to 310 K. (b) The zoomed inset images show contours near the central axis.
Energies 12 01340 g006
Figure 7. The kinetic power and temperature of each case at the height of 1 m of central axis: The black bar is the kinetic power of the base case, and the red bars are the kinetic power of models with a baffle of which the values are on the left y-axis. The line graph along the dots indicates the temperature of which the values are on the right y-axis.
Energies 12 01340 g007
Figure 8. The cross-sectional areas of flow path changes according to baffle position: (a) Reductions of the cross section on the baffle distance are calculated based on the geometric parameters. (b) The quantitative value of a cross-sectional reduction on the baffle distance: (i) the cross-sectional area reduction rate and (ii) a cross-sectional area comparison with and without a baffle.
Energies 12 01340 g008
Figure 9. (a) The kinetic power and temperature at the height of 1 m from the center axis (denotes “Base case”, “BL_1.0”, “BL_2.5”, “BL_4.5”, and “BL_4.9”’ for comparison) and (b) the radial velocity profile at the inlet (denotes “Base case”, “BL_1.0”, “BL_2.5”, “BL_4.5”, and “BL_4.9” for comparison).
Energies 12 01340 g009
Table 1. The eight models with different baffle distances from the central axis and control model (base case) for the case without baffle: Note that the number in each model name means the distance value.
Model NameBaffle Distance from Axis (m)
Base caseNot applicable (without baffle)
BL_1.01.0
BL_1.51.5
BL_2.02.0
BL_2.52.5
BL_3.03.0
BL_3.53.5
BL_4.04.0
BL_4.54.5
Table 2. The boundary conditions of SUT: All walls except for the absorber are adiabatic.
Boundary Conditions
InletPressure inlet (1 atm, 300 K)
OutletPressure outlet (1 atm, 300 K)
AbsorberWall (Heat flux: 13 W/m2)
RoofWall (Heat flux: 0 W/m2)
ChimneyWall (Heat flux: 0 W/m2)
BaffleWall (Heat flux: 0 W/m2)

