1. Introduction
The European Union established in October of 2014 a series of requirements that should be complete by the year 2030. The reduction of pollution and the use of cleaner and more efficient energies mark the goals during this period, according to De Baest et al. [
1]. In order to achieve these objectives, the use of energy optimization techniques plays a very important role. The general aim of energy optimization is to reduce energy consumption and therefore reduce the consumption of resources needed to produce that energy. Further, another way to optimize the use of energy is to distribute the use of energy throughout different hours of the day. In this way, peaks where there is a higher consumption of energy can be eliminated or reduced. To apply techniques of this type is elementary to obtain and modify the patterns of use of users.
More recently, the European Union has implemented a new Energy Performance in Buildings Directive (EPBD) (EU) 2018/844 [
2]. This plan intends to increase efficiency in the European buildings sector. It includes steps to guarantee more efficient energy systems and to renovate buildings into smart buildings.
The data that are generated in homes could be useful in order to make effective use of the electrical energy consumed in the houses. Smart homes are the ideal situation in order to collect the consumption generated by their electronic devices. However, there is a different type of devices that allows us to achieve the consumption of the electrical appliances and other devices without the need to make a great investment to transform homes in smart homes.
With this information, a data mining program can extract the behavior and rules that a resident follows during the day related to their home appliances. There are a lot of works that try to identify the electronic appliances in a home in order to predict the future use of the device by a user; for examples, see Brown et al. [
3], Chen et al. [
4], and Tang et al. [
5]. The main objective of these investigations is to use energy efficiently. By making this consumption identification, the authors are trying to distribute the use of electric energy along the different hours of a day. This method expects to reduce the maximums of consumption among other moments in the day. Therefore, electrical consumption could be more uniform during the daytime.
When a system tries to make consumption in a house uniform, it finds the best way to achieve a global goal, the effective use of energy. However, during this process, the customer is often forgotten. The client plays an important role in the process, so the system should include an incentive that promotesachieving a local goal to the client which could be useful to reach the global one. For example, in many countries, the price of electricity is modified every hour. Consequently, a good local aim could be to minimize the bill of the customer.
As a result, we propose a system in which we take into account the data generated by the electronic devices, a local aim related to how we can reduce the bill of the costumer and the global goal of distributing the use of electrical energy. In our system, the data have an enormous value, because the entire system is going to be based on recorded and storage data. By using the consumption data, we could be able to develop a recommendation system that suggests little changes to the client on their daily routine that can help to minimize their bill and to achieve a more distributed consumption from a global perspective. We verify the system with a Spanish case of study, which we think is a good case of study in order to verify the efficiency of the proposed system and the research carried out. In order to implement the proposed case of study, we should recollect the data related to the electricity prices. This information is usually stored and provided by several web pages. For this reason, our system includes a crawler that gathers and stores all the relevant information from the webs. In addition, our proposed system uses virtual agent architecture. This is a type of distributed infrastructure that allows agents to work together and in a parallel and coordinated way to achieve a common goal. This architecture allows us to make a more adaptive system in case we want to update the proposal with new features or just in case we want to modify an existing one.
The article is divided into the following sections. In the background section, we describe some of the studies related to this line of research. The proposed system is outlined in the architecture section. The case study section focuses on particular situations that have been considered during the research. In the results section, the system’s performance is described and analyzed. The last section draws conclusions on the different technological solutions that we considered for our system; furthermore, we discuss future lines of work related to the proposed study.
2. Background
Firstly, we are going to make a brief introduction about the different types of recommendations systems in order to know which technique fits better with the problem we want to resolve. According to some state-of-the-art reviews about recommendation systems, like Isinkaye et al. [
6] and Shah et al. [
7], there are three kinds. The most famous are content-based filtering (CB) and collaborative filtering (CF). The third one is hybrid filtering (HF). CB recommendation systems try to find similar items or similar users or whatever it is that we are recommending. This technique finds one object similar to another one if both share some features and characteristics in common. Basically, the similarity is established by comparing their features. Thus, an object is recommended if the user has seen, ranked, etc. a similar one. The recommendation systems based on CF recommend items that have been seen, bought or positive-ranked by users with similar preferences to the target one. This technique categorizes two different items as similar if a great number of users, similar to the original one, buy or rate the two items. The users are seen as similar if they share a great number of preferences. In this case, they are seen as close users. Finally, the HF technique is used in recommendation systems that want to avoid the problems and limitations that CF and CB usually have. It uses the best of both techniques in order to provide more accurate and effective recommendations.
Hybrid filtering, however, according to Felfernig et al. [
8], assumes that in the special case of the Internet of Things (IoT) recommendation systems, there are two more types of recommendation systems. In the case of knowledge-based recommendations, the recommended system is not based in rankings or features. In this case, the users have a series of requirements. Thus, if items or actions want to be recommended, they have to pass these rules. To do that, the system has to have information about the user. The other technique for IoT recommendations is the utility-based. In this case, when we want to recommend an item, an action, etc. we have to evaluate it based on the utility established by the user or the system. Therefore, these are all the possibilities related to recommendations for IoT and smart environments.
IoT deployments in home environments are proven by several studies. This way, the implementation of smart systems in houses can benefit the residents. From the point of view of health-related benefits, smart homes contribute to providing confort to the final user, because of the way that they perform operational efficiency, monitoring and management, and consultancy (Czaja [
9]). Smart homes also provide environmental benefits. The actual threats about climate change and volatility in energy prices have increased interest in smart devices and systems. These technologies allow to reduce energy consumption, which is important according to what the European Union has established (De Baest et al. [
1]). Smart systems can monitor the information on energy description, control the consumption patterns, and achieve efficiency and optimization and consultancy (Zhou et al. [
10], El-hawary [
11]). According to Elkhorchani an Grayaa [
12] and Aye and Fujiwara [
13], energy control can eliminate carbon emissions and be used as a first step in the way to use renewable energy sources. This assumption is more long-term, while the economic benefit is obtained more quickly. Smart home technologies reduce expenses on energy consumption. However, users do not usually see them as useful as they could be because they do not think they are going to recover the return of the investment (Balta-Ozkan et al. [
14]). Nevertheless, Khedekar et al. [
15] said that smart home technologies are going to be more affordable in the near future.
This benefit should be taken into account when a researcher develops a new smart home system. Therefore, Longe et al. [
16] proposed a daily maximum energy scheduling (DMES) algorithm that reduces by10% the amount of the monthly electrical bill. The algorithm accomplishes all the benefits exposed in the previous paragraph. They assume that people are distributed across several income classes, so based on income classes, it establishes a consumption limit that homes appliances connected to home network can consume. In order to optimize daily consumption in a home, the DMES algorithm uses mixed integer linear programming. The results of the study show that smart meters that include the proposed algorithm optimize energy consumption for residents and for utility providers. In this research, they deploy an algorithm that is installed in a smart meter. Smart meters are smart home devices that are not yet installed in all houses and are also expensive. For this reason, clients could be reticent to use this smart system.
Other researchers, such as Li et al. [
17], have worked on a multiagent system that allows to improve and optimize the energy usage of smart homes. Every electrical device is configured as a virtual agent. These agents work simultaneously and together to reduce consumption while ensuring user comfort, energy costs, and peak energy savings. The investigation permits communication, interaction, and negotiation between energy sources and appliances in order to achieve energy efficiency and a minimum electrical bill.
Lin and Chen [
18] developed a new home electric energy saving system. The system makes use of different smart devices, smart meters, smart plugs, smartphones, and database servers. The system even allows a user to monitor the electrical devices remotely. The consumed data are also used to identify the devices using the SVM (support vector machine) algorithm. The system can also control the state of the appliances remotely, so these actions could be used to save energy and reduce consumption. The system uses two monitoring devices, smart meters and smart plugs. As we said before, smart meters are expensive devices whose use is not widespread. Thus, for better deployment of the system, smart plugs can be used as the only smart devices that can monitor consumption information.
Other systems also try to make use of an intelligent home control system, for example, the one proposed by Bian et al. [
19]. In this research article, the authors have developed a new temporary home gateway in an Android phone in order to reduce the working hours of a traditional gateway. This new temporary gateway is only used when the mobile enters the home network. They also developed an intelligent control system based on the users’ behavior. This control system is able to shut down unused devices. With this functionality, the system is able to reduce cost and save energy. With this functionality, they also reduce the information that is sent between the different elements in the home network.
Sharifi and Moghouli [
20] propose a scheduling control system that can reduce cost in bills and that also tries to reduce peaks in energy consumption. Therefore, they use real-time cost pricing. They based their system on a fuzzy decision system. Researchers Khalid et al. [
21] also proposed a similar fuzzy system. In this study, a fuzzy control system is capable of reducing consumption peaks as well as reducing the cost of energy for home residents. They also classify electronic devices using their pattern of behavior. By using the fuzzy control and the classification, they can schedule the use of the devices.
On the other hand, some researchers do not automatize the system. They leave the power of decision to the user. This is the case of the study presented by Wright et al. [
22]. According to the article, they present a policy of “ know” and “care”. The user consumption information is obtained from the use of a smart meter. With this information, the system is capable of estimating the energy price. This price and the estimated carbon dioxide emissions are shown to the users in order to apply the policy of “know” and “care”. Thus, in this case, the system tries to reduce the demand for energy during peak hours. This goal tries to makes energy more efficient.
Taking into account all the previous works, in this paper, we present a new smart home electric energy saving system. We have developed a new recommendation system that works in a multiagent architecture. The recommendations are based on knowledge and utility. The recommendation system used historical consumption and price data. Historical and recent data are taken into account when the system makes its recommendations. Furthermore, in order to make recommendations, the system takes into account the type of appliances. In conclusion, the main objective of this research article was to reduce the user bill and obtain a more distributed use of energy with the use of recommendations. By doing this, the client is still the one who controls the electricity system. This is important because the users could have a more reliable relationship with the presented system. This way, the proposal satisfies the IoT benefits. In order to make the proposal more clear, a comparison between it and previous works is presented in
Table 1.
3. Proposed System
As discussed in the previous section, the main contribution of the paper is the multiagent recommendation system. Multiagent technology provides a distributed architecture in which different agents carry out different and specific tasks at the same time. Equally important is the characteristic that agents work in a coordinated way to achieve a common goal. The main advantages of the multiagent system are the mobility, the dynamic behavior, and the high level of communications through the transparent management of the message queues. Hence, the system will have different agents. Every agent will perform a different job but needed for the rest of the agents. The multiagent system is based on a Python library [
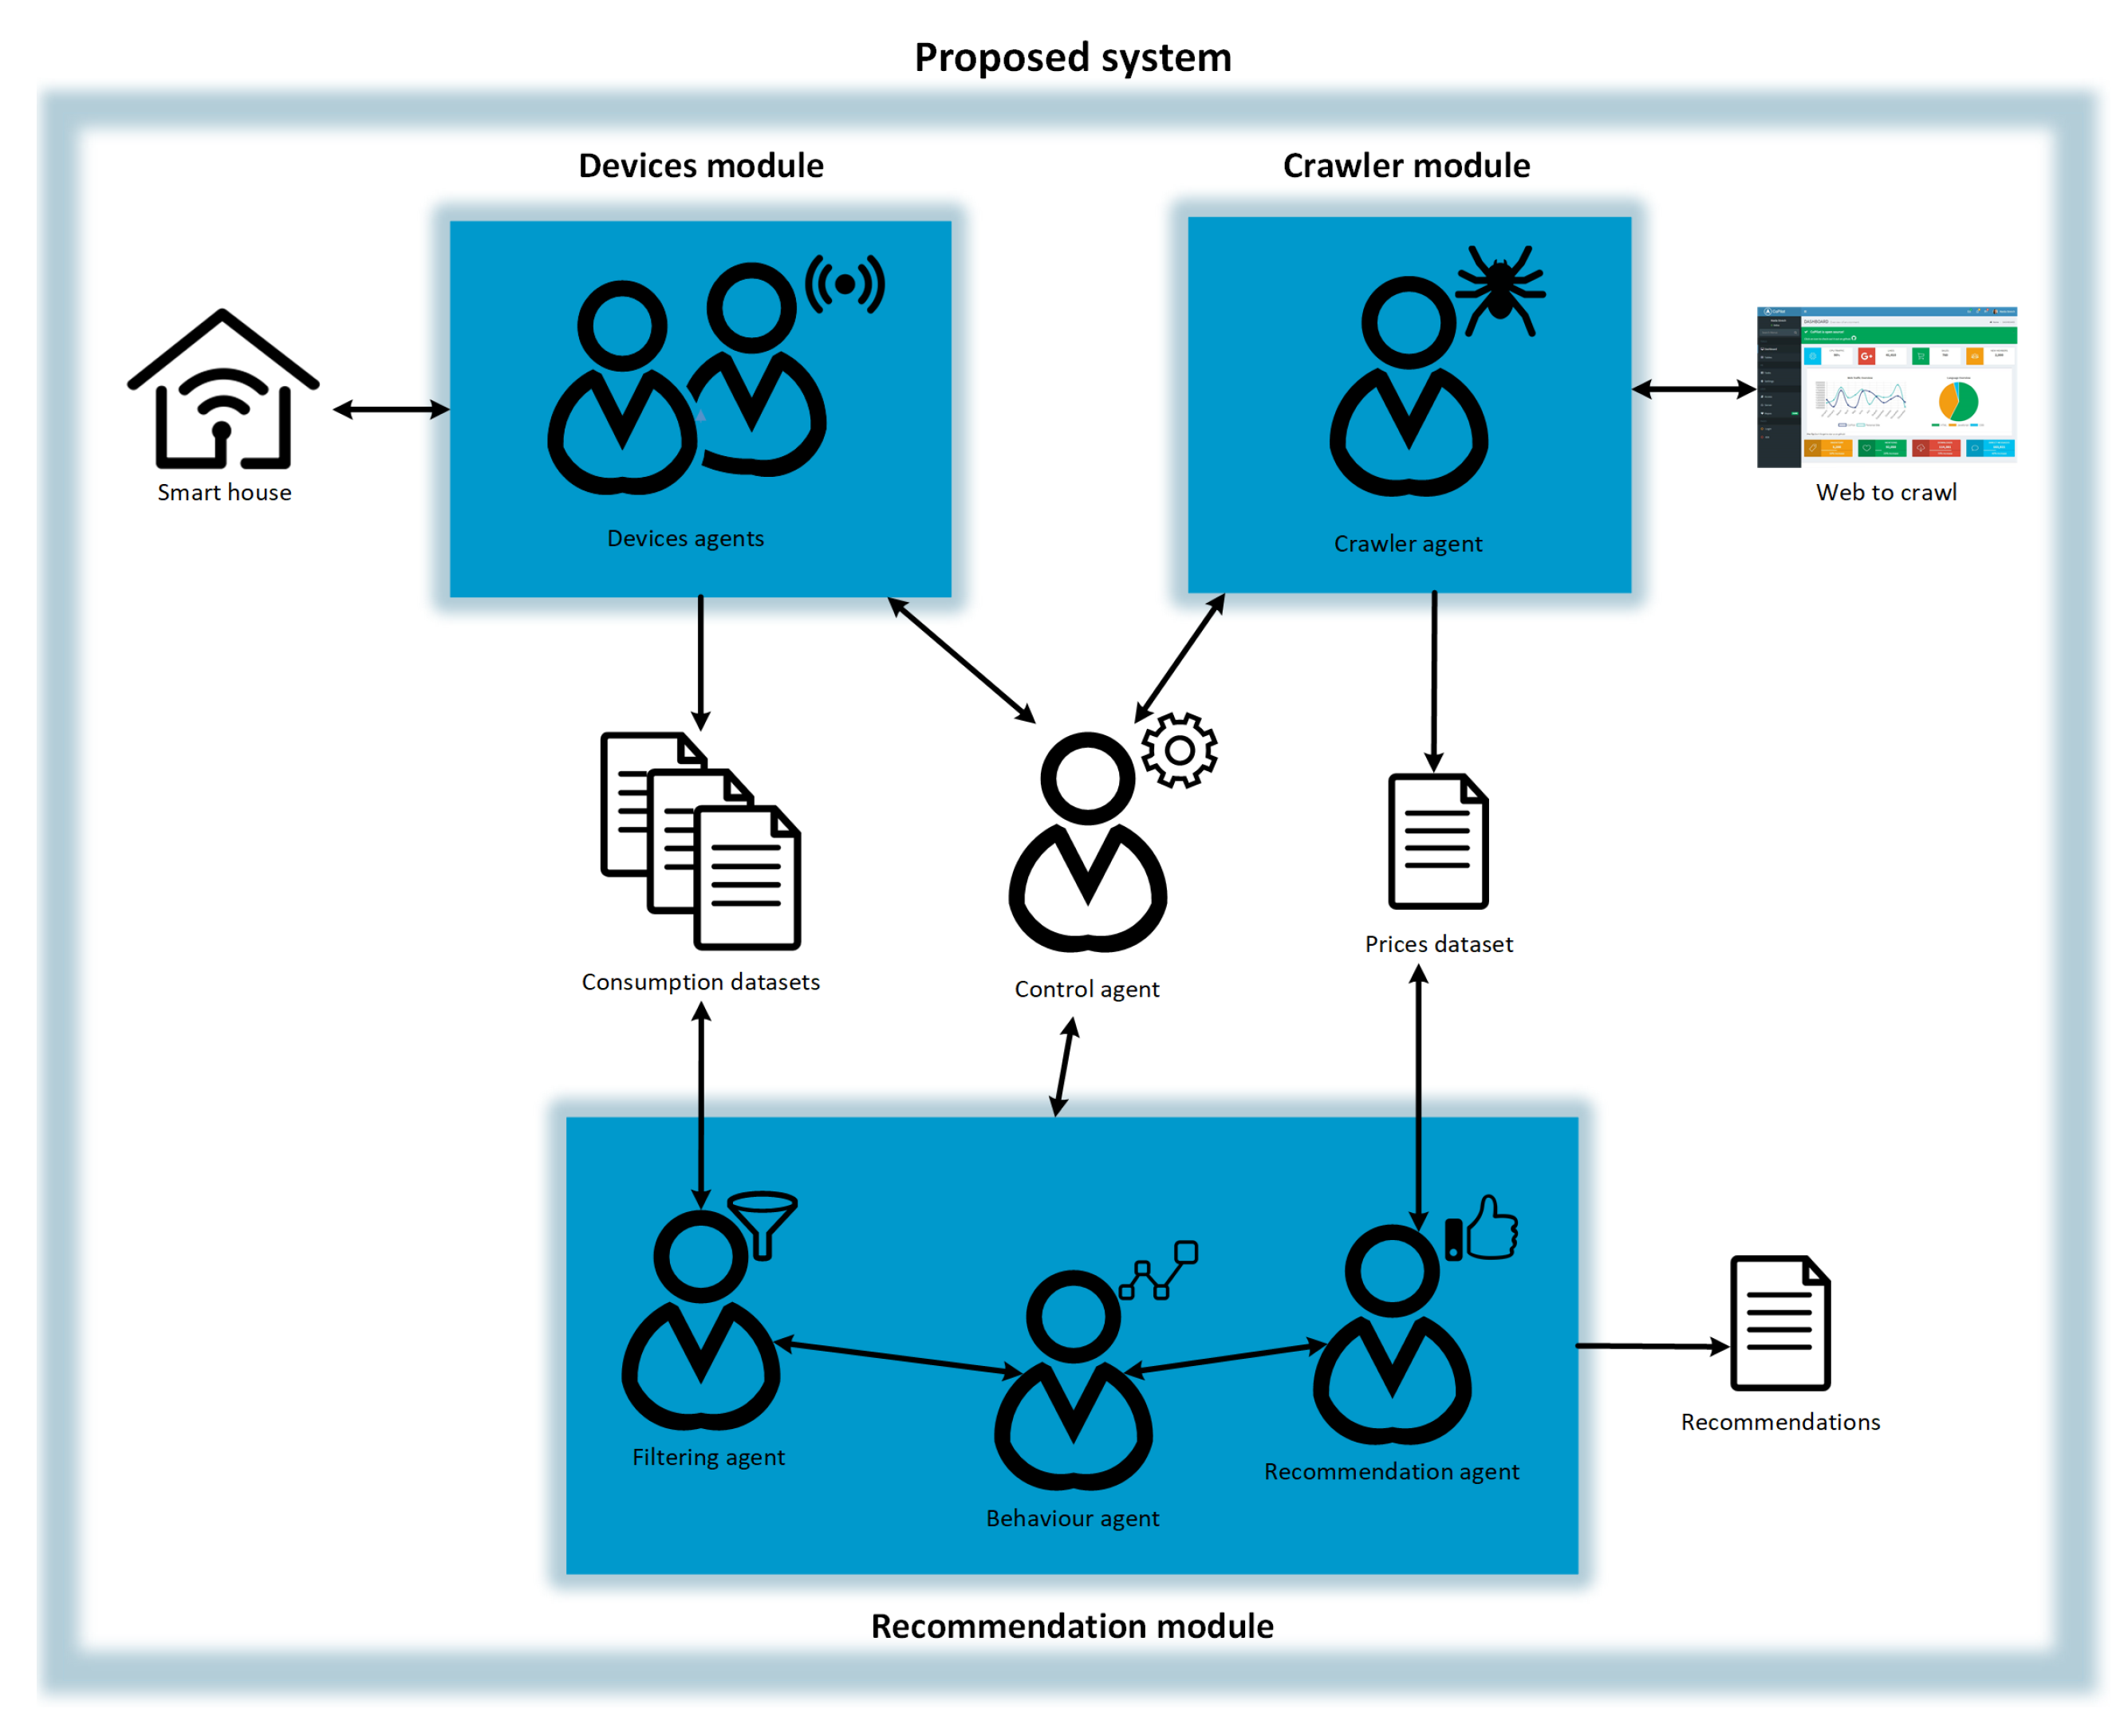
23]. With the use of this software, we implement the different agents in a central system. By doing this, the system will be installed more easily in smart homes. The agents will be connected between them, and some of them (as we will describe so on) will be connected with a network of smart devices or web pages through the specific protocol. Therefore, in the proposed system, the multiagent system is centralized, but each agent can establish communication with external elements. The architecture developed for the research is shown in
Figure 1. In order to clarify, we explain it in detail.
As can be seen in the previous figure, there are three main modules in the presented system. Every one of them plays an important role in the system because they all depend on one another to work in a proper way. Nevertheless, there is another important agent, which is in charge of controlling the system and the interactions between the modules. Therefore, the control agent and the three different modules are explained in the following paragraphs.
Control agent: It is the agent that controls the rest of the agents and determines when to initialize them. When the rest of the agents are initialized, they execute their actions in order to achieve their personal goals and also the global goal of the system.
Device agents: These agents communicate with the smart devices inside the house. The devices are connected to the global system via the specific protocol. In this article, we propose to use a low-cost device, namely, a smart plug. This can be easily installed in every normal plug of the house. The communication between the agents and the smart plug can be performed via the specific protocol. There will be as many device agents as electronic appliances we want to control. The use of virtual agents allows us to increase or reduce the number of agents with no apparent effort. Every agent only connects to a single appliance. The agents proceed in the following way. Firstly, they connect with the specific physical device. When the agent receives the answer from the device, it requests the consumption data every six seconds. This window of time can be modified, but we recommend to use this value in order to obtain good results and to reduce the number of communications between the agents and the devices. The consumption data are stored in a text file. There is a text file for every device agent and, therefore, for every appliance.
Crawler module: This module contains the crawler agent which connects to a web page. This web page contains information about the prices of electricity for the current day. Consequently, the software included in the agent selects the relevant information from the web page. This relevant information consists of the prices and the corresponding hours of the extracted prices. Thus, the agent requests the information located on the web page. When the agent obtains this information, it extracts and stores the relevant data into a text file. This text file includes all the historical information about electricity prices. This agent performs these actions every twenty-four hours, once a day.
Recommendation module: This module contains three different types of agents that interact between them and make use of the data recollected by the modules previously explained. Every one of these agents implements a specific action. Hence, we explain them thereupon.
- –
Filtering agent: Its function is to filter and apply changes to the data in order to obtain a more quality dataset. The actions that this agent can take into account are extracting some extra features that can be taken into account when doing the recommendations. The actions include transforming the data that can be stored in the text file, extracting the day of the week as of the measurement date, and determining when an appliance is active or not.
- –
Behavior agent: This agent is the one that has to determine when a device is used more and when it consumes more electricity. It interacts with the filtering agent. This agent uses the information provided by the previous one in order to extract the different patterns of use of every appliance. It extracts the use of every device every hour, and it also obtains the use during every weekday. This is important because these two patterns are used when the system provides recommendations, as we will explain soon. This agent not only extracts the historical use of the devices but, also, the last month of use, something we call temporal use. We consider this information really relevant because the use of appliances can change in time, and the most recent use is what best represents the user. For this reason, we weigh the historical and temporal use. The weighted formula is represented in Equation (
1):
where
is an electrical device,
D represents the devices as a whole,
is the weighted use. It is calculated from the historical use,
, and the temporal use,
,
j represents the historical and temporal use for every daily hour or weekday. Finally,
and
the weight elements. In our case, we estimated the values of
and
, respectively.
Therefore, with the use of Equation (
1), we increase the importance of temporal use and decrease the value of the historical one. This equation is applied for hours patterns and weekdays patters. This way, the behavior agent extracts the way users use their connected devices.
- –
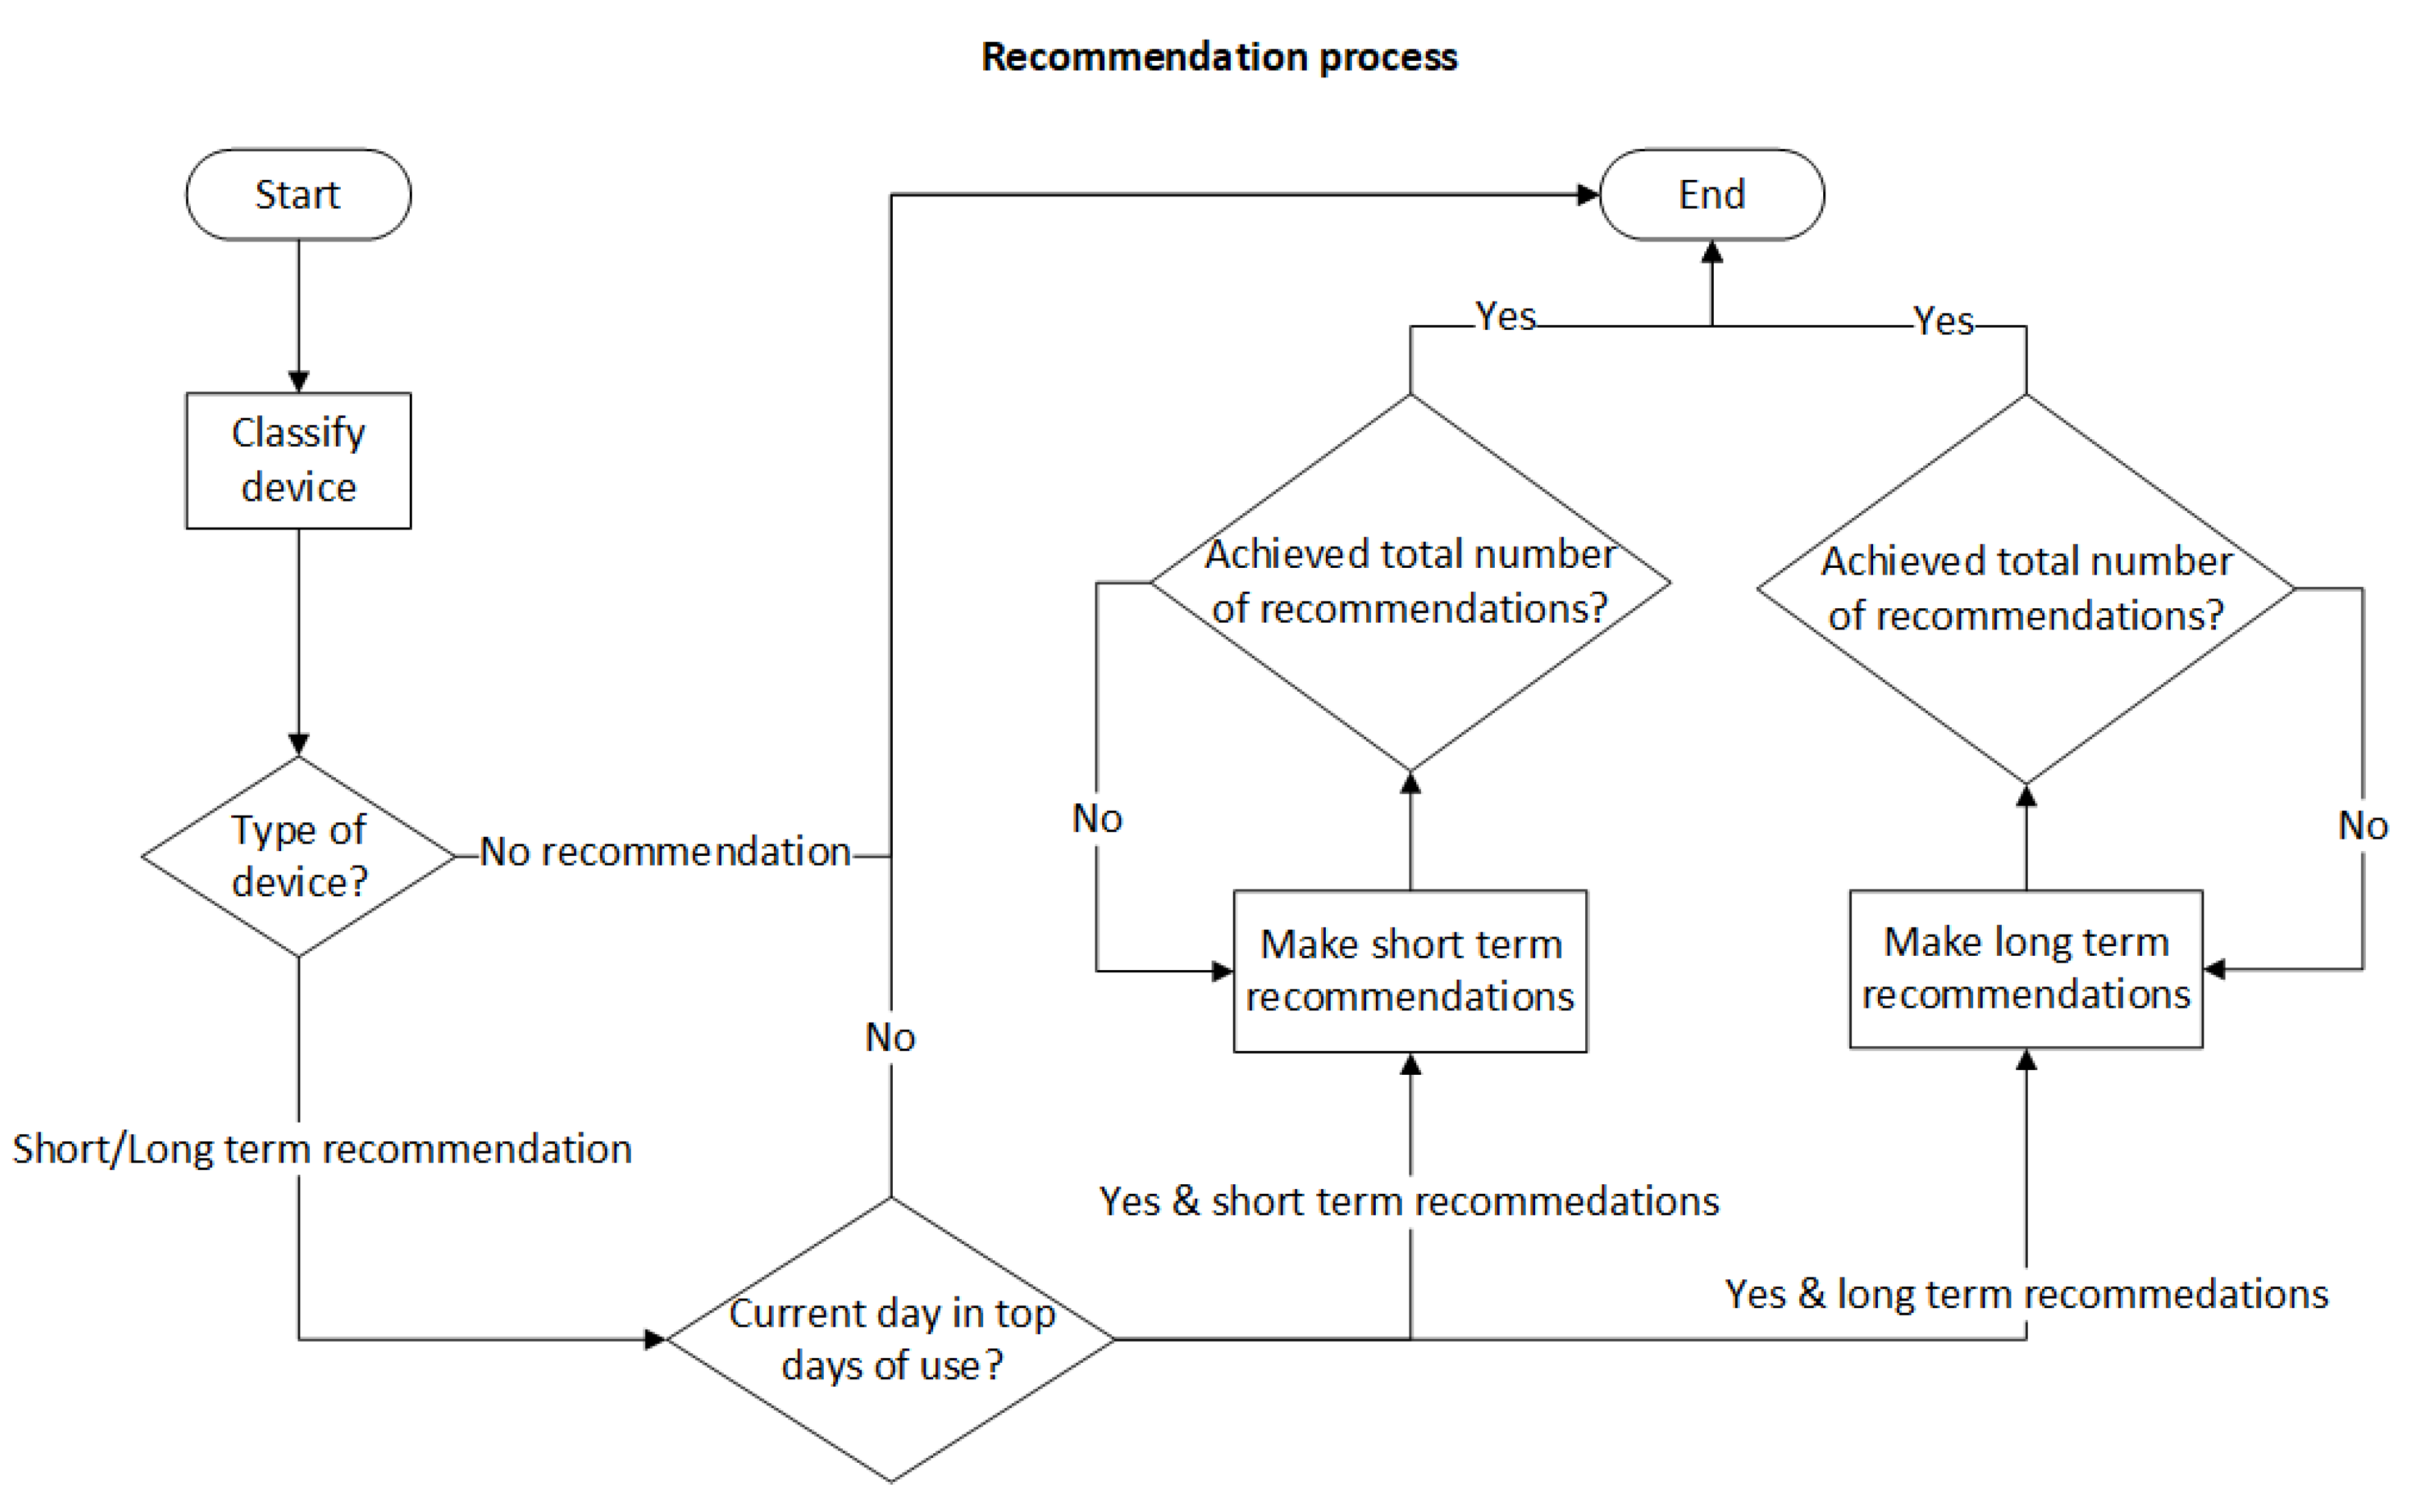
Recommendation agent: It is in charge of making and providing recommendations to the client. The first action that this agent uses is to recollect the user behavior provided by the behavior agent. This information, along with the prices dataset, is used to decide which the best recommendations to suggest are. The process that every device follows in order to make the recommendations is illustrated in
Figure 2. The agent divides the appliances into different types, namely, no recommendation type, short-term recommendation type, and long-term recommendation (this will be explained in more detail in the next section). The no recommendation type will not produce any recommendation, because its consumption is not related to human use or it has a more restricted use. The short-term recommendation type refers to a device with a restricted use, although it can be changed slightly. On the other hand, the long-term recommendation type is applied to devices that can be used in any day period.
Once the appliance is classified as a long- or short-term classification type one, the agent proceeds to make energy and money-saving recommendations for the device’s use. As explained before, the system takes into account the weekday. Thus, if the device is more used in the current day, the system will provide recommendations for that. If not, the system will not recommend anything in order to not overload the users with too many recommendations which may not be useful for the user during the current day. In the same way, when the agent provides recommendations about the electrical appliance, the number of recommendations is limited. Consequently, the recommendations supplied will be the most efficient and the ones that optimize the final goal more, to reduce the consumer bill and to distribute the use of electrical energy. For short-term recommendations, the system suggests variating the consumption to the closest and cheapest active hour (which means that the user is probably in the house). With this strategy, the system tries to distribute consumption along proximate hours and to save money. However, for long-term recommendations, the system suggests variating the consumption to the cheapest active hour, allowing to distribute the use of energy and to achieve a better financial saving.
According to what we have been saying before, the proposed recommendation system makes use of two techniques mentioned by Felfernig et al. [
8]. These techniques are knowledge-based (KBR) and utility-based (UBR) recommendations. The KBR is used when we obtain the patterns of use of the different devices. With this information, we can predict when it is more likely that the users are going to use the appliance, so we can suggest small changes in their usage. These recommendations are accompanied by an incentive, what the user can save with this small change. Therefore, with this incentive, we make use of UBR.
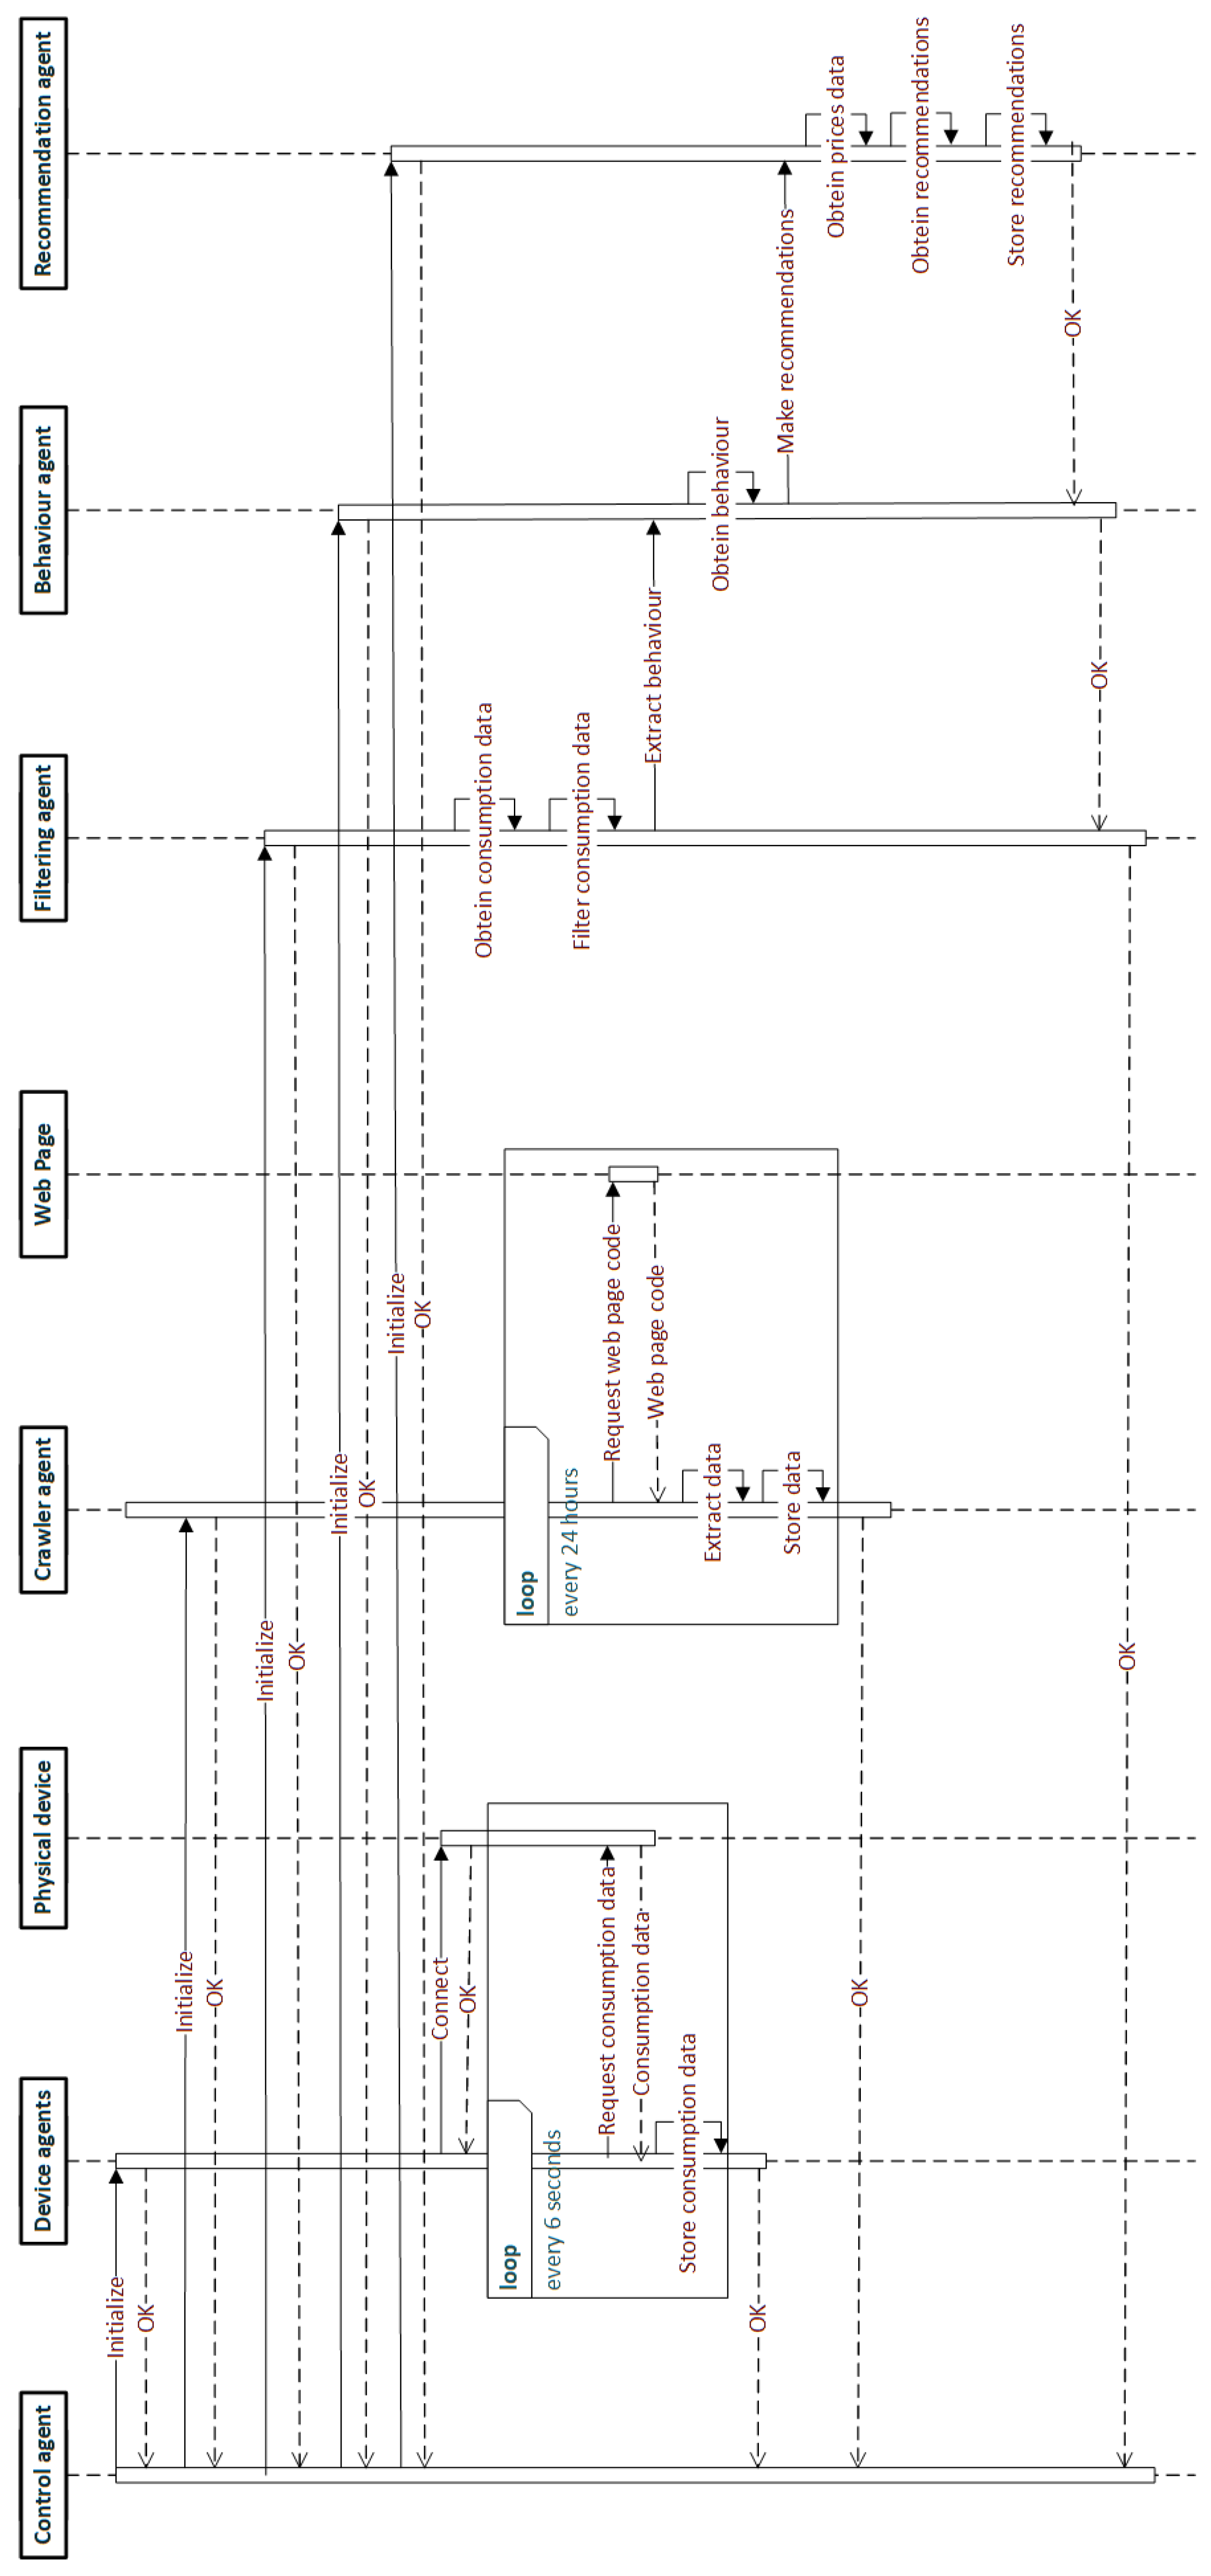
Consequently, all the modules and all the agents interact between them and are in continuous communication. Hence, we illustrate the communications and the iterations between agents in
Figure 3. There, it can be seen how the control agent initializes the rest of the agents and how specialized agents interact between themselves and achieve their personal goals. The full process is represented in
Figure 3.
On the whole, the system presented in this section makes use of a distributed architecture based on virtual organizations of agents in order to provide recommendations, generated by a KBR and UBR recommendation system, that minimize the monthly electricity bill in the short-term and that generate a more distributed use of energy, without maximum peaks, in order to use electrical energy in a more efficient way.
4. Case Study
In this section, we are going to present the different characteristics and specifications that have been taken into account to evaluate the multiagent recommendation system proposed in this article. Firstly, we are going to talk about the smart devices that are going to be installed in the house. We explain how can we recollect the consumption information from them and what other possibilities they can offer. Secondly, we explain the consumption dataset used to evaluate the recommendation system and the considerations we have taken into account to achieve better results. Thirdly, we explain how we obtain the prices dataset and what information it stores.
In our proposal, we pretend to create a low-cost system but without sacrificing certain aspects which we consider relevant for the proper performance and possible extension of the system. Therefore, the smart device that we have selected has to allow us to achieve these requirements. The requirements are as follows: In the first place and most importantly, the measuring devices must offer consumption information in real time. Consequently, the global system has to be connected continuously to the smart device using some protocol so the data can be stored and processed by the multiagent system. Secondly, the measuring devices have to be installed in the house without disturbing the client. This requirement is important because of the reticence of users to adopt this type of intelligent systems. Taking this into consideration, we decided that “plug and play” devices are the ones that best fit this requirement. Lastly, we considered that for future improvements to system, the smart devices should be allowed to turn on/off the electrical appliances connected to the electrical grid. This will allow the system to turn off some devices when there is no one at home and turn them on when the clients arrive home in order to save energy and reduce consumption. However, this requirement is being taken into account for future versions of the system proposed in this article so that the current investment in intelligent devices is not in vain.
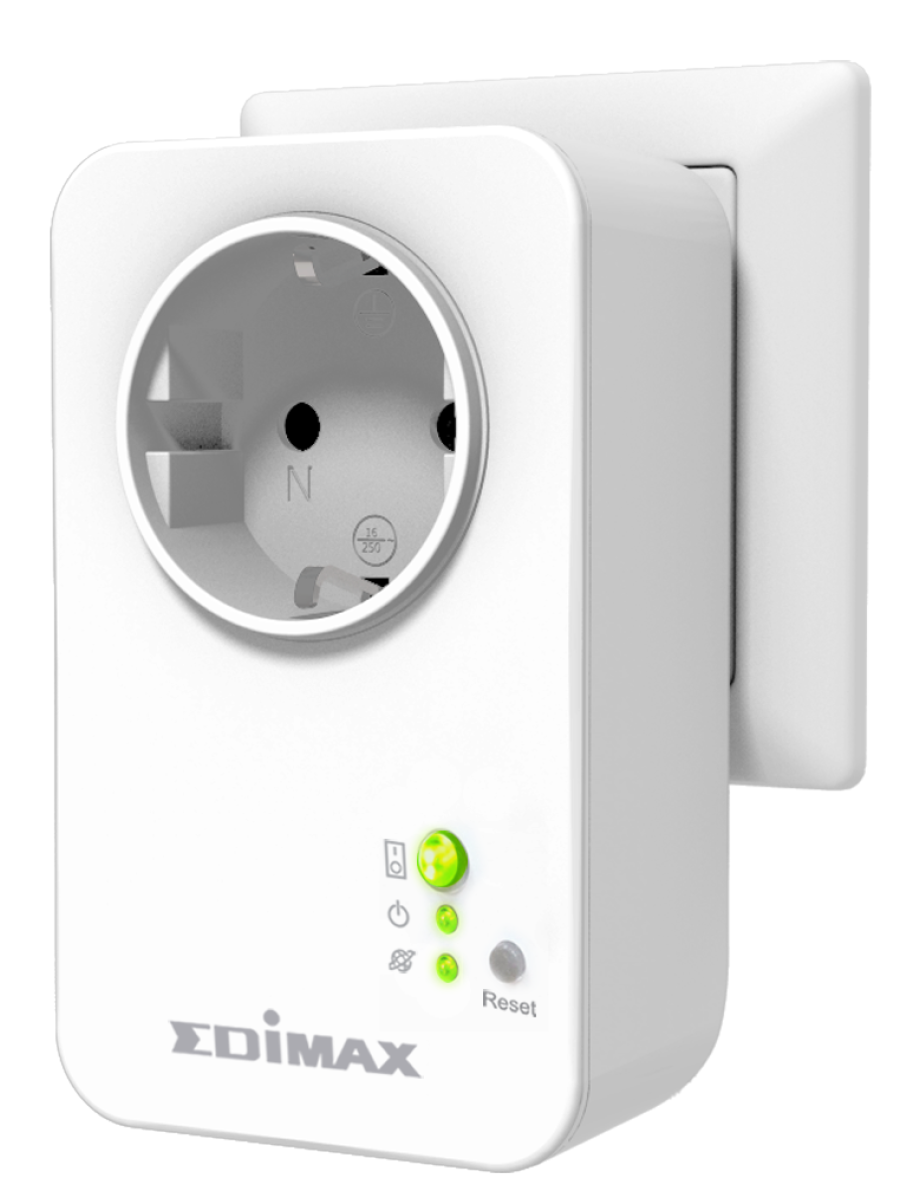
For these reasons, we consider that smart plugs are the devices that have the best quality–price relation and accomplish all the requirements. These devices have an easy implantation in the house. They just have to be plugged in a normal wall socket and the electronic appliances connected to them will be monitored. Furthermore, the devices provide information about the consumption of the appliances connected to them. Usually, these data are transmitted by a specific protocol that is implemented by official developer applications or through third-party APIs (application programming interface) that allow the establishment of a connection with the smart plugs. As a result, through this direct connection with the device, some smart plugs allow the controlling of the state (on/off) of the electronic devices through commands sent to the smart plug. Hence, for the deployment of this study, we have installed smart plugs that implement all these functionalities—in particular, the Edimax smart plug, which is illustrated in
Figure 4.
This smart plug uses the “TCP/IP” protocol described by Forouzan and Fegan [
24] in their work. Therefore, it makes use of WiFi technology in order to establish the connection. It uses IEEE 802.11b/g/n (see Sendra et al. [
25] for more information) as standard wireless. In consequence, our system makes use of the work elaborated by Wendler [
26], who has elaborated a Python API to control the Edimax smart plugs. With the use of this API, we can obtain real-time data and also control the state of the electronic appliances among other actions. Thus, in our study case, we make use of this software to implement the connectivity between the multiagent recommendation system and the measuring devices.
Thus, with this software, the devices agents are to connect to the different appliances allocated in the house. For each appliance, a device agent is generated. This agent establishes the connection through the IP address and the credentials. After the connection is established, the agent requests the current consumption of the device every six seconds. These data are stored in a text file with the weekday and the time of the request. Therefore this file contains as many records as requests done by the device agent. Once more, there is a text file for every electrical appliance in the house. Therefore, this information will form one of the datasets used for recommendations.
However, during this case study, we used an existing consumption dataset in order to verify our system with a proved dataset. Therefore, in this instance, we tested our system in order to demonstrate that the theory explained in the previous version works in the right way. Moreover, we used a well-knowing dataset so other researchers can test and improve the proposed system in this work. The last statement is what we consider more important in order to use an existing dataset. That is the continuous evolution of sciences thanks to the researchers’ community. For this study, we used electrical consumption data from the United Kingdom. We used the dataset created by Kelly and Knottenbelt [
27]—the UK-DALE dataset.
UK-DALE (domestic appliance-level electricity) is a dataset that has records from five different homes. The measure from the houses has different periods of time. The one with the longest period is “House 1”, with more than two years of active consumption records. During this time, the use of 52 electrical appliances was stored. Most of them were active for almost the entirety of those two years. Therefore, with only “House 1”, we have a lot of records in order to extract the behavior of the users. Consequently, we used these data for the case study. In particular, we used the data that were stored every 6 s (the dataset offers 6 s, 1 s, and 16 kHz data).
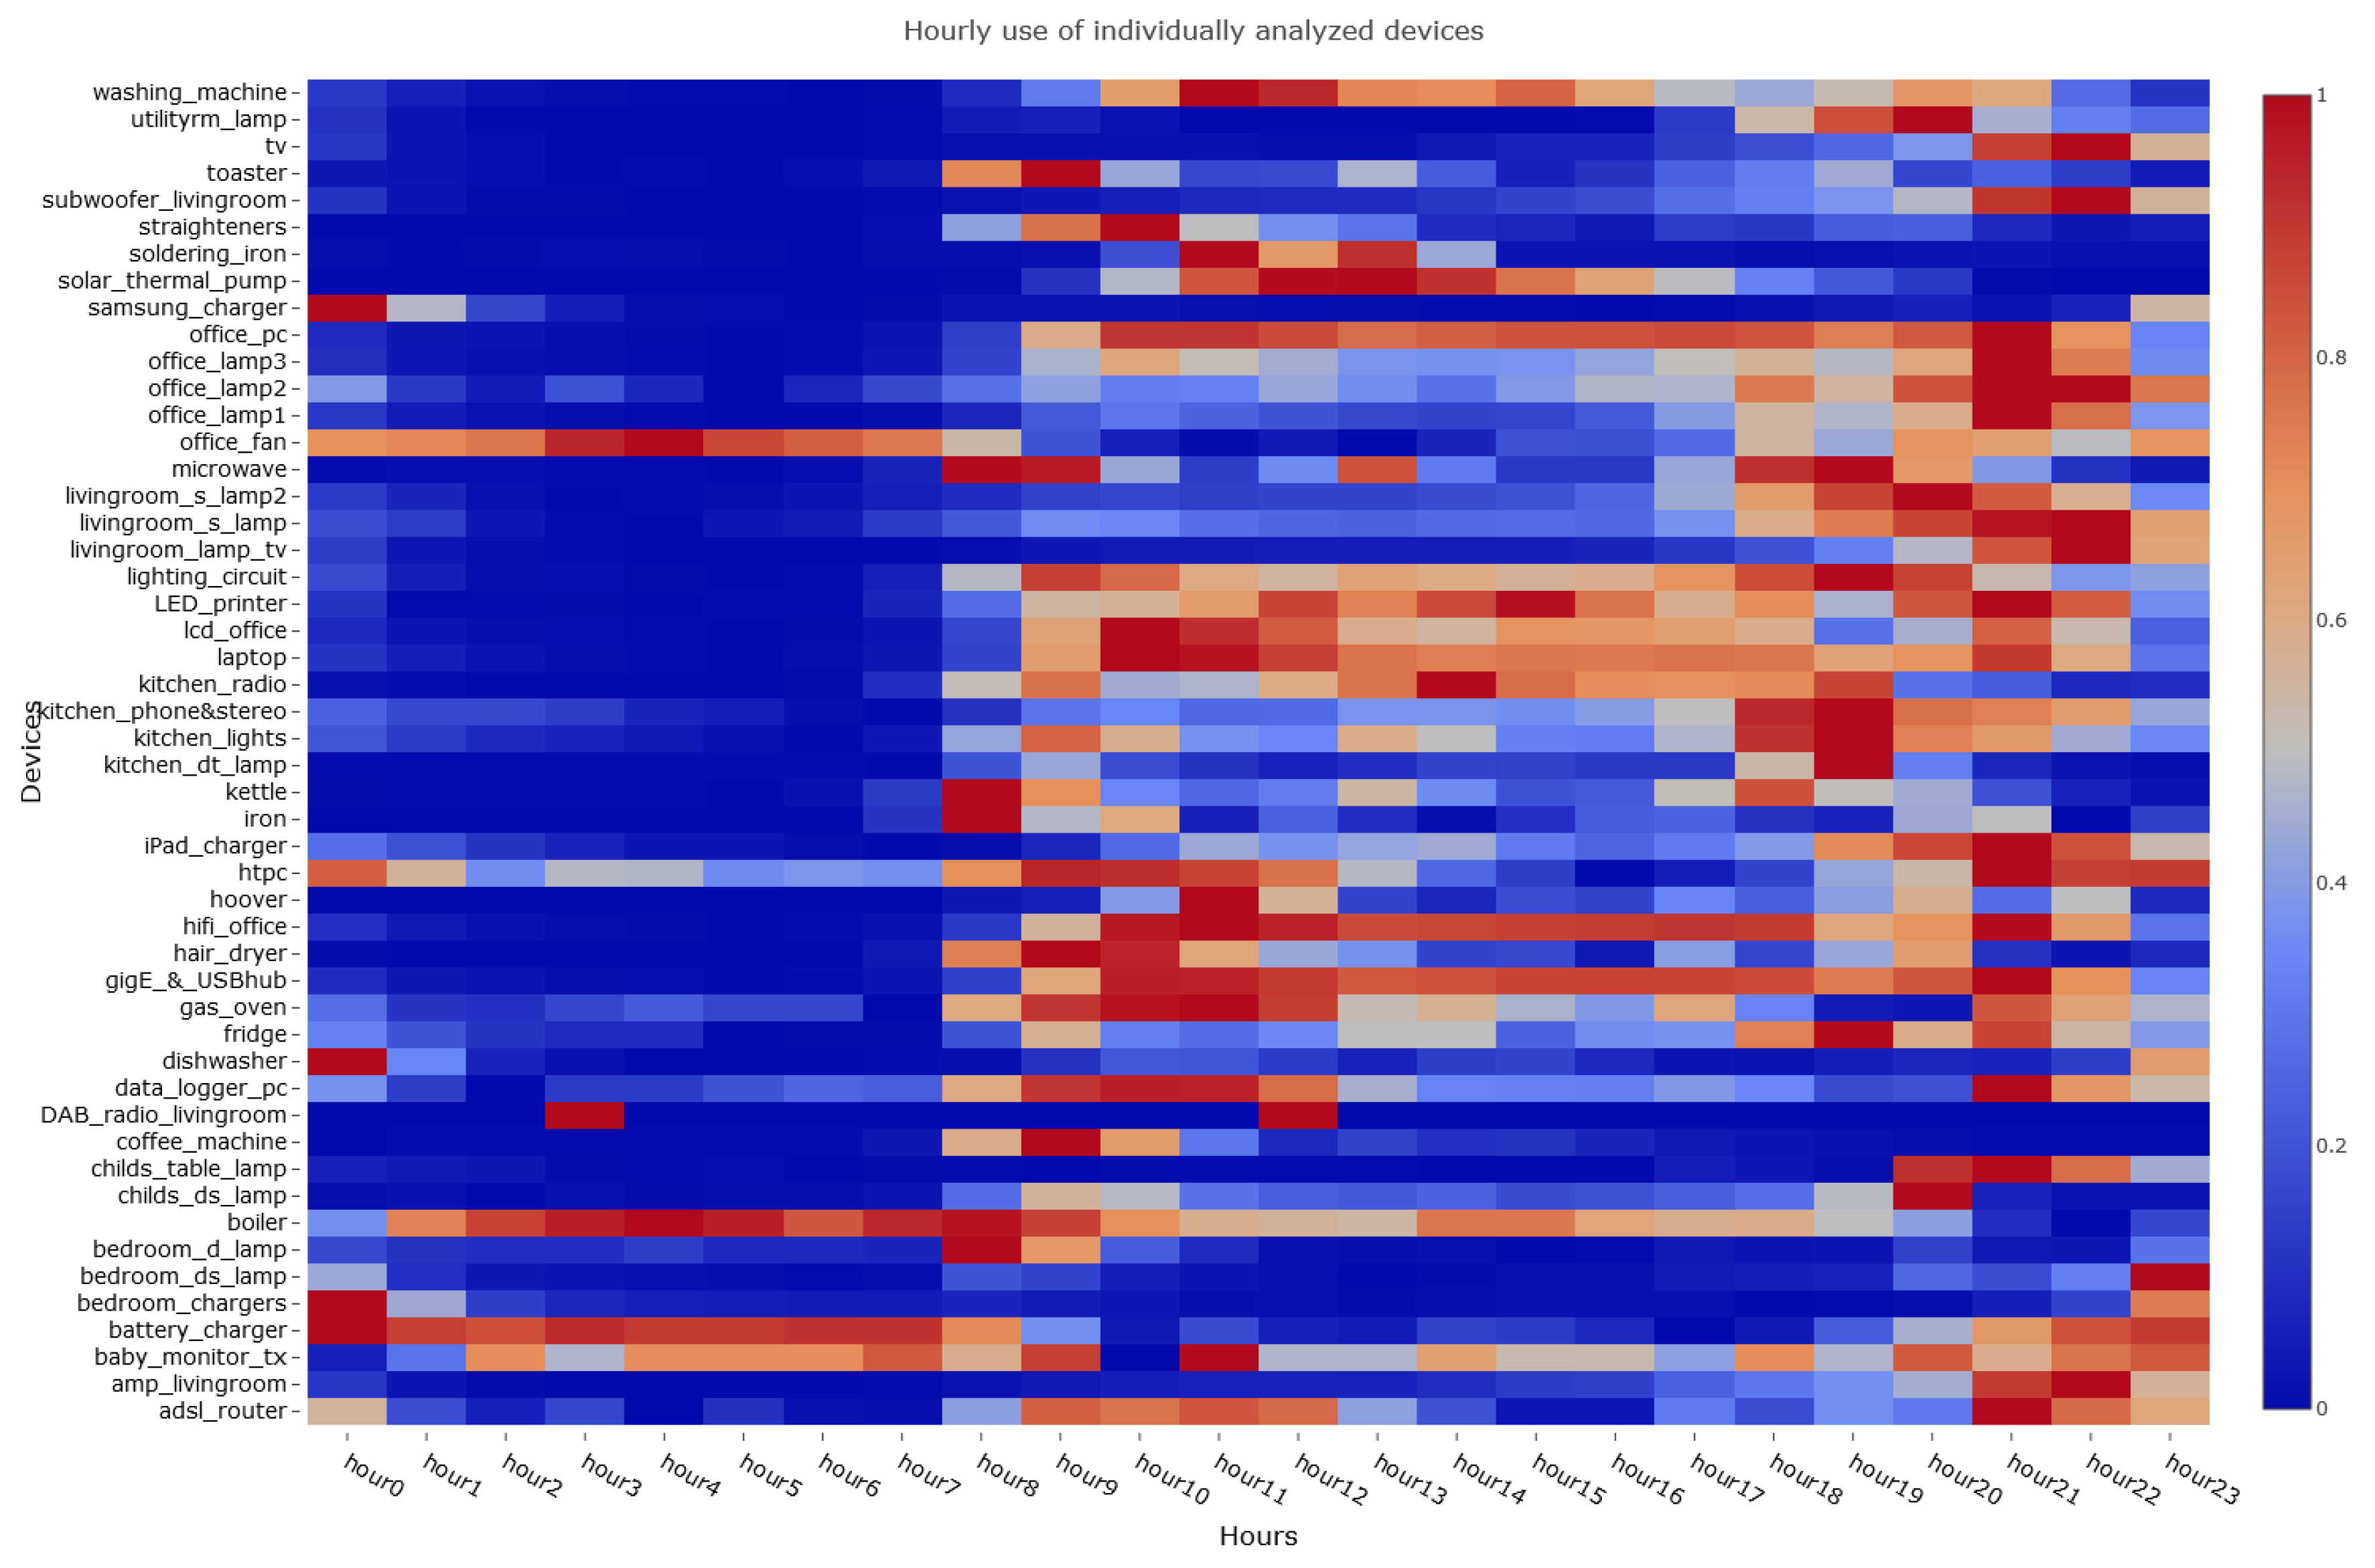
These data contain records with the data-time in “Unix epoch time” format, and the consumption for this time is in Watts. In order to attain a piece of more visual information, we transformed the “Unix epoch time” format into a “YYYY-mm-dd HH:MM:SS” format. We also obtained the weekday for this date. As we explained before, these actions are carried out by the filtering agent in the recommendation module. Once the system filters the data, the behavior agent extracts the patterns of use for every device. In this process, it is important to mention that two electronic devices of the UK-DALE dataset have to been taken out of the study because they do not have the expected structure. These appliances are the ones labeled as “breadmaker” and “kitchen_lamp2”. Therefore, the system is now working with 50 electronic appliances. The patterns of use of the different devices are shown in
Figure 5 and
Figure 6.
Figure 5 compares the hourly use of the different devices between each other.
Figure 6 represents the hourly use of devices analyzed individually.
Hence, with the information provided by these two images, we can assume some requirements in order to improve the efficiency of the proposed system. In
Figure 5, we can appreciate that there are some devices that do not change their behavior at all. These appliances can be identified as nonhuman action devices. The other type is human action devices. This classification is better understood with an example. For instance, a fridge or a boiler are electronic devices that in normal situations are continuously connected to the electric grid. Their electric consumption is not very related with the human because they will consume energy while they are connected to the grid. Consequently, it can be understood that they are nonhuman action devices. However, in many cases, these devices are the ones that consume more energy, but their behavior is not related to the user’s behavior. Thus, these devices do not require recommendations. Human action devices are the opposite, like a TV. The TV only consumes energy when the client turns on the device.
In
Figure 6, we see how appliances are used. It is important to know how devices are used in order to obtain better recommendations. Therefore, there are some devices that have a more variable use, like the washing machine. The washing machine can be used at different hours. This means that the client can turn on the washing machine at 7 p.m. or at 9 a.m. We classify these devices as “long-term recommendation”. Furthermore, in the case of the washing machine, it is important to assure that the suggested hour in which the device’s use is recommended is an active hour as well as the hour in which the device finishes its performance. This requirement prevents future complaints of the system’s users. Alternatively, there are other kinds of appliances of a more restricted use. Devices like lights are only used when the client is forced to turn them on. These devices are labeled as “no recommendation”. However, there are other kinds of restricted devices that can suffer a little change in their normal use—for example, a laptop. These devices can be used a little bit earlier or a little bit later depending on the electricity price. These types of devices are classified as “short-term recommendation”. Nevertheless, some of the recommendations related to “short-term recommendation” devices could be rejected by the users due to them not wanting to change their normal use. However, we wanted to provide these recommendations to the final users in case they change their mind and then follow the recommendations or just so that they decide to do another thing. For example, if the system recommends using the microwave one hour later, the user could decide to prepare another meal that does not involve the microwave. Another example is that if the user has turned on the TV while doing another activity, thanks to the proper recommendation, he/she could decide to turn it off in order to save some money since he/she is not paying too much attention to the TV. Consequently, we consider that this kind of “short-term” recommendation has to be offered to the user. The assumed requirements from
Figure 5 and
Figure 6 are illustrated in
Table 2.
Hence, with this decision table, the recommendation agent can follow the recommendations properly. However, to do it, it also needs an electric prices dataset. In this case study, we are going to work with the Spanish electric market. In the Spanish case of study, it is important to mention that there are three different rates. The first one is the normal rate. This rate is hired by almost all citizens in Spain. It has lower prices during the night and higher prices during the evening. The second rate is the hourly discrimination rate. This rate has higher prices between the morning and the afternoon. The lower prices are during the night and during the early morning. This type of rate is usually hired by people who are habitually active during the night because they rest during the day because of their jobs. Just as a side note, in Spain, there is a third rate, the rate for electric vehicles. It has similar prices to the hourly discrimination rate. Consequently, in order to test the proposed system, we do so with a dataset that contains the daily prices for the normal rate.
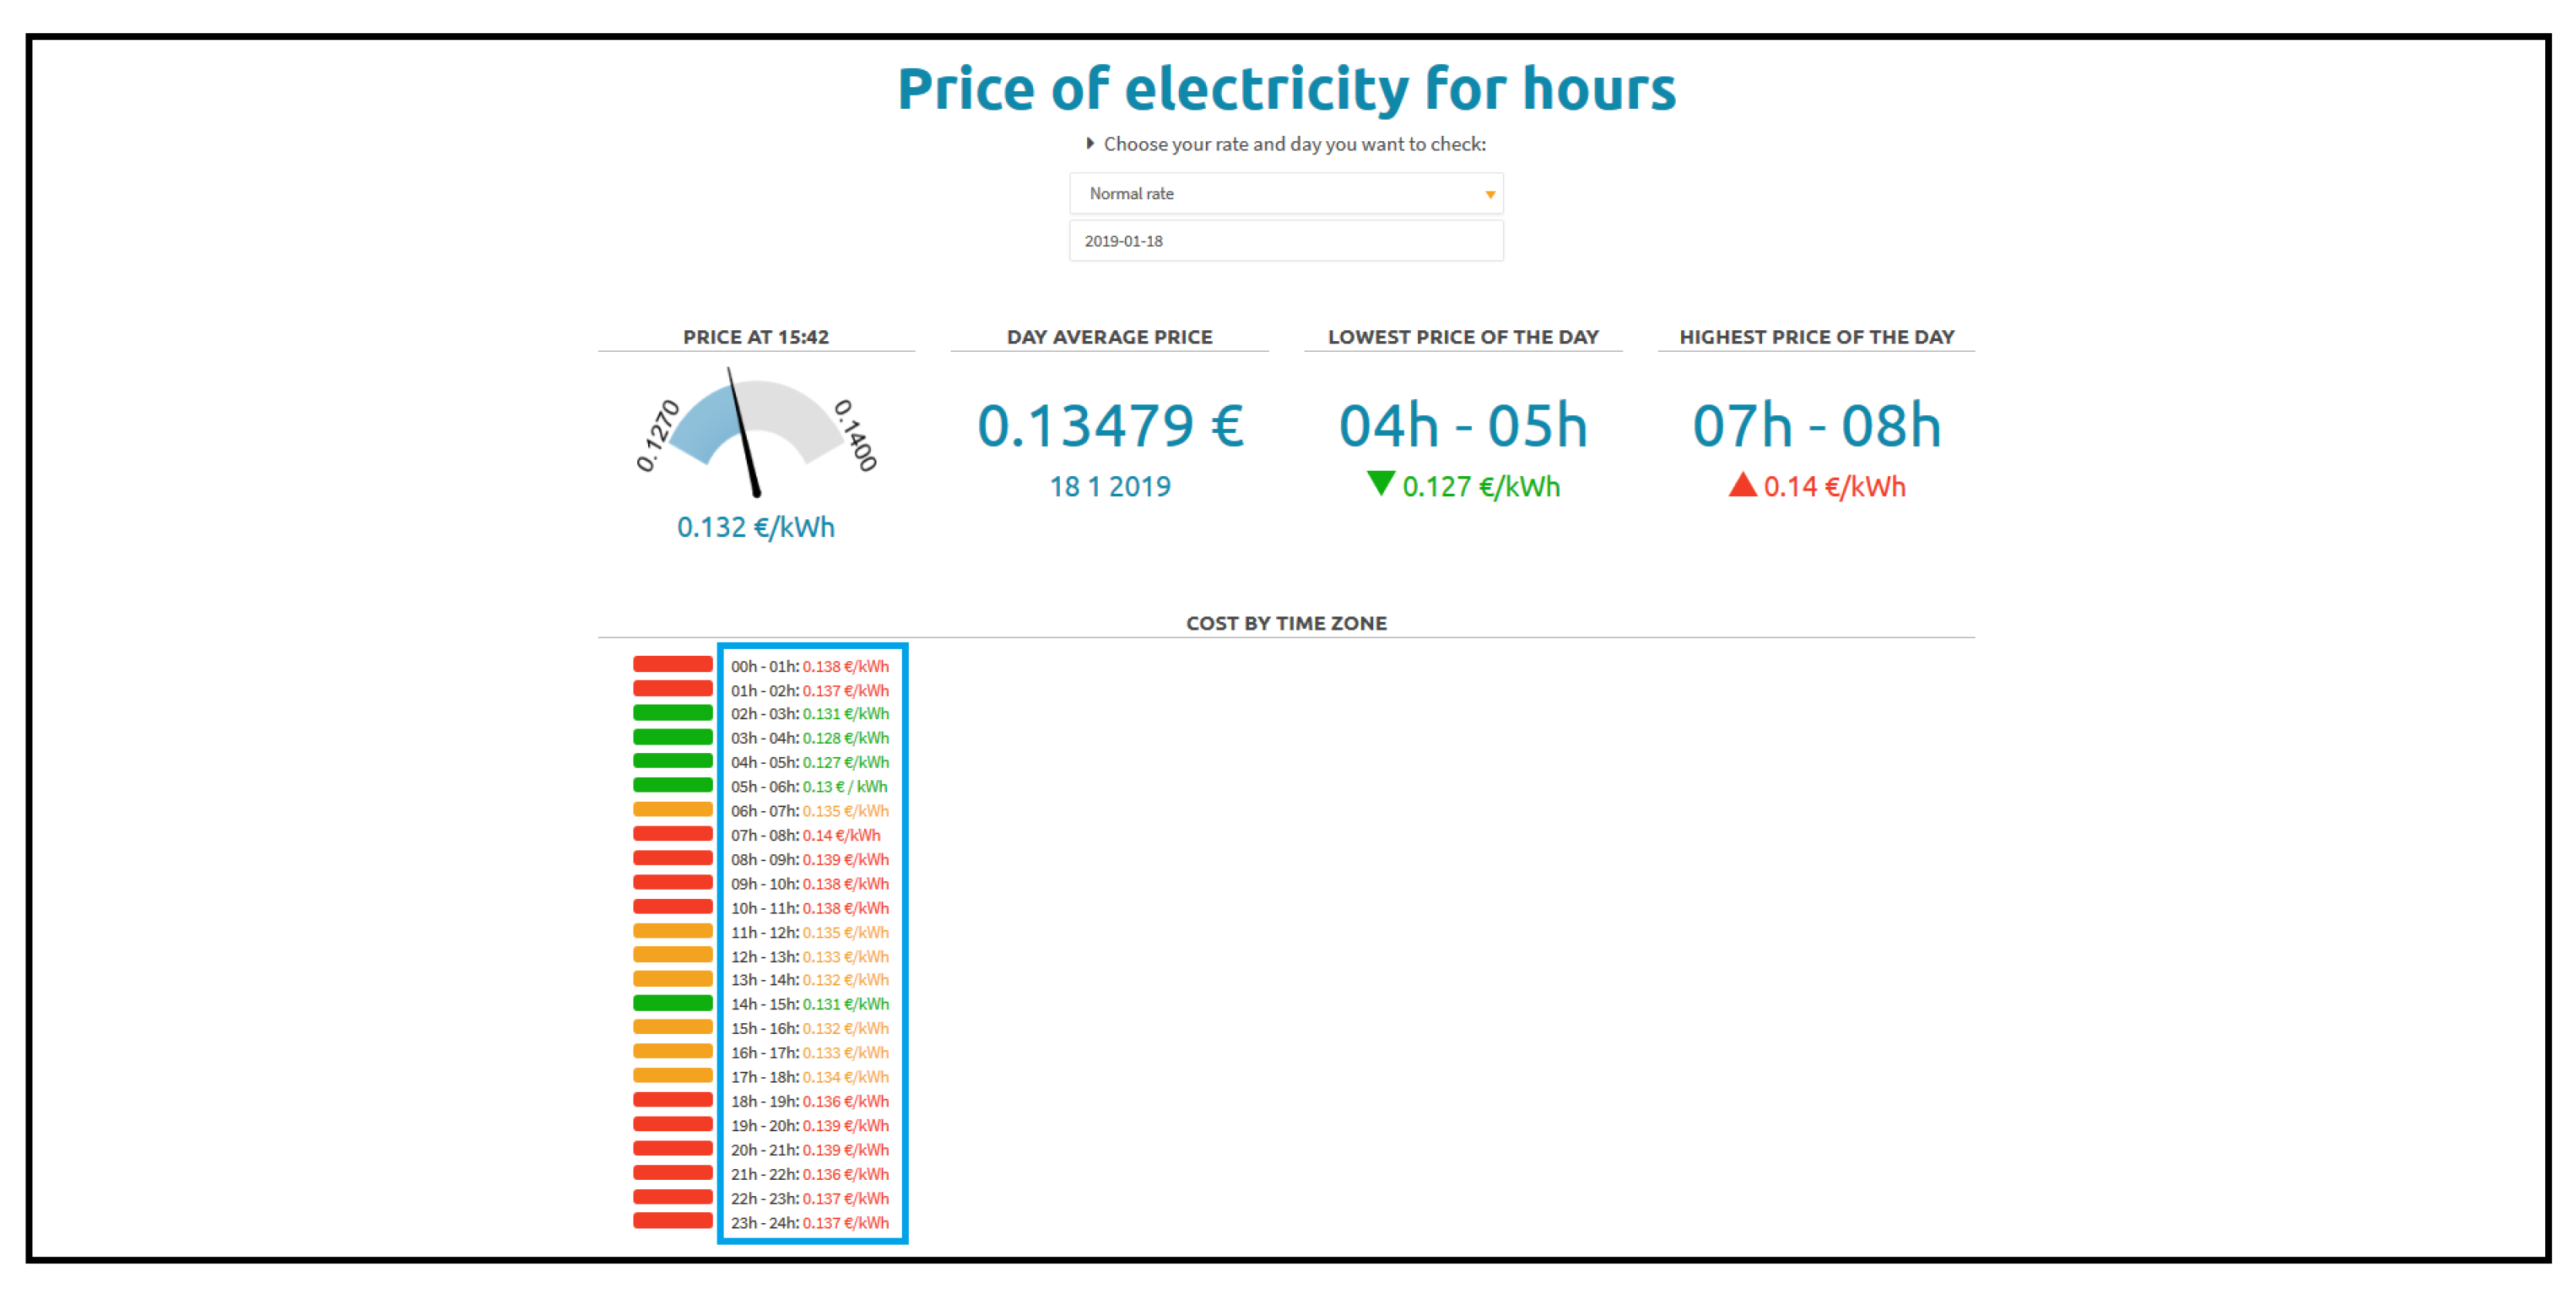
As we mentioned previously, there are several web pages that offer public information about the prices of electricity during the different hours of the day. We considered it was important to extract the data from a web page that could offer to the possibility of extracting the three different kinds of rates. Thus, for future implementations, we only have to apply little changes to the crawler software. For this study, we extracted data from the following URL,
https://tarifaluzhora.es/. A capture of this web page can be seen in
Figure 7. We have marked the data that we had to extract in blue.
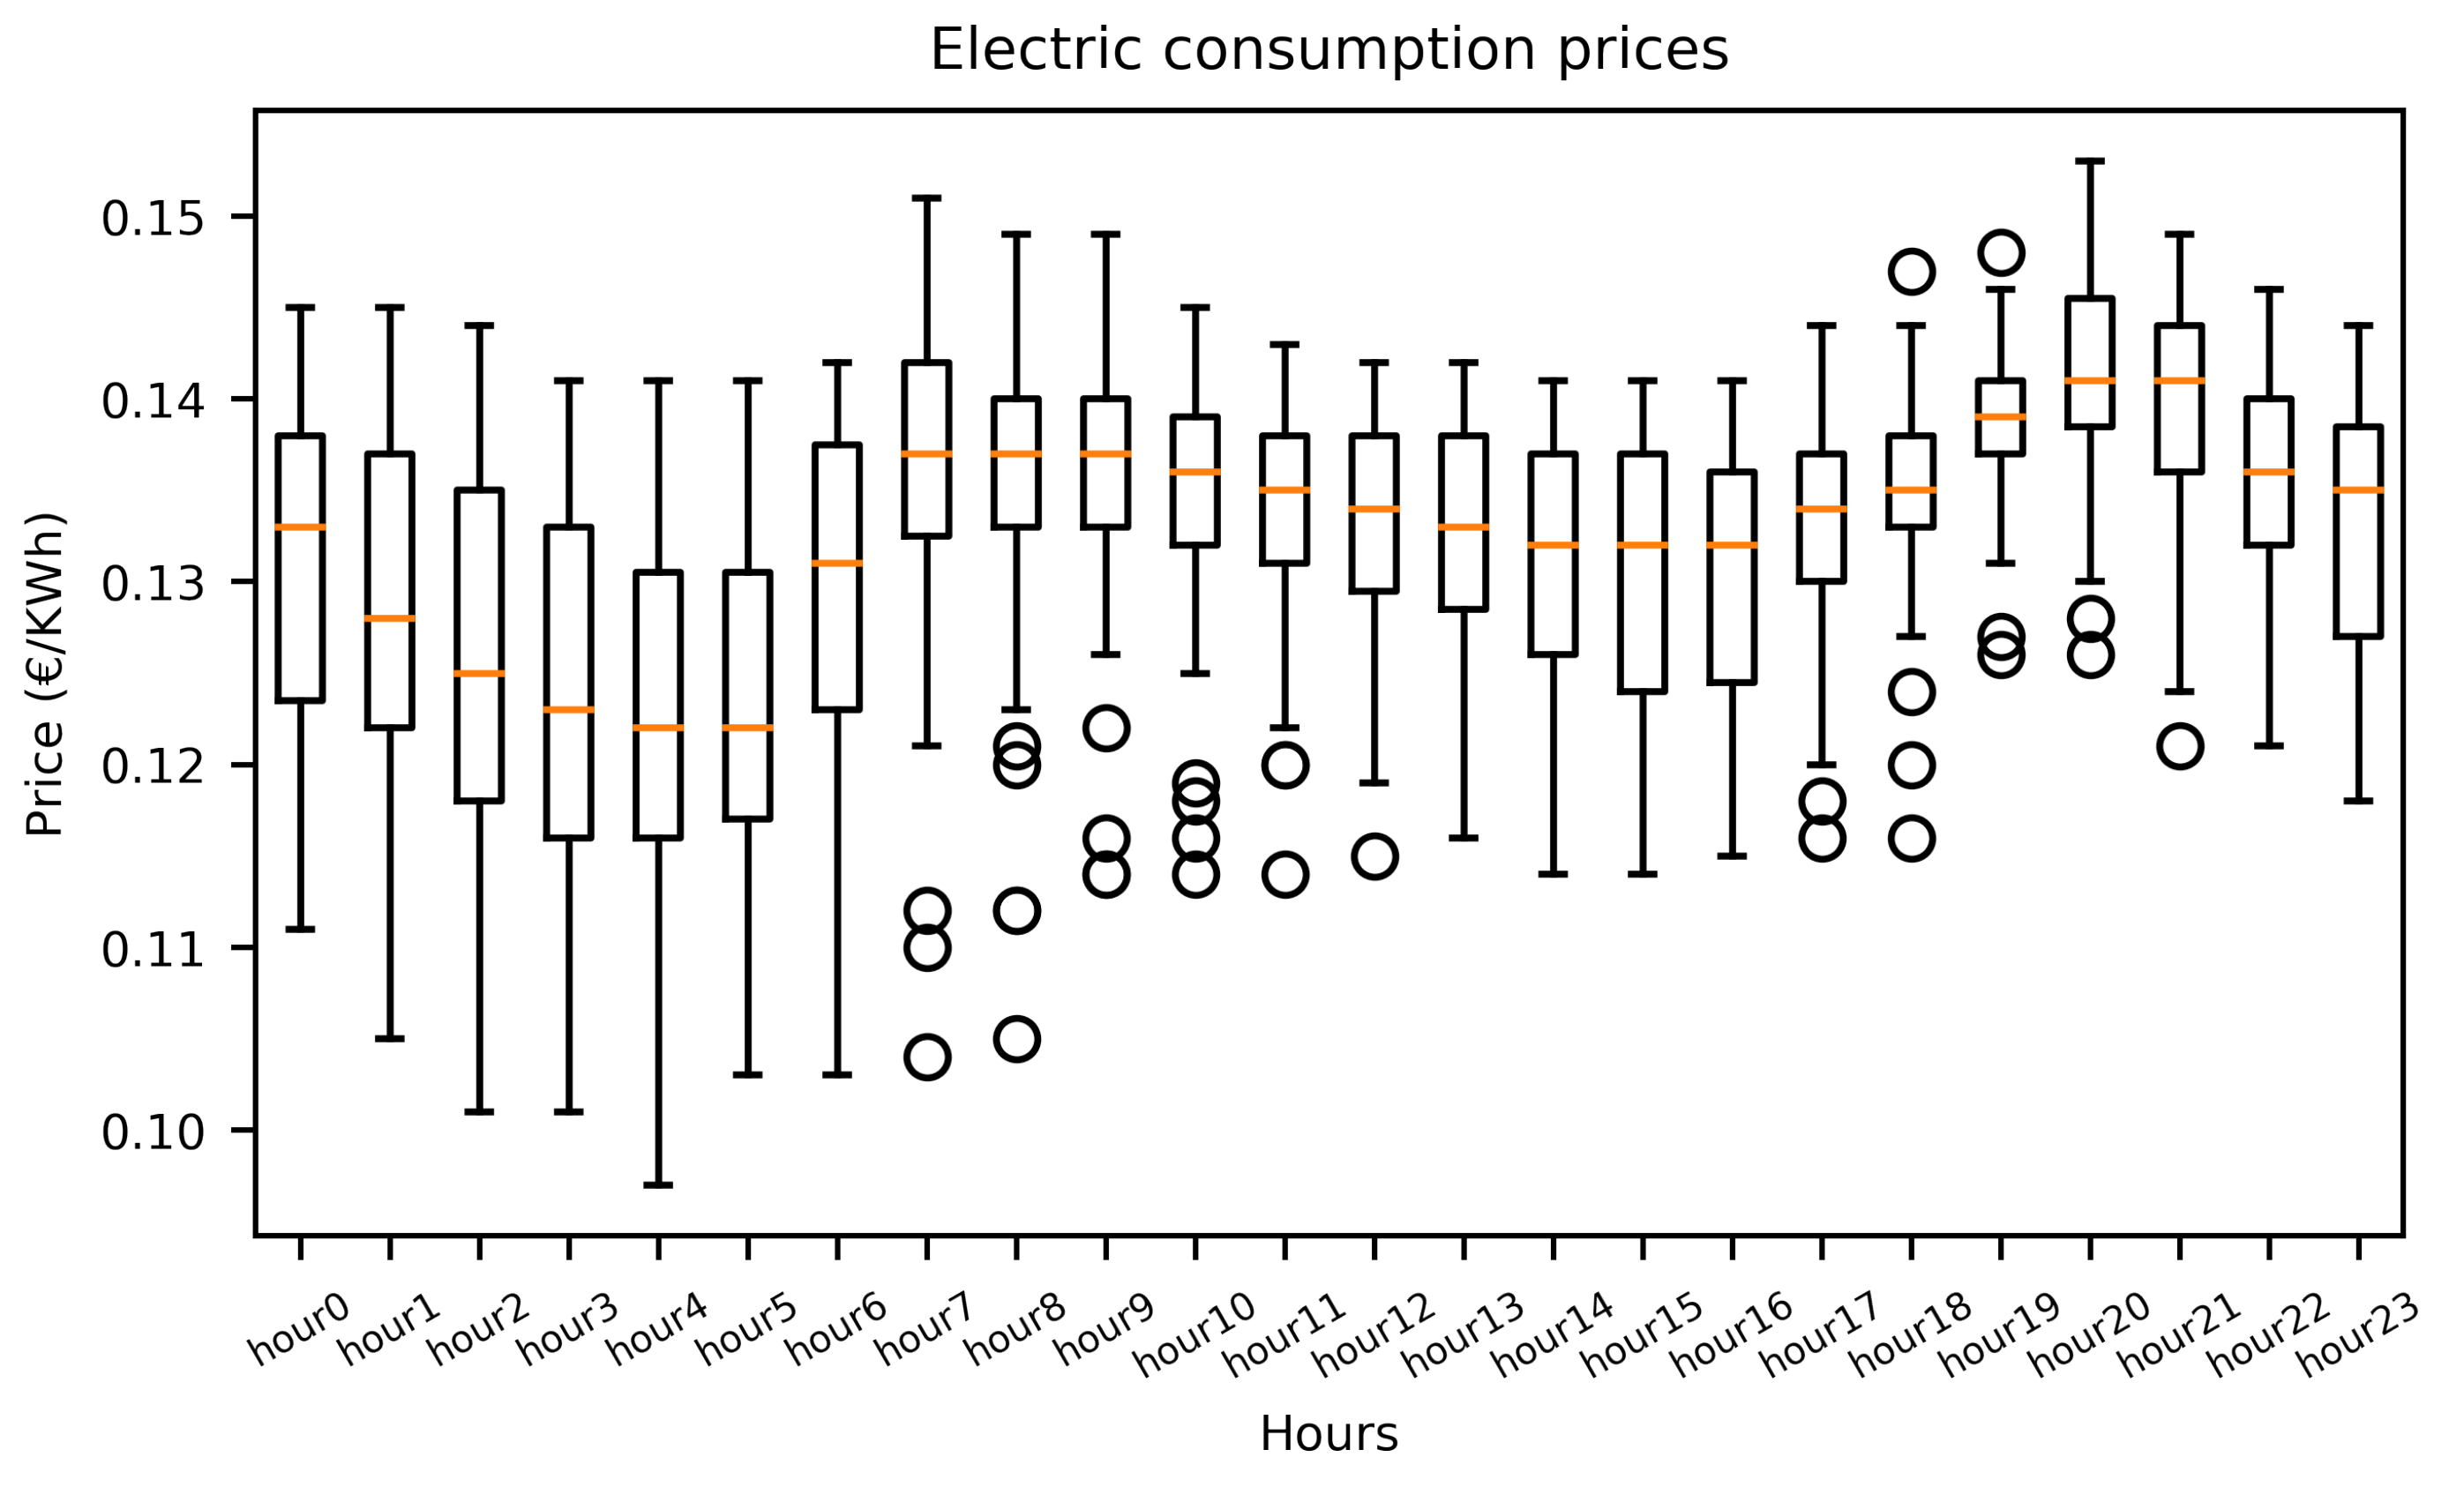
The crawler agent collects these data. For future use, we store the data with the structure that is represented in Equation (
2). The distribution of these data in the normal rate is shown in
Figure 8. As we explained before, the rate has lower prices during the night and higher prices in the evening.
where
i represents every one of the instances in the prices dataset,
D. For each instance, the date and weekday are stored as well as the prices for every hour of the day in €/kWh.
5. Results
In this section, we explain the results provided by the different modules of agents that have been described in
Section 3. Just to remember, there are three different modules, “devices module”, “crawler module”, and “recommendation module”. First, we explain the results of the “devices module” and then the rest.
As we explained before, we connected the devices agent with the different smart plugs using the software library elaborated by Wendler [
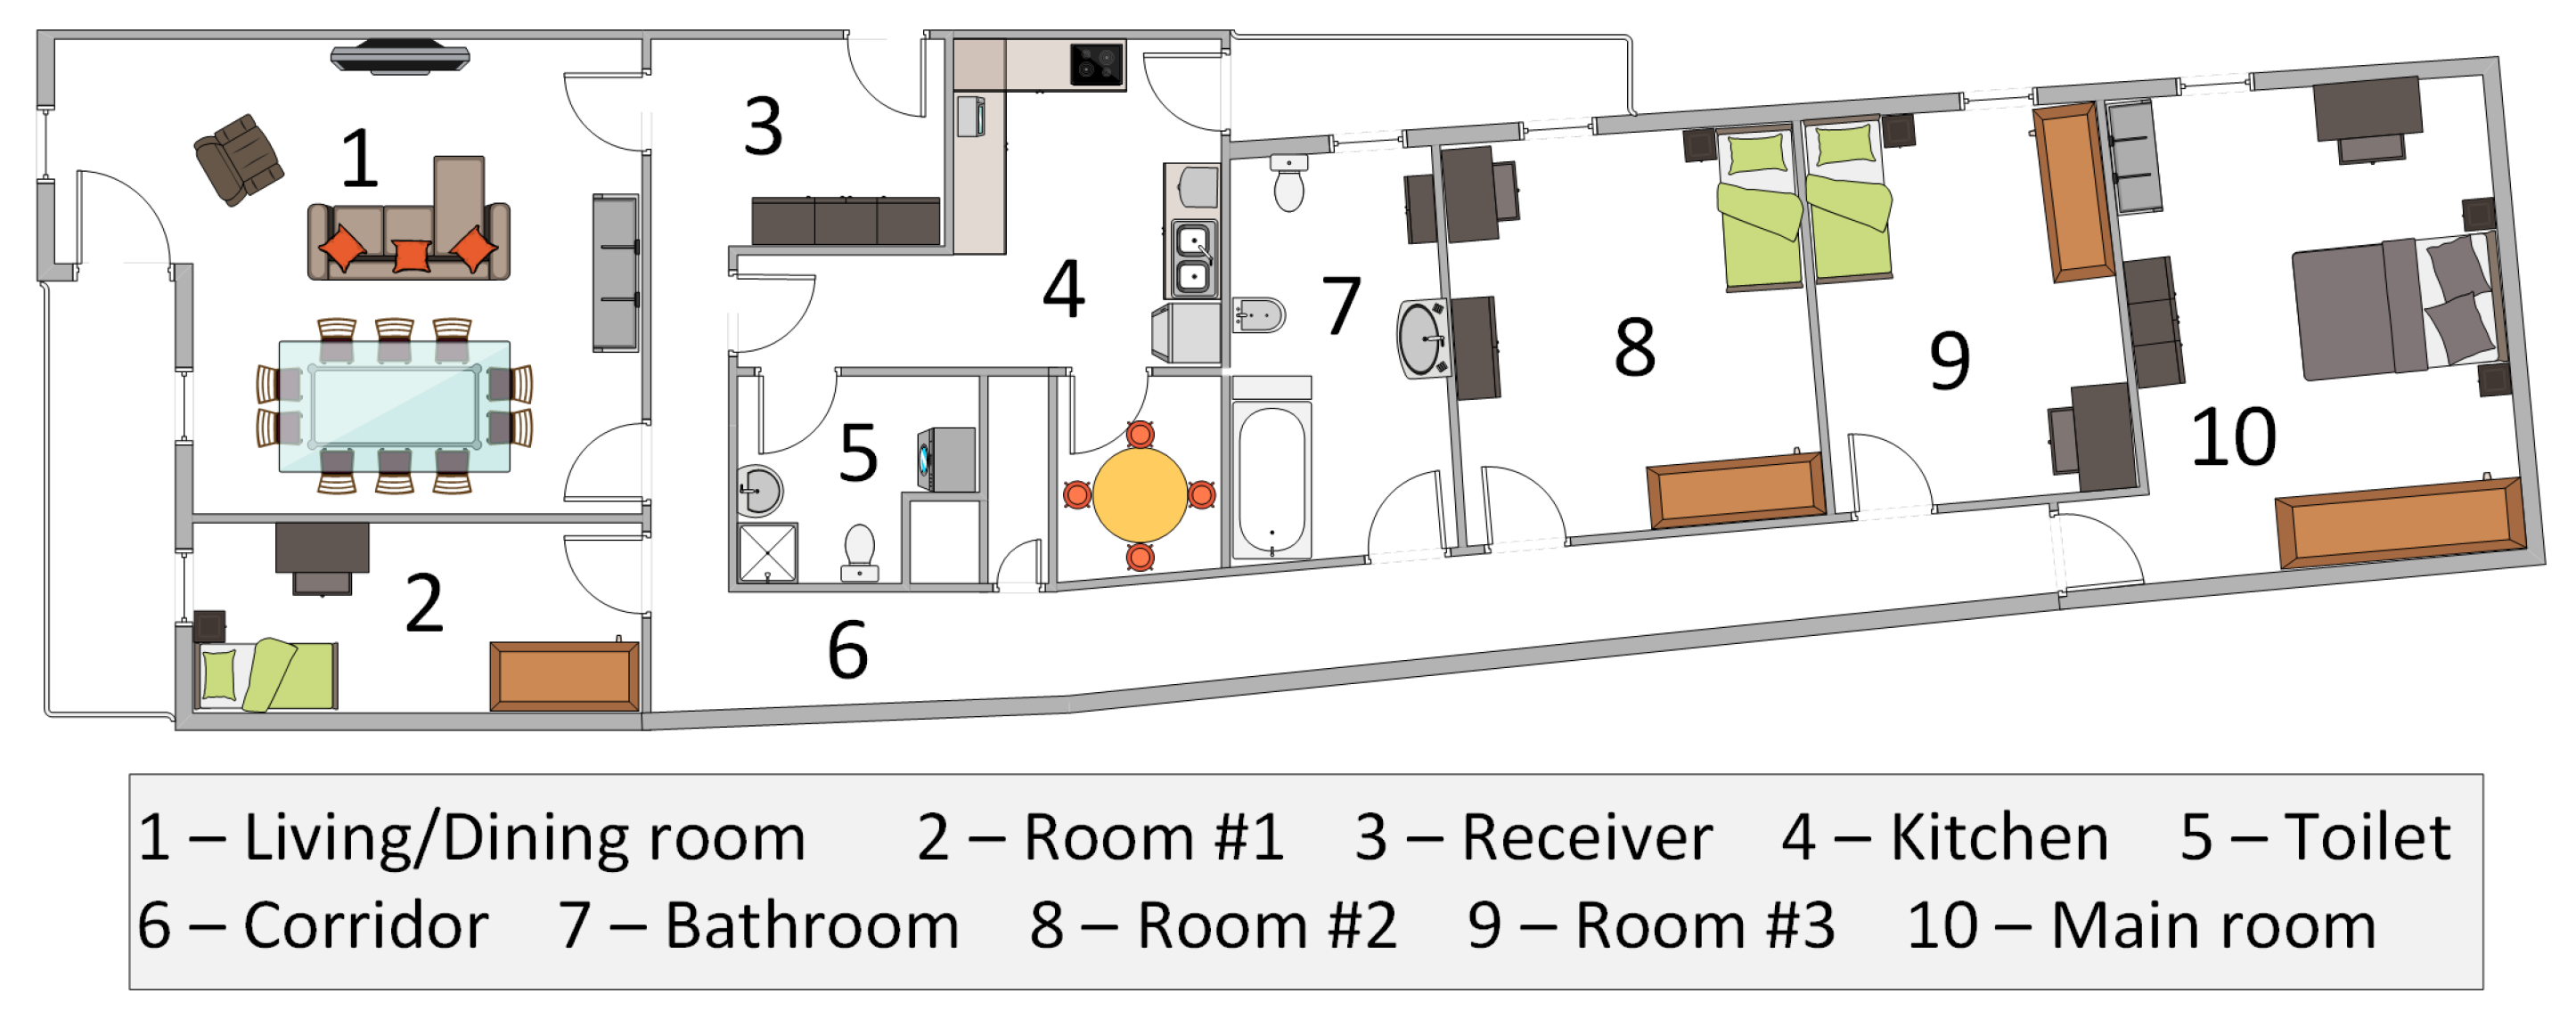
26]. We tested this module with six different EDIMAX Smart Plug Switch SP-2101W. Hence, we tested the module with a maximum of six devices agents deployed at the same time. We reviewed different electronic devices. These are a microwave, a washing machine, a TV, a fan, a laptop, a router, a desktop computer, a computer monitor, an alarm clock radio, and a desktop lamp. These devices are located in an apartment of around 120 m
. The distribution of the flat is represented in
Figure 9. The house has ten rooms, and the appliances were distributed all over the household. We tested the module with different combinations of devices. The system has not shown debilities with any of these combinations. We verified every one of them throughout a day. We have to keep in mind that the agent consults the consumption of the device every six seconds. Consequently, the agent obtains 14,400 registers for a single device in one day. Hence, 86,400 registers are collected in a single day in the case that the combination contemplates six devices. As we mentioned, the behavior of the different devices agents is as expected. Therefore, we concluded that the “devices module” is performed correctly.
The software implemented for the “crawler module” also works perfectly. In order to assess this agent, we tested it for 72 days. As explained, the agent obtains the consumption prices once a day. In our case, we decided to extract this information at 00:01:00 hours. Hence, this agent was deployed for more than 1,728 hours without causing any problems. During this process, we obtained a dataset which is going to be used by the “recommendation module”.
Finally, we are going to discuss the “recommendation module”. This module is the main contribution of this work. As we explained, this module tries to optimize the electrical bill of the customer. With this action, the system also tries to distribute the electrical consumption in the house. These are the two mains objectives of the proposed system. Consequently, we discuss each of them individually.
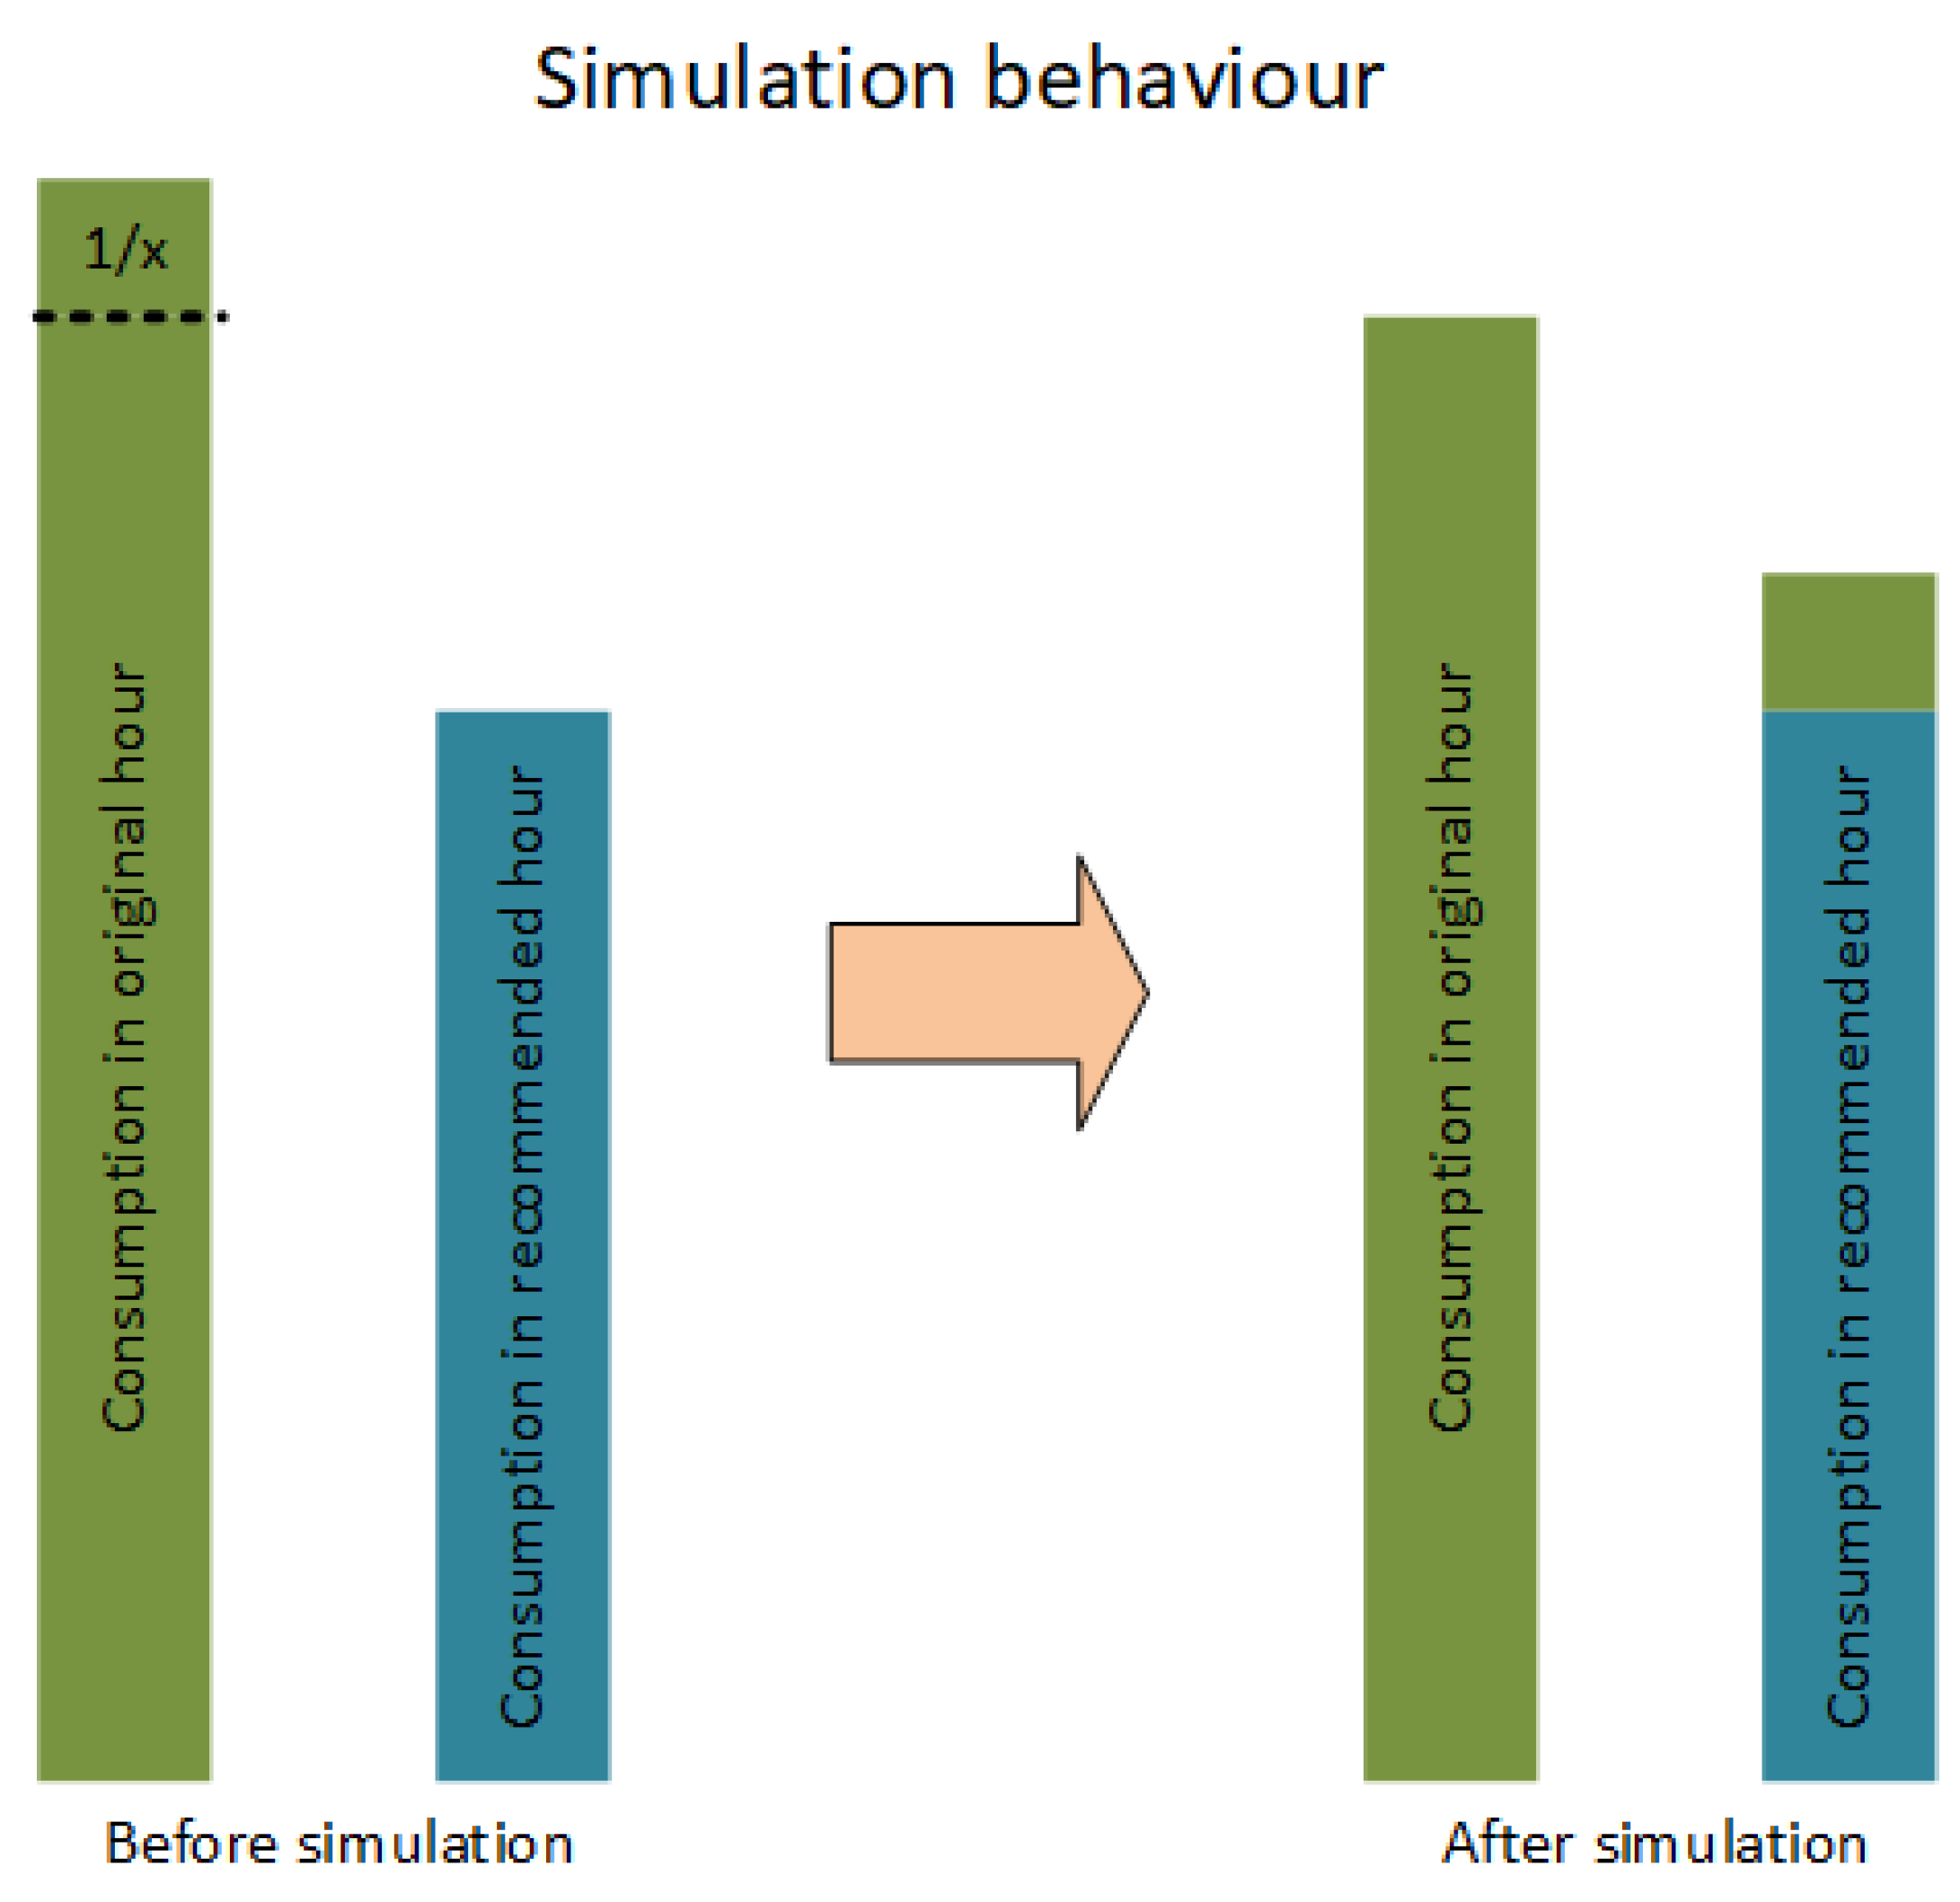
In the first term, we analyze the different simulations that were developed in order to test the system. Once the system is finished, we have to test it, so we established different situations related to the answer that the user can have to the recommendations provided by the system. It is important to mention that we limited the maximum number of recommendations per device to three. Therefore, we considered four situations, the “Optimistic”, the “Neutral”, the “Probable”, and the “Pessimistic”. The “Optimistic” is the less probable simulation because users are usually reticent to change their habits. The “Neutral” is a probable simulation but still needs a user that is not very restricted. The “Probable” simulation is the one that we considered where normal users could follow after the installation of the multiagent recommendation system in their homes. The “Pessimistic” simulation is related to the behavior followed by a restricted user. In all these simulations, we determine a percentage of the consumption consumed in the original hour that we know is going to be consumed in the recommended hour. Hence, for each situation, there is an associated percentage. In
Table 3, we determined the percentage for every simulation. For example, in the “Optimistic” situation, we determined that a tenth of the normal consumption in the original hour is going to be consumed in the recommended hour. We explain this process in
Figure 10. In these simulations, we simulated the recommended system for a month. Thus, we can offer the quantity of money that the user can save in a month and how the consumption can change in the case that the user continued with the recommended consumption and the rate of acceptance that we estimated. For the simulation, we used the consumption prices collected with the “crawler module” and the data consumption from the UK-DALE dataset ([
27]). Using this dataset, other researchers can improve this work.
We determined these percentages because it is well known that the usually recommended system has a low rate of acceptance, so we also considered low percentage for running the simulations.
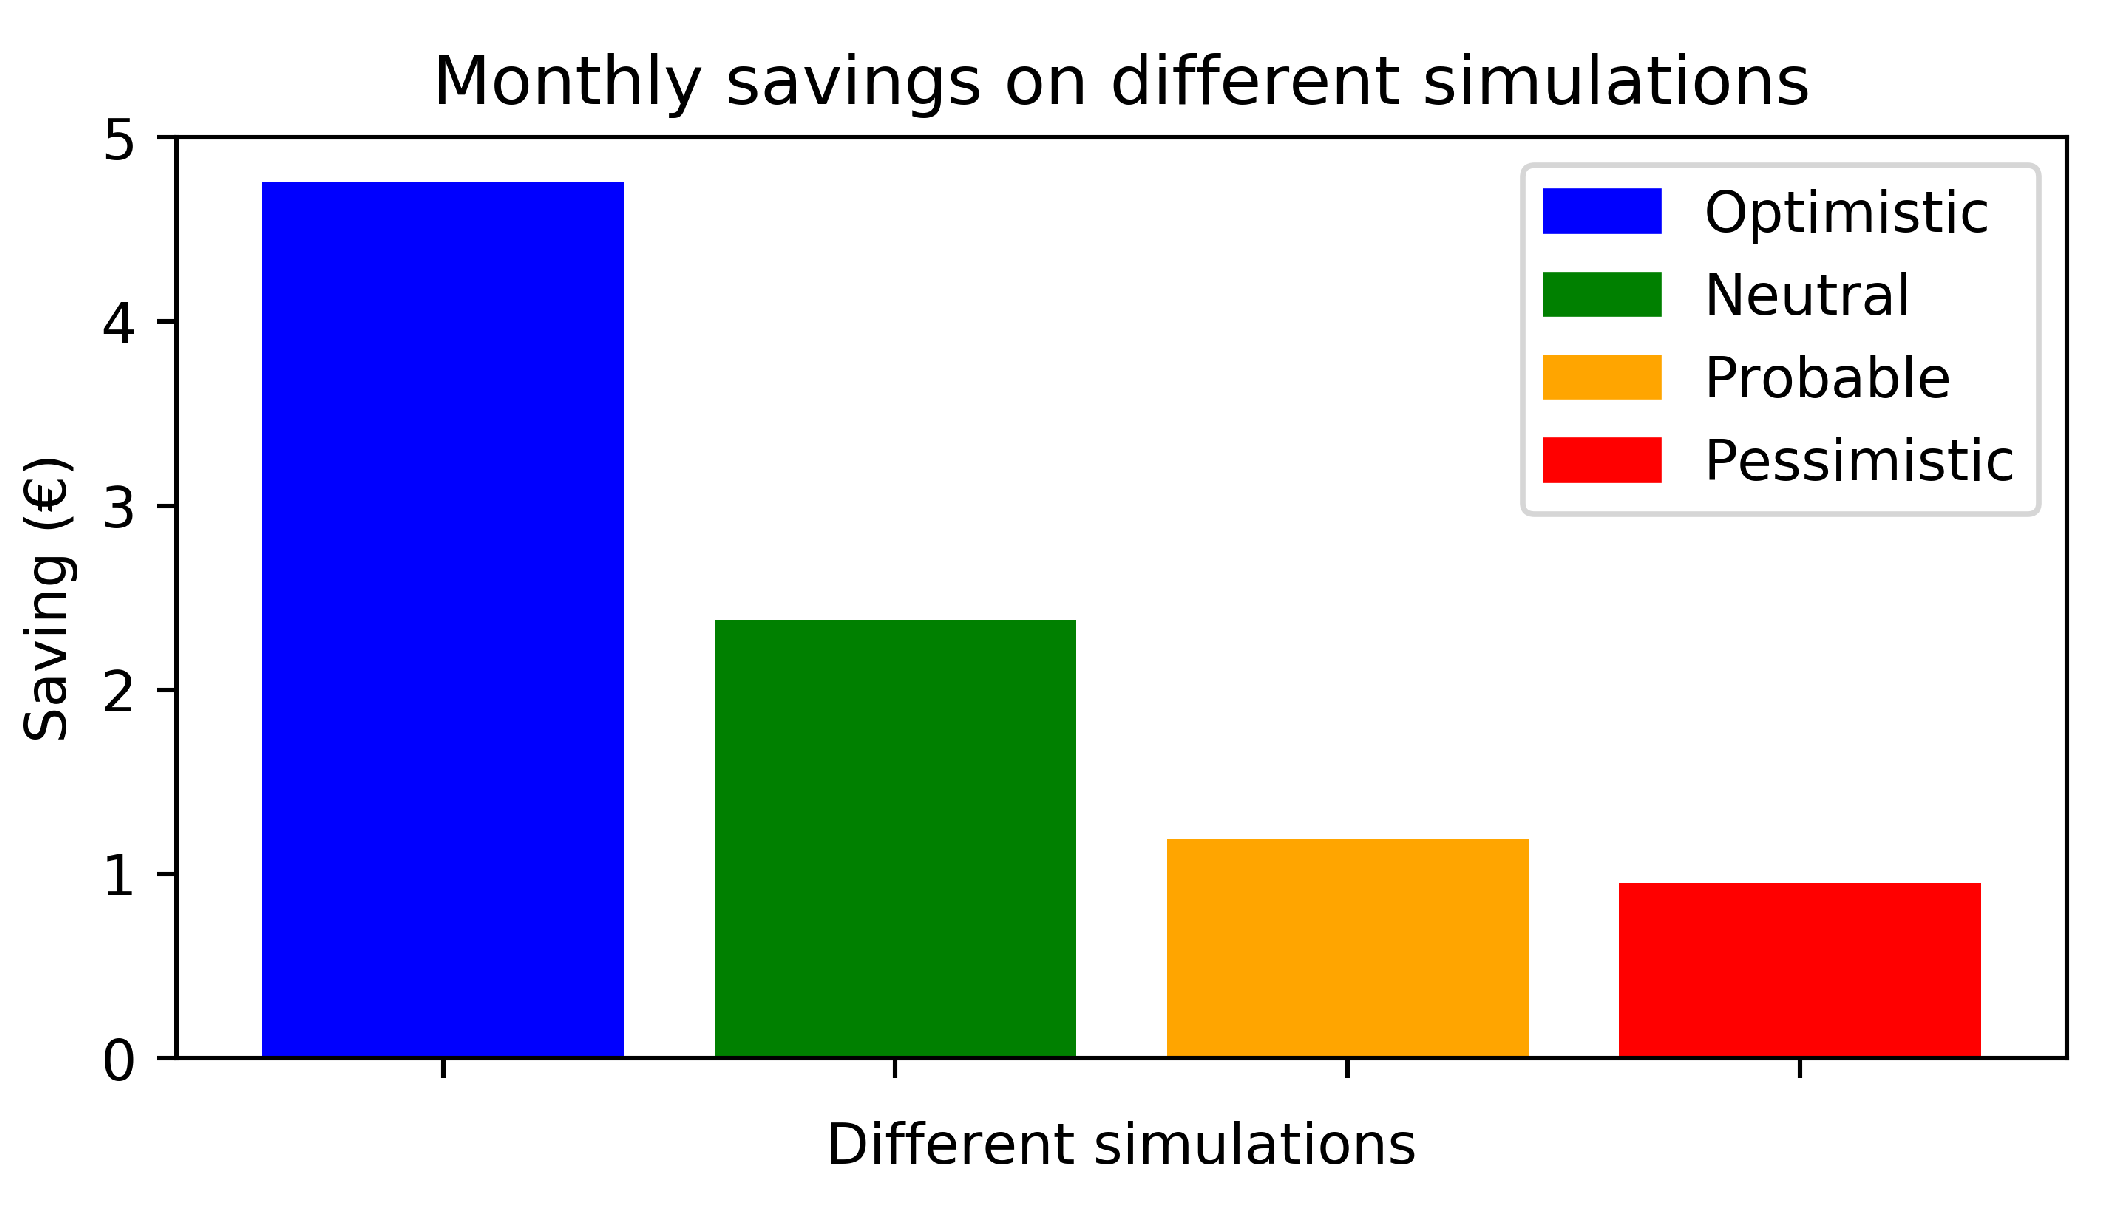
Consequently, we ran the four different simulations and we estimated what the client could save. With every simulation, we could achieve the median value that the user could save in a month. Therefore, first, we estimated these values with the mean consumption every hour. The savings in the different situations are illustrated in
Figure 11 and in
Table 4.
Table 4 also shows the total consumption in kWh during the simulation month. It can be observed that the most optimistic situation is the one that also saves more money. The other simulations’ saving decreases proportionally. Further, in
Table 5 we represent the return on investment (ROI). We considered that in this case of study, it is important to show in which moment the user receives a real economic benefit. As can be shown in the table, the return on investment is a very long period of achievement. This is due to the great number of electronic devices that the system monitored (32 devices). Therefore, we considered that in a normal home, the number of devices will be reduced significantly. However, in future lines of investigation, we will discuss the possibility of providing recommendations based on potential financial saving, so the number of monitored devices will decrease as well. Furthermore, we will study the possibility of introducing new smart plugs, which will be cheaper than the original one, to the system.
Thus, with these representations, we demonstrated that the proposed system in this article provides an incentive to the user of the system, an economic incentive. By using this strategy, more users will respond in a positive way to the recommendations that the system generates, although, as we mentioned before, this goal is not the only one that our work intends to accomplish. By using these recommendations and their incentives, we tried to distribute the use of energy so there are fewer peaks in their consumption.
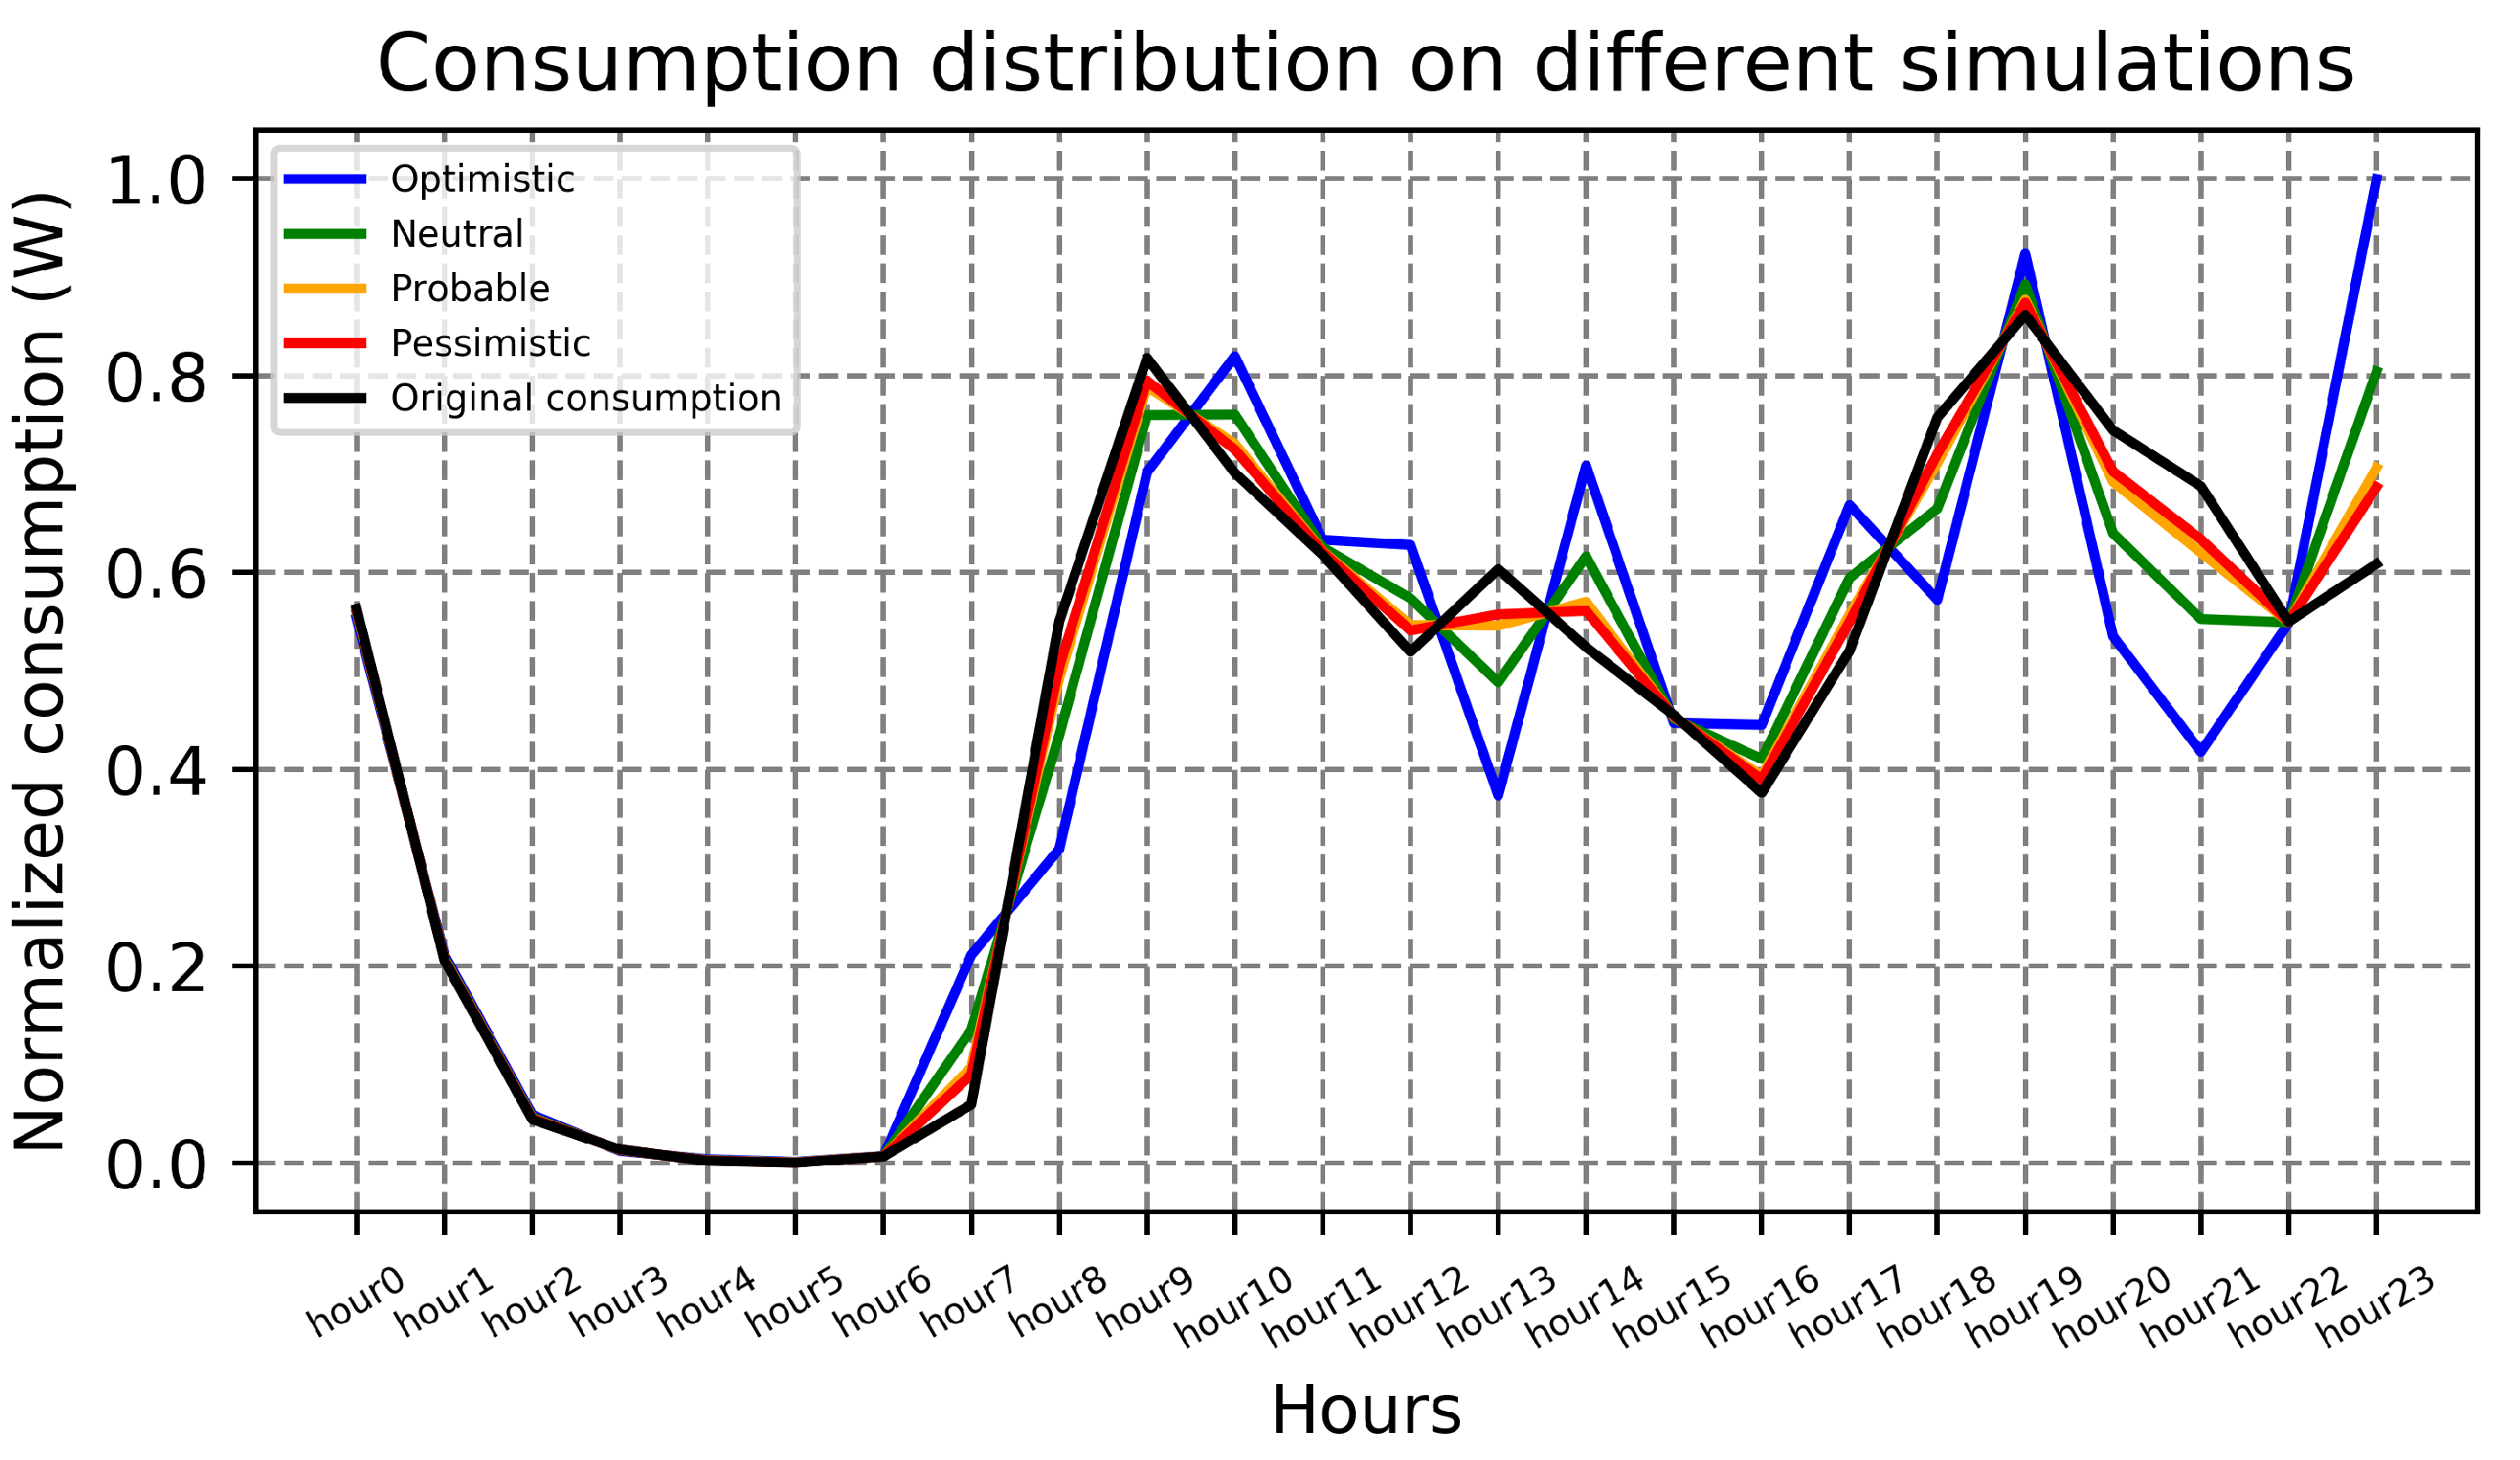
Then, if we compare the different simulations determined before and we determine how the consumption change in the case that the user follows the recommendations provided by the system, we see how the recommendations affect and modify the user’s electrical behavior. In order to make these results more clear, we prepared a visualization of how the consumption change in every simulation compared to the original pattern of consumption. It is represented in
Figure 12. There, we can see that the “Optimistic” is the one that changes more with regards to the “original consumption”. This simulation generates a lot of peaks in the consumption line. This type of answer is not what we are looking for with the execution of this project. However,
Figure 12 represents the new behavior of a single user, so even if this answer is not as good as expected, it will not have a big repercussion in the consumption of a huge community of users. Even if some users of this community implement this response, it could be good because it can distribute the energy consumption inside the community. The “Neutral” is similar to the “original consumption”. As we can see, it reduces some peaks in the original behavior, and it modifies and generates a few peaks in order to reduce the electric bill. It seems that this type of simulation does not change the user pattern behavior a lot; hence, it could be a good answer for a user who wants to save some money at the end of the month. Once again, this behavior helps to distribute the use of energy during the day in the house where the system is installed and in a major scale in the community.
The other two situations, “Probable” and “Pessimistic”, have a very similar behavior between them and the “original consumption’.’ These are the behaviors that represent the most common answer for all users. Of course, they generate savings for the clients and also distribute the energy and reduce energy consumption peaks. It can be seen that during the morning and the afternoon/evening, they soften the peaks. Further, during midday, they reduce the peak produced at meal time. However, during the last hour of the day, they produce a little peak in order to save some energy in the previous hours. These two behaviors can change the energy consumption distribution in a community if they are employed by a large amount of users. Consequently, it is interesting to implement the presented system in a large community so we can see how the consumption distribution changes over time.
To sum up, with the proposed system, we obtained a multiagent recommendation system that is capable of obtaining consumption data with low-cost smart devices; collect information about electricity prices and, with these data, offer recommendations with an incentive to clients and users in order to save energy, save money, and distribute the use of energy in smart cities. Therefore, the established objectives of the work have been accomplished.
6. Conclusions
This work presents a multiagent recommendation system for smart home electric energy optimization. The system proposed makes use of artificial intelligence in order to resolve a common problem in XXI century cities. The problem is energy optimization and energy saving. Therefore, this system proposes a solution to the problem that the European Union is trying to resolve, which is energy optimization and implementation of new smart systems that can transform actual buildings into smart buildings. This tested solution makes use of a multiagent architecture, data acquisition, data processing, and recommendation techniques. We used modern computer science techniques to resolve a modern problem.
The use of multiagent techniques allow us to make a more flexible system. Thanks to this architecture, we can create independent modules that allow us to do several tasks at the same time while every one of them works in continuous communication to achieve the global goal. This program construction also gives the possibility to add, modify or eliminate the new system’s functionalities easily. This action is easy thanks to the agent, fragments of code which can be easily modified. This characteristic is very useful when we want to add new functionalities to the system.
Data acquisition and data processing are important factors for our system because all the recommendations that the system provides are based on information extracted from these data and from data mining. Our system is capable of extracting data from smart devices and also using information stored on the Internet to generate relevant recommendations to the user of the final system. Consequently, these two techniques play an important role in the presented work.
Finally, the use of recommendation techniques is the main contribution of the article. With these recommendations, we outlined a new solution for energy distribution and optimization. The recommendations are based on knowledge and utility. Therefore, the new recommendations are very related to the normal consumption of the user. In addition, we used recommendations with financial incentives. The use of this extra information makes it easier for the user to accept recommendations. Therefore, the recommendations provide the tool to distribute the use of electrical energy during the day. As we showed in
Section 5, we achieved distribution of the consumption in the simulations that were carried out.
However, the system has only been tested in a theoretical case study and not in a real environment. This is an aspect that we have considered for future lines based on this system. There are several works of smart cities that have been developed by other authors ([
28,
29,
30,
31]) that do not include a module for energy optimization. Therefore, including the proposed system in a real smart city is a good chance to test it in different homes and by doing this, we can study the communication between the different multiagent systems so all of them work for the same purpose.
Another aspect for future lines of investigation is generalizing the system. In our case of study, we dealt with the Spanish one. In order to resolve this problem, we obtained data from Spanish electric consumption prices to generate a new dataset. Without a doubt, though, it would be very interesting to try the solution in other countries.
Additionally, the system should not be limited to a single smart plug device. In different countries, there are different popular smart plugs. Therefore, if our objective is to internationalize this system, we should implement a “devices module” for the more popular smart plugs. We must also consider that the recommendation system should also be based on the potential financial impact. With this strategy, the system could reduce the cost more, as well as the consumption peaks during the day.

 ,
, 


