Effect of Prediction Error of Machine Learning Schemes on Photovoltaic Power Trading Based on Energy Storage Systems


Abstract
1. Introduction
2. Background
2.1. Artificial Neural Networks
2.2. Support Vector Machine
3. PV Output Power Prediction
3.1. Data for PV Output Power Prediction
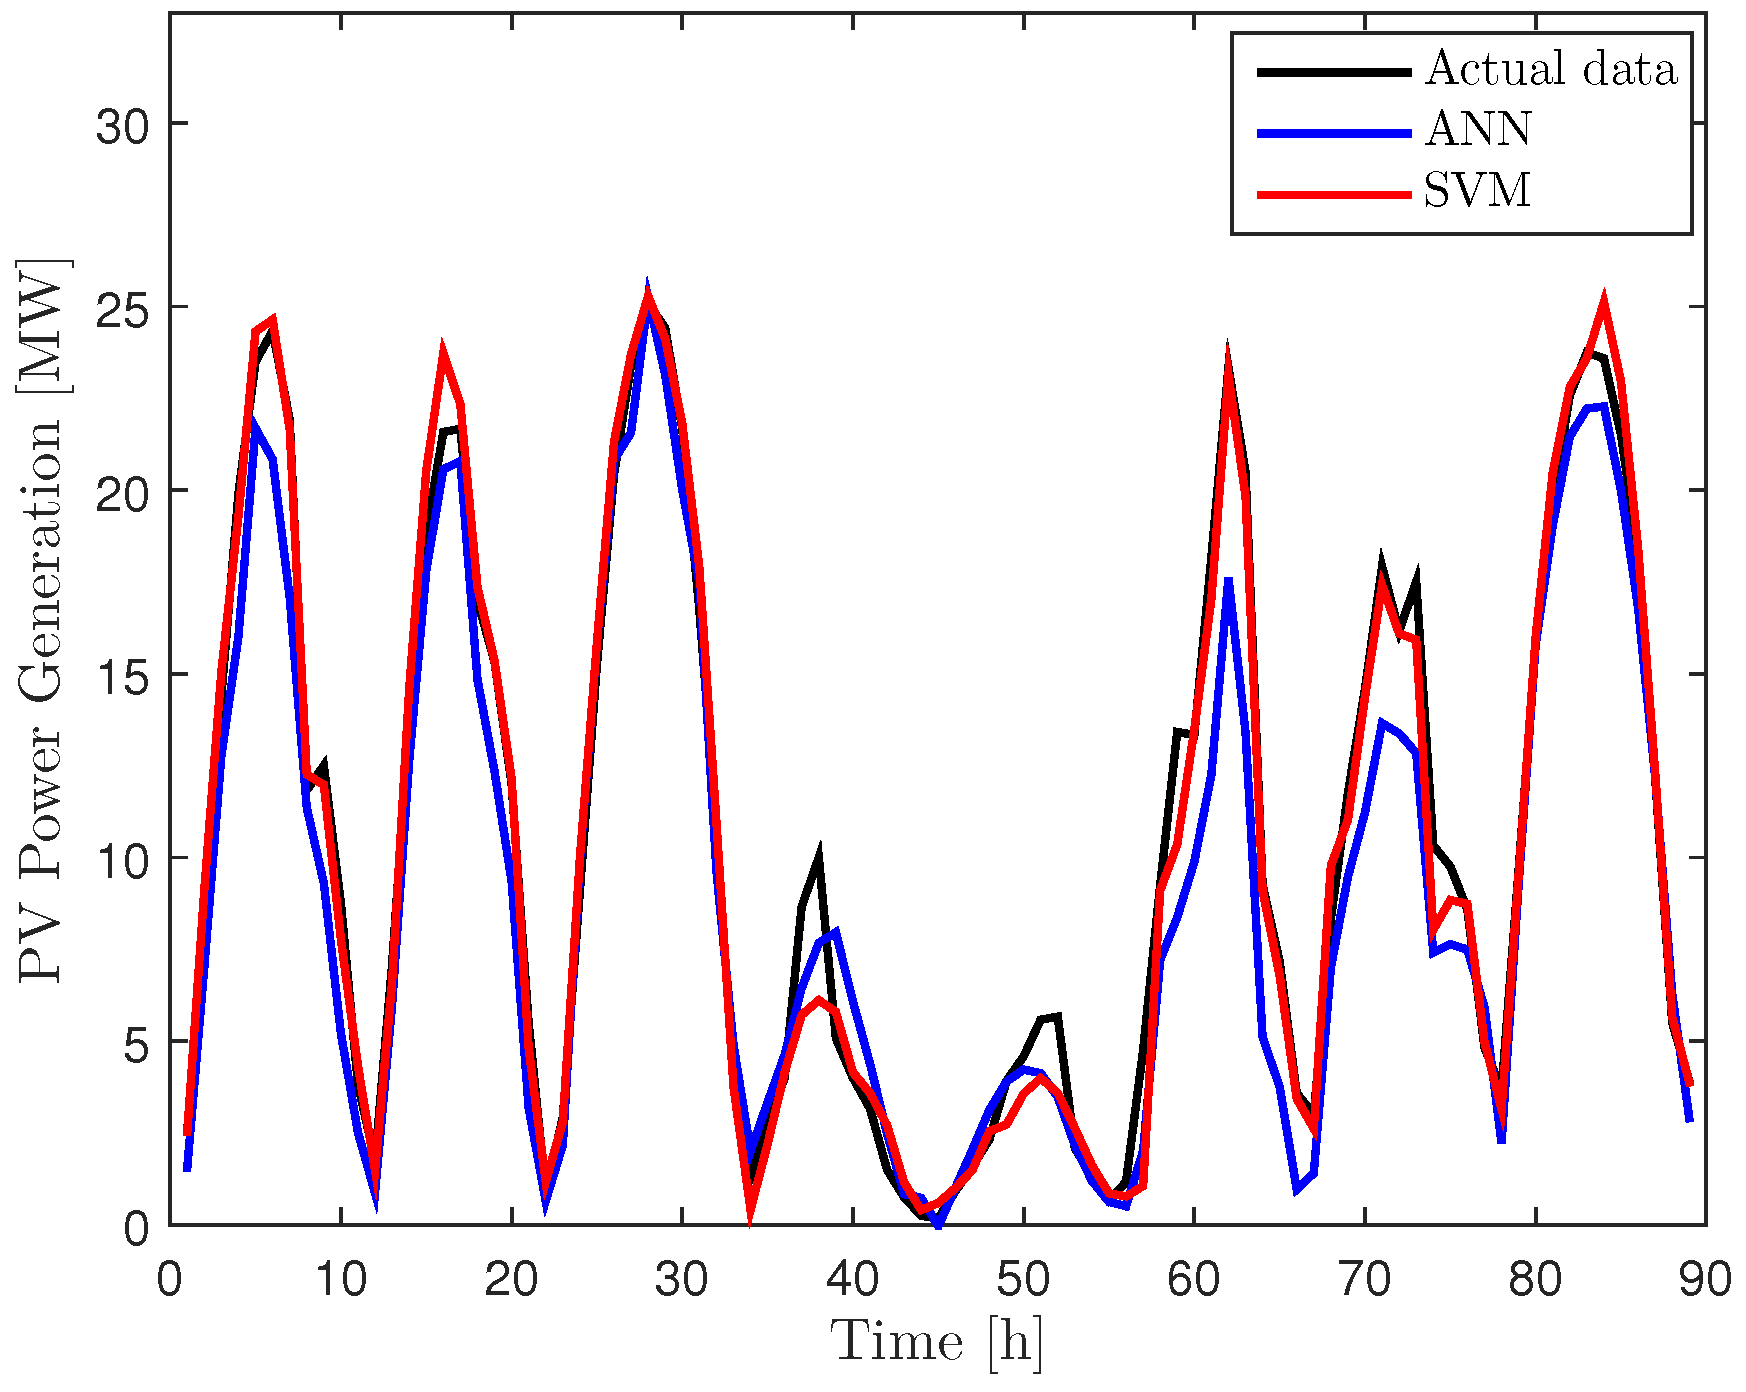
3.2. Prediction Results for PV Output Power
3.3. Estimation of Prediction Error Distribution
4. ESS-Based PV Power Trading in Energy Markets
4.1. The Importance of the ESS Role for PV Power Trading
4.2. Participation of PV Producers in LMP Markets
4.3. Estimation of Deviation Penalties
4.4. Operation and Sizing of Energy Storage Systems
5. Case Study
5.1. ESS Sizing for Machine Learning Prediction Schemes
5.2. Assessment of the Profit for the PV Power Producers
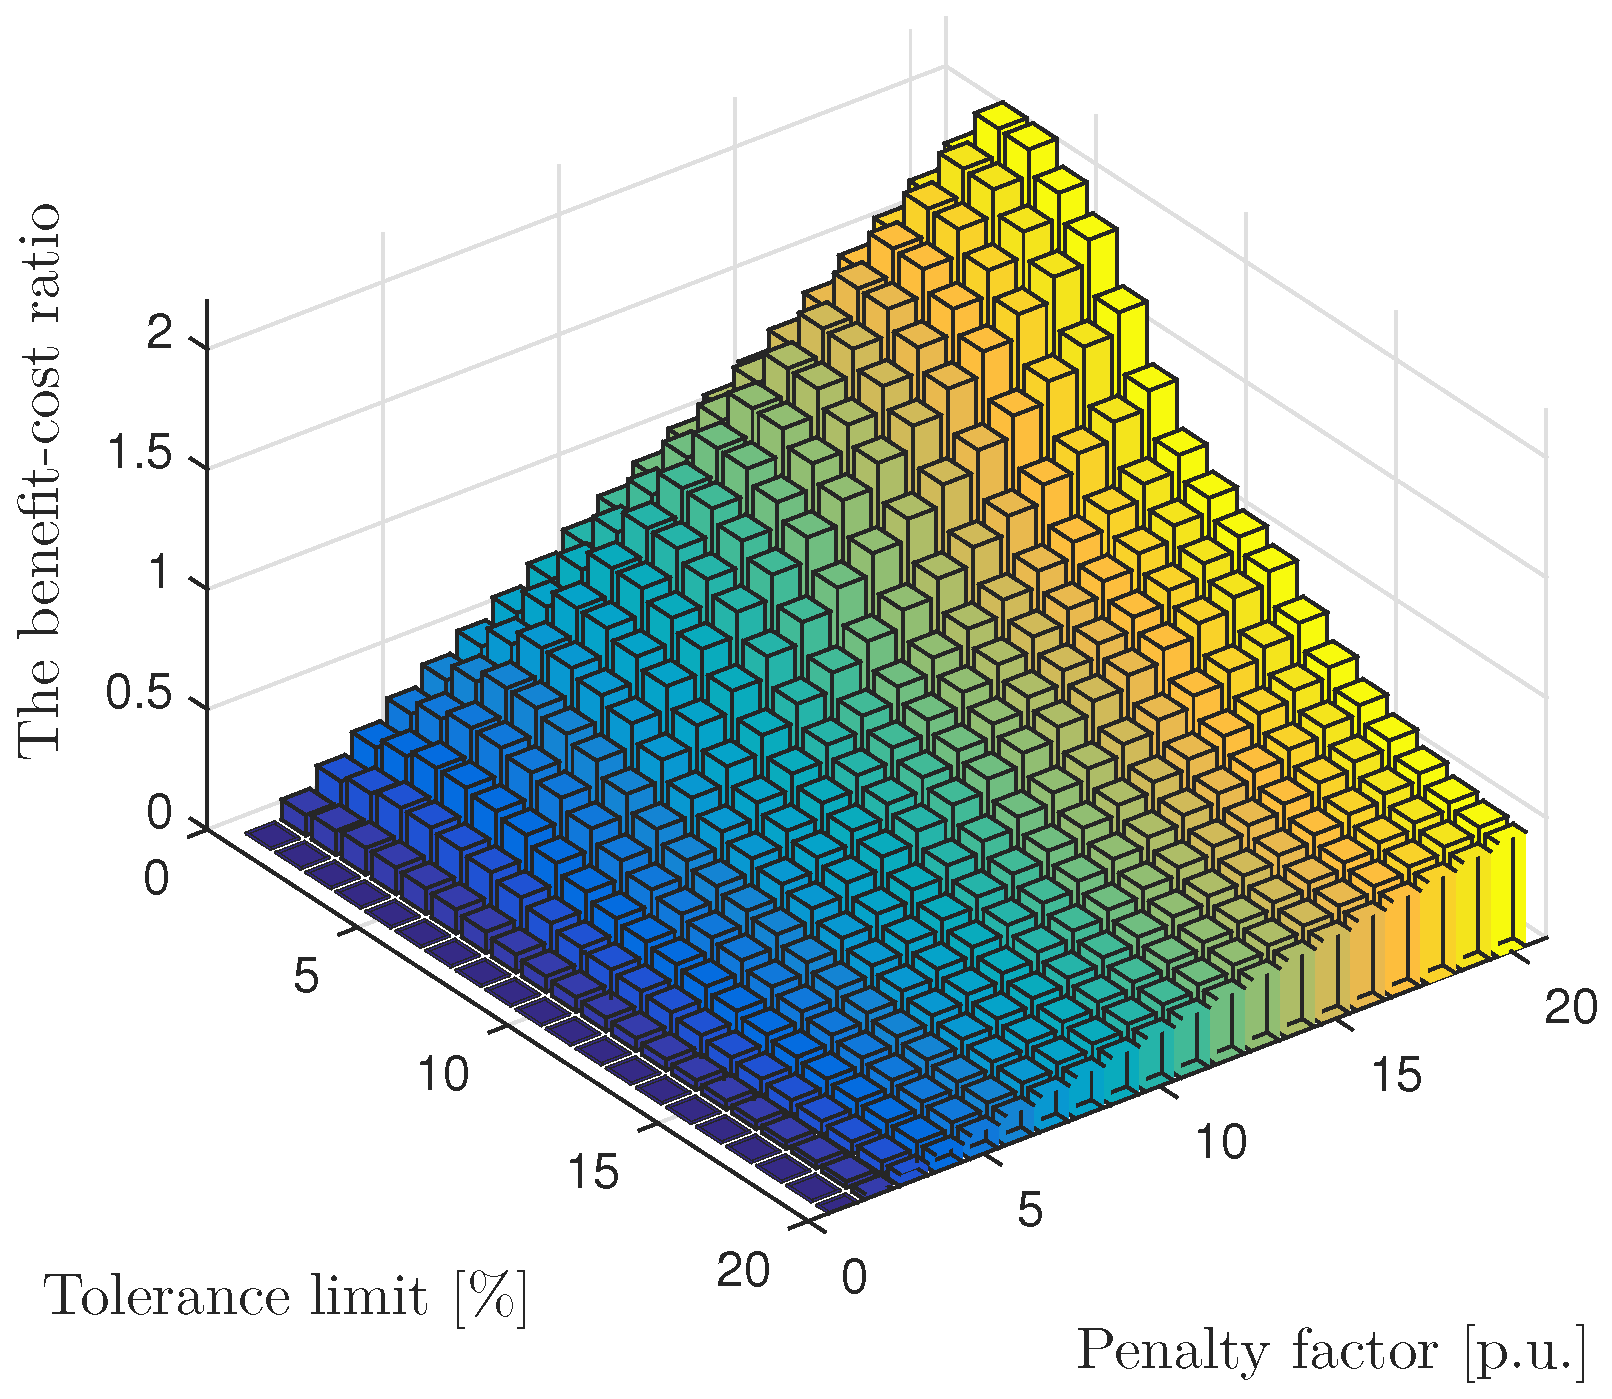
5.3. Benefit-Cost Analysis (BCA) for the ESS in PV Power Trading
6. Conclusions
Author Contributions
Funding
Conflicts of Interest
References
- Cheng, D.; Mather, B.A.; Seguin, R.; Hambrick, J.; Broadwater, R.P. Photovoltaic (PV) Impact Assessment for Very High Penetration Levels. IEEE J. Photovolt. 2016, 6, 295–300. [Google Scholar] [CrossRef]
- Korea Ministry of Trade, Industry and Energy. Renewable Energy Statistics. 2013. Available online: http://www.motie.go.kr (accessed on 20 February 2019).
- Jang, H.S.; Bae, K.Y.; Park, H.-S.; Sung, D.K. Effect of aggregation for multi-site photovoltaic (PV) farms. In Proceedings of the IEEE International Conference on Smart Grid Communications (SmartGridComm), Miami, FL, USA, 2–5 November 2015; pp. 623–628. [Google Scholar]
- Tewari, S.; Geyer, C.J.; Mohan, N. A statistical model for wind power forecast error and its application to the estimation of penalties in liberalized markets. IEEE Trans. Power Syst. 2011, 26, 2031–2039. [Google Scholar] [CrossRef]
- DeMeo, E.A.; Jordan, G.A.; Kalich, C.; King, J.; Milligan, M.R.; Murley, C.; Oakleaf, B.; Schuerger, M.J. Accommodating wind’s natural behavior. IEEE Power Energy Mag. 2007, 5, 59–67. [Google Scholar] [CrossRef]
- Kraas, B.; Schroedter-Homscheidt, M.; Madlener, R. Economic merits of a state-of-the-art concentrating solar power forecasting system for participation in the Spanish electricity market. Sol. Energy 2013, 93, 244–255. [Google Scholar] [CrossRef]
- Marquez, R.; Coimbra, C.F. Intra-hour DNI forecasting based on cloud tracking image analysis. Sol. Energy 2013, 91, 327–336. [Google Scholar] [CrossRef]
- Jang, H.S.; Bae, K.Y.; Park, H.S.; Sung, D.K. Solar power prediction based on satellite images and support vector machine. IEEE Trans. Sustain. Energy 2016, 7, 1255–1263. [Google Scholar] [CrossRef]
- Perez, R.; Kivalov, S.; Schlemmer, J.; Hemker, K.; Renné, D.; Hoff, T.E. Validation of short and medium term operational solar radiation forecasts in the US. Sol. Energy 2010, 84, 2161–2172. [Google Scholar] [CrossRef]
- Lorenz, E.; Hurka, J.; Heinemann, D.; Beyer, H.G. Irradiance forecasting for the power prediction of grid-connected photovoltaic systems. IEEE J. Sel. Top. Appl. Earth Obs. Remote Sens. 2009, 2, 2–10. [Google Scholar] [CrossRef]
- Torres, J.L.; Garcia, A.; De Blas, M.; De Francisco, A. Forecast of hourly average wind speed with ARMA models in Navarre (Spain). Sol. Energy 2005, 79, 65–77. [Google Scholar] [CrossRef]
- Reikard, G. Predicting solar radiation at high resolutions: A comparison of time series forecasts. Sol. Energy 2009, 83, 342–349. [Google Scholar] [CrossRef]
- Li, Y.; Su, Y.; Shu, L. An ARMAX model for forecasting the power output of a grid connected photovoltaic system. Renew. Energy 2014, 66, 78–89. [Google Scholar] [CrossRef]
- Amrouche, B.; Le Pivert, X. Artificial neural network based daily local forecasting for global solar radiation. Appl. Energy 2014, 130, 333–341. [Google Scholar] [CrossRef]
- Bae, K.Y.; Jang, H.S.; Sung, D.K. Hourly solar irradiance prediction based on support vector machine and its error analysis. IEEE Trans. Power Syst. 2017, 32, 935–945. [Google Scholar] [CrossRef]
- Yang, H.-T.; Huang, C.-M.; Huang, Y.-C.; Huang, Y.-S. A weather-based hybrid method for 1-Day ahead hourly forecasting of PV power output. IEEE Trans. Sustain. Energy 2014, 5, 917–926. [Google Scholar] [CrossRef]
- Ji, W.; Chee, K.C. Prediction of hourly solar radiation using a novel hybrid model of ARMA and TDNN. Sol. Energy 2011, 85, 808–817. [Google Scholar] [CrossRef]
- Lorenz, E.; Hurka, J.; Heinemann, D.; Beyer, H.G. The Federal Energy Regulatory Commission Order No. 764; United States of America Federal Energy Regulatory Commission: Washington, DC, USA, 2012.
- Botterud, A.; Wang, J.; Miranda, V.; Bessa, R.J. Wind power forecasting in US electricity markets. The Electr. J. 2010, 23, 71–82. [Google Scholar] [CrossRef]
- Pinson, P.; Chevallier, C.; Kariniotakis, G.N. Trading wind generation from short-term probabilistic forecasts of wind power. IEEE Trans. Power Syst. 2007, 22, 1148–1156. [Google Scholar] [CrossRef]
- Liang, J.; Grijalva, S.; Harley, R.G. Increased wind revenue and system security by trading wind power in energy and regulation reserve markets. IEEE Trans. Sustain. Energy 2011, 2, 340–347. [Google Scholar] [CrossRef]
- Botterud, A.; Zhou, Z.; Wang, J.; Bessa, R.J.; Keko, H.; Sumaili, J.; Miranda, V. Wind power trading under uncertainty in LMP markets. IEEE Trans. Power Syst. 2012, 27, 894–903. [Google Scholar] [CrossRef]
- Bludszuweit, H.; Domínguez-Navarro, J.A.; Llombart, A. Statistical analysis of wind power forecast error. IEEE Trans. Power Syst. 2008, 23, 983–991. [Google Scholar] [CrossRef]
- Omran, W.A.; Kazerani, M.; Salama, M. Investigation of methods for reduction of power fluctuations generated from large grid-connected photovoltaic systems. IEEE Trans. Energy Convers. 2011, 26, 318–327. [Google Scholar] [CrossRef]
- Elsied, M.; Oukaour, A.; Gualous, H.; Hassan, R. Energy management and optimization in microgrid system based on green energy. Energy 2015, 84, 139–151. [Google Scholar] [CrossRef]
- Ma, L.; Liu, N.; Zhang, J.; Tushar, W.; Yuen, C. Energy management for joint operation of CHP and PV prosumers inside a grid-connected microgrid: A game theoretic approach. IEEE Trans. Ind. Inf. 2016, 12, 1930–1942. [Google Scholar] [CrossRef]
- Kalogirou, S.A. Artificial neural networks in renewable energy systems applications: A review. Renew. Sustain. Energy Rev. 2001, 5, 373–401. [Google Scholar] [CrossRef]
- Ramadhas, A.S.; Jayaraj, S.; Muraleedharan, C.; Padmakumari, K. Artificial neural networks used for the prediction of the cetane number of biodiesel. Renew. Energy 2006, 31, 2524–2533. [Google Scholar] [CrossRef]
- MacKay, D.J. Information Theory, Inference and Learning Algorithms; Cambridge university press: Cambridge, UK, 2003. [Google Scholar]
- Hagan, M.T.; Menhaj, M.B. Training feedforward networks with the Marquardt algorithm. IEEE Trans. Neural Netw. 1994, 5, 989–993. [Google Scholar] [CrossRef] [PubMed]
- Cortes, C.; Vapnik, V. Support-vector networks. Mach. Learn. 1995, 20, 273–297. [Google Scholar] [CrossRef]
- Drucker, H.; Burges, C.J.; Kaufman, L.; Smola, A.; Vapnik, V. Support Vector Regression Machines. Adv. Neural Inf. Process. Syst. 1997, 9, 155–161. [Google Scholar]
- Shi, J.; Lee, W.-J.; Liu, Y.; Yang, Y.; Wang, P. Forecasting power output of photovoltaic systems based on weather classification and support vector machines. IEEE Trans. Ind. Appl. 2012, 48, 1064–1069. [Google Scholar] [CrossRef]
- Chang, C.-C.; Lin, C.-J. LIBSVM: A library for support vector machines. ACM Trans. Intell. Syst. Technol. (TIST) 2011, 2, 27. [Google Scholar] [CrossRef]
- Korea Meteorological Administration (KMA). Available online: http://web.kma.go.kr/eng/ (accessed on 20 February 2019).
- Jackman, S. Bayesian Analysis for the Social Sciences; John Wiley & Sons: Hoboken, NJ, USA, 2009. [Google Scholar]
- Balanda, K.P.; MacGillivray, H. Land drainage: Planning and design of agricultural systems. Am. Stat. 1998, 42, 111–119. [Google Scholar]
- Chen, C.; Duan, S.; Cai, T.; Liu, B.; Hu, G. Optimal allocation and economic analysis of energy storage system in microgrids. IEEE Trans. Power Electron. 2011, 26, 2762–2773. [Google Scholar] [CrossRef]
- Stoft, S. Power system economics. J. Energy Lit. 2002, 8, 94–99. [Google Scholar]
- Jones, L.E. Renewable Energy Integration: Practical Management of Variability, Uncertainty, and Flexibility in Power Grids; Academic Press: Cambridge, MA, USA, 2014. [Google Scholar]
- Papalexopoulos, A.D.; Andrianesis, P.E. Performance-based pricing of frequency regulation in electricity markets. IEEE Trans. Power Syst. 2014, 29, 441–449. [Google Scholar] [CrossRef]
- Schoenung, S. Energy Storage Systems Cost Update; Sandia National Laboratories: Albuquerque, NM, USA, 2011.
- Han, S.; Han, S.; Aki, H. A practical battery wear model for electric vehicle charging applications. Appl. Energy 2014, 48, 1100–1108. [Google Scholar] [CrossRef]
- Monitoring Analytics LLC. State of the Market Report for PJM; Monitoring Analytics: Norristown, PA, USA, 2015. [Google Scholar]
- David, R.; Ngulube, P.; Dube, A. A cost-benefit analysis of document management strategies used at a financial institution in Zimbabwe: A case study. SA J. Inf. Manag. 2013, 15, 10–11. [Google Scholar] [CrossRef]
- Smedema, L.K.; Rycroft, D.W. Land Drainage: Planning and Design of Agricultural Systems; HarperCollins Distribution Services: London, UK, 1983. [Google Scholar]


| Meteorological Parameters | Value Range |
|---|---|
| Irradiance | 0–1083 |
| Sunshine Duration | 7:00 A.M. to 6:00 P.M. |
| Cloud Cover | 0–10 |
| Sunshine [hour] | 0–1 |
| Humidity [%] | 10–100 |
| Precipitation [mm/h] | 0–40 |
| Air Temperature [] | −16–37 |
| Wind Speed [m/s] | 0–11 |
| Prediction Scheme | |||
|---|---|---|---|
| ANN | −0.0001 | 0.0715 | 10.7179 |
| SVM | 0.0001 | 0.0403 | 3.02911 |
| Power Capacity | ANN | SVM |
|---|---|---|
| 5% | 501.56 | 234.90 |
| 10% | 707.99 | 301.80 |
| 15% | 793.95 | 322.45 |
| Scheme | Power Capacity | 0% | 2% | 4% | 6% | 8% | 10% |
|---|---|---|---|---|---|---|---|
| 5% | 0.74 | 0.72 | 0.67 | 0.63 | 0.58 | 0.56 | |
| ANN | 10% | 1.37 | 1.26 | 1.19 | 1.15 | 1.10 | 1.07 |
| 15% | 1.83 | 1.77 | 1.70 | 1.65 | 1.56 | 1.48 | |
| 5% | 0.62 | 0.45 | 0.33 | 0.28 | 0.23 | 0.22 | |
| SVM | 10% | 0.84 | 0.61 | 0.51 | 0.44 | 0.43 | 0.34 |
| 15% | 0.93 | 0.78 | 0.63 | 0.52 | 0.45 | 0.40 |
| Scheme | Power Capacity | 0% | 2% | 4% | 6% | 8% | 10% |
|---|---|---|---|---|---|---|---|
| ANN | No ESS | 266.27 | 257.01 | 231.48 | 195.38 | 155.57 | 117.81 |
| 5% | 214.32 | 175.54 | 136.16 | 100.88 | 70.02 | 49.95 | |
| 10% | 117.81 | 85.59 | 60.17 | 41.26 | 27.80 | 18.52 | |
| 15% | 49.95 | 33.93 | 22.71 | 15.07 | 9.96 | 6.57 | |
| SVM | No ESS | 190.99 | 176.36 | 143.32 | 109.05 | 81.52 | 61.39 |
| 5% | 125.60 | 94.30 | 70.62 | 53.61 | 41.47 | 32.71 | |
| 10% | 61.39 | 47.03 | 36.74 | 29.25 | 23.69 | 19.48 | |
| 15% | 32.71 | 26.27 | 21.45 | 17.76 | 14.88 | 12.61 |
| Scheme | Power Capacity | Max. BCR | Tolerance Limit | Penalty Factor |
|---|---|---|---|---|
| 5% | 1.17 | 6% | 2.0 | |
| ANN | 10% | 1.10 | 4% | 2.0 |
| 15% | 0.96 | 3% | 2.0 | |
| 5% | 2.32 | 4% | 2.0 | |
| SVM | 10% | 2.20 | 2% | 2.0 |
| 15% | 2.11 | 2% | 2.0 |
© 2019 by the authors. Licensee MDPI, Basel, Switzerland. This article is an open access article distributed under the terms and conditions of the Creative Commons Attribution (CC BY) license (http://creativecommons.org/licenses/by/4.0/).
Share and Cite
Bae, K.Y.; Jang, H.S.; Jung, B.C.; Sung, D.K. Effect of Prediction Error of Machine Learning Schemes on Photovoltaic Power Trading Based on Energy Storage Systems. Energies 2019, 12, 1249. https://doi.org/10.3390/en12071249
Bae KY, Jang HS, Jung BC, Sung DK. Effect of Prediction Error of Machine Learning Schemes on Photovoltaic Power Trading Based on Energy Storage Systems. Energies. 2019; 12(7):1249. https://doi.org/10.3390/en12071249
Chicago/Turabian StyleBae, Kuk Yeol, Han Seung Jang, Bang Chul Jung, and Dan Keun Sung. 2019. "Effect of Prediction Error of Machine Learning Schemes on Photovoltaic Power Trading Based on Energy Storage Systems" Energies 12, no. 7: 1249. https://doi.org/10.3390/en12071249
APA StyleBae, K. Y., Jang, H. S., Jung, B. C., & Sung, D. K. (2019). Effect of Prediction Error of Machine Learning Schemes on Photovoltaic Power Trading Based on Energy Storage Systems. Energies, 12(7), 1249. https://doi.org/10.3390/en12071249