Article

Energy Storage Scheduling in Distribution Systems Considering Wind and Photovoltaic Generation Uncertainties

by
Iver Bakken Sperstad
1,* and
Magnus Korpås
2
1
SINTEF Energy Research, P.O. Box 4761 Torgarden, NO-7465 Trondheim, Norway
2
Department of Electric Power Engineering, NTNU—Norwegian University of Science and Technology, NO-7491 Trondheim, Norway
*
Author to whom correspondence should be addressed.
Energies 2019, 12(7), 1231; https://doi.org/10.3390/en12071231
Submission received: 15 February 2019 / Revised: 13 March 2019 / Accepted: 25 March 2019 / Published: 30 March 2019
(This article belongs to the Special Issue Modelling and Analysis of Distributed Energy Storage)

Abstract

:
Flexible distributed energy resources, such as energy storage systems (ESSs), are increasingly considered as means for mitigating challenges introduced by the integration of stochastic, variable distributed generation (DG). The optimal operation of a distribution system with ESS can be formulated as a multi-period optimal power flow (MPOPF) problem which involves scheduling of the charging/discharging of the ESS over an extended planning horizon, e.g., for day-ahead operational planning. Although such problems have been the subject of many works in recent years, these works very rarely consider uncertainties in DG, and almost never explicitly consider uncertainties beyond the current operational planning horizon. This article presents a framework of methods and models for accounting for uncertainties due to distributed wind and solar photovoltaic power generation beyond the planning horizon in an AC MPOPF model for distribution systems with ESS. The expected future value of energy stored at the end of the planning horizon is determined as a function of the stochastic DG resource variables and is explicitly included in the objective function. Results for a case study based on a real distribution system in Norway demonstrate the effectiveness of an operational strategy for ESS scheduling accounting for DG uncertainties. The case study compares the application of the framework to wind and solar power generation. Thus, this work also gives insight into how different approaches are appropriate for modeling DG uncertainty for these two forms of variable DG, due to their inherent differences in terms of variability and stochasticity.

1. Introduction

The increasing penetration of variable distributed generation (DG) introduce challenges to the distribution system hosting them [1,2]. Variable renewable sources of electric power such as wind power and solar photovoltaic (PV) power are associated with variability and uncertainty on multiple time scales, both within each hour, within each day, and over the year [3]. This variability comes in addition to the already existing variability of load and electricity prices. Distribution system operators (DSO) may, therefore, have to consider new flexible resources in both the operation and planning of the distribution system [2,4]. Energy storage systems (ESSs) is a class of flexible resources that has received considerable attention lately by the research community as well as by system operators and end-users [5,6]. The introduction of ESSs implies a multi-period operational planning problem since an amount of energy discharged by the ESS at one time step will have to be charged at a previous time step. When the optimal operation of a distribution system is formulated as an alternating current (AC) optimal power flow (OPF) problem, the time-coupling introduced by grid-connected ESSs therefore transforms the problem to a dynamic or multi-period OPF (MPOPF) problem over an operational planning horizon comprising multiple time steps [7,8].
Although such AC MPOPF problems in recent years have been the subject of a large number of works (that are reviewed in more detail below), and although a few of these works also consider uncertainties associated e.g., with DG within the operational planning horizon, almost no previous work considers uncertainties beyond the planning horizon. This means that when optimizing the schedule of ESS charging/discharging in the distribution system, typically over a daily (24 h) planning horizon, the amount of energy stored in the ESS at the end of the day (or, in general, planning horizon) is not explicitly assigned any value. Effectively setting this end-value to zero implicitly incentivizes the MPOPF models to deplete the ESS at the end of each day, or to fix it to a predefined value, e.g., 50% of the energy capacity. Depending on the realization of uncertain variables in the future, this may be sub-optimal from the perspective of future planning horizons.
Motivated by the shortcoming described above, our objective has been to explicitly account for uncertainties due to DG beyond the operational planning horizon in the optimal scheduling of ESSs in distribution systems. The main contribution of this article is a general framework of methods and models for accounting for these uncertainties in a consistent manner by explicitly valuating the energy stored at the end of the planning horizon in the objective function. We furthermore describe and implement models representing uncertainties for (i) wind power generation and (ii) solar PV generation in the framework. This allows us to compare these two stochastic renewable energy sources and understand how differences in their stochasticity implies differences in the value of stored energy in the grid and accordingly in the optimal operation of ESSs. We also describe how the general framework is applicable to uncertain variables other than DG generation.
The preliminary development of this framework was previously reported in Reference [9], which is limited to only consider distributed wind power generation. The present article extends this work by the following additional contributions: (1) A new model for accounting for uncertainties in distributed solar PV as well as wind power generation; (2) a more complete and general formulation of the framework; (3) a more complete and structured overview of the state of the art of MPOPF for distribution systems; and (4) a comparison with a rolling horizon approach to consider (although only implicitly) the end-value stored energy. Finally, although emphasis in the present article is on methodology rather than applications, we also include (5) a new case study based on a real Norwegian distribution system.
The proposed approach to valuating the stored energy in ESS scheduling is, in part, inspired by principles applied in hydropower scheduling for estimating the value of water stored in hydropower reservoirs. For hydropower scheduling, it is essential to implement accurate models of the stochasticity of inflow beyond the planning horizon to avoid shortage or spillage of stored water [10,11]. However, hydropower scheduling models cannot be directly applied to ESS scheduling considering wind and solar power uncertainty. Appropriate models for the stochasticity and time correlations of these energy resources must, therefore, be investigated. Whereas previously developed methods for hydropower scheduling consider long-term uncertainty (i.e., weeks to years), uncertainties over much shorter time scales (hours to days) are relevant for methods applicable to DG and ESS, such as batteries. One of the research questions posed in this work is, therefore, to what extent the principles from hydropower scheduling are applicable to the analogous case of ESS scheduling in distribution systems with wind and solar power. To address this question, we make a first step in this work by considering relatively basic models of the stochasticity; through investigating these models we aim to obtain more insight into the level of sophistication that is appropriate for modeling DG stochasticity for the purpose of ESS scheduling in distribution systems. This, in turn, allows us to suggest whether investment in more sophisticated models is warranted in future work.
The remainder of the article is organized as follows. Section 2 reviews related work on MPOPF models for distribution systems and the modeling of stochasticity in wind and solar power generation. The general method proposed for end-value setting accounting for DG uncertainties is presented in Section 3 together with implementations of exemplary models for wind and solar PV power uncertainty. Section 4 demonstrates the methods in a case study, comparing the results for distributed PV and wind power generation. The article is concluded in Section 5 with remarks on the implications of the work and suggestions for useful extensions and applications of the framework.

2. State of the Art of Multi-Period Optimal Power Flow for Distribution Systems with Energy Storage

Motivated primarily by the potential for optimizing the operation of grid-connected energy storage systems [5,6,12], the amount of literature on multi-period optimal power flow models has been increasing over the last several years. Therefore, although we cannot claim it to be exhaustive, we provide in this section an extensive and updated overview of the state of the art of multi-period OPF models applicable to ESSs in distribution systems. This section extends and systematizes the overview given in Reference [9], and to the authors’ best knowledge, no other review on this topic currently exists in the literature. For a more general survey of academic as well as industrial OPF methods and their application to distribution systems with energy storage, we refer to Reference [8]. For a survey of real-time OPF methods that also discusses the operation of battery storage systems under wind power uncertainty, we refer to Reference [13].
An overview of references on multi-period OPF models is given in Table 1. The default model formulation for a multi-period OPF with full AC power flow formulation is “AC MPOPF”, which means that OPF models with full AC power flow constraints for individual time steps are coupled with temporal constraints without any relaxation or decomposition of the problem. Unless otherwise stated, the OPF models assume a balanced system, i.e., that the currents and voltages of all three phases are balanced. To limit the scope to models applicable to distribution systems, models employing DC power flow are excluded from Table 1 and we refer to Reference [8] for a more complete overview. When not otherwise stated, the model formulation is deterministic.
The third column of Table 1 describes the approach to handling the end-value of energy stored in the ESS, i.e., whether it is being considered explicitly or otherwise handled implicitly in the optimization. If the end-value is not considered, there is, depending on the application of the ESS, usually no incentive for the model to avoid depleting the ESS at the end of each planning horizon. The conventional approach to implicitly valuate the stored energy is to require that the energy stored in the ESS at the end of the planning horizon should equal the initial value (i.e., periodic boundary conditions): E T = E 0 . Instead of this equality constraint, some works handle the value of stored energy by an inequality constraint on the form E T E T min . Another common way of implicitly handling the energy stored at the end of the planning horizon is by a rolling (or receding) horizon approach in which the initial solutions for E T are updated as the planning horizon recedes.
Many of the references above consider a 24-h planning horizon, and some consider a rolling horizon approach to ESS scheduling. Only a few of the references explicitly assigns a value to stored energy in the objective function, and they typically use an arbitrarily chosen linear penalty function. These findings also hold when considering MPOPF models with DC instead of AC power flow [8]. The reviewed references in Table 1 all employ either local optimization methods (that generally do not guarantee obtaining a globally optimal solution to the optimization problem) or solve linearized versions or convex relaxations of the optimization problem (which may guarantee obtaining a globally optimal solution to the relaxed optimization problem but not necessarily to the original non-convex AC MPOPF problem); for more discussion, we refer to Reference [8] and references therein. All but two of the reviewed references [29,44] assume a balanced system.
Moreover, only a small number of references consider stochasticity in their problems. The modeling of the variability and stochasticity in wind and solar energy is reviewed in Reference [46] in the context of DG optimization and by References [3,47] from more general perspectives. The application of ESS for wind and solar energy integration is reviewed in References [4,48,49], respectively, but these reviews discuss neither optimization nor stochasticity in any detail. Reference [12] reviews the optimization of ESS operation in general and include separate discussions of stochastic optimization methods and applications to solar energy integration. In addition, Reference [50] and references within discuss modeling of wind uncertainty in the context of distributed ESSs. However, none of the above references on the stochasticity of wind and solar power consider the optimal scheduling of ESSs taking into account the power flow constraints in distribution systems

3. Methodology

This section presents the proposed framework for accounting for uncertainties due to DG beyond the daily planning horizon in the optimal scheduling of ESSs in distribution systems. The components of the framework are described in the following subsections: Section 3.1 formulates a multi-period optimal power flow model for a distribution system with energy storage and distributed generation. The objective function of this MPOPF model includes a novel term explicitly accounting for the expected future value of stored energy but is otherwise comparable to many of the deterministic models found in the literature and reviewed in the previous section. Section 3.2 introduces the parameterization chosen for the expected future value function, and Section 3.3 describes the method based on stochastic dynamic programming for determining the parameters of this value function. To determine these parameters, the framework requires stochastic models that can use measured (historic) data to generate synthetic time series representing possible realizations of future DG power output. Section 3.4 and Section 3.5 present relatively basic examples of such models for wind and solar power, respectively.

3.1. Multi-Period Optimal Power Flow Model for Distribution System with Energy Storage

The objective function of the multi-period optimal power flow problem considering ESS and DG can generally be stated as
f = t = 1 T c 0 L t Δ t α ( E T , x )
where c 0 L t Δ t is the operational cost for time step t and α ( E T , x ) is the future value of storing the energy E T at the terminal time step t = T of the operational planning horizon, given the value x of the state variable underlying distributed generation at the end of the planning horizon. Here, the terms of the objective function are given in units of €, and the electricity price parameter c 0 with units €/MWh is used to set the scale of the cost contributions of L t . It is assumed that each time step has duration Δ t . In this article, the operational cost L t represents the total cost of operating the distribution system:
L t = c t imp P t imp c t exp P t exp + c t rat i I load P i , t rat .
Minimizing L t corresponds to optimising the social welfare for the system. In this objective function, the first two terms are the cost and revenue associated with importing or exporting electric power, respectively, with the constraints P t imp 0 and P t exp 0 imposed on the fictitious import and export generators. The cost of grid losses is implicitly accounted for through these terms, as an increase in grid losses typically increases the imported power P t imp or reduces the exported power P t exp and thus increases the operational costs. The third term represents the cost associated with rationing or shedding load for all load buses I load I bus . The power prices c t imp and c t exp are the prices of electric energy imported to the system and exported from the system, respectively, at time step t . We regard the electricity prices to be exogenous variables. The unit cost associated with load rationing is denoted by c t rat . All the price parameters c t imp , c t exp , and c t rat are dimensionless and measured relative to the electricity price parameter c 0 so that all terms of L t are given in units of MW. The decision variables of the MPOPF problem include the power output P t for all generators (real or fictious) and the energy E t stored in the ESS for all time steps t { 1 , 2 , , T } .
The distribution system is assumed to have distributed generation connected to buses I DG I bus that satisfy the constraints
0 P i , t DG P i , t DG ,   max ( y t ) .
The maximal theoretical DG output P i , t DG ,   max at each time step is a function of y t , which is the value of the DG resource variable, i.e., either wind speed or solar irradiance. DG power curtailment is represented by solutions with P i , t DG < P i , t DG ,   max . As is common in MPOPF models previously reported in the literature, we assume the DG time series y = { y 1 , y 2 , ,   y T } within the planning horizon to be deterministic. However, as our objective is to consider uncertainties beyond the current planning horizon, the stochasticity of y t for t > T will be accounted for in the next subsections.
Energy storage dynamics, i.e., the evolution in time of the energy stored in the ESS, is expressed by the energy balance equation
E t = E t 1 Δ t η out   P t ESS , d η in   Δ t P t ESS , c
where P t ESS , c and P t ESS , d is the power charged and discharged at time step t , respectively. The total efficiency of charging and discharging the ESS, also including inverter losses etc., is denoted η in and η out , respectively. The amount of energy in the ESS can never be negative or above the energy capacity E max :
0 E t E max .
In addition, we require that
E T min E T ,
i.e., that the amount of energy stored at the end of the planning horizon should be at least at a minimum value E T min . Furthermore, the ESS is subject to power capacity limits for charging and discharging,
0 P t ESS , d P max ESS , P min ESS P t ESS , c 0 .
The grid constraints we consider are the AC power flow equations as given in Reference [51], voltage limits, and apparent power flow limits, and the power system should be within its operational limits at all times. This means we enforce the upper and lower voltage magnitude limits for all buses i I bus ,
V i min   V t , i V i max   ,
and the upper and lower limits for apparent power for all branches j J branch ,
S j min   S t , j S j max   .

3.2. Expected Future Value Function for Stored Energy

The value function α ( E T , x ) denotes the expected future value of the energy stored in the ESS at the end of the planning horizon, t = T , given the value x of the stochastic variable underlying distributed generation. In the context of a multi-stage decision problem, with the first stage being the planning horizon t { 1 ,   ,   T } , α ( E T , x ) can be understood as the profit-to-go function and α ( E T , x ) is to be understood as a (non-positive) cost-to-go or future expected cost function. To use the analogy with hydropower scheduling [11], the slope of this function,
π ( E T , x ) =   α E | E = E T ,
corresponds to the incremental water value of a hydropower reservoir, i.e., the expected shadow price or marginal value of an additional unit of water added to the reservoir at the end of the current planning horizon. The so-called incremental water value method of hydropower scheduling [11] accounts for the expected future value through the marginal value in Equation (10). In that case, the stochastic variable x underlying hydropower generation would typically correspond to reservoir inflow. In our formulation, we assume that a single state variable x for each planning horizon can be used to describe the stochasticity of the DG resource variables y (wind speed or solar irradiance time series) in the next planning horizon. In this article, we limit ourselves to a distribution system with one ESS, but the framework can be extended to consider multiple ESSs similarly to how multiple reservoirs are treated in hydropower scheduling [10,11].
Explicitly including an expected future value term in the objective function may avoid myopic operation such as unnecessarily depleting the ESS at the end of each planning horizon when the energy could be more valuable in the next planning horizon. Taking into account DG stochasticity through an explicit dependence on x could also avoid unnecessarily filling the ESS in the current planning horizon when large DG output is expected in the next planning horizon; in that case, it could be better to have more capacity available to store the excess energy and then export it during hours of higher electricity prices. Thus, the inclusion of a value function α ( E T , x ) can be understood as a control measure for ensuring (on average) optimal operation also beyond the current planning horizon.
The functional form of the value function is, in general, unknown and must be determined for each problem. Based on Reference [9] we here assume a simple quadratic functional form for the value function and determine its coefficients through the method described below. Conventional approaches to representing the value function include piecewise linear functions formed by generating Benders cuts [10,52], but in Reference [9] it was shown that the value function was well approximated by a quadratic function in a similar case as those considered here. Furthermore, this functional form has the additional advantage that it is simple to implement and interpret. Thus, we propose to parameterize the value function in the following way as a quadratic function of stored energy E T :
α ( E T , x ) =   γ ( x ) β ( x ) E T γ ( x ) [ β ( x ) 1 ] E max E T 2 .
In this parameterization, the dependence of the future expected value on the distributed generation in the current planning horizon is contained in the parameters γ ( x ) and β ( x ) . For a given value of x , the parameter γ can be interpreted as the average unit value of stored energy of a fully charged ESS, as α ( E T = E max , x ) = γ ( x ) E max . The parameter β determines the curvature of the value function for a given value of x , with β ( x ) = 1 giving a linear function α ( E T , x ) = γ ( x ) E T where the value of the stored energy is proportional to the amount of stored energy. The parameter β needs to fulfil 1 β 2 to avoid α ( E T , x ) becoming non-concave and the term α ( E T , x ) in the objective function becoming non-convex.
With this parameterization, the marginal value of stored energy defined in Equation (10) takes the form
π ( E T , x ) =   γ ( x ) β ( x ) 2 γ ( x ) [ β ( x ) 1 ] E T E max = π 0 ( x ) π 1 ( x ) E T .
For a linear value function with β ( x ) = 1 , the marginal value of stored energy equals π ( E T , x ) = γ ( x ) for all values of E T , whereas for β ( x ) > 1 the marginal value of stored energy decreases as E T increases. A decreasing marginal value could represent that higher storage level increases the chance for spillage of distributed energy resources, for example, because of curtailment of DG due to grid constraints. A similar trend is also generally valid in the case of market operation in unconstrained grids: Since the highest price variations during the planning horizon are exploited first, the marginal value of moving a unit of energy from one time step to another is decreasing as more energy is added to the ESS.

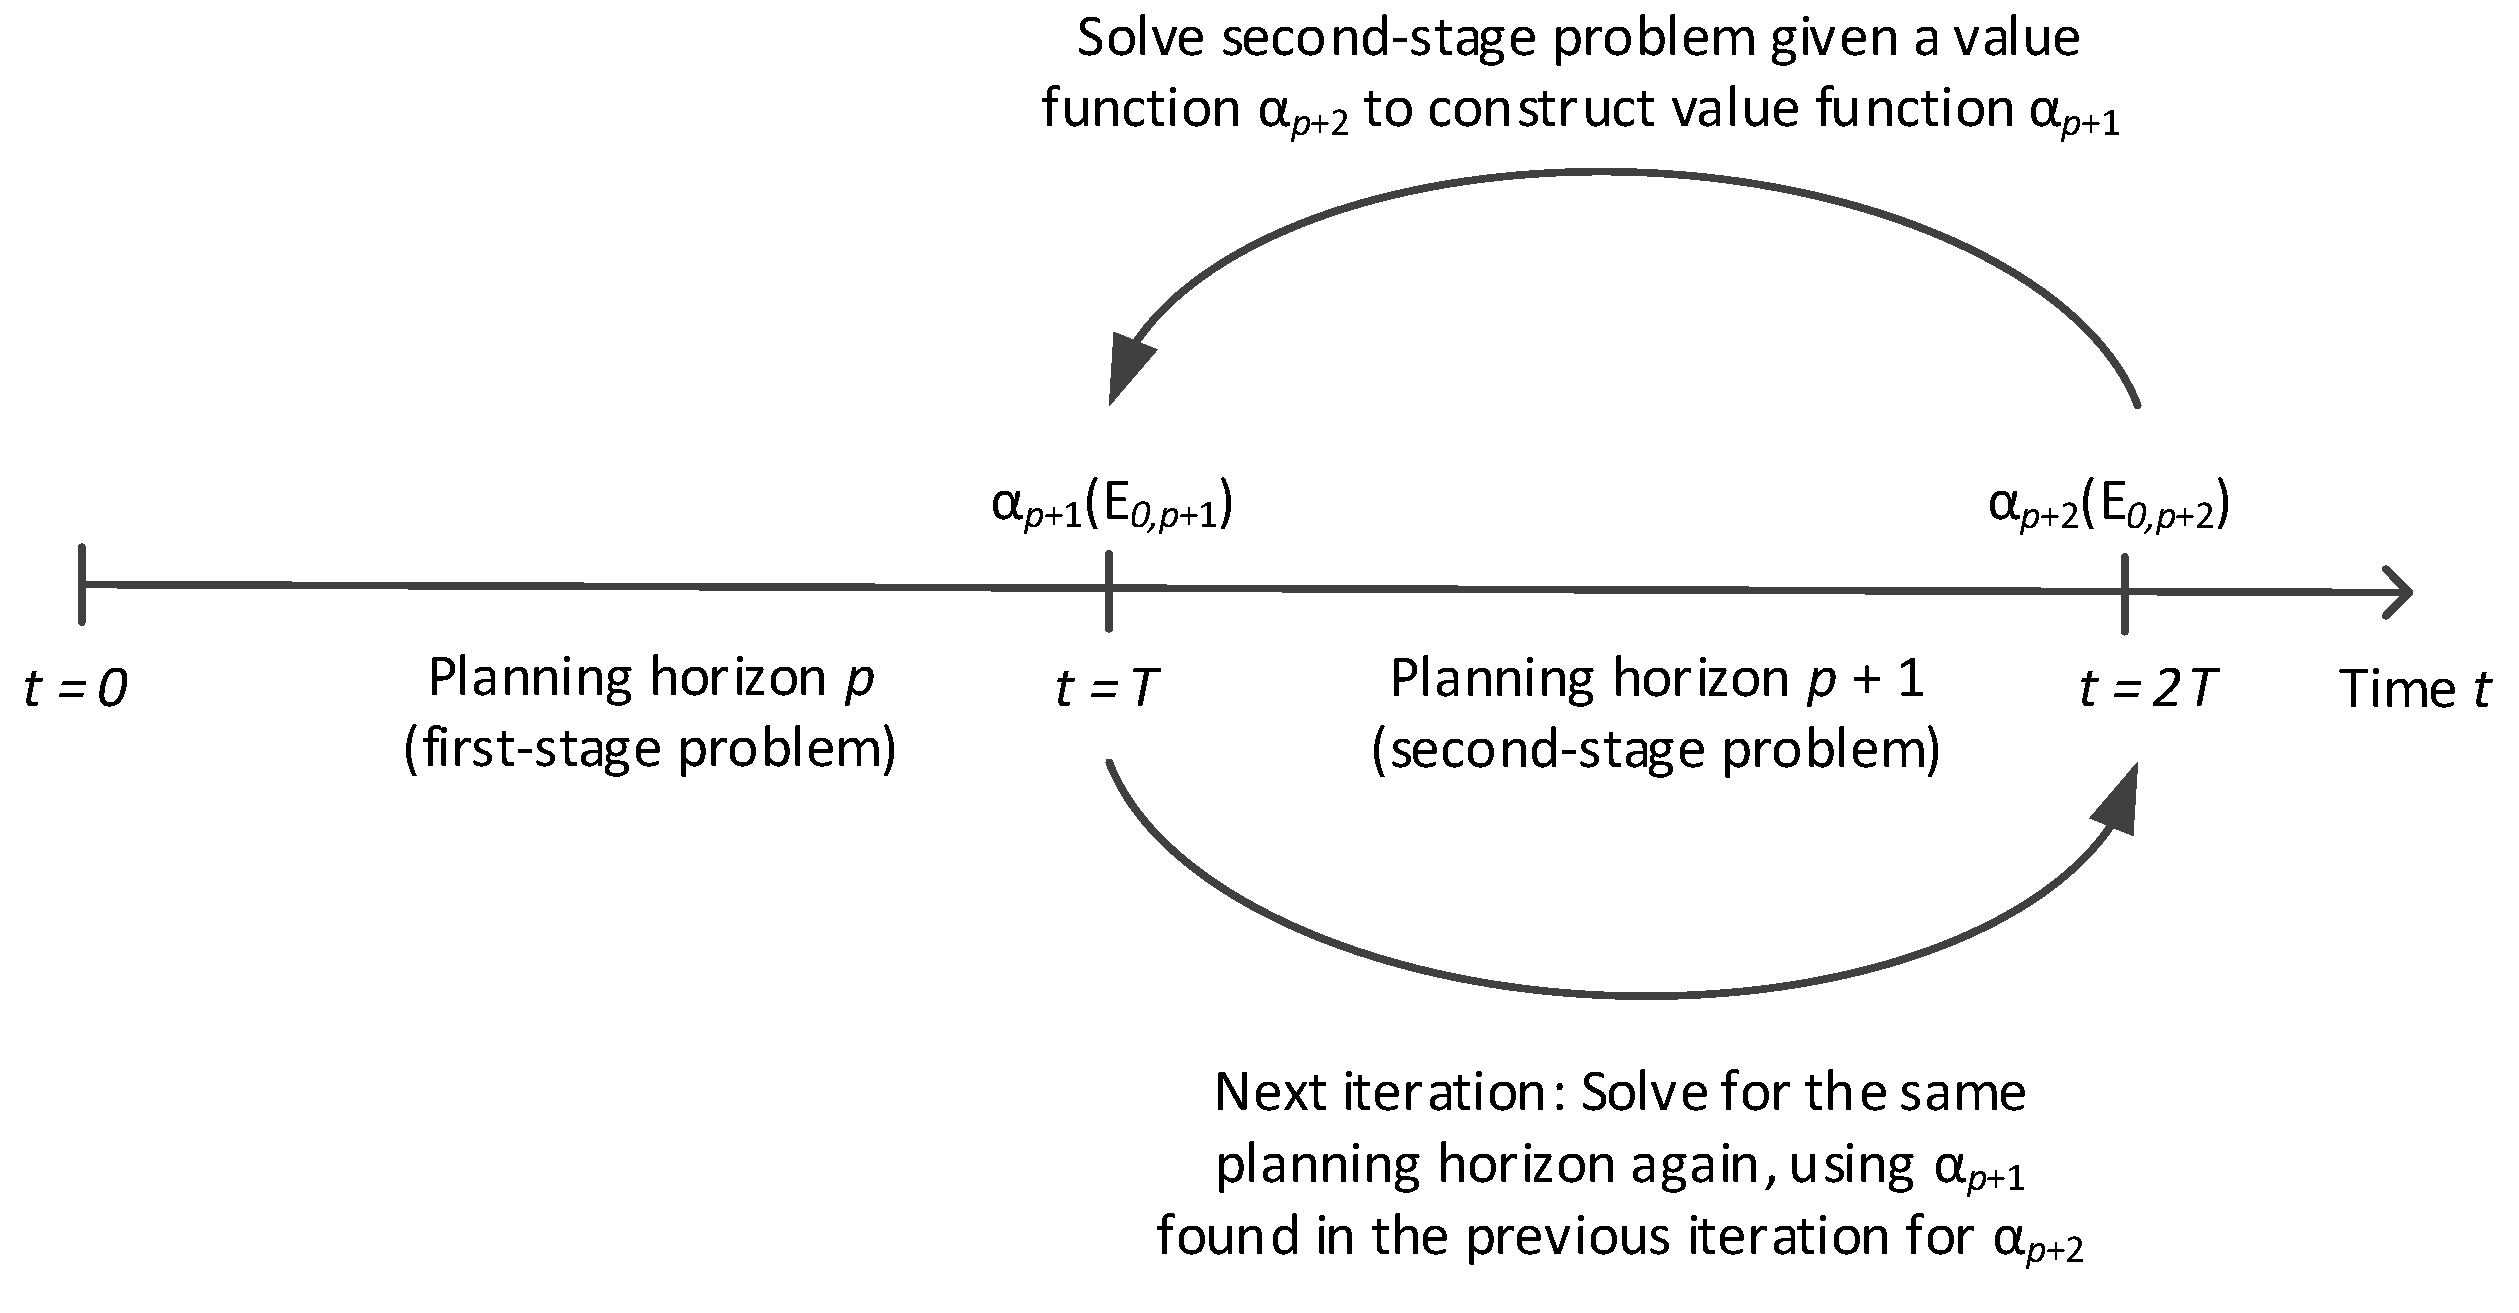
3.3. Determining the Value Function

To present how we set the end-value of stored energy, i.e., determine the value function, we consider in this section the multi-period OPF problem described above as a multi-stage decision problem, where each planning horizon corresponds to one stage. The objective is to maximize social welfare when operating the distribution system, not only for the current planning horizon p , but also for multiple planning horizons ( p ,   p + 1 , , N p ) into the future:
f = p = p N p t = 1 T L t , p c 0 Δ t .
Here, L t , p corresponds to the term of the objective function for time step t and planning horizon p . For a given planning horizon p , the objective function for the first-stage problem can be written as
f p = t = 1 T L t , p c 0 Δ t   α p + 1 ( E 0 , p + 1 ) ,
where α p + 1 ( E 0 , p + 1 ) is the future value of the energy E 0 , p + 1 stored at the beginning of planning horizon p + 1 . Solving the multi-stage decision problem amounts to determining α p + 1 ( E 0 , p + 1 ) , which corresponds to an optimal scheduling policy for each planning horizon.
For the first-stage problem, E 0 , p is known, and the problem is to determine the schedule { E 1 , p , E 2 , p , , E T , p } given the value of stored energy at the end of the planning horizon, α p + 1 ( E T , p ) . The second-stage problem is to determine the schedule for planning horizon p + 1 , { E 1 , p + 1 , E 2 , p + 1 , , E T , p + 1 } , given a realization of the uncertain DG resource variables ( y ) and given the initial stored energy E 0 , p + 1 determined by solving the first-stage problem. In this two-stage decision problem, we choose as state variables the stored energy E T , p = E 0 , p + 1 and in addition a DG state variable x p describing the stochasticity of the underlying DG resource variables. These state variables are being passed from one stage to the next, meaning that E 0 , p + 1 = E T , p and that x p + 1 is determined by x p and by a stochastic process governing the transition between the stages.
Our method builds upon a stochastic dynamic programming approach as presented in Reference [11] in the context of hydropower scheduling. The main principle here is solving a recursive Bellman equation on a form similar to
α p + 1 ( E T , p , x p ) = E y k { f p + 1 * ( E 0 , p + 1 , x p + 1 ) } .
Here f p + 1 * ( E 0 , p + 1 , x p + 1 ) = min f p + 1 ( E 0 , p + 1 , x p + 1 ) is the optimal objective value for planning horizon p + 1 , including also the future value term. The expectation is taken over possible realizations of y k , which represents stochastic variables for the next planning horizon p + 1 that are assumed to be known (realized) in planning horizon p + 1 but uncertain in the current planning horizon p . We require that the stochastic processes underlying the variables y k are stationary and do not depend on p . For our application, this condition is fulfilled when considering sufficiently short time periods, e.g., within the same month or season. This needs to be checked when pre-processing historic energy resource time series used to generate y k . Since the physical system is static between different planning horizons, the optimal scheduling policy is also stationary. For stationary processes, one can regard the multi-stage decision problem as a static infinite-horizon problem with N p . Solving this infinite-horizon problem by backwards recursion corresponds to iteratively solving a series of identical two-stage decision problem, as illustrated in Figure 1: For each next iteration, one inserts for α p + 2 the function α p + 1 found in the previous iteration. For the first iteration, one needs to make a guess at an initial value function, in our case α p + 2 = 0 . This iteration procedure is repeated until reaching convergence, i.e., α p + 2 α p + 1 . with sufficient accuracy. The value function determined through this iteration procedure can then be used in the objective function (Equation (1)) to represent the optimal scheduling policy for any planning period within the time period (e.g., month or season) it is determined for.
Similarly to the incremental water value method described in Reference [11], we construct the future value function to use in the next iteration using the marginal values of stored energy π =   α / E | E = E T instead of the values α from Equation (15) directly. Assuming a concave form of the value function as in Equation (11), one can construct a value function to use for the first-stage problem from dual values obtained from the second-stage problem. This approach is analogous to constructing Benders cuts of the decomposition of stochastic multi-stage optimization problems [52]. From the optimal solution for the second-stage planning horizon, we extract the dual value π corresponding to the energy balance constraint Equation (4) for t = 1 :
E 1 , p + 1 E 0 , p + 1 + Δ t η out   P 1 ESS , d + η in Δ t   P 1 ESS , c = 0 .
This corresponds to the marginal value of energy stored at the beginning of planning horizon p   +   1 . The dual value π ( E 0 , p + 1 , x ) as a function of the initial amount of stored energy is evaluated for the discrete set of values E 0 , p + 1 S E for a number of realizations of y k , and parameter values γ ( x ) and β ( x ) to use for the next iteration are estimated by fitting the linear function of Equation (12) to the data. This is repeated for different values of x S x , and the iterations proceed until acceptable convergence is reached for γ ( x ) and β ( x ) . The procedure is described in the Algorithm 1 below.
Algorithm 1: Determining Value Function for Stored Energy
Input: Grid data for the distribution system model in Section 3.1, historic DG resource (wind speed or solar irradiance) time series data, selection of a discrete set Sx of DG state variable values x ; selection of a discrete set S E of initial stored energy values E
Output: Estimates of value function parameters γ ( x ) and β ( x ) for all DG state variables x S x
1:  Initialize value function parameters γ ( x ) = 0 , β ( x ) = 1 for all x S x
2:  Generate k max synthetic time series yk for the stochastic DG resource variables for each value of x S x
3:  while β and γ not converged for all x S x
4:   for j x = 1   to   | S x | do
5:    Set DG state variable x to the j x th value in S x
6:    for j E = 1   to   | S E | do
7:     Set initial stored energy E 0 , p + 1 to the j E th value in S E
8:     for k = 1   to   k max do
9:        Use DG resource time series yk for state variable value x
10:      Solve second-stage problem for planning horizon p ( t = 1 , 2 , , T ) with value
        function parameterized by γ ( x ) and β ( x ) for initial stored energy E 0 , p + 1 and
        DG resource time series yk
11:      Evaluate dual value π(x, E0,p+1)
12:     end for
13:    end for
14:    Fit dual values π ( x , E ) to a linear function of E
15:    Determine updated values of γ ( x ) and β ( x )
16:   end for
17:  end while
The methods for generating synthetic time series representing possible realizations of stochastic DG variables in the next planning horizon p + 1 given the state variable x p will be made more concrete in Section 3.4 and Section 3.5 for wind power and solar PV, respectively.

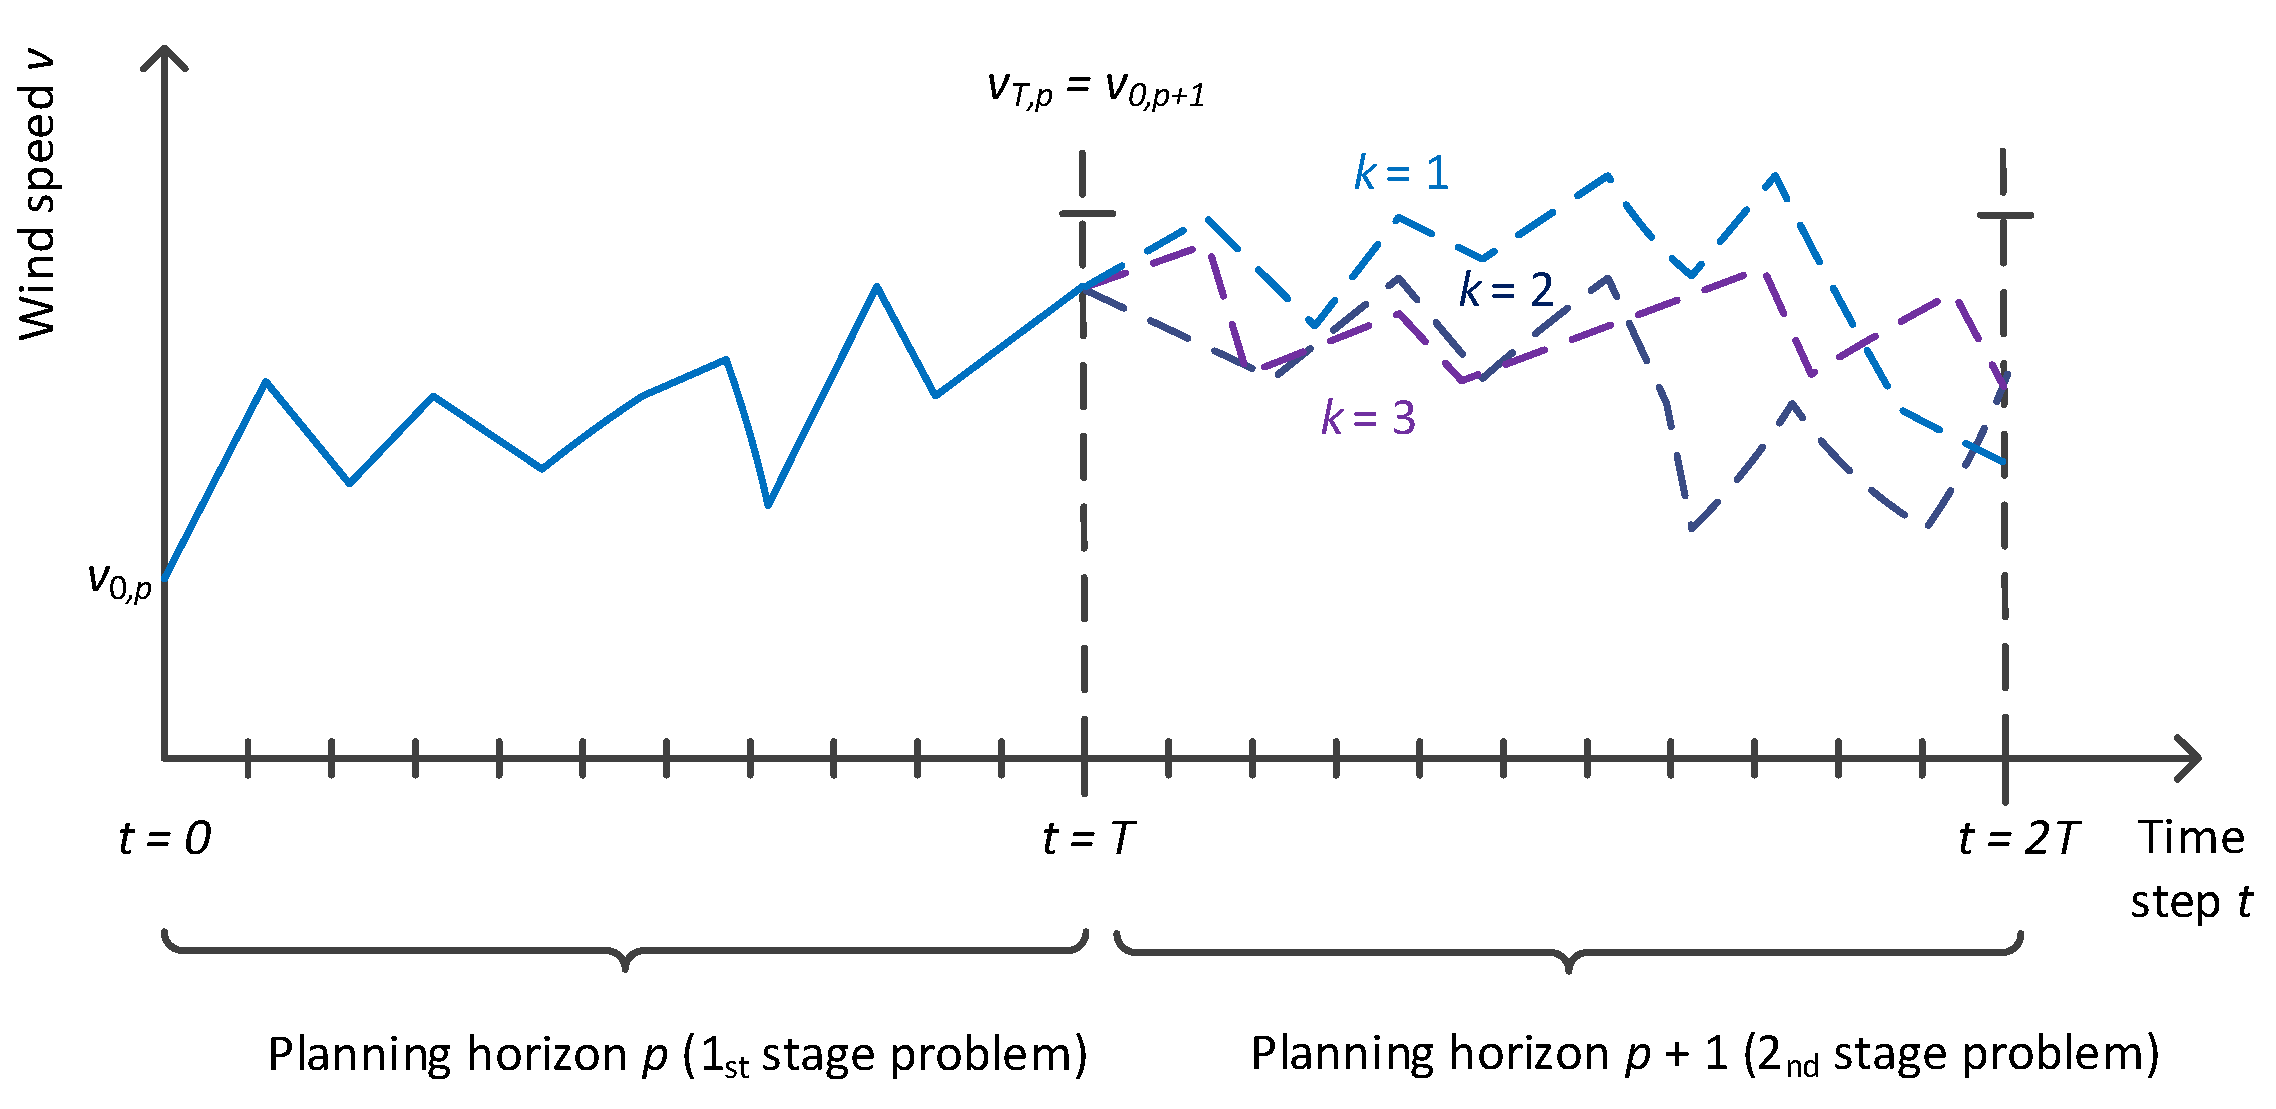
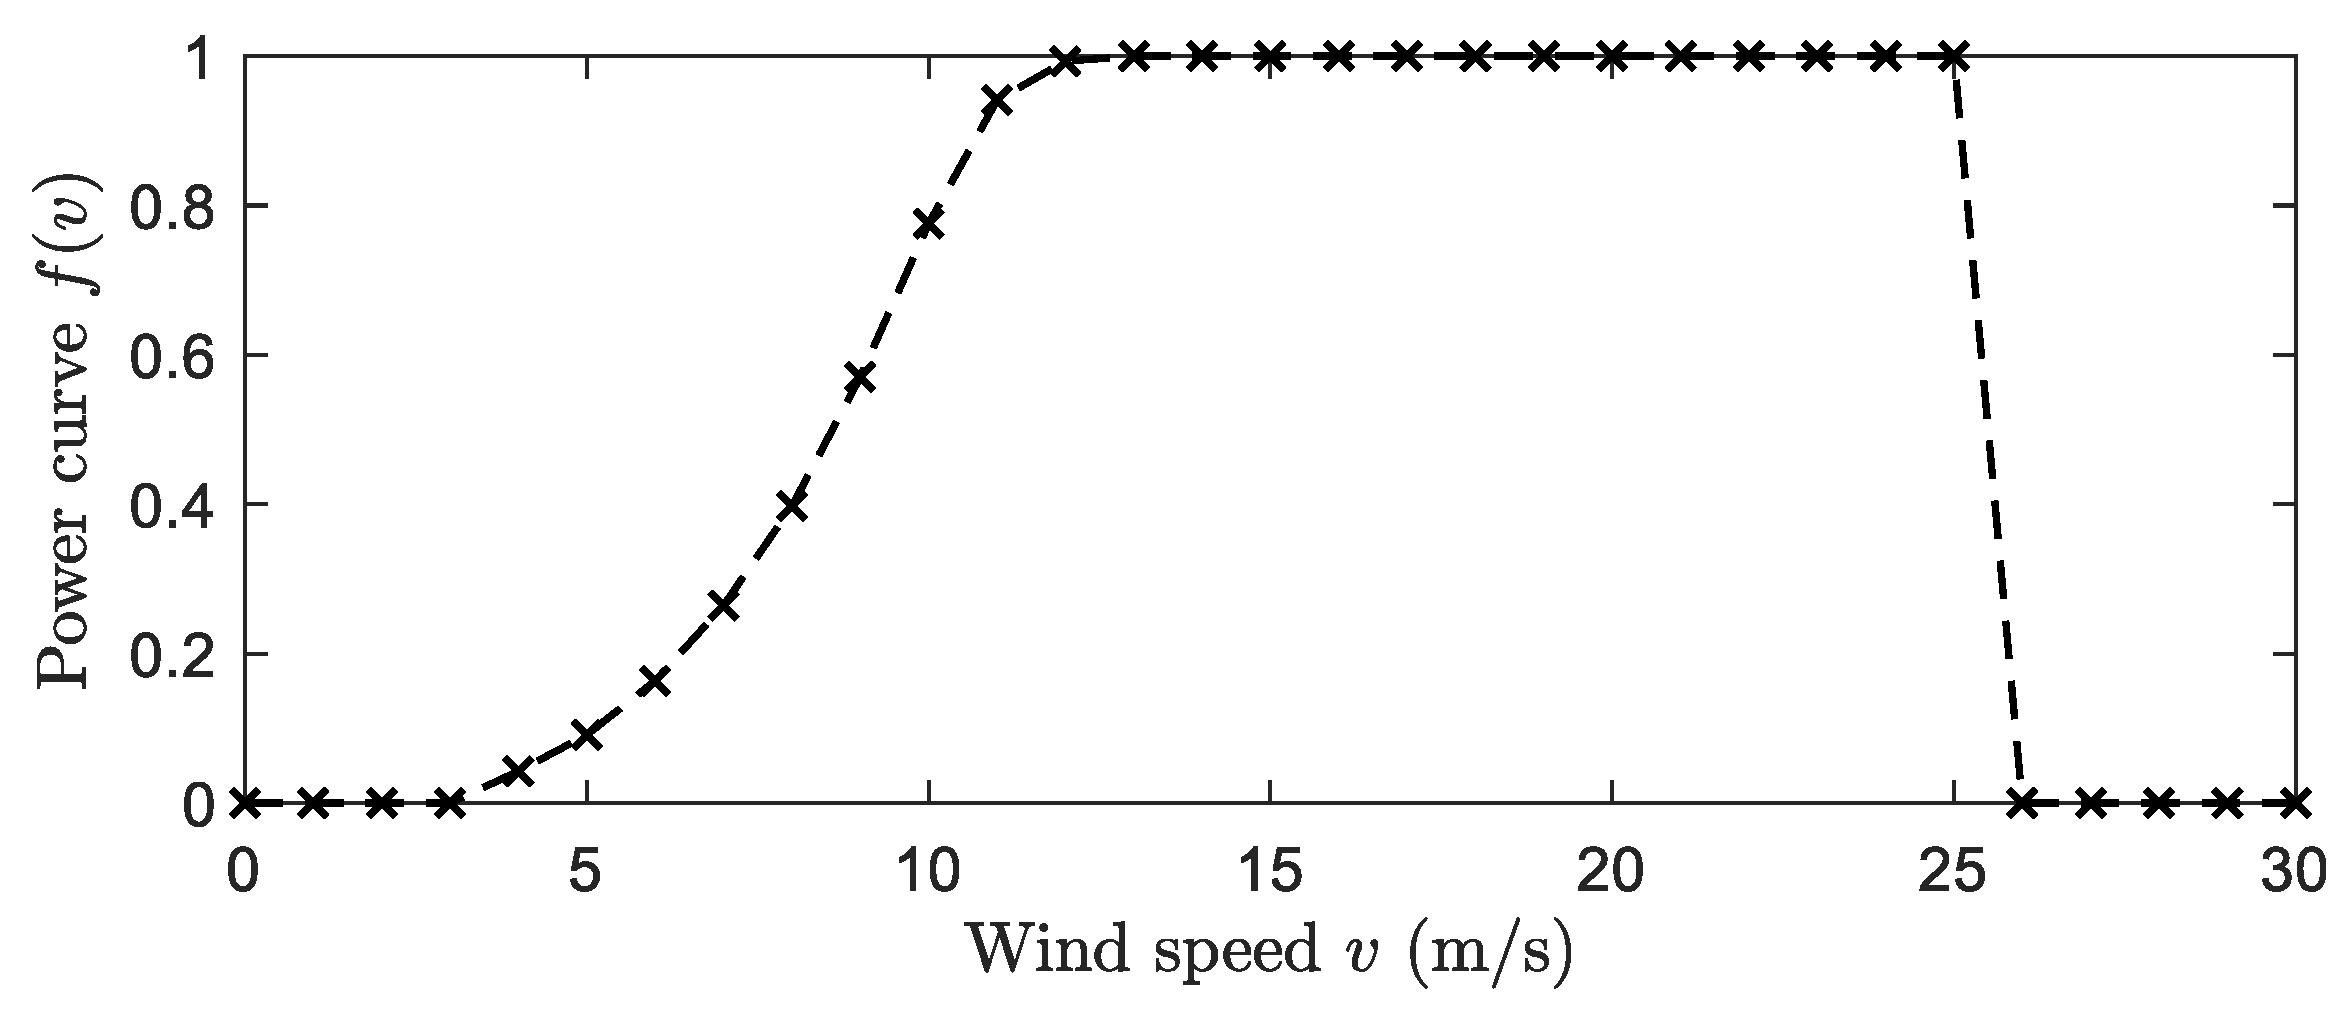
3.4. Modeling Stochasticity of Wind Power Generation

In this section, we consider the case of wind power generation where the stochastic variables y k in the next planning horizon are the wind speed time series v k = { v 1 , p + 1 , k , v 2 , p + 1 , k , ,   v T , p + 1 , k } . The mathematical expectation in Equation (15) is therefore taken over possible realizations k = 1 , 2 , , k max of this wind speed time series. In determining the value of stored energy at the end of the current planning horizon, we want to account for the time correlations between the wind speeds at the end of the current planning horizon p and at the beginning of the next planning horizon p + 1 . High values of v T , p are correlated with high wind speeds v t , p + 1 and thus high wind power output in the next planning horizon. This, in turn, increases the probability of wind power curtailment if the ESS does not have the capacity to accommodate the part of this distributed generation that cannot be exported from the grid. One would therefore expect that the future value of stored energy at t = T should decrease with increasing v T , p , which motivates including a state variable x p in Equation (15).
As in Reference [9], we use the terminal wind speed as state variable, i.e., x p = v p ,   T and capture the time correlation and stochasticity in wind speed by generating synthetic wind speed time series for planning horizon p + 1 using a discrete-state Markov chain model. Wind speed time series do not generally satisfy the Markov property, but Markov chain models may reproduce the autocorrelation of historic wind speed time series with acceptable accuracy if the timesteps are longer than around 40 min [53]. This condition is satisfied in our case.
Due to the potentially strong seasonal patterns in wind speed variation, transition matrices [ ( V t + 1 = v i | V t = v j ) ] i , j are first constructed separately for historic data for each month or season (e.g., combining data from multiple months if they represent similar wind speed statistics). An element in these transition matrices is the estimated probability that the wind speed in the next time step (the stochastic variable V t + 1 ) has the value v i , given that the wind speed in the current time step has the value v j . Next, for each value of v T , p S x , synthetic time series v k = { v 1 , p + 1 , k , v 2 , p + 1 , k , ,   v T , p + 1 , k } for k = 1 , 2 , , k max are generated using the transition matrix for the season and initializing the Markov chain from v 0 , p + 1 = v T , p . This model for the stochasticity and time correlations of wind speed is illustrated schematically in Figure 2 for a few possible wind speed realizations v k . Note that the purpose in this work is emphatically not to exactly represent accurate wind speed forecasts, but rather to generate a representative set of realizations of future ( t > T ) stochastic wind power output, capturing time correlations sufficiently accurately for the estimation of the value the energy stored at t = T . The time series for wind power output are generated based on the time series for the wind speed v t , a power curve function f ( v t ) [ 0 , 1 ] , and the rated power P i rated of the wind turbine at bus i , i.e.,
P i , t DG ,   max = P i rated f ( v t ) .

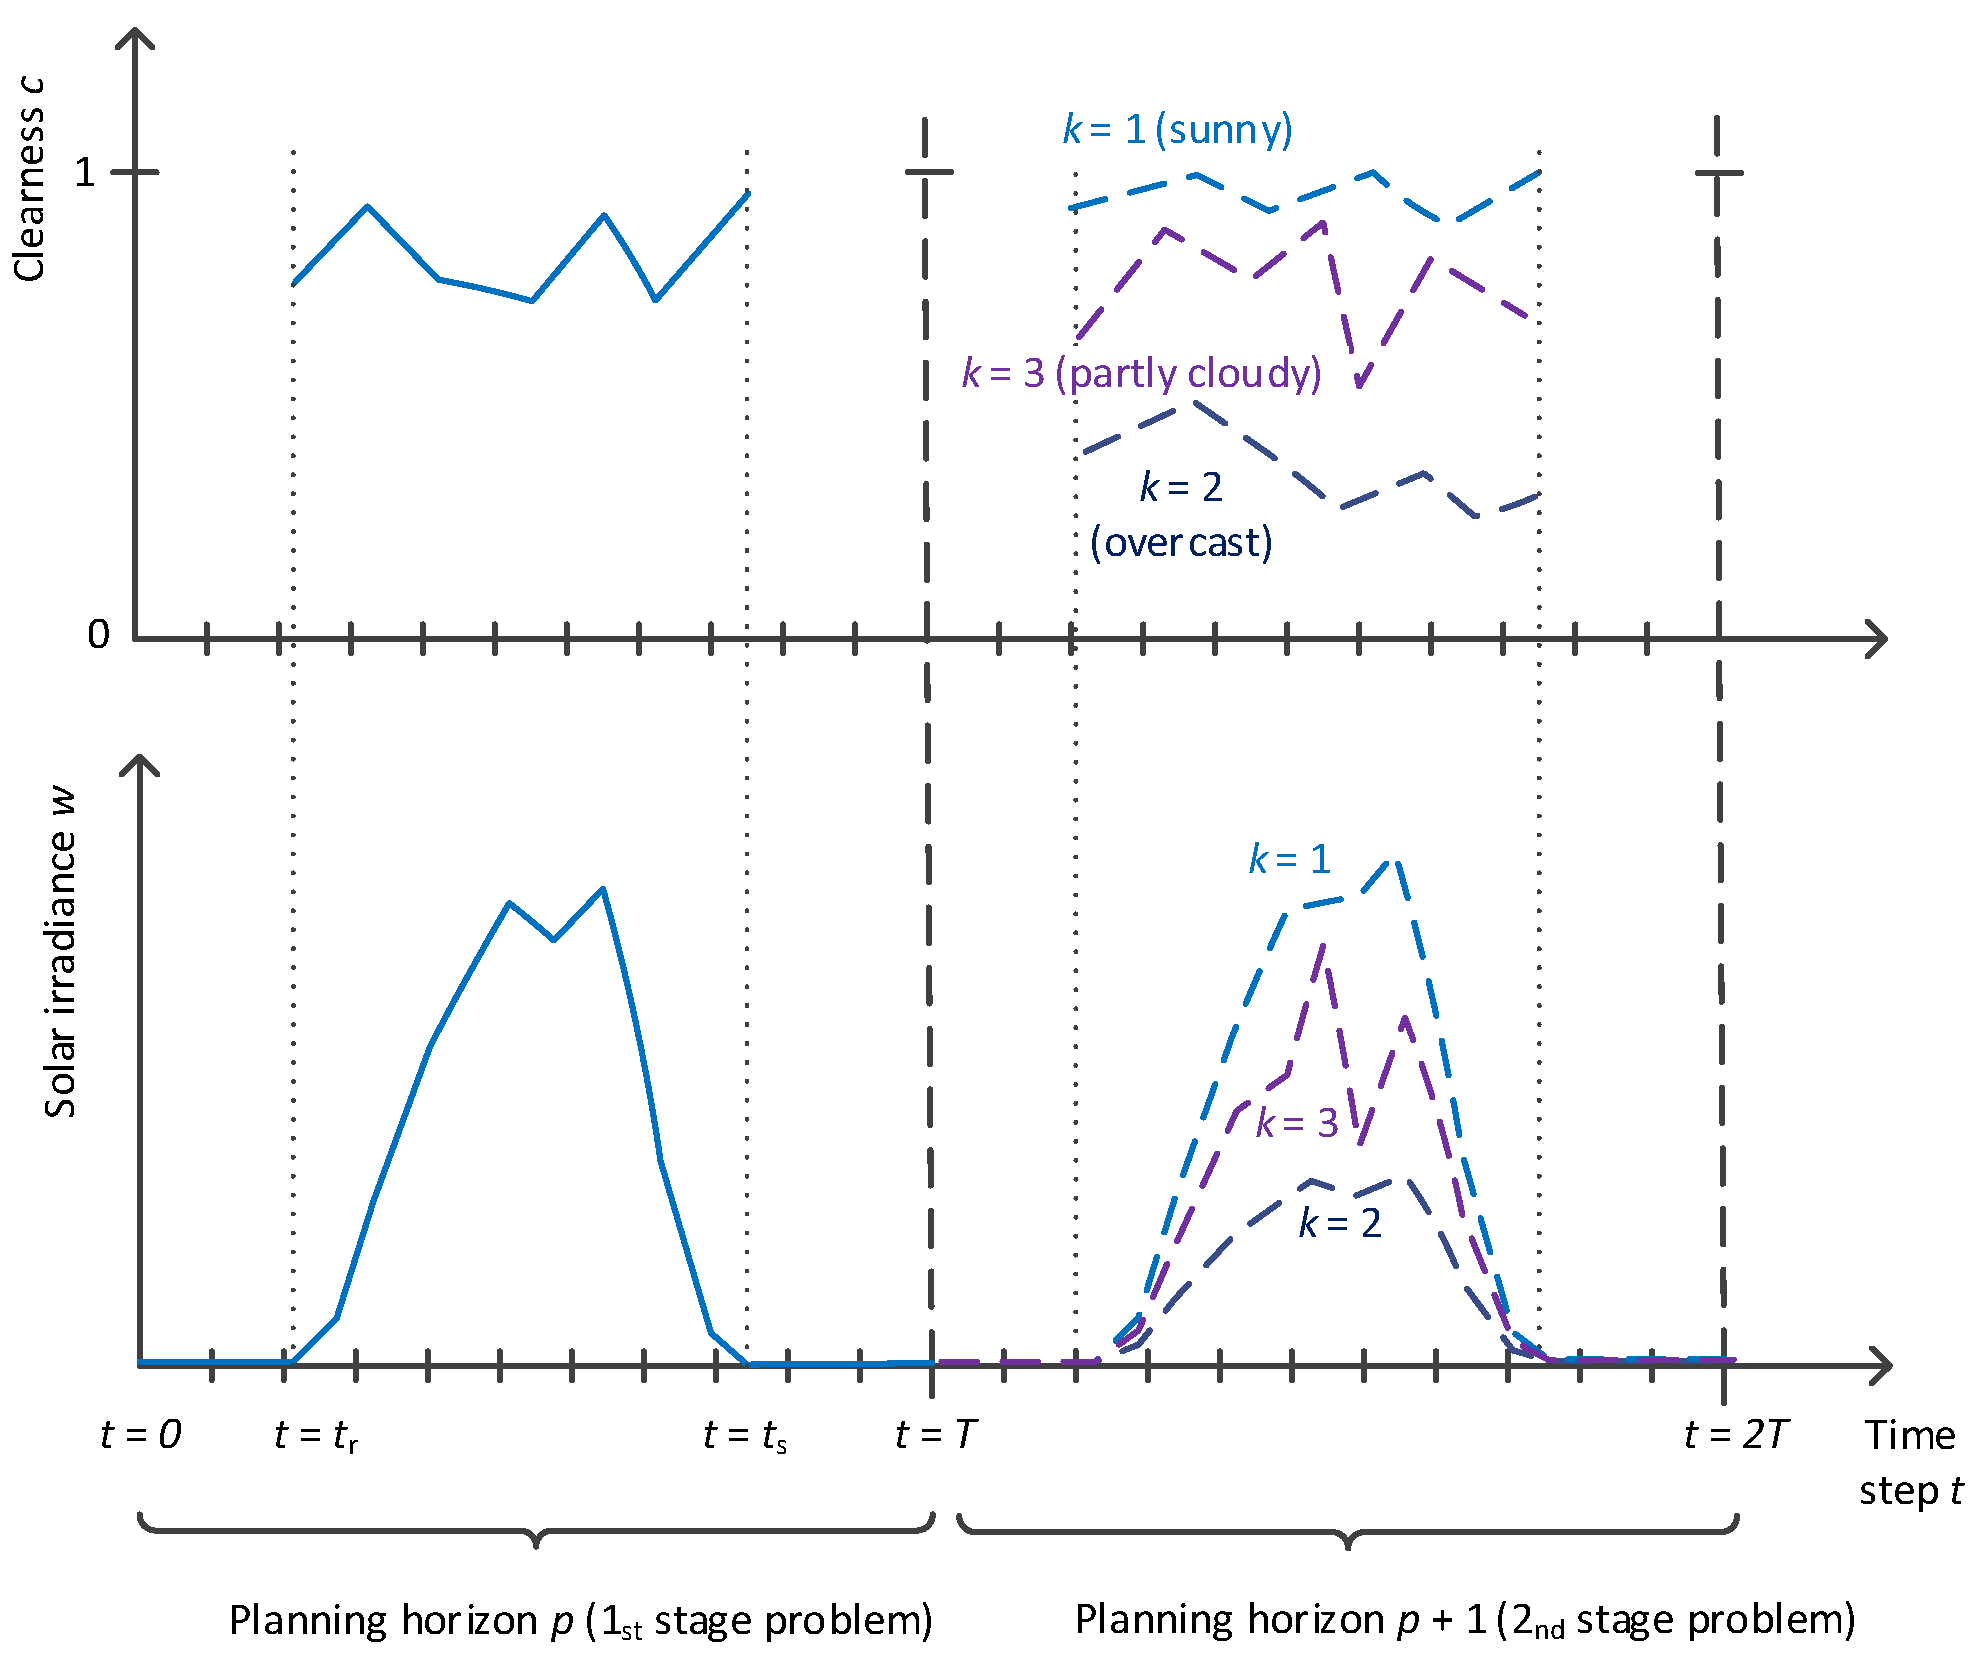
3.5. Modeling Stochasticity of Solar PV Power Generation

To model the stochasticity and time dependence of PV generation for the purpose of estimating the future value of stored energy, we have chosen a Markov chain model with regime-switching for the cloud cover (clearness) conditions, inspired by References [38,54], respectively. Following Reference [54], we assume that the stochasticity of the actual (ground-level) solar irradiance w t follows a regime-switching process in which periods of the time series for wt can be classified as belonging to one of three clearness regimes r : overcast ( r = 1 ) , partly cloudy ( r = 2 ) , or sunny ( r = 3 ) . For time series for w t within each regime, we have, following Reference [38], assumed that the stochasticity can be described by a Markov chain model for the clearness c t , defined as
c t = w t / s t ,
together with a deterministic time series s t for the expected irradiance given sunny conditions and no cloud cover. Note that in some other works [54], a clear-sky-index α t = c t 2 is used instead of the clearness c t to describe the relationship between the actual and expected irradiance.
To generate synthetic time series for w t based on historic data for w t , we first find the time series for the expected irradiance s t over a period of a day. Instead of calculating the deterministic s t profile theoretically based on geometry, latitude, date, etc., we estimate it empirically using the simple model as proposed in Reference [55]:
s t =   a + b   cos ( 2 π ( t Δ t / 2 ) 24   h ) .
First, for each month of the year and each time step of the day from sunrise ( t = t r ) to sunset ( t = t s ), the highest observed value w t max in the irradiance data set is found. Sunrise and sunset for the month are determined empirically as the first and last time steps, respectively, for which all days in the data set have nonzero irradiance. Next, Equation (19) is fitted to the time series { w t max } t = t r t s to determine the parameters a and b . For the purposes of this study, this is found to be a robust and sufficiently accurate approach given that there are no substantial systematic shading effects.
A procedure based on that proposed in Reference [54] is used to classify the cloud cover conditions (clearness regimes) for each day of the historic irradiance data set: A day p is classified as sunny if the normalized error
Error sunny = t = t r t s s t 2 ( 1 c t 2 ) 2 / t = t r t s s t 2
is below a certain threshold, Error sunny τ sunny . If not, one calculates
α ^ p = t = t r t s ( c t s t ) 2 / t = t r t s s t 2 ,
Error overcast = t = t r t s s t 2 ( α ^ p c t 2 ) 2 / t = t r t s s t 2 ,
and classifies the day as overcast if α ^ τ α and Error sunny τ overcast . Otherwise, the day is classified as partly cloudy. Time series for the clearness regime value r are thus created for the historic irradiance data set for all sets of subsequent days, and these time series are used to construct 3 × 3 transition matrices [ ( R p + 1 = r | R p = r ) ] r , r for the regime-switching process. Here, R p denotes the stochastic variable for the clearness regime for day p .
Transition matrices [ ( C t + 1 = c i | C t = c j ) ] i , j for the Markov chain model for clearness within each day are constructed separately for each of the three clearness regimes. Here, C t denotes the stochastic variable for the clearness for time step t . As in Reference [38], clearness values c i are discretized in a set of nclr values { c i = i n clr 1 } i = 0 n clr . As the daily expected irradiance time series s t may vary substantially from one month to the next, transition matrices for the regime-switching process between days and the Markov process for clearness within days are estimated separately for each month.
As the state variable underlying the PV generation in planning horizon (day) p , we use the clearness regime during this planning horizon, i.e., x p = r p . To generate a set of irradiance time series representing possible realizations of uncertainty in the next planning horizon p + 1 within a given month and given a current clearness regime r p , we (1) use the transition matrix [ ( R p + 1 = r | R p = r ) ] r , r for the regime-switching process estimated for the month to draw a pseudo-random regime value r p + 1 , (2) draw a pseudo-random clearness value c t r for the sunrise time step of the next day from the clearness probability distribution for clearness regime r p + 1 and the given season, (3) use this as the initial value in a Markov chain c k = { c t } t r t s generated using the clearness transition matrix [ ( C t + 1 = c i | C t = c j ) ] i , j for regime r p + 1 , and 4) calculate the synthetic irradiance time series w k = { w t } t = 0 T from w t = c t 2 s t with { s t } t r t s as estimated for the given month. This representation of the stochasticity and time correlations of the energy resource variables underlying PV generation is illustrated schematically in Figure 3 for a few possible realizations c k and w k for different clearness regimes.
Finally, to calculate the PV power output at bus i in time step t from the solar irradiance w t , we use the simple model [56]
P i , t DG ,   max = η PV , tot A i w t .
Here, η PV , tot is the total efficiency of the PV systems, and A i is the total PV panel area connected to bus i . Such a simple model is sufficient for the purpose of this article, but for more detailed models we refer to References [56,57].

4. Case Study

To demonstrate the framework, we implemented the MPOPF model described in Section 3.1 using MATPOWER’s extensible optimal power flow architecture [51,58] and consider a case study based on a real distribution system in Norway. The data set considered for the case study includes hourly solar irradiance time series measured at the approximate location of the distribution system (around latitude 64° 0′ N), and hourly wind speed time series measured in the same area is also considered for comparison. The model and associated data sets of the distribution system are described in Section 4.1, after which we present results for the determination of the expected value of stored energy for the two forms of distributed generation in Section 4.2. Section 4.3 evaluates the effect on the distribution system operation of explicitly considering the value of stored energy in the scheduling of the energy storage. This is done by comparing this operational strategy with the conventional periodic boundary condition approach ( E T = E 0 ) and a rolling horizon approach.

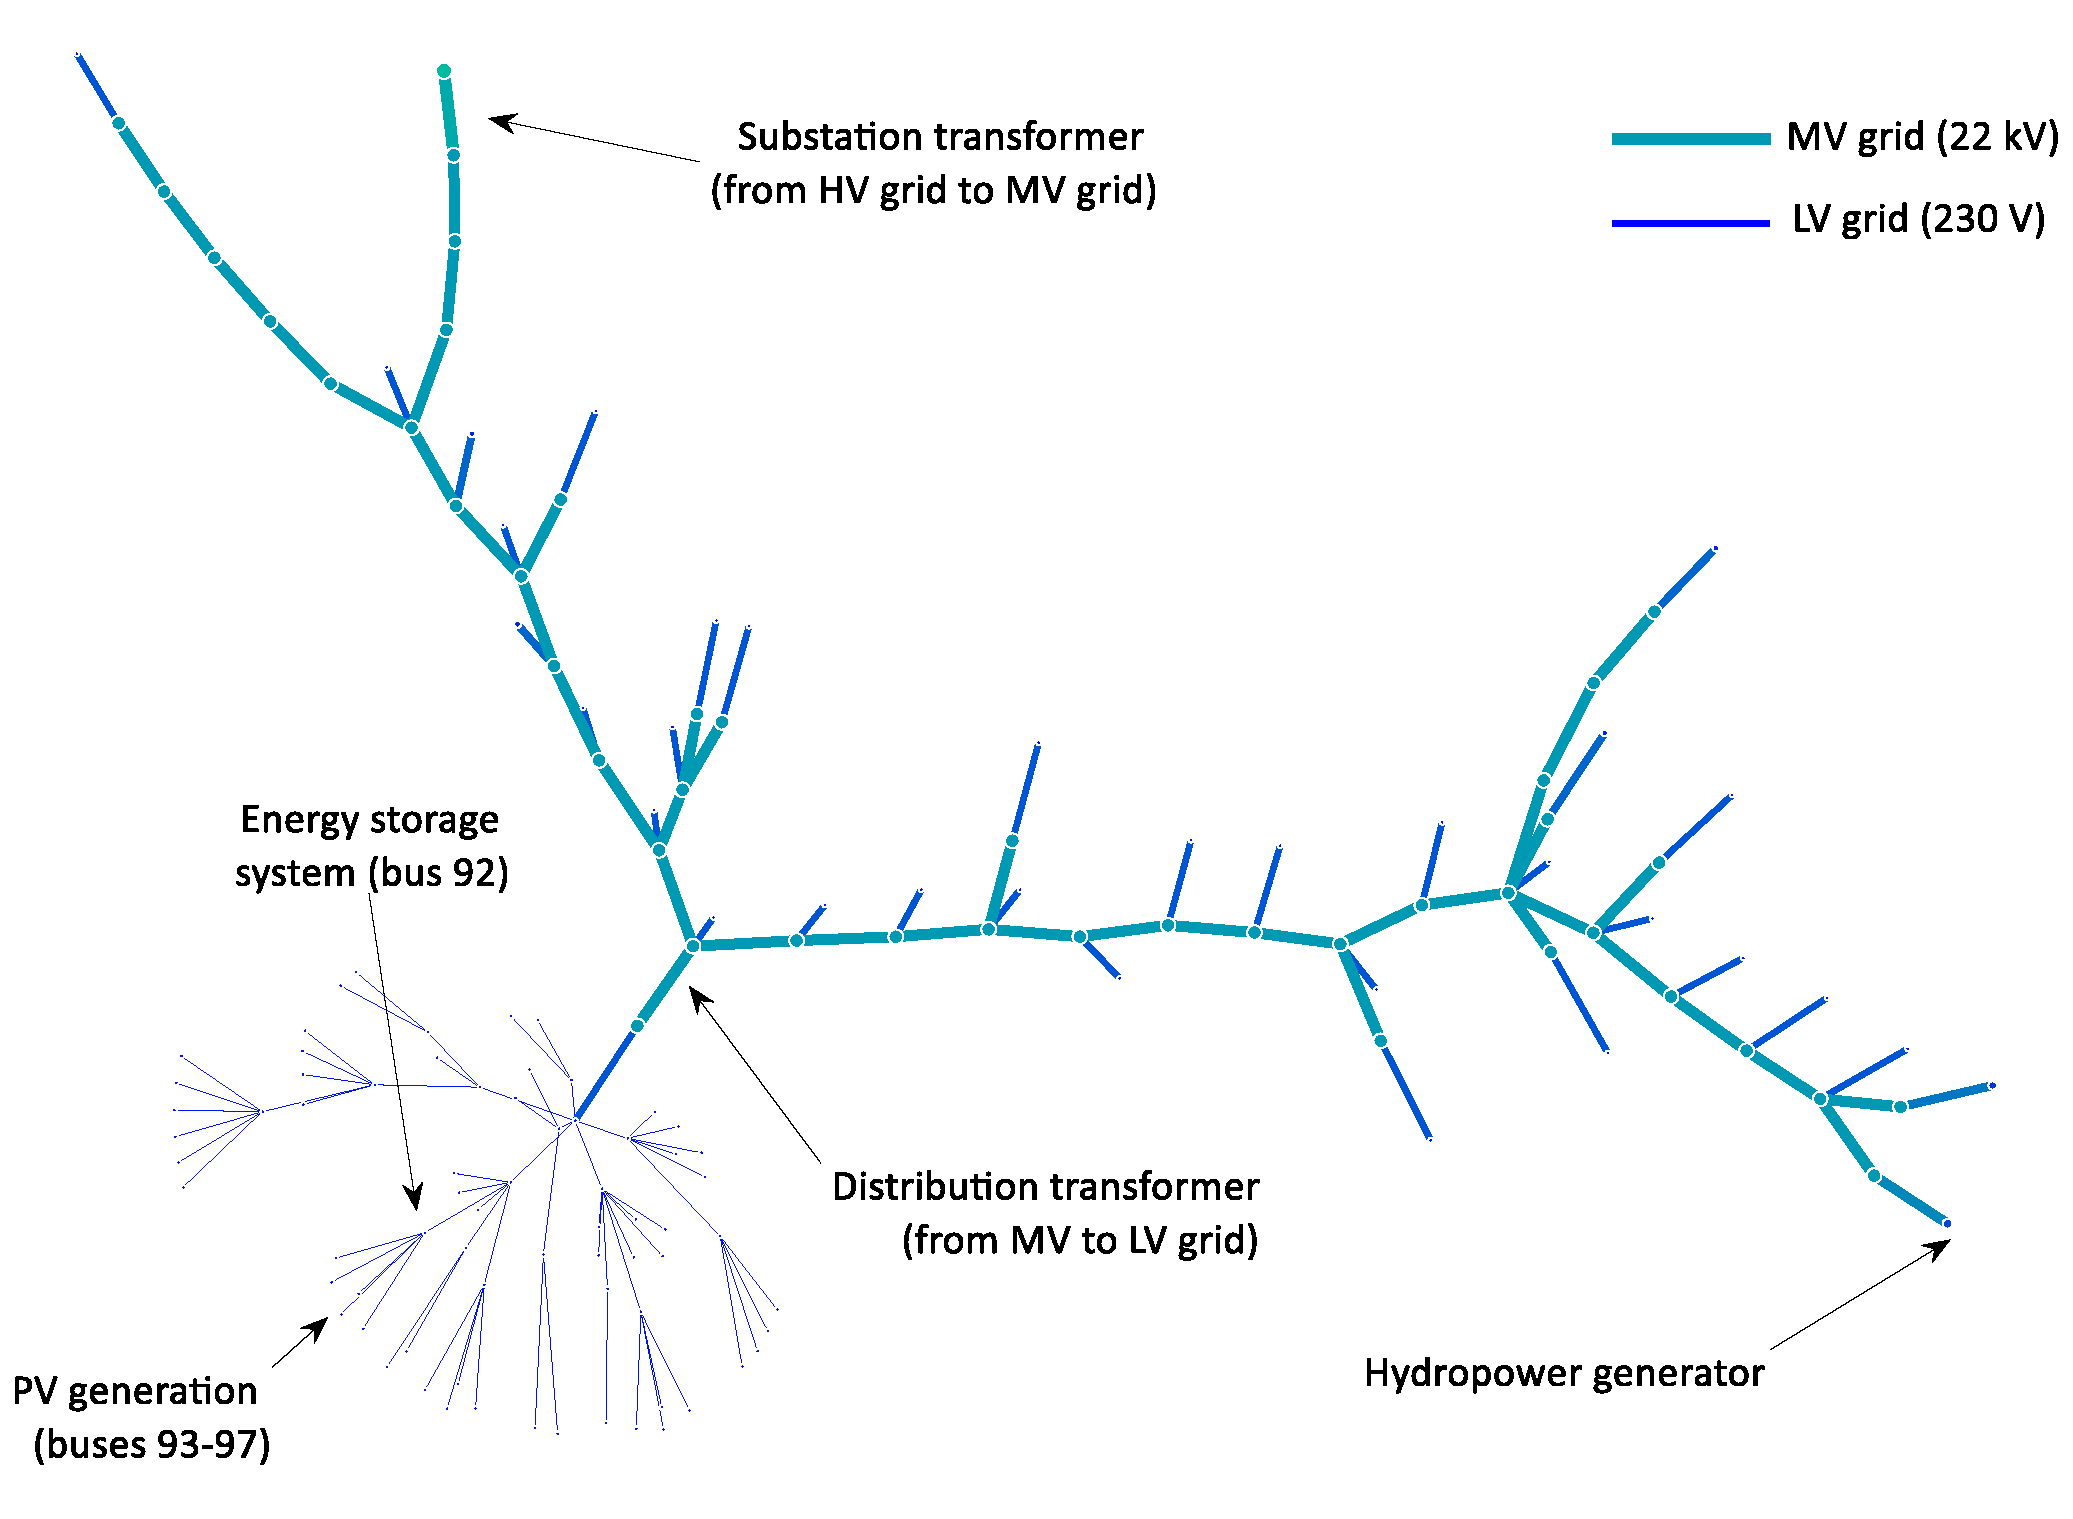
4.1. Distribution System Model

The grid model for the distribution system contains 147 buses and includes a 22-kV medium-voltage (MV) grid and parts of the 230-V low-voltage (LV) grid. The system is depicted schematically and described in more detail in Appendix A. The only point of common coupling (PCC) between the distribution system and the high-voltage (HV) grid is a 66 kV/22 kV substation, through which power is imported or exported. A small-scale hydropower generator is connected to the MV distribution grid, and the distribution system is a net exporter of power for parts of the year. Based on real power import/export and hydropower generation data from the year 2012, representative daily load demand profiles for each month were established. Variation in hydropower generation within each day was on the other hand negligible. Representative electricity price profiles were established based on power market data for the same year. To illustrate the framework and models presented in Section 3, the real distribution system model described above is augmented by the following hypothetical energy storage scenario: In a part of the LV grid, high penetration of variable distributed generation (e.g., medium-scale rooftop PV on supermarkets, office buildings, or agricultural buildings) causes adverse voltage rise in times with high PV power output relative to the load demand. This motivates the installation of a community-level stationary grid-connected energy storage system at a suitable location in the LV grid to alleviate voltage problems while facilitating the integration of the renewable energy into the system. It is not the aim of this article to study possible business models or ownership options for such an ESS (see, for example Reference [59] for a recent and relevant discussion on this issue.) Instead, we assume that the ESS is operated by some actor (e.g., the DSO or a third-party providing ESS services to the DSO) according to the objective of maximizing social welfare by minimizing the cost of importing energy to the distribution system while at the same time respecting technical constraints [9]. The means for flexibility (i.e., degrees of freedom) we focus on for the purpose of this article is the active power of the ESS (i.e., charging or discharging). Although reactive power control of the ESS or of the DG units (e.g., PV inverters) are also possible means of flexibility in reality, these degrees of freedom are not considered in this article but could easily be accounted for in our model since it is based on a full AC OPF formulation. However, we do assume that the ESS operator also has the possibility to curtail parts of the power output of the DG units if necessary, to respect the technical constraints of the system.
To investigate a time period with relatively high DG power output compared to the load demand, especially for the PV case, the case study considers a typical weekday in July. To enable a consistent comparison, equivalent parameters for the wind power case are determined such that, given no power curtailment, the average daily production of electrical energy E ¯ DG from the DG resource time series is the same for the wind power case as for the PV case. Whereas the DG resource time series for the PV case includes July for the years 2010–2015, for the wind power case we use June–August in the one-year time series that was available (2012) to ensure a sufficient number of observations, as these months have approximately the same average wind speeds. Additional details, including descriptions of data in the Supplementary Materials, is provided in Appendix A.

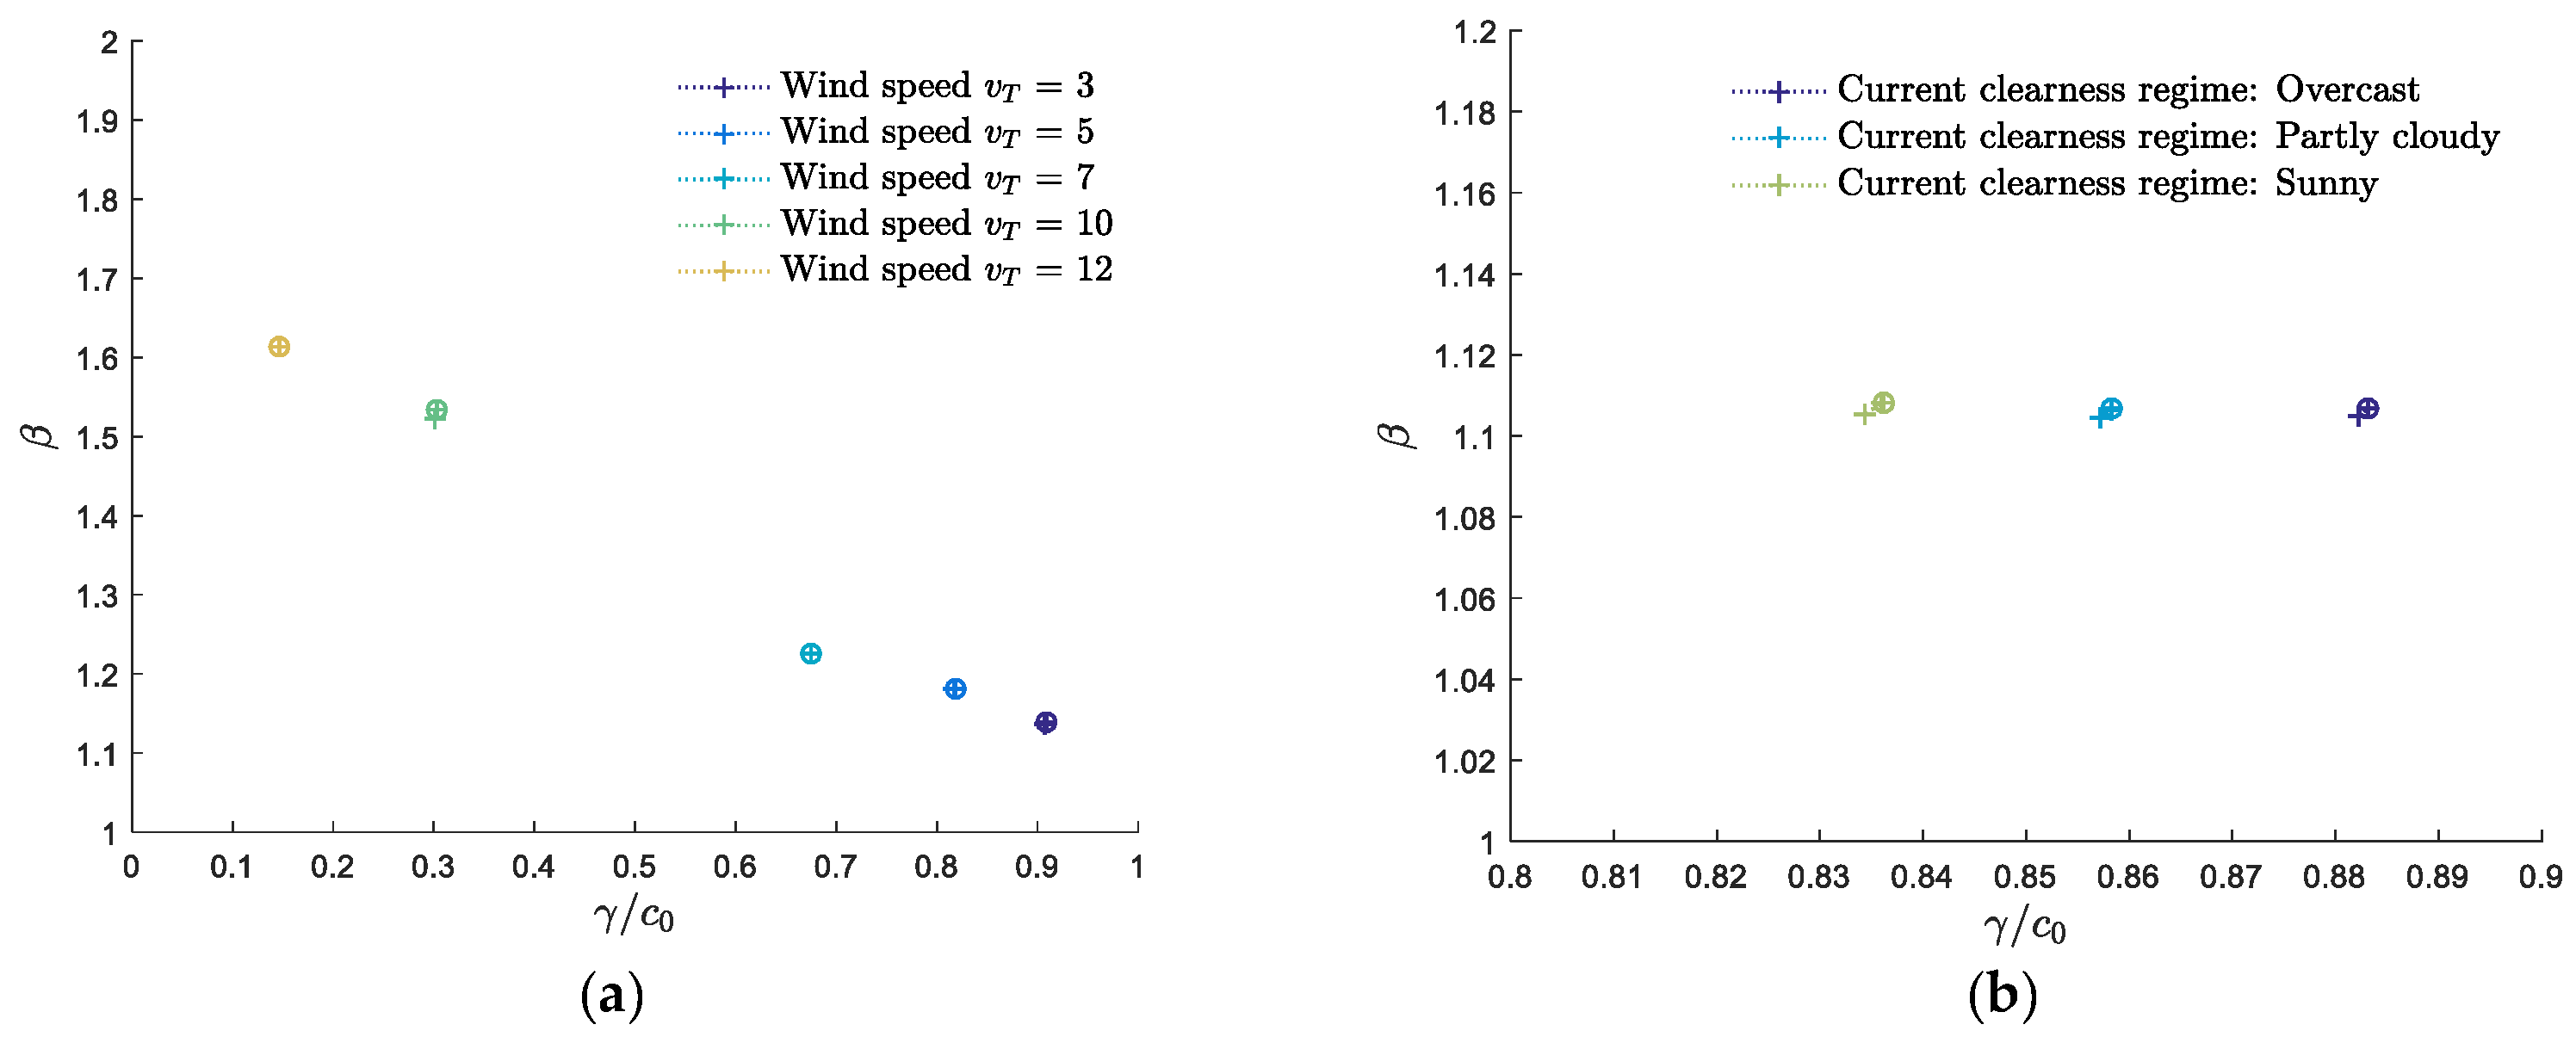
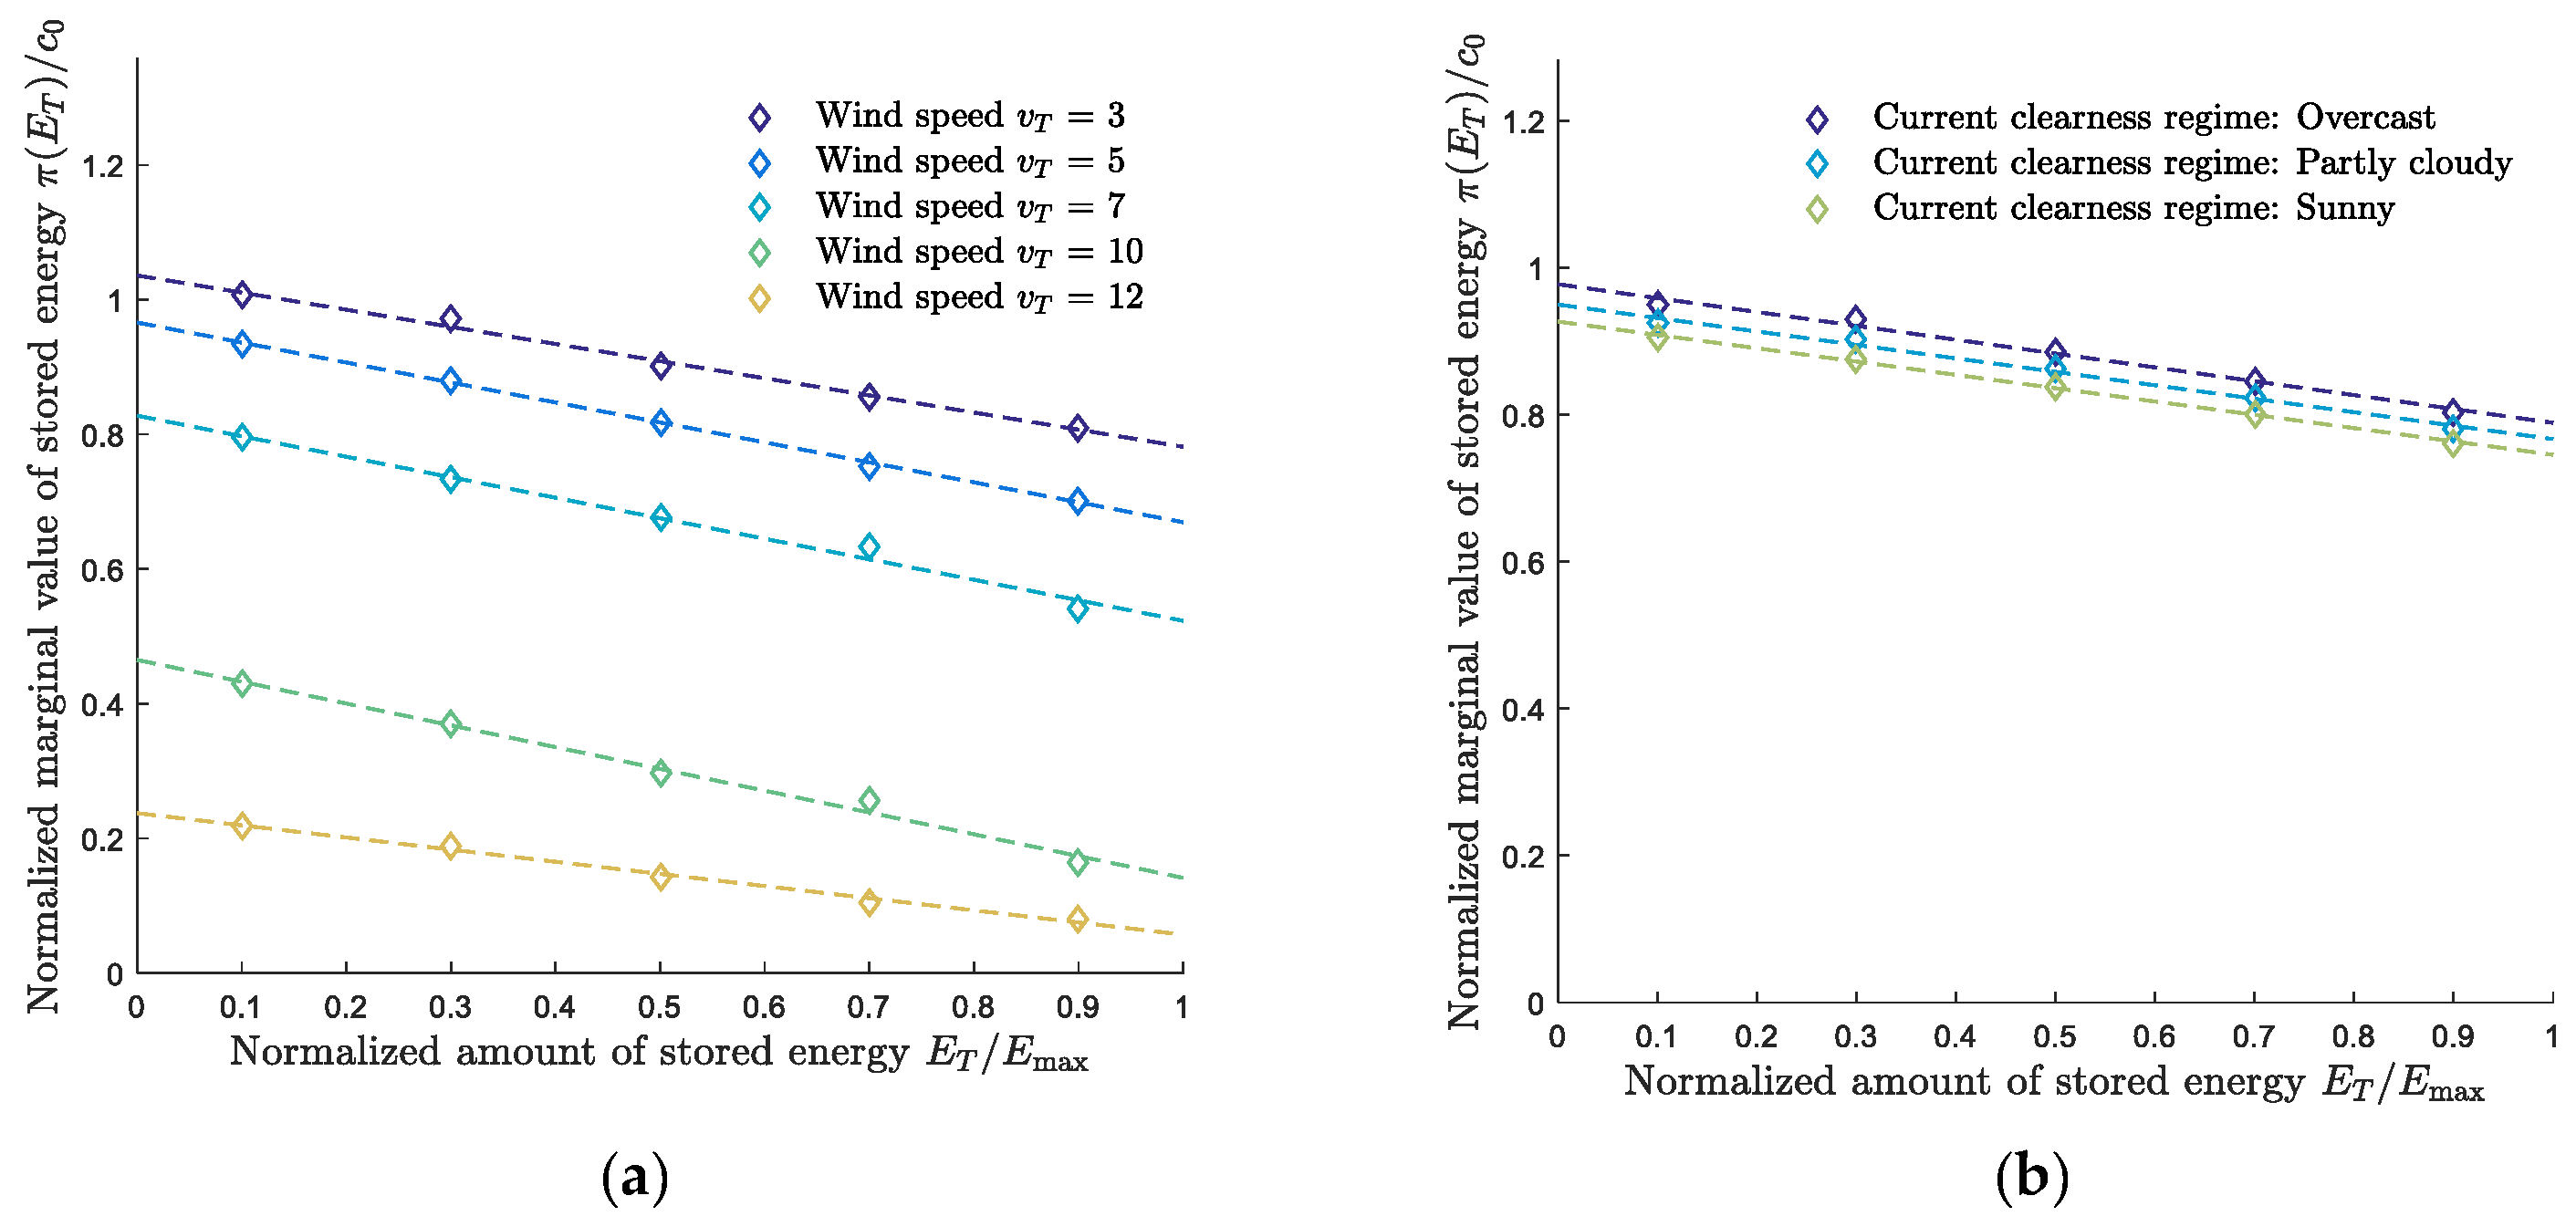
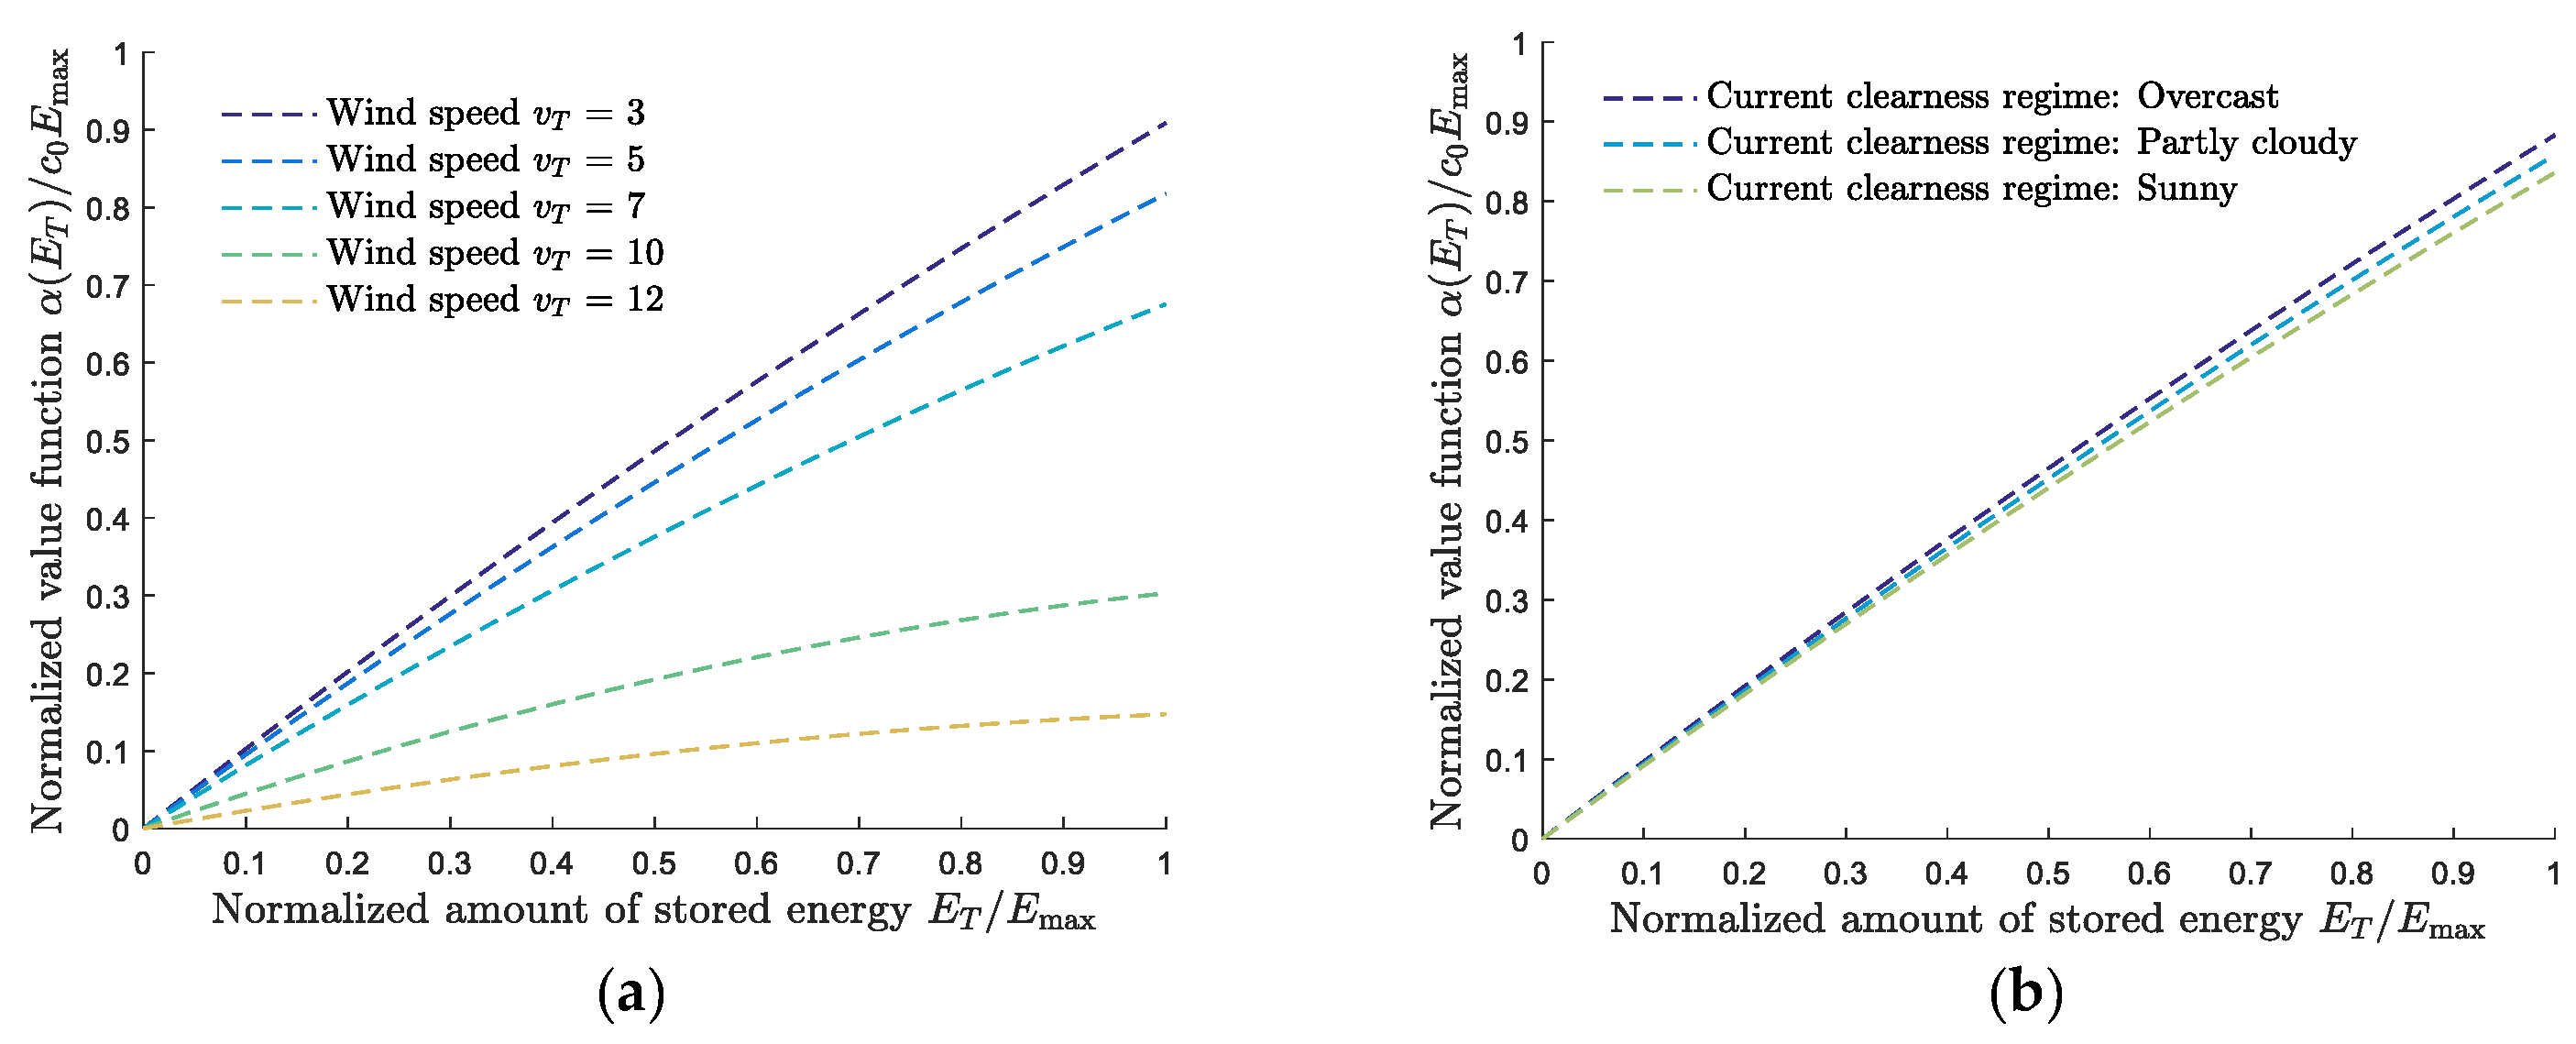
4.2. Results for the Expected Future Value of Stored Energy

In this section, we present results for the determination of the expected value of energy stored at the end of the current planning horizon. The parameters chosen for this case study were as follows: We consider a daily planning horizon with T = 24   h and time steps Δ t = 1   h . In units of m / s , the set of initial DG state variable values chosen for the determination of the value function for wind power is S x = S   v T = { 3 ,   5 ,   7 ,   10 ,   12 } . For the PV case, the corresponding set of state variables comprises the three clearness regimes, S x = S r = { 1 , 2 , 3 } . On this basis, k max = 50 synthetic DG resource variable time series y k are generated for each value in S x . The MPOPF problems are solved using the fmincon solver of the MATLAB Optimization Toolbox with the default interior point algorithm [60]. Some further discussion of computational details is provided in Appendix A.
Figure 4 shows the values of the parameters γ ( x ) and β ( x ) of the value function determined through the iterative algorithm described in Section 3.3. The results for wind power are shown on the left-hand side of Figure 4 for the chosen values x = v T S   v T , and the results for PV are shown on the right-hand side for x = r S r . Each cross represents the results after an iteration, and the circles represent the fourth iteration, after which we regard the parameter values to have converged to sufficient accuracy. For clarity, the values that the parameters were initialized to for the first iteration ( γ = 0 , β = 1 ) are not shown. From Figure 4, we observe a remarkable difference between the parameters for wind power and PV, showing that the end-value setting of the stored energy, and thereby the optimal use of storage, is very different for the two distributed energy resources.
Figure 5 shows the resulting marginal (incremental) value of stored energy π ( E T , x ) corresponding to the final iteration of the parameter values shown above in Figure 4. The values are presented in units of the average electricity price c 0 . The markers indicate the obtained dual values and the dashed lines the results of linear regression as explained in conjunction with Equation (16). The value of γ decreases as the lines are lowered, and the value of β increases as the slope becomes steeper. These results illustrate how the expected value of storing an additional unit of energy in the ESS at the end of the planning horizon decreases as the energy storage gets more fully charged. For the case of wind power, the marginal value of stored energy is, furthermore, strongly reduced as the wind speed v T increases, increasing the risk of wind power curtailment in the next planning horizon. A similar but much weaker trend can also be observed for the case of PV, where the marginal value of stored energy at the end of the day (i.e., planning horizon) is only slightly lower for a sunny day than for an overcast day. The explanation is that there is a greater probability that the next day will be sunny if the current day is sunny than if the current day is overcast, and if the next day is sunny, the expected value of having energy stored is less because there is a greater probability that PV generation may have to be curtailed.
Figure 6 shows the expected future value of stored energy α ( E T , x ) corresponding to the marginal values shown in Figure 5 and as given by the parameter values γ ( x ) and β ( x ) determined above. The curvature in Figure 6a increases as the wind speed increases, corresponding to the slope of the marginal value in Figure 5a becoming steeper. These findings for wind power are the same when considering a different distribution grid model and different wind power scenario as in Reference [9]. We have also confirmed that the findings for solar PV remain the same for the distribution grid model in Reference [9] and with irradiance time series for another location in the region.
The result that the expected value of stored energy is less dependent on the state variable underlying PV generation (i.e., on cloud cover conditions) than the state variable underlying wind power generation (i.e., wind speed) can be explained by two main effects. First, the time correlations between one day ( p ) and the next ( p + 1 ) are weaker for clearness than for wind speed: The modeled autocorrelation coefficient is 0.38 for mean wind speed and 0.22 for mean clearness. This means that the effect of taking into account the value of the DG state variable x p is smaller for solar power than for wind power. We have checked that the effect for the PV case is even weaker if we neglect the regime-switching process and simply use the clearness c t s as the state variable x p in our stochastic model instead of r p .
Second, since PV power output is determined by the deterministic diurnal patterns of the expected solar irradiance s t in addition to the clearness c t , PV power output is always zero for a period during the night. In contrast, diurnal patterns for the wind speed v t are not existing for our dataset, as commonly observed in Northern Scandinavia, see for example, Reference [61]. The diurnal pattern for solar power means that even when the energy storage is fully charged at the end of a day (planning horizon), PV power output is zero during the night, and there is almost always enough time to discharge the energy before the power output starts increasing again the next day.
One modeling implication of Figure 6b is that the future value function considering PV generation may be well approximated by a linear function, as assumed without justification by some MPOPF models in the literature (see Table 1). However, such an assumption does not hold when considering wind power generation.

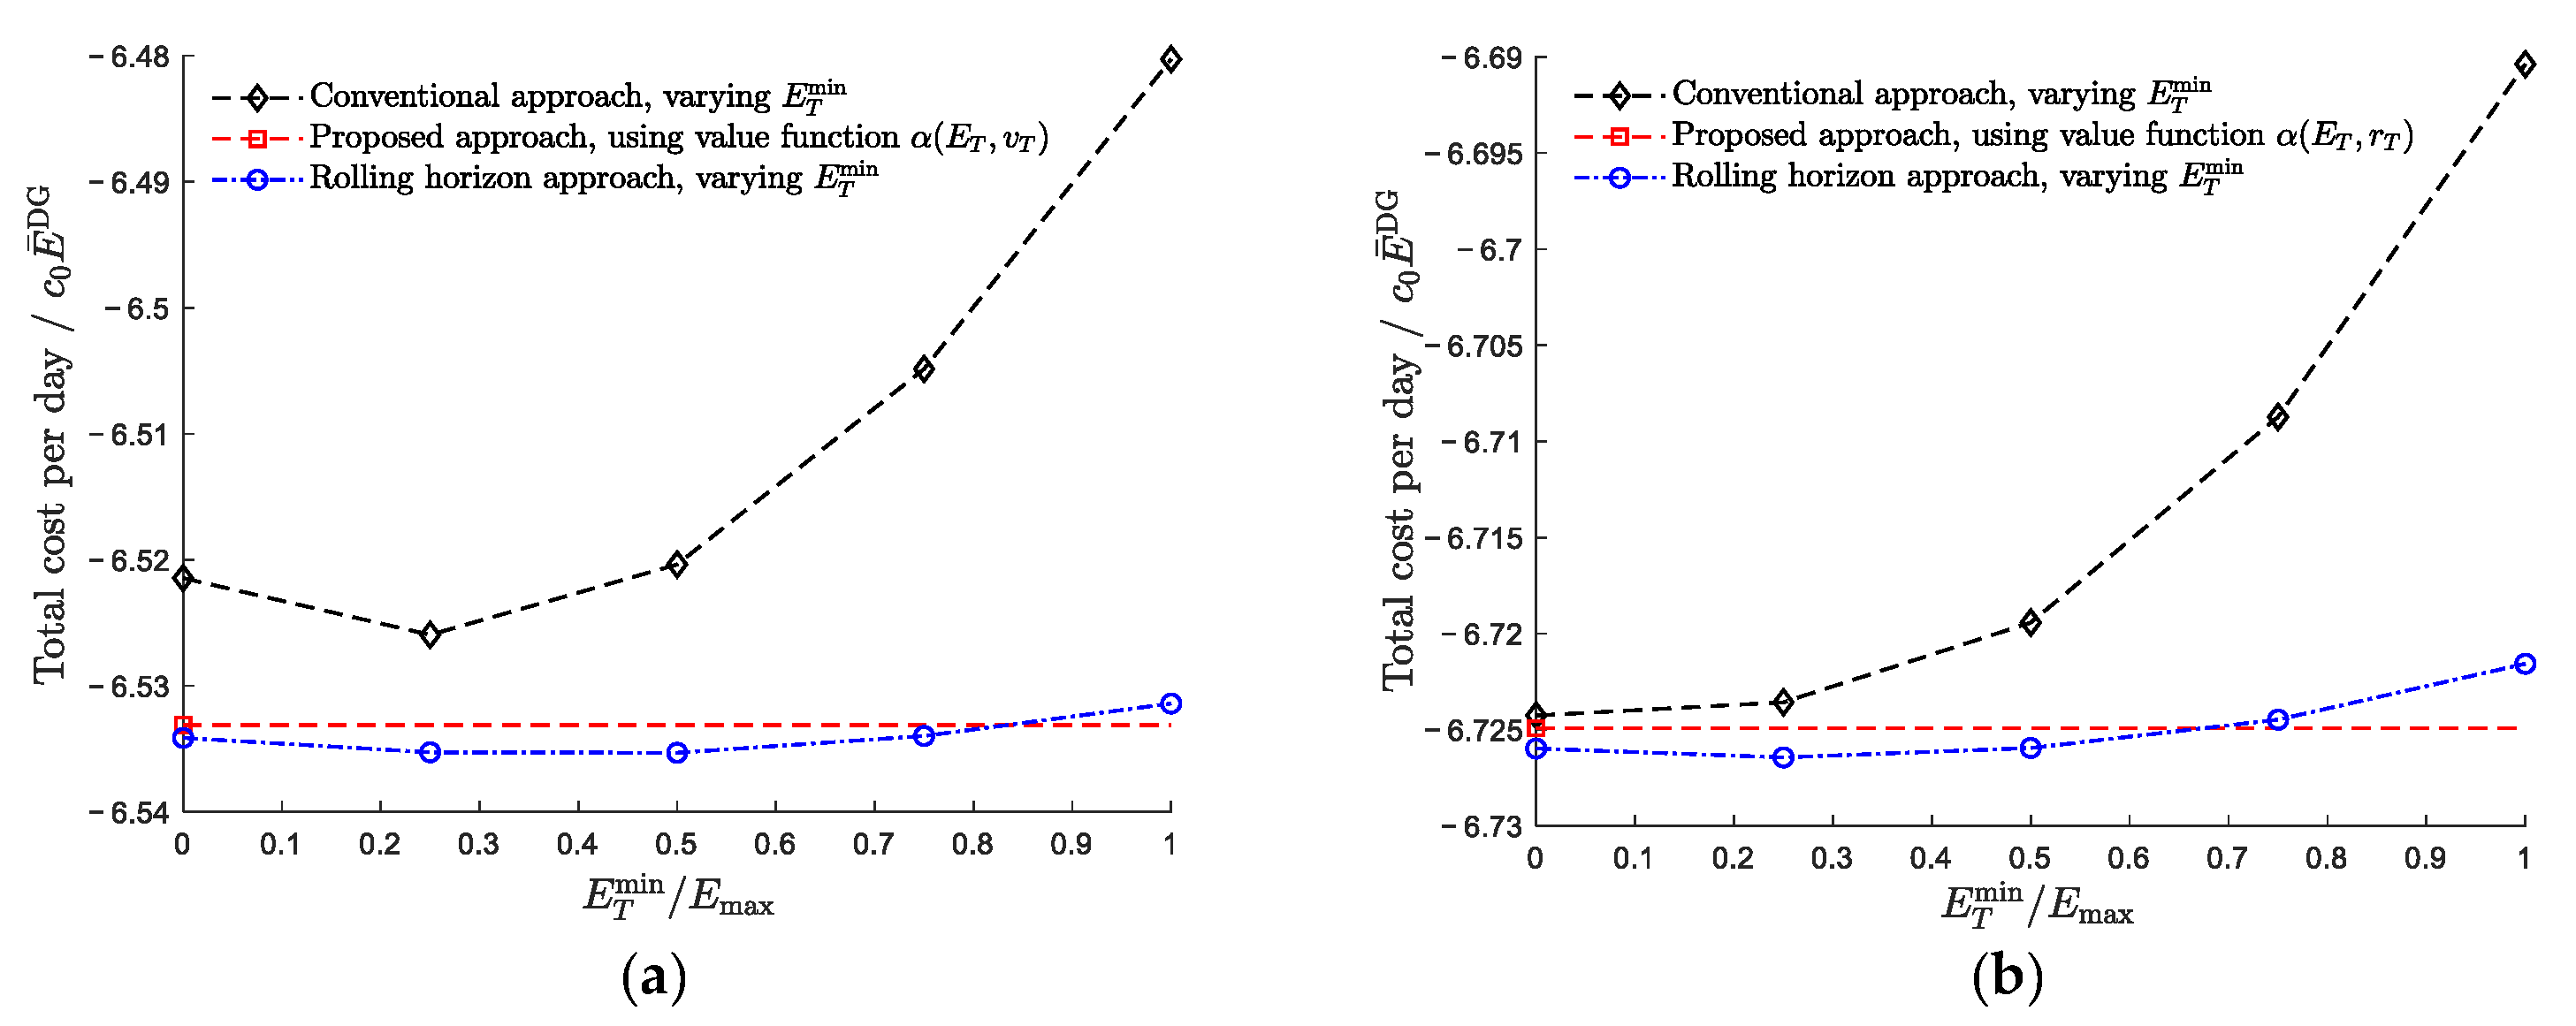
4.3. Evaluation of Energy Storage Scheduling Considering the Value of Stored Energy

We evaluate the use of the value function α ( E T , x ) as a control signal for the scheduling of ESS charging/discharging. As in Reference [9], we evaluate operational strategies by simulating the operation of the distribution system over an extended simulation period spanning multiple 24-h planning horizons. We use historic DG resource time series covering the full simulation period to capture the time correlations of wind speed both within each planning horizon and between subsequent planning horizons. The time periods for these time series are the same as described in Section 4.1. The effectiveness of the distribution system operation is evaluated by the average of the total cost (the objective value) for all planning horizons that are simulated.
In addition to comparing the proposed operational strategy to the conventional strategy requiring E T E T min as in [9], we also consider a rolling horizon approach to ESS scheduling: For the latter operational strategy, the look-ahead horizon for this deterministic MPOPF problem is still T = 24 h but the planning horizon is T < T hours, so only the solution for the MPOPF problem for the first T < T time steps is used when determining the schedule for the current planning horizon. When solving the MPOPF for the next planning horizon, the simulation thus advances by only T time steps, and the current solution for E T is used to initialize E 0 for the next planning horizon. This rolling horizon approach in effect allows for looking T T hours beyond the planning horizon when solving the MPOPF problem and thus implicitly valuates the energy stored at the end of each planning horizon. For the rolling horizon approach, we choose T = 12 h. For the conventional operational strategy without rolling horizon, on the other hand, T = T , and the look-ahead time does not extend beyond the end of the current planning horizon.
Results for the average daily total cost are shown in Figure 7a,b for the case of wind power and for the case of PV, respectively. In order to present the total cost as a convenient unitless measure of the effectiveness of the operational strategy, the results are normalized by the average electricity price c 0 times the average daily potential DG electricity production E ¯ DG . The total cost for the distribution system is negative in both cases because the distribution system is a net exporter of power during the period due to high output from the hydropower generator relative to the load in the system. The ESS is operated in such a way that it reduces the total cost (i.e., increases the social welfare) further by ensuring that more distributed generation (wind or solar power) can be exported from the system and that more power is exported at times of high electricity prices. For both cases, the total cost is shown for the conventional approach for different values of minimum energy E T min stored at the end of the look-ahead horizon for both using the rolling horizon approach and not. These two curves can be compared with the total cost of operating the distribution system when including an explicit function α ( E T , x ) for the expected value of energy stored at the end of the planning horizon. For the latter operational strategy, only E T min = 0 is used in the evaluation, and the result is shown as a horizontal line. The comparison shows that for both wind power and PV, including α ( E T , x ) in the objective function is an effective operational strategy irrespective of which value one chooses for E T min . The total cost obtained with the rolling horizon approach is comparable to explicitly considering α ( E T , x ) and is slightly lower for some values of E T min . This can be understood by realizing that the look-ahead time for which the DG resource time series y is assumed to be deterministic is 24 h for both operational strategies. Therefore, in the rolling horizon approach, the look-ahead horizon extends T T = 12 h beyond the planning horizon each time the MPOPF problem is solved.
Comparing the cases of wind power and PV in Figure 7, one can notice that the total cost overall is lower for PV than for wind power. The main reason for this is that although the potential electric energy production in the system from DG is the same for the two cases, more of this electric energy production can be exported for the PV case than for the wind power case: More than 17% of the potential production is curtailed for the wind power case compared to 1.3% for the PV case. The main reason for this difference is the deterministic diurnal pattern for PV power output, which allows almost all energy that is stored in the ESS at the end of a day to be discharged and exported during the following night. In general, the amount of curtailment also depends on the ratio of the maximal power output to the average power output (i.e., the capacity factor), but for this case the ratio was almost the same for wind and solar power. The diurnal patterns for the PV case mean that how the stored energy E T is accounted for in the operational strategy has a much smaller impact on the level of DG curtailment than for the wind power case. However, the operational strategy also determines the extent to which the ESS can exploit price differences during the day. For instance, in this case with relatively low electricity prices during the night and early morning, an operational strategy requiring a higher value of E T would tend to result in a higher total cost because this energy would have to be exported during low-price hours to make room for new electric energy from DG later in the day.

5. Conclusions and Further Work

We have presented models and methods for accounting for uncertainties in distributed wind and photovoltaic generation beyond the current planning horizon in multi-period optimal power flow models for the operation of distribution systems with energy storage. The variability and stochasticity of wind and solar power have several inherent differences, including differences in autocorrelation, diurnal patterns, and ratio of maximal to average power output. It is shown how these differences imply that different approaches to modeling DG uncertainty are appropriate, and it is demonstrated how these differences impact the end-value of stored energy in the grid. There was a markedly weaker dependence of the future value function on the underlying state variable (cloud cover and wind speed, respectively) for PV than for wind power. Consequently, for the purpose of ESS scheduling, there appears to be less need for sophistication in the modeling of the stochasticity of PV generation beyond the daily planning horizon. Nevertheless, the general methodology presented in this article is not restricted to a particular renewable energy source, planning horizon or time resolution.
The effectiveness of the framework was evaluated in terms of the distribution system operational cost compared to approaches previously considered in the literature. Explicitly accounting for uncertainties in wind and PV generation beyond the current planning horizon is found to be a more effective operational strategy than the conventional approach of requiring the energy stored to be at or above a fixed level E T min at the end of the planning horizon. The proposed approach is furthermore a robust operational strategy in the sense that it does not require a predefined value for a parameter E T min to be effective. The proposed operational strategy is also competitive with an operational strategy based on a rolling horizon approach, although the latter is more effective for most values of the parameter E T min in the case study considered. A rolling horizon approach to solving an ESS scheduling problem may be more straightforward to implement, but it also has drawbacks: It assumes that updated point forecasts are made available at intervals significantly shorter than the look-ahead horizon and does not explicitly consider forecast uncertainties.
Although the paper considers the stochasticity of distributed generation (wind and solar) in particular, the general methodology is also applicable to accounting for the uncertainty in electricity prices and in load. One interesting extension would be to consider the uncertainty in load due to charging of electrical vehicles (EV), for instance for ESSs deployed in conjunction with fast EV chargers with large but variable power demand. Furthermore, the presented MPOPF model also captures the risk of rationing of the load, e.g., in case of microgrid applications, grid congestions, outages, and/or sharp load peaks. Accounting for the expected value of lost load in setting the end-value of stored energy is particularly relevant for ESSs installed for reliability of supply purposes. Finally, considering separate electricity prices for import to and export from the system is relevant for considering how different grid tariffs affect the end-value stored energy in the scheduling of behind-the-meter ESSs.

Supplementary Materials

The following are available online at https://www.mdpi.com/1996-1073/12/7/1231/s1, Table S1: Relative load profile, Table S2: Relative electricity price profile, Tables S3–S8: Solar irradiance time series (for 2010–2015); Table S9: Wind speed time series, Table S10: Power curve function.

Author Contributions

Conceptualization, M.K.; methodology, I.B.S. and M.K.; software, I.B.S.; formal analysis, I.B.S.; investigation, I.B.S.; data curation, I.B.S.; writing—original draft preparation, I.B.S.; writing—review and editing, M.K.; visualization, I.B.S.; supervision, M.K.

Funding

This work has been funded by CINELDI—Centre for intelligent electricity distribution, an 8-year Research Centre under the FME scheme (Centre for Environment-friendly Energy Research, 257626/E20) of the Norwegian Research Council.

Acknowledgments

The authors would like to thank Merkebu Zenebe Degefa for critical comments and proofreading, Salman Zaferanlouei for help with setting up the case study, Sigurd Bjarghov for input on PV modeling, and Arild Helseth for his contributions to previous work that formed the basis for the present work. Øystein Sagosen is acknowledged for his contributions in preparing the original network and load data sets.

Conflicts of Interest

The authors declare no conflict of interest. The funders had no role in the design of the study; in the collection, analyses, or interpretation of data; in the writing of the manuscript, or in the decision to publish the results.

Appendix A

This appendix presents additional details on the case study described in Section 4.1 and Section 4.2. The distribution system grid and load data used for this case study were originally prepared for Reference [62]. The distribution grid is depicted schematically in Figure A1. The LV grid that is included in the model represents the grid supplied by one of the in total 32 distribution transformers (22 kV/230 V); the LV grids supplied by the remaining distribution transformers are not modeled in detail but represented as aggregated loads. Assuming a stiff HV grid, the voltage is fixed to 1 p.u. at the 66-kV side of the 66 kV/22 kV substation. The small-scale hydropower generator connected to the MV grid has nominal power capacity 2.4 MW.
Figure A1. Schematic of distribution grid considered in the case study, prepared using the visualization techniques of [63].
Energies 12 01231 g0a1
The details of the grid model cannot be published due to the confidentiality of the data, but both the MV and the LV grid consist primarily of underground cables (typically TFXP 4x95/240 AL and TFXP 4x50 AL cables, respectively). The model is a single-phase equivalent representation of a balanced three-phase distribution system, which means that possible voltage imbalance effects and effects of phase imbalances on losses in the real grid are not captured [64].
The total load demand in the distribution system varies from a minimum of around 1 MW in summer to a maximum of around 5 MW in winter. The typical weekday in July considered in the case study is represented by using a constant hydropower output of 1.572 MW and an average total distribution system load demand of 1.398 MW. For simplicity and in absence of more detailed load data for the system, the same daily relative load profile for a weekday in July (Supplementary Materials, Table S1) is used for end-users at all load buses. The total system load demand is then distributed on the individual load buses according to their annual energy consumption as in Reference [62]. Representative electricity price profiles for July 2012 (Supplementary Materials, Table S2) are taken from the Nord Pool day-ahead area prices for the same region of Norway as the distribution system [65]. The average electricity price of 13.72 €/MWh for this period was used to set the value of the scale parameter c 0 in the objective function.
The energy storage system is assumed to be located at bus 92 in the LV grid. We consider an energy capacity of E max = 210 kWh and a power capacity of P max ESS = P min ESS = 50   kW , and the charging and discharging efficiency is chosen to be η in = η out = 0.94 . These parameter values correspond to the specifications stated for a Tesla Powerpack battery storage system [66]. We assume that PV generators are located at buses I DG = { 93 , , 97 } in the LV grid. These buses are all adjacent to bus 92, as shown in Figure A1. We furthermore consider PV system parameters η PV , tot = 0.1763 and A i = 170.28   m 2 for all iIDG and a unity power factor for the PV inverters. These parameter choices correspond to a maximum total DG power output of 119.8 kW for the maximum solar irradiance of w = 795   W / m 2 observed in July 2010–2015. The hourly solar irradiance time series (in units W / m 2 ) are available in the Supplementary Materials (Tables S3–S8).
The wind speed time series is based on measured data from 2012 for an actual wind farm in the same area [62]. The wind speed data were extrapolated to a hub height of 30 m assuming a logarithmic wind profile and a roughness length of 0.03 m. The hourly wind speed time series (in units m/s) is available in the Supplementary Materials (Table S9). The power curve used was a downscaled version of a Siemens SWT-2.3-93 [67], and the power curve function f ( v ) . in Equation (17) is shown in Figure A2. (See Supplementary Materials, Table S10; the first column gives the wind speed in units m/s and the second column gives the power output relative to the rated power.) Based on this, and on an average annual electrical energy production E ¯ DG = 589.9 kWh for the PV case, an equivalent installed wind power capacity was found to be 140.2 kW. A turbine with this rated capacity was assumed to be connected to bus 92. The power factor of the wind turbine generator is set to unity as for the PV generators.
Figure A2. Normalized power curve function used for the wind power case study.
Energies 12 01231 g0a2
The resolution of the discrete state Markov model for wind speed is chosen to be 1 m/s. As in Reference [54], the parameters in the algorithm for classifying the clearness regime are determined heuristically, and in our case, τ sunny = 0.4 , τα = 0.5 and τ overcast = 0.135 were chosen. To discretize the clearness states, the same value n clr = 14 is used as in Reference [38]. The synthetic time series y k reproduce the general autocorrelation characteristics of the historic time series, with autocorrelation times around 14.4 h for wind speed and 8–9 h for clearness when averaged over sets { y k } .
Since the fmincon solver used in this case study is a local solver and AC MPOPF is a non-convex optimization problem, one generally cannot guarantee that an obtained solution is globally optimal, as discussed in Section 2, and as was also the case for the previous work on AC MPOPF reviewed there. We also tested the MATPOWER Interior Point Solver [51], and although it typically converged to a feasible solution more quickly than fmincon, this solution was, in a few cases, found to be sub-optimal to the solution obtained by fmincon. In this sense, fmincon thus appears to be a robust solver for this problem, but we found that overriding the default initialization procedure of the solver was necessary to ensure robustness. Further experimentation also showed that robustness and convergence properties were improved by assigning a reference bus in the grid model for each time step t for the multi-period optimization problem and by fixing P i , t rat = 0 in the optimization for cases where it is found that no load rationing occurs. The computation time for the solution of each T = 24 MPOPF problem lies around 5.5 s on a computer with an Intel Core i7-7600U CPU @ 2.8 GHz, MATLAB (R2015b, MathWorks®, Natick, MA, USA), and tolerances (decision variables and objective value) set to 10−6. Based on tests for T [ 12 , 48 ] , the computation time increases with the number of time steps T approximately according to O ( T 1.4 ) .

References

  1. Zubo, R.H.A.; Mokryani, G.; Rajamani, H.-S.; Aghaei, J.; Niknam, T.; Pillai, P. Operation and planning of distribution networks with integration of renewable distributed generators considering uncertainties: A review. Renew. Sustain. Energy Rev. 2017, 72, 1177–1198. [Google Scholar] [CrossRef]
  2. Haque, M.M.; Wolfs, P. A review of high PV penetrations in LV distribution networks: Present status, impacts and mitigation measures. Renew. Sustain. Energy Rev. 2016, 62, 1195–1208. [Google Scholar] [CrossRef]
  3. Engeland, K.; Borga, M.; Creutin, J.-D.; François, B.; Ramos, M.-H.; Vidal, J.-P. Space-time variability of climate variables and intermittent renewable electricity production—A review. Renew. Sustain. Energy Rev. 2017, 79, 600–617. [Google Scholar] [CrossRef]
  4. Shivashankar, S.; Mekhilef, S.; Mokhlis, H.; Karimi, M. Mitigating methods of power fluctuation of photovoltaic (PV) sources—A review. Renew. Sustain. Energy Rev. 2016, 59, 1170–1184. [Google Scholar] [CrossRef]
  5. Malhotra, A.; Battke, B.; Beuse, M.; Stephan, A.; Schmidt, T. Use cases for stationary battery technologies: A review of the literature and existing projects. Renew. Sustain. Energy Rev. 2016, 56, 705–721. [Google Scholar] [CrossRef]
  6. Rocky Mountain Institute. The Economics of Battery Energy Storage; Rocky Mountain Institute: Boulder, CO, USA, 2015. [Google Scholar]
  7. Xia, X.; Elaiw, A.M. Optimal dynamic economic dispatch of generation: A review. Electr. Power Syst. Res. 2010, 80, 975–986. [Google Scholar] [CrossRef]
  8. Sperstad, I.B.; Marthinsen, H. Optimal Power Flow Methods and Their Application to Distribution Systems with Energy Storage—A Survey of Available Tools and Methods; SINTEF Energy Research: Trondheim, Norway, 2016. [Google Scholar]
  9. Sperstad, I.B.; Helseth, A.; Korpås, M. Valuation of stored energy in dynamic optimal power flow of distribution systems with energy storage. In Proceedings of the 2016 International Conference on Probabilistic Methods Applied to Power Systems (PMAPS), Beijing, China, 16–20 October 2016. [Google Scholar]
  10. Pereira, M.V.F. Optimal stochastic operations scheduling of large hydroelectric systems. Int. J. Electr. Power Energy Syst. 1989, 11, 161–169. [Google Scholar] [CrossRef]
  11. Gjelsvik, A.; Røtting, T.A.; Røynstrand, J. Long-term scheduling of hydro-thermal power systems. In Hydropower ’92; Broch, E., Lysne, D.K., Eds.; Balkema: Rotterdam, The Netherlands, 1992; pp. 539–546. [Google Scholar]
  12. Byrne, R.H.; Nguyen, T.A.; Copp, D.A.; Chalamala, B.R.; Gyuk, I. Energy Management and optimization methods for grid energy storage systems. IEEE Access 2017, 6, 13231–13260. [Google Scholar] [CrossRef]
  13. Mohagheghi, E.; Alramlawi, M.; Gabash, A.; Li, P. A survey of real-time optimal power flow. Energies 2018, 11, 3142. [Google Scholar] [CrossRef]
  14. Chandy, K.M.; Low, S.H.; Topcu, U.; Xu, H. A simple optimal power flow model with energy storage. In Proceedings of the 49th IEEE Conference on Decision and Control (CDC), Atlanta, Georgia, 15–17 December 2010; pp. 1051–1057. [Google Scholar]
  15. Lamadrid, A.J.; Mount, T.D.; Thomas, R.J. Scheduling of energy storage systems with geographically distributed renewables. In Proceedings of the Ninth IEEE International Symposium on Parallel and Distributed Processing with Applications Workshops (ISPAW), Busan, Korea, 26–28 May 2011; pp. 85–90. [Google Scholar]
  16. Sojoudi, S.; Low, S.H. Optimal charging of plug-in hybrid electric vehicles in smart grids. In Proceedings of the Power and Energy Society General Meeting, Detroit, Michigan, 24–29 July 2011; pp. 1–6. [Google Scholar]
  17. Gabash, A.; Pu, L. Active-reactive optimal power flow in distribution networks with embedded generation and battery storage. IEEE Trans. Power Syst. 2012, 27, 2026–2035. [Google Scholar] [CrossRef]
  18. Gopalakrishnan, A.; Raghunathan, A.U.; Nikovski, D.; Biegler, L.T. Global optimization of multi-period optimal power flow. In Proceedings of the American Control Conference (ACC), Washington, DC, USA, 17–19 June 2013; pp. 1157–1164. [Google Scholar]
  19. Baker, K.; Zhu, D.; Hug, G.; Li, X. Jacobian singularities in optimal power flow problems caused by intertemporal constraints. In Proceedings of the North American Power Symposium (NAPS), Manhatan, KS, USA, 22–24 September 2013; 2013; pp. 1–6. [Google Scholar]
  20. Celli, G.; Mocci, S.; Pilo, F.; Loddo, M. Optimal integration of energy storage in distribution networks. In Proceedings of the PowerTech, Bucharest, Romania, 28 June–2 July 2009; pp. 1–7. [Google Scholar]
  21. Carpinelli, G.; Celli, G.; Mocci, S.; Mottola, F.; Pilo, F.; Proto, D. Optimal integration of distributed energy storage devices in smart grids. IEEE Trans. Smart Grid 2013, 4, 985–995. [Google Scholar] [CrossRef]
  22. Murillo-Sanchez, C.E.; Zimmerman, R.D.; Anderson, C.L.; Thomas, R.J. Secure planning and operations of systems with stochastic sources, energy storage, and active demand. IEEE Trans. Smart Grid 2013, 4, 2220–2229. [Google Scholar] [CrossRef]
  23. Zimmerman, R.D.; Murillo-Sanchez, C.E. Matpower Optimal Scheduling Tool (MOST) User’s Manual; Power Systems Engineering Research Center (PSERC): Tempe, AZ, USA, 2016. [Google Scholar]
  24. Khanabadi, M.; Moghadasi, S.; Kamalasadan, S. Real-time optimization of distribution system considering interaction between markets. In Proceedings of the Industry Applications Society Annual Meeting, Orlando, FL, USA, 6–11 October 2013; pp. 1–8. [Google Scholar]
  25. Levron, Y.; Guerrero, J.M.; Beck, Y. Optimal power flow in microgrids with energy storage. IEEE Trans. Power Syst. 2013, 28, 3226–3234. [Google Scholar] [CrossRef]
  26. Tant, J.; Geth, F.; Six, D.; Tant, P.; Driesen, J. Multiobjective battery storage to improve pv integration in residential distribution grids. IEEE Trans. Sustain. Energy 2013, 4, 182–191. [Google Scholar] [CrossRef]
  27. Gill, S.; Kockar, I.; Ault, G.W. Dynamic optimal power flow for active distribution networks. IEEE Trans. Power Syst. 2014, 29, 121–131. [Google Scholar] [CrossRef]
  28. Moghadasi, S.; Kamalasadan, S. Real-time optimal scheduling of smart power distribution systems using integrated receding horizon control and convex conic programming. In Proceedings of the Industry Application Society Annual Meeting, Vancouver, BC, CA, 5–9 October 2014; pp. 1–7. [Google Scholar]
  29. Bozchalui, M.C.; Sharma, R. Operation strategies for energy storage systems in distribution networks. In Proceedings of the PES General Meeting | Conference & Exposition, 2014, National Harbor, MD, USA, 27–31 July 2014; pp. 1–5. [Google Scholar]
  30. Maffei, A.; Meola, D.; Marafioti, G.; Palmieri, G.; Iannelli, L.; Mathisen, G.; Bjerkan, E.; Glielmo, L. Optimal Power Flow model with energy storage, an extension towards large integration of renewable energy sources. In Proceedings of the 19th World Congress on International Federation of Automatic Control, Cape Town, South Africa, 2014; pp. 9456–9461. [Google Scholar]
  31. Maffei, A.; Srinivasan, S.; Iannelli, L.; Glielmo, L. A receding horizon approach for the power flow management with renewable energy and energ storage systems. In Proceedings of the 2015 AEIT International Annual Conference, Naples, Italy, 14–16 October 2015; pp. 1–6. [Google Scholar]
  32. Maffei, A.; Srinivasan, S.; Meola, D.; Palmieri, G.; Iannelli, L.; Holhjem, Ø.H.; Marafioti, G.; Mathisen, G.; Glielmo, L. A cyber-physical systems approach for implementing the receding horizon optimal power flow in smart grids. IEEE Trans. Sustain. Comput. 2018, 3, 98–111. [Google Scholar] [CrossRef]
  33. Meyer-Huebner, N.; Suriyah, M.; Leibfried, T. On efficient computation of time constrained optimal power flow in rectangular form. In Proceedings of the PowerTech 2015, Eindhoven, The Netherlands, 29 June–2 July 2015; pp. 1–6. [Google Scholar]
  34. Nguyen, N.T.A.; Le, D.D.; Bovo, C.; Berizzi, A. Optimal power flow with energy storage systems: Single-period model vs. multi-period model. In Proceedings of the PowerTech 2015, Eindhoven, The Netherlands, 29 June–2 July 2015; pp. 1–635. [Google Scholar]
  35. Fortenbacher, P.; Zellner, M.; Andersson, G. Optimal sizing and placement of distributed storage in low voltage networks. In Proceedings of the Power Systems Computation Conference (PSCC), Genoa, Italy, 20–24 June 2016; pp. 1–7. [Google Scholar]
  36. Fortenbacher, P.; Mathieu, J.L.; Andersson, G. Modeling and optimal operation of distributed battery storage in low voltage grids. IEEE Trans. Power Syst. 2017, 32, 4340–4350. [Google Scholar] [CrossRef]
  37. Geth, F.; Leyder, S.; Marmol, C.D.; Rapoport, S. The PlanGridEV distribution grid simulation tool with EV models. In CIRED Workshop 2016; CIRED: Helsinki, Finland, 2016. [Google Scholar]
  38. Grillo, S.; Pievatolo, A.; Tironi, E. Optimal storage scheduling using Markov decision processes. IEEE Trans. Sustain. Energy 2016, 7, 755–764. [Google Scholar] [CrossRef]
  39. Marley, J.F.; Hiskens, I.A. Multi-period AC-QP optimal power flow including storage. In Proceedings of the 19th Power Systems Computation Conference (PSCC), Genoa, Italy, 20–24 June 2016; 2016; pp. 1–7. [Google Scholar]
  40. Zaferanlouei, S.; Korpås, M.; Farahmand, H.; Vadlamudi, V.V. Integration of PEV and PV in Norway using multi-period ACOPF—Case study. In PowerTech 2017; IEEE: Manchester, UK, 2017. [Google Scholar]
  41. Zaferanlouei, S.; Korpås, M.; Hashemipour, N.; Aghaei, J.; Farahmand, H. Computational efficiency assessment of multi-period AC optimal power flow including energy storage systems. In Proceedings of the International Conference on Smart Energy Systems and Technologies (SEST), Sevilla, Spain, 10–12 September 2018; pp. 1–6. [Google Scholar]
  42. Nick, M.; Cherkaoui, R.; Paolone, M. Optimal planning of distributed energy storage systems in active distribution networks embedding grid reconfiguration. IEEE Trans.Power Syst. 2018, 33, 1577–1590. [Google Scholar] [CrossRef]
  43. Kourounis, D.; Fuchs, A.; Schenk, O. Towards the next generation of multiperiod optimal power flow solvers. IEEE Trans. Power Syst. 2018, 33, 4005–4013. [Google Scholar] [CrossRef]
  44. Knezović, K.; Soroudi, A.; Keane, A.; Marinelli, M. Robust multi-objective PQ scheduling for electric vehicles in flexible unbalanced distribution grids. IET Gener. Transm. Distrib. 2017, 11, 4031–4040. [Google Scholar] [CrossRef] [Green Version]
  45. Karagiannopoulos, S.; Roald, L.; Aristidou, D.; Hug, G. Operational planning of active distribution grids under uncertainty. In Proceedings of the 10th Bulk Power Systems Dynamics and Control Symposium—IREP 2017, Espinho, Portugal, 27 August–1 September 2017. [Google Scholar]
  46. Theo, W.L.; Lim, J.S.; Ho, W.S.; Hashim, H.; Lee, C.T. Review of distributed generation (DG) system planning and optimisation techniques: Comparison of numerical and mathematical modelling methods. Renew. Sustain. Energy Rev. 2017, 67, 531–573. [Google Scholar] [CrossRef]
  47. Graabak, I.; Korpås, M. Variability characteristics of european wind and solar power resources—A review. Energies 2016, 9, 449. [Google Scholar] [CrossRef]
  48. Díaz-González, F.; Sumper, A.; Gomis-Bellmunt, O.; Villafáfila-Robles, R. A review of energy storage technologies for wind power applications. Renew. Sustain. Energy Rev. 2012, 16, 2154–2171. [Google Scholar] [CrossRef]
  49. Lai, C.S.; Jia, Y.; Lai, L.L.; Xu, Z.; McCulloch, M.D.; Wong, K.P. A comprehensive review on large-scale photovoltaic system with applications of electrical energy storage. Renew. Sustain. Energy Rev. 2017, 78, 439–451. [Google Scholar] [CrossRef]
  50. Crespo Del Granado, P.; Wallace, S.W.; Pang, Z. The impact of wind uncertainty on the strategic valuation of distributed electricity storage. Comput. Manag. Sci. 2016, 13, 5–27. [Google Scholar] [CrossRef]
  51. Zimmerman, R.D.; Murillo-Sanchez, C.E.; Thomas, R.J. MATPOWER: Steady-state operations, planning, and analysis tools for power systems research and education. IEEE Trans. Power Syst. 2011, 26, 12–19. [Google Scholar] [CrossRef]
  52. Pereira, M.V.F.; Pinto, L.M.V.G. Multi-stage stochastic optimization applied to energy planning. Math. Program. 1991, 52, 359–375. [Google Scholar] [CrossRef]
  53. Brokish, K.; Kirtley, J. Pitfalls of modeling wind power using Markov chains. In Proceedings of the2009 IEEE/PES Power Systems Conference and Exposition, 15–18 March 2009; pp. 1–6. [Google Scholar]
  54. Ramakrishna, R.; Scaglione, A.; Vittal, V. A stochastic model for short-term probabilistic forecast of solar photo-voltaic power. arXiv, 2017; arXiv:1706.05445. [Google Scholar]
  55. Kaplanis, S.N. New methodologies to estimate the hourly global solar radiation: Comparisons with existing models. Renew. Energy 2006, 31, 781–790. [Google Scholar] [CrossRef]
  56. Bjarghov, S.N. Utilizing EV Batteries as a Flexible Resource at End-User Level. Master’s Thesis, Norwegian University of Science and Technology, Trondheim, Norway, 2017. [Google Scholar]
  57. Roberts, J.J.; Mendiburu Zevallos, A.A.; Cassula, A.M. Assessment of photovoltaic performance models for system simulation. Renew. Sustain. Energy Rev. 2017, 72, 1104–1123. [Google Scholar] [CrossRef]
  58. Zimmerman, R.D.; Murillo-Sanchez, C.E.; Thomas, R.J. MATPOWER’s extensible optimal power flow architecture. In Proceedings of the Power & Energy Society General Meeting 2009, Calgary, AB, Canada, 26–30 July 2009; pp. 1–7. [Google Scholar]
  59. INVADE Consortium. D9.1: Review of Existing Business Models and Storage Technology Database. 2017. Available online: https://h2020invade.eu/wp-content/uploads/2017/04/D9.1-Review-of-existing-business-models-and-storage-technology-database.pdf (accessed on 3 July 2018).
  60. MathWorks®. Optimization Toolbox™ User’s Guide; 2015b ed.; MathWorks®: Natick, MA, USA, 2015. [Google Scholar]
  61. Holttinen, H.; Rissanen, S.; Larsen, X.; Løvholm, A.L. Wind and Load Variability in the Nordic Countries; VTT: Espoo, Finland, 2013. [Google Scholar]
  62. Sagosen, Ø. Analysis of Large Scale Integration of Electric Vehicles in Nord-Trøndelag. Master’s Thesis, Norwegian University of Science and Technology, Trondheim, Norway, 2013. [Google Scholar]
  63. Cuffe, P.; Keane, A. Visualizing the electrical structure of power systems. IEEE Syst. J. 2017, 11, 1810–1821. [Google Scholar] [CrossRef]
  64. Usman, M.; Coppo, M.; Bignucolo, F.; Turri, R. Losses management strategies in active distribution networks: A review. Elect. Power Syst. Res. 2018, 163, 116–132. [Google Scholar] [CrossRef]
  65. Nord Pool. Market data|Nord Pool. Available online: https://www.nordpoolgroup.com (accessed on 23 May 2018).
  66. Tesla. Powerpack|Commercial and Utility Energy Storage Solutions. Available online: https://www.tesla.com/powerpack (accessed on 9 June 2018).
  67. Staffell, I. Wind Turbine Power Curves; Imperial College: London, UK, 2012. [Google Scholar]
Figure 1. Illustration of iterative solution approach to an infinite-horizon multi-stage decision problem solved in determining the future value function.
Energies 12 01231 g001
Figure 2. Schematic illustration of the model of stochasticity in wind speed beyond the planning horizon t = T .
Energies 12 01231 g002
Figure 3. Schematic illustration of the model of stochasticity in clearness (above) and solar irradiance (below) beyond the planning horizon t = T .
Energies 12 01231 g003
Figure 4. Convergence of value function parameters for different wind speeds for the case of wind power (a) and for different cloud cover conditions (clearness regimes) for the case of PV (b).
Energies 12 01231 g004
Figure 5. Marginal value of stored energy at the end of the planning horizon as a function of the amount of stored energy for different wind speeds for the case of wind power (a) and for different cloud cover conditions (clearness regimes) for the case of PV (b).
Energies 12 01231 g005
Figure 6. Estimated future value of stored energy as a function of the amount of stored energy for different wind speeds for the case of wind power (a) and for different cloud cover conditions (clearness regimes) for the case of PV (b).
Energies 12 01231 g006
Figure 7. Comparison of approaches to considering the expected value of stored energy at the end of the planning horizon for distributed wind power (a) and PV (b) generation in terms of the total cost of the distribution system over the simulation period.
Energies 12 01231 g007
Table 1. Overview of literature on AC multi-period optimal power flow models.
ReferenceOPF Model and ApplicationHandling of Stored Energy At The End Of Planning Horizon
[14]AC MPOPF with small voltage angle approximation (convex problem), formulated as a finite-horizon optimal control problemLinear penalty function in the objective function (proportional to the deviation of the amount of stored energy at the end of the planning horizon from the maximal energy capacity); 24 h horizon
[15]AC MPOPF; applied to power system with wind powerRolling horizon (24 h look-ahead horizon)
[16]AC MPOPF for optimal charging of EVsRequiring that all EVs are charged at the end of 10 h planning horizon
[17]AC MPOPF (coupled real-reactive) E T = E 0 (24 h horizon or 120 h horizon)
[18]Semidefinite programming relaxation of AC MPOPF E T E T min (8 h horizon)
[19]AC MPOPF; applied to power system with wind powerRolling horizon (10 × 5 min look-ahead horizon)
[20]Scheduling of ESS (not including power flow constraints) solved by dynamic programming; genetic algorithm for sizing and siting problem as an outer loop (including checking of power flow constraints) E T = E 0 (24 h horizon)
[21]AC MPOPF with linearized power flow constraints; genetic algorithm for sizing and siting problem as an outer loop E T = E 0 (24 h horizon)
[22]Stochastic security-constrained AC MPOPF; implemented in the MATPOWER Optimal Scheduling Tool [23]Linear penalty function (that is a linear combination of charged and discharged power for all time steps)
[24]AC MPOPFRolling horizon (24 h look-ahead horizon)
[25]Dynamic programming search in the time domain combined with conventional PF solver in the network domain; grid-connected microgrid with DGn/a (72 h horizon)
[26]Combined ESS scheduling and sizing problem for distribution system with PV; no power flow constraints but including linearized voltage constraints from base case power flow sensitivities E T E T min (16 week horizon)
[27]AC MPOPF; applied to distribution system with DG E T = E 0 (24 h horizon)
[28]AC MPOPF with second-order cone programming relaxationRolling horizon (72 h look-ahead horizon)
[29]AC MPOPF for unbalanced 3-phase distribution network E T = E 0 (24 h horizon)
[30]AC MPOPF for distribution system with wind power Linear penalty function in the objective function for each time step (proportional to the deviation of the amount of stored energy from the maximal energy capacity); 24 h horizon
[31,32]AC MPOPF; applied to distribution system with wind powerLinear penalty function in the objective function for each time step proportional to energy stored, and implicitly through rolling horizon (24 h look-ahead horizon)
[33]AC MPOPFn/a (72 h horizon)
[34]AC MPOPF (comparing with solving each time step in isolation) E T = E 0 (24 h horizon)
[9]AC MPOPF; applied to distribution system with wind power (which is treated as stochastic for the next planning horizon)Explicit valuation of the future value of stored energy at the end of 24 h planning horizon
[35]MPOPF with linearized AC power flow equations for radial distribution grids; compared with full AC power flown/a (up to 744 h horizon)
[36]Robust MPOPF with linearized AC power flow equations for radial distribution grids; applied to LV grid with high PV penetrationRolling horizon (24 h look-ahead horizon) combined with real-time control within each hour
[37]AC MPOPF for radial distribution systems based on convex relaxation; optimizing EV charging Requiring fully charged EV at the end of the 24 h planning horizon [31]
[38]Finite-horizon optimal policy problem for Markov decision process for distribution system with PV generation, solved by stochastic dynamic programming, explicitly checking for violations of power flow constraintsTaken into account within each daily planning horizon through stochastic dynamic programming approach (not explicitly discussing the storage level at the end of the planning horizon)
[39]AC-Quadratic Programming MPOPFA quadratic penalty function penalizing the deviation from a reference storage level (with penalty coefficient and reference storage level varying over the day); up to 8 h horizons
[40]AC MPOPF; optimal scheduling of EVs in distribution system with PV and wind powerRequiring fully charged EV at the end of the 33 h planning horizon
[41]AC MPOPF, applied to minimizing generation costsn/a (2 h horizon)
[42]Conditionally exact convex MPOPF embedded in model for optimal sizing and siting with stochastic load, electricity prices and PV; applied to distribution system with PV E T = E 0 (24 h horizons for separate days with time series for the stochastic variables)
[43]AC MPOPF E T = E 0 (up to 2880 time steps)
[44]Robust AC MPOPF for unbalanced 3-phase distribution network, applied to EV charging schedulingRequiring fully charged EV at the end of the 24 h planning horizon
[45]Chance-constrained AC MPOPF for radial distribution systemsn/a (24 h planning horizon)

