Abstract
To overcome profitability deterioration in executing steel price projects, companies are seeking overseas expansion, which increases market size while reducing profit certainty. Special purpose companies (SPCs) have been found to better manage these risks through tolling agreements which transfer the local pricing volatility risks (raw material, steel sales, licensing and income tax) to the project sponsor. The energy market has benefited from policy changes allowing the use of the tolling model, finding an increase in profitability for both project sponsors and SPCs through more effective risk sharing. While successes have been published in the energy, gas, and highway sectors, the tolling model’s efficacy has yet to be tested on the steel sector. As such, this research adds to the existing body of knowledge by testing the financial feasibility of using the tolling model on three million ton/year capacity steel projects. The data analyzed has been collected from “Company A”, a company with 50 years of domestic and 20 years international steel-iron plant project execution and operation experience. An economic analysis is performed on the best, most likely, and worst-case cost/revenue scenarios of a virtual project (which represents the average of all Company A projects) and two Company A projects under construction/operation. The findings support the use of the tolling model in volatile markets, showing a net present value (NPV) profitability increase of up to $940 versus the traditional project company model under worst case market conditions. However, the traditional project company model was found to be superior in best case market conditions. With these findings, international steel companies are able to consider alternative financing structures when executing projects in volatile markets, potentially resulting in greater project sponsor and SPC profit.
1. Introduction
With the recent global economic recovery, retirement of aging facilities, and mergers/company reorganizations, global demand for new international investments in steel is expected to increase [1]. In years past, most steel investors enjoyed low risks and superior market conditions due to a high demand and a focus on domestic versus international projects. This negated the need for complex investment platforms. However, the recent global recovery has equated to most opportunities being international, posing significant risks for steel plant investors entering unknown markets. To mitigate said risks, steel investment companies organize a consortium of local companies rather than make direct, singular overseas investments. The result is a multi-company contract agreement which creates an entity known as a special purpose company (SPC), with the steel industry typically using a project company model [2,3]. While an apt investment platform, the tolling agreement has been found to better handle and allocate project risks across contracting companies [4]. Existing research has investigated the use of tolling agreements to govern energy, gas, and highway SPC-sponsor contracts. This publication builds off of these findings, filling a gap in the body of knowledge by researching the impact of the tolling investment platform’s impact on steel investor profitability.
Figure 1 and Figure 2 show a comparison of the project company and tolling agreement models. With the traditional project company model, the project sponsor seeks out project opportunities and financing from international governments and/or lenders. In this model, this is the extent of the project sponsor’s responsibilities, as seen in Table 1. Alternatively, the SPC is responsible for constructing the plant, procuring the raw material, using said material to produce the steel, and generate revenue from selling their production. The SPC holds the procurement and sales risks. Figure 1 shows the project company model breakdown which includes a project sponsor which includes both the government and lender(s) and a SPC which includes a project sponsor, a feedstock supplier, subcontractors, and a buyer.
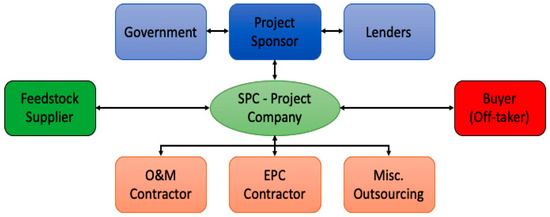
Figure 1.
Project company model (modified from [4]).
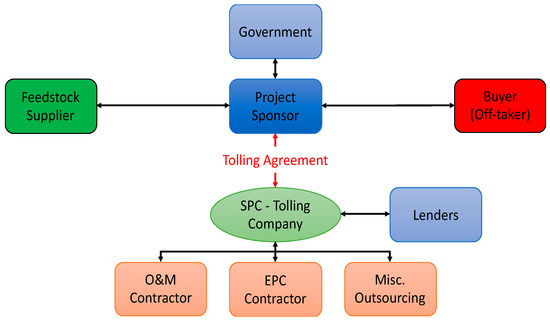
Figure 2.
Tolling model (modified from [4]).

Table 1.
Responsibility matrix (modified from [4]).
Alternatively, with the tolling model the SPC tolling company is separated from political (government), procurement, and sales risks but is still responsible for the plant construction and operation and maintenance. The tolling company also becomes responsible for the project financing. The tolling model is shown in Figure 2 and includes the same entities as the project company model but with different contractual relationships.
The features of a tolling agreement that are atypical for traditional SPC agreements include the tolling fee and guaranteed production requirements. The tolling fee is the method of payment for steel produced and consists of the start-up, capacity, and variable payments, described in greater detail in Section 2.1. The guaranteed production requirements govern the capacity payment and set the minimum and maximum production quantity and quality [5].
Concerning the responsibility breakdown of each model, Table 1 shows that in the project company model, all of the project responsibilities fall on the singular SPC entity. Alternatively, with the tolling model the project sponsor contracts with and is responsible for the purchasing of raw materials and selling of steel. The tolling company then manages the contractors and is responsible for acquiring project financing [4]. The tolling model allows for greater risk sharing, reducing the associated SPC risk premiums. Per existing literature, predicted risk-sharing benefits are as follows: (1) the raw material and sales risks are transferred to the project sponsor; (2) the SPC is able to receive a stable revenue stream through the received tolling fee; and (3) ownership of the steel plant can fall solely on the project sponsor as the tolling company is only involved in production and maintenance, which all result in (4), superior project financing due to the associated risk reduction [4]. These advantages are also the model’s disadvantage as the SPC’s ability to earn high profit margins associated with smart procurement practices is reduced. Another disadvantage is the complex tolling fee agreement versus the typical sales and purchasing agreements [4].
Although existing literature has cited the potential advantages of the tolling model, there has been performed no research on its use in the steel industry as it is still an unfamiliar concept. Rather, existing research has been focused on the tolling model’s efficacy in other industries such as the highway, energy, and gas sectors. Rouwendal and Verhoef [6] presented the basic principles of the tolling agreement as it is used in the highway sector, including the link between congestion pricing and road capacity, policies that affect tolling pricing, and a model which shows these variables’ impact on economic efficiency. De Borger et al. [7] presented strategic owner investment and pricing decisions using game theory to test the differing tolling strategies’ impacts on expected capacity, user demand, and associated revenue. Wirahadikusumah et al. [8] identified risks associated with the tolling contract including estimation accuracy of future revenue, overloading of the asset, and inadequate feasibility studies. Chung and Hensher [9] investigated the differences in how the private and public sectors valuate risk, presenting a risk profile index to capture the influence as perceived by each sector. Alasad and Motawa [10] developed a system dynamics model to assess demand risks which impact the revenue received on toll road projects.
Many studies have performed economic assessments on the tolling agreement’s use for public-private partnership highway projects, finding the risk-sharing model to be fiscally attractive to owners. Rouhani et al. [11] found tolling methods were able to maximize profitability and overall system efficiency in road pricing. This method is most advantageous when public agencies desire to have greater risk ownership and where significant revenue variability is expected [12]. When the owners take greater ownership of risk on highly congested roads (at least 30-min deadlock at peak hours without a toll), the owner could increase revenue by 70% versus traditional models [13]. Chen et al. [14] present a modified, hybrid tolling model which includes a greater level of risk/reward sharing across the public and private entities. Although most studies promote the tolling model as more efficient, one highway study found the tolling model to be less than optimal. This study finds the owner best equipped to manage all but the construction risks, and transferring finance, maintenance, and/or operation responsibilities to a contractor to be less than preferable [15]. While these studies are of merit, the highway industry is very different than gas, energy, and steel as the owner serves the public rather than financiers or corporations and has a near impossibility of failure (e.g., bankruptcy).
Studies within the energy sector have also found tolling agreements to be a valid risk management technique [16]. Shi-Jie and Xia [17] used a Monte Carlo simulation to assess the effects of different power price models on the valuation of tolling agreements, presenting an option pricing approach to maximize owner-received value. Another study proposes a tolling agreement in the power sector in which the energy manager of the power plant (project sponsor) has the option to switch the plant on or off to maximize revenue based on the fluctuations of electricity pricing [18]. Woo et al. [19] discuss the impact the discount rate has on economic evaluations of tolling agreements, proposing the use of a risk-adjusted discount rate and the variables to consider. Ryabchenko and Uryasev [20] introduce a new approach for pricing energy derivatives using a tolling agreement, presenting an algorithm depicting the optimal operating strategy reflecting power plant operational constraints. Woo et al. [21] propose a regression-based approach to benchmarking a reasonable tolling fee in the power sector. Wiser et al. [22] assessed 27 renewable and gas-fired electricity tolling agreements, comparing the risk profiles of each finding renewable energy contracts to best mitigate fuel price volatility and environmental compliance risks. With renewable energy power generation increasing its market share, one study also investigated the impact renewable energy has on existing natural gas-fired power generation tolling agreements [23]. Deng and Xia [24] studied the effects of different electricity price assumptions had on the valuation of tolling contracts using Monte Carlo simulation as an assessment tool. The tolling method has also been found to successfully allocate risks on gas [25] and shipping ports [26] and provide SPC’s with financial benefits related to income tax [27].
The authors have performed a holistic review of existing tolling model literature, focusing on publications which perform economic analyses. The most relevant studies of this review have been shown above. Within existing literature, multiple studies have been performed on the tolling model’s application to the gas, power, and highway sectors. Steel plant projects are structured differently and have different raw material, product sales, manufacturing, construction, and legislative risks. The impact of changing the risk ownership structure of a steel plant project through a tolling agreement will be different than other sectors. There have been publications dedicated to solving the economic pressures felt by steel producing companies including optimal risk-assessment processes [28], optimal investment timing [29], risk-sharing feedstock agreements [30], and creating financing [31] but minimal on the impact of differing SPC agreements. The lack of publications on the tolling agreement’s use on steel projects represents a gap in the literature. The authors only found two publications filling this gap, presenting the tolling model’s use on steel mills. In a presentation of tolling agreements used in Russian industries, Avdasheva [32] found 94% of steel projects use a tolling agreement. While the study performs an economic analysis of the tolling model, it is based on the full Russian industrial sector and does not isolate the steel sector [32]. Another publication presents a case study of an Indonesian steel plant which used a tolling agreement as a way to introduce billet steel byproduct into the steel production to maximize profit [33]. While the findings are of merit, they focus on the cost impacts of introducing the byproduct and do not isolate the impacts the tolling agreement have on project profitability [33]. This study fills a gap in the existing body of knowledge by assessing the efficacy of tolling agreements on steel plant projects. The paper’s unique contribution is in having only one variable, the use of a tolling agreement. Isolating the tolling agreement as the variable of study and focusing on the steel industry strengthen and enable generalizability of the findings to the population of international steel projects.
2. Data Collection and Research Methodology
The authors collected data Company A who provided detailed production, costs, and revenue data on overseas steel plant projects. Company A, a global steel-iron producing company with over 50 years of domestic and 20 years of international steel plant project execution experience, is represented as the sponsor in this paper’s model. As of 2015, they had a steel output of 46 million tons per year, supplying the automotive, steel construction, shipbuilding, energy, industrial machine, and home appliance sectors. They currently operate two integrated steel mills in South Korea, operate a joint venture with a US company in California, have invested in the development of an integrated steel mill in Indonesia and Brazil, and have recently begun development on steel mills in Indonesia, Iran, and India. As of 2011, they have a net income of $3.22 billion USD, operating income of $8.00 billion USD, and $60.87 billion USD with nearly 30,000 employees. Company A was chosen based on the following attributes desirable for this study: (1) substantial experience in the steel industry as the fourth largest steel producer in the world; (2) experience in all stages of steel production including investing, planning/designing, construction, and operation; (3) both domestic and international operational experience; (4) currently have projects in the development phase; and (5) desire to use the tolling model. The research methodology was guided by Company A and is detailed below in Figure 3 and the following subsections.
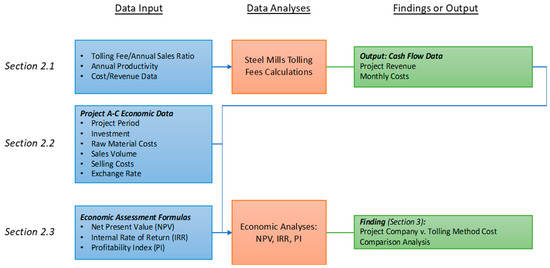
Figure 3.
Research methodology.
2.1. Steel Mill Project Costs
Within the energy and gas sectors, the tolling fee does not have an internationally accepted value. Rather, the value is determined on a contract by contract basis. This is typically based on industry trends and the project sponsor and tolling company’s negotiation results. The tolling fee consists of a capacity, variable, and start-up payment as seen below in Equation (1):
For this paper, the authors assumed that the tolling fee was 35% of the annual sales. This was based on a study performed on the tolling fee of a one- and 10-year energies contract, results shown below in Table 2 and Table 3 [24]. Each table shows the results of 2000 and 1000 runs of the Monte Carlo Sample Paths related to electricity generation prices and gas prices, respectively.
Table 2.
Tolling fee of one-year energies contract (modified from [24]).
Table 3.
Tolling fee of 10-year energies contract (modified from [24]).
The remaining research methodology process was based on data collected on one virtual project (Project A) and two projects currently in the development phase (Projects B and C). These are defined in greater detail in Section 2.2. The following process uses data from Project A. The remaining data and analyses can be found in the cited report [34]. Based on data collected from Company A, a typical plant capacity is 3,000,000 tons/year with average annual sales of $2B USD. Using the annual sales and ratio from Table 2, the tolling fee is estimated to be $668M USD, exact value used for this project shown below in Equation (2):
where:
- Annual Sales = $1,907,501,817 USD
- Tolling Fee = $667,625,636 USD
From the resultant tolling fees and Equation (1), the authors calculated the capacity, variable, and startup payments. The variable payment was used to compensate for the difference between scheduled capacity and actual delivered capacity arising from unplanned operations and maintenance. However, published tolling fees show that this amount is typically very small because in the tolling model, the sponsor is responsible for the raw material costs that account for most of the operating costs [35,36]. The variable cost, therefore, was ignored for this study. The startup payment was estimated based on the commissioning costs on a one-time basis depending on the capacity of the plant that a domestic steel company applies to overseas steel plants. Based on Company A data collected, the authors set the startup payment at $9,890,969 USD. The capacity payment was then assumed to be $657,734,667 using the known startup payment and Equation (1). The monthly fixed payment, used in calculating cash flow, was then calculated using monthly productions collected from Company A and the following Equation (3) [35,36]:
where:
- MFP = Monthly Fixed Payment = (shown in Table 4)
Table 4. Monthly fixed payments.
- CPR = Capacity Payment Rate = $1850 per ton-year
- FOMR = Fixed O&M Rate = $315 per ton-year
- MAF = Monthly Allocation Factor = (shown in Table 4)
- MCC = Monthly Contract Capacity = (shown in Table 4)
- AA = Availability Adjustment = (shown in Table 4)
Table 4 shows the resultant monthly fixed payments used for Project A of this study.
Finally, the authors collected general revenue, cost, pre-tax profit, corporate tax, and after-tax profit for each of the case study projects. Figure 4 shows the income statement of Project A, tolling model, and best-case scenario. This model is based on the collected production, sales, investment, and construction and project period. Note that the only change from the traditional to tolling model is the annual sales. Figure 5 shows the cash flow analysis of Project A, tolling model. Once again, this is the tolling model base project company method and is modified as applicable for the tolling method.
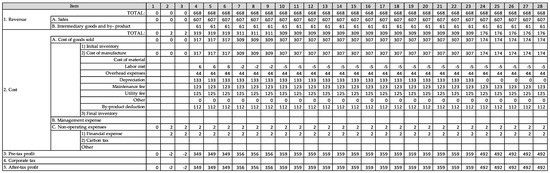
Figure 4.
Cost/revenue analysis of typical three mil ton/year steel project ($M USD).
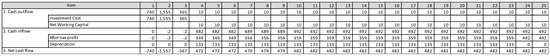
Figure 5.
Cash flow of typical three mil ton/year steel project ($M USD).
2.2. Project Case Study Data Description
The authors analyzed data collected from Company A executed projects for the case studies presented in this section. Table 5, Table 6 and Table 7 show the economic data used for this publication [34]. From the data collected, three project scenarios were developed with varying initial investments, material costs, productivity, selling prices, and exchange rates. The three scenarios are defined as the best, most likely, and worst-case scenarios. Due to the significant investment required of steel projects, Company A only invests in projects when the market is very healthy or in a “best case” condition. Company A, as an institution, have identified the minimum required economic variables for them to enter into a project at the point of investment (known as FID or the final investment decision) given the project size and location. These economic variables are represented as the “best case” scenario. Company A’s corporate model is based on the expectation that the market will maintain a “best case” condition through plant operation approximately 50% of the time. The remaining 50% of the time, after construction is complete and the plant is operational, Company A has planned for the market to have worsened to a state identified as “most-likely”. The “worst case” scenario represents a significant decrease in the market conditions and only occurs during a global economic crisis. Company A’s corporate model is based on this occurring once every 15 to 20 years. However, due to the 2008 global recession and recent raw material pricing volatility Company A has executed nearly half of their projects in worst-case conditions in the last ten years. This has caused Company A significant financial strains and is the driving force for them seeking alternative investment platforms such as the tolling model.
Table 5.
Economic data for virtual Project A.
Table 6.
Economic data for case study Project B.
Table 7.
Economic data for case study Project C.
Table 5 represents these scenarios for a virtual overseas case-study steel project which produces approximately three million tons per year. This virtual project, or Project A, represents the expected “average” economic data for a new steel mill of said annual production. The data was collected from interviews with Company A representatives and data collected from their operational steel plants located in South Korea, Indonesia, Brazil, and the US. The best-case scenario is the average “best-case” of all locations as defined by Company A management, ‘most-likely’ scenario is the average economic conditions Company A experiences when the market worsens, and the worst case are based on the average “worst-case” conditions experienced by Company A management for a steel plant of this size.
The authors also collected data on two industry projects executed by Company A. Table 6 shows a steel plant project located in India, Project B, whose SPC agreement was signed in August of 2015. The project is a 1.5 million ton/year steel project in the western part of India’s Satarda-Maharashtra area currently under consideration. The best-case scenario represents the market conditions and the worst-case scenario is as was estimated by the Company A project management team, both at FID. The equity ratio used is 35% equity, 65% debt with the steel company’s equity interest at 19.99%.
Table 7 shows a steel plant project located in Iran, Project C, SPC agreement signed February of 2016. The project is a 1.5 million ton/year steel project in the Parsian Free Economic Zone, the southern coastal region of Iran. Similar to Project B, the best-case scenario represents the market conditions and the worst-case scenario. The equity ratio used is 40% equity, 60% debt with equity interest at 13%.
2.3. Economic Analysis
To compare the economic performance of the project company and tolling models, the authors calculated the net present value (NPV), internal rate of return (IRR), and profitability index. NPV calculates the present value of future cash flows using a discount rate. For this paper, if the NPV is greater than $0, the investment is considered economically viable. NPV is calculated in Equation (4):
where:
- CFI = Cash Flow Input
- CFO = Cash Flow Output
- r = discount rate (12.5% for project company model; 11.9% for tolling model)
- t = time or payback period (20 years project company model; 25 years tolling model)
The IRR is the discount rate at which the present value of the future cash inflows from the investment is equal to the present value of the cash outflow. If the IRR is greater than the identified target discount rate, the investment is considered to be economical. The IRR is calculated in Equation (5).
where:
- CFI = Cash Flow Input
- CFO = Cash Flow Output
- r = discount rate (12.5% for project company model; 11.9% for tolling model)
- t = time or payback period (20 years project company model; 25 years tolling model)
The target rate of return desired for the IRR is calculated using the Equation (6).
where:
- WACC = Weighted Average Cost of Capital
- E = Firm’s Equity
- D = Firm’s Debt
- V = E + D
- Re = Cost of Equity
- Rd = Cost of Debt
- Tc = Corporate Tax Rate
- Country Risk = Moody’s Default Country Risk Spread
- Industrial Risk = Risk Premium (Table 8)
Table 8. Industry risk premiums (modified from [28]).
The industrial risk premium values are shown in Table 8 as defined by Company A’s investment business economic analysis [37]. As can be seen, the value can be negative or positive with a maximum of +/−2%.
For tolling model, the authors used a target IRR of 12.5% with the variables shown in Table 9.
Table 9.
Target internal rate of return (IRR).
In addition, the PI is the ratio of the present value of future cash flows to the initial investments of the project. In essence, this is a cost/benefit analysis. For this paper, a project is considered viable when PI is greater than 1. The PI is calculated in Equation (7):
where:
- NPV = Net Present Value (Equation (4))
- I = Initial Investment Required
Finally, a pay-back period was calculated, which is the period of time required to collect the same amount of investment as the basis for project evaluation. As can be seen, the authors took a deterministic approach based on a range of market conditions (best, most-likely, and worst-case scenarios) versus a probabilistic approach. The best, most-likely, and worst-case scenarios represent the expected distributions assigned to each economic variable. An alternative approach would have been to analyze the input data using a probabilistic analysis, often through Monte Carlo simulations. As the tolling model’s use in infrequent to non-existent in international steel projects, the data was not deemed to be of suitable quality for generating a probabilistic distribution.
3. Findings
The authors tested the value-adding of the tolling model from the perspective of the project sponsor. The first step in performing this was to apply the project company and tolling model to the best, most likely, and worst cases of case study Project A. Table 10 shows the results of the project company model economic evaluation. The targeted IRR was 12.5% and the payback period was 20 years. As can be seen, the best case would be considered economically feasible with an IRR greater than 12.5%, a positive NPV, and a PI over one. However, the most likely and worst-case scenarios were not economically feasible using a project company economic platform. In summary, Table 10 shows that the project company model is only profitable in the best-case scenarios with IRR of 15.8% and NPV of 556 Mil USD, but the most likely and worst-case scenarios fail to secure profitability.
Table 10.
Project A project company model economic evaluation. NPV: net present value.
Table 11 depicts the same Project A best, most likely, and worst-case economic evaluation results. The targeted IRR was assumed to be 11.9%. As in the case of the project company model, the best-case economic evaluation of the tolling model was expected to be appropriate because the anticipated sales, tolling fee, and lower expected risks. However, it is interesting to note that the project company model results in $328 million USD greater NPV than the tolling model in the best-case scenario. The most likely case had a poorer investment and operation environment yet, unlike the project company model, the tolling model still meets the project profitability criteria. The tolling company profitability is still healthy because the responsibility for raw material price risk, product selling price and sales volume risk, which is considered as the most critical risk excluding investment cost, belongs to the sponsor and not tolling company. Finally, in the worst-case scenario, where the factor for critical risk is more severely set, the tolling model shows a negative NPV value even though the IRR satisfies the criterion. Overall, the economic performance of the tolling model was superior to the project company model for all three cases of the case study.
Table 11.
Tolling model economic evaluation for virtual Project A.
The authors next performed an analysis on an Indian project that Company A has considered for project execution. The targeted IRR is assumed to be 12.5% and the payback period 20 years. Table 12 shows a comparison of the project company and tolling model showing the latter to have a clear financial superiority. Both models would succeed in the best-case scenario, but only the tolling model would be financially viable for the worst-case scenario. Once again, while both are financially viable for the best-case scenario, the project company model results in $228 million USD greater NPV than the tolling model in the best-case scenario. Based on only this analysis, Company A would be advised to pursue a traditional agreement in a strong/steady market and a tolling agreement in a volatile/weak market with the project sponsor for Project B. However, as the current volatile environment making the worst-case scenario highly likely, Company A would be advised to pursue a tolling agreement with for Project B.
Table 12.
Project B project company vs. tolling model economic evaluation.
Finally, the authors performed an analysis on an Iranian project that Company A has considered for project execution. The targeted IRR is assumed to be 11.9% and the payback period 25 years. Table 13 shows a comparison of the project company and tolling model. Like Project B, the tolling model is less profitable than the project company model when the investment environment is favorable. However, in a situation where the investment environment changes drastically, the worst-case scenario, negative economic evaluation results are obtained in the project company model, while stable profitability is confirmed in the Tolling Model. Similar to Project B, assuming the current market will maintain a “worst case” status, Company A would be advised to pursue a tolling agreement with for Project C.
Table 13.
Project C project company vs. tolling model economic evaluation.
One of the greater impacts to a project’s success is the country risk. For this paper, the authors used a country risk of 3.58 for Project A based on Company A’s domestic work. Figure 6, below, depicts the sensitivity of the NPV based on changes in the country risk factor. As can be seen, the greater the country risk, or country instability, the lower the NPV. What is also seen from Figure 6 is that the tolling model has a much lower variance from the best to worst case scenarios than the traditional project company model. From the data and this finding, we can summarize that the tolling model reduces the risks of losses in instable countries.
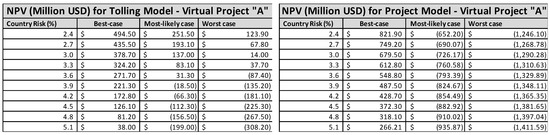
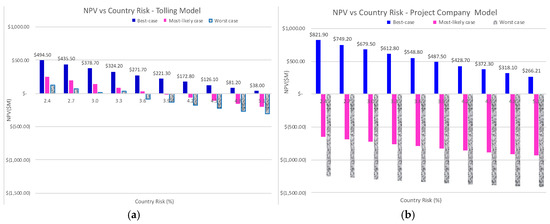
Figure 6.
NPV sensitivity: (a) tolling model; and (b) project company model.
4. Discussion
In an attempt to maintain revenue in the wake of the 2008 financial crisis, Company A and many steel companies have pursued international projects and/or volatile projects with various risks related to both upstream and downstream activities. A recent study found the top five most impactful risks of international projects to be as follows: procurement plans for raw materials, design errors and omissions, poor plant performance, technology ownership, and spill prevention technology [38]. To manage these risks, the Project Management Body of Knowledge proposes the following risk management steps: (1) identify risks; (2) qualitative risk analysis; (3) quantitative risk analysis; and (4) plan risk response [39]. After steps 1 to 3, the SPC and projects sponsor chose ways in which to handle the identified risks; accept, avoid, transfer, or mitigate the risks [39]. The choice of which investment plan to use (project company or tolling model) occurs in the plan risk response stage, after risks are identified and both a qualitative and quantitative risk assessment occurs. As stated in the introduction, the tolling model’s effectiveness spawns from efficient risk-sharing [4] which can also be stated as accurately transferring each risk to the party which is most competent to handle said risk [39]. Finding that the tolling model results in a more favorable economic condition under the most likely and worst-case scenarios means that the project sponsor is better equipped to handle volatile raw material, steel sales, and income tax risks (Table 1) for international steel projects.
5. Conclusions
The highway, energy, and gas sectors have found success in the tolling economic platforms to minimize or hedge these risks and the steel industry must follow suite. As such, this research investigates the financial feasibility of using the tolling model as a new investment model for executing overseas steel plant project. The assessment was made based on data collected from Company A, a steel-iron project sponsor with over 50 years of domestic and 20 years of international project experience. This study has found that the project company model results in superior profitability for the project company in healthy or “best case” markets. For the virtual project, which is an average of all Company A experiences, the project company model resulted in a $328 million USD increase in NPV profits versus the tolling model. Similarly, for the Indian and Iranian case studies, the project company model resulted in a $3.7 and $4.2 million USD increase, respectively, in NPV profits versus the tolling model. Company A and many other steel project sponsors attempt to only invest in projects with healthy markets and have experienced success with this model from the late 90’s to 2008. However, since the 2008 recession the raw material market and/or steel sales have been extremely volatile, and the market has significantly worsened.
Company A has experienced “worst-case” economic conditions on approximately half of their projects from 2008 to 2018. With the “worst-case” economic conditions, this study found the tolling model to be an improvement to the project company model. In the worst-case scenario of the Indian and Iranian steel project, the tolling model was found to result in an NPV profit $932 and $940 million USD, respectively, increase in comparison the project company model. However, both the project sponsor and tolling models had NPV profit losses in the worst-case scenario of the virtual project. These project savings are caused by transferring the political, raw material price, final product sales volume, and sales price risks to the project sponsor in volatile markets. The tolling model also allows the tolling company a stable revenue source (the tolling fee) over the duration of the agreement. Due to this reduction in risks, the tolling company also benefits from the ability to attain funding under low pricing and long-term conditions. Furthermore, the sponsor can borrow under non-recourse conditions. The findings of this research support the tolling model as a win-win for both tolling company and sponsor in volatile markets. However, when the market is more favorable, the traditional project company model produces superior profitability.
Company A’s existing investment strategy and operational processes are similar to other Asian countries such as South Korea, Taiwan, Japan, and Singapore. As such, this study’s findings are generalizable to steel companies in these countries. These findings also suggest that there may be advantages of using the tolling model for any first-world steel company. However, further research would be required to confirm. The limiting factor in generalizing findings to wealthy North American, European, or Australian nations is that Company A benefits from cheap labor and material, in-country ore production, and an in-country increase in steel demand which is not experienced by said nations.
Limitations and Future Work
The tolling model is still an unfamiliar concept in the steel industry. As such, all investigative research of this study was performed on projects executed with the traditional model. Future research will include analyzing executed tolling model steel project cases and compare them to executed traditional model steel projects of equivalent size and scope. Furthermore, the three presented scenarios (best, most likely, and worst) assumed in the project company and tolling model economic evaluation do not take all cases into consideration. The accuracy of the economic forecasting related to the volatility should be increased in future research through inquiring the investment and operation environment at the time of approval and at the time of start-up. Once more accurate data is available, a probabilistic assessment will be performed to better understand the ranges in potential profitability and sensitivity to market variables. Finally, overseas steel plant projects to which the tolling model can be applied may be very small. Problems can arise with sponsors who are ignorant of the tolling model or are less capable of risk hedging. However, this can be solved by maximizing common interest and nurturing a mutual trust between the project sponsor and tolling company.
Author Contributions
D.H.K. developed the concept of the study with necessary analysis and drafted the manuscript. I.H.J. assisted the study and supported the editing of the manuscript. D.A. enhanced the study contents and added academic feedback on the manuscript. E.B.L. revised the manuscript and supervised the overall work.
Funding
The authors acknowledge that this research was sponsored by the Ministry of Trade Industry and Energy (MOTIE/KEIT) Korea through the Technology Innovation Program funding for: (1) Artificial Intelligence Big-data (AI-BD) Platform for Engineering Decision-support Systems (Grant Number: 20002806); and (2) Intelligent Project Management Information Systems (i-PMIS) for Engineering Projects (Grant Number: 10077606).
Acknowledgments
The authors would like to thank So-Won Choi (a Ph. D. candidate in POSTECH University) for her academic feedback on this paper. The views expressed in this paper are solely those of the authors and do not represent those of any official organization.
Conflicts of Interest
The authors declare no conflict of interest.
Abbreviations
| ADF | Augmented Dickey-Fuller Test |
| EIB | Europe Investment Bank |
| FERC | Federal Energy Regulatory Commission |
| FHP | Fired Hour Payment |
| GSA | Gas Sales Agreement |
| IRR | Internal Ratio of Return |
| JMA | Joint Marketing Agreement |
| JOA | Joint Operating Agreement |
| LBA | Land Boundary Agreement |
| LDCs | Local Distribution Companies |
| MFP | Monthly Fixed Payment |
| NPV | Net Present Value |
| OATT | Open Access Transmission Tariff |
| PSC | Production Sharing Contract |
| PURPA | Public Utility Regulatory Policy Act |
| QF | Qualifying Facility |
| SPA | Sales and Purchase Agreement |
| TSA | Tolling Service Agreement |
| VOM | Variable Operation & Maintenance |
References
- Investment Mine. Historical Nickel Prices and Price Chart. Available online: http://www.infomine.com/investment/metal-prices/nickel/all/ (accessed on 25 June 2018).
- D’Costa, A.P. The Global Restricting of the Steel Industry; Routledge: London, UK, 1999. [Google Scholar]
- Harris, M.; Raviv, A. The Theory of Capital Structure. J. Financ. 1991, 46, 297–355. [Google Scholar] [CrossRef]
- Miles, S.R. Legal Structures and Commercial Issues for LNG Export Projects. 2013. Available online: https://slideplayer.com/slide/5720447/ (accessed on 12 January 2019).
- Energy Services, Inc. Capacity Sale and Tolling Agreement; Energy Services, Inc.: Houston, TX, USA, 2000. [Google Scholar]
- Rouwendal, J.; Verhoef, E.T. Basic economic principles of road pricing: From theory to applications. Transp. Policy 2006, 13, 106–114. [Google Scholar] [CrossRef]
- De Borger, B.; Dunkerley, F.; Proost, S. Strategic investment and pricing decisions in a congested transport corridor. J. Econ. 2007, 62, 294–316. [Google Scholar] [CrossRef]
- Wirahadikusumah, R.D.; Sapitri; Susanti, B.; Soemardi, B.W. Risk in Government’s Estimate for Toll Road: Based on Investors’ Perspective. Int. J. Adv. Sci. Eng. Inf. Technol. 2018, 8, 475–482. [Google Scholar] [CrossRef]
- Chung, D.; Hensher, D.A. Modelling Risk Perceptions of Stakeholders in Public-Private Partnership Toll Road Contracts. Abacus 2015, 51, 437–483. [Google Scholar] [CrossRef]
- Alasad, R.; Motawa, I. Dynamic demand risk assessment for toll road projects. Constr. Manag. Econ. 2016, 33, 799–817. [Google Scholar] [CrossRef]
- Rouhani, O.M.; Gao, H.O.; Geddes, R.R. Policy lessons for regulating public–private partnership tolling schemes in urban environments. Transp. Policy 2015, 41, 68–79. [Google Scholar] [CrossRef]
- Rouhani, O.M.; Geddes, R.R.; Do, W.; Gao, H.O.; Beheshtian, A. Revenue-risk-sharing approaches for public-private partnership provision of highway facilities. Case Stud. Transp. 2018, 6, 439–448. [Google Scholar] [CrossRef]
- Basar, G.; Cetin, M. Auction-based tolling systems in a connected and automated vehicles environment: Public opinion and implications for toll revenue and capacity utilization. Transp. Res. C Emerg. Technol. 2017, 81, 268–285. [Google Scholar] [CrossRef]
- Chen, Q.; Shen, G.; Xue, F.; Xia, B. Real Options Model of Toll-Adjustment Mechanism in Concession Contracts of Toll Road Projects. J. Manag. Eng. 2018, 34, 4017040. [Google Scholar] [CrossRef]
- Szeto, W.; Lo, H.K. Time-dependent transport network improvement and tolling strategies. Transp. Res. A Policy Pract. 2008, 42, 376–391. [Google Scholar] [CrossRef]
- Shi-Jie, D.; Oren, S. Electricity derivatives and risk management. Energy 2006, 31, 940–953. [Google Scholar]
- Shi-Jie, D.; Xia, Z.D. Pricing the hidden options in power contracts: A case with tolling agreements. In Proceedings of the 2003 IEEE Power Engineering Society General Meeting (IEEE Cat. No.03CH37491), Toronto, ON, Canada, 13–17 July 2003. [Google Scholar]
- Baldi, F. Switch, switch, switch! A regime-switching option-based model for valuing a tolling agreement. Eng. Econ. 2010, 55, 268–304. [Google Scholar] [CrossRef]
- Woo, C.; Horii, B.; Chait, M.; Horowitz, I. Should a Lower Discount Rate Be Used for Evaluating a Tolling Agreement than Used for a Renewable Energy Contract? Electr. J. 2008, 21, 35–40. [Google Scholar] [CrossRef]
- Ryabchenko, V.; Uryasev, S. Pricing Energy Derivatives by Linear Programming: Tolling Agreement Contracts. J. Comput. Financ. 2011, 14, 73–126. [Google Scholar] [CrossRef]
- Woo, C.-K.; Olson, A.; Orans, R. Benchmarking the Price Reasonableness of an Electricity Tolling Agreement. Electr. J. 2004, 17, 65–75. [Google Scholar] [CrossRef]
- Wiser, R.; Bachrach, D.; Bolinger, M.; Golove, W. Comparing the risk profiles of renewable and natural gas-fired electricity contracts. Renew. Sustain. Rev. 2004, 8, 335–363. [Google Scholar] [CrossRef]
- Woo, C.-K.; Horowitz, I.; Horii, B.; Orans, R.; Zarnikau, J. Blowing in the wind: Vanishing payoffs of a tolling agreement for natural-gas-fired generation of electricity in Texas. Energy J. 2012, 207–229. [Google Scholar] [CrossRef]
- Deng, S.-J.; Xia, Z. A real options approach for pricing electricity tolling agreements. Int. J. Inf. Technol. Decis. Mak. 2006, 5, 421–436. [Google Scholar] [CrossRef]
- Noonan, T.; Martin, M. Project Financing of an LNG Import Terminal as a Tolling Facility. In Proceedings of the 2001 International Conference & Exhibition on Liquified Natural Gas, Seoul, Korea, 14–17 May 2001. [Google Scholar]
- Chen, D.; Chen, Y.; Han, B. Toll Policy for Load Balancing Research Based on Data Mining in Port Logistics. J. Coast. Res. 2015, 73, 82–88. [Google Scholar] [CrossRef]
- Brich, C. Tolling Companies and Their Income Taxation Features. J. Aust. Tax. 2002, 5, 213. [Google Scholar]
- Yoo, J.I.; Lee, E.B.; Choi, J.-W. Balancing Project Financing and Mezzanine Project Financing with Option Value to Mitigate Sponsor’s Risks for Overseas Investment Projects. Sustainability 2018, 10, 1498. [Google Scholar] [CrossRef]
- Kim, Y.G.; Lee, E.B. A Probabilistic Alternative Approach to Optimal Project Profitability Based on the Value-at-Risk. Sustainability 2018, 10, 747. [Google Scholar] [CrossRef]
- Kim, Y.; Shin, K.; Ahn, J.; Lee, E.B. Probabilistic Cash Flow-Based Optimal Investment Timing Using Two-Color Rainbow Options Valuation for Economic Sustainability Appraisement. Sustainability 2017, 9, 1781. [Google Scholar] [CrossRef]
- Jeong, H.H.; Lee, E.B.; Alleman, D. Ore Composition’s Impact on Smelting Profitability: An Optimum Pricing Index Model for Long-Term Nickel Ore Feedstock Purchasing Agreements. Appl. Sci. 2018, 8, 2100. [Google Scholar] [CrossRef]
- Avdasheva, S. Tolling arrangements in the Russian industries: An institutional perspective. J. Econ. Bus. 2002, 5, 217–240. [Google Scholar]
- Gupito, W.; Larso, D. Improving Business Synergy Between PT. Krakatau Steel (Persero) Tbk and PT. Krakatau Wajatama Using Byproduct Billet Steel Plant to Increase Consolidated Profit. Indones. J. Bus. Adm. 2013, 2, 1888–1896. [Google Scholar]
- Kim, D.H. Developing and Applying Tolling Model to Steel Plant Project. Master’s Thesis, Pohang University of Science and Technology, Graduate School of Engineering Mastership, Pohang, Korea, 2015. [Google Scholar]
- Louisville Gas and Electric Company. Kentucky Utilities Company Commonwealth of Kentucky before the Public Service Commission; Louisville Gas and Electric Company: Louisville, KY, USA, 2014. [Google Scholar]
- Pacific Gas and Electric Company. Example form of Tolling Agreement for Consideration under CAES Protocol. 2015. Available online: https://www.pge.com/includes/docs/pdfs/b2b/wholesaleelectricsuppliersolicitation/CAES/Tolling_PPA_PGE_CAES.pdf (accessed on 28 March 2019).
- Park, H.J. Investment Business Economics Analysis. Bachelor’s Thesis, Pohang Iron and Steel Company Group University, Pohang, Korea, 2014. [Google Scholar]
- Kim, M.S.; Lee, E.B.; Jung, I.H.; Alleman, D. Risk Assessment and Mitigation Model for Overseas Steel-Plant Project Investment with Analytic Hierarchy Process—Fuzzy Inference System. Sustainability 2018, 10, 4780. [Google Scholar] [CrossRef]
- Project Management Institute. A Guide to the Project Management Body of Knowledge, 6th ed.; Project Management Institute: Newtown Square, PA, USA, 2013. [Google Scholar]


© 2019 by the authors. Licensee MDPI, Basel, Switzerland. This article is an open access article distributed under the terms and conditions of the Creative Commons Attribution (CC BY) license (http://creativecommons.org/licenses/by/4.0/).