Article

Installation and Operation of a Solar Cooling and Heating System Incorporated with Air-Source Heat Pumps

1
Faculty of Architecture, Civil Engineering College, Ningbo University, Fenghua Street 818, Ningbo 315211, China
2
Fraunhofer Institute for Environmental, Safety, and Energy Technology UMSICHT, Osterfelder Strasse 3, 46047 Oberhausen, Germany
*
Author to whom correspondence should be addressed.
Energies 2019, 12(6), 996; https://doi.org/10.3390/en12060996
Submission received: 21 January 2019 / Revised: 4 March 2019 / Accepted: 11 March 2019 / Published: 14 March 2019
(This article belongs to the Special Issue Solar Heating and Cooling 2019)

Abstract

:
A solar cooling and heating system incorporated with two air-source heat pumps was installed in Ningbo City, China and has been operating since 2018. It is composed of 40 evacuated tube modules with a total aperture area of 120 m2, a single-stage and LiBr–water-based absorption chiller with a cooling capacity of 35 kW, a cooling tower, a hot water storage tank, a buffer tank, and two air-source heat pumps, each with a rated cooling capacity of 23.8 kW and heating capacity of 33 kW as the auxiliary system. This paper presents the operational results and performance evaluation of the system during the summer cooling and winter heatingperiod, as well as on a typical summer day in 2018. It was found that the collector field yield and cooling energy yield increased by more than 40% when the solar cooling and heating system is incorporated with heat pumps. The annual average collector efficiency was 44% for cooling and 42% for heating, and the average coefficient of performance (COP) of the absorption chiller ranged between 0.68 and 0.76. The annual average solar fraction reached 56.6% for cooling and 62.5% for heating respectively. The yearly electricity savings accounted for 41.1% of the total electricity consumption for building cooling and heating.

1. Introduction

In recent years, building energy consumption has been steadily increasing with the development of the economy and the improvement of living standards in China. It occupies 30% of the total energy consumption in China [1], 50–60% of which is consumed by air conditioning in public buildings in hot summer and cold winter zones [2]. Conventional air conditioning systems use electricity to drive a compressor to circulate a refrigerant which absorbs and removes heat from the space. The rising air conditioner usage not only results in a considerable increase in power consumption, but also in a power peak demand during the hottest hours in summer, which has a strong negative impact on the existent power grid and often causes power blackouts in summer.
Solar cooling technology has been developed to reduce the increasing electricity consumption for air conditioning and to shift the peak load on hot summer days. This technology uses solar energy to drive a refrigerator to cool the space and reduces the electricity consumption. Many researchers have focused on solar cooling systems and different types have been investigated. As of 2014, about 1200 solar cooling systems have been installed worldwide, most of them in Europe [3]. It is considered that about 71% of the installations are solar absorption cooling systems, and 13% are adsorption systems. Some of the installed systems have been studied in the literature, both in terms of thermodynamic and economic performance. For example, Syed et al. [4] tested a flat-plate collector-driven 35 kW single-effect LiBr–water absorption chiller in Madrid. The maximum instantaneous coefficient of performance (COP) (COP is the ratio of cooling energy yield and heat supplied by the generator), daily average COP and average COP during the period of 20 days of monitoring (25/07/2003 to 19/08/2003) were 0.60, 0.42, and 0.34, respectively. Pongtornkulpanich et al. [5] tested a 10-ton single effect LiBr–water absorption chiller powered by an evacuated tube solar collector in Thailand where the solar collector delivered 81% of the thermal energy for the chiller. Rosiek and Batlles [6] analyzed the behavior of the solar-assisted air-conditioning system installed in the CIESOL building to maximize the use of solar thermal energy supplying the cooling and heating system. The average values of coefficient of performance and the cooling capacity in summer months were 0.6 and 40 kW, respectively. Bermejo et al. [7] built and tested a solar/gas-driven double effect LiBr–water absorption system in Spain. The system could be driven by a direct-fired natural gas burner or by pressurized hot water delivered from a linear concentrating Fresnel collector. The average and maximum daily efficiencies of the solar collector were 0.35 and 0.4, respectively. The daily average COP of the chiller was 1.1–1.25. Lizarte et al. [8] experimentally studied a vacuum flat-plate collector-driven 4.5 kW air-cooled single-effect LiBr–water absorption chiller in Madrid. It was found that the mean COP and solar coefficient of performance (SCOP) (the ratio of cooling energy yield and the total solar energy available) were 0.53 and 0.06, respectively. Balghouthi et al. [9] presented a solar absorption cooling installation in Tunisia where it was found that the coefficient of performance (COP) ranged between 0.8 and 0.91 during the installation running, while the solar coefficient of performance (SCOP) was between 0.1 and 0.43. The drain backup night storage improved the average solar fraction (SF) of the system, which increased from 0.54 to 0.77.
Hang et al. [10] built a double-effect solar absorption cooling test facility and investigated the experimentally based energy performance of the system. The results showed that the system could provide adequate cooling for a test facility between 11 a.m. and5 p.m. on both sunny and cloudy days. The daily average collector efficiency was in the range of 36% to 39%. The average coefficient of performance (COP) of the LiBr-water absorption chiller was between 0.91 and 1.02 with an average of 1.0, and the daily solar COP was approximately at 0.374. Marc et al. [11] presented a dynamic modeling of a single-effect absorption chiller working with a LiBr–water solution used in a solar cooling installation operating without any backup systems (hot or cold). The numerical model was based on the mass and energy balances of each component, equations of state, and equations of heat transfers. Experimental validation elements were proposed to validate pressures and temperatures of the chiller. Xu et al. [12] studied a variable effect LiBr–water absorption chiller based upon a real developed 50 kW prototype. The results showed that the COP increased from 0.69 to 1.08 under generation temperature from 95 °C to 120 °C. The chiller performance will be higher under high chilled water temperature, low cooling water temperature, proper frequency of generation pump, optimized high pressure absorber valve opening, and high frequency of hot water pump.
Since the first solar cooling system was installed in Shenzhen in 1987, there have been over 10 demonstration projects put into service in China. The first system in Shenzhen provided cooling in summer to guestrooms with a total area of 80 m2 by applying two single-stage LiBr–water absorption chillers and a hot water boiler as the auxiliary heat source. It was found that the LiBr–water absorption chiller could not always operate at its nominal rating during periods of low solar radiation and high cooling water temperature as the temperature in the storage could not always be maintained at temperatures as high as 88–90 °C throughout the day even on clear sunny days [13]. Two of the most famous solar absorption cooling systems of Tianpu and Beiyuan were built in Beijing in 2001 and 2005, respectively. The Tianpu demonstration project consists of a 200 kW solar absorption cooling system assisted by a ground-source heat pump with a rated cooling capacity of 391 kW. It was reported that the average solar collecting efficiency in summer exceeded 40% [14]. So far, the largest solar cooling system in China is the demonstration project of Beiyuan. A single-effect LiBr-water absorption chiller was chosen to supply cooling to the building with an area of 3000 m2. An electric boiler was installed as an auxiliary heat source. When the ambient temperature was about 30.3 °C during the experimental period, the average solar collecting efficiency and the COP of the chiller was 0.42 and 0.75, respectively, whereas the average indoor air temperature was 23.8 °C [15].
Due to the intermittent nature of solar energy, a backup system is required in solar cooling and heating systems to meet the building load demand when solar inputs are insufficient. The backup system can use either gas or electricity as the auxiliary energy source [16]. Most of the above-mentioned solar cooling and heating systems used a gas boiler as an auxiliary heat source. In this paper, a new system incorporated with two air-source heat pumps as the auxiliary system was installed in Ningbo City, which is located in the hot summer and cold winter zone in China, and it has been operating since 2018. This paper presents the installation and performance evaluation of the solar cooling and heating system during the summer cooling and winter heating period, as well as on a typical summer day, namely, 23 July 2018.

2. Climate Conditions and Building Characteristics

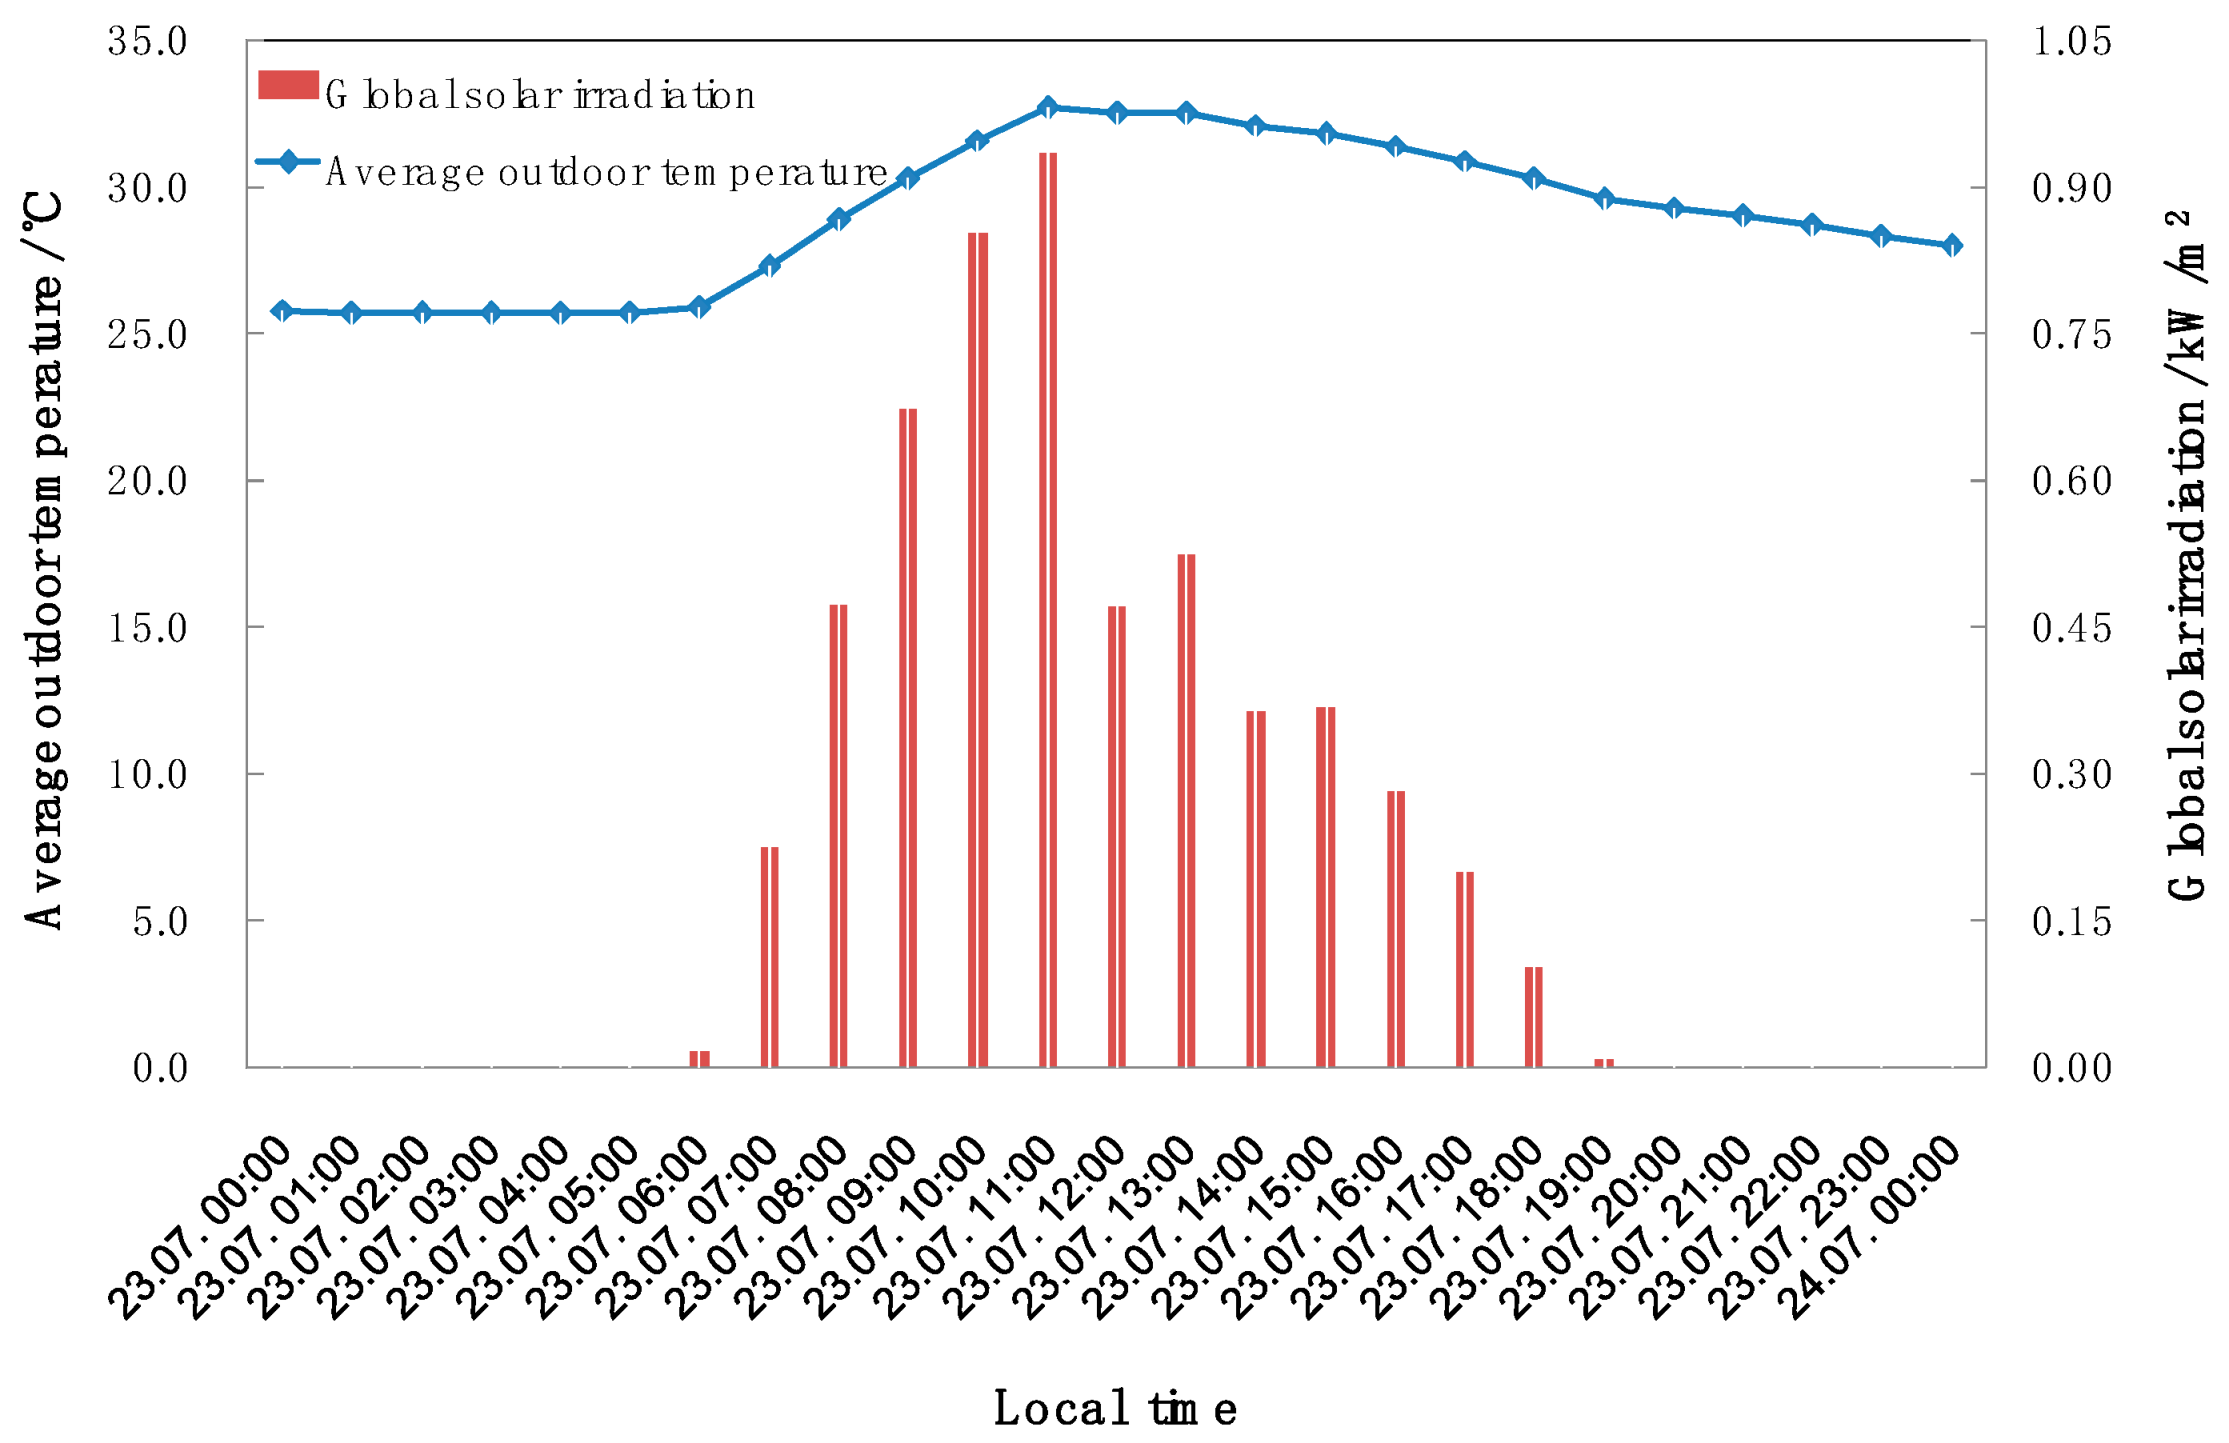
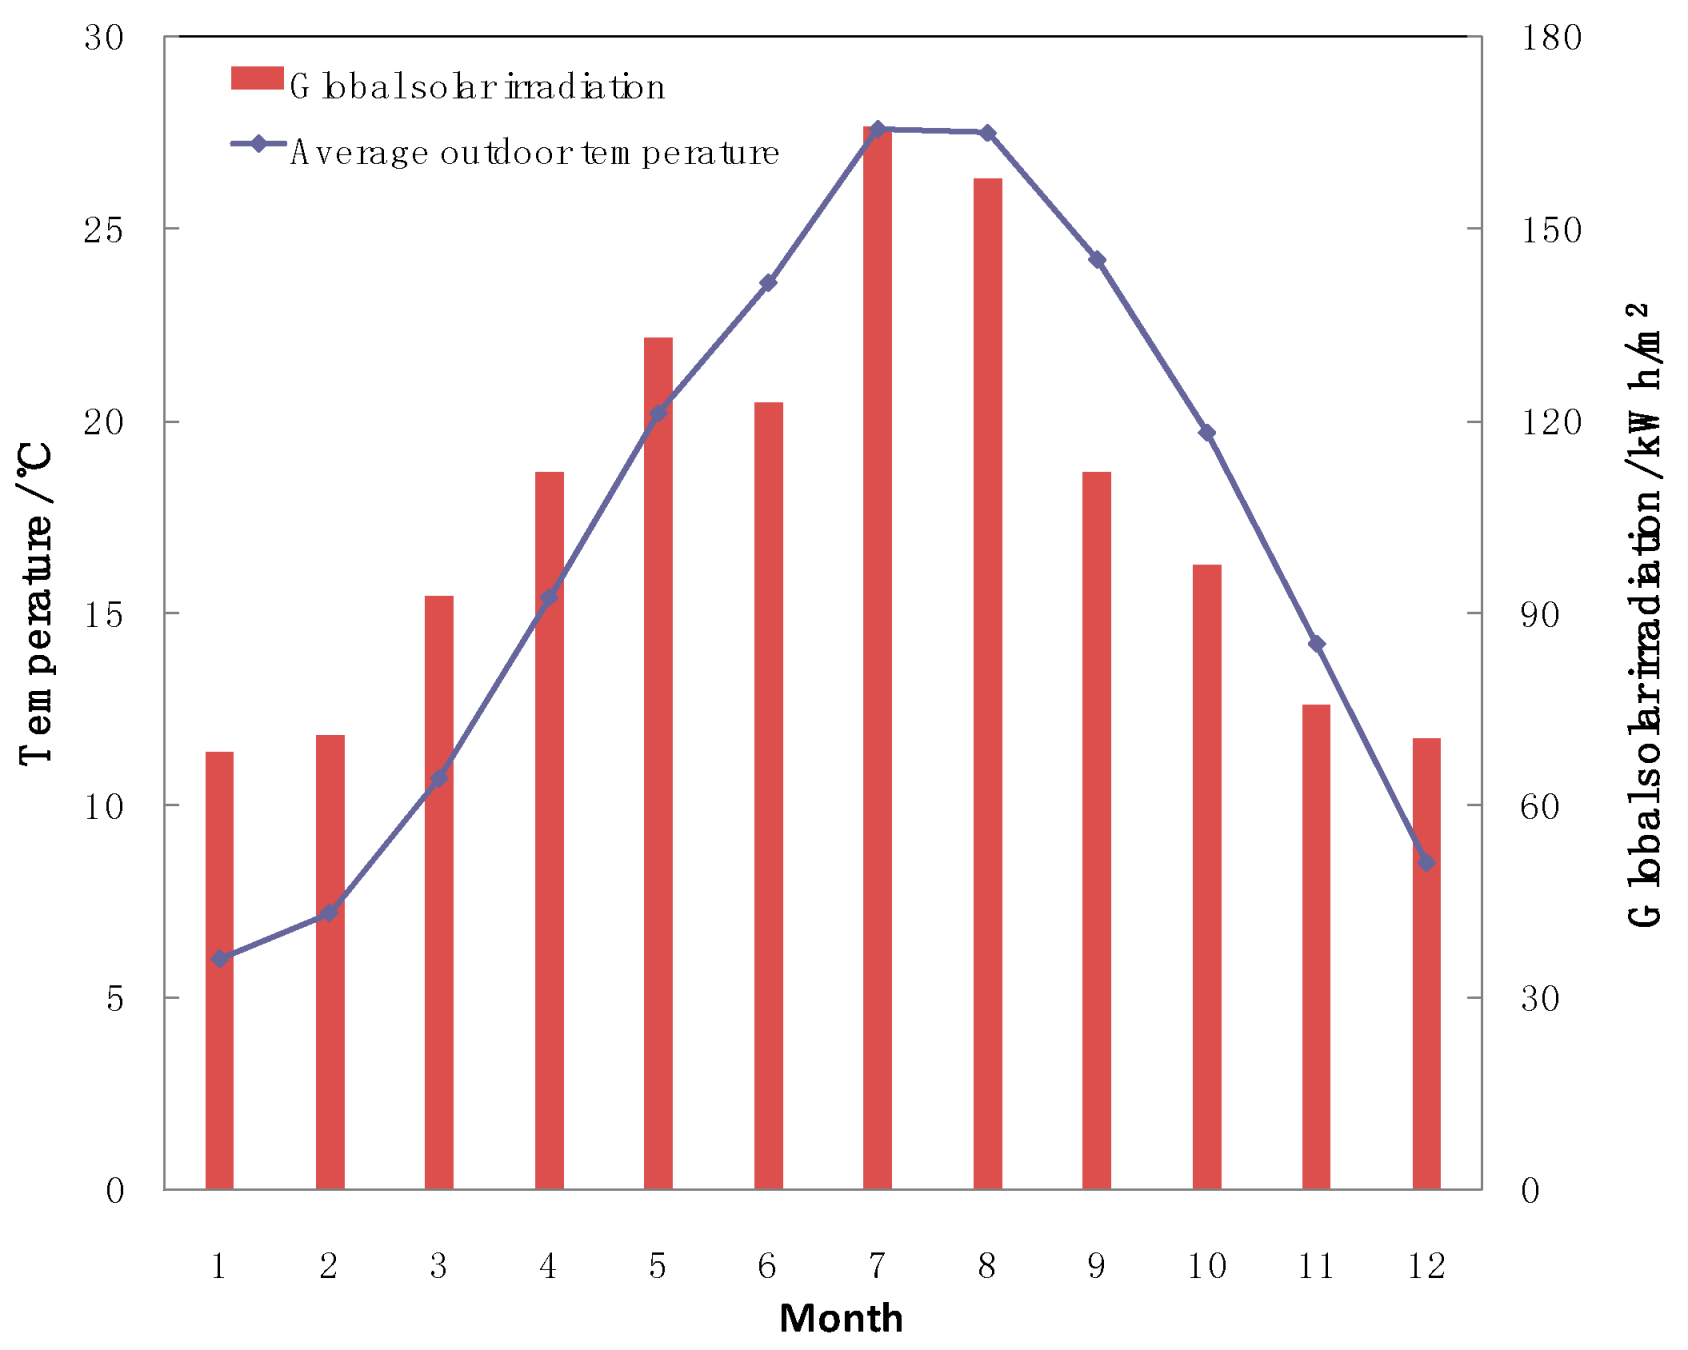
2.1. Climate Conditions

Figure 1 presents the monthly average outdoor temperature and global solar irradiation in Ningbo City in 2018. The average outdoor temperature during July, the hottest month, is 27.6 °C, whereas the average outdoor temperature during January, the coldest month, is 6 °C. Thus, air conditioning systems are necessary for both cooling in summer and heating in winter. The average sunshine hours are 1855.6 h per year and the average daily sunshine hours are 5.41 h. The total annual solar radiation is 1280.5 kWh/m2, which is 78% of the average value of 1627.8 kWh/m2 in China.
Figure 2 shows the hourly average outdoor temperature and global solar irradiation on 23 July 2018. The strongest solar radiation occurred from 9:00 to 13:00, while the temperatures exceeded 32 °C between 11:00 and 14:00, which also corresponded to the maximal cooling energy demand during the day.

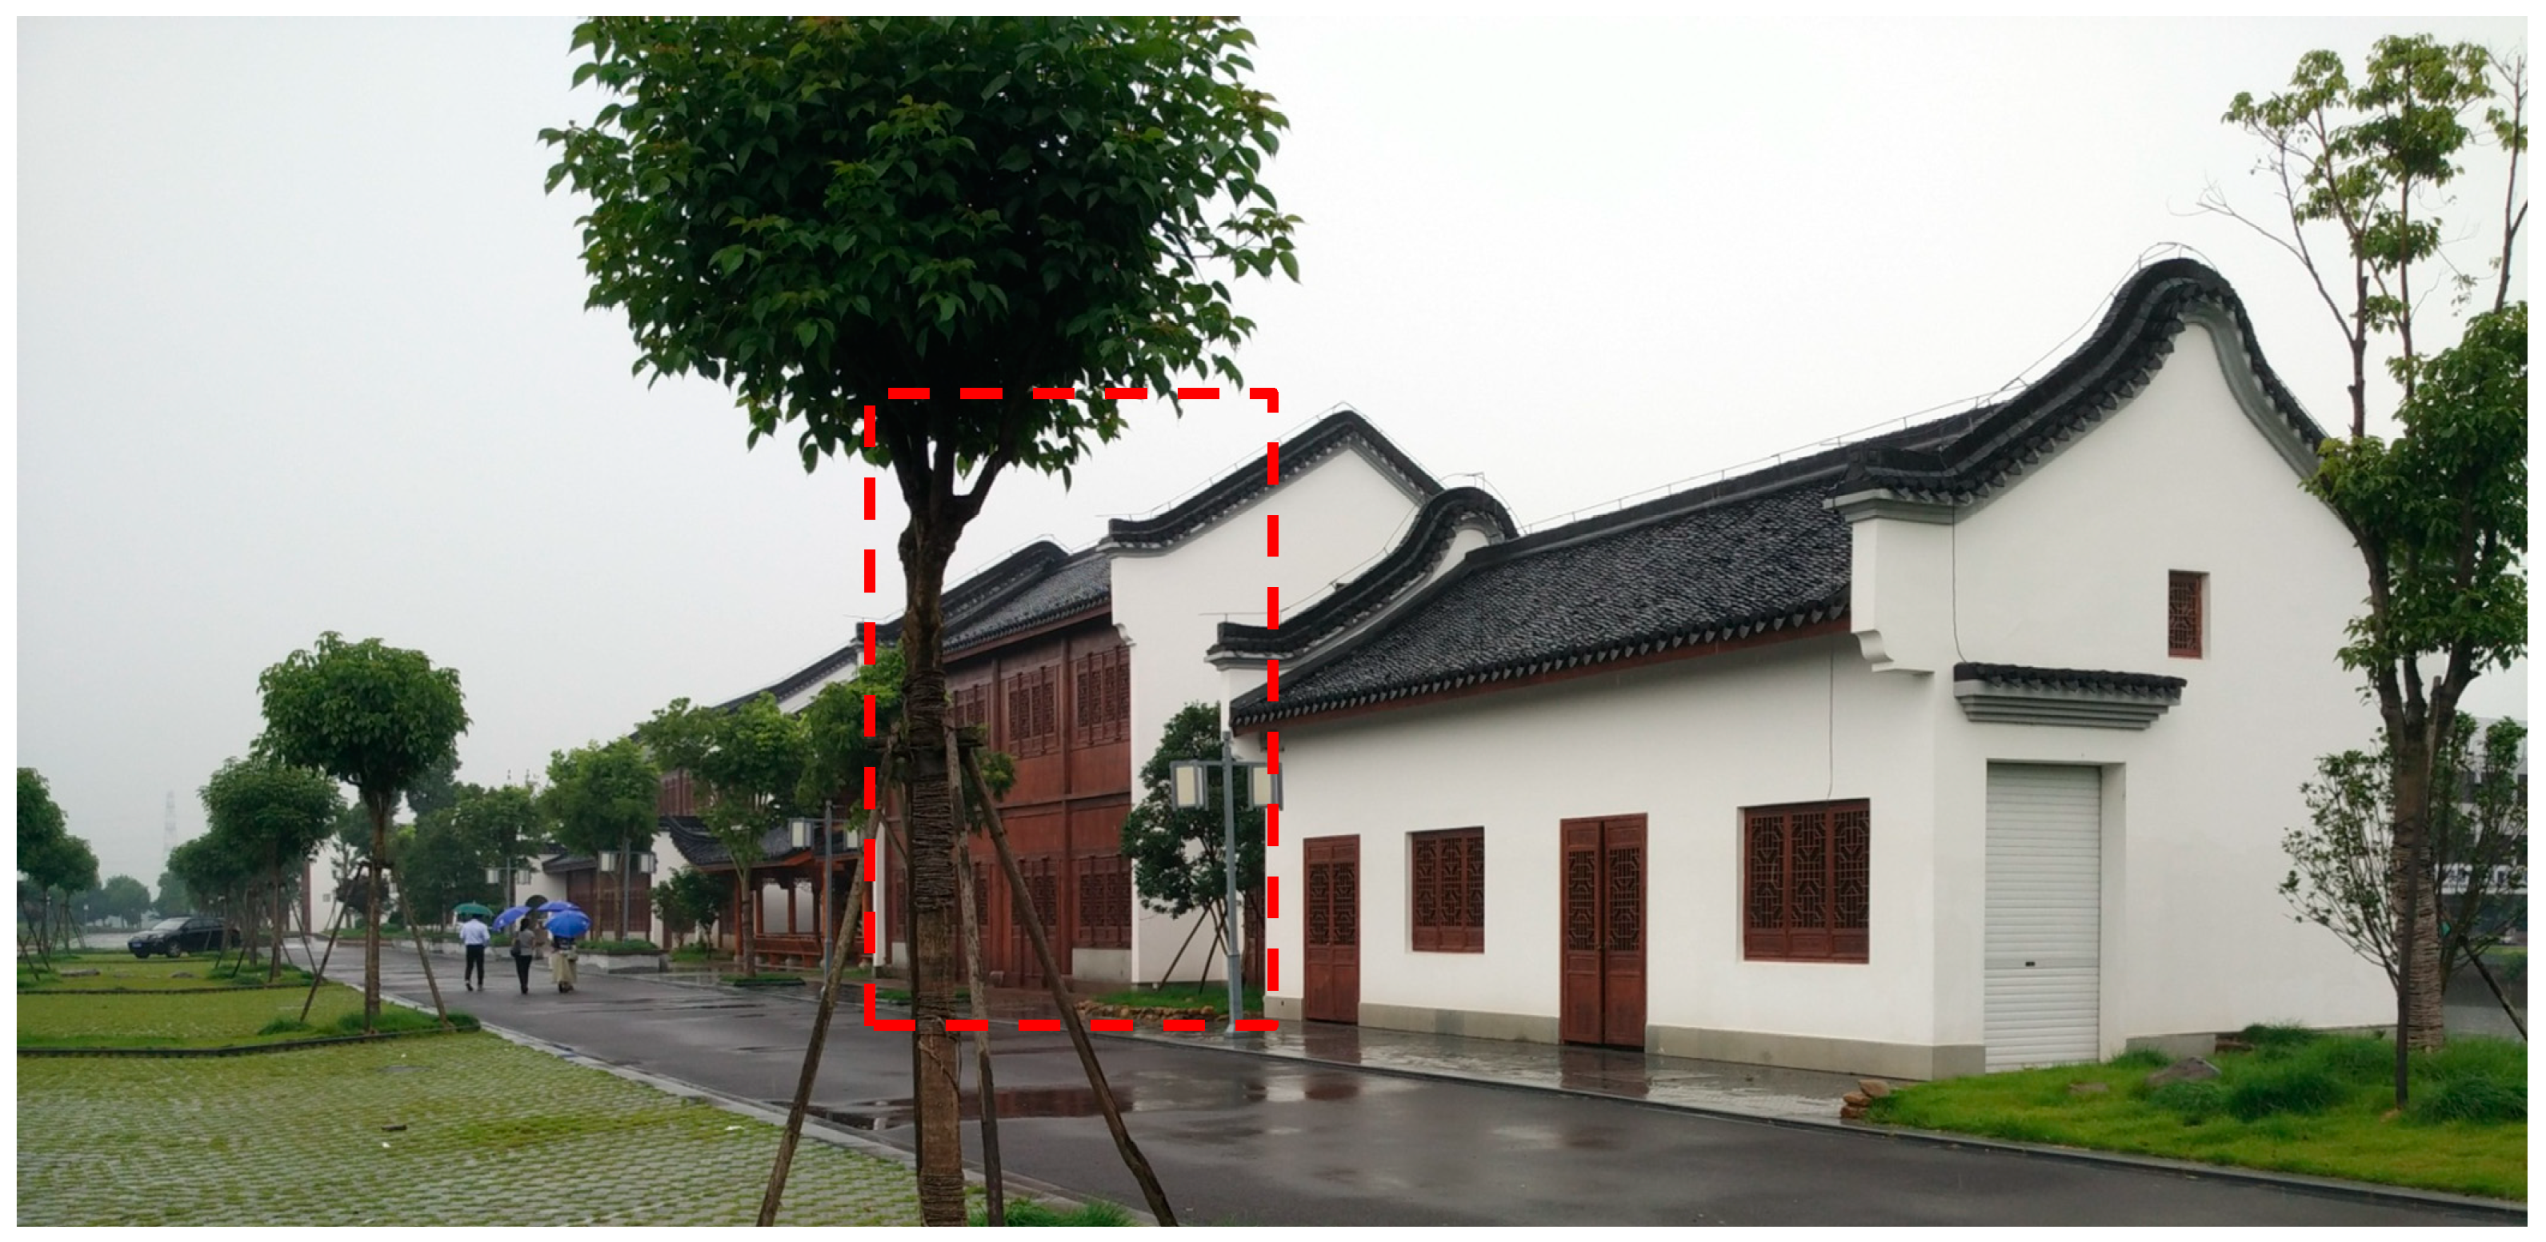
2.2. Building Characteristics

The building, which the solar cooling system serves, is an office building of a tourist center as shown in Figure 3 and occupied for 10 h from 8:00 to 18:00 every day. The two-story building has a total area of 242.4 m2 and a total height of 6.9 m. The specific cooling and heating power demands are 120 W/m2 and 82 W/ m2, respectively, and the total cooling and heating loads are 29 kW and 20 kW, respectively. There is no hot water demand in the building. The construction characteristics of this building are shown in Table 1.

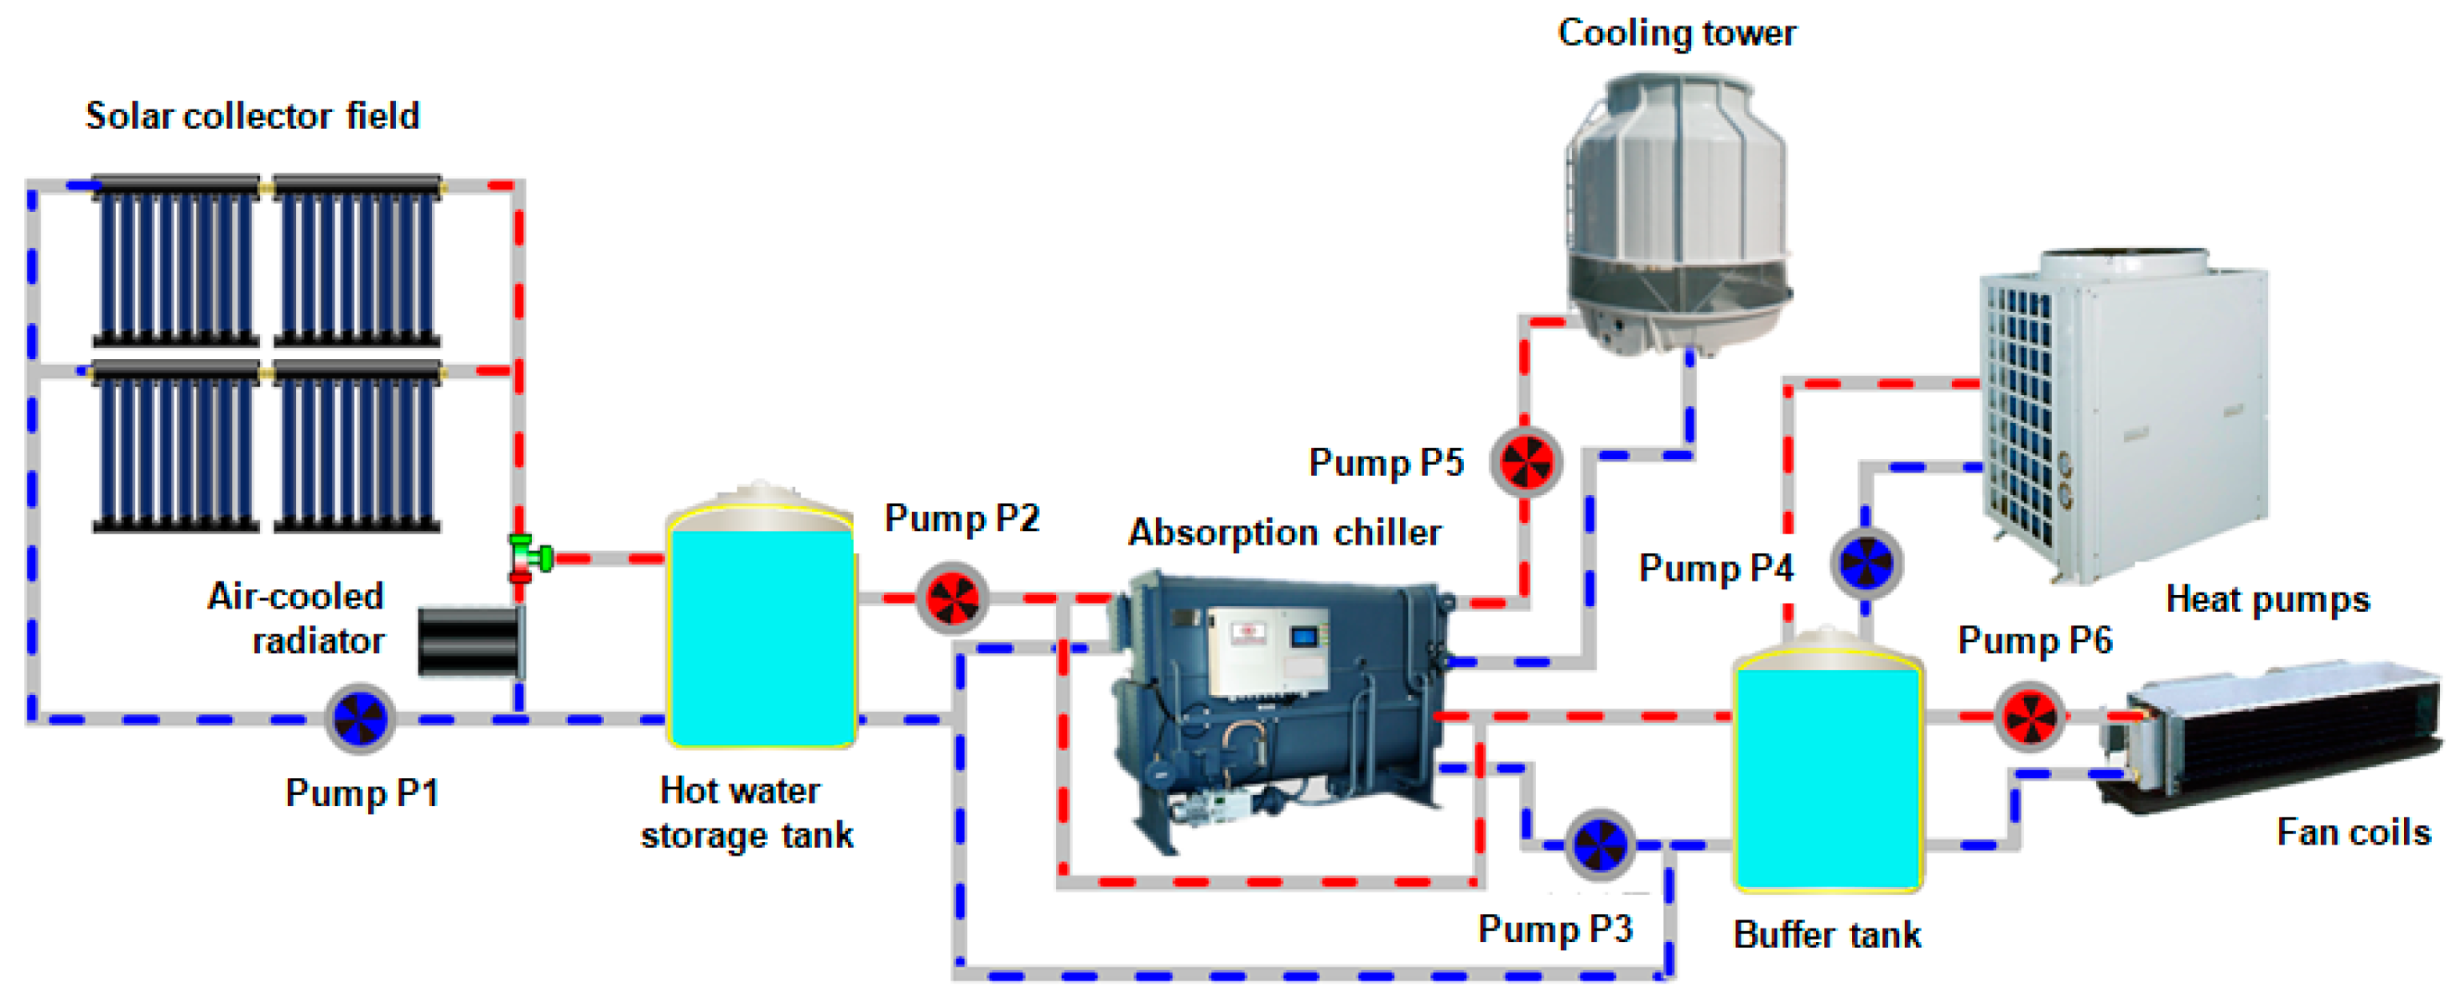
3. System Installation

The installation is a solar collector-based thermal cooling system where a LiBr-water absorption chiller is driven by hot water from the solar collectors. As shown in Figure 4, it consists of two arrays of evacuated tube collectors, an air-cooled radiator to prevent overheating of the solar collectors, an absorption chiller, a cooling tower, a hot water storage tank, a buffer tank, and two air-source heat pumps as an auxiliary system. During the summer cooling time, the solar collector field transfers solar radiation into thermal energy to produce hot water at a temperature range of 70–110 °C, which is stored in the hot water storage tank. The absorption chiller is driven by the hot water and produces chilled water at a temperature of 10–15 °C, which is stored in the buffer tank for building cooling. The cooling tower is used to extract waste heat from the chiller. The heat pumps additionally provide chilled water when solar energy is insufficient. During the winter heating time, the absorption chiller is switched off, and the hot water with a temperature range between 45 °C and 60 °C produced by the solar collector field is directly used for building heating. The heat pumps additionally provide hot water when solar energy is insufficient.

3.1. Description of the System Components

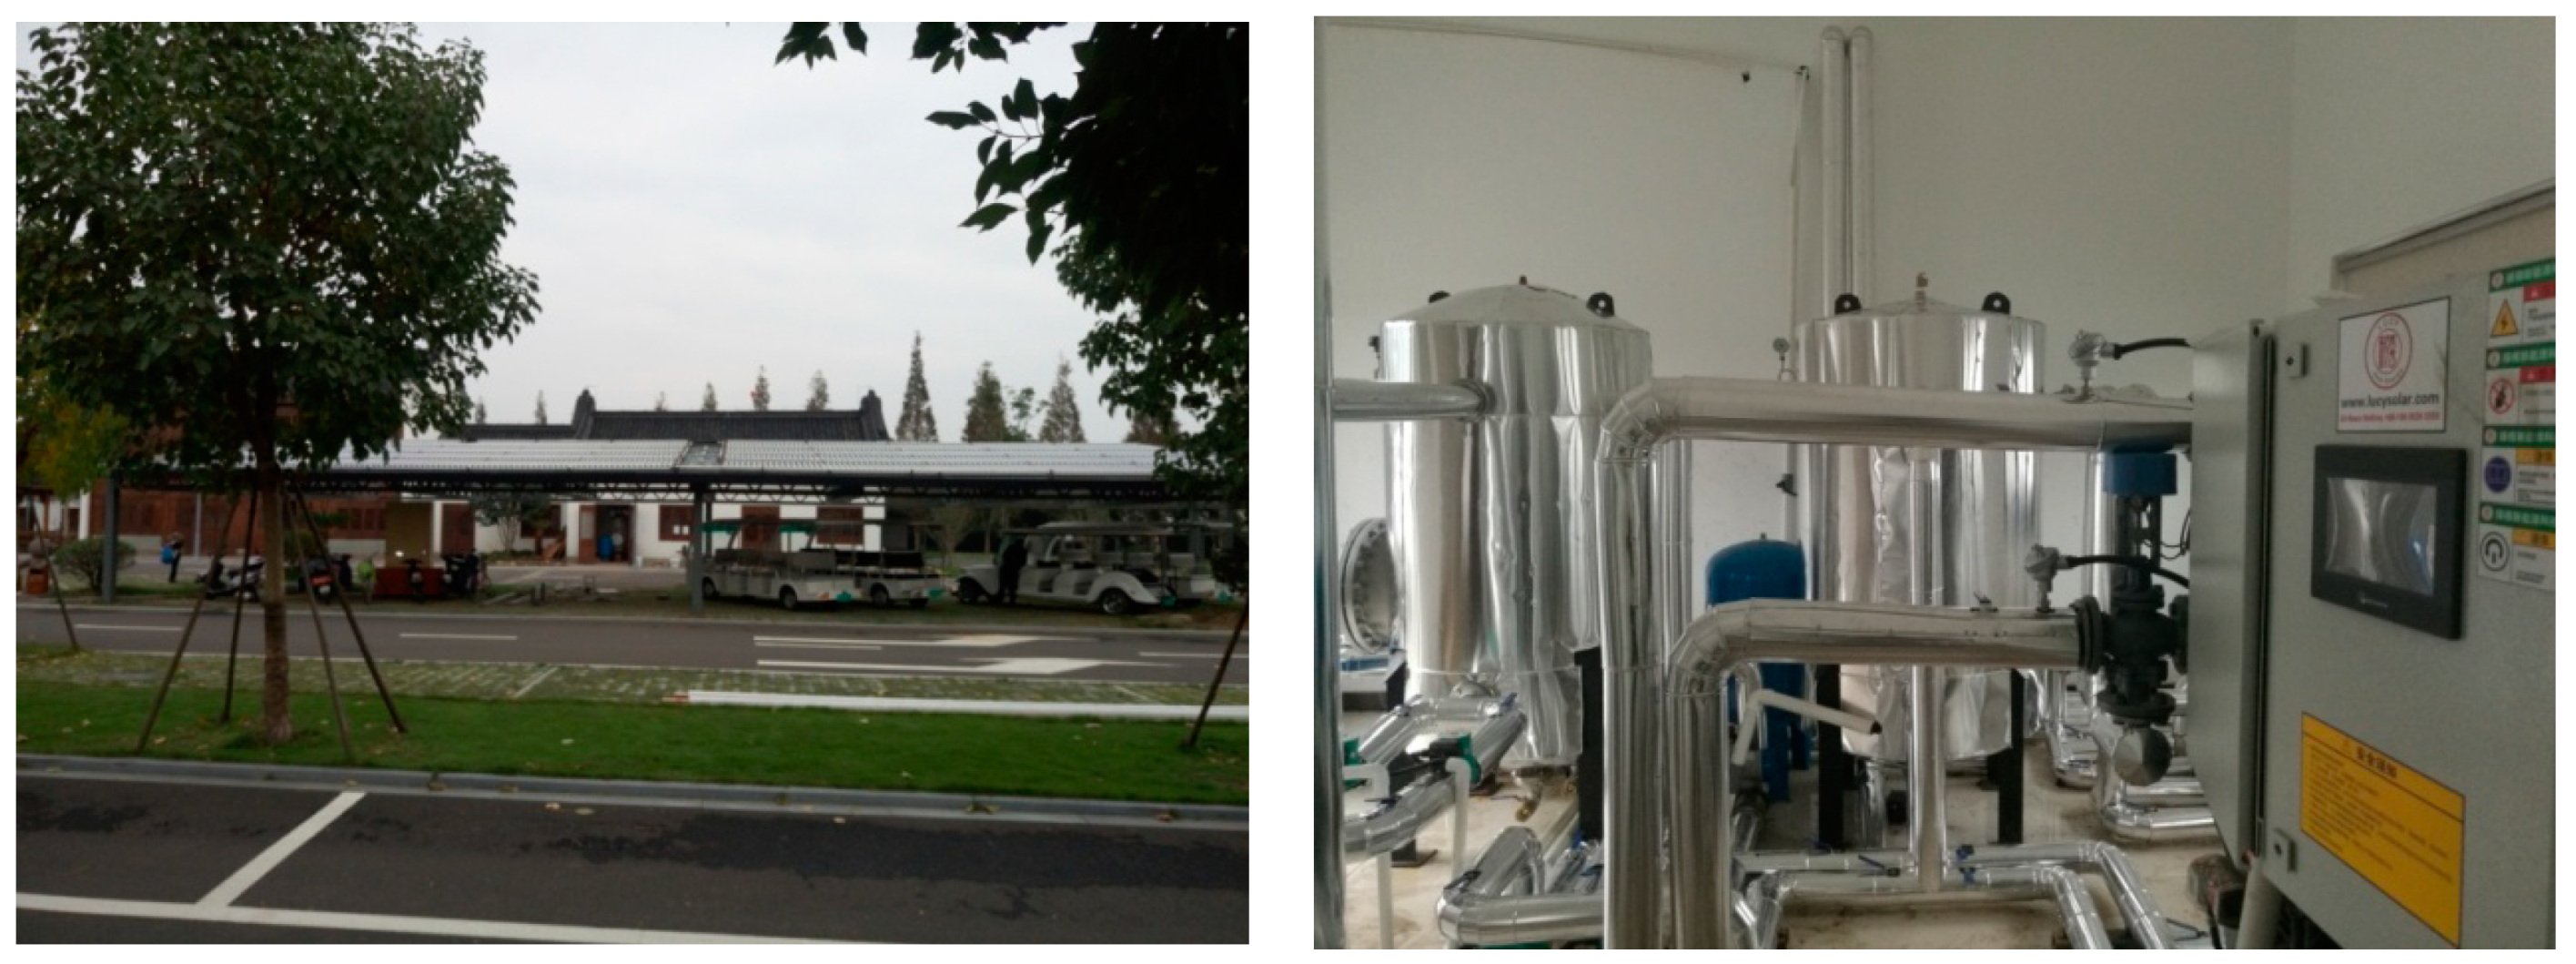
3.1.1. The Solar Collector Field

The main heat driving source of the installation is the solar collector field, which was installed on the roof of a steel-structure parking shed near the office building shown in Figure 5 (left). It comprises 40 all-glass evacuated tube modules in two parallel arrays with a total aperture area of 120 m2. Each module contains 18 evacuated tubes and has an aperture area of 3.0 m2.

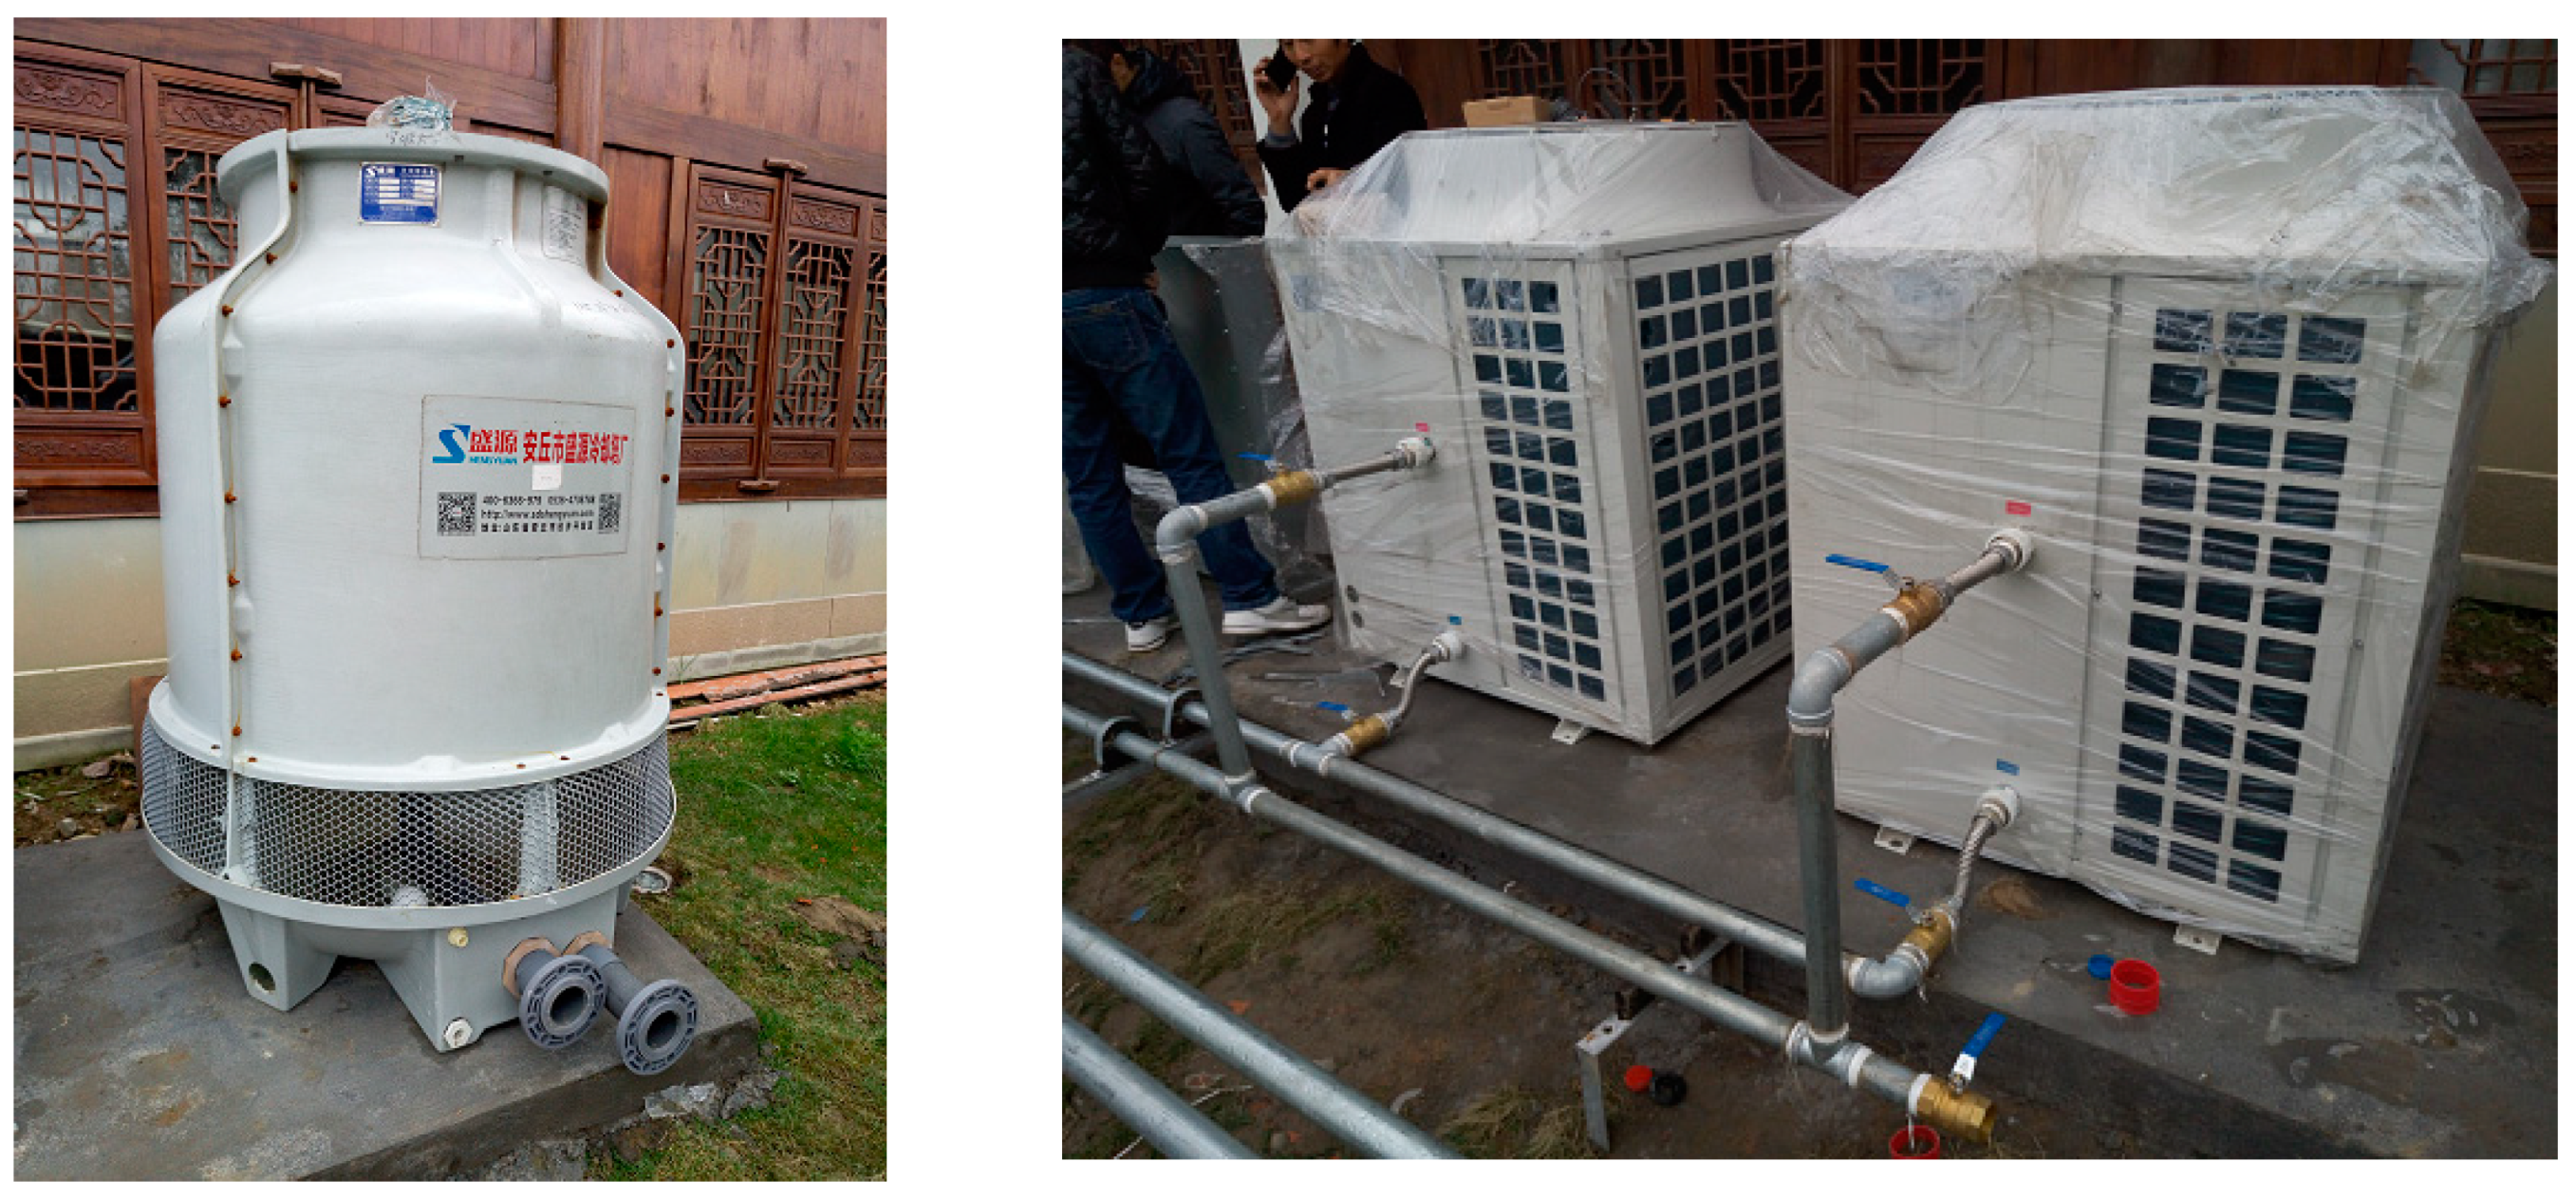
3.1.2. The Absorption Chiller

The absorption chiller presented in Figure 5 (right) is a single-stage and LiBr–water based machine associated with a cooling tower shown in Figure 6 (left). This chiller had a cooling capacity of 35 kW. The hot water design inlet and outlet temperatures were 80 °C and 75 °C, respectively, and the rated flow was 8.6 m3/h; the chilled water design inlet and outlet temperatures were 15 °C and 10 °C respectively, and the rated flow was 6.0 m3/h; the cooling water design inlet and outlet temperatures were 30 °C and 35 °C, respectively, and the rated flow was 15.0 m3/h. The cooling tower had a rated water flow of 25.0 m3/h.

3.1.3. The Thermal Energy Storage

In order to make rational use of solar energy and to maximize the energy efficiency, two pressure storage tanks were used in the installation, which were a hot water storage tank with a volume of 4 m3 and a buffer tank with a volume of 1 m3. The hot water storage tank had built-in heat exchanger coils and the heat transfer capacity was 58 kW.

3.1.4. The Auxiliary System

An auxiliary system is required due to the instability of solar energy. Two air-source heat pumps were applied in the installation as shown in Figure 6 (right). The rated cooling capacity was 23.8 kW and the heating capacity was 32 kW.

3.2. Description of the Controlling and Monitoring System

The controlling and monitoring system is very important for the safe and stable running of this installation. As presented in Figure 7, the solar radiation Isolar, the temperatures T0T17, the mass flow rates F1F4, and the electrical consumption E1 were recorded by the monitoring system. Table 2 presents the instruments and their calibration range and uncertainty.
The installation had two operational modes, namely, the building cooling and heating modes. During the cooling period in summer, the valves V1–V6 and V9–V18 were open and V7 and V8 were closed. The controlling system was achieved through the following main cycles:
(1) The solar loop
The pump, P1, was switched on when the difference between the outlet temperature of the collector field and the upper layer temperature of the hot water storage tank T3T4 ≥ 4 °C; the pump, P1, was switched off when the temperature difference T3T4 < 2 °C.
(2) The cooling loop
The pump, P2, was switched on when the upper layer temperature of the hot water storage tank T4 ≥ 80 °CAND the fan coils were turned on; the pump, P2, was switched off when T4 < 70 °COR the fan coils were shut down.
(3) The heat pump loop
The heat pumps and pump P6 were switched on when the lower layer temperature of the buffer tank T15 > 18 °C AND the fan coils were turned on; the heat pumps and pump P6 were switched off when T15 ≤ 15 °C OR the fan coils were shut down.
During the heating period in winter, the valves V1, V2, V7–V10, and V13–V18 were open and V3–V6, V11, and V12 were closed. The controlling system was achieved through the following main cycles:
(1) The solar loop
The pump, P1, was switched on when the difference between the outlet temperature of the collector field and the upper layer temperature of the hot water storage tank T3T4 ≥ 4 °C; the pump, P1, was switched off when the temperature difference T3T4 < 2 °C.
(2) The heating loop
The pump, P2, was switched on when the lower layer temperature of the buffer tank T15 < 55 °C AND the difference between the upper layer temperature of the hot water storage tank and the lower layer temperature of the buffer tank T4T15 ≥ 2 °C; the pump, P2, was switched on when the lower layer temperature of the buffer tank T15 ≥ 60 °C OR T4T15.
(3) The heat pump loop
The heat pumps and pump P6 were switched on when the lower layer temperature of the buffer tank T15 < 45 °C AND the fan coils were turned on; the heat pumps and pump P6 were switched off when T15 ≥ 50 °C OR the fan coils were shut down.

4. Operational Results and Performance Evaluation

The solar cooling system was installed in December 2017 and has been operating since January 2018. The monthly operational results and performance evaluation as well as those on a typical summer day, namely, 23 July 2018, are presented below.

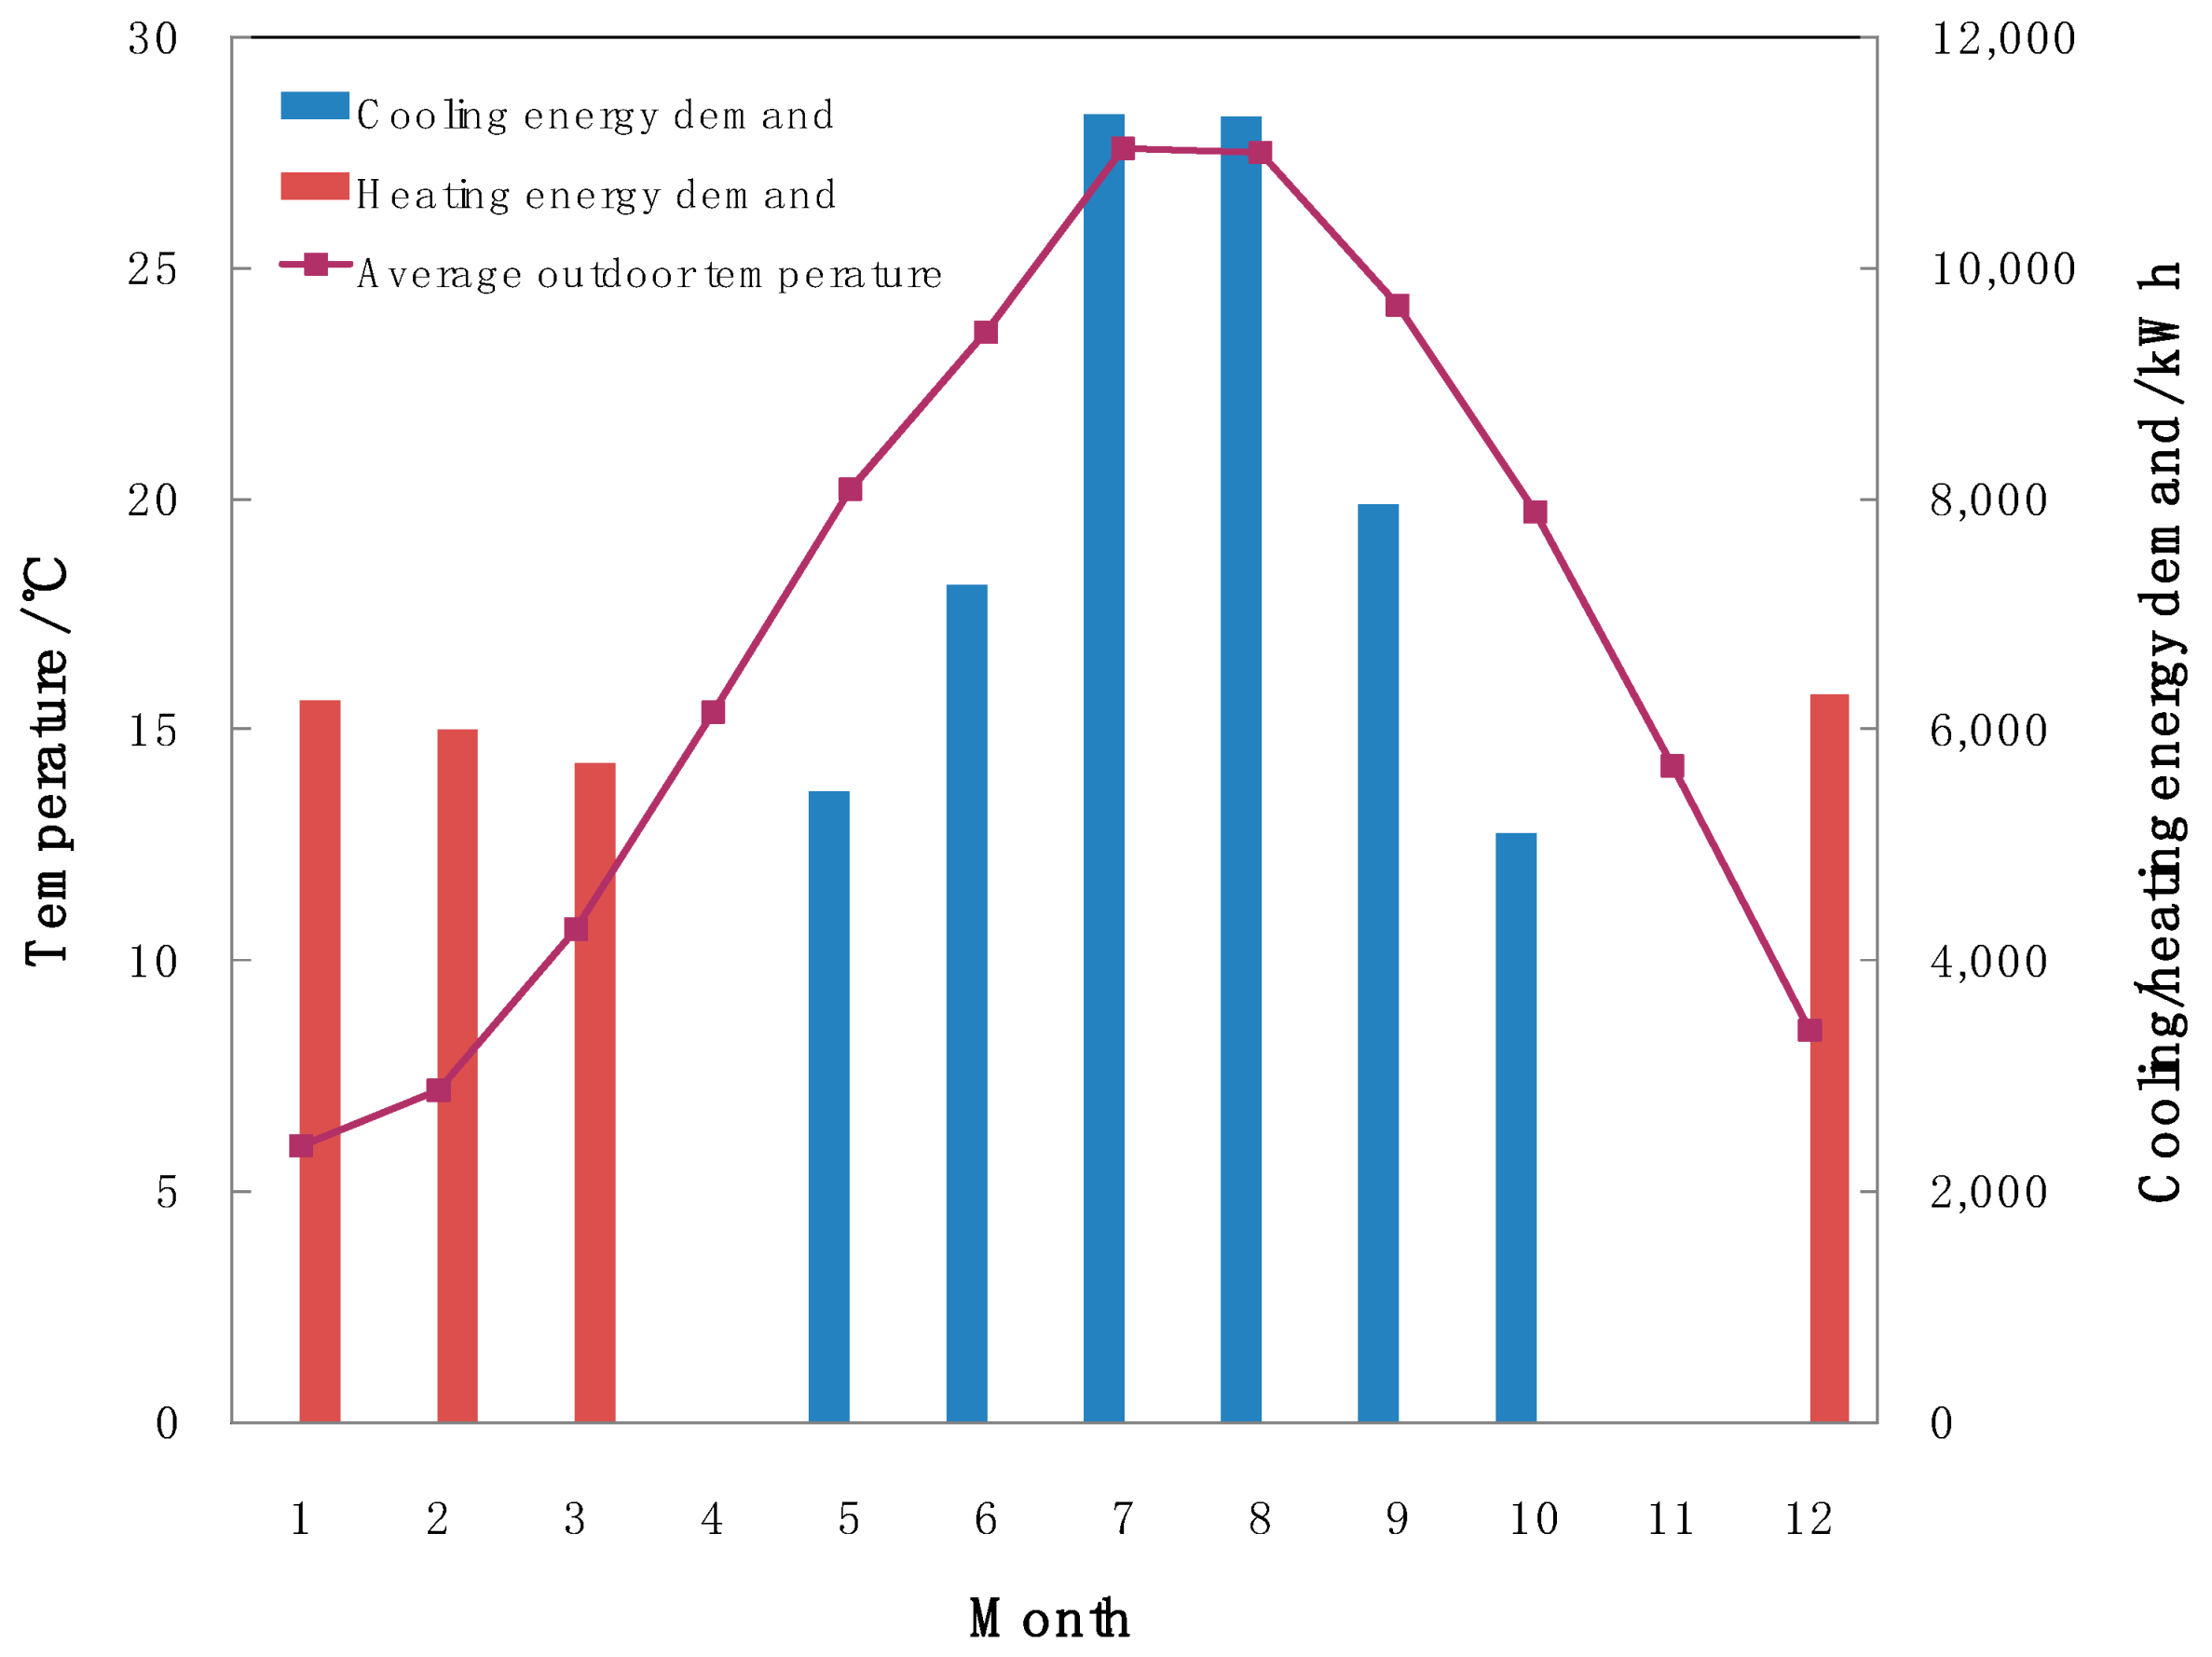
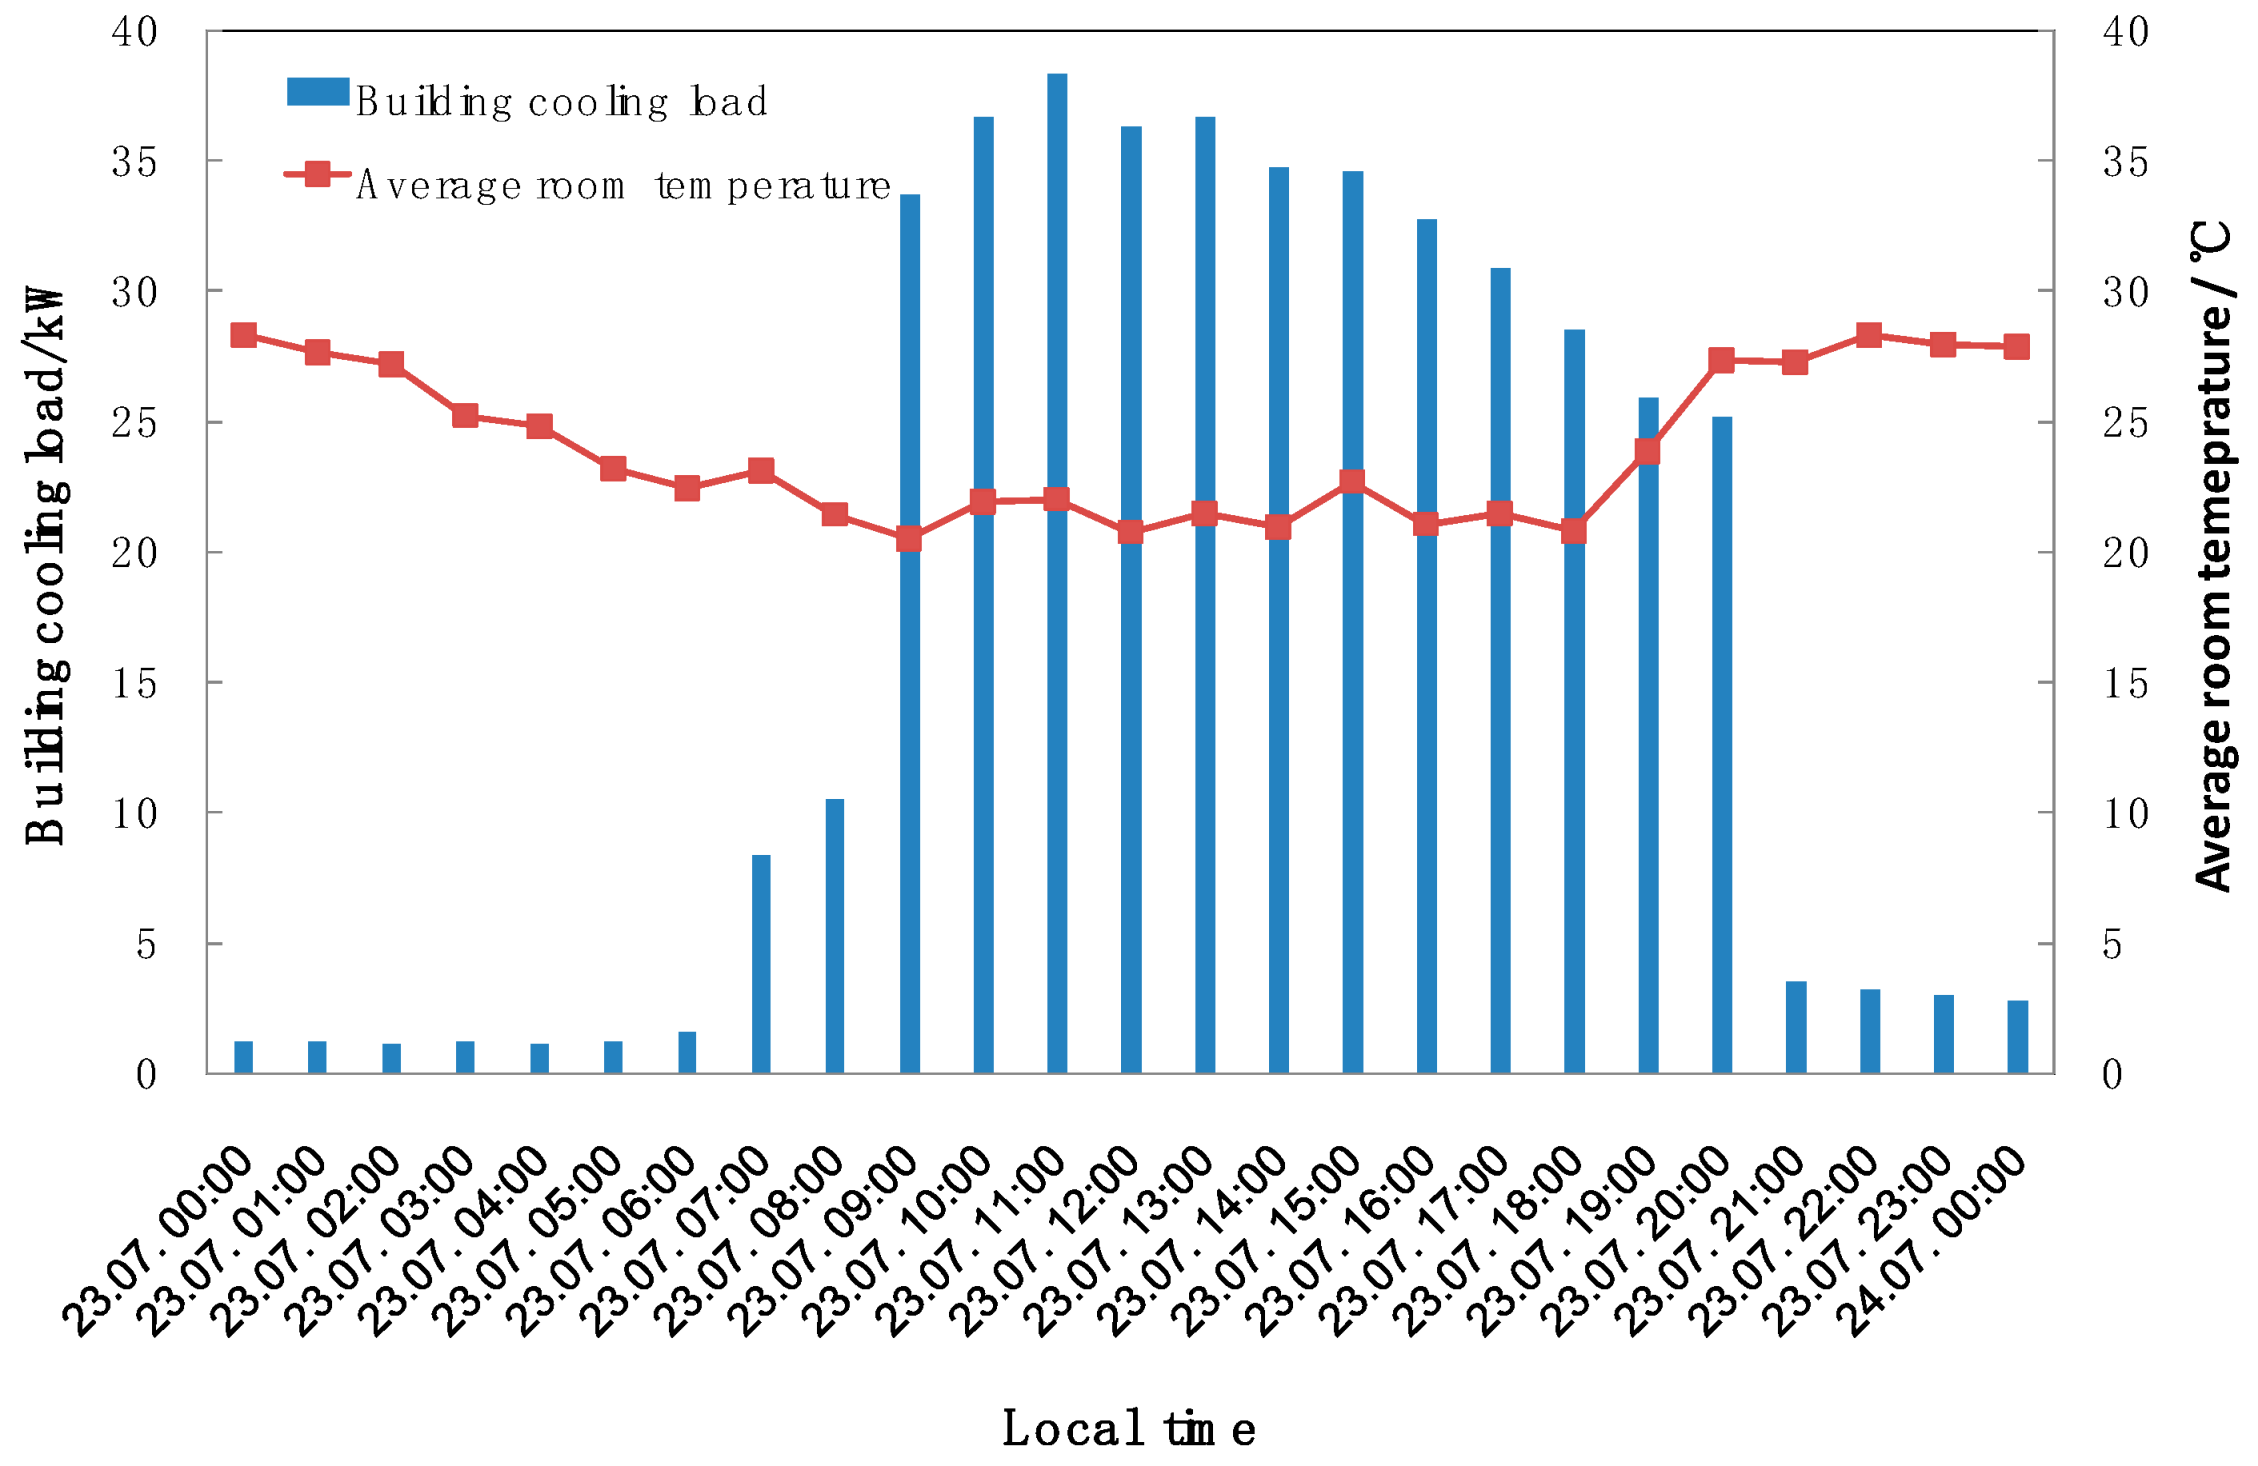
4.1. Building Cooling and Heating Energy Demand and Room Temperature

The room cooling and heating temperatures were set to 22 °C and 18 °C, respectively, according to the Chinese standards GB 50189-2005 “Design standard for energy efficiency of public buildings” and JGJ 134-2010 “Design standard for energy efficiency of residential buildings in hot-summer and cold-winter zone.” Figure 8 shows the monthly average outdoor temperature and building cooling and heating energy demand in 2018. The annual cooling and heating energy demands were 48,418 kWh and 24,288 kWh, respectively. The highest cooling demand occurred in July and August, which corresponded to the hottest months in 2018, while the monthly heating energy demands were similar from December to March. There was neither cooling nor heating demand in November and April.
Figure 9 shows the hourly building cooling load and average room temperature on 23 July 2018. The daily cooling energy demand was 435 kWh. The room temperature decreased to 21.4 °C as the solar cooling system started to work at 8:00 in the morning and kept in the range of 21.0–22.0 °C for 10 h. The room temperature increased rapidly to 27.0 °C after the system stopped working at 18:00.

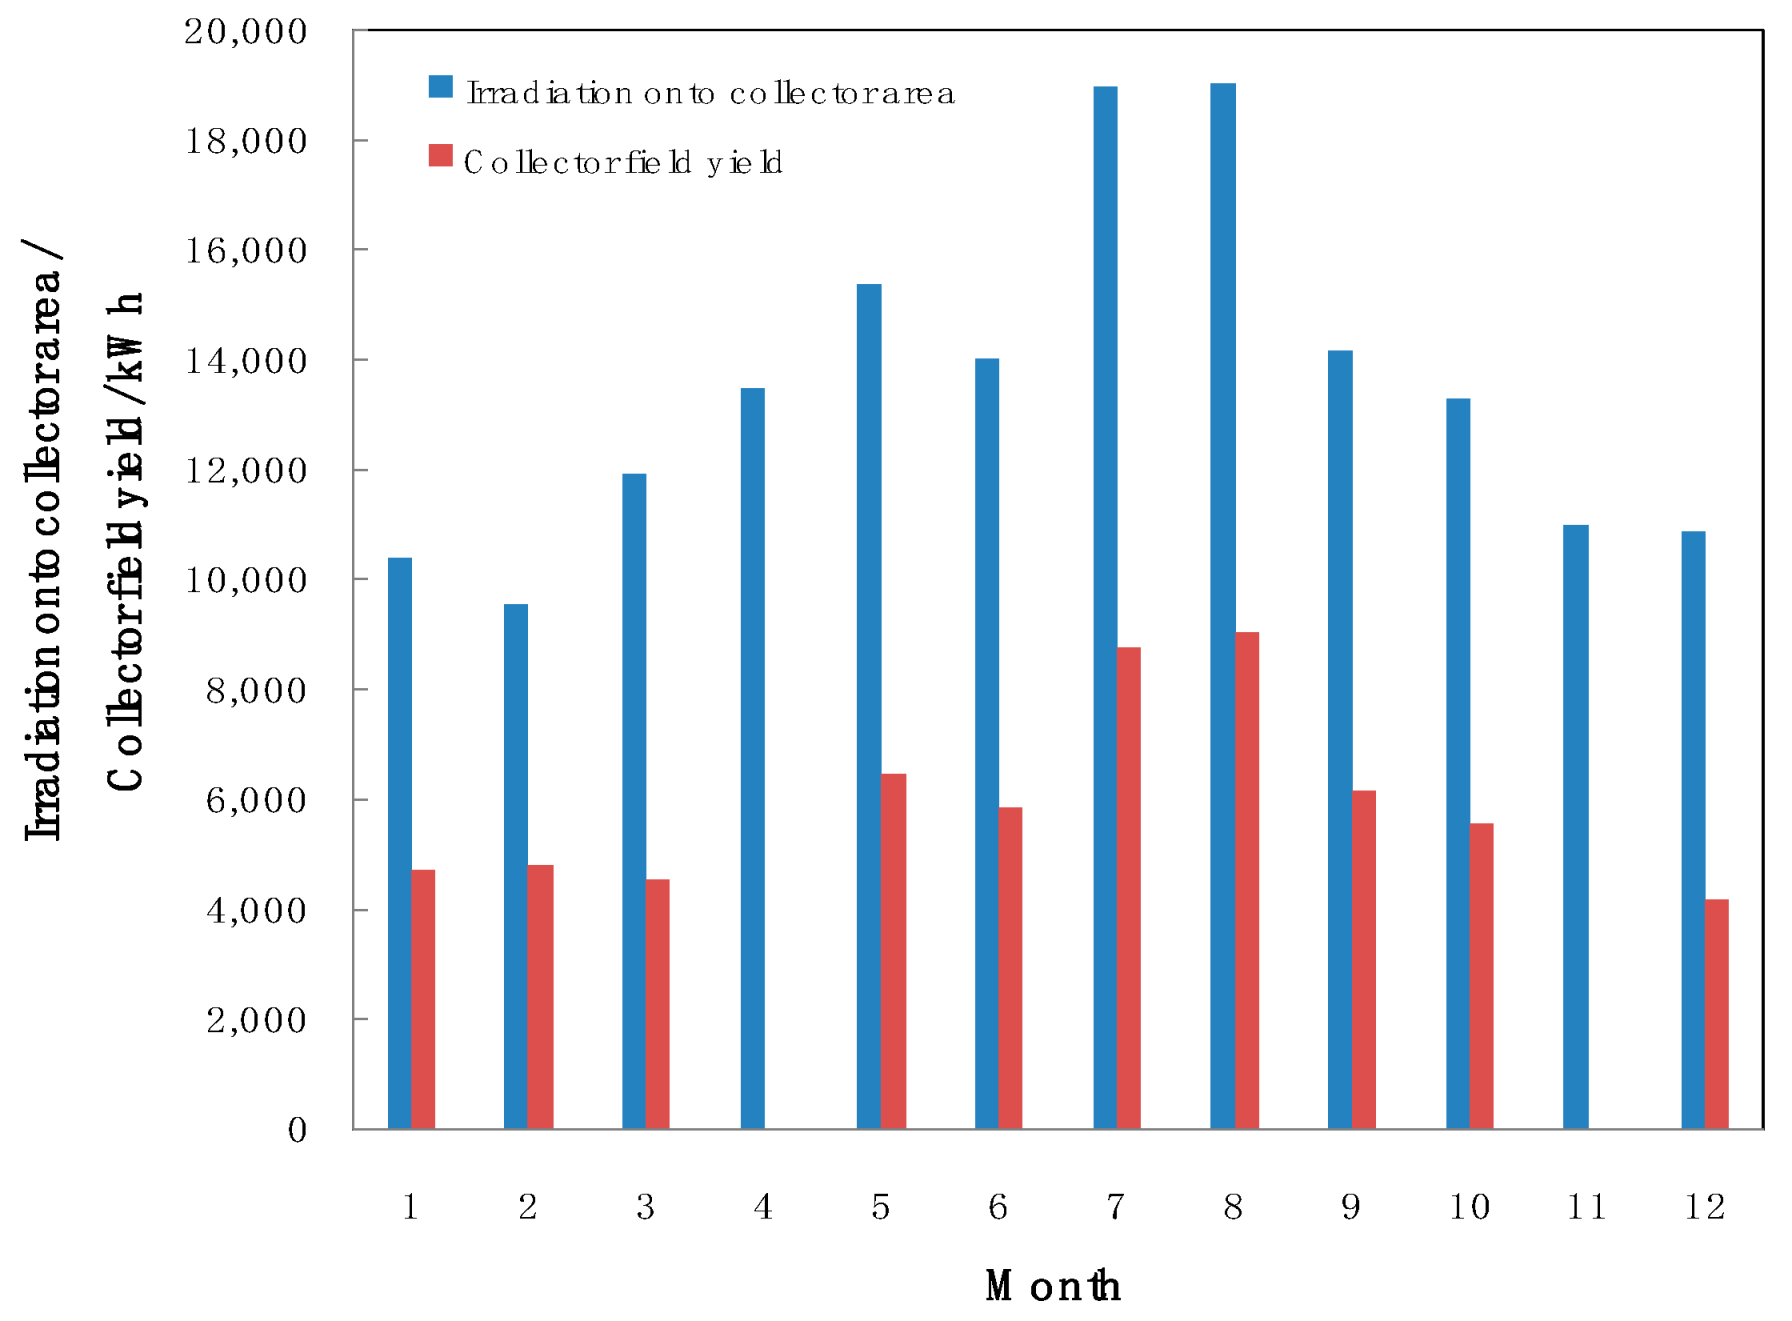
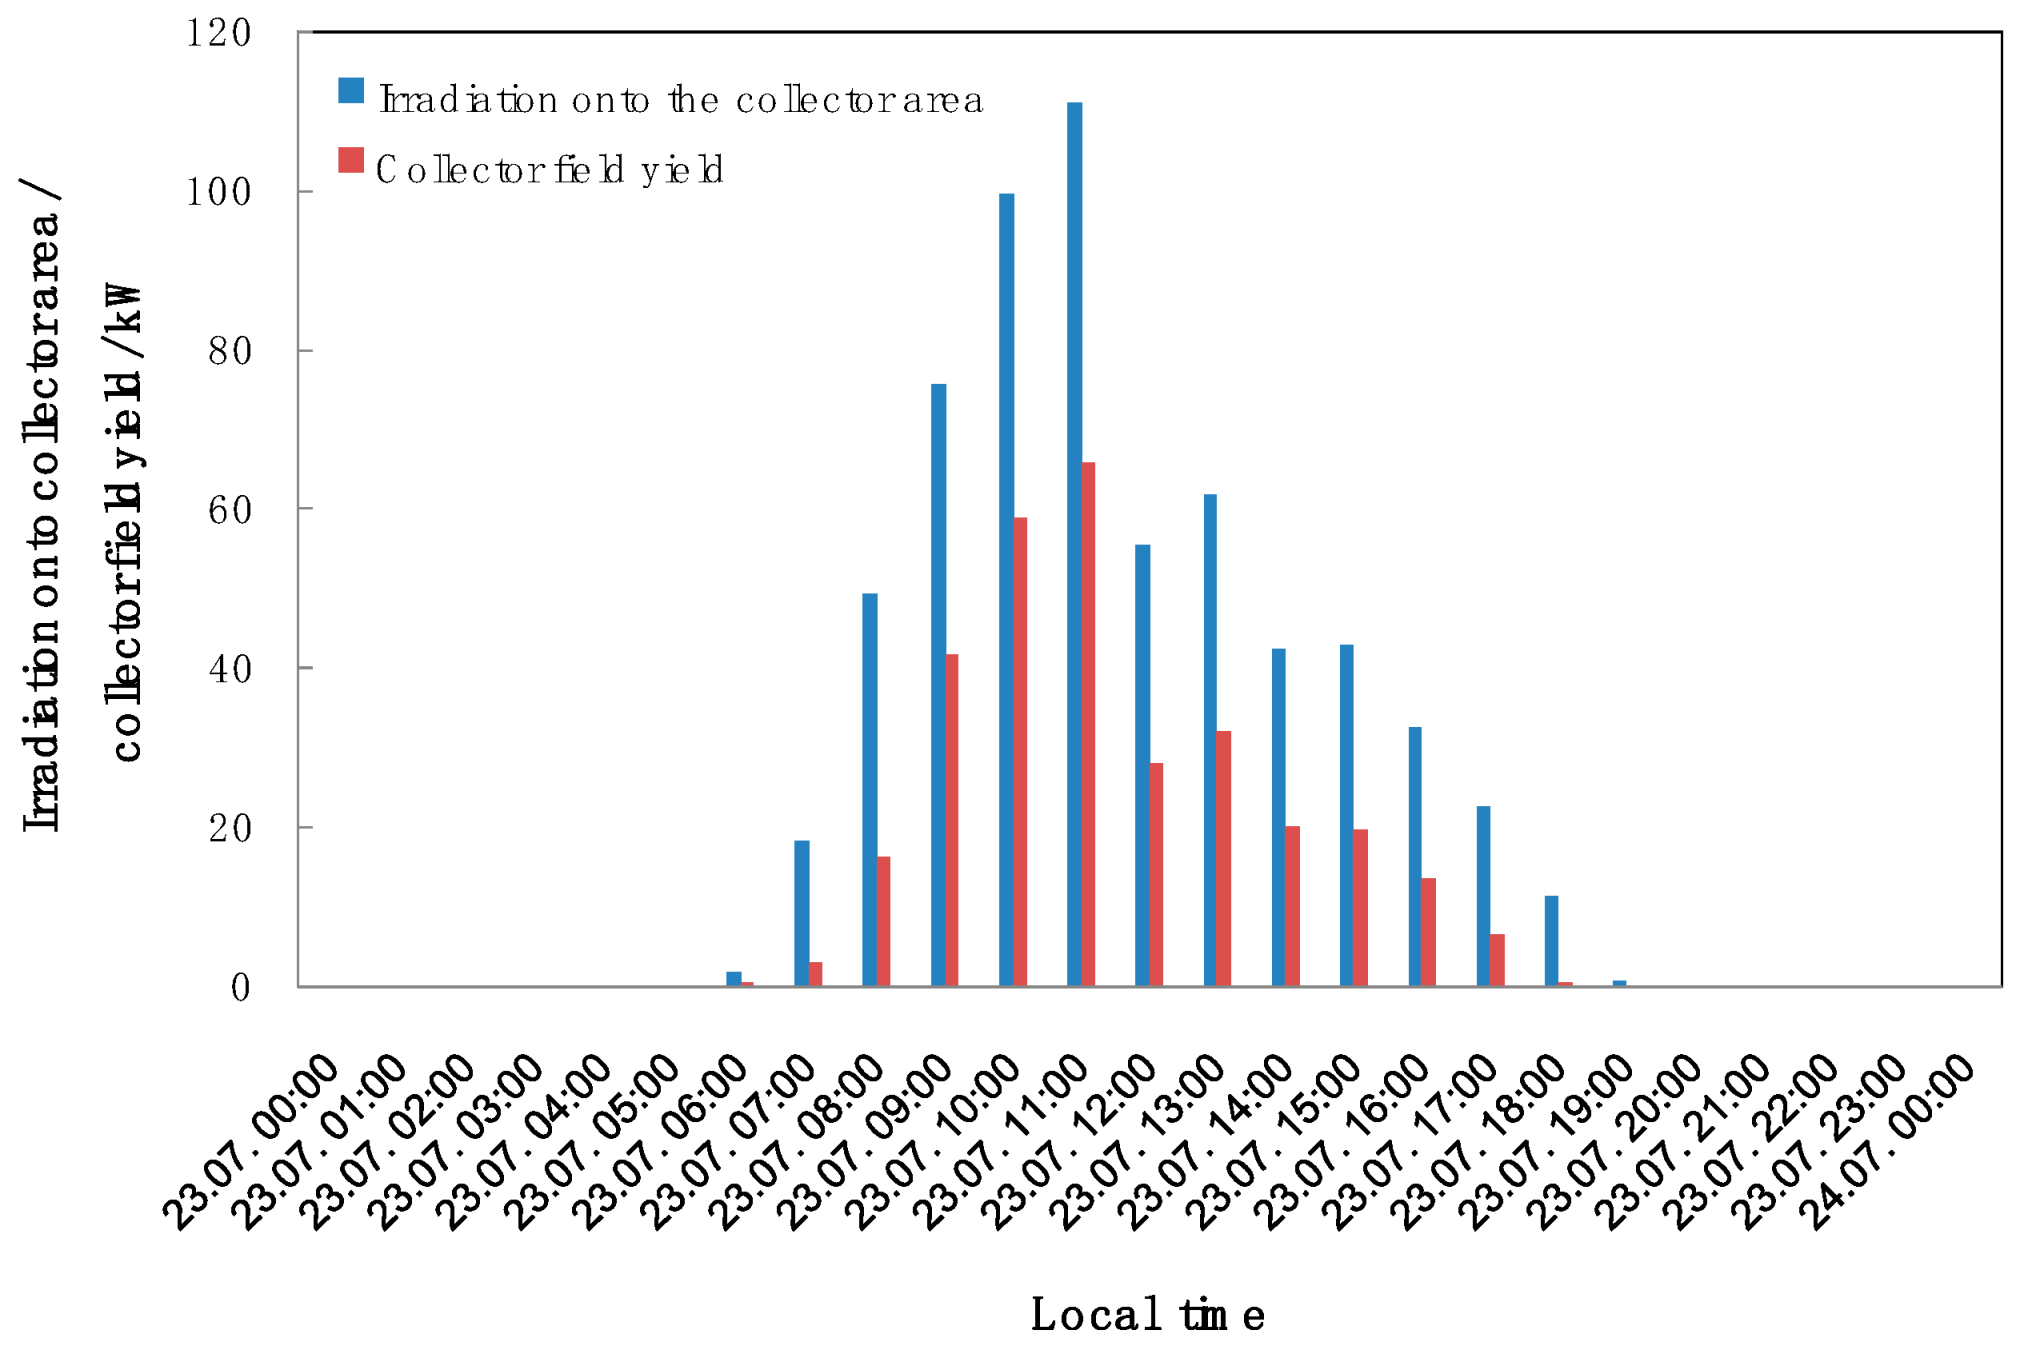
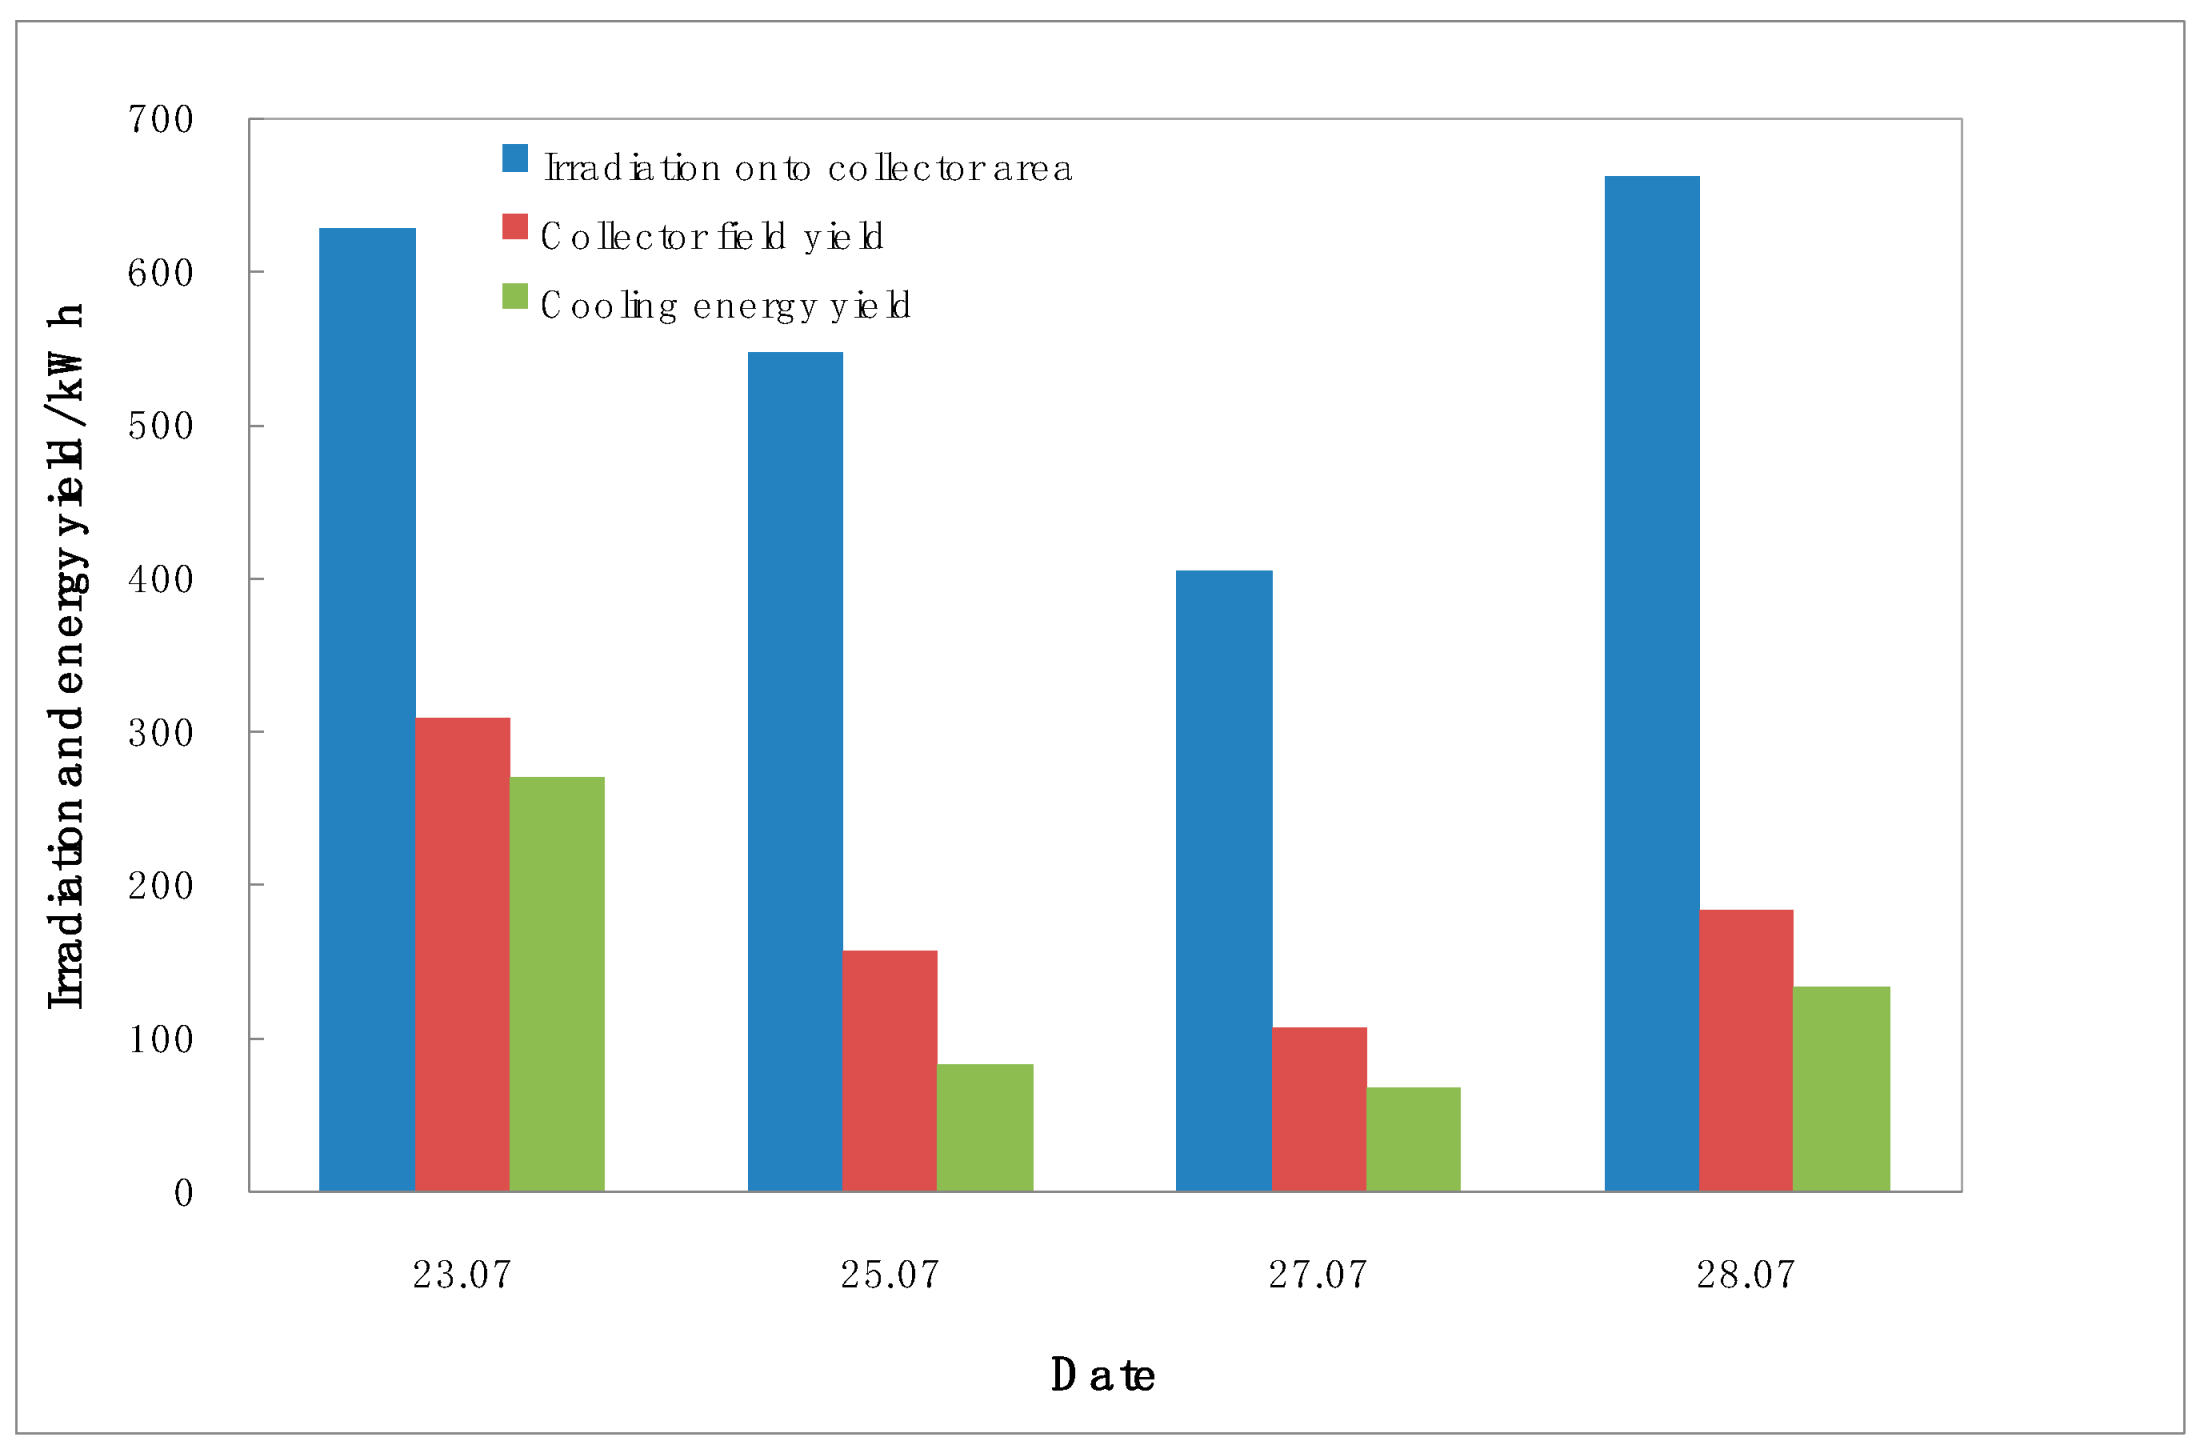
4.2. Solar Collector Field

The collector efficiency η is given by Equation (1):
η = Q s c Q s o l a r = F 1 · c p , w · ( T 3 T 6 ) I s o l a r · A c o l ,
where Qsolar and Qsc represent the total solar energy available and solar energy collected; Isolar is the solar irradiation; Asolar is the aperture area of the solar collectors; F1 is the inlet mass flow rate of the collector filed; cp,w is the specific heat of water; T3 and T6 are the outlet and inlet temperatures of the solar collection loop, respectively; and η is the collector efficiency, with an uncertainty of 3.3% due to the measurement errors.
Figure 10 presents the monthly solar irradiation onto the collector area and the collector field yield. The solar irradiation onto the collector area from May to October was 94,878 kWh and the collector field yield was 41,849 kWh during the summer cooling time. The annual average collector efficiency for building cooling was 44%, with a maximum of 47% in August. On the other hand, the solar irradiation onto the collector area from December to March was 42,709 kWh and the collector field yield was 18,221 kWh during the winter heating time. The annual average collector efficiency for building heating was 42%.
Figure 11 shows the hourly solar irradiation onto the collector area and the collector field yield on 23 July 2018. The daily solar irradiation and collector field yield were 627.7 kWh and 308.5 kWh, respectively. The daily average collector efficiency was 49%.

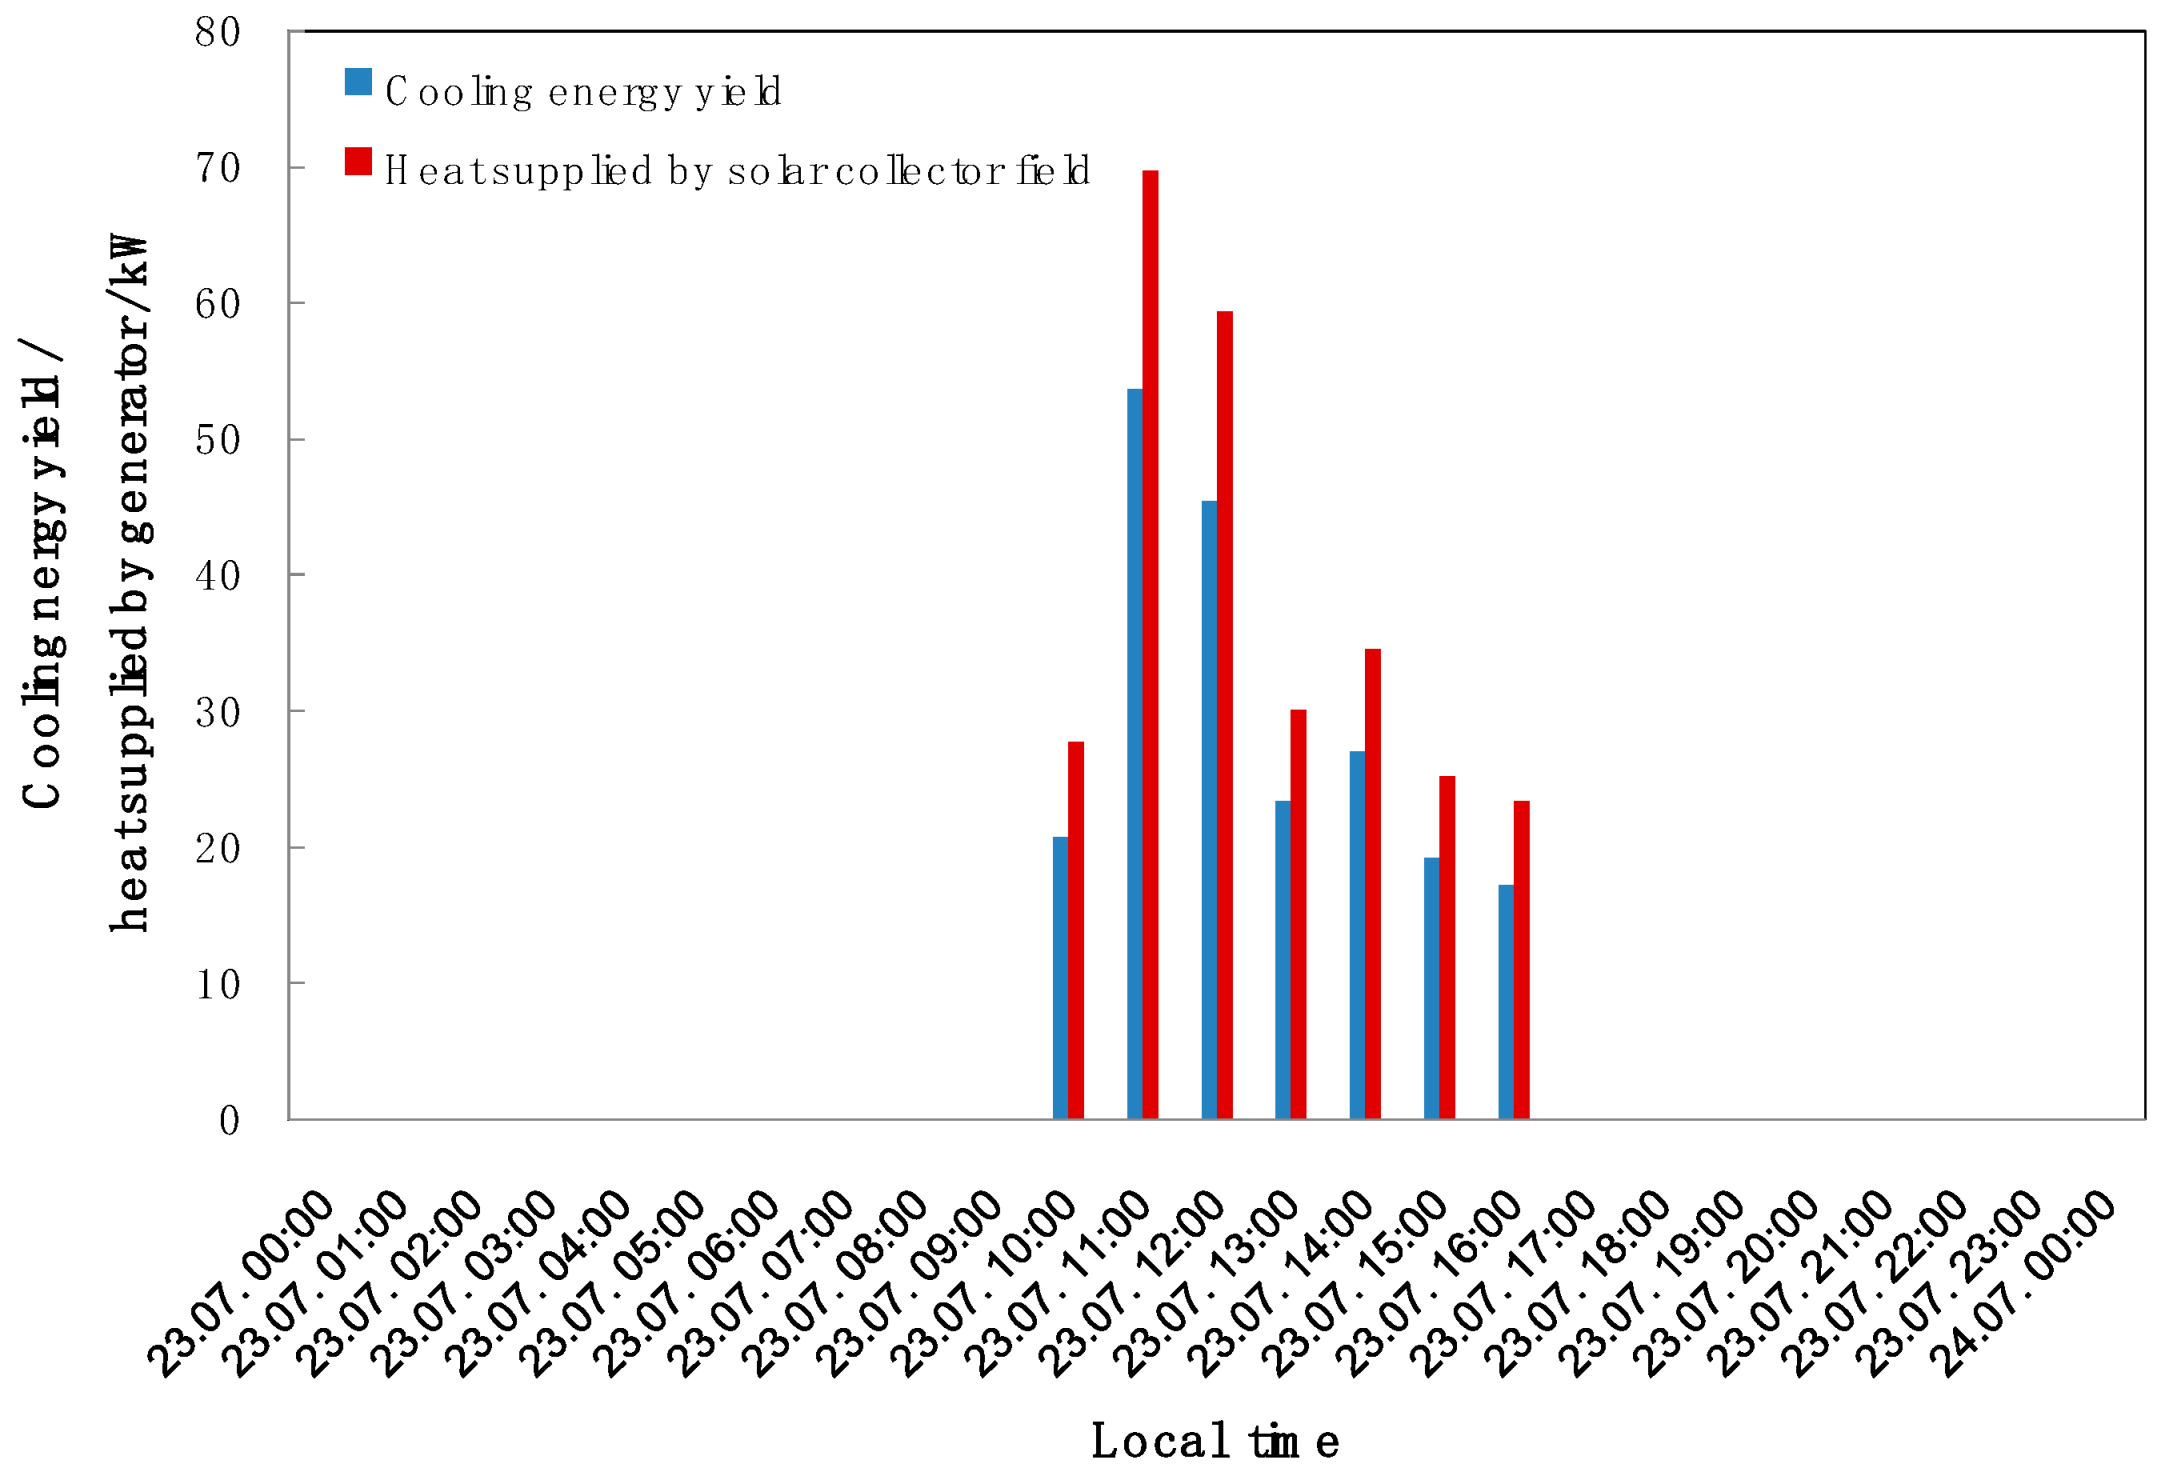
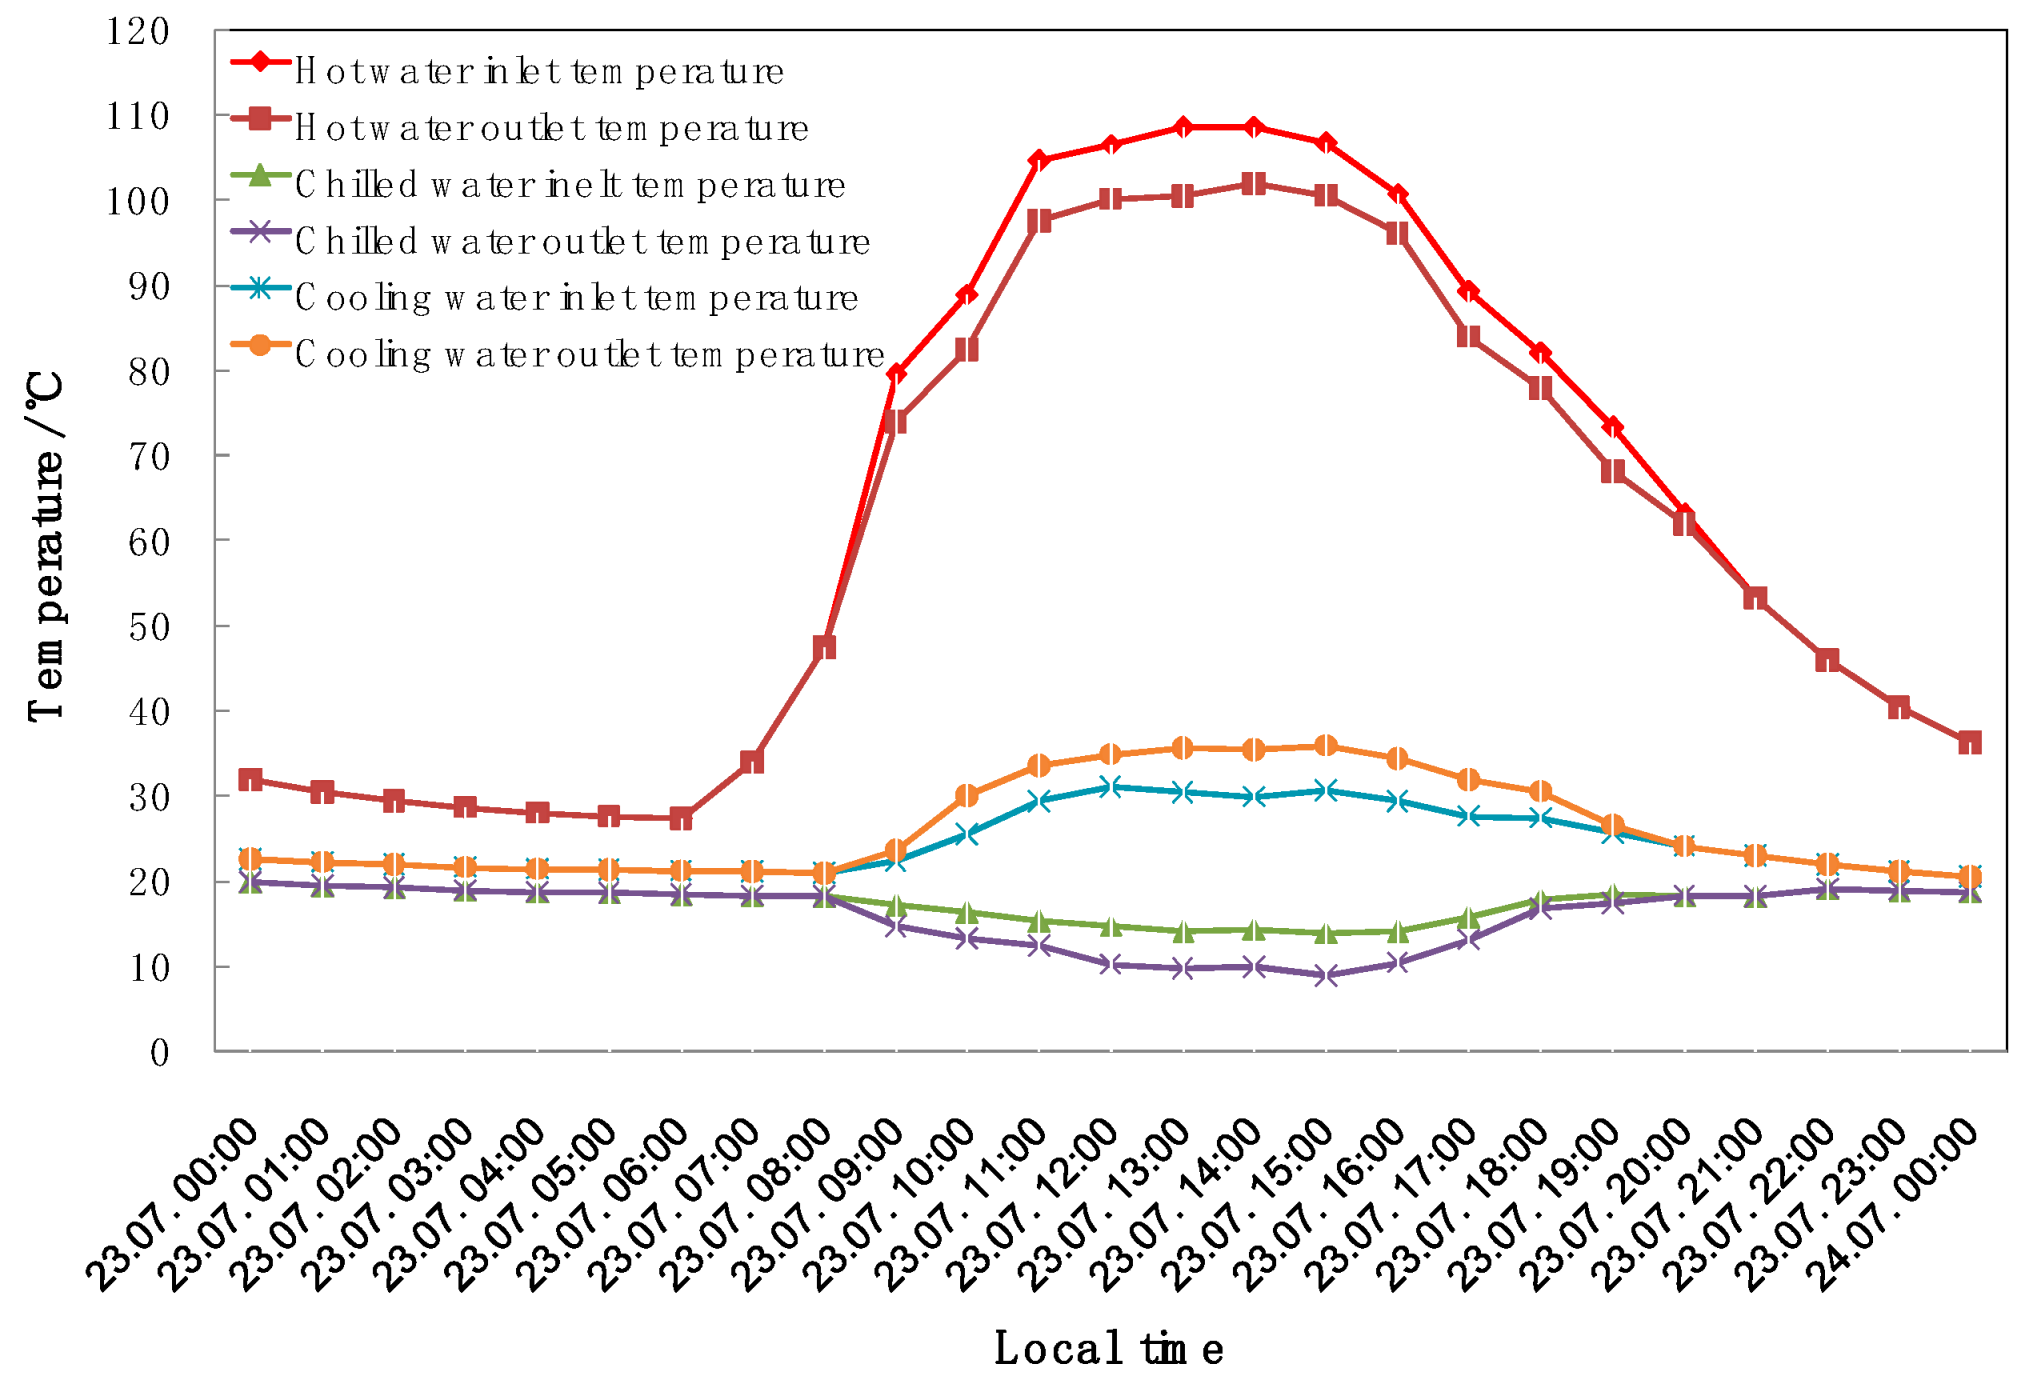
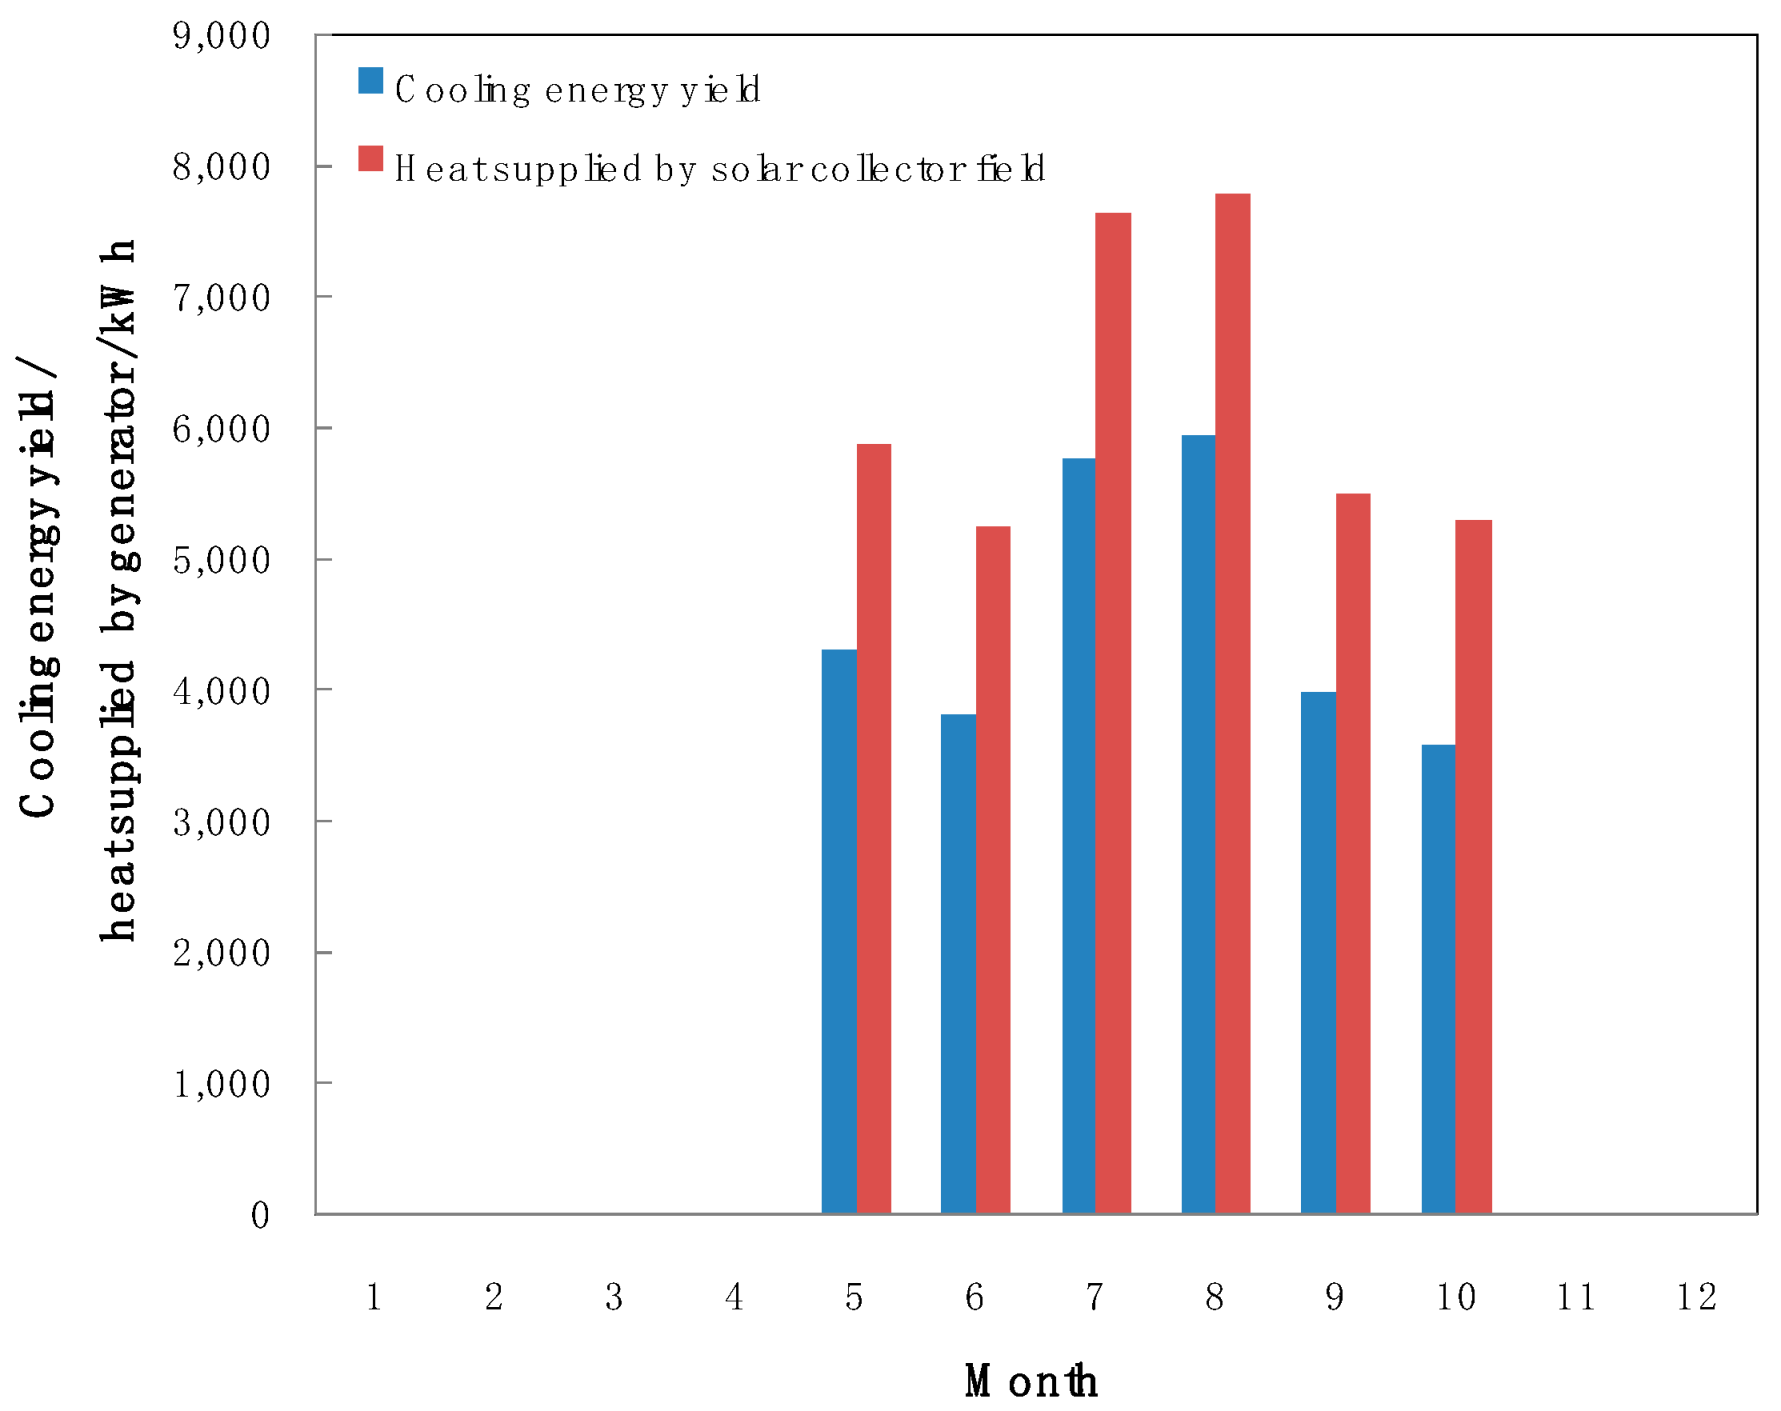
4.3. Absorption Chiller
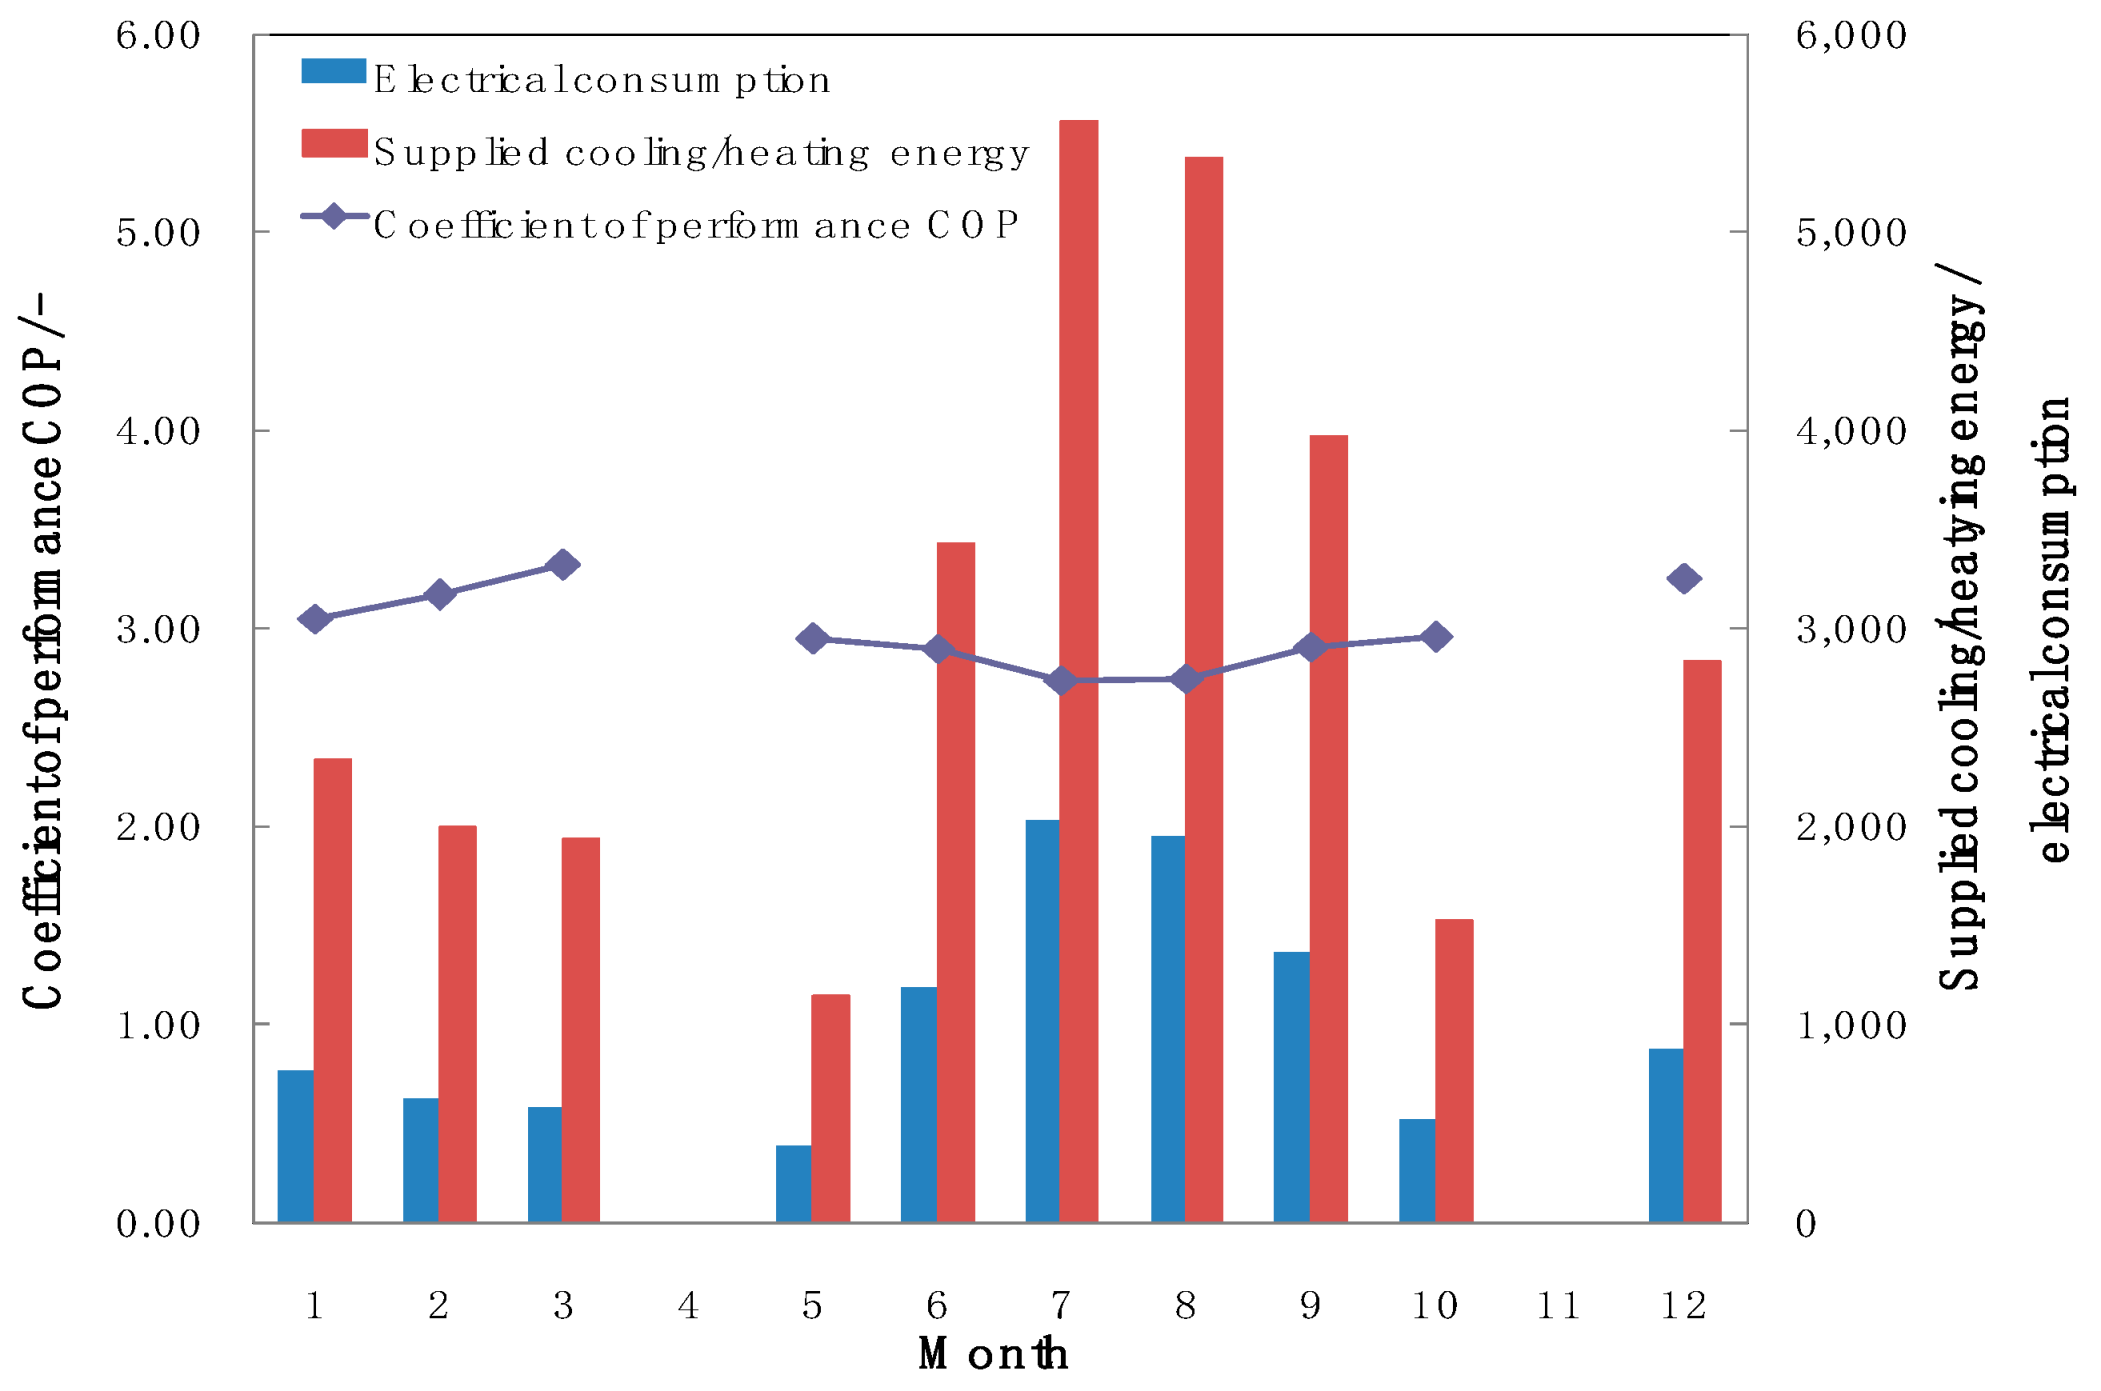
The coefficient of performance of the absorption chiller COPchiller is defined as the ratio of cooling energy yield and heat supplied by the generator. It is determined on the basis of the Equation (2):
C O P c h i l l e r = Q c Q s c = F 3 · c p , w · ( T 11 T 10 ) F 1 · c p , w · ( T 3 T 6 ) ,
where Qsolar, Qsc and Qc represent the total solar energy available, solar energy collected, and cooling energy generated by the chiller driven by solar; Isolar is the solar irradiation; Asolar is the aperture area of the solar collectors; F1 and F3 are the mass flow rate of the hot water of the absorption chiller and that of the chilled water, respectively; cp,w is the specific heat of water; T3 and T6 are the outlet and inlet temperatures of the solar collection loop, respectively; T10 and T11 are the chilled water outlet and inlet temperatures of the absorption chiller, respectively; COPchiller is the coefficient of performance of the absorption chiller, with an uncertainty of 3.2% due to the measurement errors.
Figure 12 shows the monthly cooling energy yield of the absorption chiller and heat supplied by the solar collector field in 2018. The annual cooling energy yield and the heat supplied were 27,399 kWh and 37,318 kWh respectively. The monthly average COPchiller ranged between 0.68 and 0.76. The yearly average COPchiller was 0.73.
Figure 13 presents the hourly cooling energy yield of the absorption chiller and heat supplied by generator on 23 July 2018. The absorption chiller was able to produce chilled water for 6 h from 10:00 to 16:00. The daily cooling energy yield of the absorption chiller and the heat supplied by the solar collector field were 207.1 kWh and 270.5 kWh respectively. The average coefficient of performance COPchiller was 0.76, with maximums of 0.78 at 13:00 and 14:00 when the inlet hot water reached its highest temperature. It was found that the COPchiller increased with the rising hot water inlet temperature.
Figure 14 presents the hourly hot water, chilled water, and cooling water inlet and outlet temperatures on 23 July 2018. The hot water inlet temperature from the solar collector field reached 106.6 °C at 12:00, after 2 h of operation and it remained constant for about 4 h before decreasing. The chilled water outlet temperature decreased until reaching a minimum value of 10 °C at 12:00. It remained constant for about 4 h and then started increasing. Similarly, the cooling water outlet temperature increased until reaching a maximal value of 35 °C at 12:00. It remained constant for about 4 h, and then started decreasing.

4.4. Heat Pumps

The coefficient of performance of the heat pumps COPhp is defined as the ratio of cooling/heating energy yield and electrical consumption. It is determined on the basis of the Equations (3) and (4):
C O P h p , c = Q t Q c E 1 = F 4 · c p , w · ( T 17 T 16 ) F 3 · c p , w · ( T 11 T 10 ) E 1 ,
C O P h p , h = Q t Q h E 1 = F 4 · c p , w · ( T 17 T 16 ) F 2 · c p , w · ( T 4 T 5 ) E 1 .
The solar fraction SFn is defined as the ratio of the generated cooling or heating by solar to the total generated cooling or heating energy by solar and the heat pumps which corresponds to the total cooling or heating energy used by the fan coils. It can be calculated with the Equations (5) and (6):
S F n , c = Q c Q t = F 3 · c p , w · ( T 11 T 10 ) F 4 · c p , w · ( T 17 T 16 ) ,
S F n , h = Q h Q t = F 2 · c p , w · ( T 4 T 5 ) F 4 · c p , w · ( T 17 T 16 ) ,
where Qt, Qc, and Qh are the total cooling or heating energy used, cooling energy generated by the chiller driven by solar and heating energy generated by solar, respectively; F2, F3, and F4 are the hot water inlet flow rate of the absorption chiller, chilled water inlet flow rate of the absorption chiller and inlet flow rate of the fan coils, respectively; cp,w is the specific heat of water; T4 and T5 are the upper layer temperature and lower layer temperature of the hot water storage tank, respectively; T10 and T11 are the chilled water outlet and inlet temperatures of the absorption chiller, respectively; T16 and T17 are the inlet temperature and outlet temperature of the fan coils, respectively; E1 is the electrical consumption of the heat pumps; COPhp,c and COPhp,h are the coefficient of performance of the heat pumps during the summer cooling time and that during the winter heating time, respectively, with an uncertainty of 3.5% due to the measurement errors; SFn,c and SFn,h are the solar fraction for building cooling and heating, respectively, with an uncertainty of 3.2% due to the measurement errors.
Figure 15 shows the monthly cooling/heating energy supplied, the electricity consumption, and the coefficient of performance of the heat pumps COPhp in 2018. The heat pumps produced a total of 21,019 kWh cooling energy and 9104 kWh heating energy in 2018, corresponding to the electrical consumption of 7439 kWh for cooling and 2851 kWh for heating, respectively. The average coefficient of performance for cooling COPhp,c was 2.83, with minimums of 2.74 and 2.75 in July and August, respectively. The average coefficient of performance for heating COPhp,h was 3.20.
In order to determine the influence of the heat pumps on the system performance, the heat pumps were switched off on 25, 27, and 28 July 2018 and the system performance was analyzed. As shown in Figure 16, the energy yield and the solar fraction distinctly decreased without the heat pumps as the auxiliary system. The daily global irradiation onto the collector area was 661.6 kWh on 28 July, which was similar to that of 627.7 kWh on 23 July. However, the collector field yield and the cooling energy yield were 183.9 kWh and 133.7 kWh, respectively, which were only 60% and 50% of those values on 23 July when incorporated with the heat pumps.

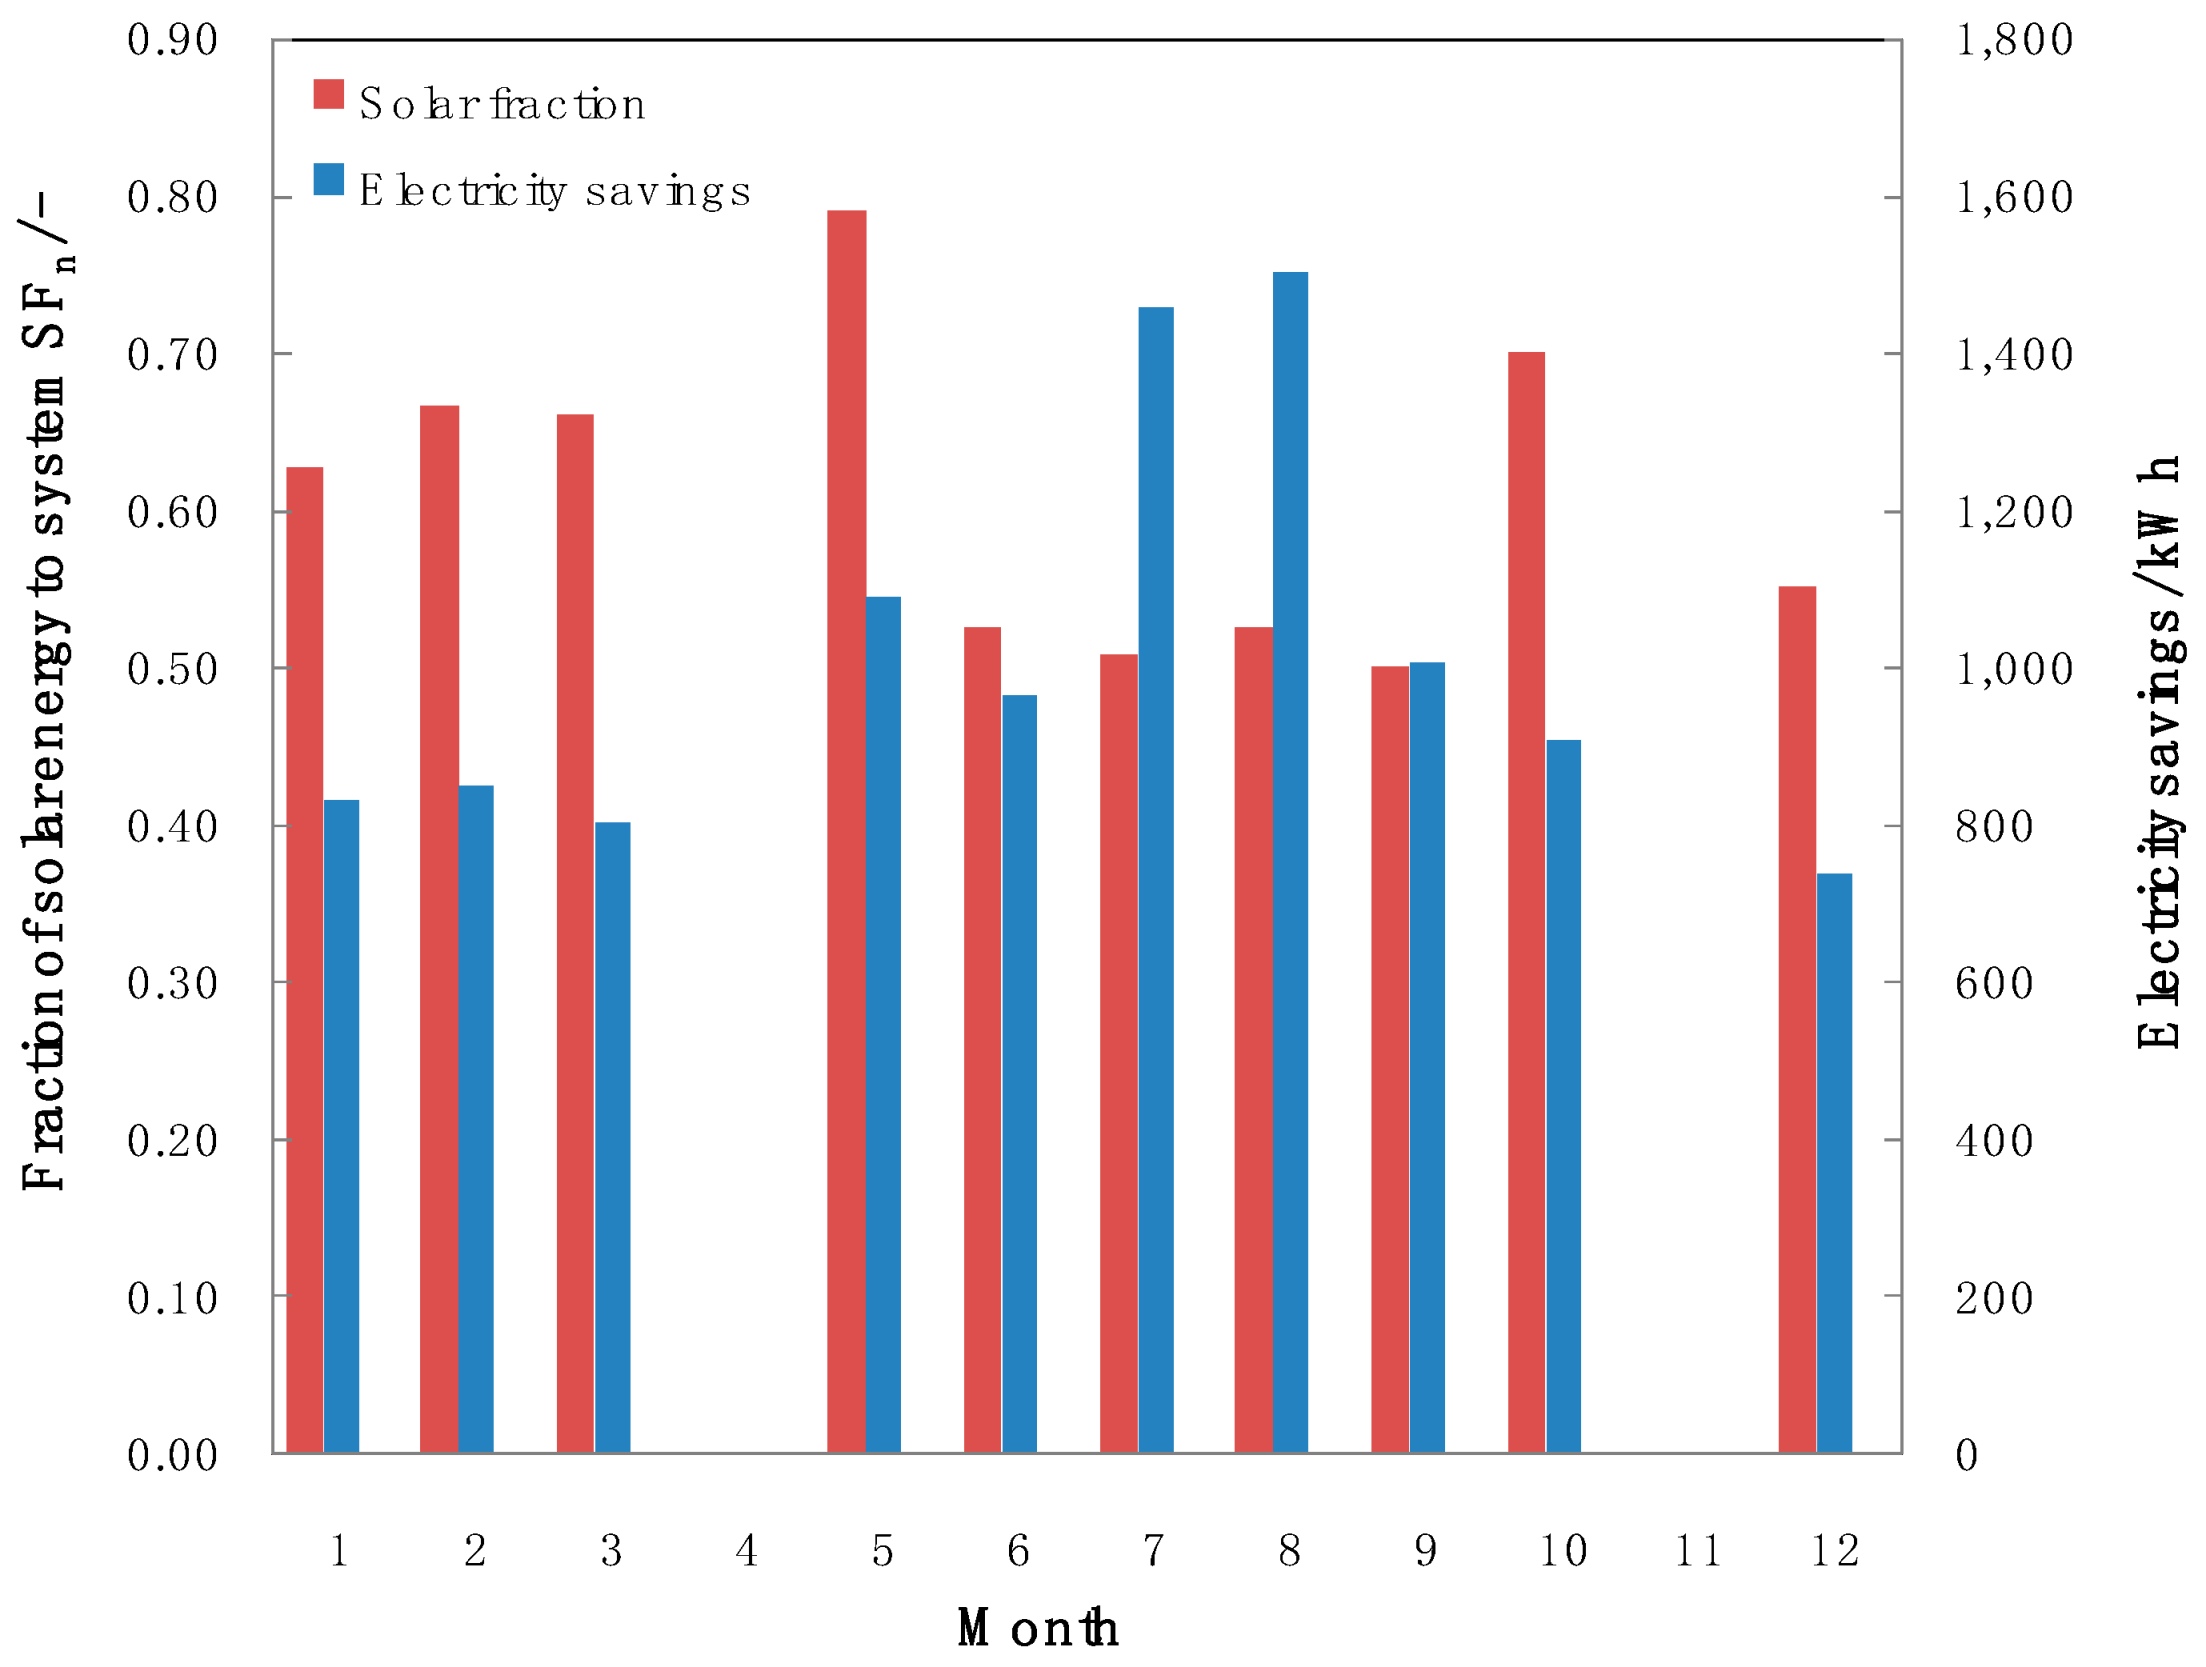
4.5. Electricity Savings and Emission Reduction

Figure 17 shows the monthly solar fraction SFn and electricity savings in 2018. The annual mean solar fractions for cooling and heating were 56.6% and 62.5%, respectively. This means that 43.4% of the annual building cooling demand and 37.5% of the annual building heating demand were covered by the heat pumps.
One of the essential purposes of the solar cooling and heating systems is to reduce the use of non-solar energy sources such as electricity or fossil fuel burning, which also results in a reduction of CO2 emissions [6]. There are 536 g of CO2 emitted into the atmosphere for each kWh of electricity produced. Thus, the conversion factor to calculate the quantities of CO2 emitted is fc = 0.54 kg/kWh. Assuming that all building cooling and heating demands were covered by the two air-source heat pumps with the mean cooling COPhp,c of 2.83 and mean heating COPhp,h of 3.20, the annual total electricity consumption was 24,699 kWh. The yearly electricity saving was 10,158.6 kWh when combined with the solar cooling and heating system, which accounted for 41.1% of the total electricity consumption for the building cooling and heating and corresponds to 5445 kg of CO2 emissions prevented from being released into the atmosphere.

5. Discussion and Conclusions

An absorption solar cooling and heating system assisted by two air-source heat pumps located in Ningbo City, China was studied in this paper. The system started operating in 2018 and the operational results were evaluated. Based on this study, the main conclusions are as follows:
  • The solar collector field was comprised of 40 all-glass evacuated tube modules with a total aperture area of 120 m2. The annual average collector efficiency was 44%for building cooling and 42% for building heating.
  • The single-stage and LiBr–water based absorption chiller had a cooling capacity of 35 kW. The monthly average coefficient of performance COPchiller ranged between 0.68 and 0.76 in 2018. The COPchiller increased with the rising hot water inlet temperature.
  • Two air-source heat pumps each with a rated cooling capacity of 23.8 kW and heating capacity of 33 kW were used as the auxiliary system for the solar cooling and heating installation. The average coefficient of performance COPhp,c was 2.83 in 2018, with minimums of 2.74 and 2.75 in July and August, respectively. The average coefficient of performance for heating COPhp,h was 3.20.
  • The energy yields distinctly decreased without the heat pumps as the auxiliary system. In comparison with the case combined with the heat pumps under similar irradiation conditions, the collector field yield and cooling energy yield decreased by more than 40%.
  • Two kinds of operational modes were conducted, namely, the building cooling and heating modes. The annual mean solar fractions for cooling and heating were 56.6% and 62.5%, respectively. The yearly electricity saving was 10,158.6 kWh when combined with the solar cooling and heating system, which accounted for 41.1% of the total electricity consumption for building cooling and heating and corresponds to 5445 kg of CO2 emissions prevented from being released into the atmosphere.

Author Contributions

Methodology and writing—original draft preparation, L.H.; Project administration, R.Z.; Data curation, U.P.

Funding

This research was funded by a grant from the National Key Technology Support Program of the Twelfth Five-Year of the People’s Republic of China, grant number 2013BAJ10B06, project title “The integration and demonstration of construction technology on the ecosystem villages and towns and well-off residences in the southeast coastal area.”

Acknowledgments

All support given for this paper is covered by the author contribution and funding sections.

Conflicts of Interest

The authors declare no conflict of interest.

Nomenclature

AsolarAperture area of solar collectors, m2
COPchillerCoefficient of performance of the absorption chiller
COPhp,cCoefficient of performance of the heat pump for cooling
COPhp,hCoefficient of performance of the heat pump for heating
E1Electrical consumption of the heat pumps, kWh
F1Inlet flow rate of the collector field, kg/s
F2Hot water inlet flow rate of the absorption chiller, kg/s
F3Chilled water inlet flow rate of the absorption chiller, kg/s
F4Inlet flow rate of the fan coils, kg/s
IsolarSolar radiation, W/m2
QcCooling energy generated by the chiller driven by solar, kWh
QhHeating energy generated by solar, kWh
QscSolar energy collected, kWh
QsolarTotal solar energy available, kWh
QtTotal cooling or heating energy used, kWh
SFn,cCoefficient of performance of the heat pumps during the winter heating time
SFn,hCoefficient of performance of the heat pumps during the summer cooling time
T0Ambient temperature, °C
T1Temperature of the collector array 1, °C
T2Temperature of the collector array 2, °C
T3Outlet temperature of the collector field, °C
T4Upper layer temperature of the hot water storage tank, °C
T5Lower layer temperature of the hot water storage tank, °C
T6Inlet temperature of the collector field, °C
T7Antifreeze temperature of the collector field, °C
T8Hot water inlet temperature of the absorption chiller, °C
T9Hot water outlet temperature of the absorption chiller, °C
T10Chilled water outlet temperature of the absorption chiller, °C
T11Chilled water inlet temperature of the absorption chiller, °C
T12Cooling water outlet temperature of the absorption chiller, °C
T13Cooling water inlet temperature of the absorption chiller, °C
T14Upper layer temperature of the buffer tank, °C
T15Lower layer temperature of the buffer tank, °C
T16Inlet temperature of the fan coils, °C
T17Outlet temperature of the fan coils, °C
ηCollector efficiency

References

  1. Zhao, H.X.; Frédéric, M. A review on the prediction of building energy consumption. Renew. Energ. Rev. 2012, 4, 3586–3592. [Google Scholar] [CrossRef]
  2. Yang, X.M. The energy consumption and savings of public buildings in Shanghai. Master Thesis, Tongji University, Shanghai, China, 2007. [Google Scholar]
  3. Mugnier, D. State of the art for solar thermal or PV cooling and refrigeration. In Proceedings of the Solar Heating & Cooling Program SHC 2014 Conference, Beijing, China, 15 October 2014. [Google Scholar]
  4. Syed, A.; Izquierdo, M.; Rodriguez, P.; Maidment, G.; Missenden, J.; Lecuona, A.; Tozer, R. A novel experimental investigation of a solar cooling system in Madrid. Int. J. Refrig. 2005, 28, 859–871. [Google Scholar] [CrossRef]
  5. Pongtornkulpanich, A.; Thepa, S.; Amornkitbamrung, M.; Butcher, C. Experience with fully operational solar-driven 10 ton LiBr/H2O single-effect absorption cooling system in Thailand. Renew. Energy 2008, 33, 943–949. [Google Scholar] [CrossRef]
  6. Rosiek, S.; Batlles, F.Z. Integration of the solar thermal energy in the construction: Analysis of the solar-assisted air-conditioning system installed in CIESOL building. Renew. Energy 2009, 34, 1423–1431. [Google Scholar] [CrossRef]
  7. Bermejo, P.; Pino, F.J.; Rosa, F. Solar absorption cooling plant in Seville. Sol. Energy 2010, 84, 1503–1512. [Google Scholar] [CrossRef]
  8. Lizarte, R.; Izquerdo, M.; Marcos, J.D.; Palacios, E. An innovative solar-driven directly air-cooled LiBr-H2O absorption chiller prototype for residential use. Energy Build. 2012, 47, 1–11. [Google Scholar] [CrossRef]
  9. Balghouthi, M.; Chahbani, M.H.; Guizani, A. Investigation of a solar cooling installation in Tunisia. Appl. Energy 2012, 98, 138–148. [Google Scholar] [CrossRef]
  10. Hang, Y.; Qu, M.; Winston, R.; Jiang, L.; Widyolar, B.; Poiry, H. Experimental based energy performance analysis and life cycle assessment for solar absorption cooling system at University of Californian, Merced. Energy Build. 2014, 82, 746–757. [Google Scholar] [CrossRef]
  11. Marc, O.; Sinama, F.; Praene, J.P.; Lucas, F.; Castaing-Lasvignottes, J. Dynamic modeling and experimental validation elements of a 30 kW LiBr/H2O single effect absorption chiller for solar application. Appl. Therm. Eng. 2015, 90, 980–993. [Google Scholar] [CrossRef]
  12. Xu, Z.Y.; Wang, R.Z.; Wang, H.B. Experimental evaluation of a variable effect LiBr–water absorption chiller designed for high-efficient solar cooling system. Int. J. Refrig. 2015, 59, 135–143. [Google Scholar] [CrossRef]
  13. Sumathy, K.; Huang, Z.C.; Li, Z.F. Solar absorption cooling with low grade heat source—A strategy of development in South China. Sol. Energy 2002, 72, 155–165. [Google Scholar] [CrossRef]
  14. Li, J.; Bai, N.; Ma, W. Large solar powered air conditioning-heat pump system. Acta Energiae Solaris Sinica 2006, 27, 152–158. (In Chinese) [Google Scholar]
  15. Han, J.; Xie, G.; Feng, L. Demonstration project of Beiyuan solar energy system. In Proceedings of the Moderate and High Temperature Solar Collectors and Solar Heating and Cooling Conference, Shanghai, China, 2006. (In Chinese). [Google Scholar]
  16. Shirazi, A.; Taylor, R.A.; Morrison, G.L.; White, S.D. Solar-powered absorption chillers: A comprehensive and critical review. Energy Convers Manag. 2018, 171, 59–81. [Google Scholar] [CrossRef]
Figure 1. The monthly average outdoor temperature and global solar irradiation in Ningbo in 2018.
Energies 12 00996 g001
Figure 2. The hourly average outdoor temperature and global solar irradiation on 23 July 2018.
Energies 12 00996 g002
Figure 3. The tourist center and the office building marked with the red frame, which the solar cooling system serves.
Energies 12 00996 g003
Figure 4. The schematic of the solar thermal cooling and heating system.
Energies 12 00996 g004
Figure 5. Photos of the (left) solar collector field on the roof of a steel-structure parking shed and the (right) equipment room.
Energies 12 00996 g005
Figure 6. Photos of the (left) cooling tower and the (right) two heat pumps.
Energies 12 00996 g006
Figure 7. The schematic of the controlling and monitoring system: T0—the ambient temperature; T1—the temperature of the collector array 1; T2—the temperature of the collector array 2; T3—the outlet temperature of the collector field; T4—the upper layer temperature of the hot water storage tank; T5—the lower layer temperature of the hot water storage tank; T6—the inlet temperature of the collector field; T7—the antifreeze temperature of the collector field; T8—the hot water inlet temperature of the absorption chiller; T9—the hot water outlet temperature of the absorption chiller; T10—the chilled water outlet temperature of the absorption chiller; T11—the chilled water inlet temperature of the absorption chiller; T12—the cooling water outlet temperature of the absorption chiller; T13—the cooling water inlet temperature of the absorption chiller; T14—the upper layer temperature of the buffer tank; T15—the lower layer temperature of the buffer tank; T16—the inlet temperature of the fan coils; T17—the outlet temperature of the fan coils; Isolar—solar radiation; F1—the inlet flow rate of the collector field; F2—the hot water inlet flow rate of the absorption chiller; F3—the chilled water inlet flow rate of the absorption chiller; F4—the inlet flow rate of the fan coils; E1—the electrical consumption of the heat pumps.
Energies 12 00996 g007
Figure 8. The monthly average outdoor temperature and building cooling and heating energy demand in 2018.
Energies 12 00996 g008
Figure 9. The hourly building cooling load and average room temperature on 23 July 2018.
Energies 12 00996 g009
Figure 10. The monthly solar irradiation onto the collector area and the collector filed yield in 2018.
Energies 12 00996 g010
Figure 11. The hourly solar irradiation onto the collector area and the collector filed yield on 23 July 2018.
Energies 12 00996 g011
Figure 12. The monthly cooling energy yield of the absorption chiller and heat supplied by the solar collector field in 2018.
Energies 12 00996 g012
Figure 13. The hourly cooling energy yield of the absorption chiller and heat supplied by generator on 23 July 2018.
Energies 12 00996 g013
Figure 14. The hourly hot water, chilled water, and cooling water inlet and outlet temperatures on 23 July 2018.
Energies 12 00996 g014
Figure 15. The monthly supplied cooling/heating energy, the electricity consumption, and the coefficient of performance of the heat pumps COPhp in 2018.
Energies 12 00996 g015
Figure 16. The irradiation onto the collector area, the collector field yield, and the cooling energy yield on 23, 25, 27, and 28 July; the heat pumps were switched off on 25, 27, and 28 July2018.
Energies 12 00996 g016
Figure 17. The monthly solar fraction SFn and electricity savings in 2018.
Energies 12 00996 g017
Table 1. The construction characteristics of the building.
ParameterValue
Total U-value (W/m2·K)0.5
Window-to-wall area ratio (%)North13
West6
East25
South25
Type of windowFramePVC-U
GlassDouble clear (5/9/5)
U-window (W/m2·K)3.0
g-value window * (-)0.8
Air change (1/h)0.3
* g-value window: solar heat gain coefficient of window.
Table 2. The instruments and their calibration range and uncertainty.
ParameterInstrumentCalibration RangeInstrument Uncertainty
Ambient temperatureResistance Temperature Detector RTD−40–60 °C±0.6 °C
Fluid temperatureThermocouple, Type K0–200 °C±2.2 °C
Mass flowCoriolis flow and density meters0–2.7 kg/s±0.1–0.2%
Global solar radiationPyranometer0–2000 W/m2±1%
Electrical consumptionThree-phase multifunction energy meter0–999,999.99 kWh±1%

