1. Introduction
Power system security is an important subject for electricity companies that operate transmission networks, which depend on the system operating condition and contingencies and can lead to interruption of customer service [
1,
2,
3]. Thus, some methodologies seek to identify the safe operation of the power system [
2]. Although these procedures allow a safer operation, the large number of exogenous variables, such as maintenance that exceeds the planned time, emergency outage of transmission equipment, and volatility of renewable sources, lead the operation to a risk zone and new emergency actions.
A classic economic dispatch is commonly used to identify the generation costs of each unit, which considers constraints as Kirchhoff’s first and second laws with AC or DC models [
4]. The security-constrained economic dispatch (SCED) could include physical limits of equipment, operative limits, and contingencies [
5], and the solution is found with a security-constrained optimal power flow (SCOPF), in which the objective function can be the minimization of losses, minimization of power demand rationing, minimization of the cost of operation, and others. Security constraints imply the modeling of the power grid, which leads to an important high computational cost [
6]; therefore, economic dispatch models with security constraints are usually implemented by means of metaheuristic methods that imply lengthy execution time, or by means of exact models such as the interior point algorithm, which sometimes causes difficulties with convergence [
7].
With this, the economic re-dispatch is made to avoid overloads at the lowest cost, as implemented in [
8,
9]. In this case, particle swarm optimization (PSO) is used to optimize as a stable algorithm with respect to the convergence of the non-linear modeling of the power flow equations.
Other authors have implemented a similar economic dispatch model with classic constraints by using learning machines [
10]. In addition, an interesting algorithm was presented in [
11], which selects the generation to participate in an economic dispatch using a direct acyclic graph (DAG). This model has been proposed as an alternative for large networks and various operational areas. In [
12], a model that considers mixed integer linear programming (MILP) to minimize switch opening as a solution to reduce overloads is implemented. Further, in [
13] the overloads are reduced through fuzzy logic, whose model tries to recreate the actions of the network operators; however, this model does not take into account the generation cost.
In [
14], the online economic dispatch is implemented using the metaheuristics of Fuzzy Logic and Genetic Algorithm, which avoids the modeling of the complete AC system and the problems of non-convergence of exact solution methods. On the other hand, an exact solution method based on Primal Dual interior Point (PDIP) can be used [
15]; however, in order to execute the final solution algorithm, different simplification stages of the dispatch scenarios to be executed by clustering can be used, so that the appropriate selection of the scenarios will have a direct impact on the consolidation of the global optimum and compliance with the system constraints.
Middle- and long-term solutions seek to guarantee security and reliability within the network. On the one hand, middle-term solutions use contingency analysis through simulations to find network expansion that mitigate the constraints found in the analysis. On the other hand, short-term solutions and online operation are based on controlling constraints where the operator or intelligent algorithms monitor and control system variables. However, during online operation there is no time to perform network expansion; here, techniques consider variation of the network topology, new economic dispatches, stress control, load shedding, and others.
Security-constrained economic dispatch (SCED) uses algorithms that are of high computational cost, so they are not normally used in the online operation. Therefore, despite previous plans for the operation through middle- and short-term analysis to carry out the secure operation of power systems, deviations of the programmed resources and the projected variables are evidenced in the operation. Therefore, this paper proposes an online economic re-dispatch to mitigate overloads of transmission elements after N−1contingencies to reduce the risk of collapse [
16]. Because of the number of variables that contain the problem, the mathematical formulation can be simplified by distribution factors (DFs) such as the power transfer distribution factor (PTDF), the line outage distribution factor (LODF) [
17], and the outage transfer distribution factors (OTDF) [
4,
5,
18,
19,
20]. This technique has an advantage that allows the linearization of the power flow’s equations around an operation point. Thus, the contributions of the paper are defined as follows:
a mathematical model is formulated for the economic re-dispatch, together with the security constraints to be used for the online operation;
the system models are simplified to find quick solutions to the problem of contingencies, and are used in the formulation of the economic re-dispatch with constraints;
the input of the economic re-dispatch program is referred to the topology changes in the power grid, the availability of power generation, and the generation costs of the units;
and an on-line re-dispatch is presented to reduce the operational risk of generation outage and changes of power from renewable energies.
The rest of the paper is organized in three more sections:
Section 2 describes the main mathematical model of the online economic re-dispatch for the normal operation and the model of the online economic re-dispatch proposed for overloads; the sensitivity factors, which are applicable to the power flow and the online operation are included in the formulation.
Section 3 presents the power system test case and the results obtained by applying the formulation. Finally,
Section 4 includes the conclusions, recommendations and the future work in this research.
2. Methodology
In this section the mathematical formulation used for the application of the economic re-dispatch schemes, and the simplification of the formulation to apply the electrical constraints of the system are presented. In addition, we present the algorithms used for the economic re-dispatch in normal operation and the economic re-dispatch after contingencies.
2.1. Economic Re-Dispatch with Power Demand Rationing Cost
The online economic dispatch model to reduce overloads after N−1contingencies can be formulated as in Equation (1), where
is the power generation change in bus
i,
is the operational generation cost in bus
i,
power load shedding change in bus
i,
is the load shedding cost in bus
i, and
i = 1, 2, 3…
m buses. This equation corresponds to the objective function, which is used to minimize the operating cost of the system. The expression considers the sum of the generation cost and the cost of power demand rationing. It should be noted that the generation cost (
is assumed as a constant value that is expressed in terms of the cost per power supplied (
$/MWh), as well as the cost of power demand rationing. However, the latter is much greater than the generation cost and it can be considered as a constant value of great magnitude, because it is only required to help the convergence of the model:
The model starts with an initial condition, dispatching the central generation plants (), the power flowing through transmission elements () and the power demanded in the load buses of the power system (). In the present work, it is assumed that all these initial parameters are obtained online by measurement units as the supervisory control and data acquisition (SCADA), because this information can be managed from this type of application.
When there is no feasible safe dispatch and the power demand rationing can be applied to bus
i, the model would reflect that situation, obtaining a value of
greater than zero. In this case, the final power demanded in bus
i (
) would be reduced as expressed in Equation (2):
Therefore, the decision variable for power rationing (
) is modeled as a generator in each bus with power limits on the demand at each bus, as expressed in Equation (3):
The active generation or generation synchronized to the system is the only one that should be considered in the optimization model, because it is the only one that can be managed in real time. This generation could consider renewable generation sources such as solar, wind, and even battery banks (BESS).
Starting from the initial operation (
), the model calculates the deltas of generation (
), which are required to maintain a preventive condition where the N−1contingencies do not generate overloads. Once the model converges, the new power for each generator in bus
i (
will have a value calculated by Equation (4):
Equation (5) is used to prevent the total generation deviation from exceeding the allowed level of automatic generation control (AGC) for the online re-dispatch algorithm, where
represents the power reserves used for generation re-dispatch. This value of AGC can be managed by the
parameter, which could even be 0 MW. Equation (6) is used to avoid the operating limits of each generator are violated, where
and
are the maximum and minimum power generation in bus
, respectively:
The power that flows for each transmission element (
is calculated from the initial state
, which corresponds to the power measured online at transmission lines and transformers. To this value, the calculated delta of the power flow (
) and delta power rationing (
) are added, multiplied by the power transfer distribution factors PTDF that relate to the contribution of the power injection in the bus with respect to the transmission element (
), as shown in Equation (7):
Equation (8) corresponds to the security constraints that prevent the transmission elements from being overloaded above their allowed values, after generation changes and without contingencies; where
is the rated power flow of each transmission element
without contingencies:
Finally, the constraints in Equation (9), ensure that no N−1contingency leads to the overload of other elements, by including the sensitivity factor LODF (
between two lines. Herein, the term
refers to the maximum power flow for transmission element
under single contingencies:
2.2. Economic Re-Dispatch without Power Demand Rationing Cost
If an economic dispatch solution is required without power rationing, the objective function is defined as presented in Equation (10). This function considers minimizing the operating cost of the system:
The constraints defined above are maintained, and the power flowing through each transmission element is calculated from the initial power of the system, as shown in Equation (11):
In addition, Equation (2) is delete and Equation (3) is modified with the expression shown in Equation (12):
With this modification the model that considers electricity rationing is eliminated, and now the capacity of the transmission elements after contingencies is considered in the formulation. The variable allows the convergence of the model, even when the system is unsecure with critical contingencies, allowing security to be maximized. The critical contingencies correspond to all those contingencies that generate overloads and that said overload cannot be alleviated by any feasible online economic dispatch. Therefore, the result of this model corresponds to the most secure economic dispatch possible without considering the rationing and improving the capacity of the transmission elements to contingency.
Because the process is iterative according to the total number of critical contingencies, this implies that the model must be linearized around the point of operation whenever the topology of the system is altered from the evaluation of each critical contingency. The above implies that the matrix of PTDF sensitivity factors must be updated for each topology. However, there is another possibility to update the sensitivity matrix PTDF, by replacing this matrix with the calculation of the sensitivities known as OTDF [
21].
According to this, the power flow for transmission elements that was considered in Equation (7) is modified and the new expression is shown in Equation (13), where:
where
represents the sensitivity factor OTDF, that models the power flow distribution in a bus
k, to the monitored element
, considering the outage of an element
(for our case the critical contingency evaluated). Therefore, the calculation of the sensitivities for the modelling variations in the power flow after various topological changes becomes simpler, if it is formulated from the OTDF sensitivities matrix instead of PTDF.
2.3. Algorithm for the Online Economic Re-Dispatch
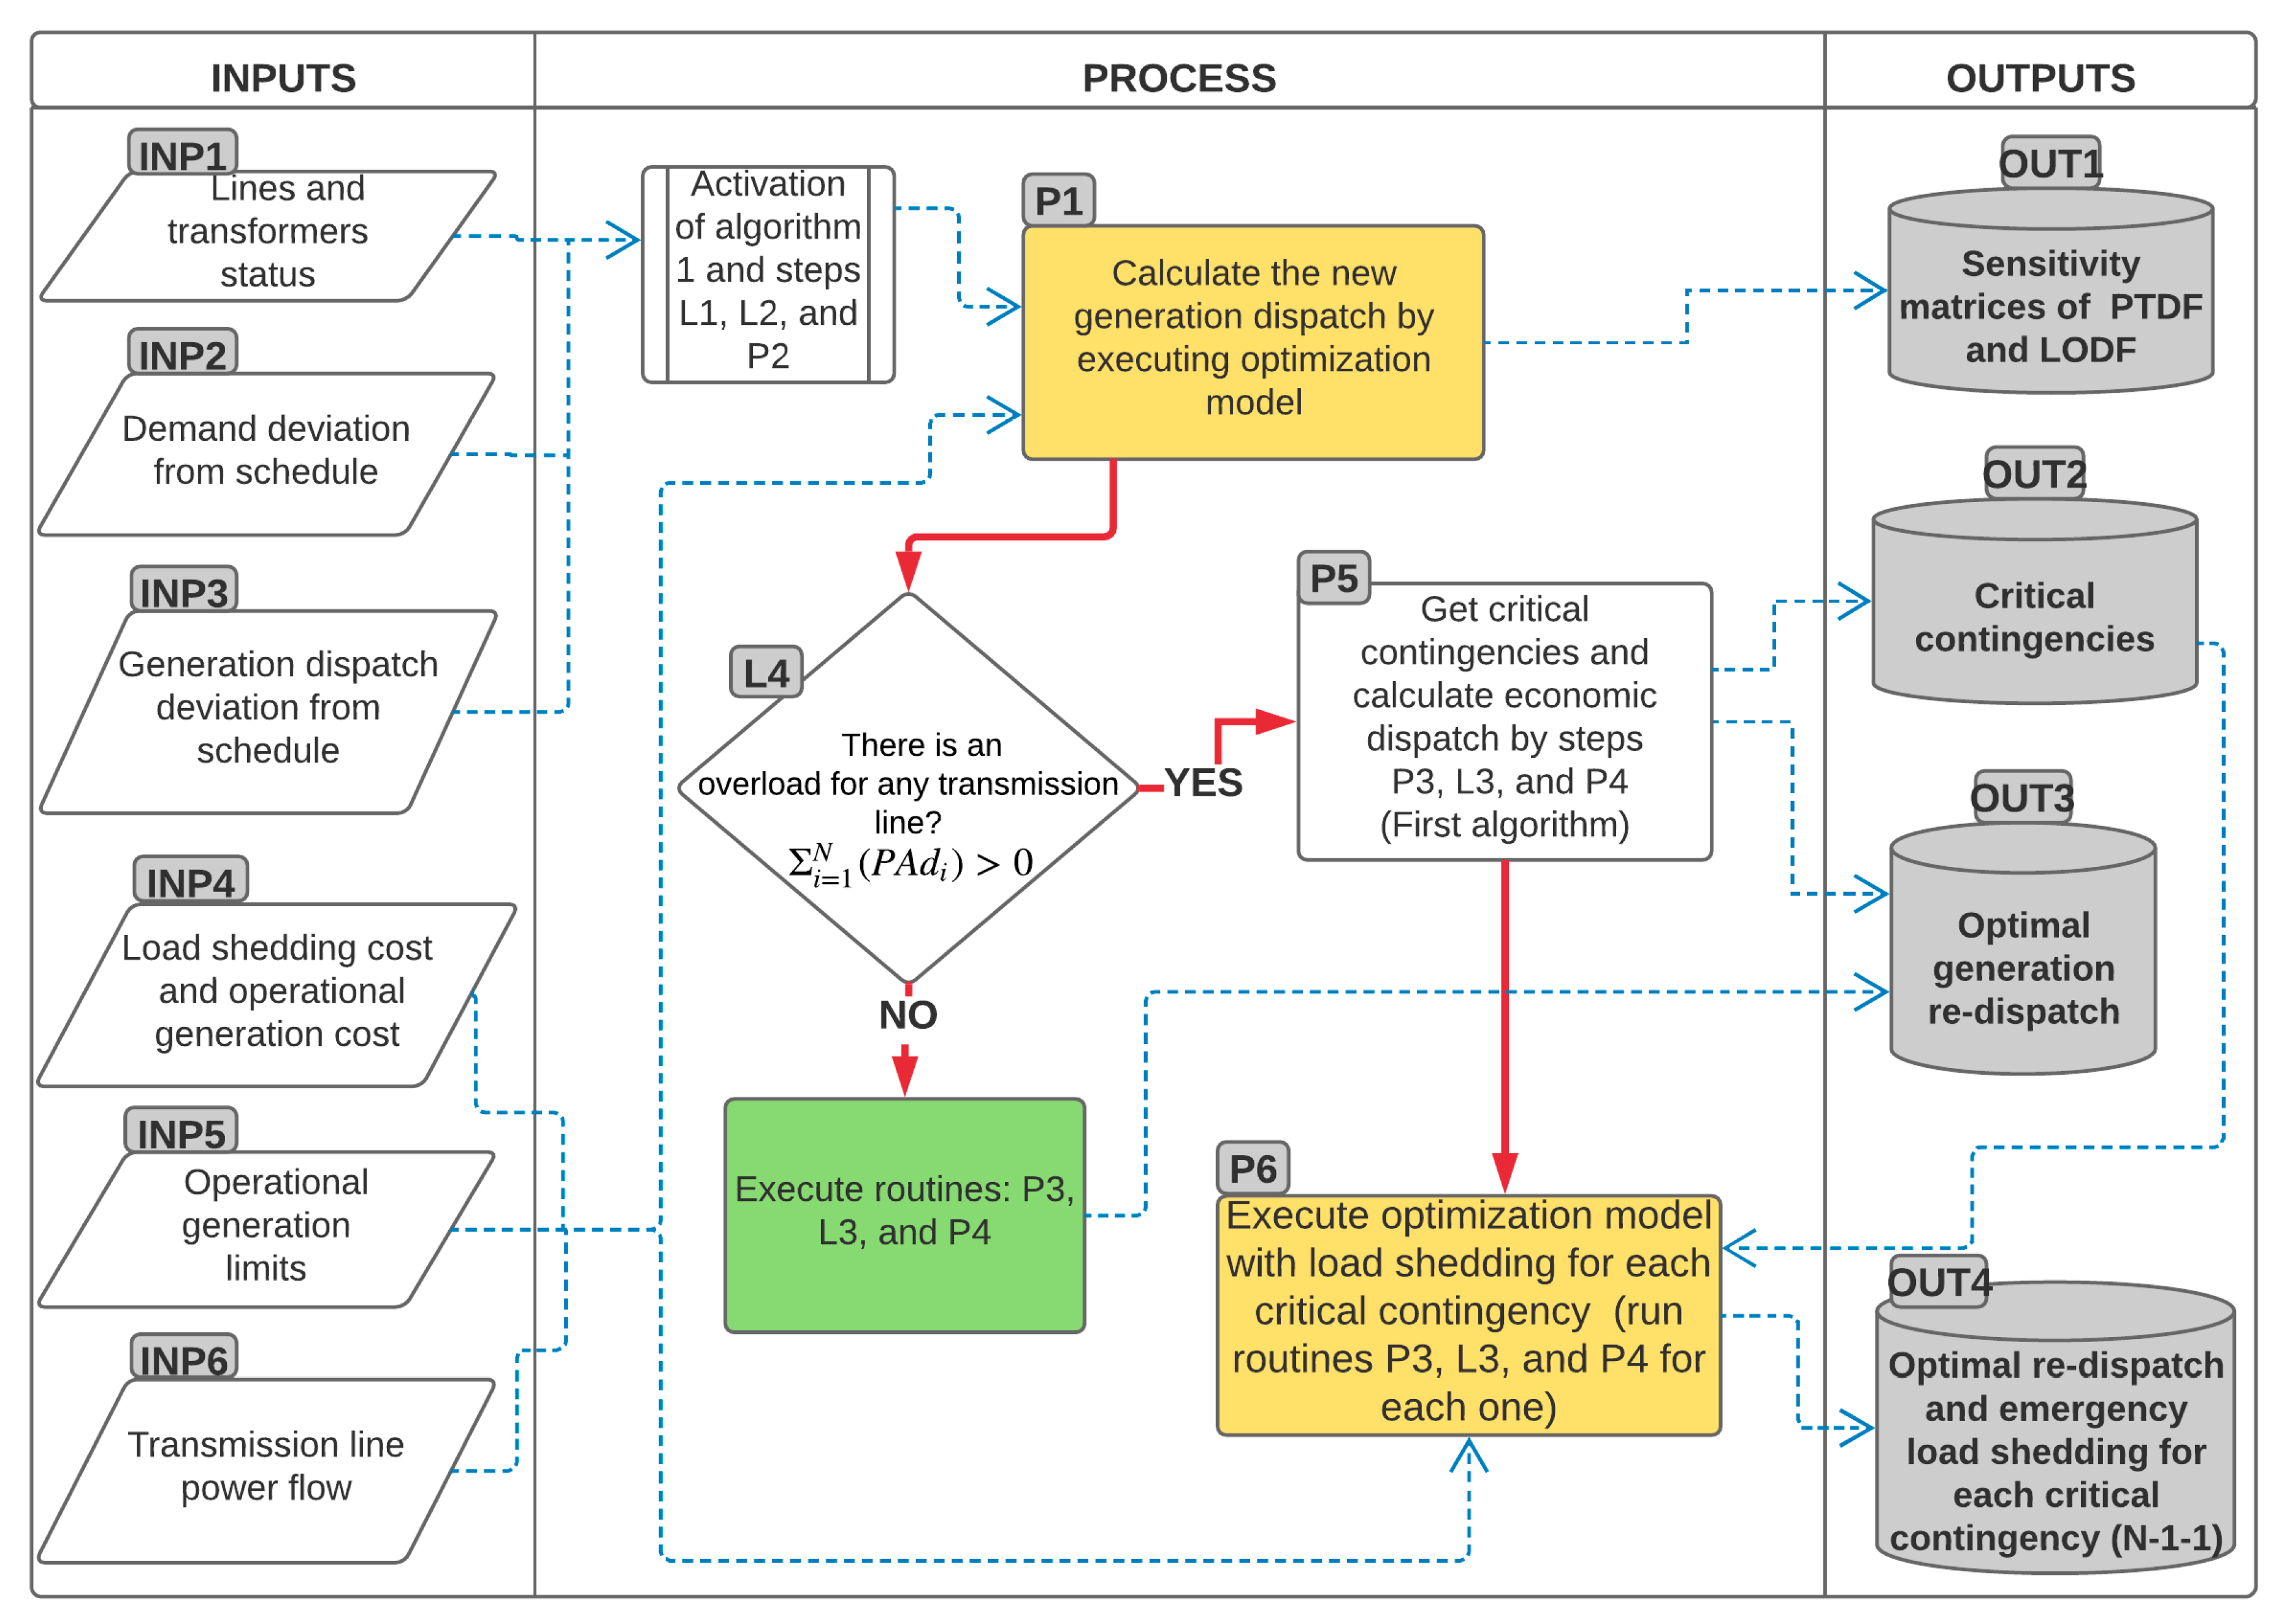
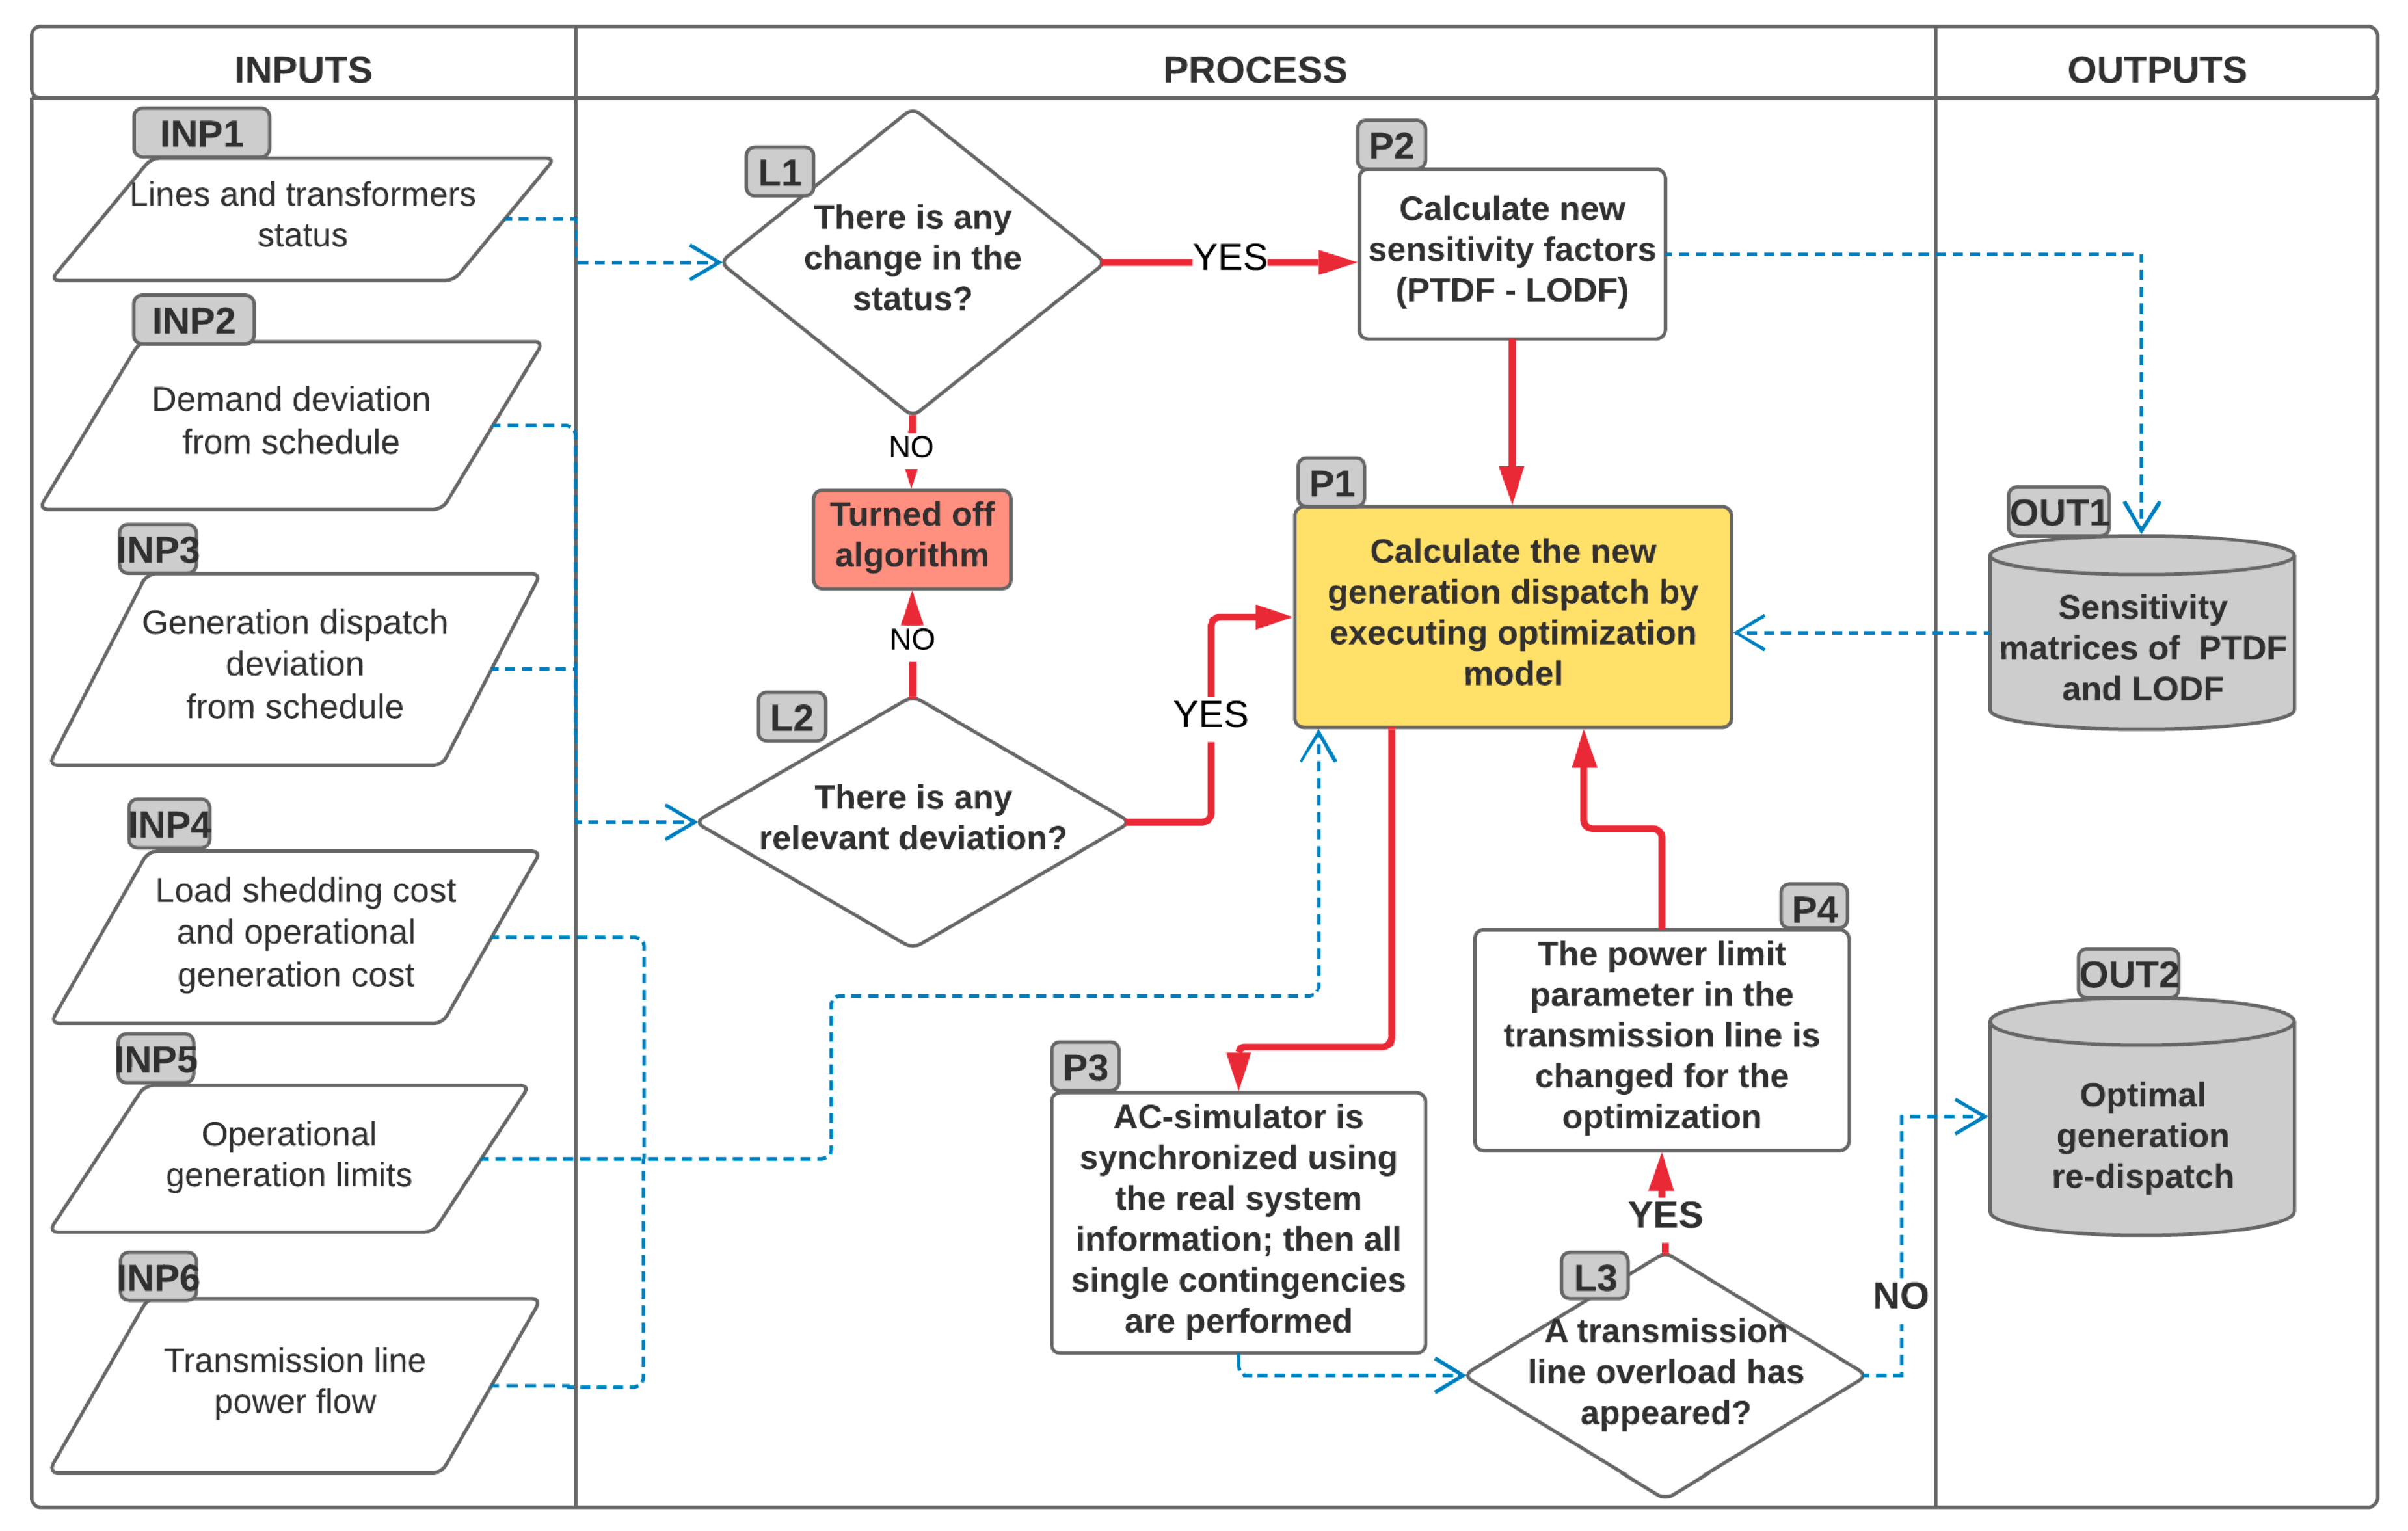
The general model of the online economic re-dispatch algorithm used in the research is presented in
Figure 1. The interaction between the power system information SCADA, the AC simulator, and the linear optimization model is observed.
The model is divided into three main stages. The first one (inputs) corresponds to the capture of information corresponding to the physical system. The second one (process) corresponds to the evaluation of this information and integration of the optimization models and AC simulator. Finally, the third one (outputs) corresponds to the economic re-dispatch solution in each operating state which could be implemented in an automated system or through operational actions of operators.
In the first stage of the complete methodology, the inputs of the system are considered as the required variables for the procedure. The input E1 corresponds to the status of the transmission lines and transformers, representing the elements that are in service (ON = 1) or out of service (OFF = 0). The input E2 defines the difference between the forecasted demand and the actual demand, representing the power deviation of the system. The input E3 corresponds to the difference between the scheduled power dispatch and the current power dispatch presented in the online transaction; for this, each generator must be monitored to calculate the deviation. The input E4 represents the price of each generator for the online operation period. The input E5 refers to the minimum and maximum limits of the generation plants, which, in the online operation, are considered variables, mainly in thermal plants and will depend on factors such as generator temperature, generator’s configuration (cycle center combined), start ramps, etc. The input E6 is the linearized model obtained from the current power system condition, and refers to the values of real power that flows through the various transmission elements that are monitored; it is not necessary to monitor or model the complete power system for use in the economic re-dispatch with overloads and after contingencies.
The second stage corresponds to the logic and subroutines of the general process. For example, the process L1 identifies the state of a line or transformer defined as in service (ON = 1) and out of service (OFF = 0). This logic can be implemented from measures of each element or switch positions. The process L2 corresponds to the logic in which the presence of a deviation of generation (E1) or demand (E2) is evaluated, so that the algorithm recognizes the presence of a deviation, it must be fulfilled; thus, if a deviation is greater than a value ArP, then the logic L1 can be expressed as the inequality ΔPi > ArrP.
Now, P1 refers to the economic re-dispatch optimization model with constraints and N−1contingencies. Herein, the optimization model does not consider the calculation of power demand rationing. Therefore, the optimization model defined in P1 uses the objective function of Equation (10) and the constraints of Equations (11), (12), and (13). P1 also corresponds to the main subprocess of the algorithm, because the solution of the economic re-dispatch is obtained from it, which is refined through the iterations with the AC simulator. Then, the process P2 includes the sensitivity factors PTDF and LODF, and the optimization model P1 is linearized from a current operating point. This process must be carried out whenever the topology of the network is modified, due to the deviations in the distribution of the power flows.
In the process P3 the operating state of the AC simulator must be coordinated, which implies that the state of lines and transformers in the simulator must be the same as in the real power system, as well as the power demand in the bus of the power system. However, the power dispatch to be implemented in the simulator must be that obtained through the process optimization model P1. Once the simulator is coordinated, N−1contingencies are executed with AC load flow. From the N−1contingency results obtained from process P3, the process L3 verifies that no overloads are presented in the elements. If an overload is detected in this process, then the process P4 is executed, correcting the maximum power overload with this change in the parameter of the optimization model; the process P1 is executed again thus obtaining an economic re-dispatch result, starting from the new iteration. If no overloads are detected in the process L3, then the final value is obtained.
2.4. Online Emergency Economic Re-Dispatch Algorithm
The model presented in
Figure 1 should not generate power demand rationing as a solution to the problem. Instead, an adaptable optimization model is necessary for the calculation of the secure dispatch and lowest cost without sacrificing the power demand and minimizing the overload of transmission elements after N−1contingencies. However, if critical contingencies are detected when applying the algorithm presented in
Figure 1, then the complementary algorithm presented in
Figure 2 is executed. This new processes perform the calculation of a new dispatch and emergency load shedding, for each one of the critical contingencies found in the P1 process. That is, in this second phase of the algorithm, a new dispatch is calculated with possible load shedding for each critical contingency. This complementary sub-algorithm for critical contingencies corresponds to an optional algorithm, and is useful in cases in which the network is not fully covered before all the possible N−1contingencies, or is useful in cases in which the only solution to avoid collapse is the load shedding.
According to the above, it is assumed that an emergency load shedding is considered because of critical contingencies. The previous algorithm could have an operation similar to that of a systemic protection supplementary scheme (SPS), but considering the minimization of the generation cost and minimization of load shedding, depending on the various operation points and topologies presented in online operation. The power demand rationing should always be the minimum possible. For this the complementary algorithm of
Figure 2 has been proposed, which, given the initial dispatch calculated in process P1, obtains the value of the new dispatch and emergency load shedding for each critical contingency.
In the process L4, the presence of critical contingencies is detected through the evaluation of the variable (
). If there is no risk due to critical contingencies, the algorithm behaves as shown in
Figure 1; otherwise, the complementary algorithm shown in
Figure 2, composed of P5 and P6, is executed. With the process P5, a most secure generation dispatch is obtained, despite the existence of critical contingencies. Additionally, the process L3 and processes P3 and P4—through which the economic re-dispatch is obtained from P1—is refined by iteration with the AC simulator.
Then, the process P6 considers an adapted optimization model, this time, with the objective of providing a solution of an economic re-dispatch with the possibility of load shedding for each of the critical contingencies. Therefore, the objective function formulated by Equation (1) is used, considering the constraints of the model presented from Equations (2) to (6). Additionally, the constraint in Equation (7) is not considered in the first part of the algorithm, because the calculation of the new economic re-dispatch and load shedding is performed after detecting critical contingencies. Thus, the optimization model is applied to the degraded network after critical contingency; therefore, from each critical contingency, a result of the new economic dispatch and different load shedding is obtained. Finally, the constraint presented in Equation (10) is not required for process P6.
3. Results
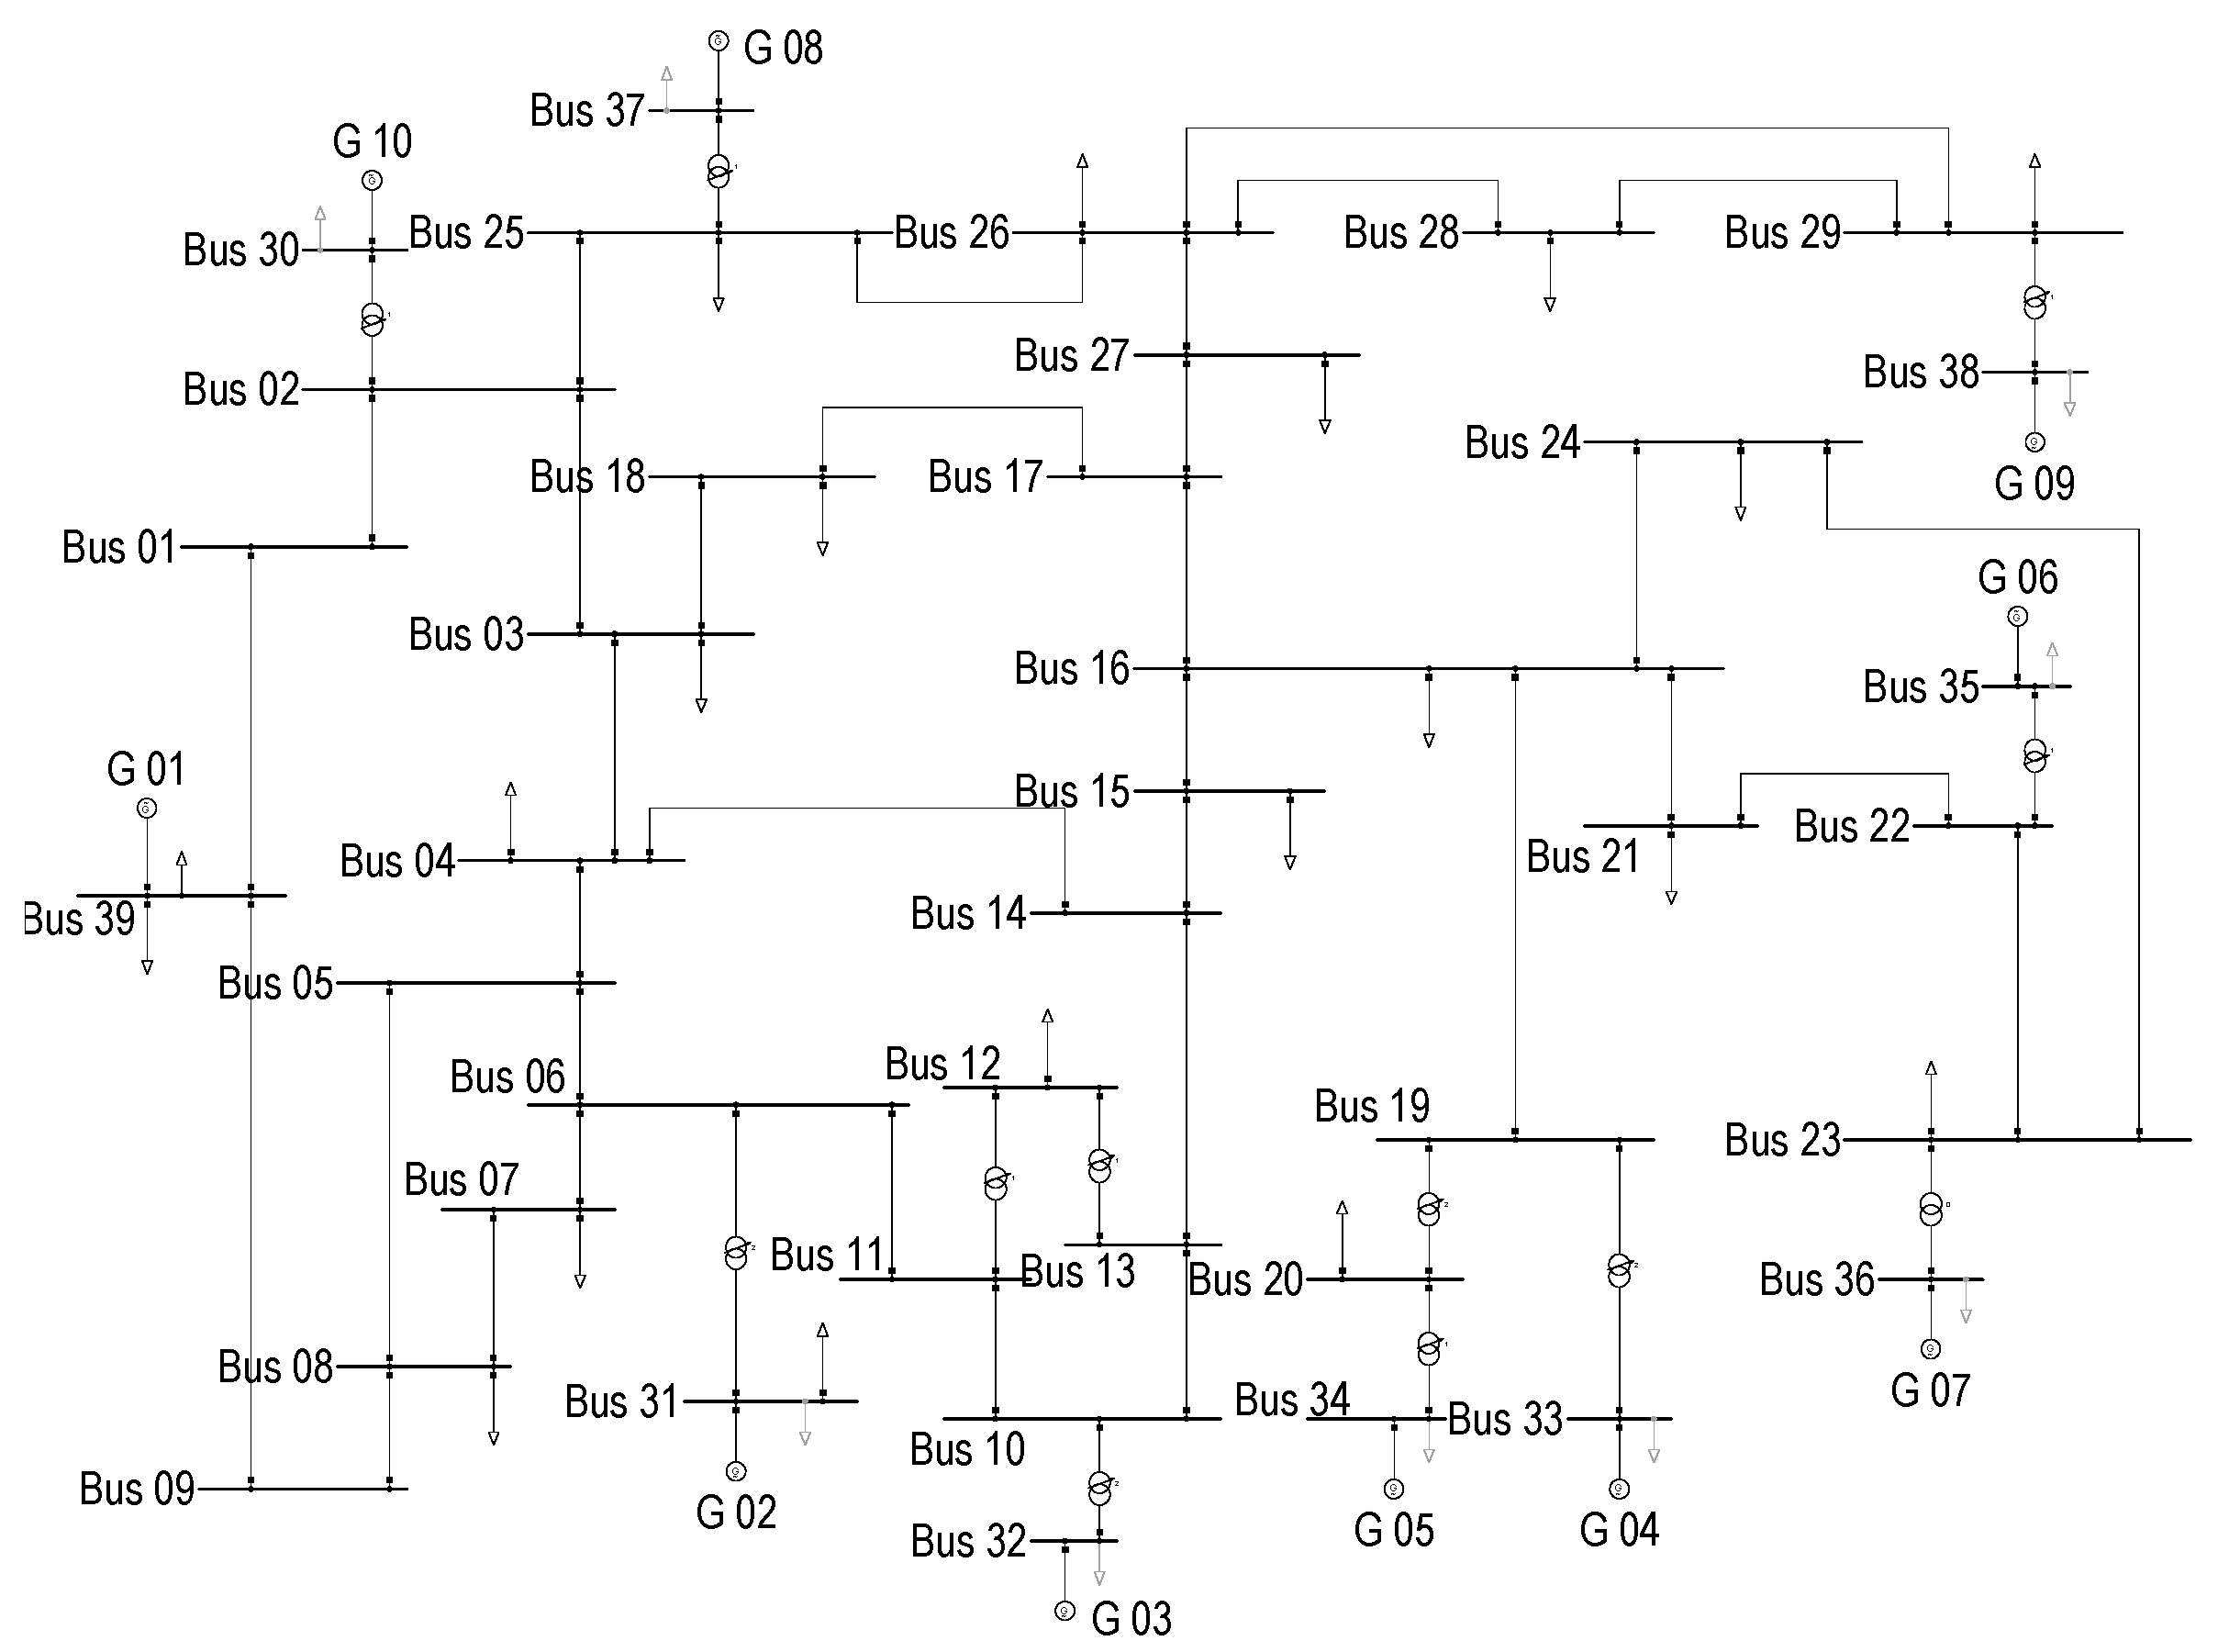
3.1. IEEE 39–Bus Power System Test Case
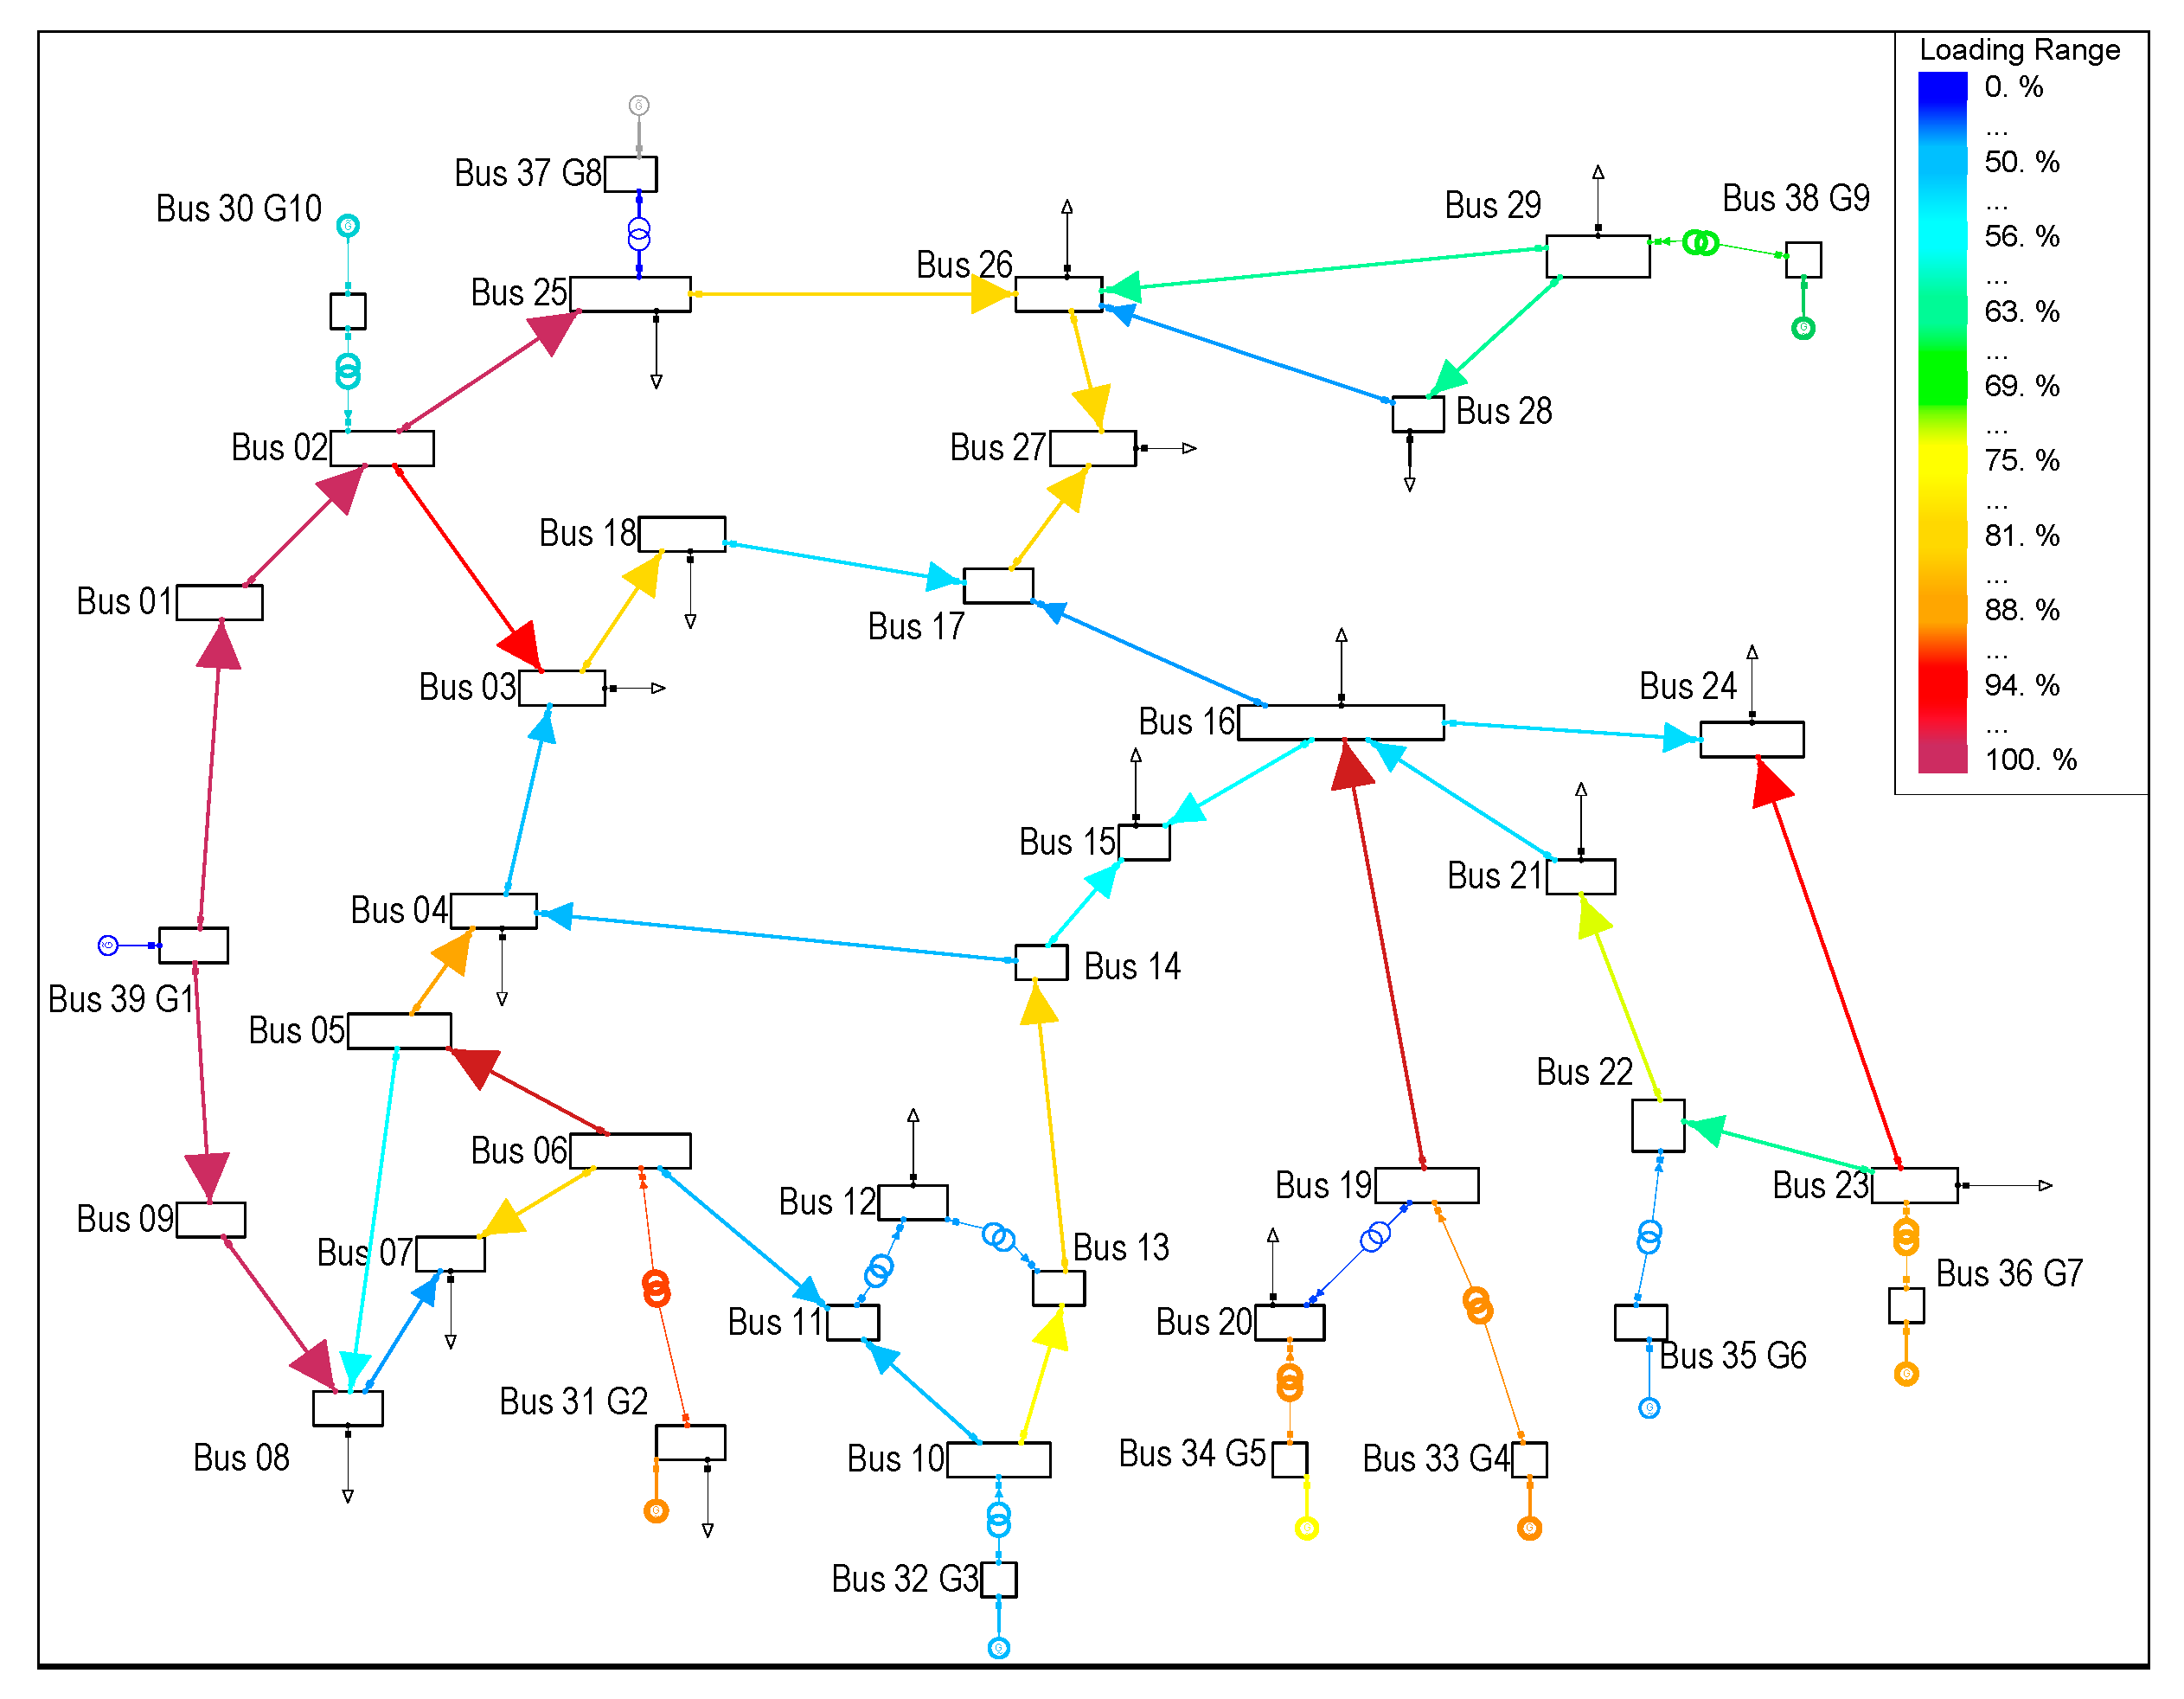
Figure 3 shows the IEEE 39–bus power system test case, which is a simplified model of the New England power grid. This system has ten generators; generator one is an equivalent representation of the rest of the power grid. This power system topology allows one to assess multiple power demand and generation dispatch scenarios.
3.2. Input Parameters
Table 1 presents the demand value and initial economic dispatch considered in the research. This dispatch has been calculated using the optimization model with the aim of starting from a secure point, which will be altered before topology changes and generator outages. This is also done to obtain the economic re-dispatch using the proposed online economic dispatch algorithm.
Table 1 shows that the power demand rationing cost tends to an infinite value, and the optimization must search to minimize this value modifying each bus of the system. For example, in Colombia the power demand rationing cost oscillates between 130 and 2608 USD/MWh [
22]. From the generation dispatch and demand presented in
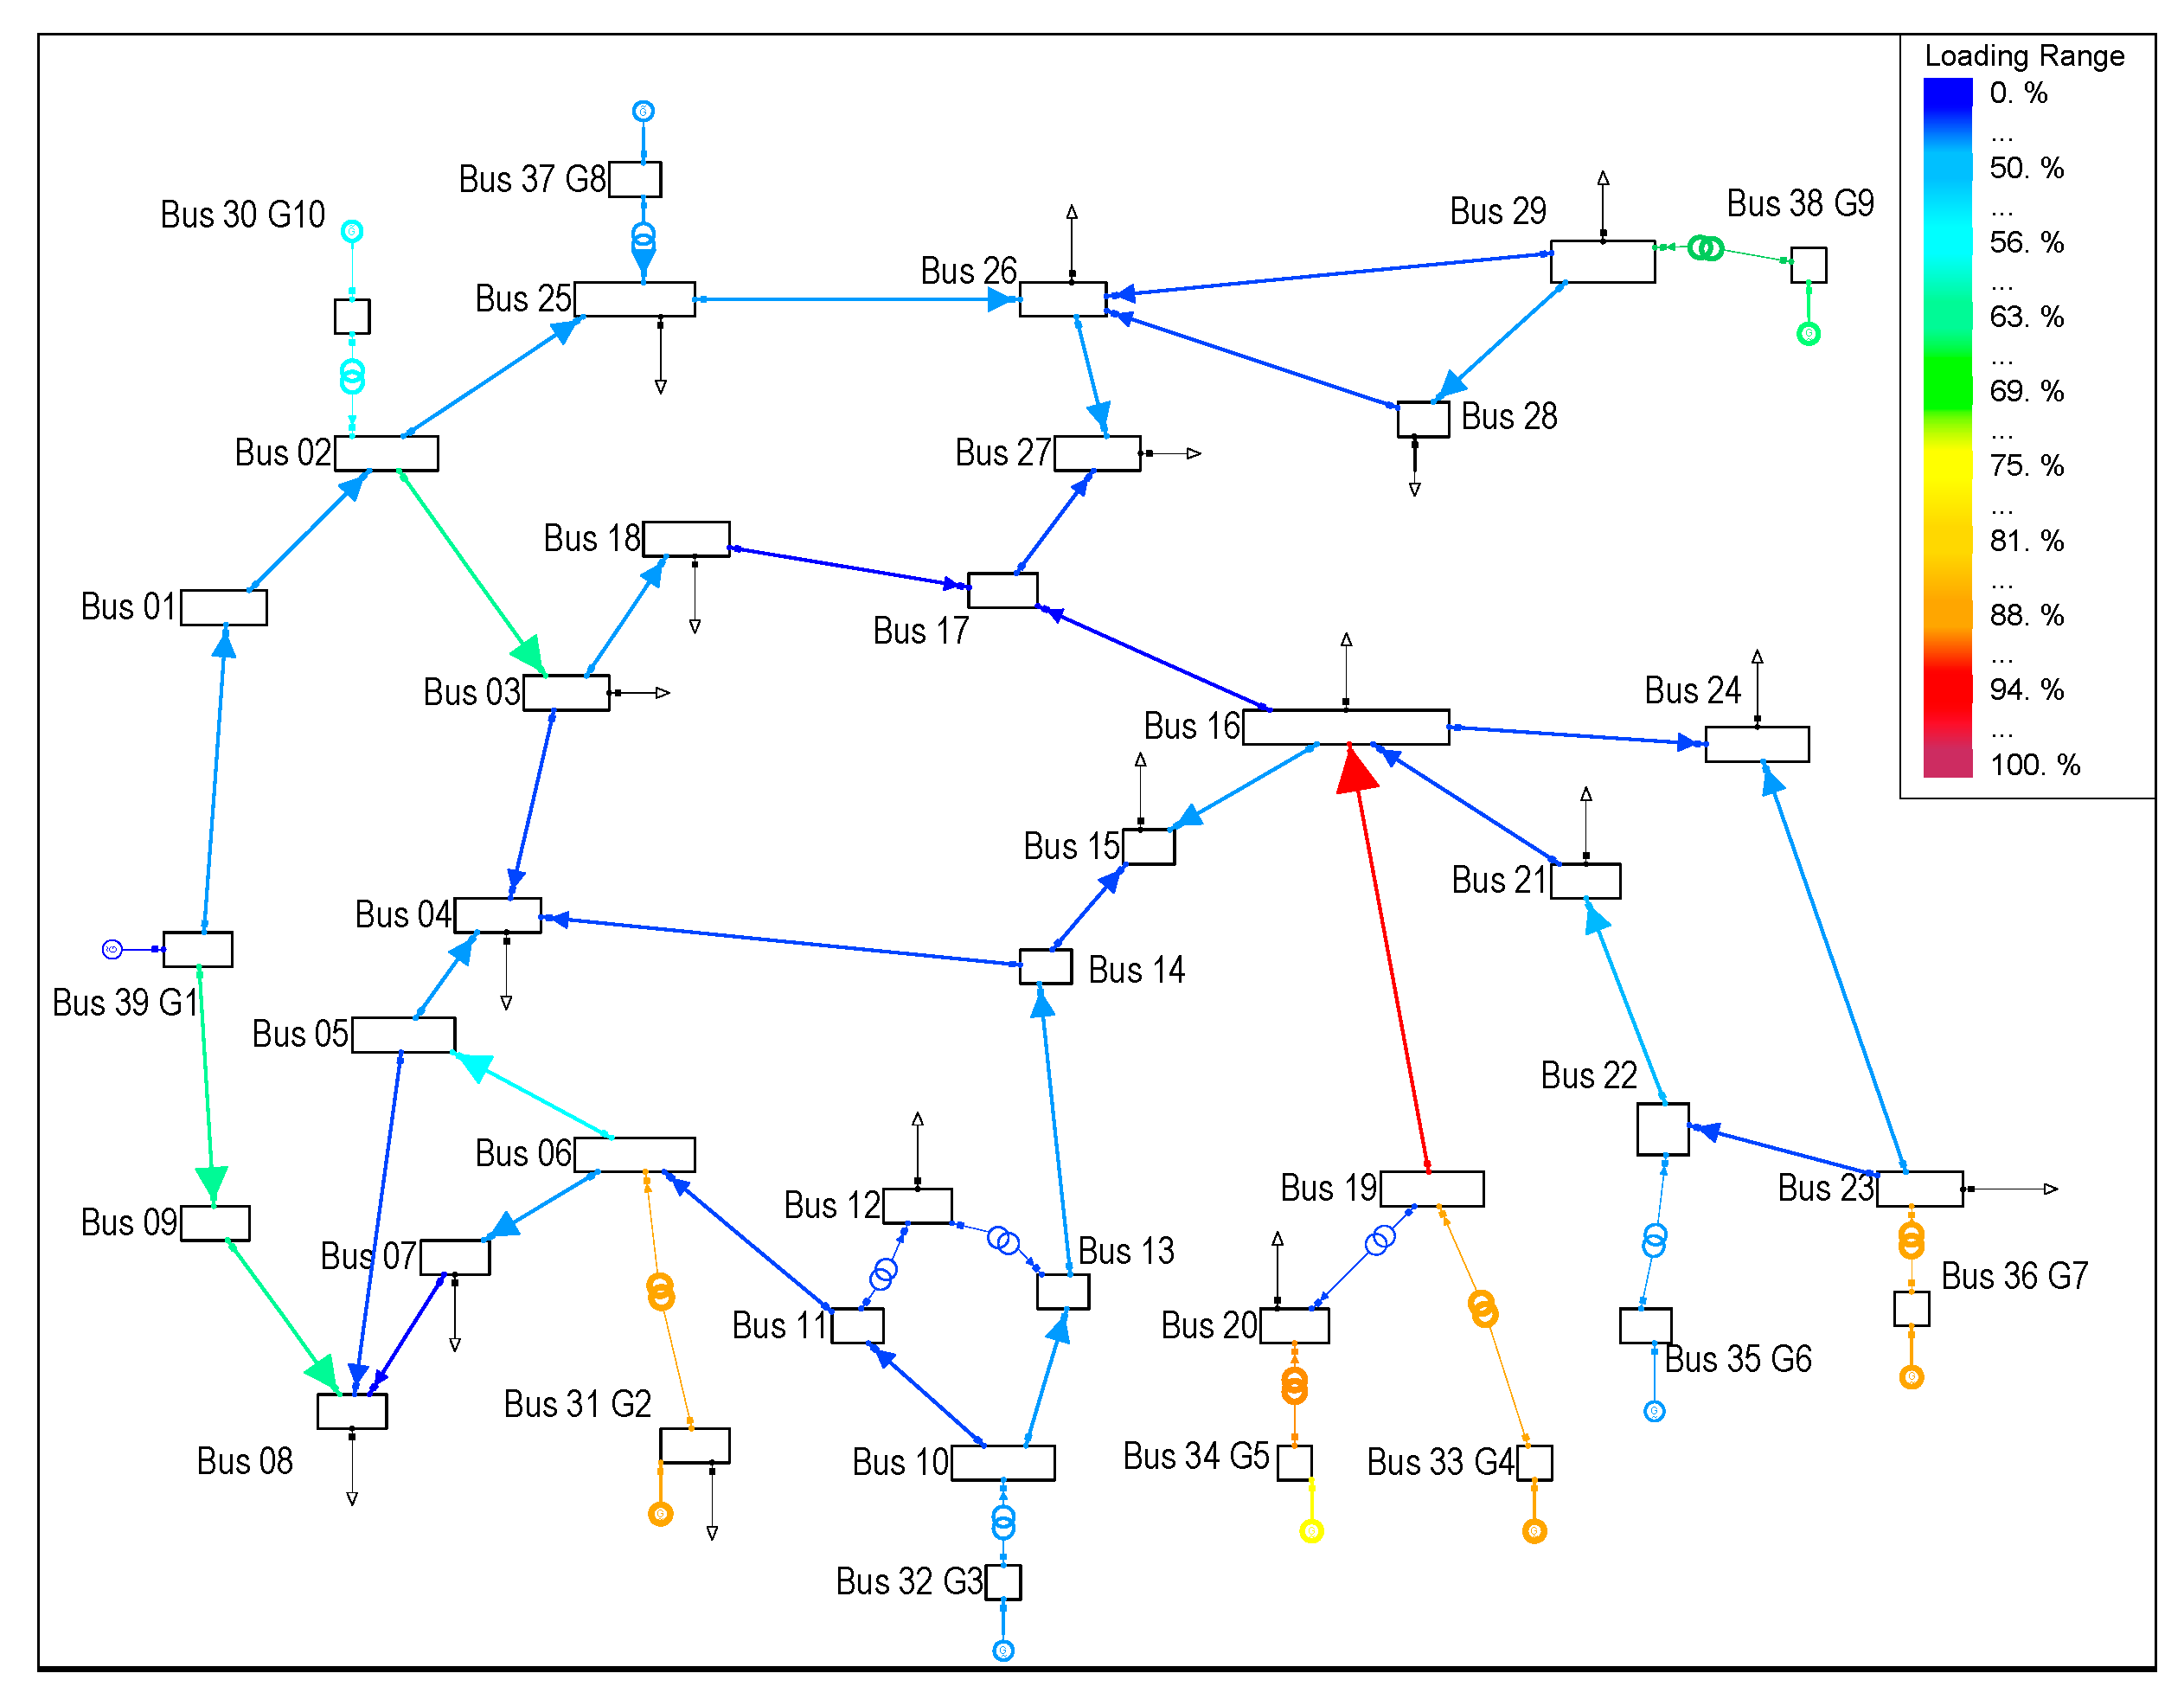
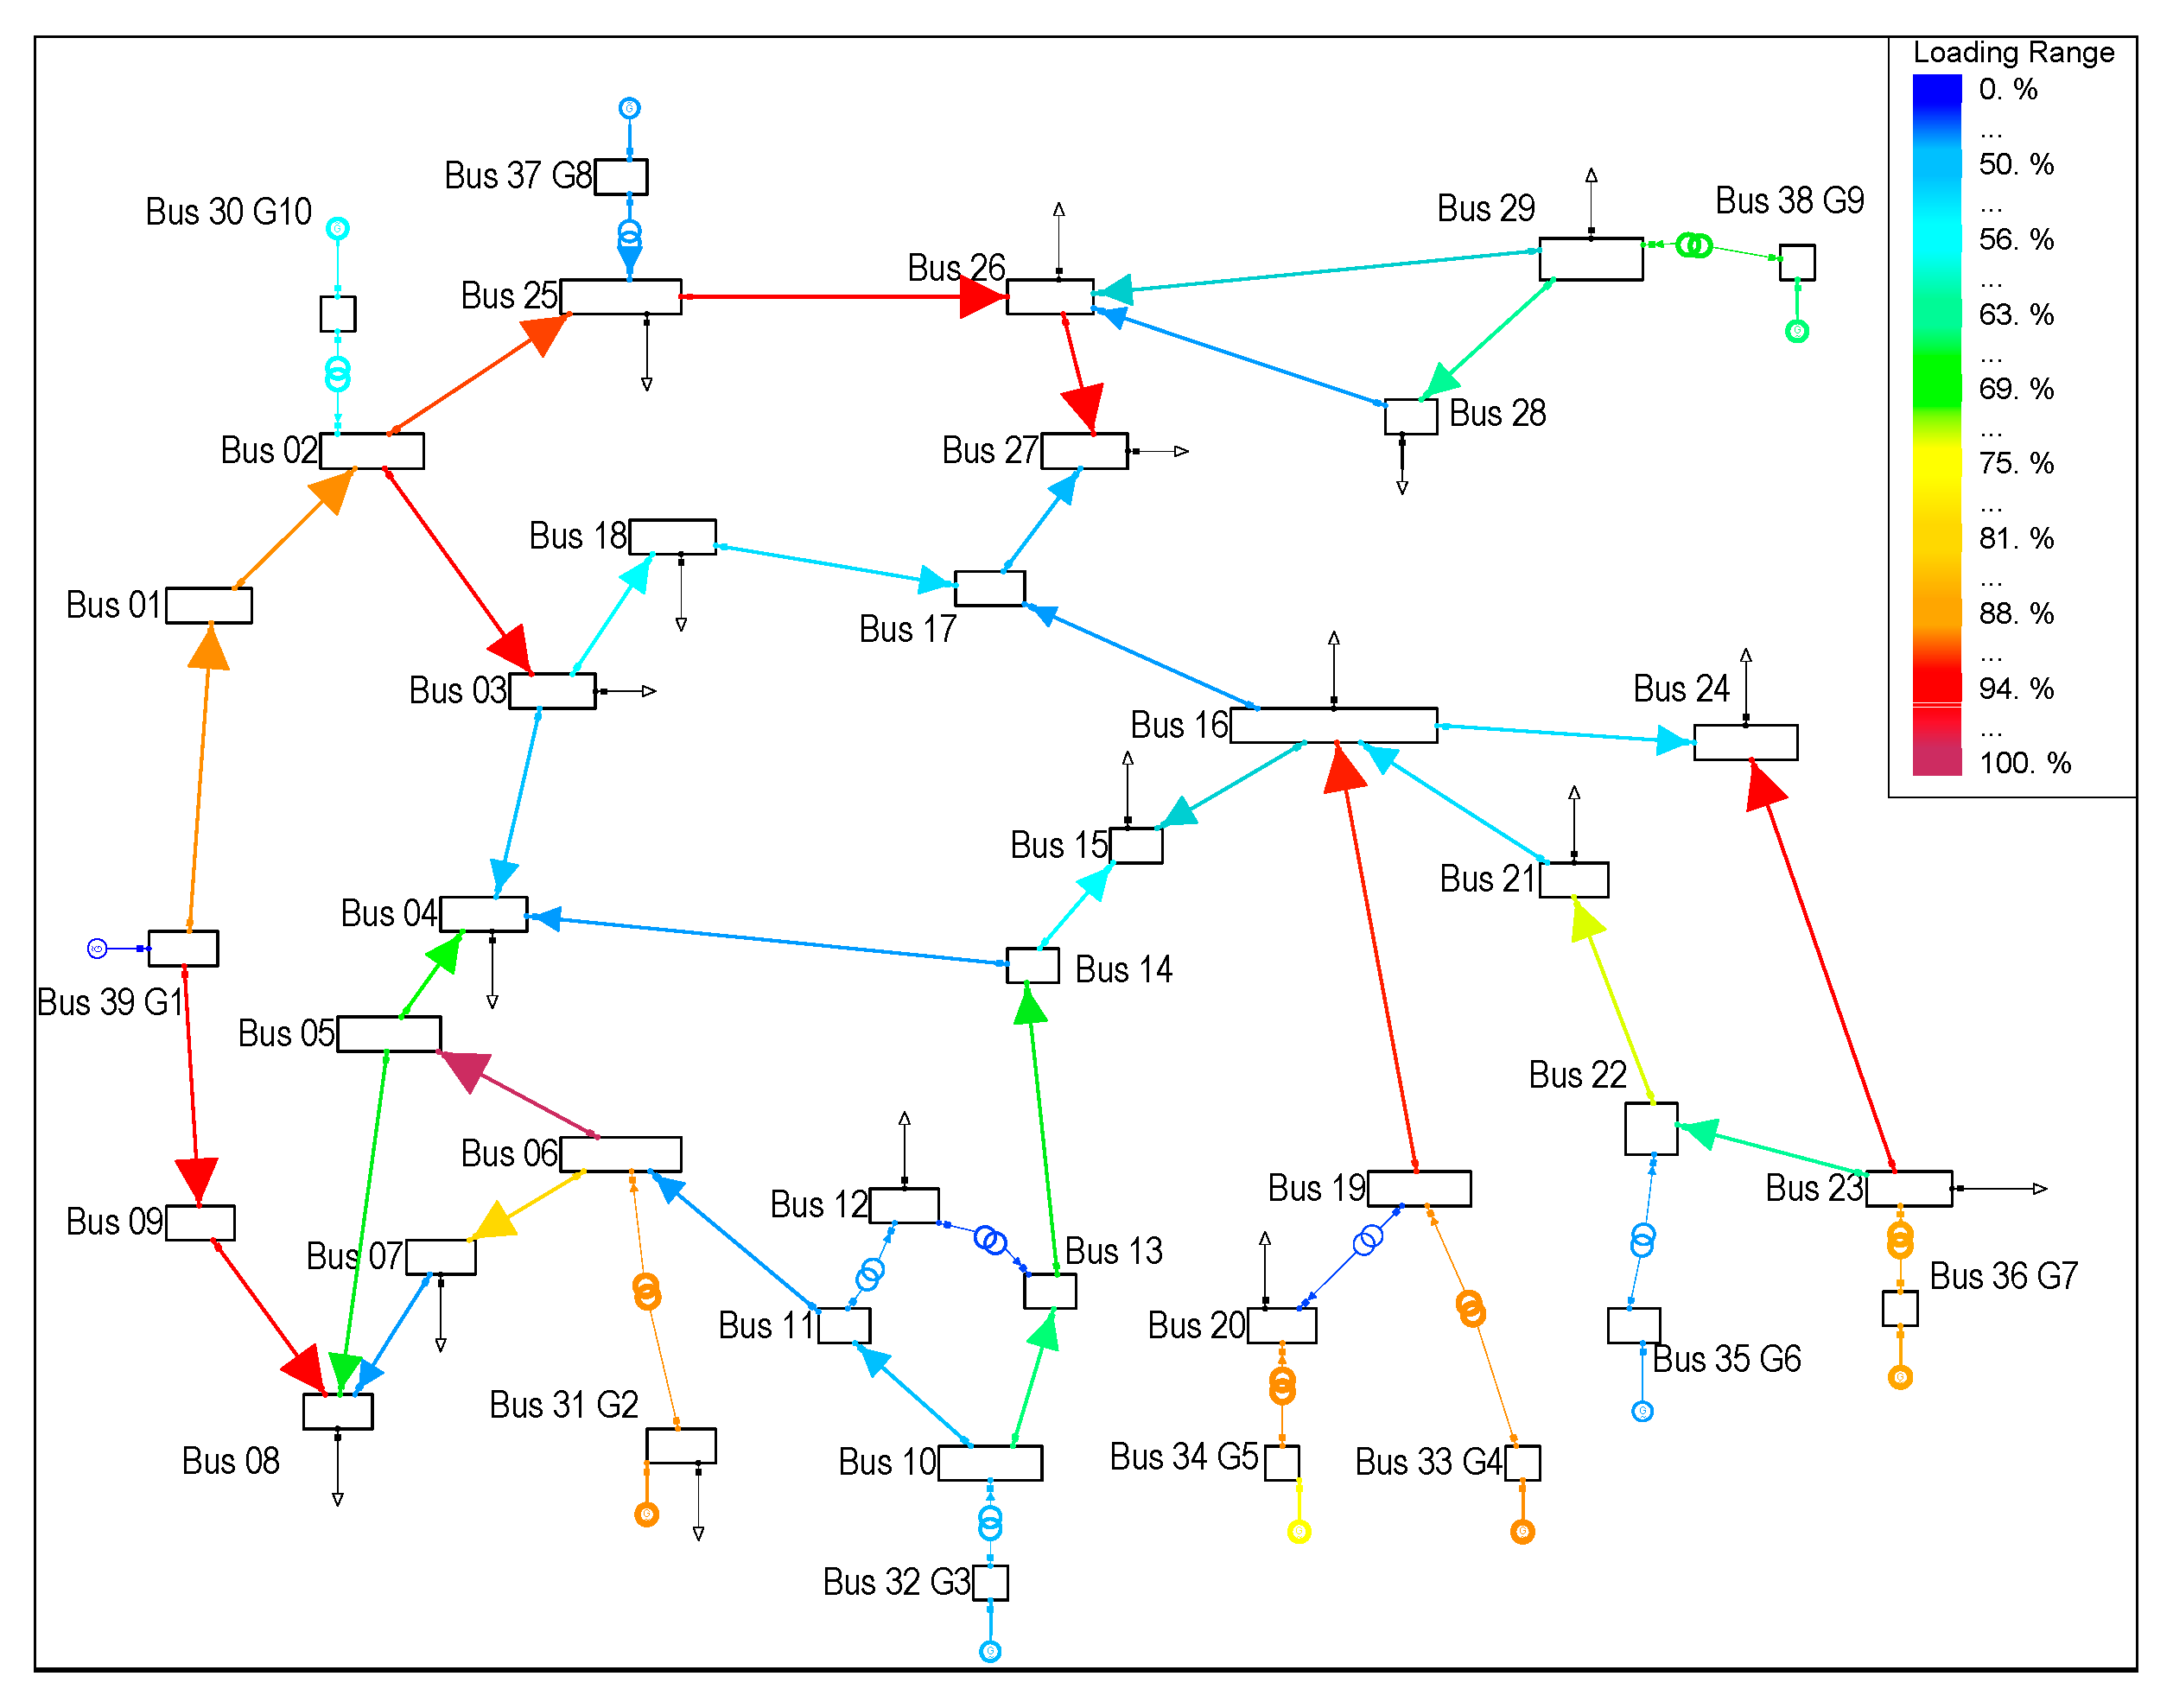
Table 1, the initial operating state of the power system is obtained as shown in
Figure 4, in which each line and transformer obtains a color according to the level of overload presented between 0% and 100% of its maximum loadability. In this case the load flow is simulated, and the power system is represented under normal operating conditions and considering all the elements in service.
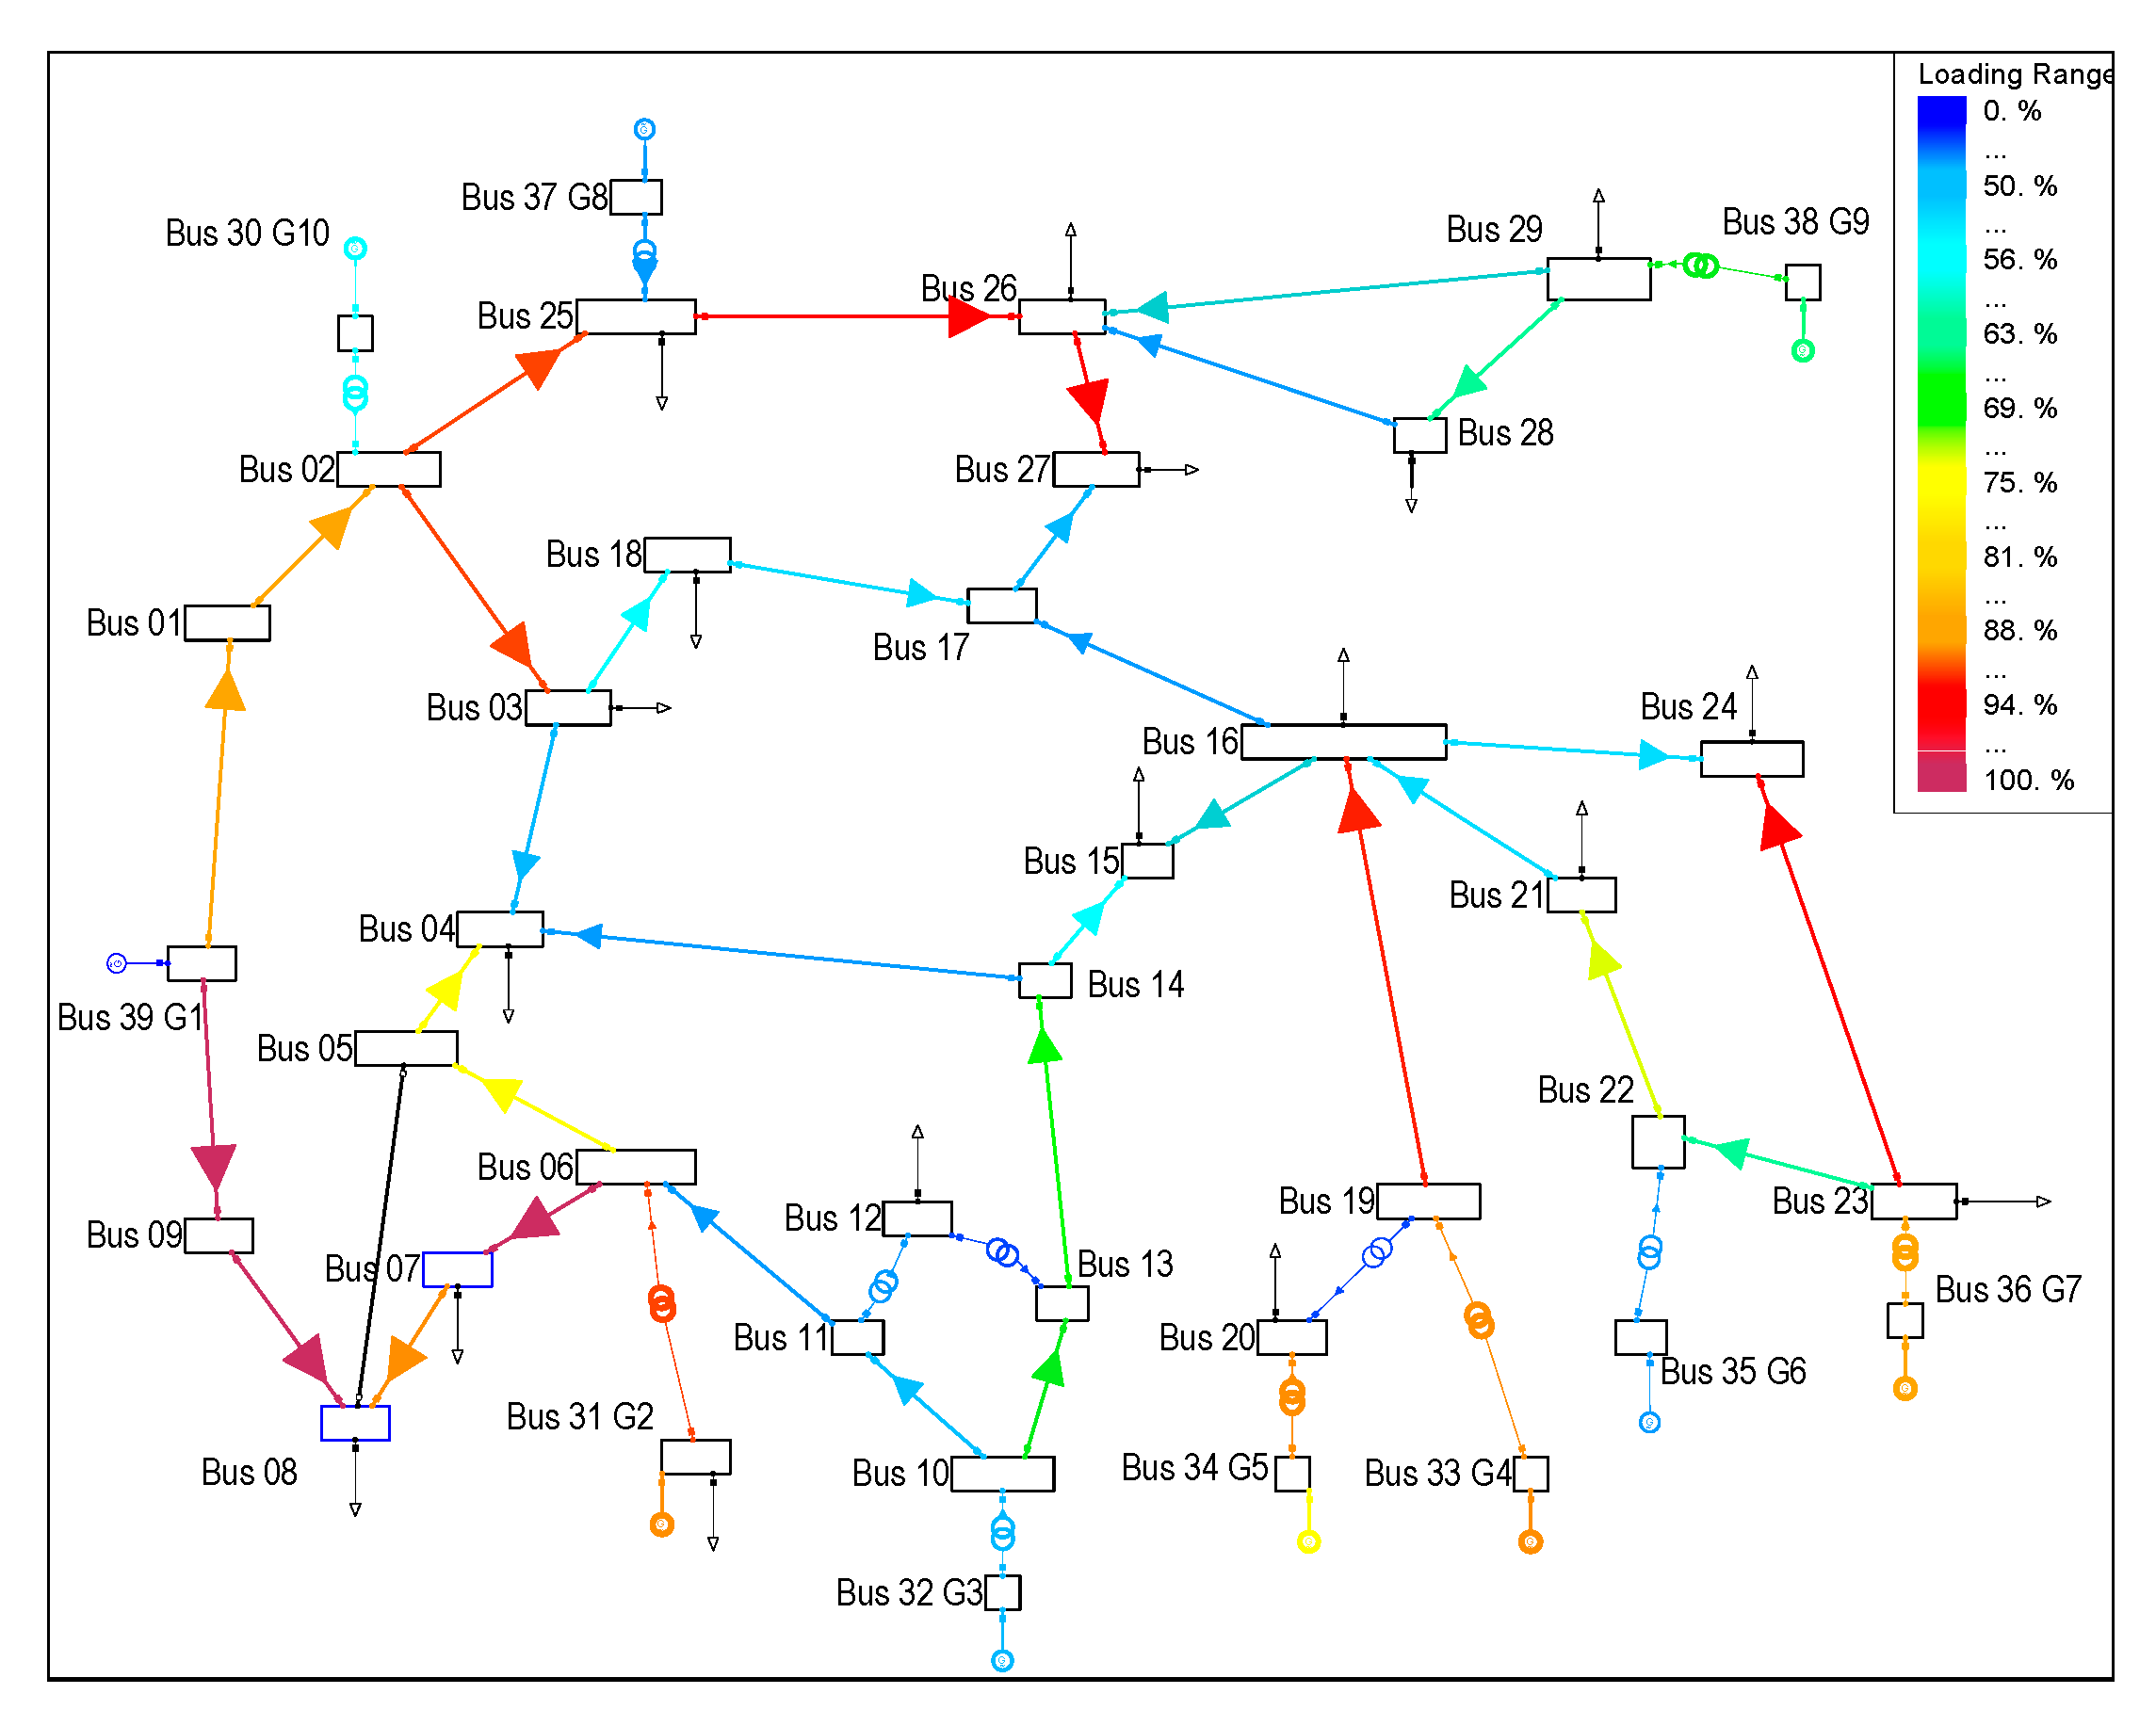
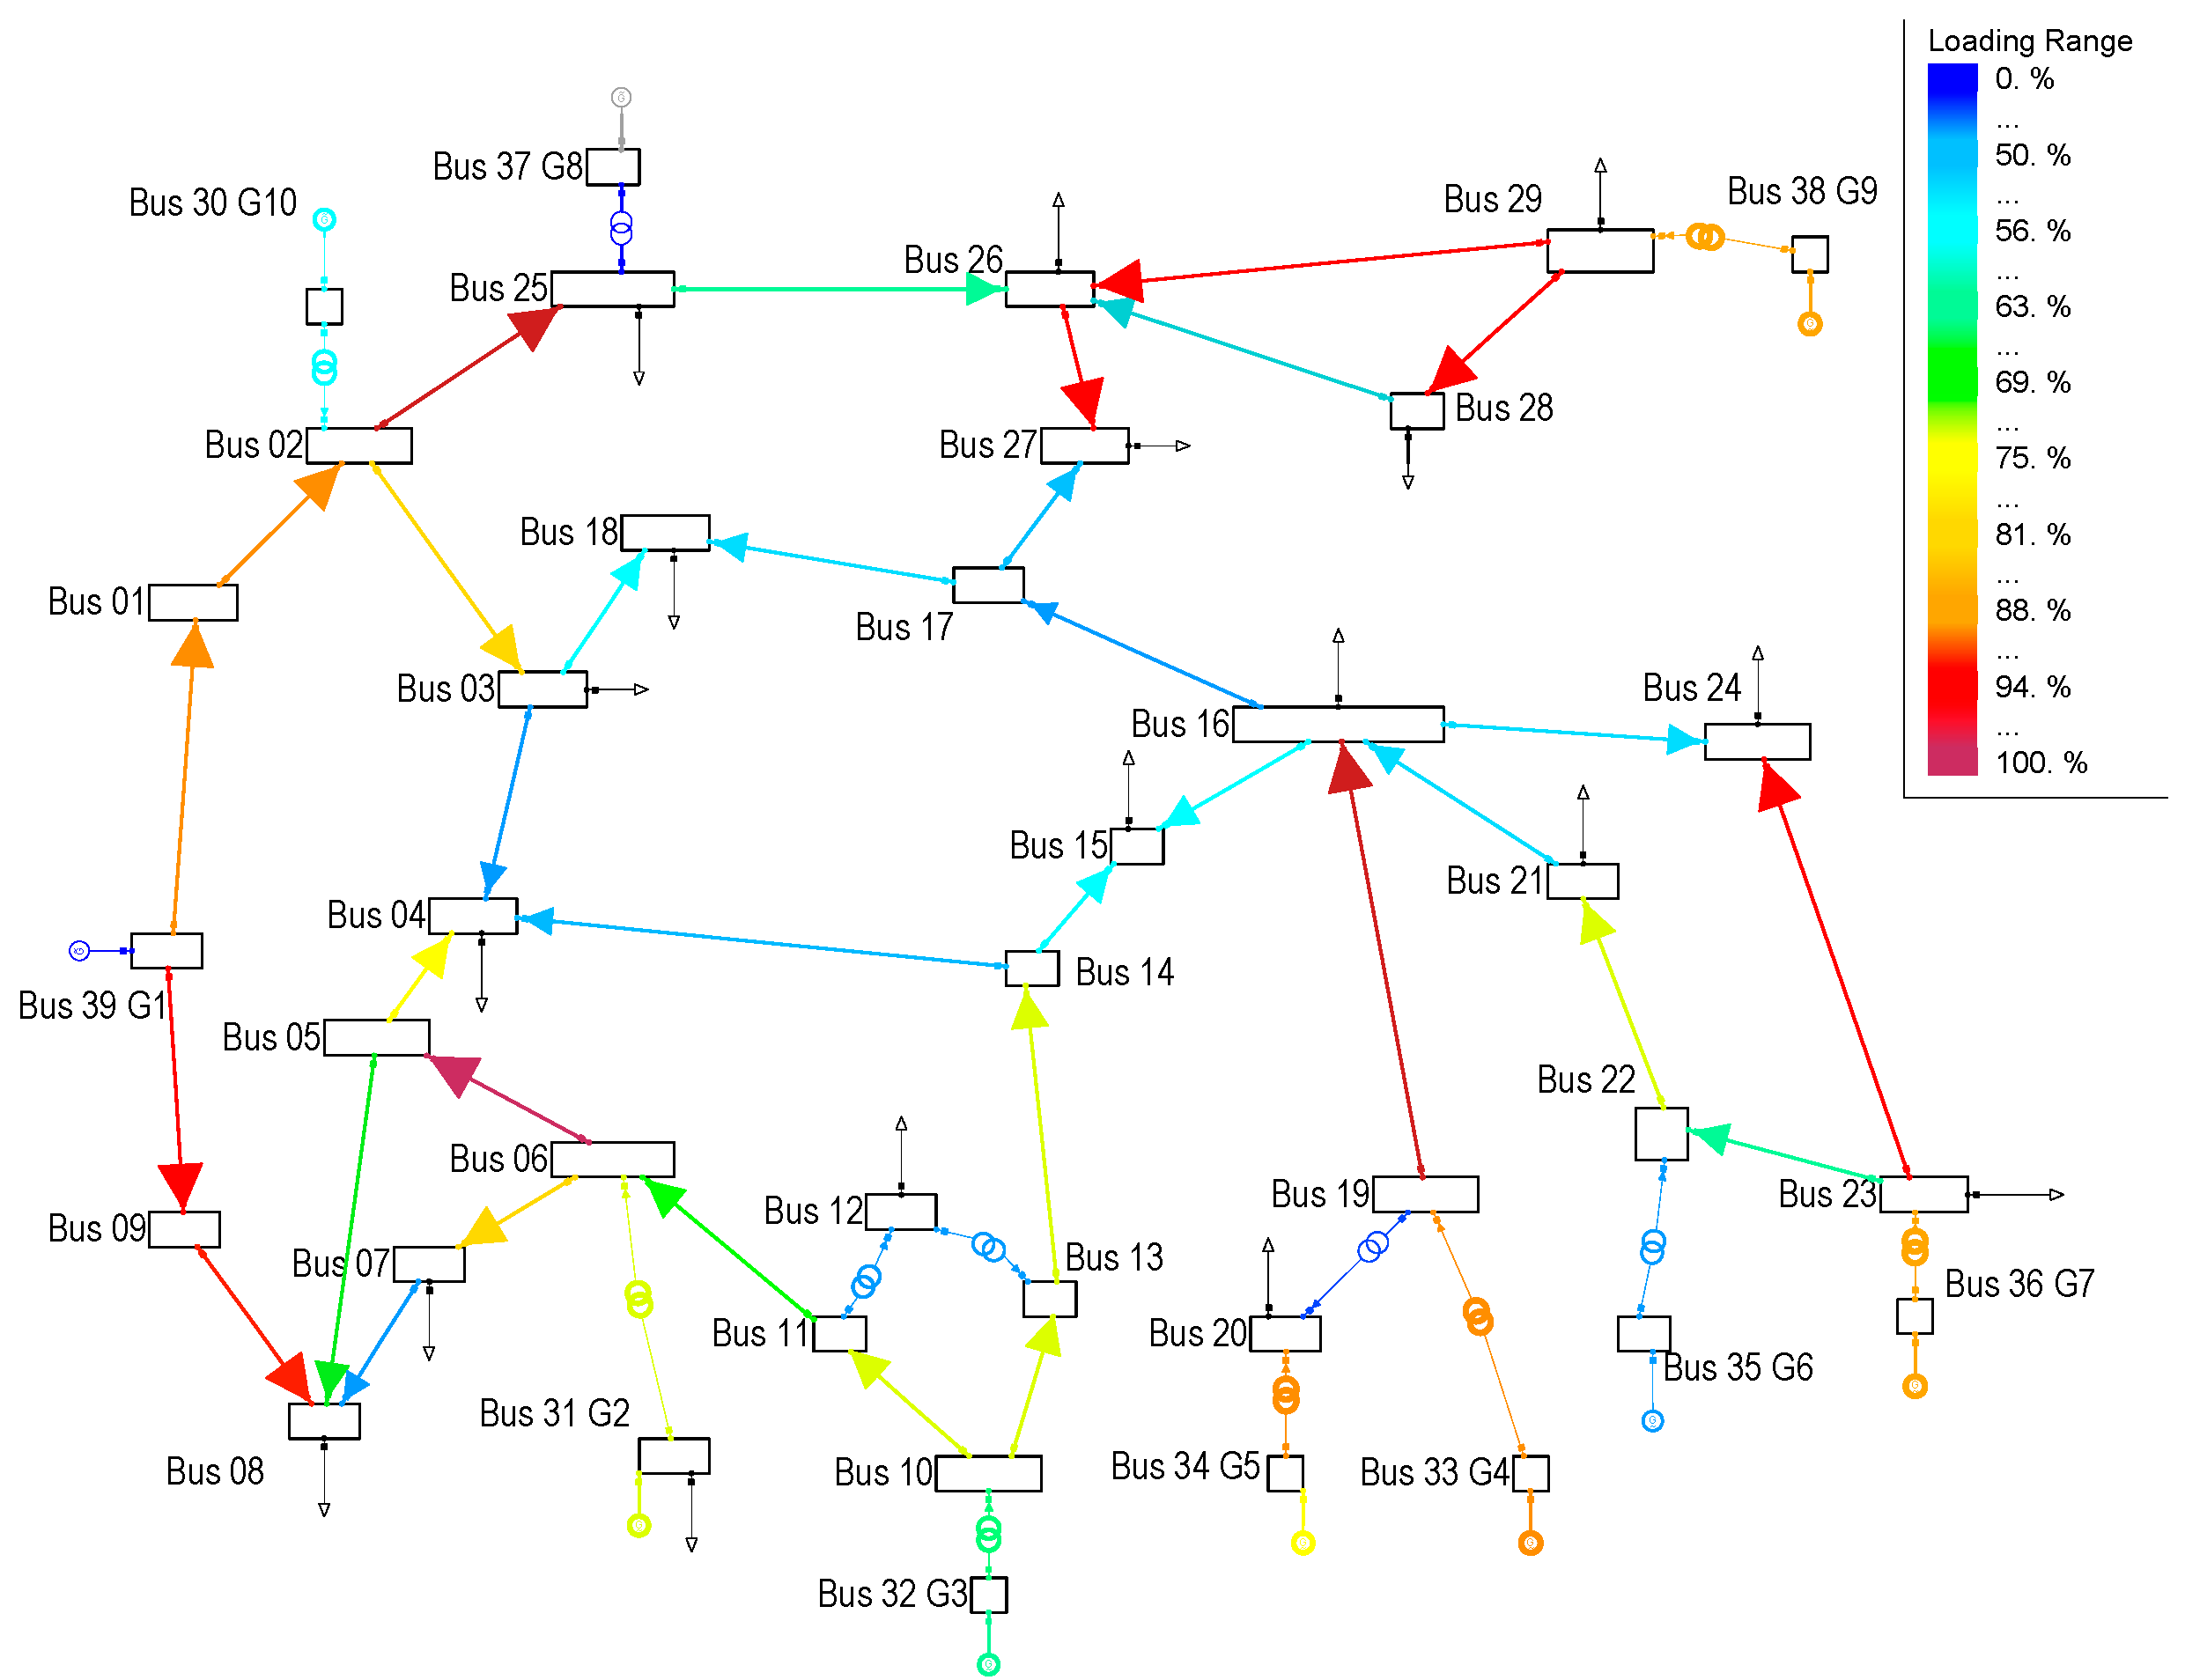
By representing the maximum loadability of transmission elements, considering N−1contingencies, and using the same method of coloring elements used in
Figure 4, the heat diagram of
Figure 5 is obtained, in which branches increased overloading risks when N−1contingencies occurred. Additionally, when comparing
Figure 4 and
Figure 5, loadability has increased with N−1contingencies and that affects power system security. For example, line 23–24, under normal operating conditions has an overload of less than 50% and the power flow can increase to approximately twice the current value. However, for the same line after N−1contingencies, loadability reaches values higher than 90%, implying a critical state.
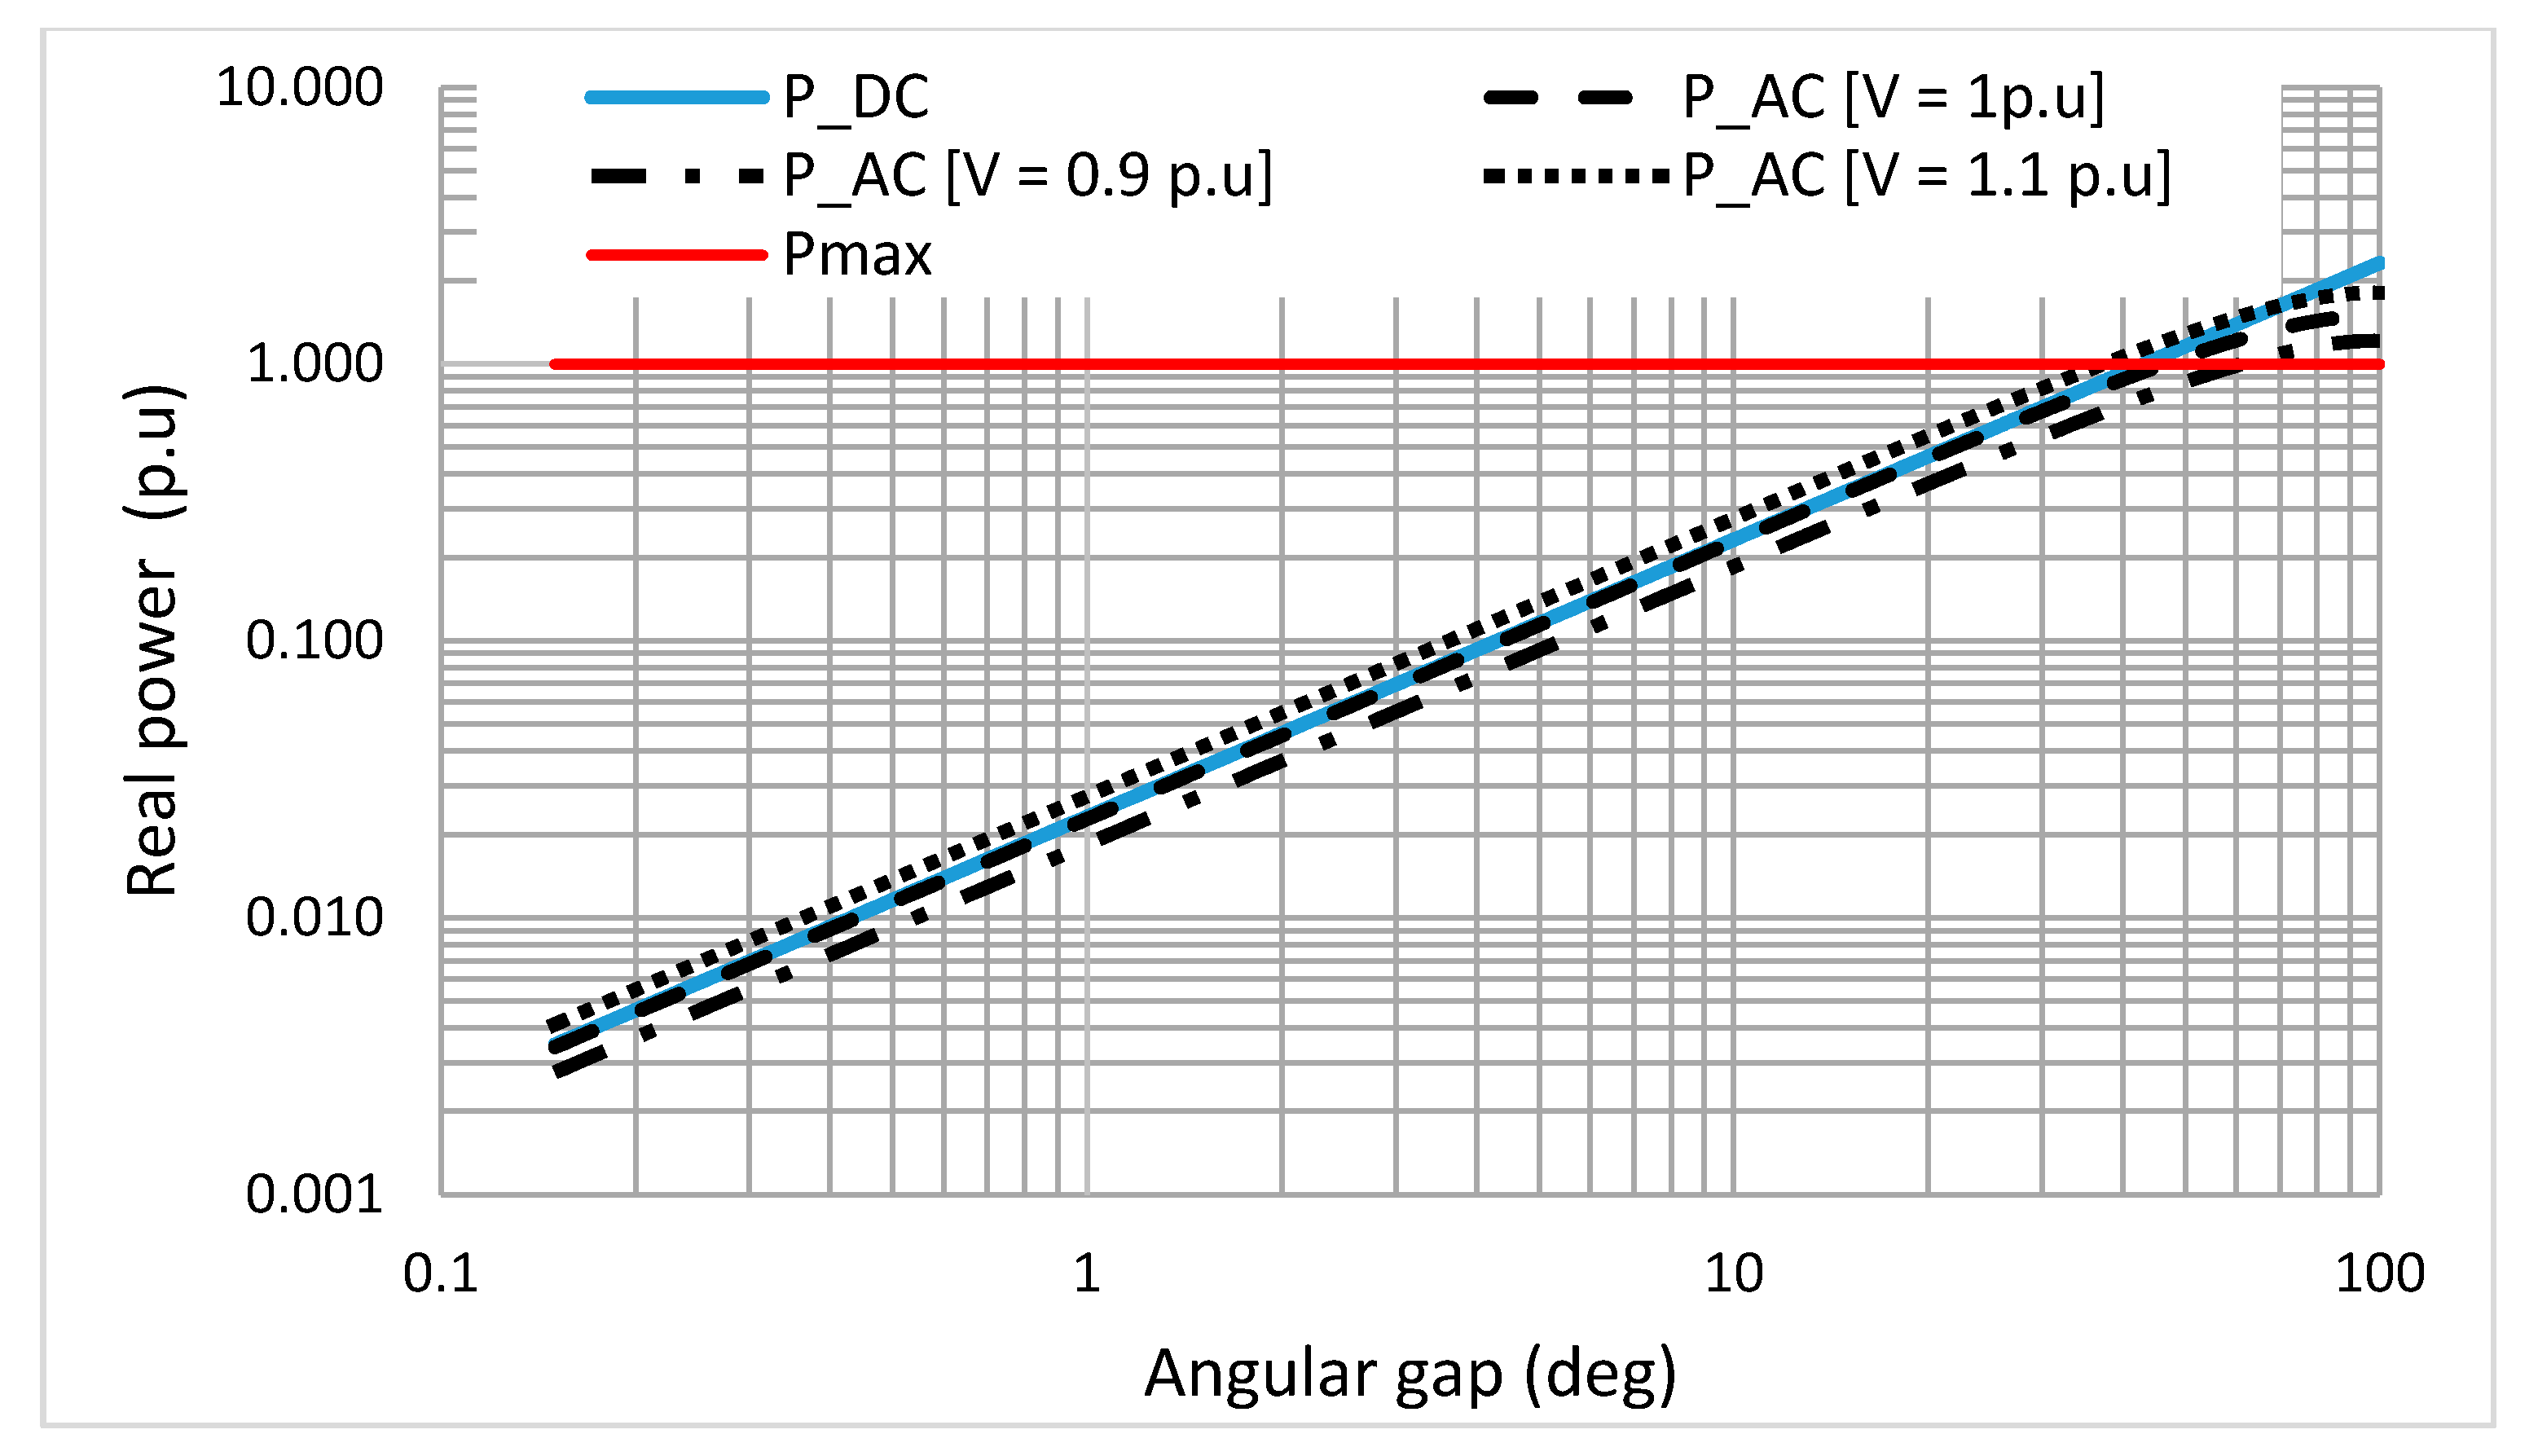
As discussed above, the optimization model uses security constraints based on sensitivity factors, such as: PTDF, LODF and OTDF. The main advantages of using these sensitivity factors are: first, they simplify the security constraint model for both power flow and contingencies calculations; and second, they include small errors in the optimization result when the system works with AC model. In this method, the constraint calculation is made based on the initial and real states of the power system, which means that a linearized model is achieved around the operating point and a simple model is obtained to solve the difficult problem of the economic dispatch with online security constraints. For example,
Figure 6 shows a comparison between the AC and DC power flow for a 230 kV line with 260 km, obtaining that the largest error of the calculation is given by the angular opening and the voltage along the line. Therefore, the error when using sensitivity factors is small, because the problem is linearized around the real state of the power system.
3.3. Line Outages
The algorithm must again perform a generation dispatch calculation based on the changes presented in the power system (L1 and L2 of
Figure 1). In the case of the unexpected line outage, logic L1 will activate the algorithm, which will obtain a new economic re-dispatch. In accordance with the above, permanent line outage events that do not represent critical contingencies activate the first economic dispatch algorithm presented in
Figure 1 and do not activate the second economic dispatch algorithm presented in
Figure 2. For example, in the IEEE 39–bus power system the lines outages are: (a) Line 3–18, (b) Line 16–21, and (c) Line 17–18, and those allow calculating an economic re-dispatch.
For each event a, b and c, the algorithm calculates the economic dispatch and the results are shown in
Table 2. The economic dispatch before the outage of line 16–21 is approximately equal to the dispatch of the base case. Therefore, it is not necessary to implement a generation re-dispatch for this case. On the other hand, the output of lines 3–18 and 17–18 originate a more relevant change in the generation dispatch. Additionally, generation plants G4, G5, G6, and G7 remain almost invariant before the outage of these three lines. As generators G4, G5, and G6 are the most economic units, then those generators are not dispatched again because of security constraints related to overloads.
None of the three outages of lines 3–16, 16–21, and 17–18 create a risk situation after N−1contingencies. However, the resulting economic re-dispatch corresponds to an opportunity to save generation costs, because each outage of each of these lines creates a different topology, so that power system security changes. Thus, the algorithm performs online monitoring of the cost reductions, avoiding the overload risk after N−1contingencies, and contributing to the improvement of power system security and operating costs. By considering hour-operation periods, the outage of line 17–18 saves around USD 12,316; the outage of line 16–21 saves only USD 42.15; and the outage of line 03–18 saves USD 8859.73. According to the previous results, we can say that before the unexpected outage of lines 03–18 and 17–18, it is not necessary to carry out a re-dispatch if only the security constraints after N−1contingencies are required. However, the resulting economic re-dispatch corresponds to an opportunity to save the operating cost.
Finally, the verification of the deviation value of each of the new economic re-dispatch is important because the power delta lost or gained after each dispatch could affect the operation of the secondary frequency control or AGC. In addition, the generation delta should not be very large, since the AGC must have available a power reserve to respond to frequency events, and in this case the permissive availability of AGC of + −10 MW has been assumed. For the outage of line 03–18 there is a power generation deviation of −4.857 MW, for the outage of line 16–21 there is a deviation of 0.688 MW, and for the outage of line 17–18 there is a deviation of −2,397 MW.
3.4. Critical Contingencies
To involve the operation of the algorithm presented in
Figure 2, two lines have been selected, which correspond to the outages of lines 05–08 and 13–14, and which cause critical contingencies N−1. Therefore, the algorithm will present two operation stages: the first is presented in
Figure 1, where the algorithm must calculate the secure operation and most economical re-dispatch without considering load shedding, and without minimizing the overload after N−1contingency. In the second stage presented in
Figure 2, the algorithm must calculate the new redistribution and load shedding corresponding to each of the critical contingencies that remain unprotected in the first stage.
In accordance with the above,
Figure 7 shows the results of the economic re-dispatch of the first stage, which allows the lowest possible overload after N−1contingencies at the lowest generation cost. However, as stated above, the evaluated line outages create critical contingencies N−1. Thus, before the outage of any line (05–08 and 13–14), there is no totally secure economic re-dispatch; that is, under this condition there will be at least one N−1contingency that causes an overload above the maximum limit of the overloaded element. In
Table 3, we present in detail the values of the economic re-dispatch to consider, before the outage of lines 05–08 or 13–14.
In relation to the deviations of the generation cost, when the outage of line 13–14 is presented, the cost increases by USD 3271.93; therefore, in this case, the algorithm detects the need to increase the generation of more expensive security to reduce the risk of contingencies N−1. On the other hand, the result of the cost of generation before the exit of the line 05–08 leads to a reduction of the same in USD 9818.76, which represents an operating benefit, and at the same time leads to a reduction of risk due to overload between N−1contingencies.
When evaluating N−1contingencies before the outage of line 05–08 considering the economic re-dispatch presented in
Table 3, it is observed that lines 09–39, 08–09 and 06–07 present an overload on their maximum values, as seen in
Figure 7.
After the outage of line 05–08, the algorithm calculates a fictitious increase in the capacity of lines 09–39, 08–09 and 06–07, resulting in 42.3 MW, 28.2 MW and 142.5 MW, respectively. The fictitious increase in the capacity of transmission lines is calculated by means of the variable
, of Equations (8) and (10). From the process P5 of
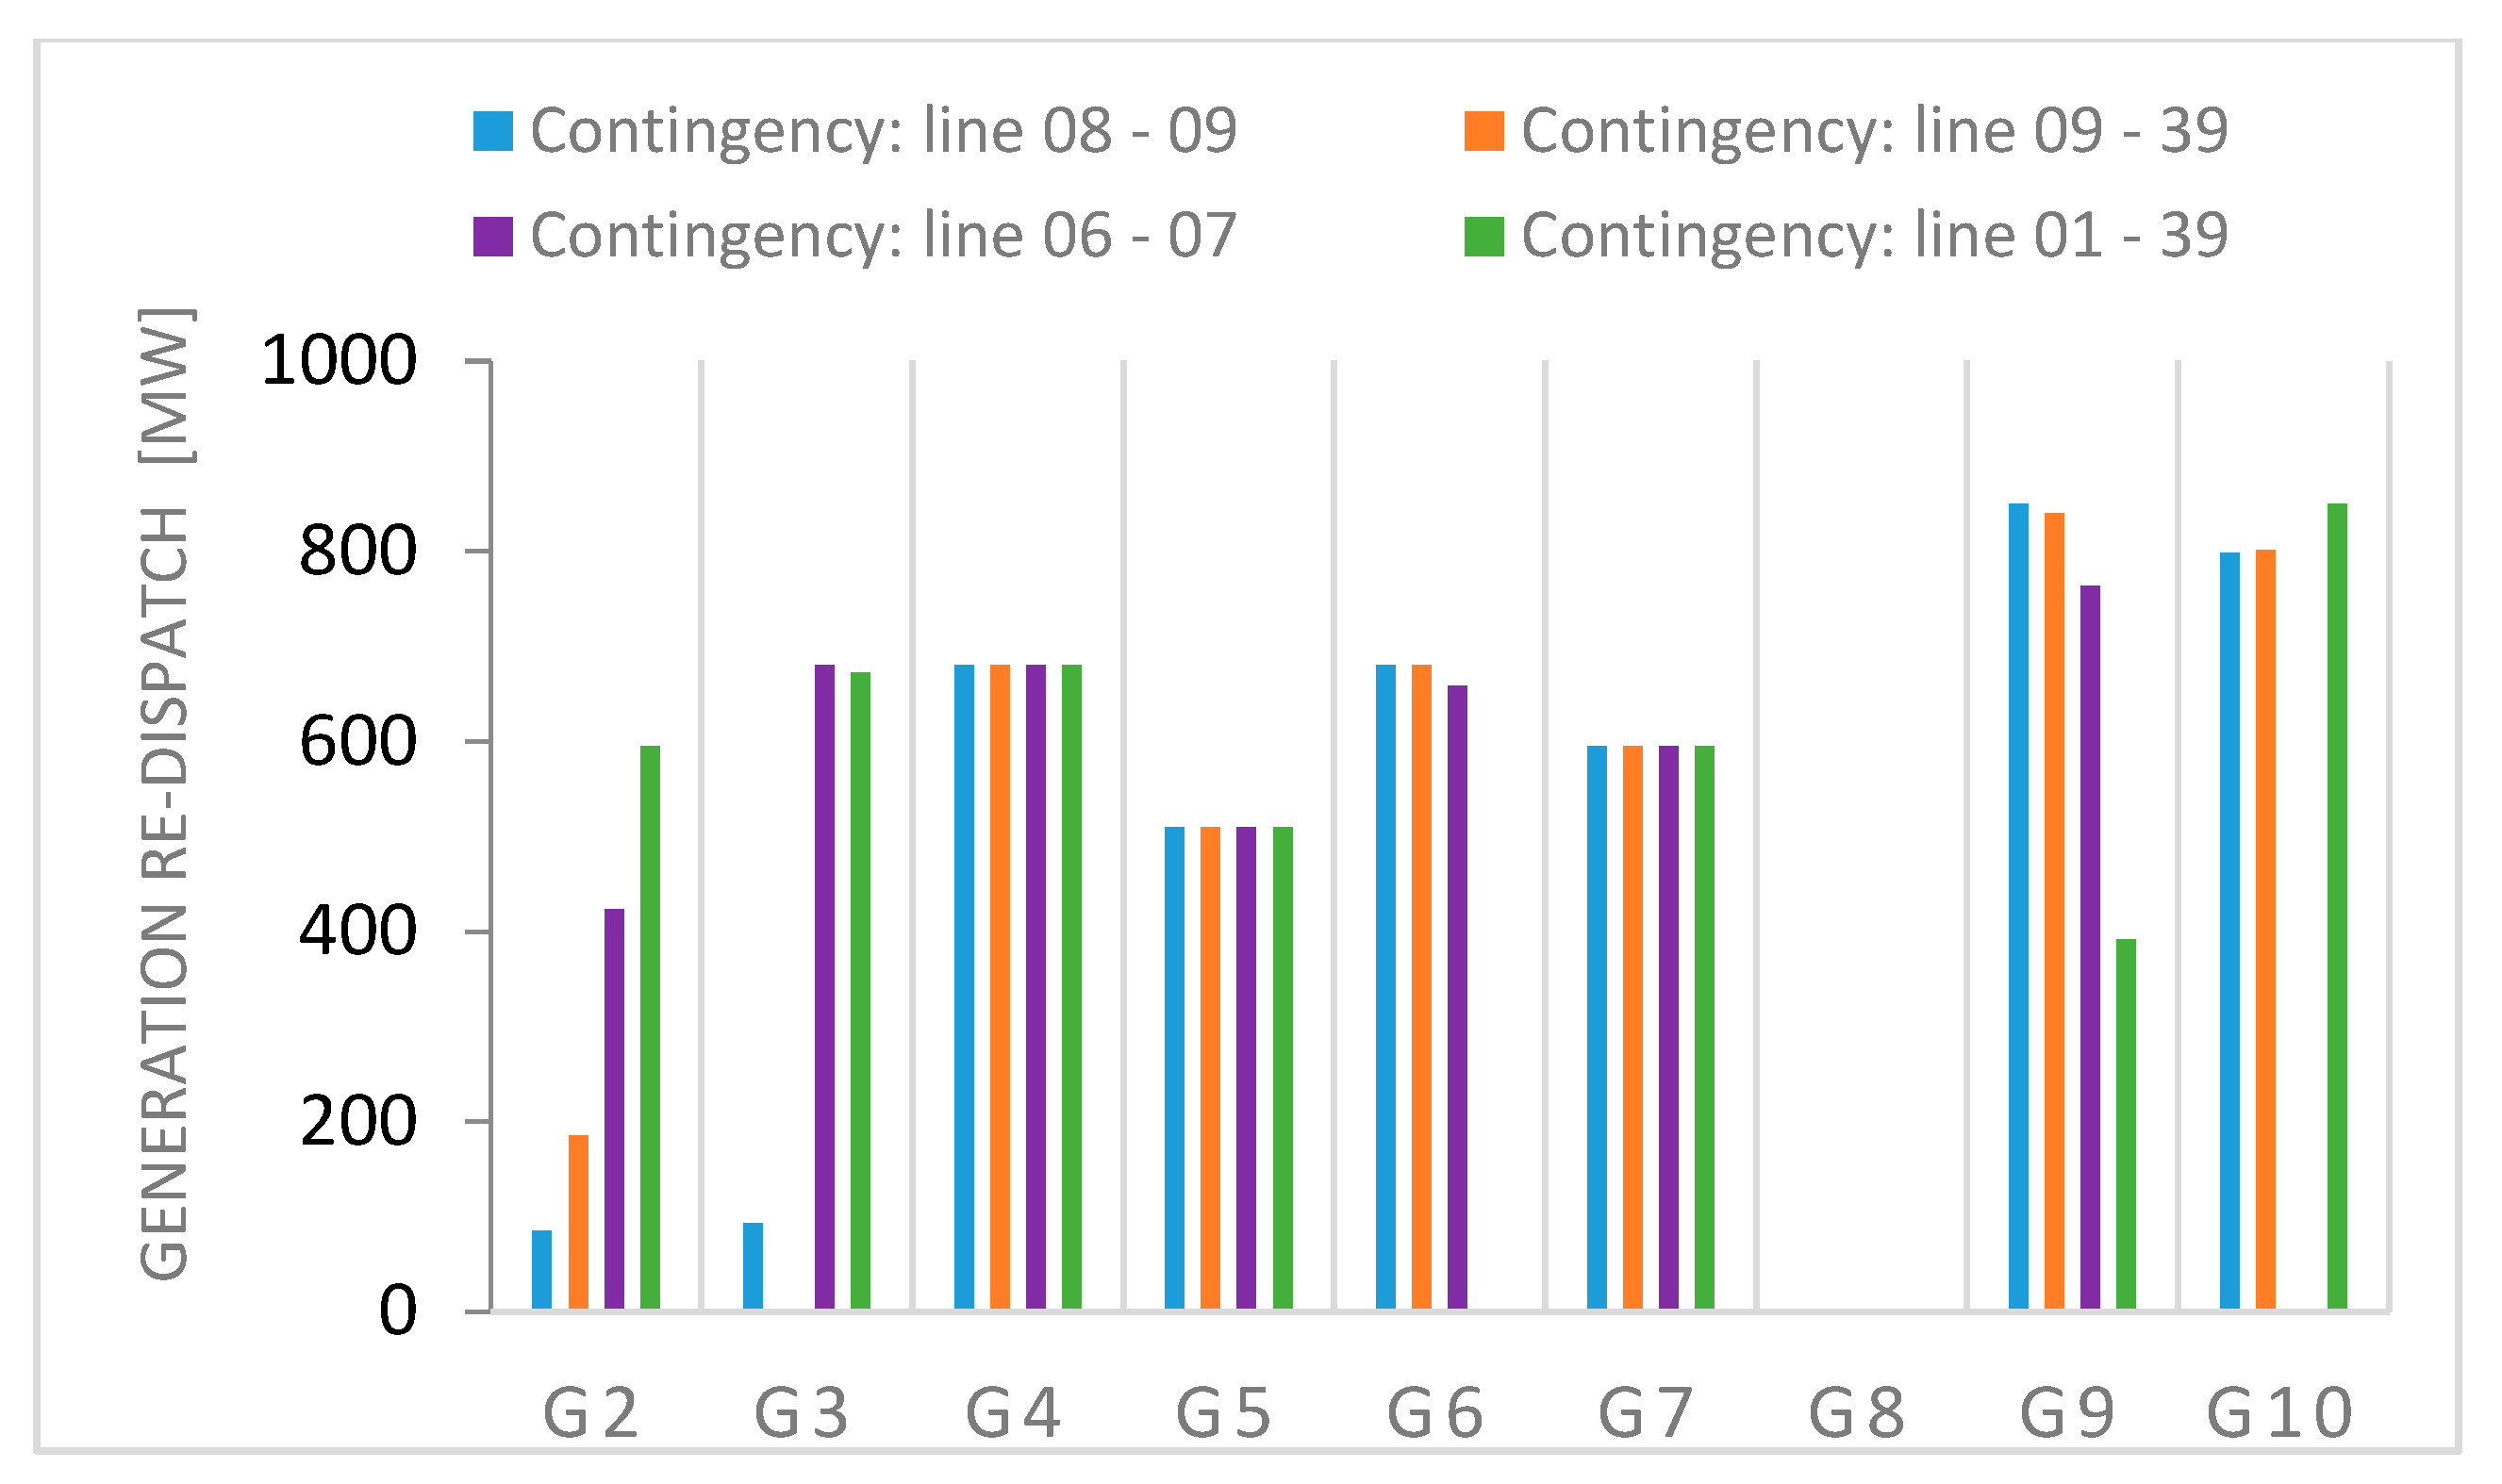
Figure 2, critical contingencies are obtained when considering the outage of line 05–08. For this case, the critical contingencies correspond to the lines: 08–09, 06–07, 09–39 and 01–39, as shown in
Figure 8.
Table 4 shows the results obtained by simulating critical N−1contingencies, considering the outage of line 05–08. The loadability of each element of the power system is presented. For each critical contingency, it is required to carry out the dispatch presented in
Figure 9, as well as the corresponding load shedding as shown in
Table 4.
As shown in
Table 4, the contingency of line 01–39, would be the only critical contingency that would not increase the operation cost. The other contingencies cause a considerable increase in the operation cost, due to the fact that they require load shedding.
3.5. Economic Re-Dispatch Algorithm Operating after Generation Tripping
For this case, a generation tripping event is considered, which activates the online economic re-dispatch algorithm using the L2 logic, presented in
Figure 1, for this case a complete outage of generator G8 in bus 37.
Figure 9 shows the loadability status of the transmission elements after the outage of G8 and with N−1contingencies. High loadability are presented in lines 01–39, 01–02, 02–25, 09–39, 08–09, because the slack bus, which represents the generator with AGC control of the power system, responds to the loss of the G8 generation with a real power increase and generates power congestion on those transmission lines. With an event that creates generation-demand imbalance, as the outage of G8, the redistribution of the AGC generators is required, greater than the value considered in the
parameter of Equation (5). Because after the outage of a non-radial transmission line, there would be no generation-demand imbalance; therefore, the adjustment value of the AGC (
) may be lower than after the event that generates a generation-demand imbalance.
For the event of the outage of G8, the
value has been modified by 248.729 MW, which corresponds to the value of the G8 generator dispatch after the outage of G8.
Figure 10 shows the variation of the economic re-dispatch calculated from the generation tripping (G8), with which the system will be safe again with N−1contingency.
Table 5 shows the values of the economic re-dispatch calculated after the outage of G8, a generation deviation of −19.58 MW is presented, which means that an increase of the
parameter is required, given that the most economical solution is the generators G2 and G3, generating an unbalance greater than 10 MW.
It should be noted that for the simplicity of this model, a cost of 0.0 USD/MWh has been assumed for the AGC generator, because the generator G1 represents not only the AGC, but also the rest of the equivalent system; therefore, the AGC is assumed to be part of the equivalent system and for simplicity the cost of this equivalent generator is assumed to be zero. Deviation of the total generation is −19.58 MW and the generation cost is USD −4945.
4. Conclusions
This paper presented an online generation dispatch scheme to minimize generation costs and the loadability of elements in the power system. The proposed method incorporated the power sensitivity factors (LODF and PTDF) in an optimization model with variables obtained from online operation, considering the generation cost, and with overload constraints. The results showed that the online economic re-dispatch identifies the operating cost reduction and reduces the overload risk created by N−1contingencies, contributing to a safety operation, and at the same time reducing the operating costs of the power system. In addition, it is a useful proposal when there are highly variable power plants such as power systems with solar and wind power.
This operating scheme could also be very useful in power systems in which there are usually appreciable differences in demand, dispatch or topology, between the scheduled operation and the actual operation. The complementary algorithm to deal with critical N−1contingencies, corresponds to a useful proposal in cases in which the network is not fully covered before all the possible N−1contingencies. It is also considered a necessary operation scheme, in cases in which the only solution to avoid collapse is load shedding. Therefore, instead of executing a programmed power demand rationing, the model uses a prediction of the required load shedding and emergency economic re-dispatch, which would be implemented only in cases of critical contingency.
The model considered sensitivity factors in order to simplify calculations, and it provided an advantage when considering large-scale systems divided into many operational areas. The online economic re-dispatch presented in the present work does not require metaheuristic techniques, so the minimization of the generation cost is done by an exact and simple method, which means it is suited to an online operation. Thanks to the model based on the objective function with the variable PADi, it is possible to achieve the convergence of the model, even when the system is unsafe with critical contingencies. Therefore, the result of this model corresponds to the security constraint generation economic re-dispatch without the need to calculate power demand rationing.


