Article

Assessing the Potentiality of Animal Fat Based-Bio Phase Change Materials (PCM) for Building Applications: An Innovative Multipurpose Thermal Investigation

1
CIRIAF, Interuniversity Research Center, University of Perugia, Via G. Duranti, 63-06125 Perugia, Italy
2
Department of Engineering, University of Perugia, Via G. Duranti, 97-06125 Perugia, Italy
3
Department of Economics, Engineering, Society and Business Organization, University of Tuscia, Via del Paradiso, 47-01100 Viterbo, Italy
4
GREiA Research Group, INSPIRES Research Centre, Universitat de Lleida, Pere de Cabrera s/n, 25001 Lleida, Spain
*
Author to whom correspondence should be addressed.
Energies 2019, 12(6), 1111; https://doi.org/10.3390/en12061111
Submission received: 31 January 2019 / Revised: 11 March 2019 / Accepted: 15 March 2019 / Published: 21 March 2019

Abstract

:
In recent years, the implementation of novel solutions aimed at improving thermal energy storage (TES) capability to both energy technologies and building-integrated systems has gained increasing attention. In particular, the application of phase change materials (PCM) is currently gathering worldwide acknowledgment. In this work, the potential of animal fat as a novel bio-based PCM having transition temperature around the ambient temperature is assessed by means of thermogravimetric analysis (TGA), differential scanning calorimetry (DSC), and extensive temperature monitoring. Results from the TGA showed the differential degradation of the main components of the animal fat during the heating phase, where three different decomposition steps could be noticed. The thermal monitoring and the DSC analysis demonstrated the promising thermal performance of the material, which showed an interesting double transition range globally associated to a melting enthalpy of about 28.94 kJ·kg 1 . The obtained results demonstrate the promising thermophysical properties of the animal fat blend, which can be considered as a low-cost, biocompatible PCM, particularly with potential application in passive building envelope applications for a wide range of temperature boundary conditions.

1. Introduction

In a modern, energy-conscious society, the reduction of buildings’ energy consumption and the improvement of indoor thermal comfort conditions can be considered as an urgent priority. In order to achieve such a crucial goal, both active and passive measures aimed at providing good indoor environmental quality while achieving energy and cost-efficient buildings are being continuously improved and newly developed. In particular, the manufacturing of highly efficient passive techniques for increasing the thermal performance of a construction represents a thriving area for the building sector. Among these solutions, thermal insulation materials probably constitute the most widely employed and investigated application worldwide [1,2,3].
However, in recent years, the use of thermal energy storage (TES) materials, capable of storing heat to be later used under varying temperature conditions has gathered increasing attention by the scientific community [4,5,6]. As a matter of fact, this kind of material can guarantee a dynamic response to the local boundary conditions, and provide an innovative buffering effect on indoor thermal fluctuations [5]. In particular, because of its high energy density, latent thermal energy storage, above all in the form of phase change materials (PCMs), is nowadays considered as a very promising field in passive building applications.
Phase change materials are generally divided in two different groups: organic, (mostly paraffin and acids) and inorganic, (predominantly hydrated salts) [7]. The latter ones are usually associated with better thermodynamic properties; however, they also possess high-volume change and supercooling effect, and because of this, paraffin and acids are generally preferred to be incorporated in passive building solutions [4]. All this considered, several research studies have been focusing on the development and integration of organic latent applications in the building sector. Vicente R. and Silva T. [8], for example, experimentally investigated the thermal buffer effect of paraffin-based PCM macrocapsules incorporated into brick masonry walls, while Chhugani B. et al. [9] focused their attention on the regeneration behavior of PCM wallboards. They found that different climate zones can significantly influence the final behavior of the considered latent-based solutions.
Paraffin-based PCM microcapsules were also used by D’Alessandro et al. [10] to produce multifunctional concretes to be integrated in thermally enhanced structural applications. Fatty acids have also been widely characterized and used to produce dynamic building components [11]. Kahwaji et al. [12], for example, carried out a comprehensive study on the most important thermal properties and on the thermal and chemical stability of six different organic phase change materials: capric acid, lauric acid, myristic acid, palmitic acid, stearic acid and 1-octadecanol, while Wang R. et al. [13] used macro-encapsulated ternary fatty acid eutectic to produce enhanced cement-based composites by using a direct impregnation treatment.
In the last few years, several other research contributions have focused on the use of phase change materials in passive TES applications, which gained worldwide acknowledgment and also took the first steps in the market. All this considered, a new stage in PCM development is currently being taken by the scientific community: the investigation of their environmental impacts and of the amount of embodied energy associated to their production [14,15]. de Gracia et al. [16], for example, used the life cycle assessment (LCA) methodology to analyse the impact of storage materials in building applications, concluding that the addition of a PCM, would not produce a significant variation in terms of building global impact. Oró et al. [17], on the other hand, carried out a study about high temperature applications, using LCA methodology, and showed that the system based on solid media presents the lowest environmental impact per kWh stored of all the compared ones.
This kind of analysis also opened the doors to the research for new promising potential PCM coming from industry or agricultural wastes, mainly composed of highly sustainable bio-sources. This is the case of the so-called bio-based PCM, i.e., organic components obtained from underused vegetable oils or animal fats. These kinds of materials are generally associated to acceptable latent heat values, although lower than those of the most common commercial applications. The silverlining of their use lies in the fact that they usually guarantee a non-toxic and stable chemical composition and can be used in a wide activation range (between −23 and 78 C) [18].
In this context, Gallart-Sirvent et al. [19] hydrolyzed and crystallized a composite of non-edible fat waste and investigated their thermal behavior by means of differential scanning calorimetry (DSC) and Fourier transform-infrared spectroscopy (FT-IR). In a different contribution, the same authors also applied combined biocatalytic reactions on non-edible animal fats and successfully converted the final mixture into dihydroxystearates (DHSEs) that showed good thermal properties as PCMs [20].
In the meantime, several studies have focused on the possibility of increasing the effective thermal conductivity of bio-PCM mixtures. Yu et al. [21], for example, stirred carbon nanomaterials, in a liquid Bio-PCM, for increasing the thermal conductivity of the final mixture, while Kang et al. [22] prepared a thermally enhanced bio-based PCM with silica fume through a vacuum impregnation process in combination with exfoliated graphite nanoplatelets (xGnP) with the aim of producing light-weight thermal energy storage materials for building applications.
As can be seen from these and other literature studies, most of the contributions focusing on bio-based PCMs generally develop advanced manipulation techniques aimed at optimizing the thermophysical performance of the waste, and because of this, inevitably end up increasing the overall embodied energy of the original product. In this work, fat wastes from slaughterhouse residues are used without further chemical processing to produce phase change material composites and their thermophysical performance is assessed by means of thermogravimetric analysis (TGA), differential scanning calorimetry (DSC) and extensive thermal monitoring. The final aim of the study is to investigate the potential use of the selected bio-PCM in the frame of passive building envelope solutions, where its less specialized behavior could represent a win to win solution for long term applications on the year basis.
Additionally, the main kinetic parameters of the investigated blend of fatty-acids could be employed to produce a numerical model describing the fire behavior of the PCM material [23,24]. The model could be implemented in a Computational Fluid Dynamics (CFD) code after the calculation of the kinetic triplet [25].

2. Materials and Methods

2.1. Phase Change Materials

In this work, an innovative bio-based PCM encountering phase transition around the ambient temperature, was selected and investigated by means of (i) thermogravimetric analysis (TGA) (ii) differential scanning calorimetry (DSC), and (iii) extensive thermal monitoring in dynamic thermal conditions. Results from the TGA were also used to investigate the kinetic of the thermal oxidation and define a specific reaction model. The selected PCM, i.e., animal fat from slaughtering residues, was mostly composed of non-edible fatty pig and chicken parts. All the different components where gathered at a slaughterhouse and reduced to a uniform blend by a mechanical treatment carried out at low temperatures, with the aim of producing a uniform paste to be later used in the characterization procedure. Globally, the final product presented around 52% of unsaturated, i.e., 42.5% monounsaturated and 9.5% polyunsaturated, and 42% of saturated fatty acids.

2.2. Methods for the Multipurpose Thermal Investigation

In this work, the previously described blend of bio-based fatty acids is characterized by means of an innovative multipurpose thermal investigation, with the aim of analyzing the potential use of the considered material in passive building envelope applications. In this view, a thermochemical investigation technique, generally used for characterizing bio-fuels is carried out with the aim of analyzing chemical stability and fire resistance of the samples. Secondly, a more common DSC analysis is used to define their latent behavior, and finally, a real scale thermal monitoring procedure is developed to evaluate the thermal response of the bio-blend when exposed to a thermal forcing procedure characterized by heating and cooling rates representative of real dynamic conditions for common building envelope applications.

2.2.1. Thermogravimetric Analysis

A thermogravimetric analyzer (Leco TGA-601, Leco Corporation, St. Joseph, MI, USA) was used to investigate the thermal stability of the animal fat, by means of TGA experiments in the range 303.15–973.15 K using synthetic air, with a flow rate of 3.5 L/min. Based on the ICTAC recommendations [26], four different heating rates, i.e., 5, 7, 10 and 15 K·min 1 , were used in the kinetic experiments. A quantity of 0.2 g of animal fat was placed in each crucible with the aim of reducing mass and heat transfer limitations [27].
Thermogravimetric (TG) and differential thermogravimetric (DTG) curves were obtained as a function of temperature and the initial and peak decomposition temperatures, i.e., T i and T p , respectively, were determined. The former was defined as the temperature at which 5% of the initial mass of the fatty acids is lost, while the latter was defined as the temperature at the maximum rate of thermal decomposition [28]. Several blank runs were carried out without a sample for TG baseline correction. All thermal analyses were repeated twice to decrease the experimental error, and the reproducibility was good.

2.2.2. Kinetic Analysis

In this study, the thermal data from the TGA analyses were used to carry out a kinetic investigation on the animal fat and calculate its main kinetic parameters such as the activation energy (E), the reaction model f( α ) and the pre-exponential factor (A). In particular, the activation energy represents the minimum amount of energy required to start combustion and, therefore, it is a key parameter in the analysis of building fire safety. The kinetic analysis is based on the material decomposition rate equation, which can be written as:
d α d t = k T f α h P
where t is time, T is the absolute temperature, f( α ) is the differential form of the reaction model, k(T) is the temperature dependence of the rate constant, h P is a function of the total pressure of the system. Such contribution is here neglected since it generally has low impact and is also usually ignored in most kinetic computational methods used for thermal analyses [26]. Finally, α is the conversion degree and is the expressed as:
α = m i m t m i m f
where m i is the initial mass of the sample, m t is the mass of the sample at temperature T, m f is the final mass of the sample. Since the rate constant k(T) can be defined by Arrhenius equation as:
k T = A exp E R T
where E (kJ·mol 1 ) is the activation energy, A (s 1 ) is the pre-exponential coefficient and R (J·mol 1 · K 1 ) is the universal gas constant. Then, under non-isothermal conditions at a constant heating rate, β = dT/dt, Equation (1) is transformed:
d α d t = A β exp E R T f α
which following the integration, can be written as:
0 α d α f ( α ) = g ( α ) = A β T 0 T exp E R T d T = A E β R p ( u )
where p(u), with u = E/RT, and g ( α ) are the temperature integral and the integral form of the reaction model, respectively.
No analytic solution can be found for Equation (5) but different approximations have been studied. Here, in particular, we will consider two kinetic models based on the isoconversional method, i.e., the distributed activation energy models developed by Starink [29]:
ln β T 1.92 = 1.0008 E R T + c o n s t a n t
where the activation energy can be determined by the slope of the regression lines of ln ( β /T 1.92 ) vs. 1/T, and Miura-Maki [30]:
ln β T 2 = ln A R E + 0.6075 E R T
where the activation energy can be determined by the slope of the regression lines of ( β /T 2 ) vs. 1/T.

2.2.3. Reaction Model Determination Using the Master-Plots Method

In this work, the master-plots method was used to define the reaction mechanism and the related pre-exponential factor for the thermal decomposition, based on the activation energy found with the isoconversional methods. In this methodology, the temperature integral, p(u), is defined by means of the Doyle’s approximation [31]:
p u = 0.00484 e 1.0516 u
and a reference conversion point ( α = 0.5 ) is used in Equation (5):
g 0.5 = A E β R p u 0.5
where u 0.5 = E · ( R T 0.5 ) 1 , T 0.5 is the temperature at α = 0.5 and g(0.5) is the integral form of the reaction model at α = 0.5 .
At this point, the integral master-plots equation can be obtained dividing Equation (5) by Equation (9):
g α g 0.5 = p u p 0.5
Finally, the theoretical, g( α )/g(0.5), and the experimental, p(u)/p(0.5), master plots are plotted as a function of conversion rate and used to define the most suitable kinetic model, which for a single step decomposition process with a constant g ( α ) expression, was shown to be associated with a relatively high degree of certainty [32].
Table 1 shows the most common kinetic functions g ( α ) . According to Yang et al. [33], the model which better represents the experimental data was selected based on the minimum standard deviation ( δ ) between experimental and theoretical data. As reported in Equation (11) the reference criterion for choosing an acceptable kinetic model was taken as a sum of δ :
Σ δ = Σ j n Σ i m g k α i p j u i g k 0.5 p j u 0.5 2 n 1 m 1
where m and n are the numbers of points and heating rates, respectively. The value of Σ δ is the averaged square of the deviation between p ( u ) / p ( u 0.5 ) calculated on the base of the experiment and g k α / g k 0.5 , in which k denotes the serial number of the model functions listed in Table 1.

2.2.4. Differential Scanning Calorimetry

A DSC 822e from Mettler Toledo differential scanning calorimeter was used to carry out the thermophysical characterization of the animal fat in terms of phase change temperature and enthalpy. In more detail, a three cycle program at 5 K·min 1 under flowing 80 mL·min 1 nitrogen gas was used to analyze the bio-based PCM (the first cycle one was disregarded and the mean average of the other two was used, with a confidence interval of 95%). In the DSC analyses the temperature range 253.15–333.15 K and a mass sample of around 5 mg located in 40 μ L aluminium crucibles were considered. The equipment accuracy was ±0.1 K for temperature and ±3 kJ·kg 1 for enthalpy.

2.2.5. Thermal Monitoring in Dynamic Conditions

The last analysis developed in this work was focused on the evaluation of the animal fat thermal response under heating and cooling rates representative of real dynamic conditions. To this aim an ATT DM 340 SR climatic chamber, equipped with a 601 × 810 × 694 mm 3 test compartment was used to expose the bio-based PCM to a specifically designed hygrothermal cycle.
In more detail, three different samples were produced using three identical glass sample holders (with a volume of about 1385 cm 3 ). The thus-prepared animal fat specimen were housed within the test compartment of the ATT DM 340 SR equipment and exposed to a thermal cycle characterized by two linear ramps (a heating and a cooling one) with a variation rate of about 0.2 K·min 1 and three temperature plateuax (two at 263.15 K and one at 323.15 K) (see Table 2). The temperature forcing procedure was specifically realized with the aim of investigating the thermal response of the material considering temperature ranges that typically characterize real applications, in order to investigate its possible behavior when integrated in engineered building components.
Nine T-type thermocouples were used to continuously monitor the theraml profile of each sample during the whole duration of the cycle. In more detail, the temperature sensors were placed on the nodes of a 5 × 5 cm planar grid constituted by 2 cells both on the x and y direction. Such grid was located vertically in the sample, with the x axis parallel to a diameter of the cylindrical sample holder, about 1 cm away from the contact surface between the matrial and the glass or the air (see Figure 1).

3. Results and Discussion

3.1. Thermal Decomposition Characteristics

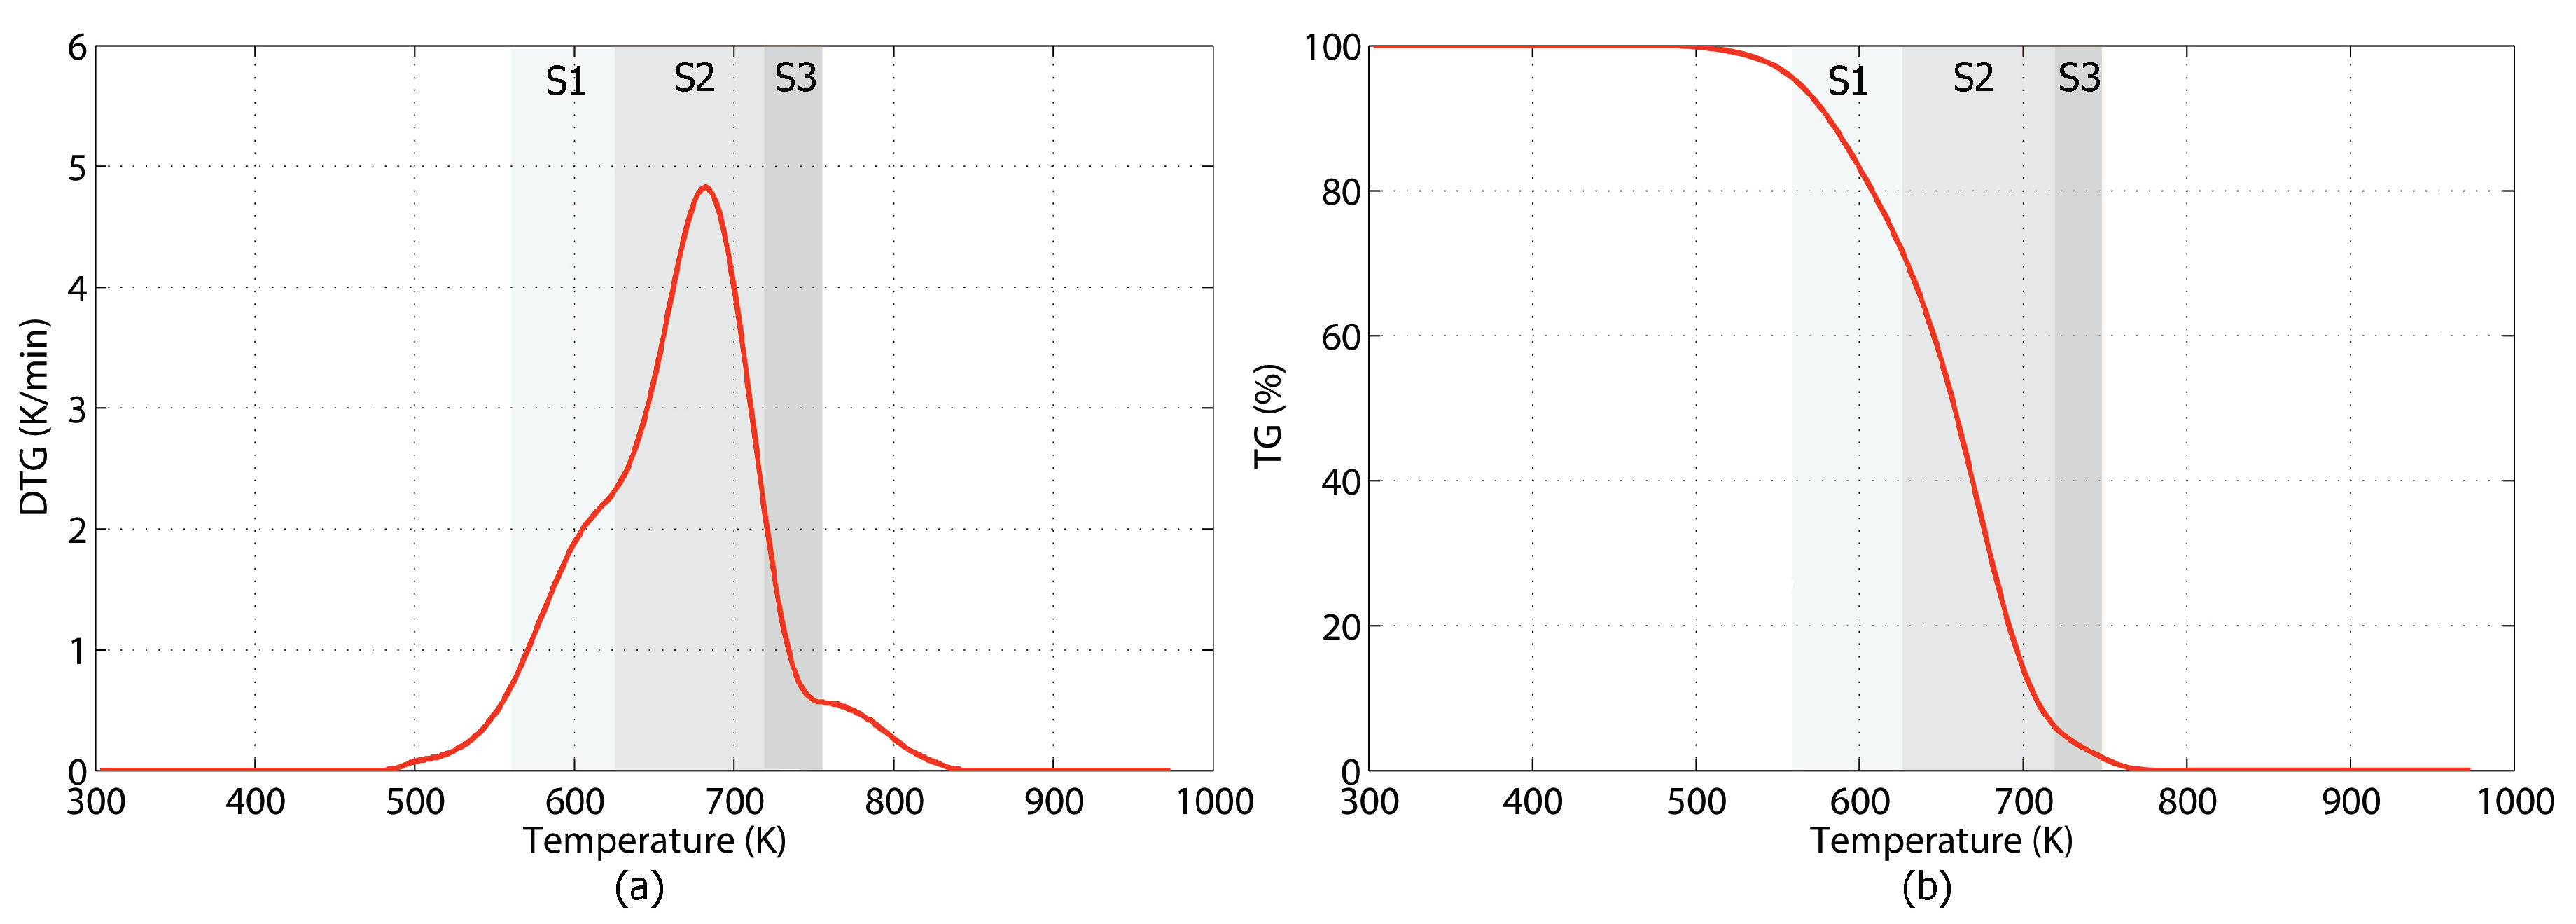
According to Li et al. [34], the TG and the DTG curves obtained considering heating rates of 5 K·min 1 were used to accurately investigate the oxidative stability of the animal fat and determine its initial decomposition temperature. In particular, Figure 2 shows that the thermal degradation of the animal fat can be divided into three oxidation stages, based on the degradation of polyunsaturated, monounsaturated and saturated fatty acids [35].
The first stage (S1) is due to the breakdown of polyunsaturated fatty acids and produces a 28% animal fat weight loss. It starts at about 567 K, and ends at 623 K. At this stage polyunsaturated fatty acids, mostly linjoleic acid, are decomposed and volatile compounds are produced and removed by the vapor produced during heating [36].
In the temperature range 623–721 K the investigated material experiences the second decomposition stage (S2), which corresponds to the volatilization of triglycerides, mainly composed of the monounsaturated fatty acids, with around 92 wt.% of animal fat lost. The peak temperature (680 K) is observed at this stage, due to the large oleic acid content, i.e., about 42.6%. Finally, the volatilisation of saturated fatty acids determines the last decomposition step (S3), which is registered between 721 K and 755 K. (mainly stearic and palmitic acids, 14.9% and 27.6%, respectively). The curve flattening at about 770 K shows that no further decomposition occurs at higher temperatures. This is also attributed to the vaporization and/or combustion of the animal fat.

3.2. Determination of the Activation Energy

In this section, results for the kinetic decomposition of the animal fat during its oxidation process carried out using Starink and Miura-Maki models are presented. Both these models were applied considering a conversion degree ( α ) between 20% and 80%, with a 5% step, according to the ICTAC recommendations [26]. This particular range allows us to obtain more accurate kinetic data avoiding multiple reactions, and excessive experimental errors that could affect the data below the lower and above the upper selected limits, respectively.
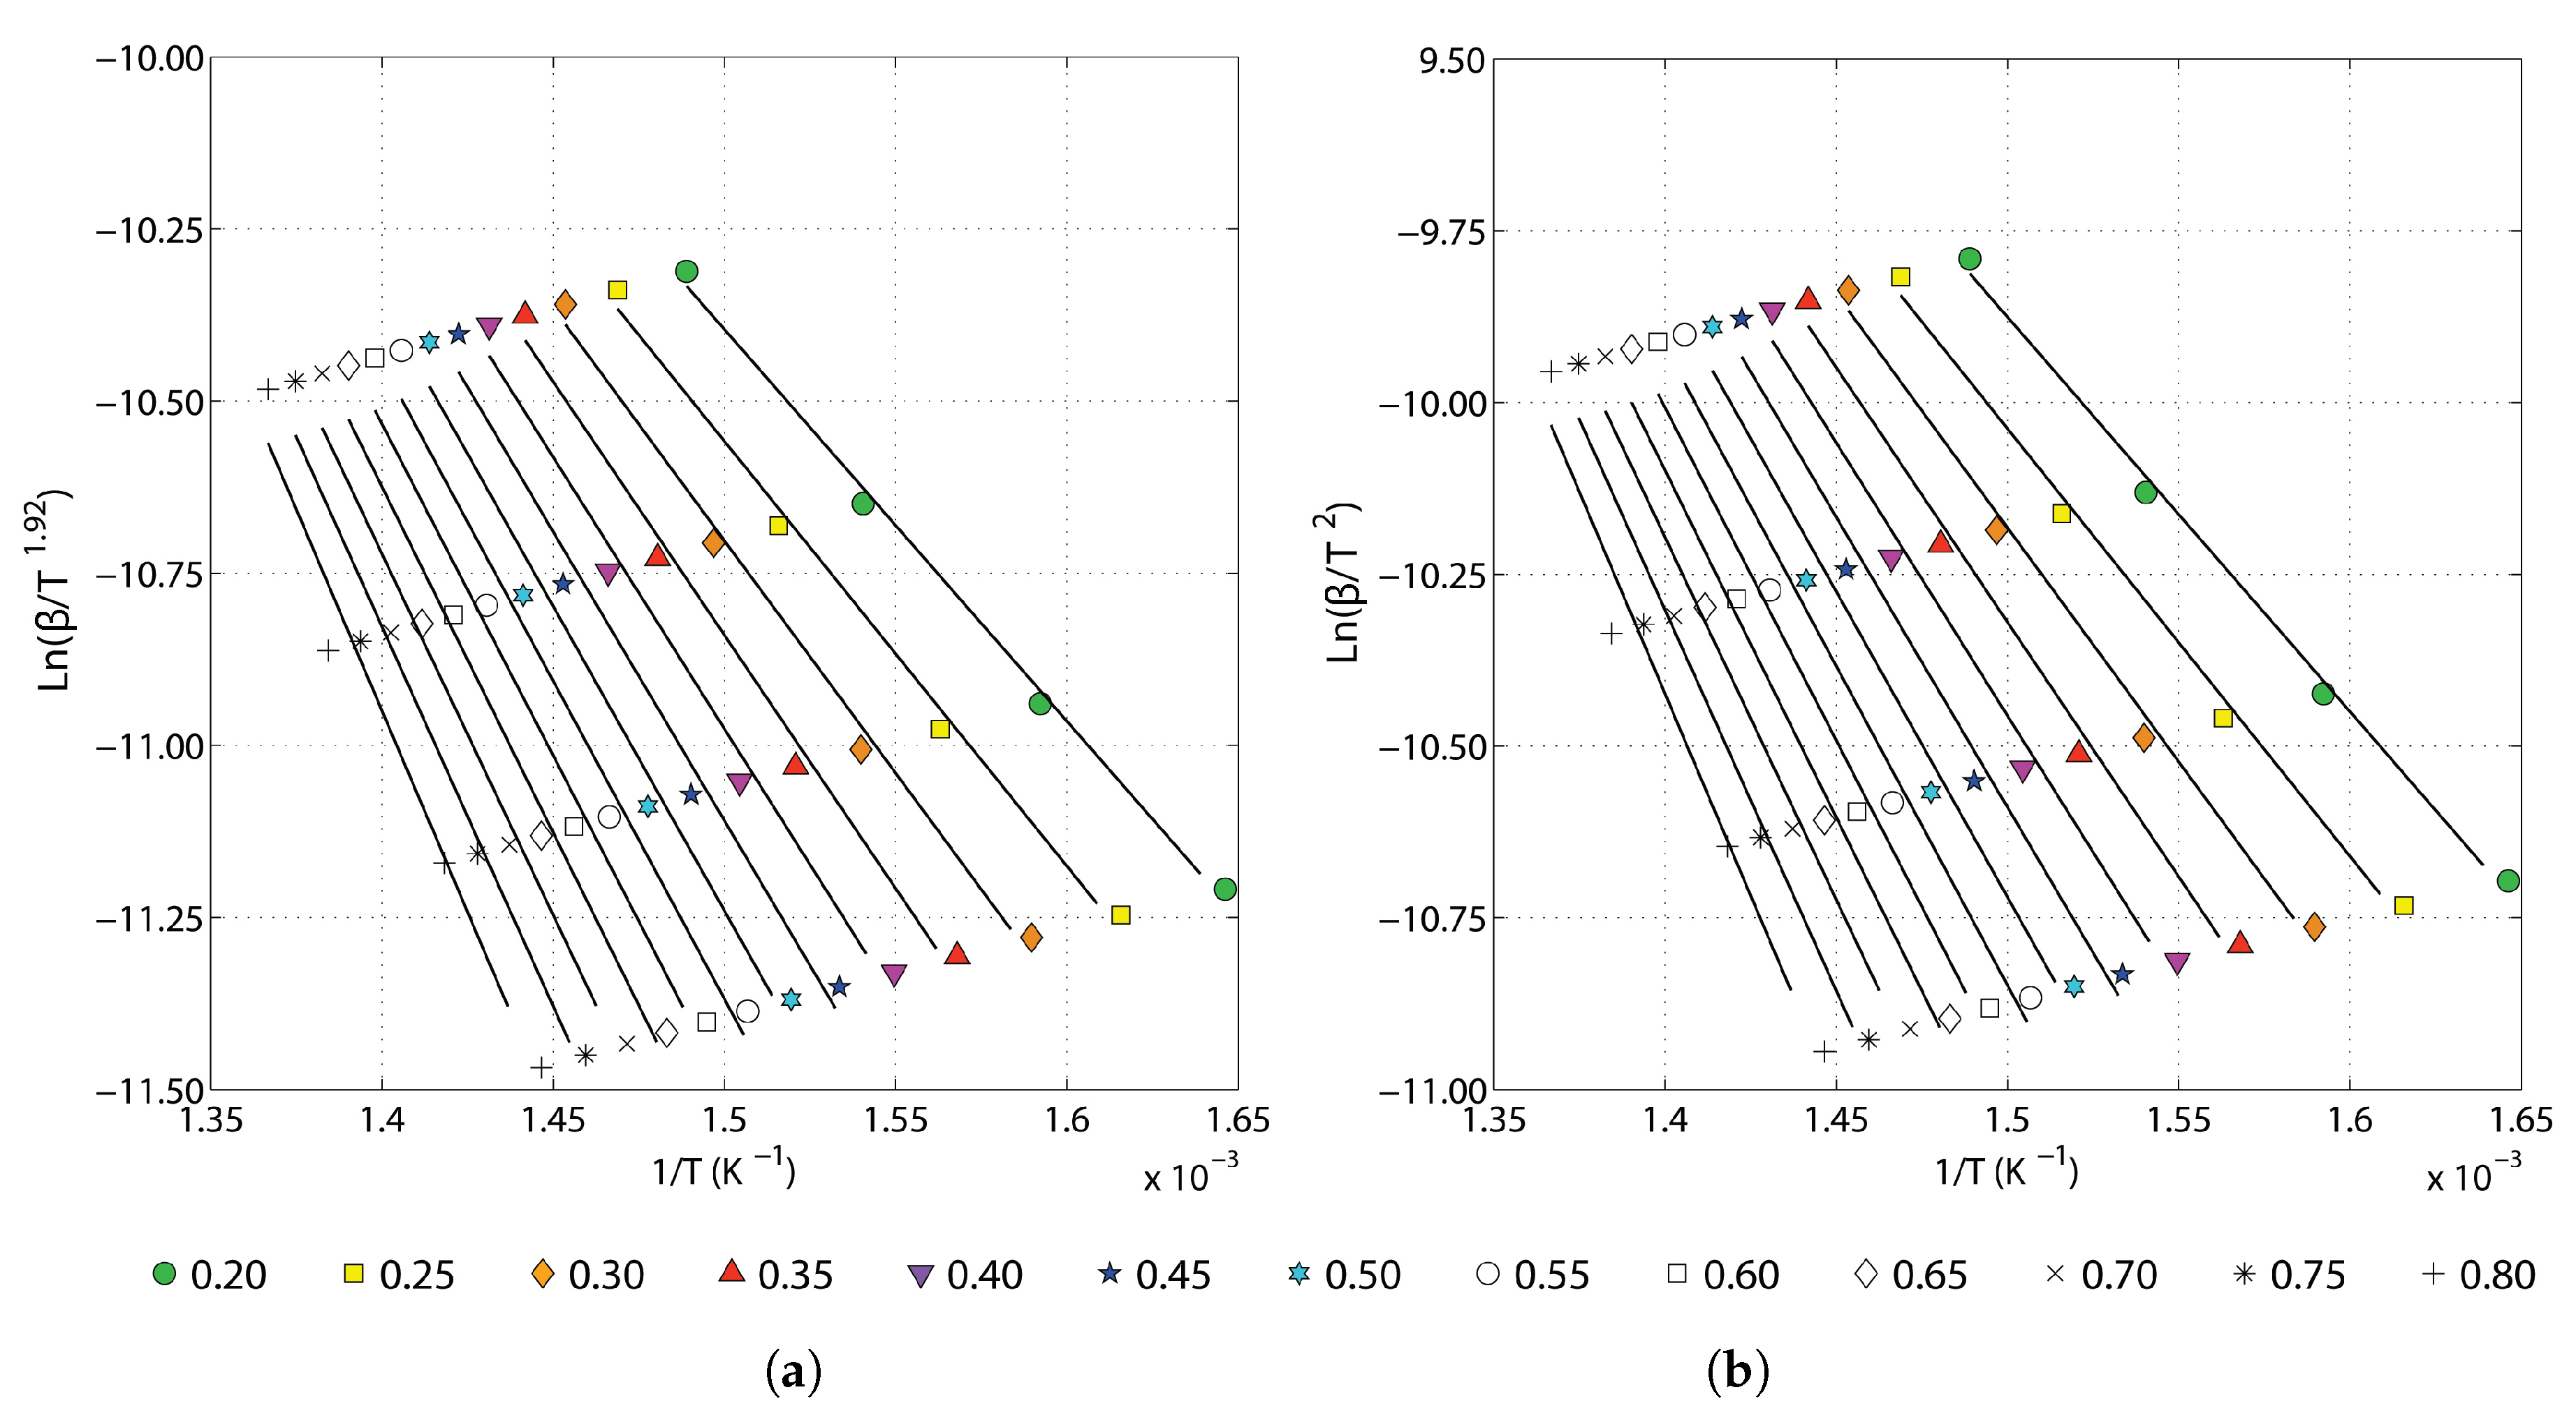
As explained in Section 2.2.3 and shown in Figure 3, the activation energy (E) of the animal fat was defined based on the isoconversional methods (Equations (6) and (7)), using different heating rates. The obtained values and the associated correlation (R 2 ) coefficient (always between 0.9972 and 0.9688) are resumed in Table 3.
As can be seen, both the investigated methods testify a relatively broad range for the activation energy, i.e., within 47.70 and 97.66 kJ·mol 1 and 47.37 and 97.26 kJ·mol 1 for the Starink and Miura-Maki method, respectvely, for α values ranging from 0.2 to 0.8. This suggests that the decomposition of the animal fat can be considered as a complex reaction including parallel, competitive, consecutive and reversible reactions [37].
At any rate, in both cases increasing degrees of conversion always produce an increase in the activation energy, whose average value represents the energy barrier to be overcome to break the chemical bonds between atoms, and can be considered as the main parameter to evaluate the thermal stability of a sample [38]. The obtained average value for the animal fat is 75.16 kJ·mol 1 and 72.46 kJ·mol 1 for the Starink amd the Miura-Maki method, respectively. These results are in line with previous studies on beef tallow and crude glycerin, which define ranges between 50 and 113 kJ·mol 1 and 42 and 90 kJ·mol 1 , respectively [23,39].

3.3. Reaction Model and Pre-Exponential Factor Determination

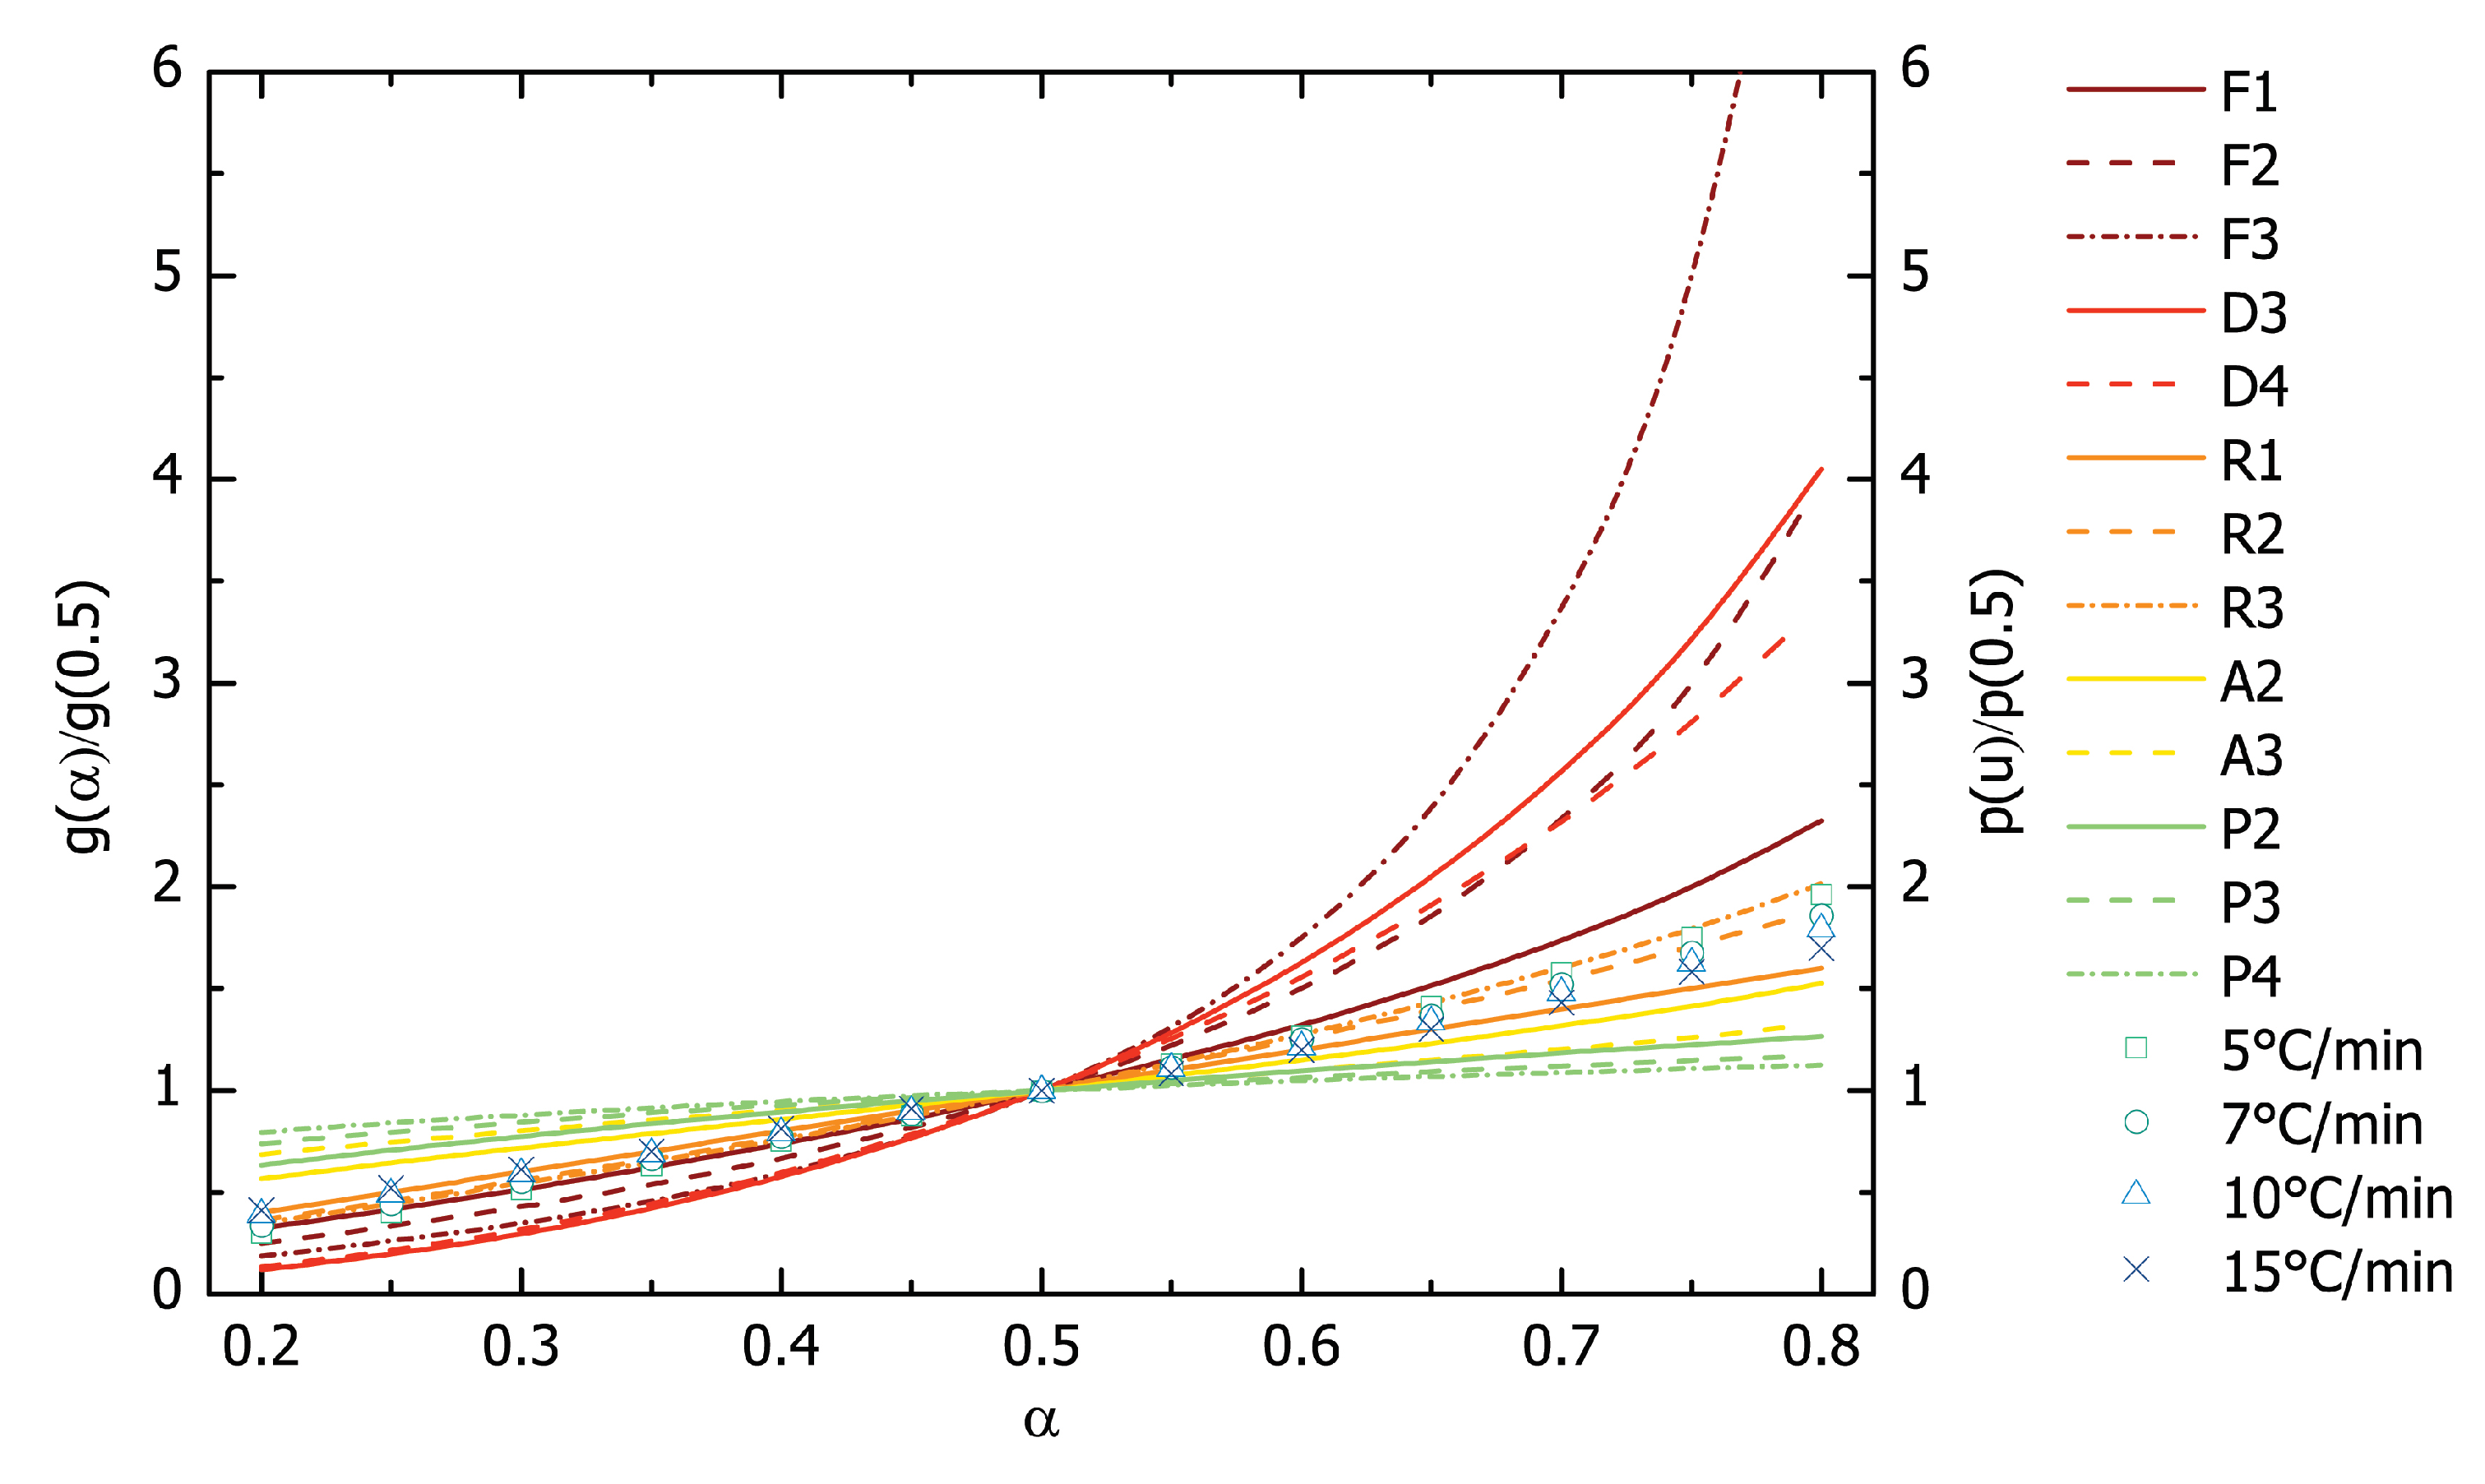
The obtained activation energy value was used in the master-plots method to predict the animal fat reaction mechanism. In more detail, the average E value from the Starink and the Miura-Maki methods, i.e., 73.81 kJ·mol 1 was introduced in Equation (8) and used for determining the animal fat reaction model. Figure 4 shows the theoretical, g ( α ) · g(0.5) 1 , and the experimental, P(u) · P( u 0.5 ) 1 , master-plots as a function of α . As can be seen, the experimental master-plots at different heating rates are almost identical, consequently, it can be stated that the thermal oxidation process of animal fat can be described by a single kinetic model.
The most representative kinetic model for the selected reaction is determined by means of a classic fitting procedure, considering the mathematical function in Table 3 and the obtained standard deviations calculated according to Equation (11).
Results show that the most probable reaction model for the animal fat thermal decompositionis the phase boundary controlled process (contracting area, R 2 mechanism) in which the nucleation step occurs immediately, so that the surface of each particle is covered with a layer of the product [40].
The mathematical expression of the selected reaction mechanism was introduced into Equation (5) to estimate the pre-exponential factor, obtaining Equation (12):
1 1 α 1 / 2 = A E β R ρ u
where E is the average value of the activation energy (73.81 kJ·mol 1 ).
At this stage, the values of the pre-exponential factor can be calculated from the slope of the straight line by plotting [1− (1 α ) 1 / 2 ] versus EAp(u) · ( β R ) 1 at various heating rates. From the results shown in Table 4, it can be noted that changes in the heating rate cause minimal difference in the values of A, confirming the single step reaction. Low values of pre-exponential factors (<10 9 s 1 ) may indicate a surface feedback of the animal fat, as well as a tight complex, and difficulties in breaking down [41].
The kinetic triplet (E, A, and f( α )) for the animal fat thermal decomposition process can be employed to define the kinetic expression using Equation (4). Therefore, Equation (13) can describe the kinetic reaction in a single-step for the animal fat.
d α d t = 6.46 E + 7 exp 73810 R T 2 ( 1 α ) 1 / 2
An important application of Equation (13) is the prediction of the estimated lifetime of the animal fat. Vyazovkin et al. [26] defined the lifetime of a material as the time after which the material loses its properties to such extent that it cannot efficiently fulfil the function for which it was produced. In particular, the degradation time (t α ) required to reach a given conversion rate can be calculated by Equation (14), which is the integral of Equation (13).
t α = 1 1 α 1 / 2 6.46 E + 7 exp 73810 R T
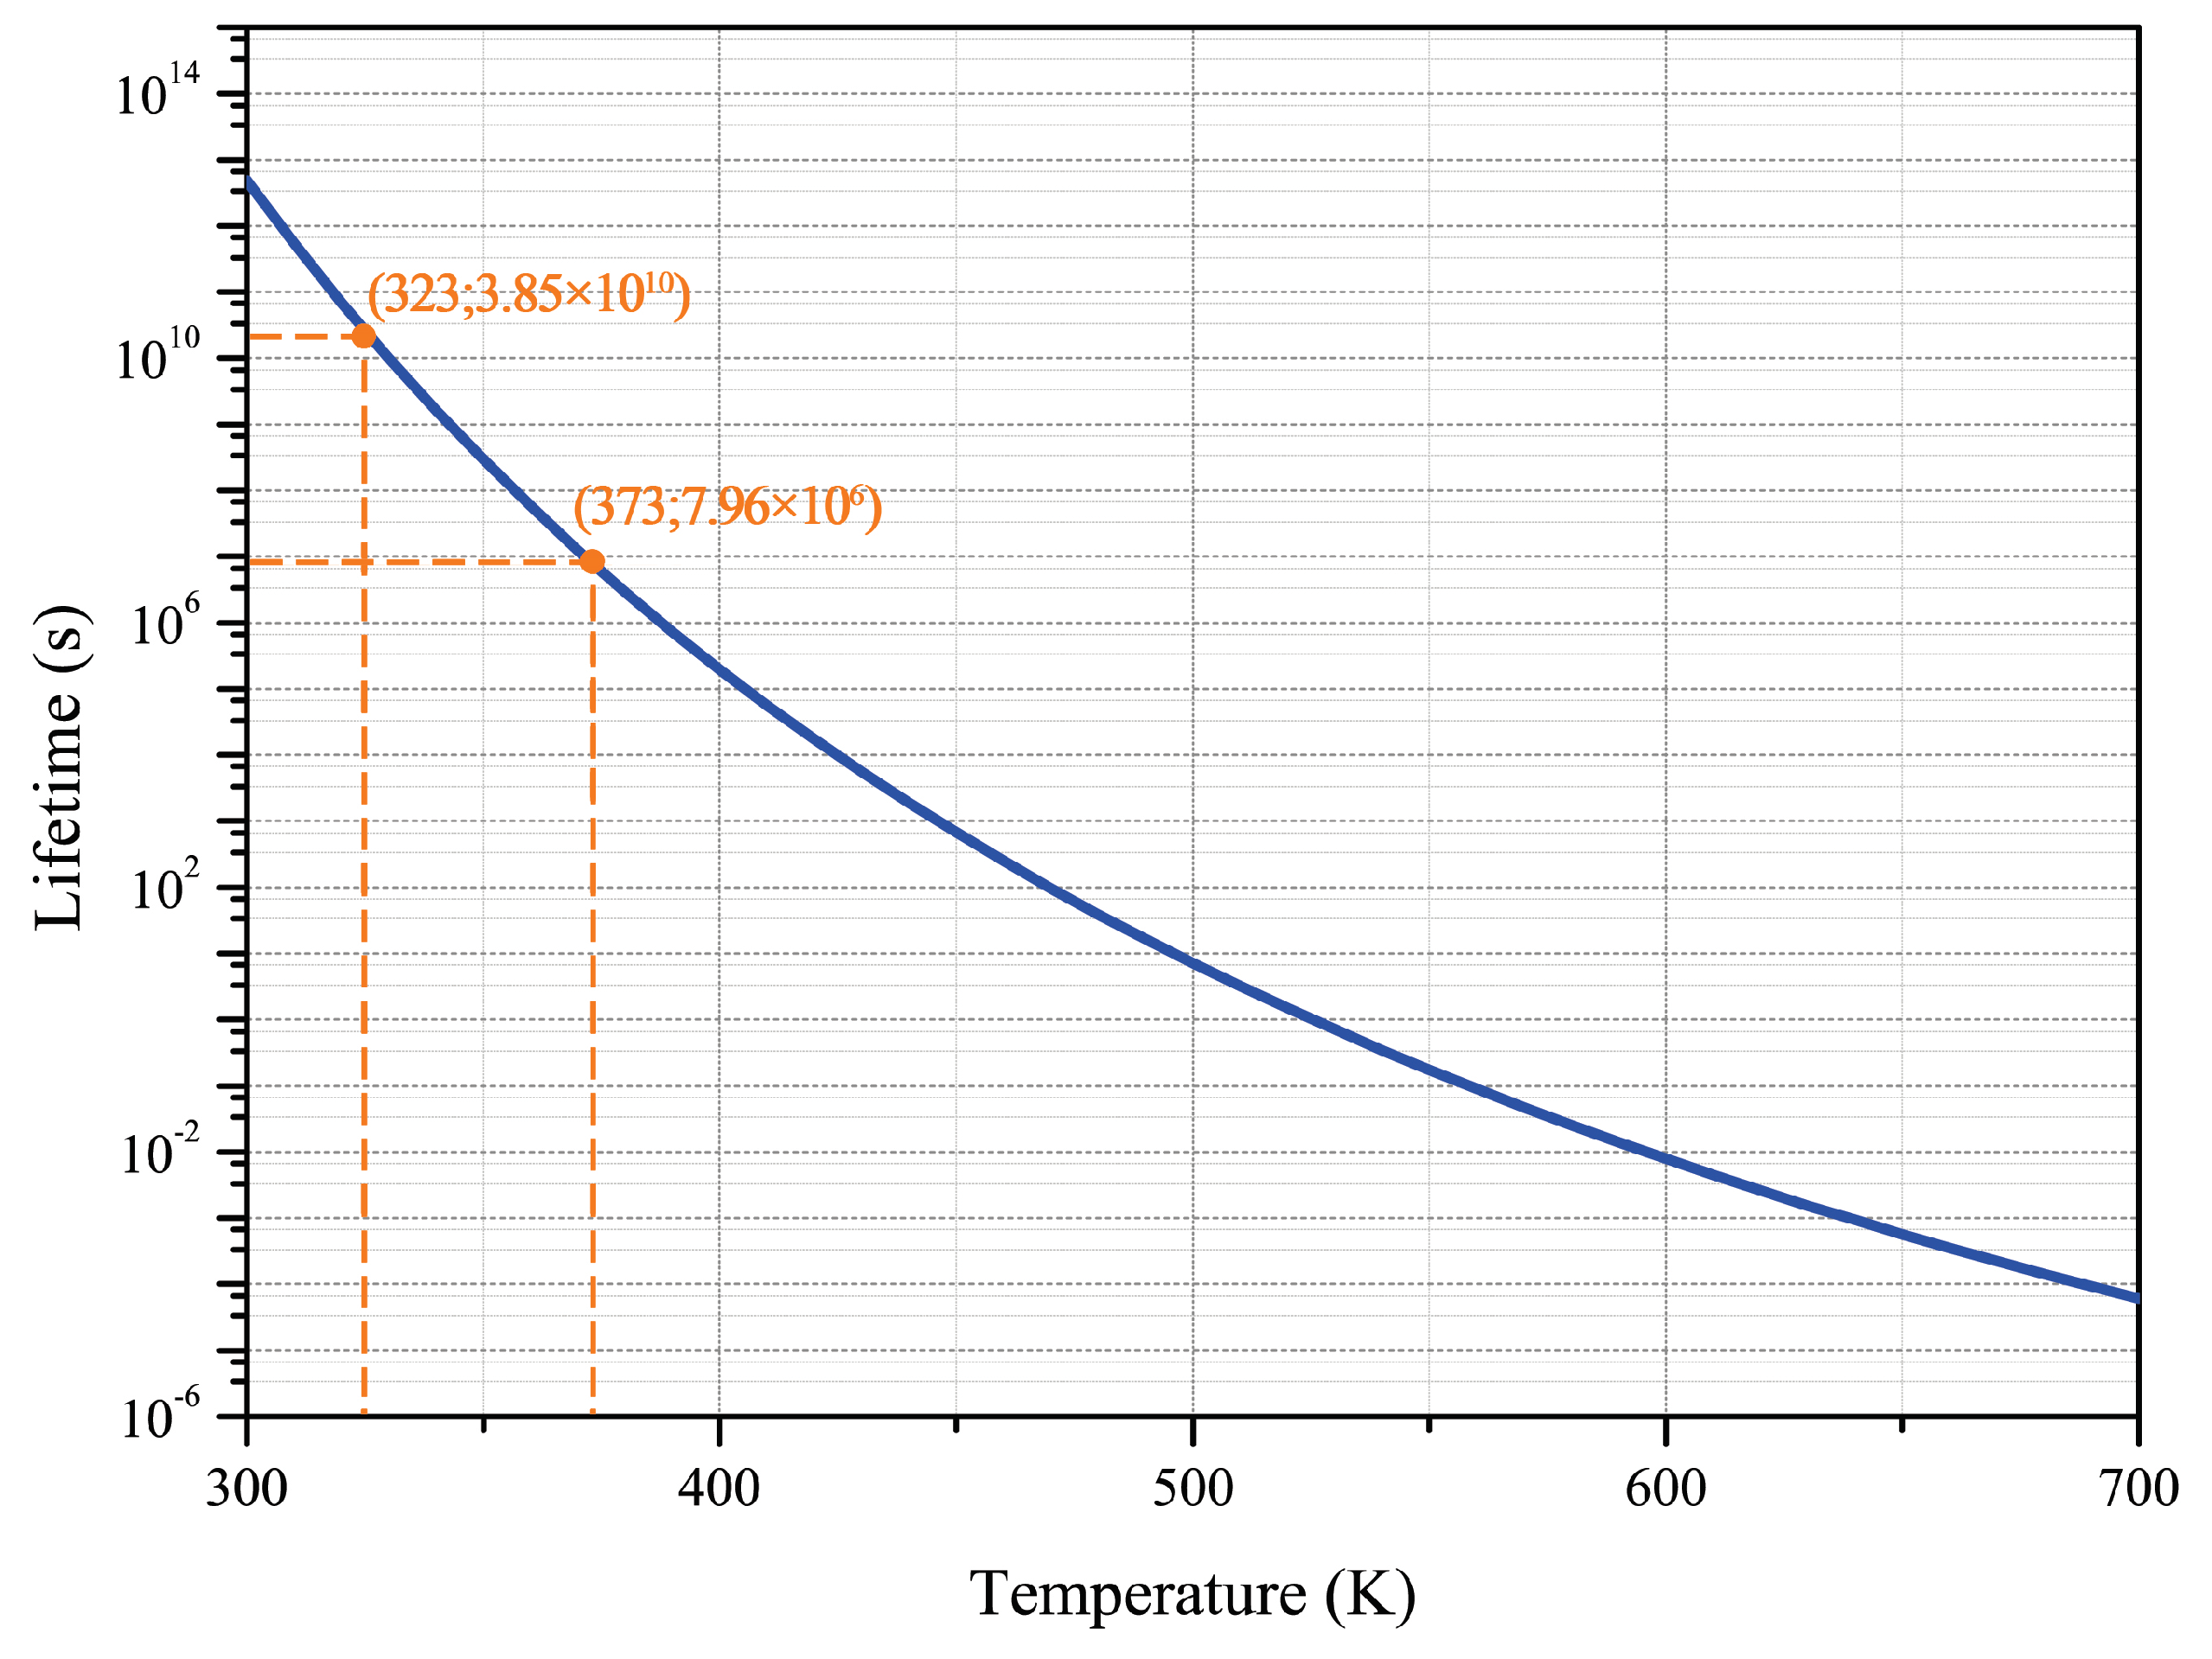
The lifetime, t f , is defined to be when the conversion rate is equal to 5%. Figure 5 shows the logarithmic curve of lifetime versus temperature for animal fat. Based on the calculation shown above, the lifetime of animal fat at 323 K and 373 K is equal to about 3.85 × 10 10 and 7.96 × 10 6 years, respectively. Consequently, the animal fat has the potential to be used as PCM for a very long time without failure.

3.4. Results from the DSC Characterization

As can be seen in Figure 6, results from the DSC analysis carried out on the animal fat detect two different peaks both during the melting and the freezing process. This is a consequence of the unique chemical composition of the bio-based PCM, which blends in its matrix different kinds of fatty acids, and in particular saturated and monounsaturated fatty acids. The first melting peak is observed at about 2 C, i.e., 275.03 K, while the second one at about 25 C, i.e., 298.30 K. As for the solidification process, it is associated with a first peak at about 21 C, i.e., 274.24 K, and a second one at 7 C, i.e., 280.33 K. In both cases, the melting and freezing peaks defined through the differential analysis are not very clear and cover a wide temperature range, so the obtained peak value can be considered as an average reference value for the transition processes.
By numerically integrating the obtained DSC profile, it is possible to calculate the latent heat capacities associated to the bio-based PCM double transition. In particular, as shown in Table 5, the global heat of fusion of the animal fat reaches 28.94 kJ·kg 1 . Such a value, although lower than the most common commercial products [18], can be considered as an interesting result for a cost-effective, bio-based solution such as the selected animal fat, which is in effect a residue from a slaughterhouse. Furthermore, the application of this kind of bio-source is even more interesting if we consider that its unique chemical composition would allow us to produce with little processing a passive building envelope component with two different activation temperatures.

3.5. Results from the Thermal Monitoring

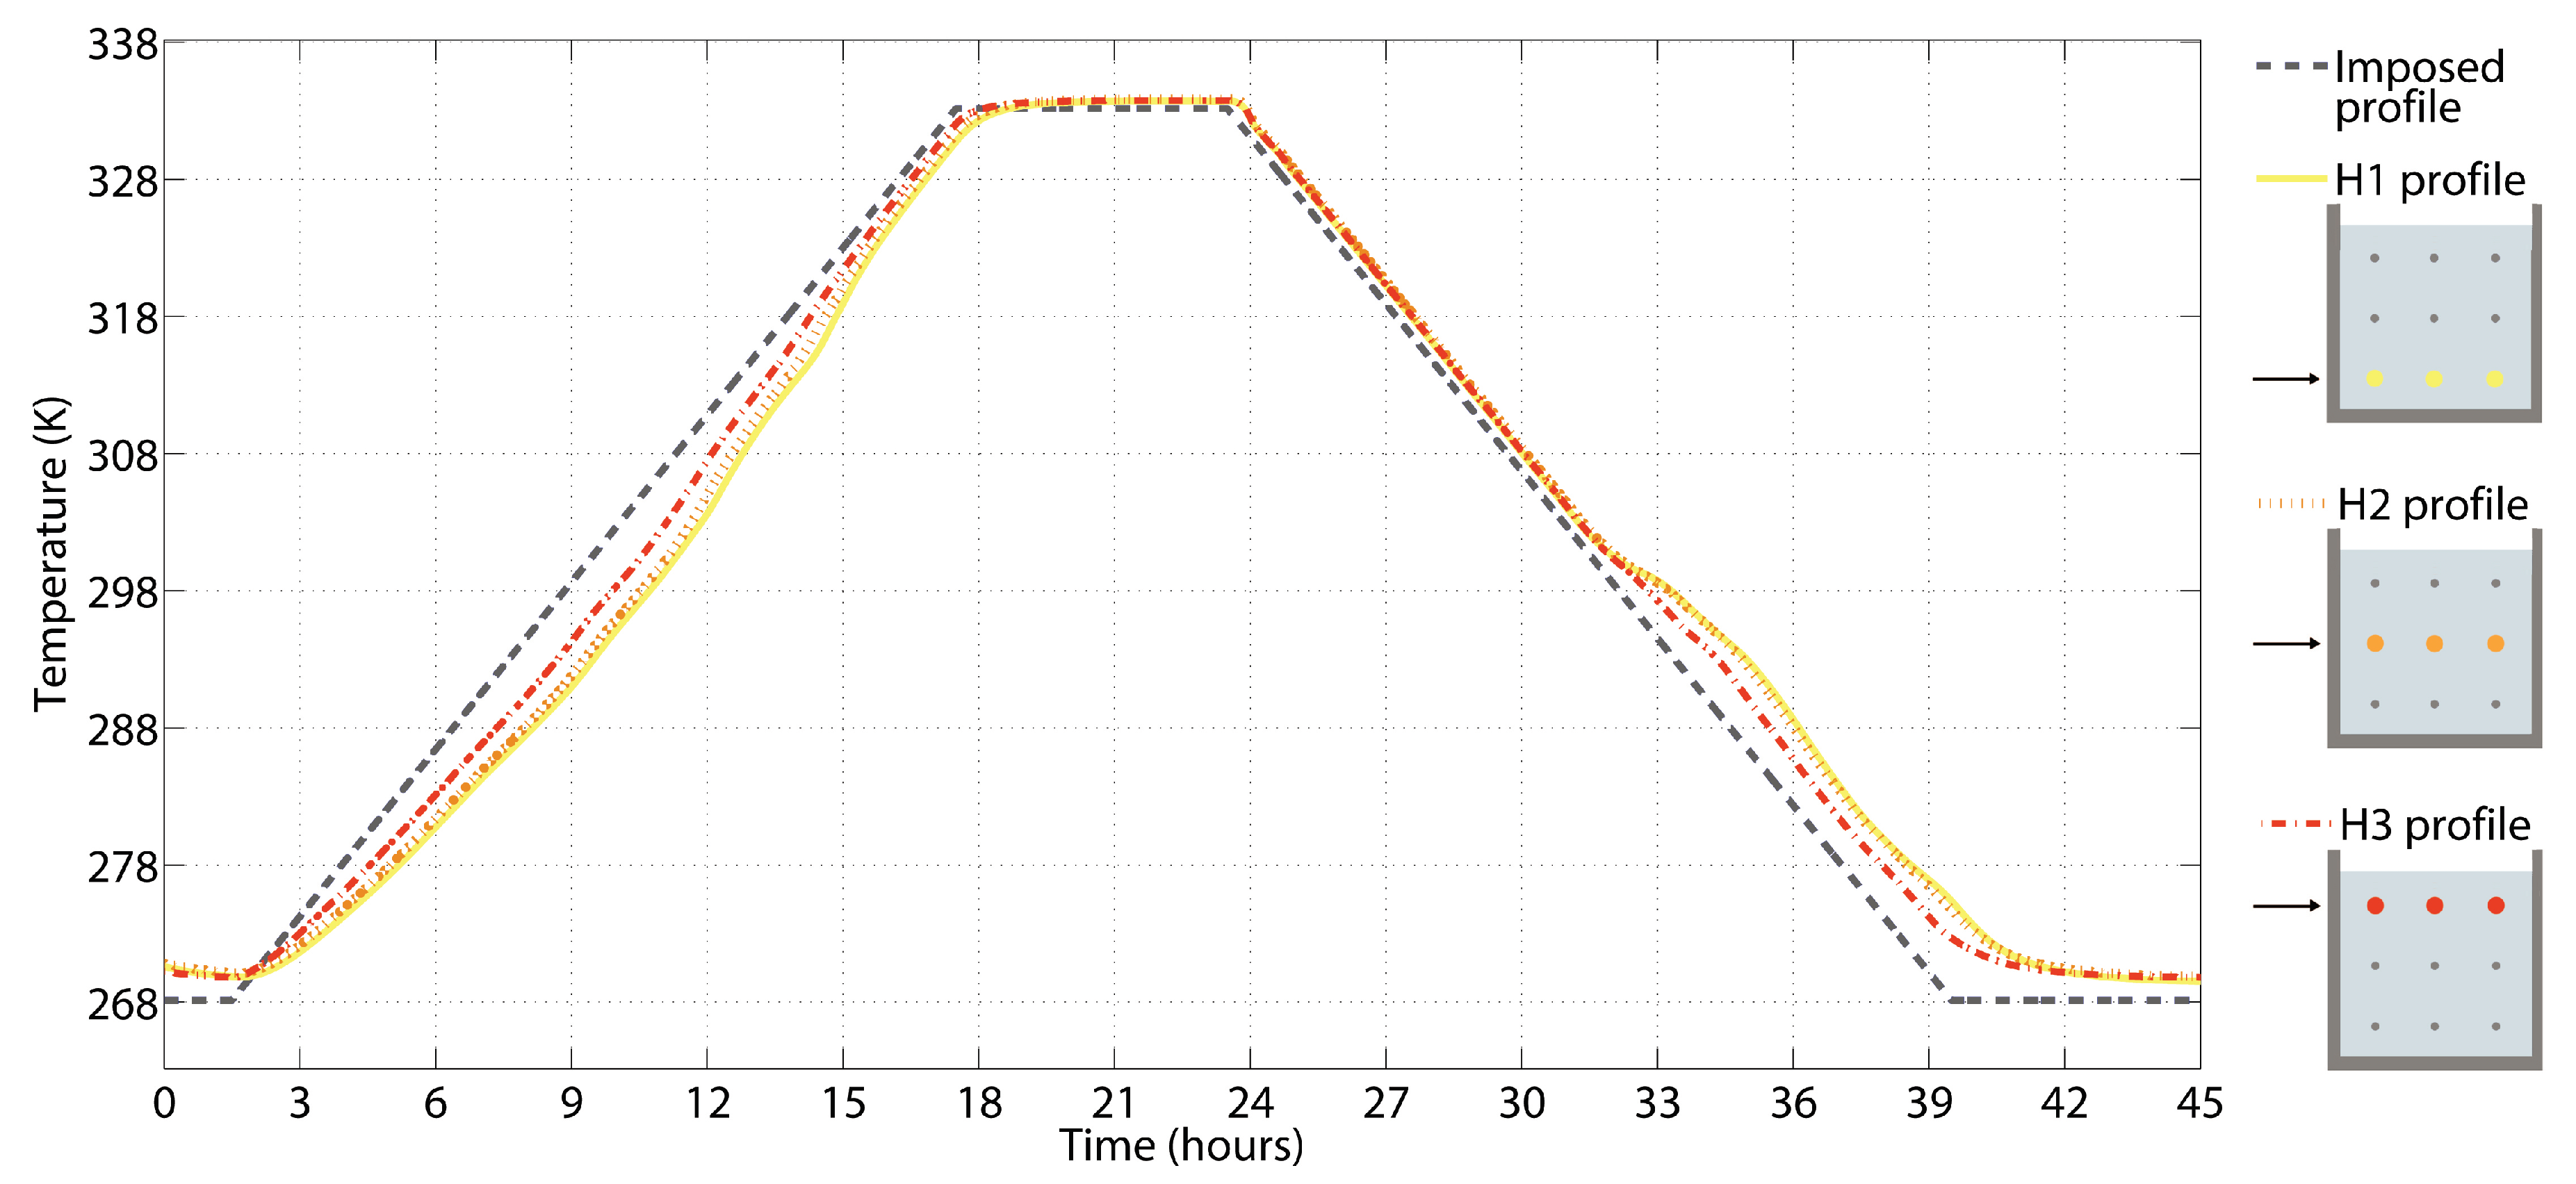
Results from the continuous monitoring of the bio-based PCM during the imposed hygrothermal profile are reported in Figure 7, where the dashed line represents the temperature profile imposed by the chamber, and the other ones, i.e., the solid yellow, the dot orange and the dash-dot red line, show the average thermal response of the animal fat at the bottom (H1), medium (H2) and top (H3) nodes of the monitoring grid, respectively. As can be seen, the bio-PCM follows the imposed forcing conditions fairly regularly; however, the thermocouples in the upper part of the sample seem to be more rapidly affected by the cycle, and more closely follow the reference dashed line. This is because, without the glass layer, the free surface of the PCM directly exchanges heat mainly via convection and conduction with the surrounding air volume, and so, the rate of heat exchanged by the PCM is generally higher in this part of its volume.
The H2 and H1 temperature profiles, on the other hand, are essentially overlapping during the overall duration of the cycle, and show unique deviations during both the heating and the cooling ramp. Such deviations can be considered as an effect of the phase transition taking place in the animal fat under specific temperature conditions.
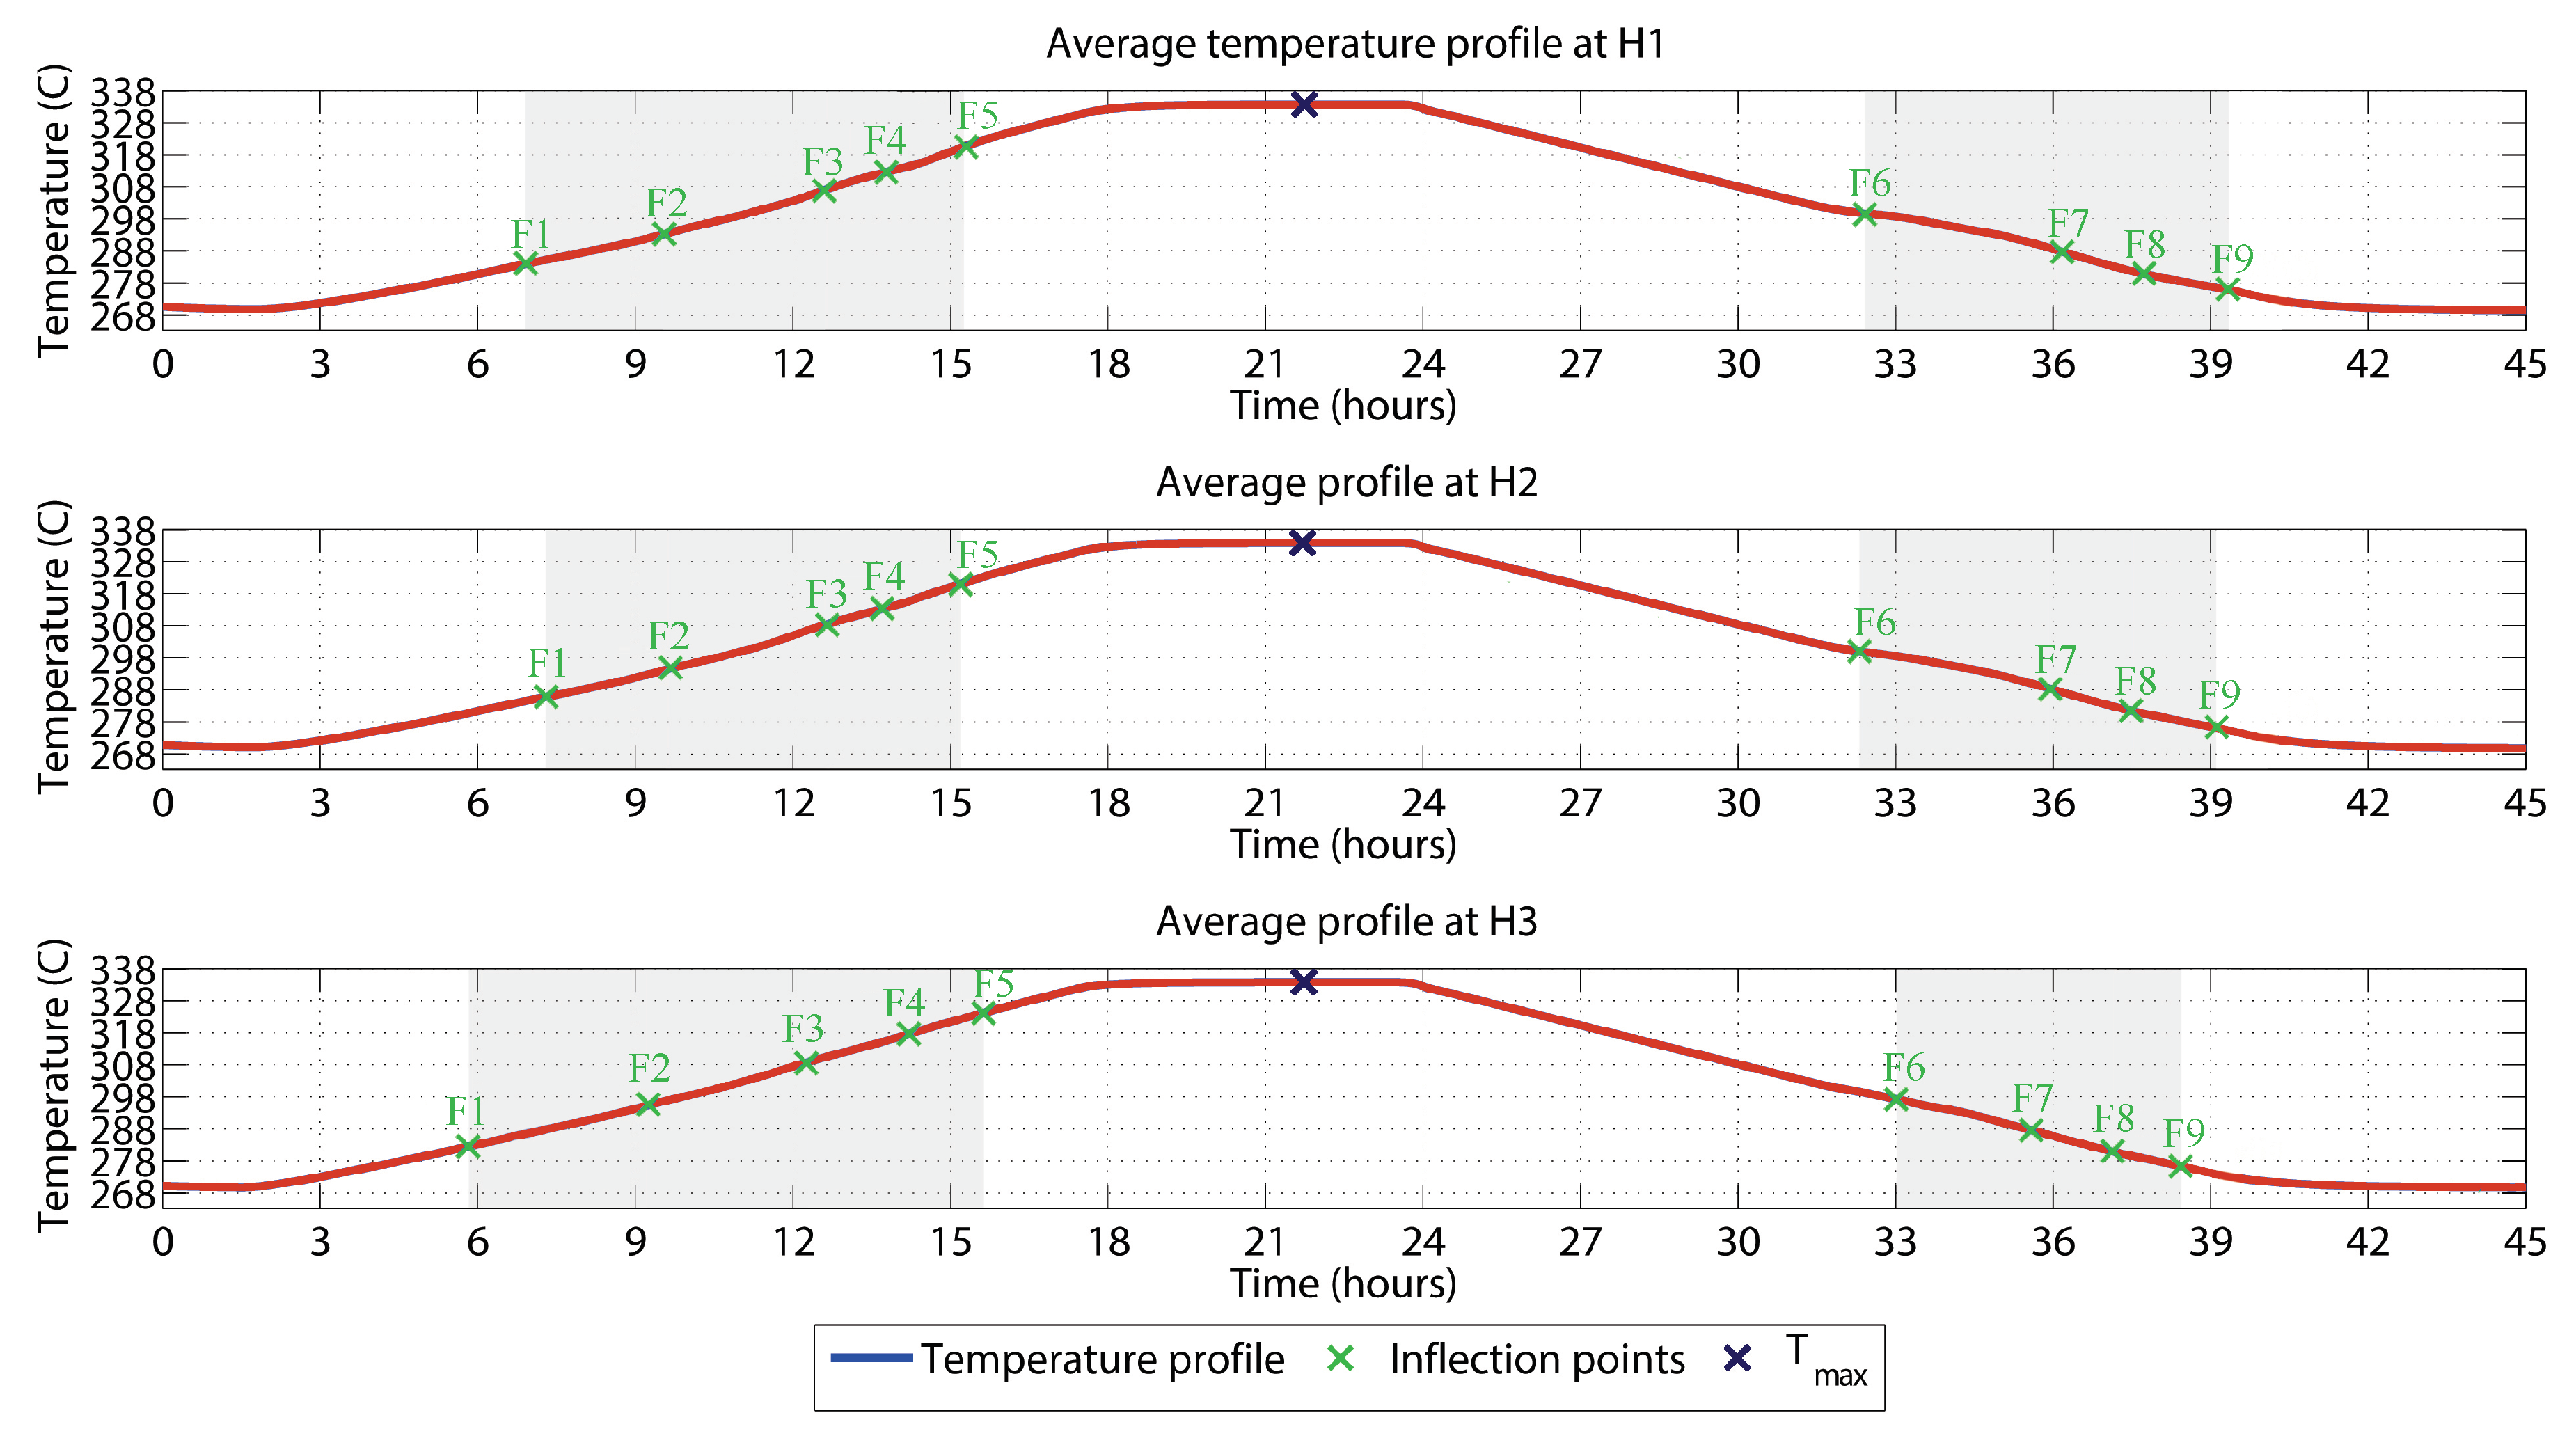
A more careful analysis of the animal fat thermal performance was carried out by numerically investigating each temperature trend in terms of peak temperature and inflection points. The main results from this investigation are shown in Figure 8 and Table 6.
As expected, the maximum temperature value, i.e., about 333.6 K is firstly reached by the superficial layer of the animal fat (after about 22 h and 28 min), followed by the central (22 h and 31 min) and the lower one (22 h and 34 min).
Concerning the characterization of the different latent phenomena taking place in the bio-based matrix, nine different inflection points are identified by the automated calculation: five during in the heating and four during the cooling transients of the cycle. These points are essentially overlapping in the case of the H1 and H2 profiles, even though the temperature trend associated to central nodes of the monitoring grid (H2) tends to be a little delayed in time. As for the H3 results, although similar regions are defined by the inflection points, in this case the obtained temperature trend can be considered as partly affected by the local boundary condition. For this reason only the points from H1 and H2 profiles are considered and used to define the main features of the melting process occurring in the PCM. Results do not allow us to identify distinct melting processes, but rather seem to depict a large transition process, starting at about 283.8 K, and finishing at about 321.4 K. The different variations in the concavity of the obtained profile are probably due to the sub-sequential activation of the different latent processes associated to the various fatty acids dispersed in the mixture. Similarly, a long crystallization process affected by a non-negligible subcooling phenomenon is also detected, i.e., in the range 299.7–25.7 K; however, an extension to lower temperatures would probably show more inflection points due to the progression of the phase transition with decreasing temperature boundary conditions.

4. Concluding Remarks

In this work, thermogravimetric analysis (TGA), differential scanning calorimetry (DSC) and extensive thermal monitoring during imposed hygrothermal cycling are used to investigate the potential use of a novel bio-based PCM, i.e., animal fat from slaughterhouse residues, in passive building envelope applications. Additionally, results from the TGA are also used for exploring the stability of the fatty acids blend when exposed to high temperatures. In particular, the main kinetic parameters representative of the oxidation process such as the activation energy (E), the reaction model (f( α )) and the pre-exponential factor (A), are defined with the aim of producing useful information for combustibility and flame spread analyses by means of numerical models.
The thermogravimetric analyses carried out under air atmosphere to better represent real conditions in building applications, revealed that the thermal oxidation of the animal fat can be represented by a three-step reaction. Each step is associated to the oxidation of a specific fatty acid, i.e., polyunsaturated, monounsaterated and saturated fatty acids in the range 567–623 K, 623–721 K and 721–770 K, respectively. Additionally, two kinetic models (Starink and Miura-Maki) based on the isoconversional method, allow us to define an average activation energy of about 73.81 kJ·mol 1 , in line with previous literature studies. Concerning the kinetic analysis through Master-plot methods, the two-dimensional phase boundary reaction is the most suitable model to represent the thermal degradation of the animal fat, which revealed an optimal thermal durability when exposed to medium-low temperatures.
Results from the differential scanning calorimetry show that the investigated bio-source exhibits two different and quite broad melting peaks. The former occurs at about 2 C and is associated to a melting enthalpy of about 5.67 kJ·kg 1 , while the latter, which can approximately store 23 kJ·kg 1 has its peak at about 25 C. Both these phase transitions seem to be subjected to non-negligigle subcooling effects.
Lastly, results from the thermal monitoring during the imposed hygrothermal cycle show a large number of inflection points during the investigated heating and cooling ramp, nine in total. These inflection points are associated with the large, higher temperature melting peak already detected by the DSC characterization. the different inflection points are a consequence of the spurious nature of the blend, which is composed by different kinds of fatty acids and for this reason can maintain its latent response to the incoming heat wave for longer periods of time, and in a larger temperature range.
As a conclusion, the multipurpose thermal-based investigation carried out in this work allowed us to investigate the potential use of a promising, low-cost bio-based material, produced by simply collecting animal fat residues from a local slaughterhouse, as a non-hazardous component for passive building envelope applications. The obtained results testify to the good compatibility of the material with the selected passive application, which could benefit from both the broader activation range of the single melting phenomenon and the double phase transition given by the unique chemical characteristics of the composite. As a matter of fact, although commercial phase change materials are usually optimized in order to guarantee a very short activation range in terms of temperature, this is mostly a requirement of active systems, dealing with specific temperature inflows and outflows. However, when passive building solutions are considered, the integration of a low-tech and low-cost latent component, capable of responding to different boundary conditions could represent a win-win solution for both reducing summer overheating and winter dispersion. In this context, the use of relatively less refined fatty acids mixtures such the one selected in this study, could eventually represent a potential breakthrough in terms of seasonal building energy efficiency.

Author Contributions

Conceptualization, A.L.P. and L.F.C.; Methodology, C.F. and A.L.P.; Formal Analysis, C.F. and M.B.; Investigation, C.F.; Data Curation, C.F. and M.B.; Writing—Original Draft Preparation, C.F. and M.B.; Writing—Review & Editing, A.L.P. and L.F.C.; Visualization, F.C.; Supervision, L.F.C. and F.C.; Project Administration, L.F.C., A.L.P. and F.C.; Funding Acquisition, L.F.C., A.L.P. and F.C.

Funding

The work partially funded by the Spanish government (ENE2015-64117-C5-1-R (MINECO/FEDER)).

Acknowledgments

Cabeza would like to thank the Catalan Government for the quality accreditation given to her research group (2017 SGR 1537). GREA is a certified agent TECNIO in the category of technology developers from the Government of Catalonia. Authors from University of Perugia thank Fondazione cassa di Risparmio di Perugia for supporting the investigation about biomaterials within the project SOS CITTÁ 2018.0499.026.

Conflicts of Interest

The authors declare no conflict of interest.

References

  1. Aditya, L.; Mahlia, T.; Rismanchi, B.; Ng, H.; Hasan, M.; Metselaar, H.; Muraza, O.; Aditiya, H. A review on insulation materials for energy conservation in buildings. Renew. Sustain. Energy Rev. 2017, 73, 1352–1365. [Google Scholar] [CrossRef]
  2. Jelle, B.P. Traditional, state-of-the-art and future thermal building insulation materials and solutions—Properties, requirements and possibilities. Energy Build. 2011, 43, 2549–2563. [Google Scholar] [CrossRef]
  3. Schiavoni, S.; D’Alessandro, F.; Bianchi, F.; Asdrubali, F. Insulation materials for the building sector: A review and comparative analysis. Renew. Sustain. Energy Rev. 2016, 62, 988–1011. [Google Scholar] [CrossRef]
  4. Mehling, H.; Cabeza, L.F. Heat and Cold Storage with PCM—An up to Date Introduction into Basics and Applications, 1st ed.; Springer: Berlin/Heidelberg, Germany, 2008; p. 308. [Google Scholar]
  5. Souayfane, F.; Fardoun, F.; Biwole, P.H. Phase change materials (PCM) for cooling applications in buildings: A review. Energy Build. 2016, 129, 396–431. [Google Scholar] [CrossRef]
  6. Konuklu, Y.; Ostry, M.; Paksoy, H.O.; Charvat, P. Review on using microencapsulated phase change materials (PCM) in building applications. Energy Build. 2015, 106, 134–155. [Google Scholar] [CrossRef]
  7. D’Alessandro, A.; Fabiani, C.; Pisello, A.L.; Ubertini, F.; Materazzi, A.L.; Cotana, F. Innovative concretes for low-carbon constructions: A review. Int. J. Low-Carbon Technol. 2016, 12, 289–309. [Google Scholar] [CrossRef]
  8. Vicente, R.; Silva, T. Brick masonry walls with PCM macrocapsules: An experimental approach. Appl. Therm. Eng. 2014, 67, 24–34. [Google Scholar] [CrossRef]
  9. Chhugani, B.; Klinker, F.; Weinlaeder, H.; Reim, M. Energetic performance of two different PCM wallboards and their regeneration behavior in office rooms. Energy Procedia 2017, 122, 625–630. [Google Scholar] [CrossRef]
  10. D’Alessandro, A.; Pisello, A.L.; Fabiani, C.; Ubertini, F.; Cotana, F. Multifunctional smart concretes with novel phase change materials: Mechanical and thermo-energy investigation. Appl. Energy 2018, 212, 1448–1461. [Google Scholar] [CrossRef]
  11. Yuan, Y.; Zhang, N.; Tao, W.; Cao, X.; He, Y. Fatty acids as phase change materials: A review. Renew. Sustain. Energy Rev. 2014, 29, 482–498. [Google Scholar] [CrossRef]
  12. Kahwaji, S.; Johnson, M.B.; Kheirabadi, A.C.; Groulx, D.; White, M.A. Fatty acids and related phase change materials for reliable thermal energy storage at moderate temperatures. Sol. Energy Mater. Sol. Cells 2017, 167, 109–120. [Google Scholar] [CrossRef]
  13. Wang, R.; Ren, M.; Gao, X.; Qin, L. Preparation and properties of fatty acids based thermal energy storage aggregate concrete. Constr. Build. Mater. 2018, 165, 1–10. [Google Scholar] [CrossRef]
  14. Miró, L.; Oró, E.; Boer, D.; Cabeza, L.F. Embodied energy in thermal energy storage (TES) systems for high temperature applications. Appl. Energy 2015, 137, 793–799. [Google Scholar] [CrossRef]
  15. Cabeza, L.F.; Barreneche, C.; Miró, L.; Morera, J.M.; Bartolí, E.; Inés Fernández, A. Low carbon and low embodied energy materials in buildings: A review. Renew. Sustain. Energy Rev. 2013, 23, 536–542. [Google Scholar] [CrossRef]
  16. De Gracia, A.; Rincón, L.; Castell, A.; Jiménez, M.; Boer, D.; Medrano, M.; Cabeza, L.F. Life Cycle Assessment of the inclusion of phase change materials (PCM) in experimental buildings. Energy Build. 2010, 42, 1517–1523. [Google Scholar] [CrossRef]
  17. Oró, E.; Gil, A.; de Gracia, A.; Boer, D.; Cabeza, L.F. Comparative life cycle assessment of thermal energy storage systems for solar power plants. Renew. Energy 2012, 44, 166–173. [Google Scholar] [CrossRef]
  18. Sharma, R.K.; Ganesan, P.; Tyagi, V.V.; Metselaar, H.S.; Sandaran, S.C. Developments in organic solid-liquid phase change materials and their applications in thermal energy storage. Energy Convers. Manag. 2015, 95, 193–228. [Google Scholar] [CrossRef]
  19. Gallart-Sirvent, P.; Martín, M.; Villorbina, G.; Balcells, M.; Solé, A.; Barrenche, C.; Cabeza, L.F.; Canela-Garayoa, R. Fatty acid eutectic mixtures and derivatives from non-edible animal fat as phase change materials. RSC Adv. 2017, 7, 24133–24139. [Google Scholar] [CrossRef]
  20. Gallart-Sirvent, P.; Martín, M.; Solé, A.; Villorbina, G.; Balcells, M.; Cabeza, L.F.; Canela-Garayoa, R. Combining biocatalysts to achieve new phase change materials. Application to non-edible animal fat. Mol. Catal. 2018, 444, 76–83. [Google Scholar] [CrossRef]
  21. Yu, S.; Jeong, S.G.; Chung, O.; Kim, S. Bio-based PCM/carbon nanomaterials composites with enhanced thermal conductivity. Sol. Energy Mater. Sol. Cells 2014, 120, 549–554. [Google Scholar] [CrossRef]
  22. Kang, Y.; Jeong, S.G.; Wi, S.; Kim, S. Energy efficient Bio-based PCM with silica fume composites to apply in concrete for energy saving in buildings. Sol. Energy Mater. Sol. Cells 2015, 143, 430–434. [Google Scholar] [CrossRef]
  23. Crnkovic, P.M.; Koch, C.; Ávila, I.; Mortari, D.A.; Cordoba, A.M.; Moreira dos Santos, A. Determination of the activation energies of beef tallow and crude glycerin combustion using thermogravimetry. Biomass Bioenergy 2012, 44, 8–16. [Google Scholar] [CrossRef]
  24. Chetehouna, K.; Belayachi, N.; Rengel, B.; Hoxha, D.; Gillard, P. Investigation on the thermal degradation and kinetic parameters of innovative insulation materials using TGA-MS. Appl. Therm. Eng. 2015, 81, 177–184. [Google Scholar] [CrossRef]
  25. Asimakopoulou, E.K.; Kolaitis, D.I.; Founti, M.A. Fire safety aspects of PCM-enhanced gypsum plasterboards: An experimental and numerical investigation. Fire Saf. J. 2015, 72, 50–58. [Google Scholar] [CrossRef]
  26. Vyazovkin, S.; Burnham, A.K.; Criado, J.M.; Pérez-Maqueda, L.A.; Popescu, C.; Sbirrazzuoli, N. ICTAC Kinetics Committee recommendations for performing kinetic computations on thermal analysis data. Thermochim. Acta 2011, 520, 1–19. [Google Scholar] [CrossRef]
  27. Buratti, C.; Mousavi, S.; Barbanera, M.; Lascaro, E.; Cotana, F.; Bufacchi, M. Thermal behaviour and kinetic study of the olive oil production chain residues and their mixtures during co-combustion. Bioresour. Technol. 2016, 214, 266–275. [Google Scholar] [CrossRef]
  28. Carrasco, F.; Pags, P.; Gámez-Pérez, J.; Santana, O.O.; Maspoch, M.L. Kinetics of the thermal decomposition of processed poly(lactic acid). Polym. Degrad. Stab. 2010, 95, 2508–2514. [Google Scholar] [CrossRef]
  29. Starink, M.J. The determination of activation energy from linear heating rate experiments: A comparison of the accuracy of isoconversion methods. Thermochim. Acta 2003, 404, 163–176. [Google Scholar] [CrossRef]
  30. Miura, K.; Maki, T. A simple method for estimating f(E) and k0(E) in the distributed activation energy model. Energy Fuels 1998, 12, 864–869. [Google Scholar] [CrossRef]
  31. Doyle, C.D. Estimating isothermal life from thermogravimetric data. J. Appl. Polym. Sci. 1962, 6, 639–642. [Google Scholar] [CrossRef]
  32. Irmak Aslan, D.; Parthasarathy, P.; Goldfarb, J.L.; Ceylan, S. Pyrolysis reaction models of waste tires: Application of Master-Plots method for energy conversion via devolatilization. Waste Manag. 2017, 68, 405–411. [Google Scholar] [CrossRef] [PubMed]
  33. Yang, H.C.; Cho, Y.J.; Eun, H.C.; Kim, E.H.; Kim, I.T. Kinetic study of a thermal dechlorination and oxidation of neodymium oxychloride. Thermochim. Acta 2007, 460, 53–59. [Google Scholar] [CrossRef]
  34. Li, J.; Liu, J.; Sun, X.; Liu, Y. The mathematical prediction model for the oxidative stability of vegetable oils by the main fatty acids composition and thermogravimetric analysis. LWT 2018, 96, 51–57. [Google Scholar] [CrossRef]
  35. Kenda, E.S.; N’Tsoukpoe, K.E.; Ouédraogo, I.W.; Coulibaly, Y.; Py, X.; Ouédraogo, F.M.A.W. Jatropha curcas crude oil as heat transfer fluid or thermal energy storage material for concentrating solar power plants. Energy Sustain. Dev. 2017, 40, 59–67. [Google Scholar] [CrossRef]
  36. Gouveia De Souza, A.; Oliveira Santos, J.C.; Conceição, M.M.; Dantas Silva, M.C.; Prasad, S. A thermoanalytic and kinetic study of sunflower oil. Braz. J. Chem. Eng. 2004, 21, 265–273. [Google Scholar] [CrossRef]
  37. Trache, D.; Maggi, F.; Palmucci, I.; DeLuca, L.T. Thermal behavior and decomposition kinetics of composite solid propellants in the presence of amide burning rate suppressants. J. Therm. Anal. Calorim. 2018, 132, 1601–1615. [Google Scholar] [CrossRef]
  38. Li, H.; Niu, S.; Lu, C.; Wang, Y. Comprehensive Investigation of the Thermal Degradation Characteristics of Biodiesel and Its Feedstock Oil through TGA-FTIR. Energy Fuels 2015, 29, 5145–5153. [Google Scholar] [CrossRef]
  39. Galvan, D.; Orives, J.R.; Coppo, R.L.; Silva, E.T.; Angilelli, K.G.; Borsato, D. Determination of the kinetics and thermodynamics parameters of biodiesel oxidation reaction obtained from an optimized mixture of vegetable oil and animal fat. Energy Fuels 2013, 27, 6866–6871. [Google Scholar] [CrossRef]
  40. Mahfouz, R.M.; Bumajdad, A.; Al-Sagheer, F.A. γ-Irradiation effects on the kinetics and mechanism of the thermal decomposition of silver acetate. Radiat. Eff. Defects Solids 2009, 164, 170–177. [Google Scholar] [CrossRef]
  41. Turmanova, S.C.; Genieva, S.D.; Dimitrova, A.S.; Vlaev, L.T. Non-isothermal degradation kinetics of filled with rise husk ash polypropene composites. Express Polym. Lett. 2008, 2, 133–146. [Google Scholar] [CrossRef]
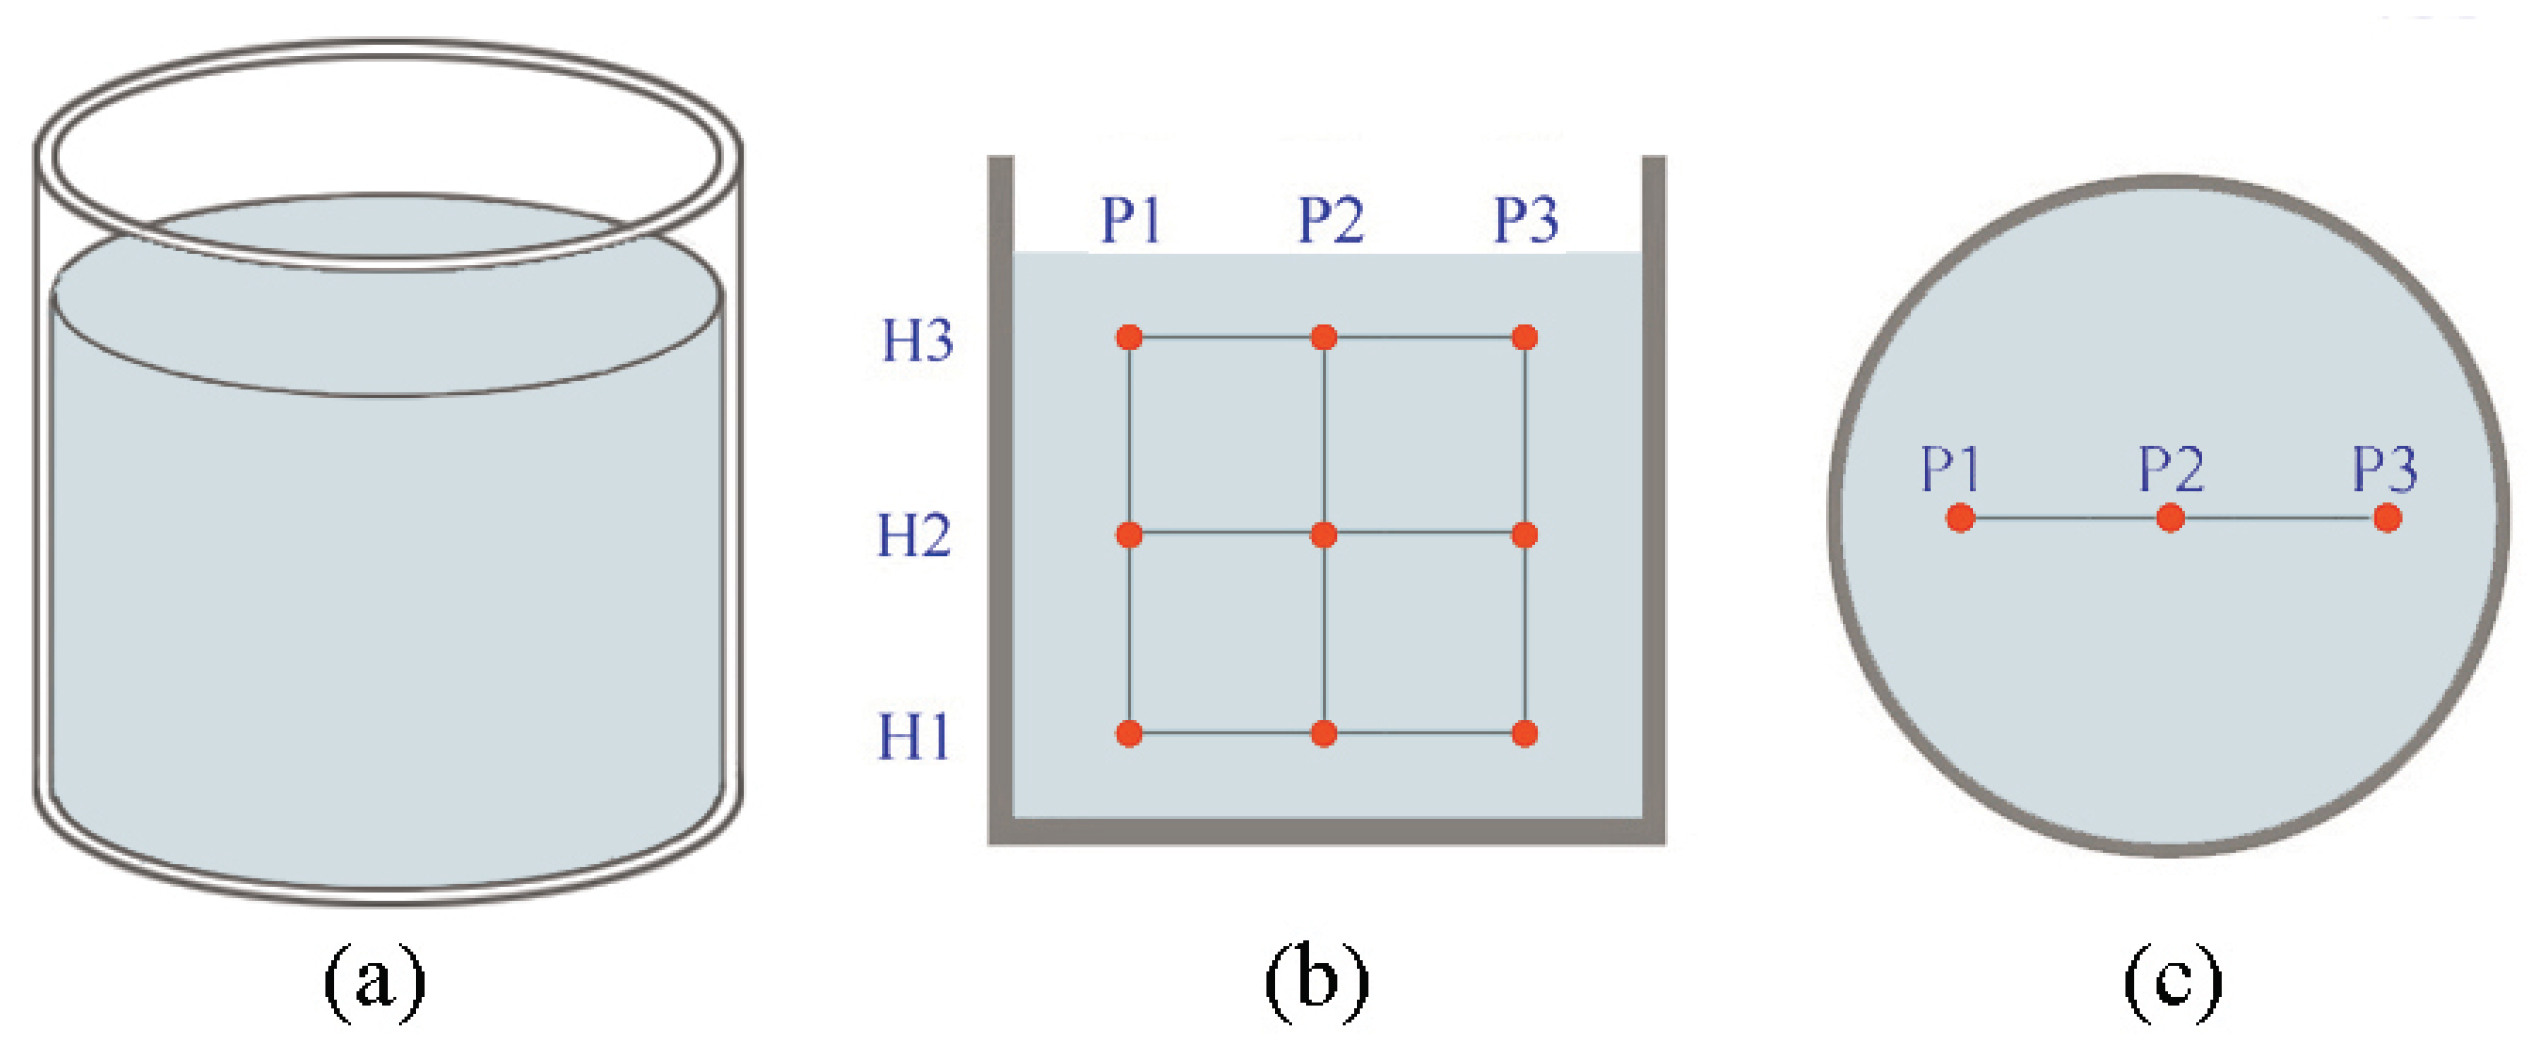
Figure 1. (a) Animal fat in the cylindrical sample holder, and thermocouples positioning within the sample in (b) a vertical section at x = r , and (c) a horizontal section at z = H2.
Energies 12 01111 g001
Figure 2. Thermal decomposition process of the animal fat sample at 5 K·min 1 : (a) differential thermogravimetric (DTG) curve, and (b) thermogravimetric (TG) curve.
Energies 12 01111 g002
Figure 3. Plots for determination of activation energy at different conversion rates by (a) Starink method, and (b) Miura-Maki method.
Energies 12 01111 g003
Figure 4. Master plots of theoretical g ( α ) / g ( 0.5 ) and experimental p ( u ) / p ( 0.5 ) against α for the thermal decomposition of the animal fat.
Energies 12 01111 g004
Figure 5. Lifetime as a function of temperature for the animal fat.
Energies 12 01111 g005
Figure 6. Animal fat differential scanning calorimetry (DSC) results.
Energies 12 01111 g006
Figure 7. Animal fat average thermal profiles at the three considered heights.
Energies 12 01111 g007
Figure 8. Animal fat average thermal profiles with the specific maxima and inflection points.
Energies 12 01111 g008
Table 1. Most frequent mechanism functions and their integral forms using in thermogravimetric analysis (TGA) kinetic with the sum of the standard deviations between the theoretical master and the experimental data.
MechanismSerial Number (k)Symbol f ( α )g( α ) 1 Σ δ
Order of reaction
First-order1 F 1 1 α ln ( 1 α )0.462
Second-order2 F 2 ( 1 α ) 2 ( 1 α ) 1 −12.388
Third-order3 F 3 ( 1 α ) 3 ( 1 α ) 2 1 /29.844
Diffusion
One-way transport4 D 1 0.5 α α 2 0.554
Two-way transport5 D 2 ln ( 1 α ) 1 ( 1 α ) ln ( 1 α ) + α 0.990
Three-way transport6 D 3 1.5 ( 1 α ) 2 / 3 1 ( 1 α ) 1 / 3 1 1 ( 1 α ) 1 / 3 2 1.850
Ginstling-Brounshtein equation7 D 4 1.5 ( 1 α ) 1 / 3 1 1 ( 1 2 α / 3 ) ( 1 α ) 2 / 3 1.234
Limiting surface reaction between both phases
One dimension8 R 1 1 α 0.183
Two dimensions9 R 2 2 ( 1 α ) 1 / 2 1 ( 1 α ) 1 / 2 0.123
Three dimensions10 R 3 3 ( 1 α ) 2 / 3 1 ( 1 α ) 1 / 3 0.202
Random nucleation and nuclei growth
Two-dimensional11 A 2 2 ( 1 α ) ln ( 1 α ) 1 / 2 ln ( 1 α ) 1 / 2 0.249
Three-dimensional12 A 3 3 ( 1 α ) ln ( 1 α ) 2 / 3 ln ( 1 α ) 1 / 3 0.406
Exponential nucleation
Power law, n = 1/213 P 2 2 α 1 / 2 α 1 / 2 0.433
Power law, n = 1/314 P 3 3 α 2 / 3 α 1 / 3 0.521
Power law, n = 1/415 P 4 4 α 3 / 4 α 1 / 4 0.568
1 g ( α ) is the integral form of f ( α ).
Table 2. Imposed hygrothermal cycle.
StepTemperature Setpoint (K)Relative Humidity Set Point (%)Duration (h)
S1268.15405.5
S2268.15 → 333.154016
S3333.15406
S4333.15 → 268.154016
S5268.15405.5
Table 3. Activation energies of animal fat at different degrees of conversion by using Starink and Miura-Maki methods.
Degree of Conversion ( α ) Starink MethodMiura-Maki Method
E (kJ·mol 1 )R 2 E (kJ·mol 1 )R 2
0.2047.700.996247.370.9962
0.2551.720.993851.330.9937
0.3056.560.992656.170.9925
0.3561.580.989961.180.9898
0.4066.030.986765.640.9865
0.4570.230.981569.840.9813
0.5073.950.976873.550.9765
0.5577.200.973076.810.9727
0.6080.490.970380.090.9700
0.6583.920.969383.530.9690
0.7087.620.969187.220.9688
0.7592.080.969991.680.9696
0.8097.660.970297.260.9700
Average75.16 72.46
Table 4. Pre-exponential factor calculated for different heating rates.
Heating Rate (K·min 1 )A (s 1 )R 2
55.85 × 10 7 0.9991
76.27 × 10 7 0.9968
106.66 × 10 7 0.9949
157.05 × 10 7 0.9951
Average6.46 × 10 7
Table 5. Thermophysical characterisation of the studied bio-based phase change materials (PCM).
Melting Temperature (K)Melting Enthalpy (kJ·kg 1 )
275.035.67
298.3023.27
Table 6. Maxima and inflection points of the three average temperature trends at H1 = 1 cm, H2 = 3.5 cm and H3 = 6 cm.
PositionH1H2H3
Quantity t T t T t T
Unit(hh:mm:ss)(K)(hh:mm:ss)(K)(hh:mm:ss)(K)
F106:54:20283.807:25:20286.205:45:20282.2
F209:31:10293.109:54:10295.609:26:50296.2
F312:41:50307.512:40:00308.612:15:30308.5
F414:03:30313.813:45:10313.514:12:40317.7
F515:22:10321.215:15:10321.415:37:50324.2
F632:23:20299.732:25:00299.832:58:20297.3
F736:10:00287.835:56:40288.335:58:20287.6
F837:30:00281.737:35:00281.137:10:00280.8
F939:25:00275.739:13:20275.838:18:20276.8
Max22:34:40333.622:30:50333.622:28:05333.5