Integrated Renewable Energy System Based on IREOM Model and Spatial–Temporal Series for Isolated Rural Areas in the Region of Valparaiso, Chile


Abstract
:1. Introduction
2. Methodology
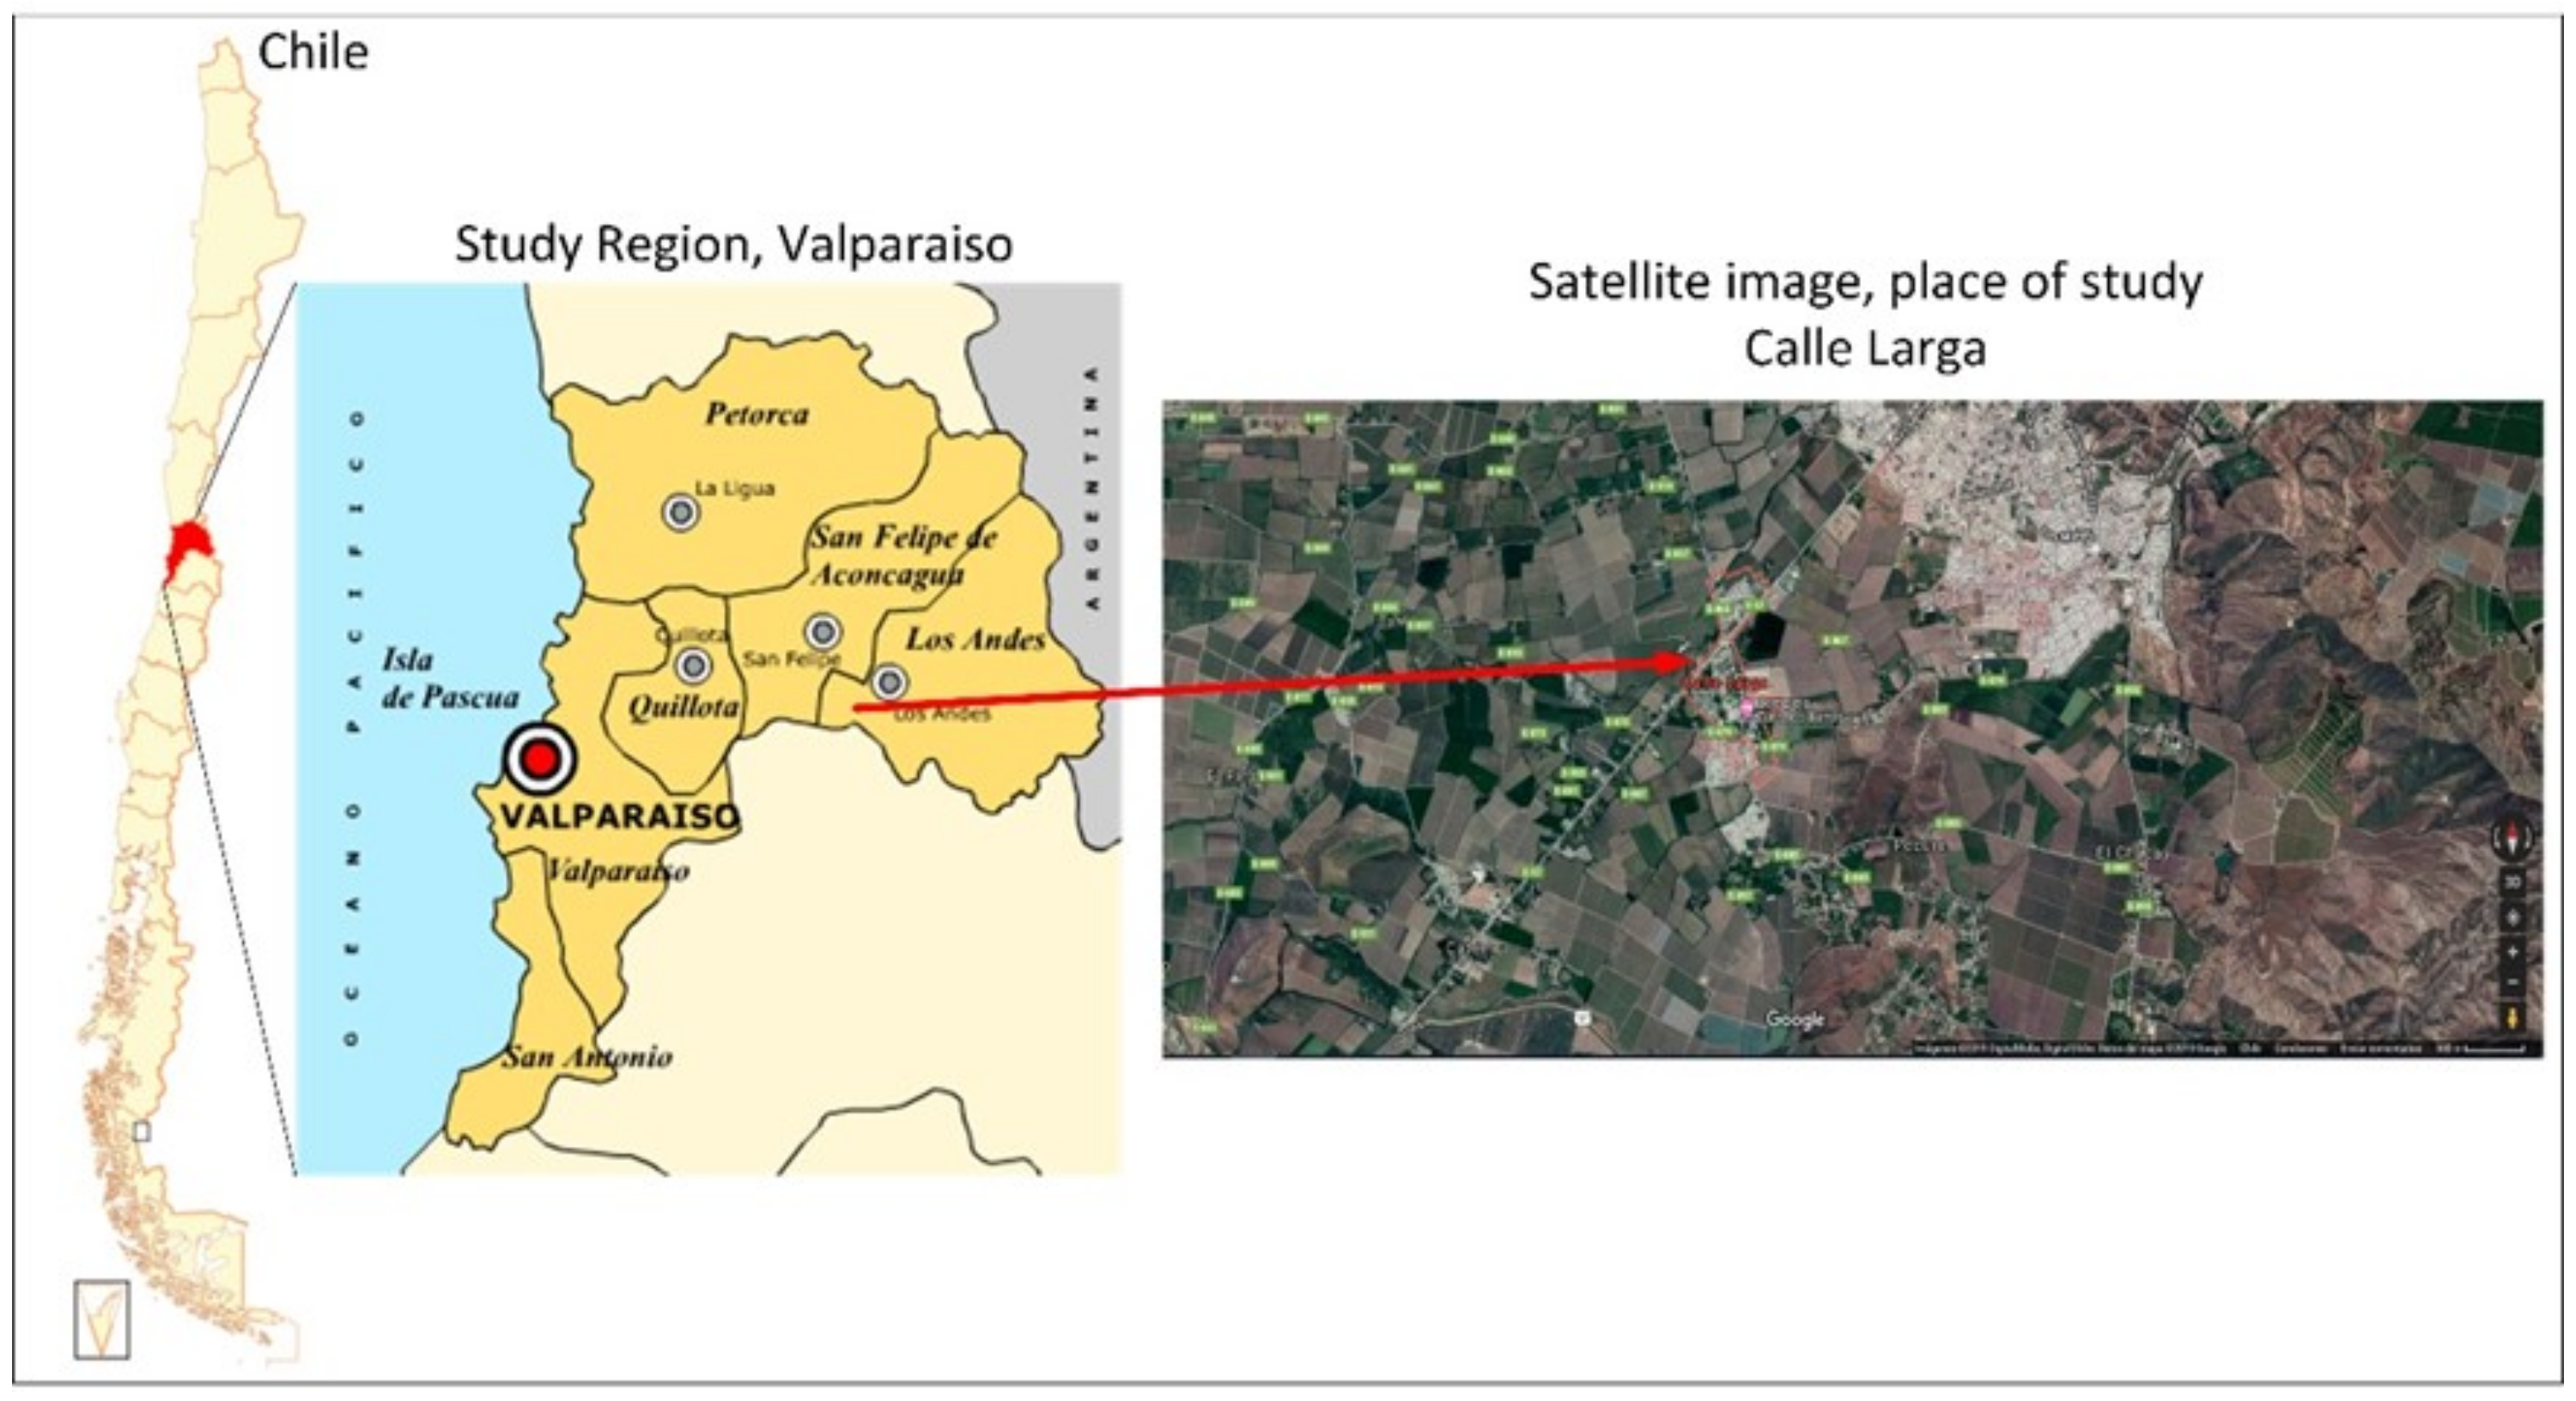
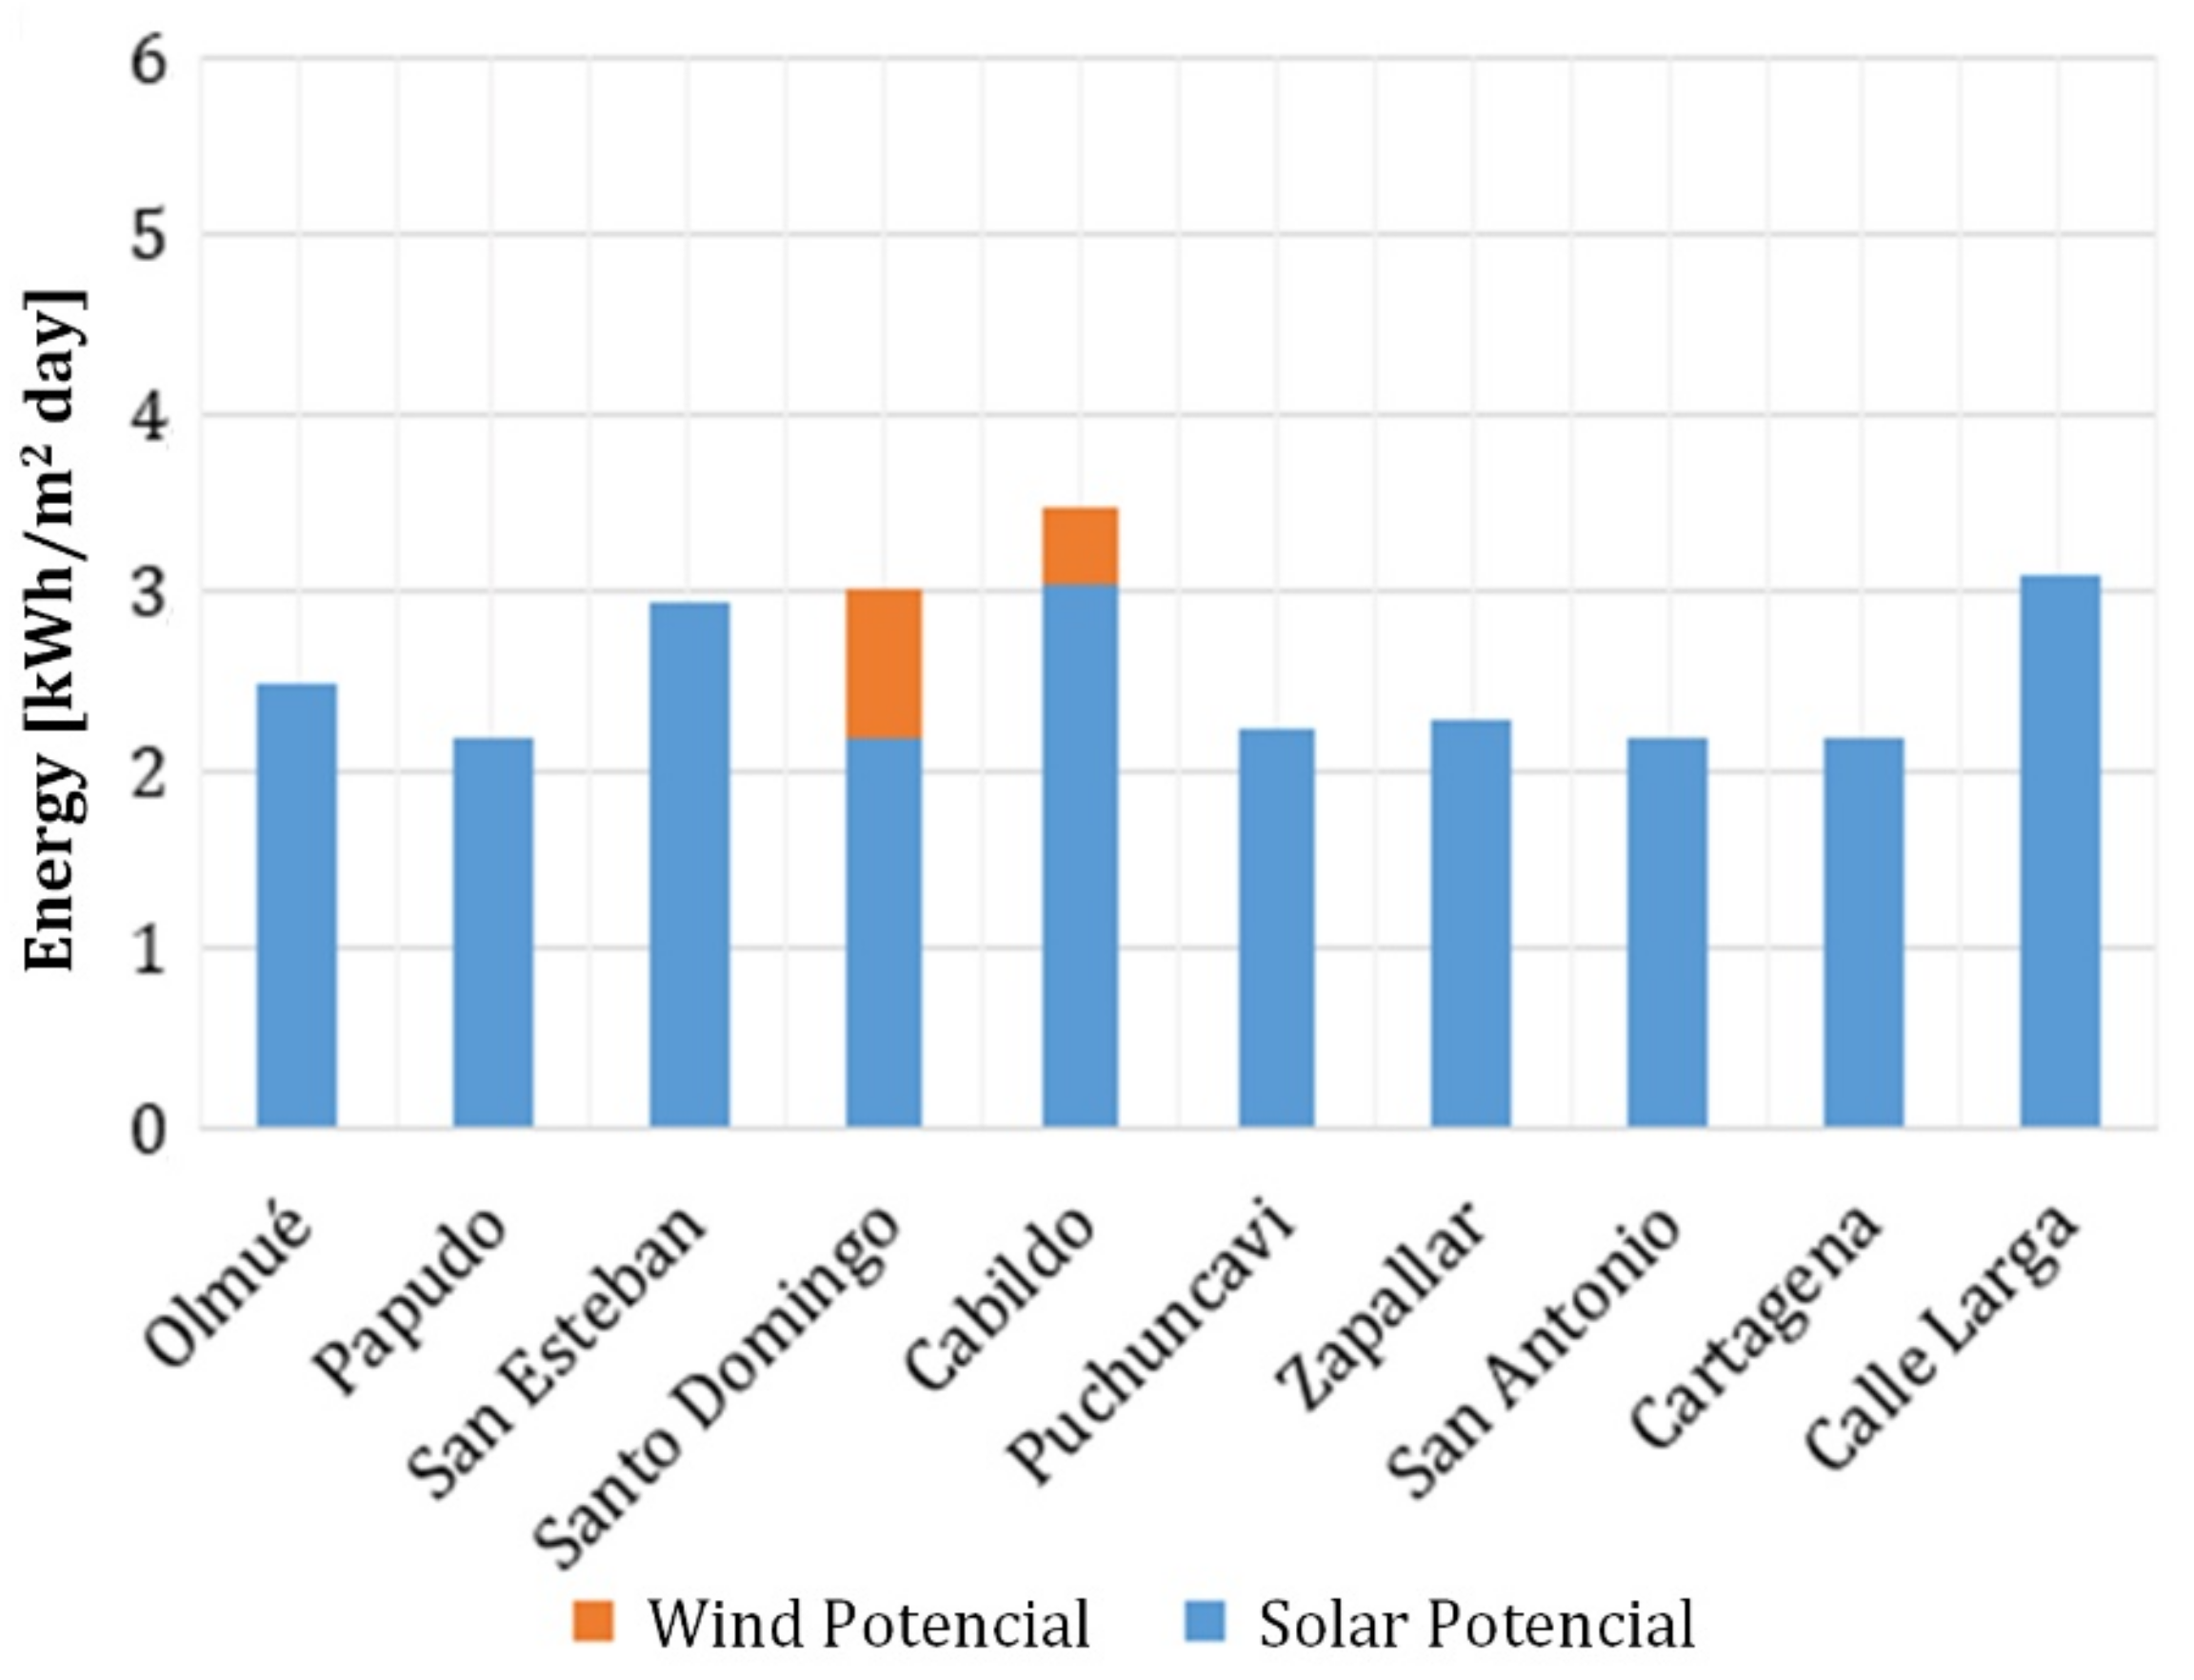
2.1. Study Area
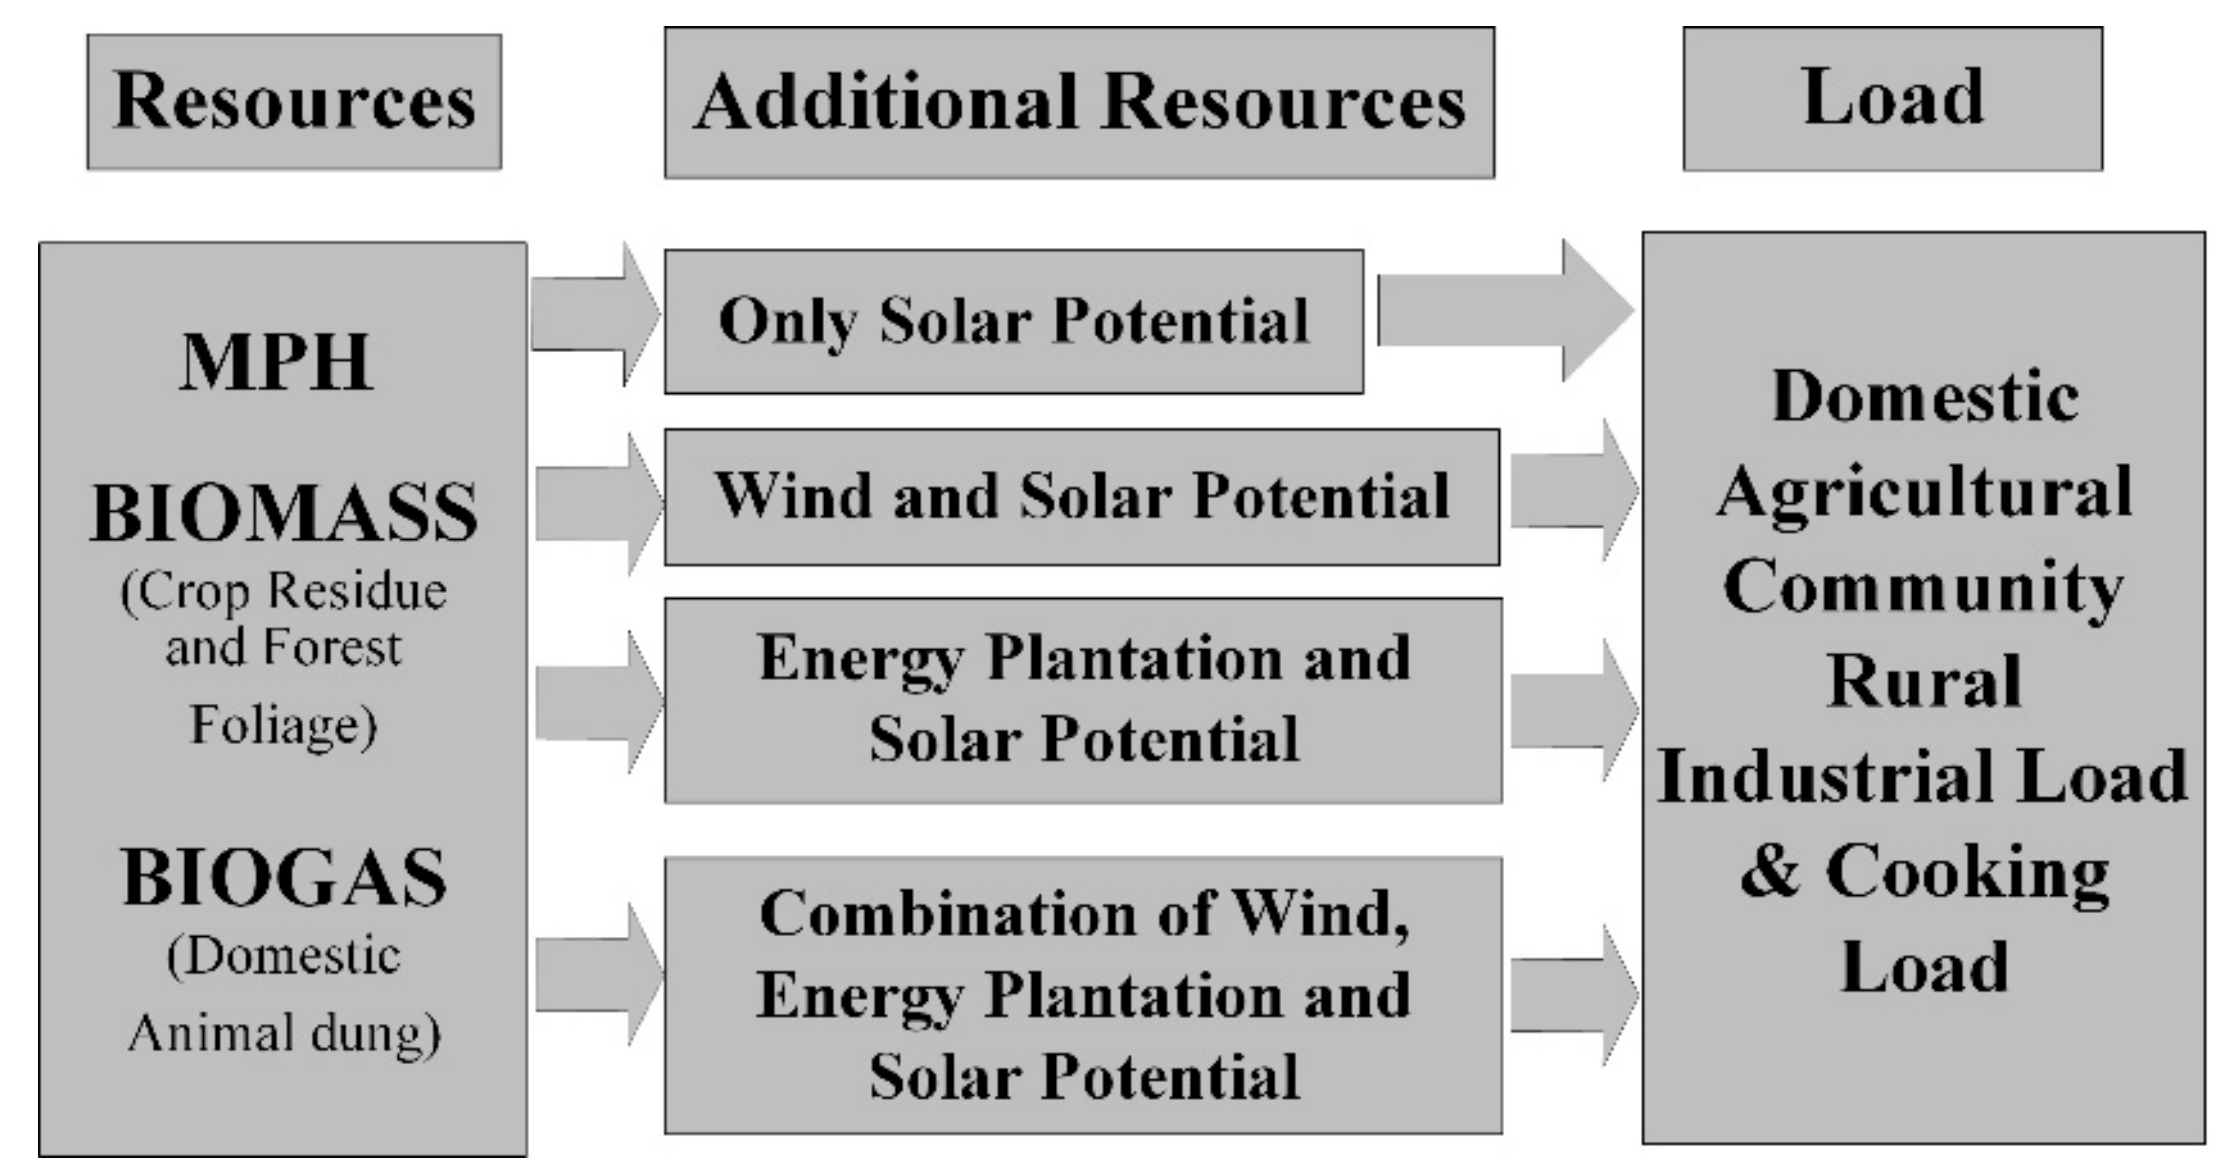
2.2. Resources and Load/Demand Assessment
- 1st Method—Wind + Solar (Photovoltaic and thermal) + Biomass (biogas), Sector Cabildo;
- 2nd Method—Wind + Solar (Photovoltaic and thermal), Sector Santo Domingo;
- 3rd Method—Solar (Photovoltaic and thermal), Sector Calle Larga and Cabildo.
2.3. Average Energy Consumption of an Isolate Home in a Rural Area and Disconnected from the Grid
2.3.1. Electrical Energy Consumption
- Basic rural housing with four inhabitants: Basic electrical appliances;
- Equipped rural housing with four inhabitants: Common electrical appliances.
2.3.2. Energy Consumption for Cooking
2.3.3. SHW Consumption and the Energy Needed
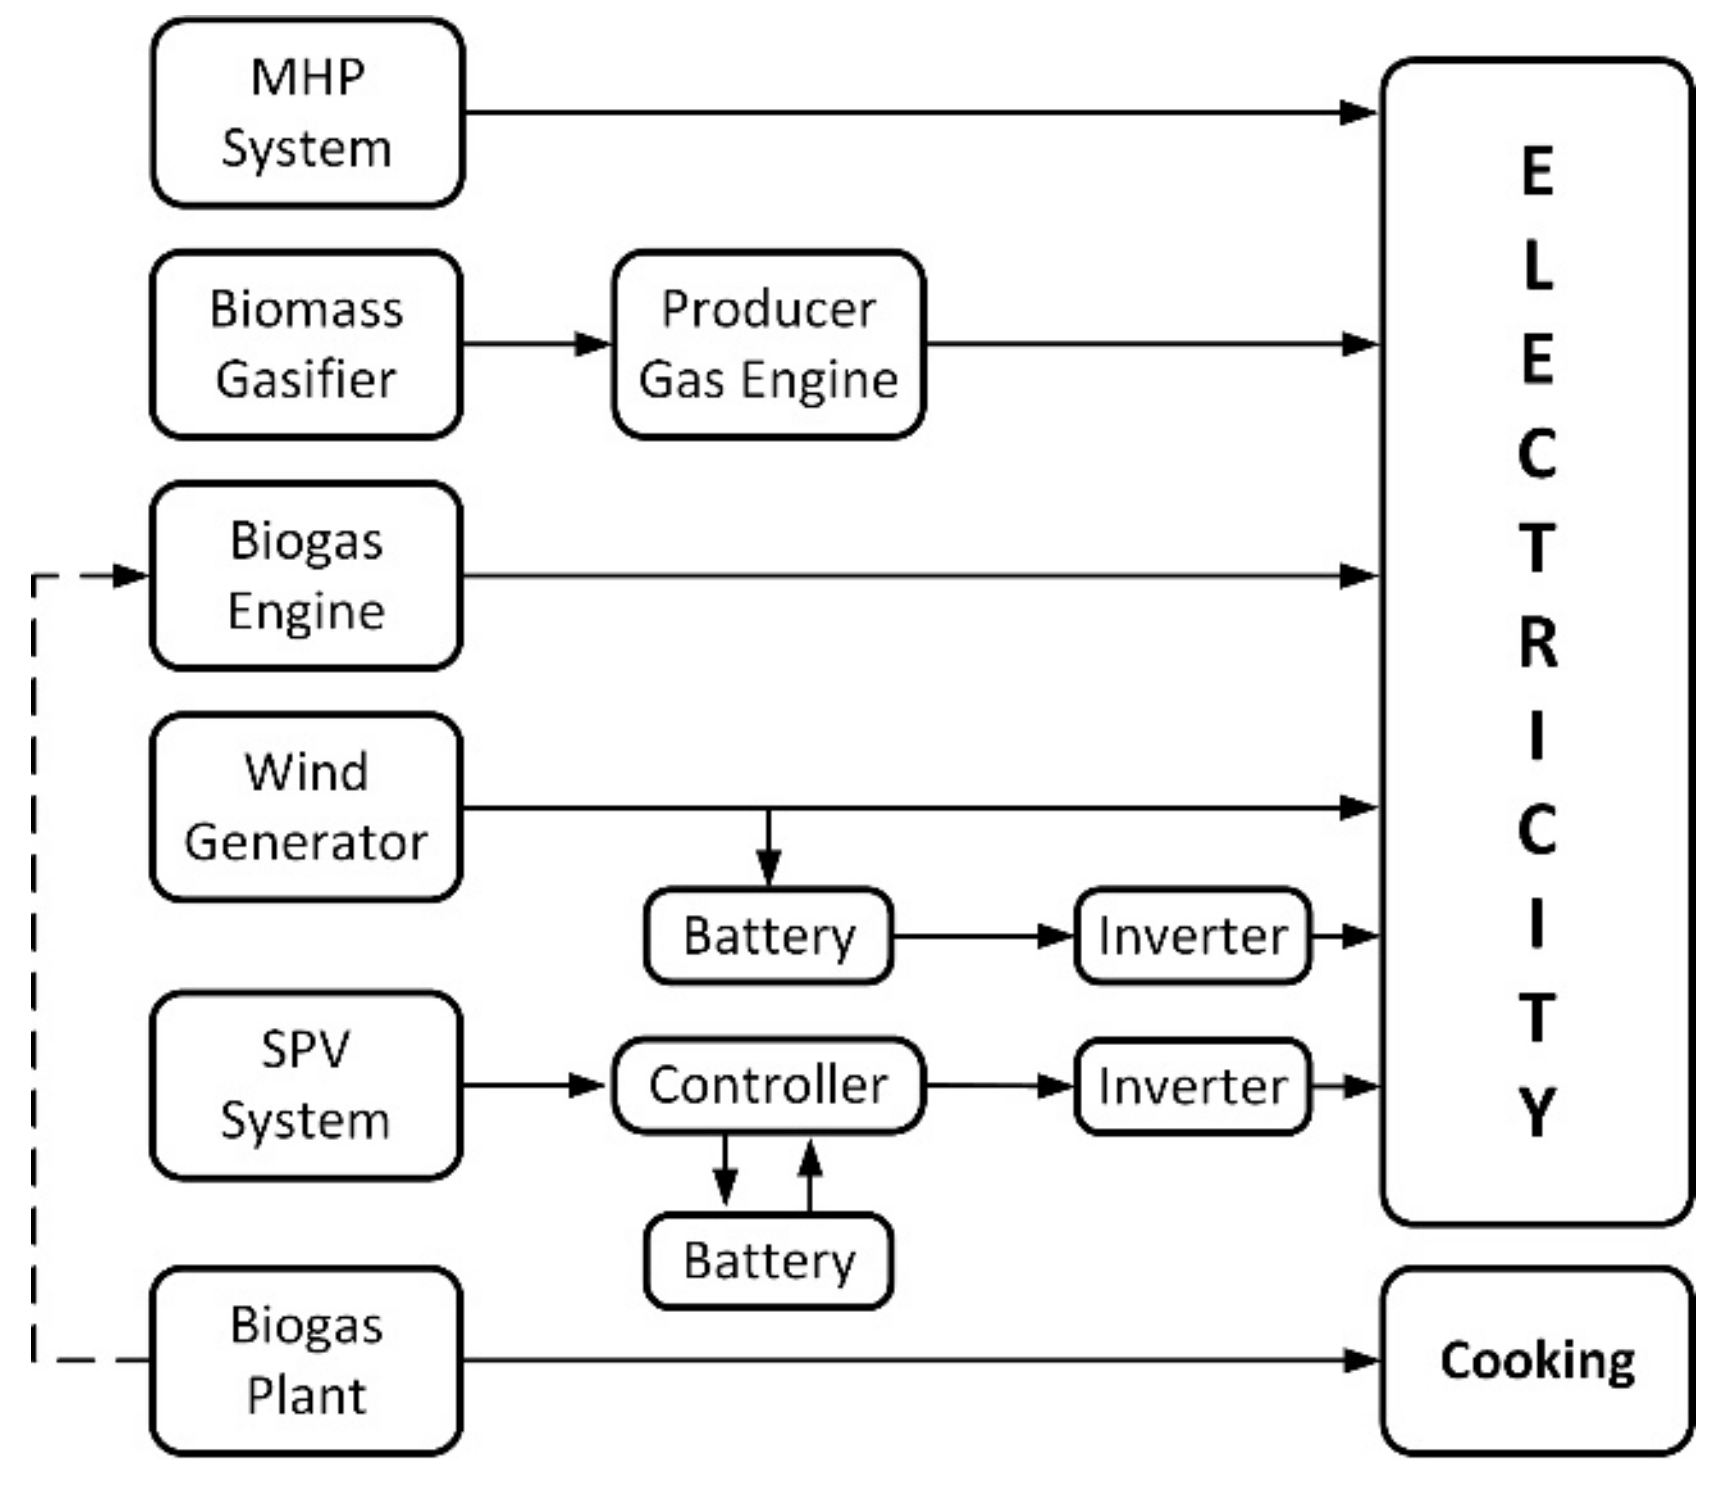
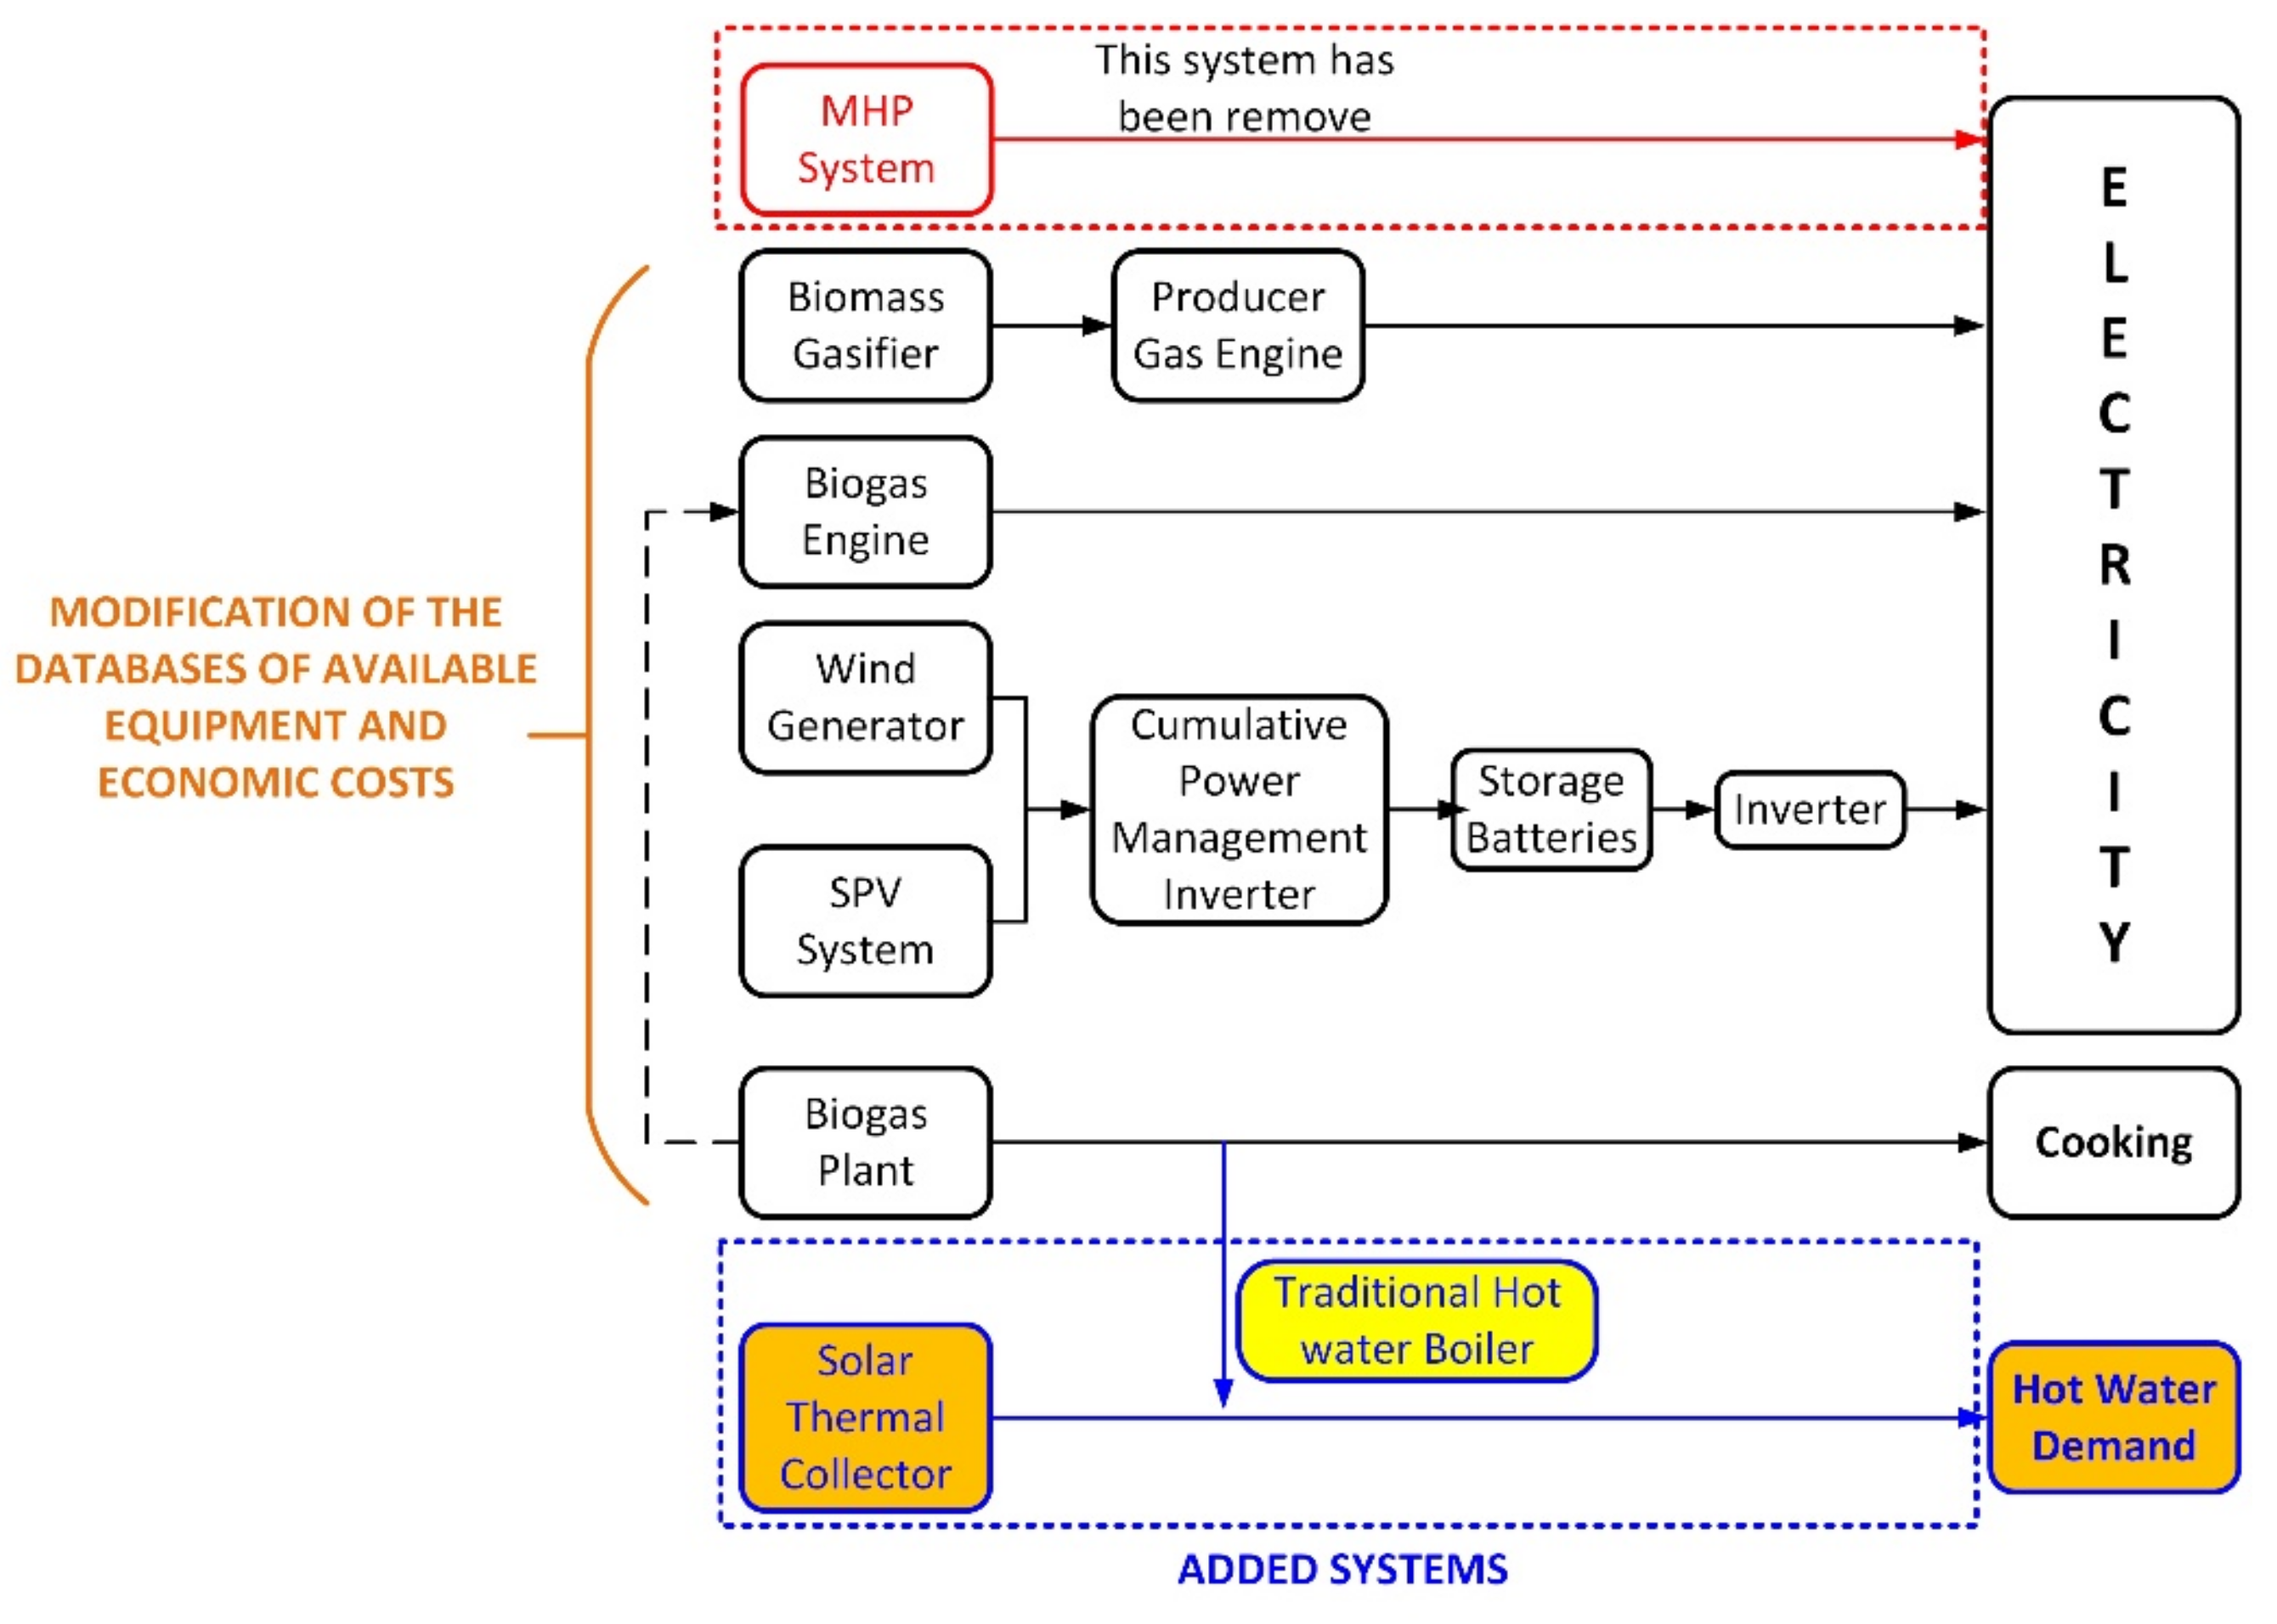
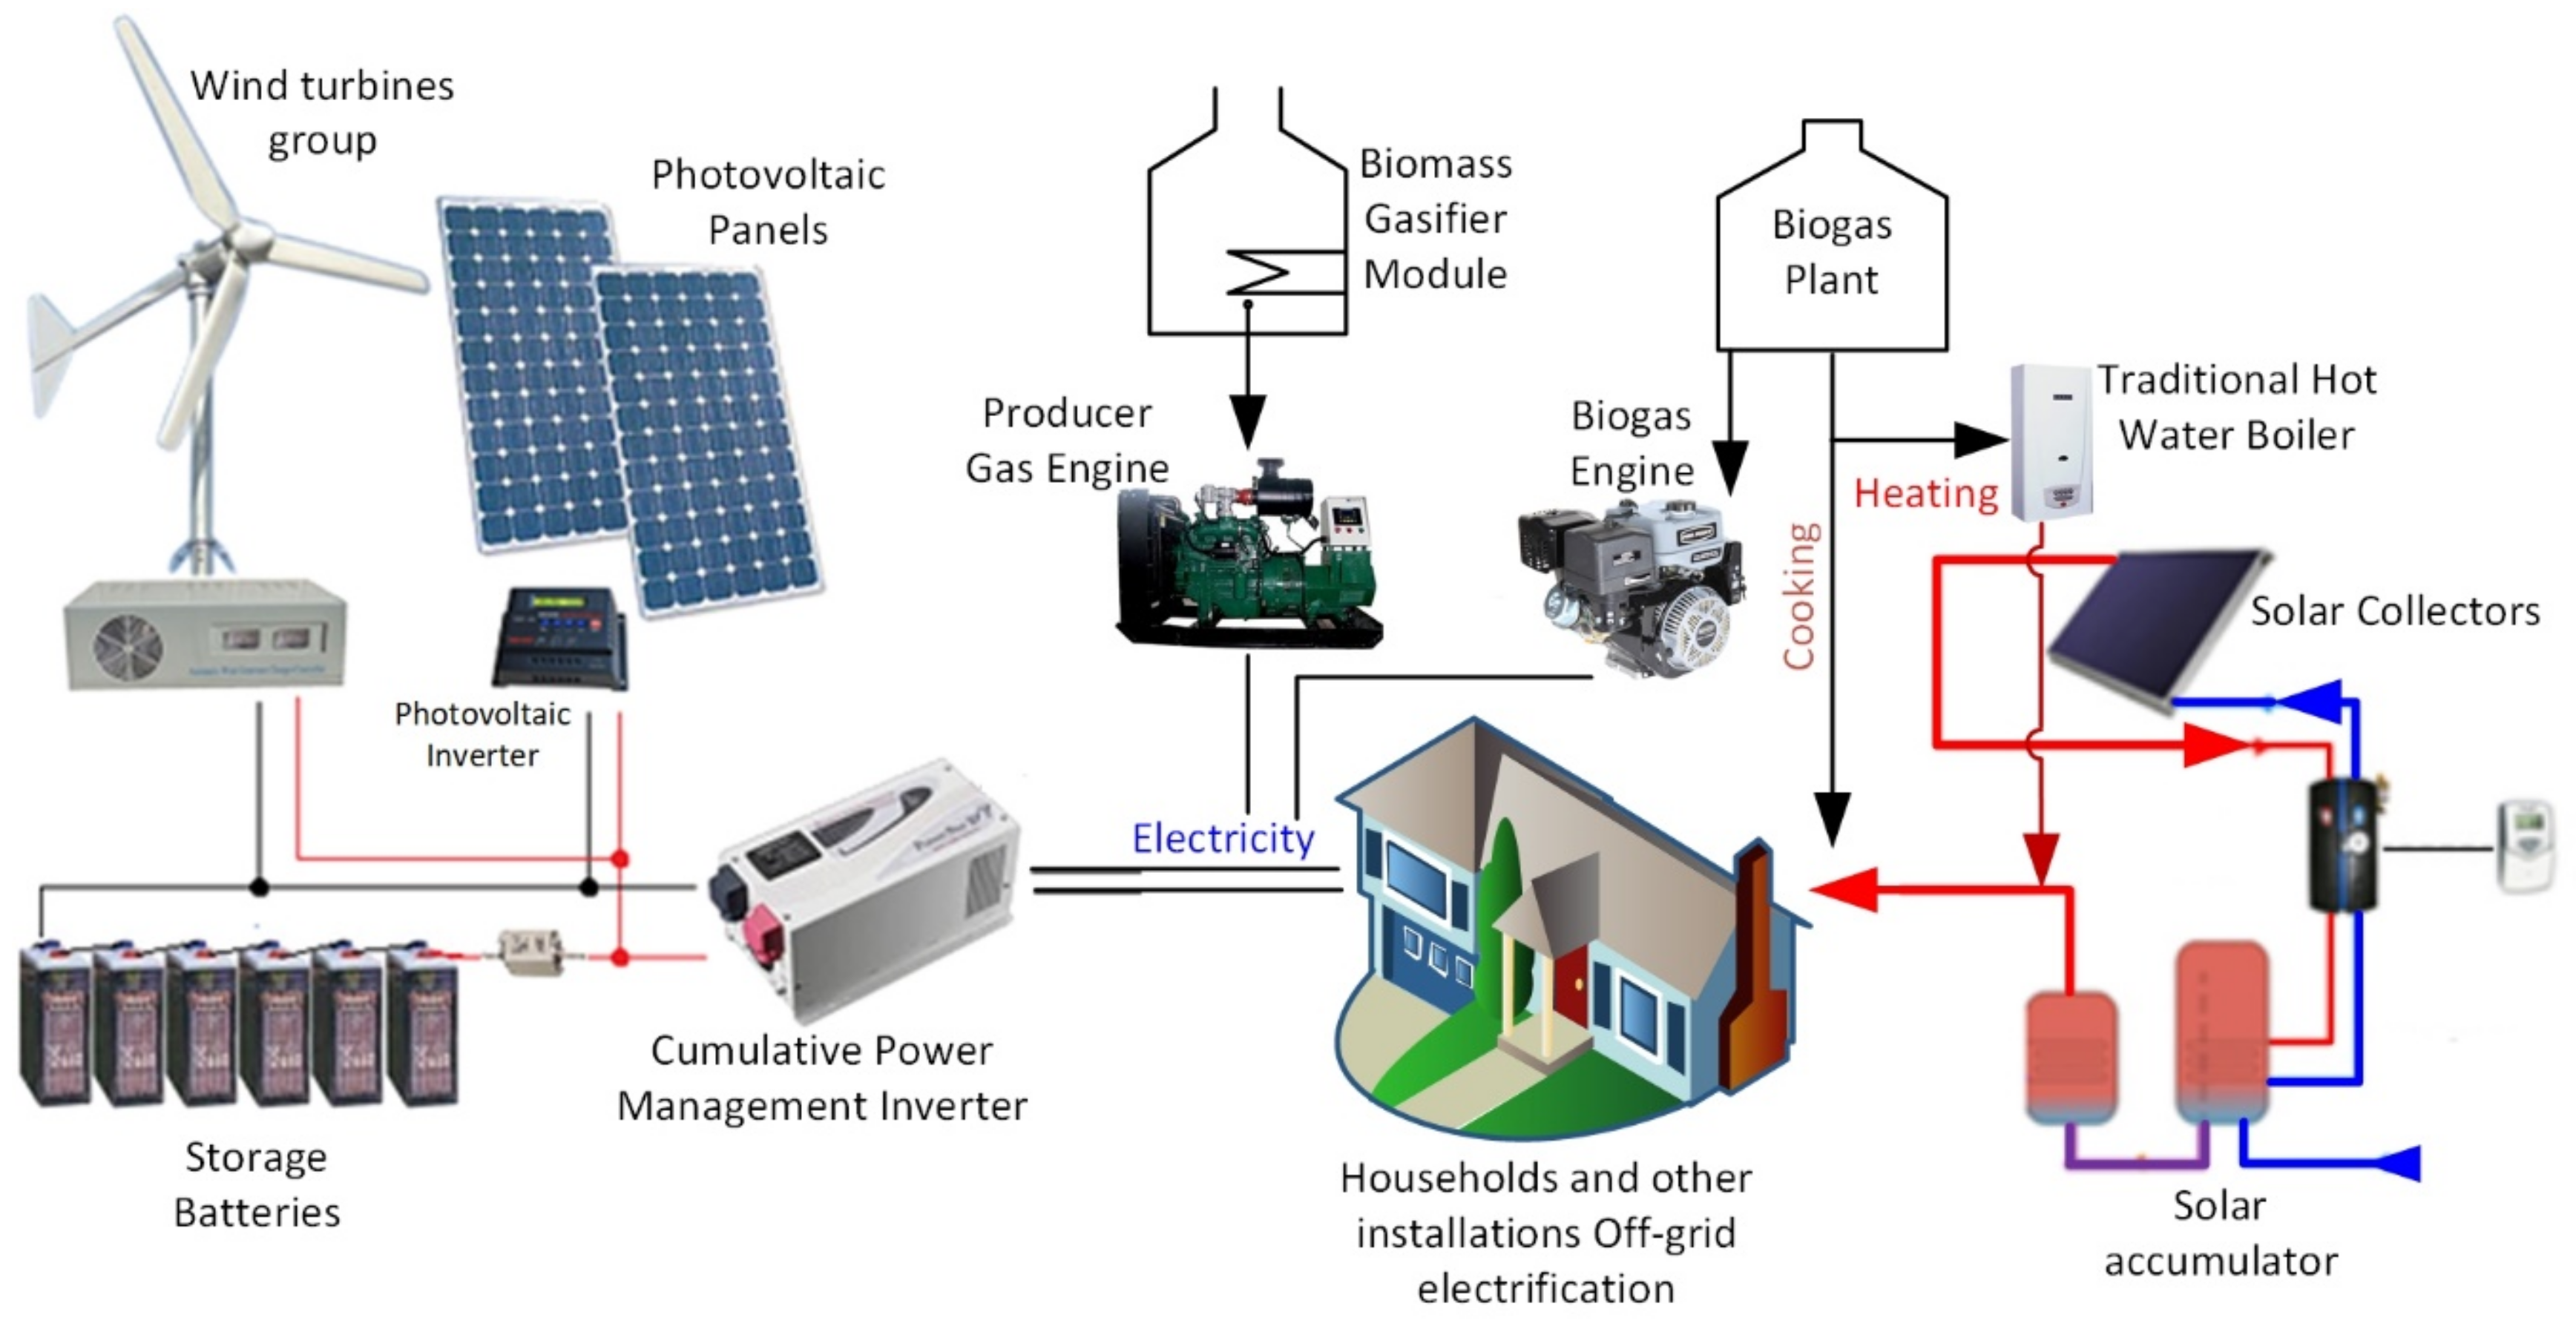
3. Model Configuration
Mathematical Model for Solar Thermal Collectors (STC)
- Mean monthly temperature of water network, for month i, for the district, in °C.
- Mean monthly outside temperature, for month i, for the district, in °C.
- = 45 °C, minimum working temperature [41].
- If < 0, then = 0
- If > 1, then = 1
- If > 0 and < 1, then
4. Results and Discussion
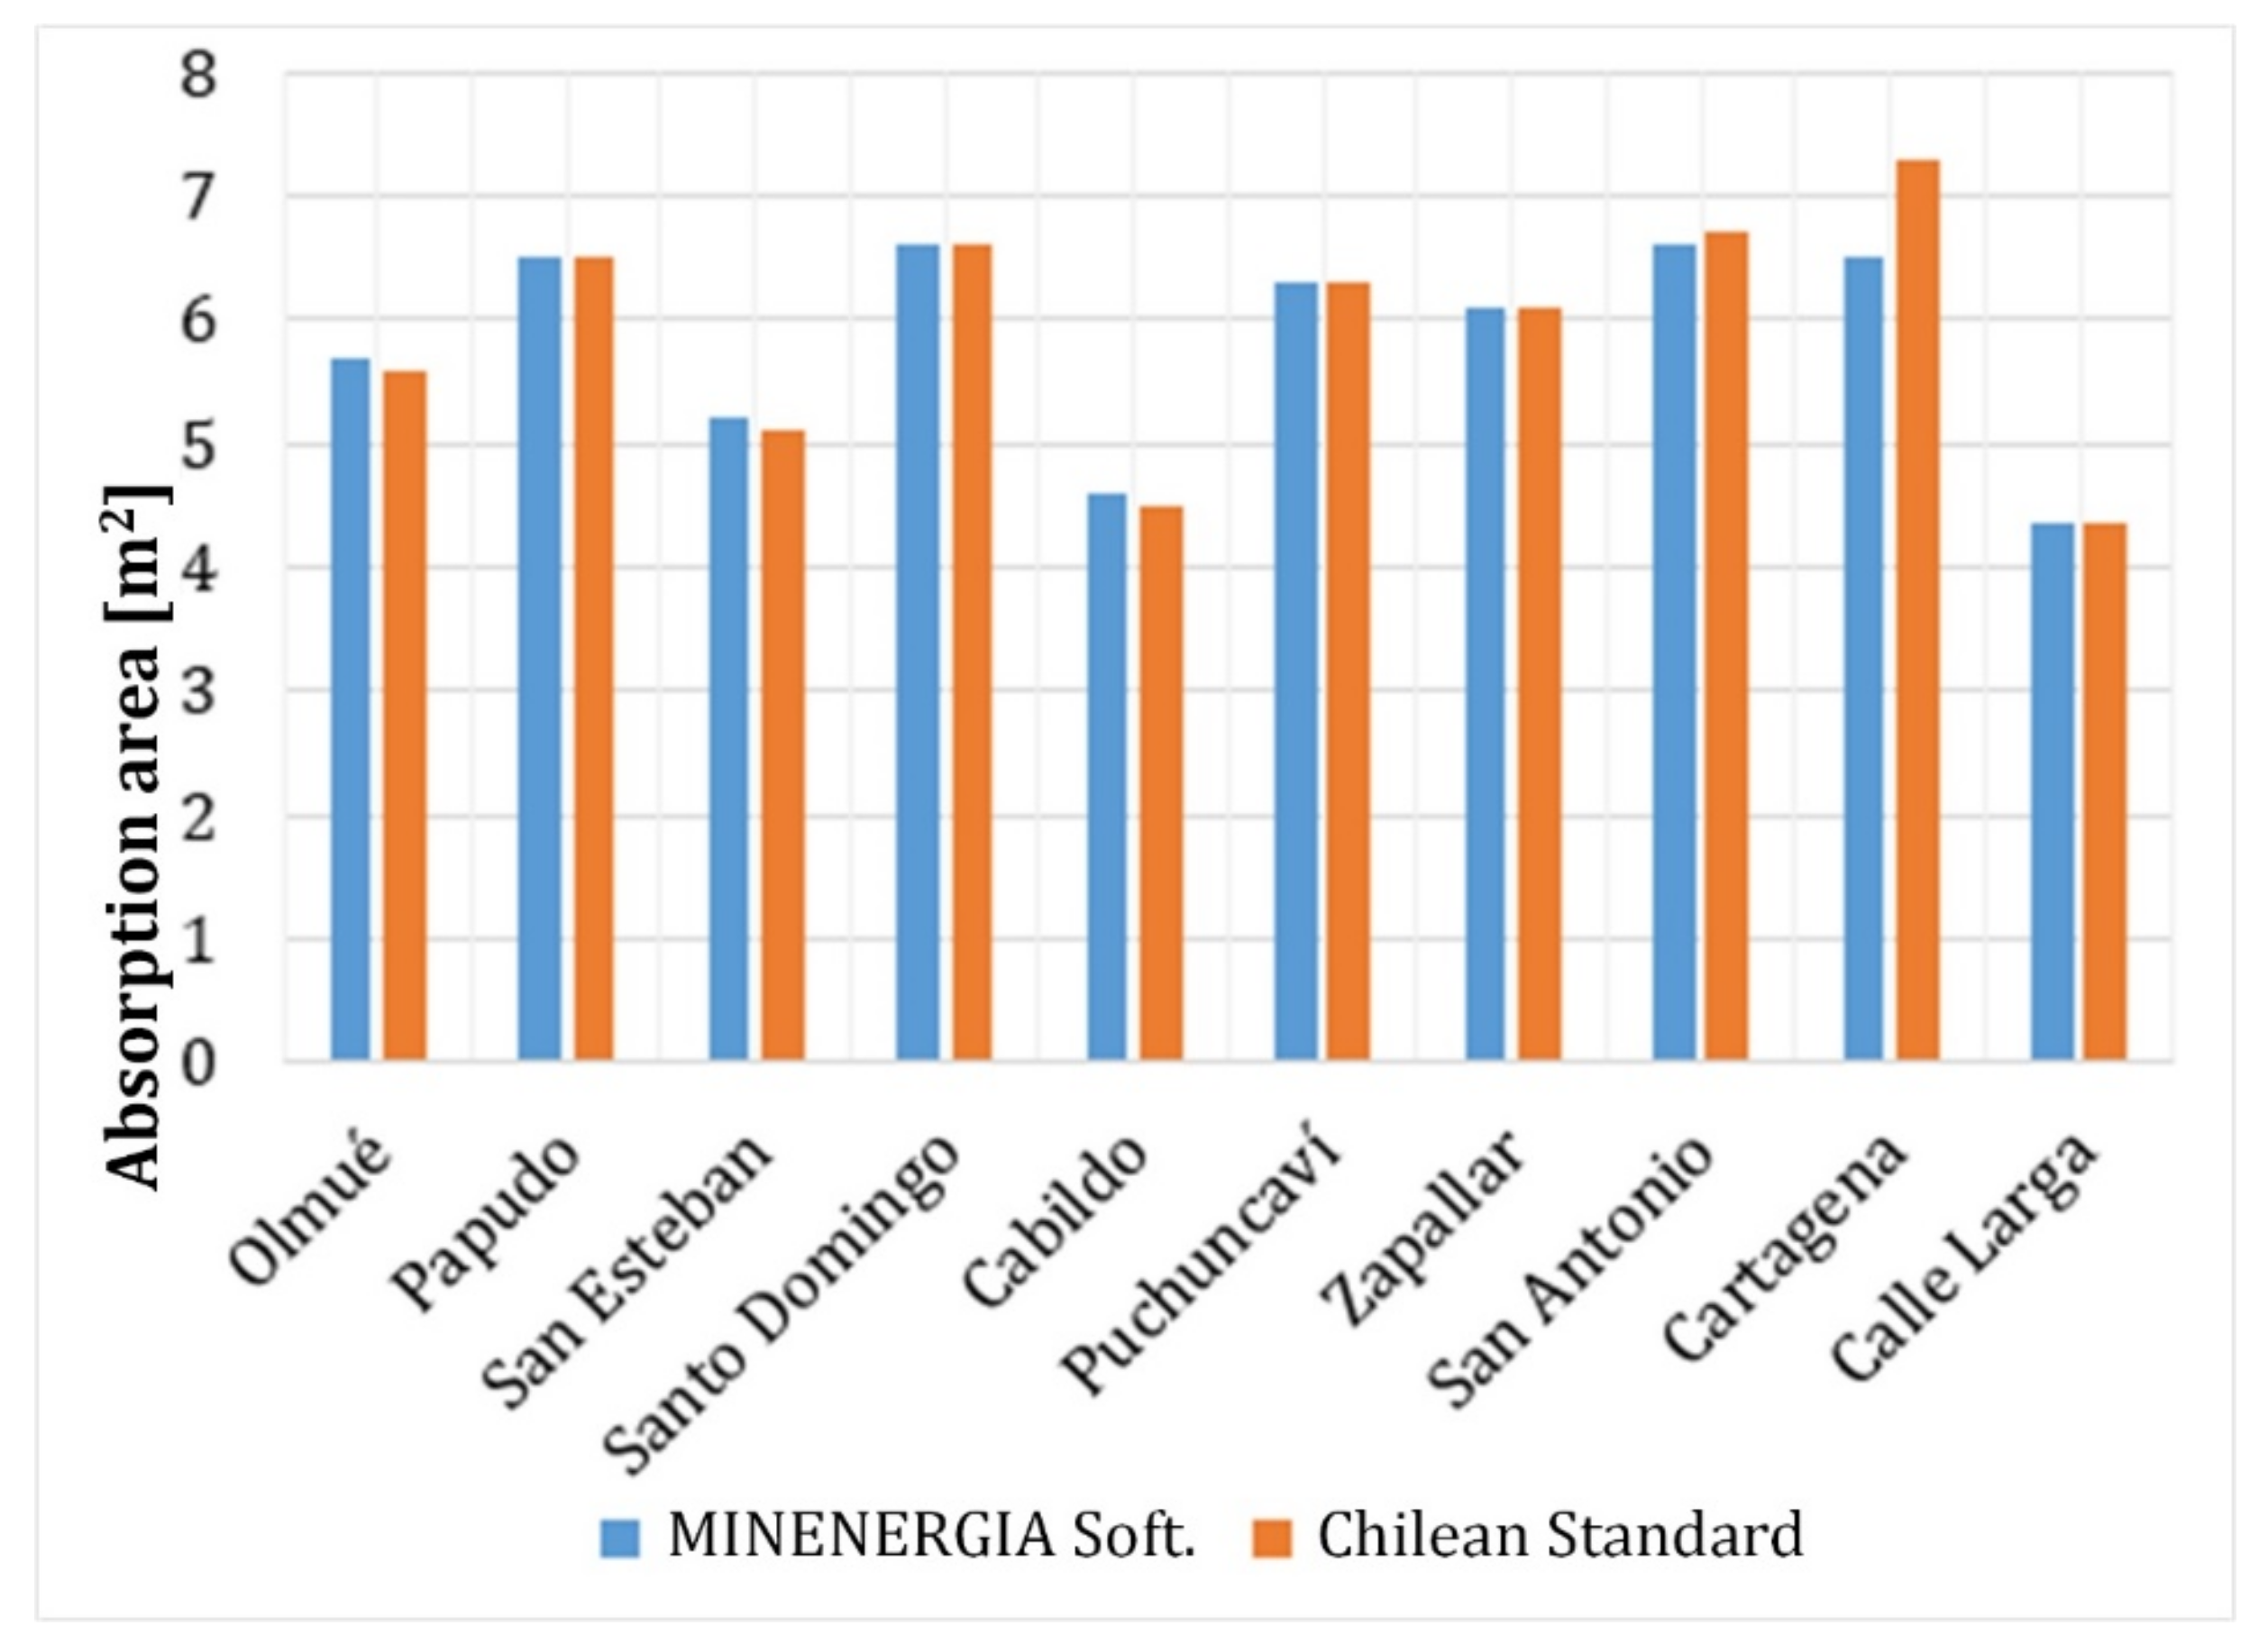
4.1. Solar Thermal Collectors (STC)
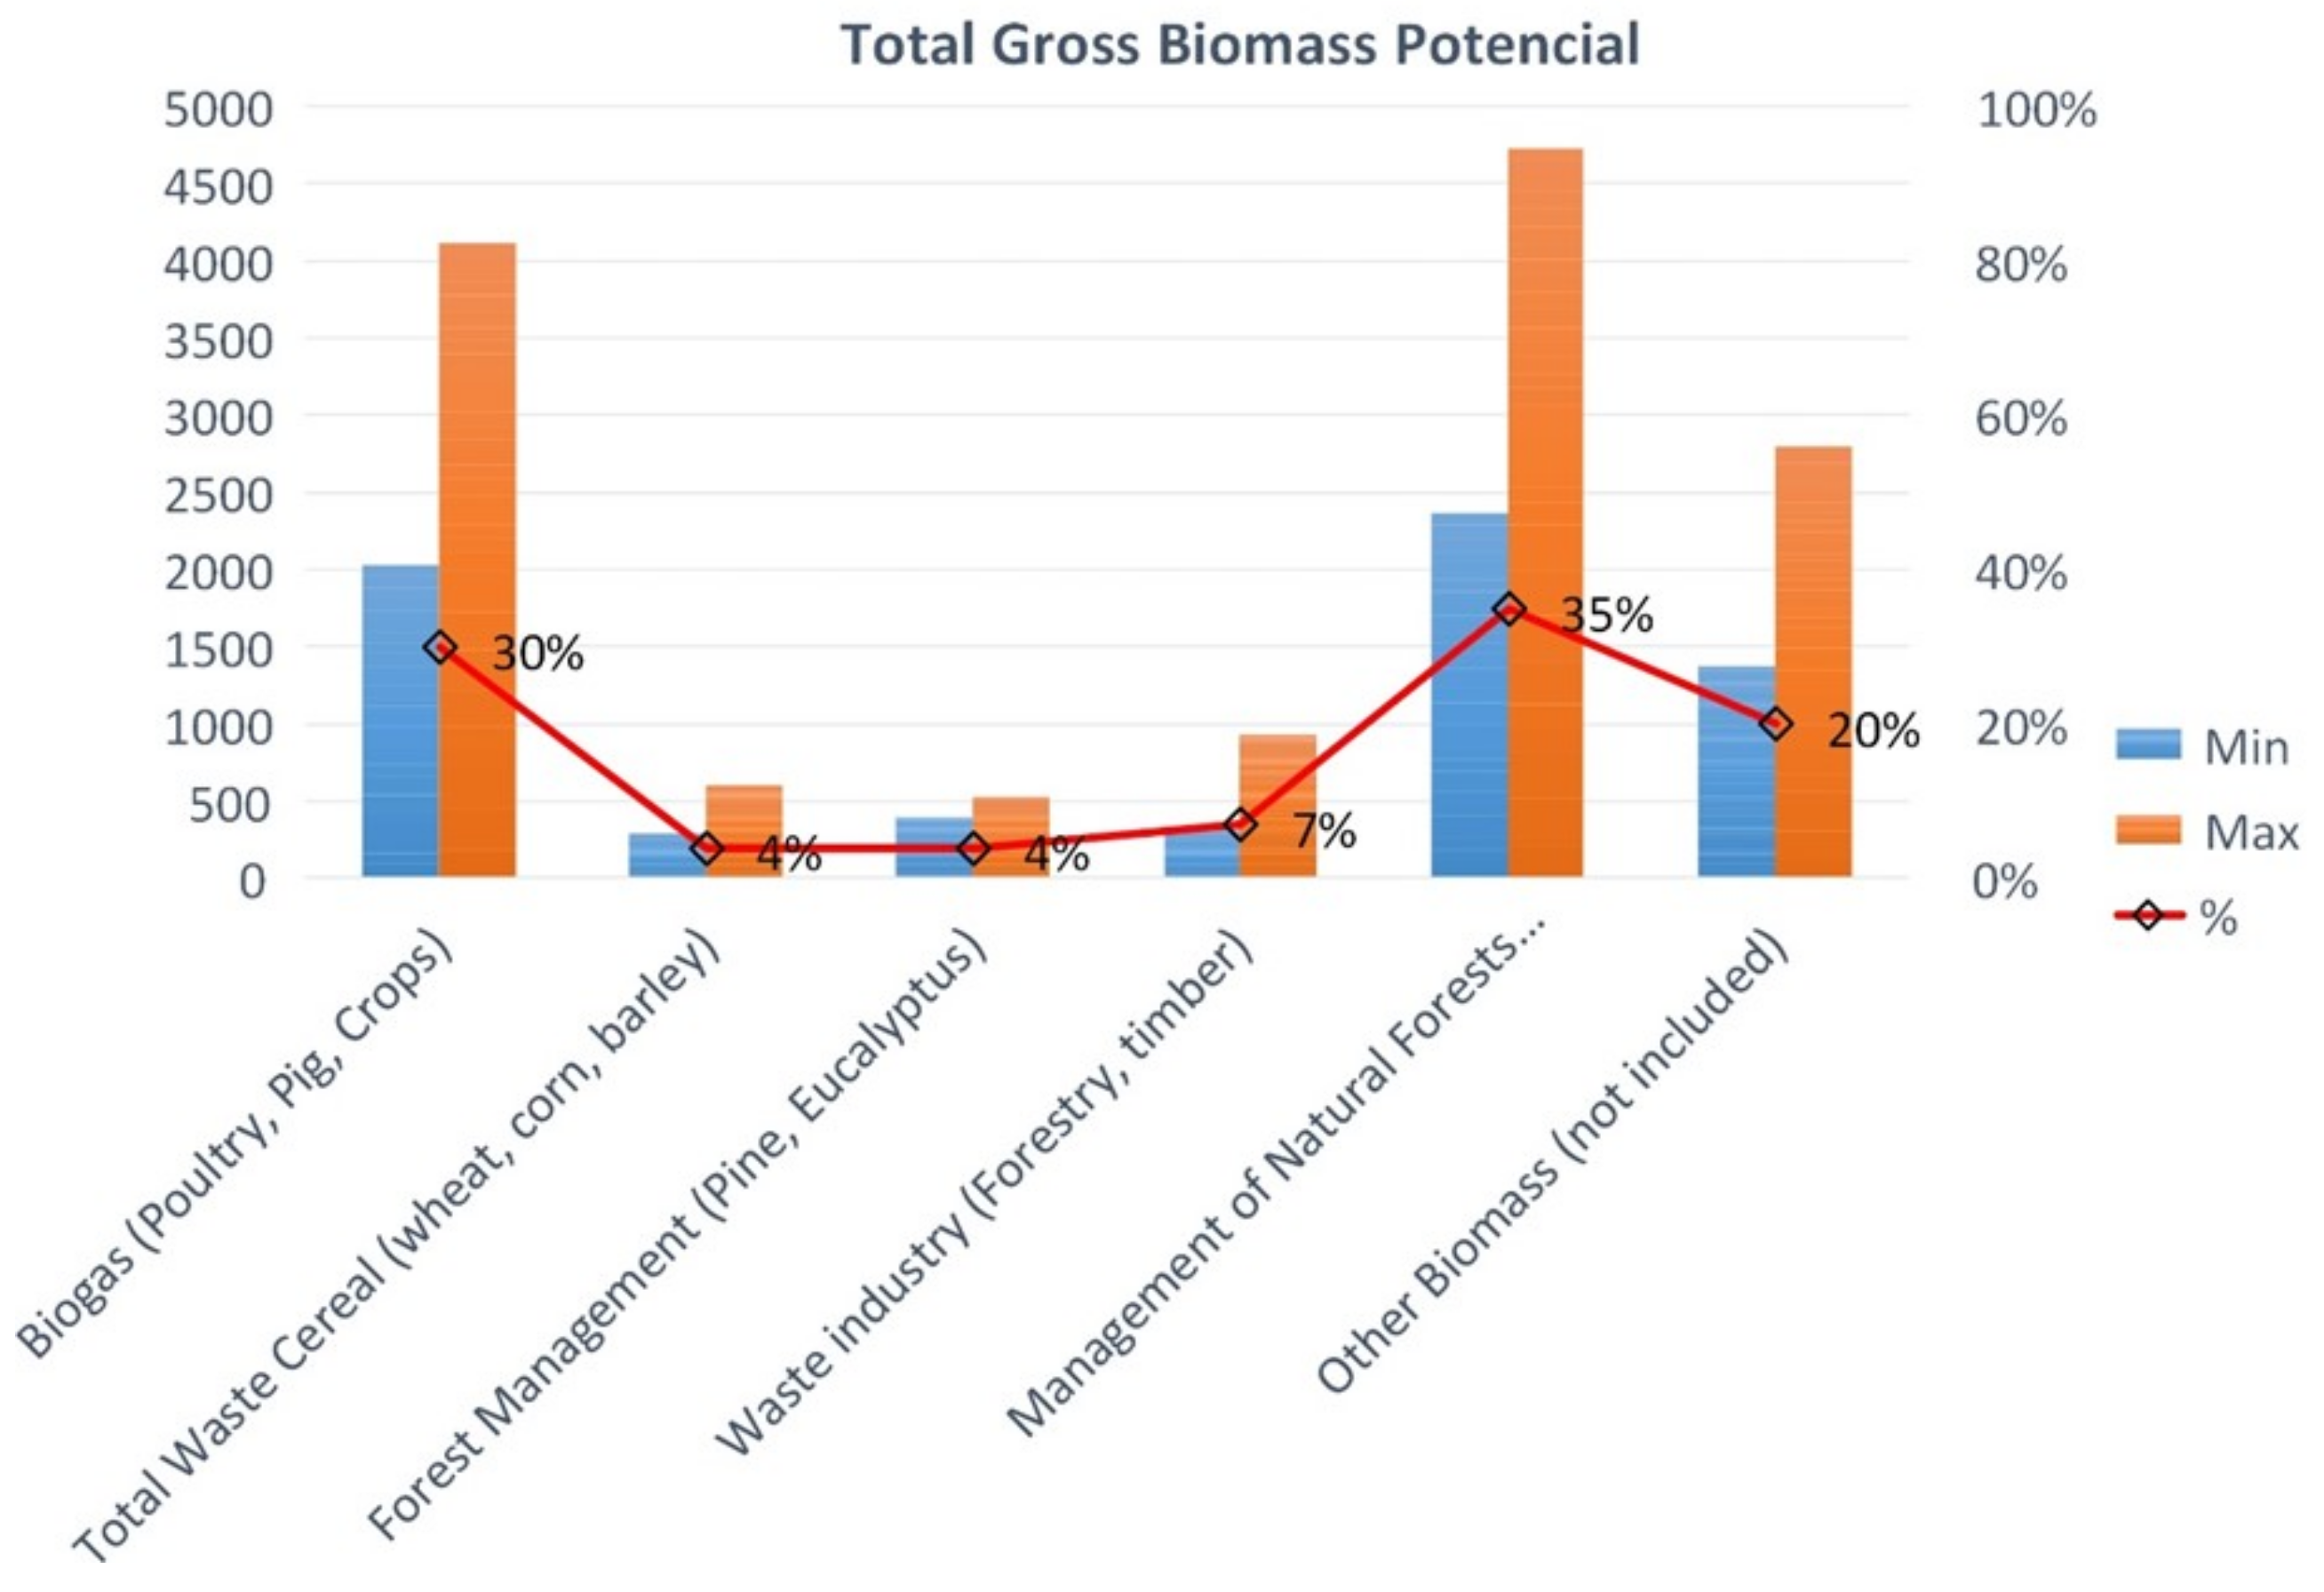
4.2. Tube Biodigester for Biogas Production
4.3. Installation of Solar Photovoltaic (PV) for Electricity Consumption
4.4. Installation of Wind Energy
4.5. Biomass Gasifier Power
4.6. Approximate Cost Generation Equipment, Reserve Equipment, and Installation
- Cost of electrical installation: $600,000 Chilean pesos
- Cost thermal installation: $400,000 Chilean pesos
4.7. Selection of Technology to Be Used and the Sector of Installation of the SIRES
5. Conclusions
Author Contributions
Funding
Acknowledgments
Conflicts of Interest
References
- Transforming Our World: The 2030 Agenda for Sustainable Development, United Nations. Available online: http://sustainabledevelopment.un.org (accessed on 20 January 2019).
- Ramakumar, R. Role of renewable energy in the development and electrification of remote and rural areas. IEEE Power Eng. Soc. Gen. Meet. 2004, 2, 2103–2105. [Google Scholar] [CrossRef]
- Maheshwari, Z.; Ramakumar, R. Smart integrated renewable energy systems (SIRES): A novel approach for sustainable development. Energies 2017, 10, 1145. [Google Scholar] [CrossRef]
- Ramakumar, R. Technical ad socio-economic aspects of solar energy and rural development in developing countries. Sol. Energy 1977, 19, 643–649. [Google Scholar] [CrossRef]
- Ramakumar, R.; Hughes, W.L. Renewable energy sources and rural development in developing countries. IEEE Trans. Educ. 1981, 24, 242–251. [Google Scholar] [CrossRef]
- Ramakumar, R. Renewable energy sources and developing countries. IEEE Trans. Power App. Syst. 1983, PAS-102, 502–510. [Google Scholar] [CrossRef]
- Ministerio de Energía de Chile. Energía 2050: Política Energética de Chile, 1st ed.; Ministerio de Energía, Gobierno de Chile: Santiago, Chile, 2015. [Google Scholar]
- Santana, C.; Falvey, M.; Ibarra, M.; García, M. Energías Renovables en Chile, el Potencial Eólico, Solar e Hidroeléctricos de Arica a Chiloé; Gobierno de Chile: Santiago, Chile, 2014. [Google Scholar]
- Bertran, J.; Morales, E. Potencial de Generación de Energía por Residuos del Manejo Forestal en Chile; Comisión Nacional de Energía (CNE): Santiago, Chile, 2008. [Google Scholar]
- Bartoli, B.; Cuomo, V.; Fontana, F.; Serio, C.; Silvestrini, V. The design of photovoltaic plants: An optimization procedure. Appl. Energy 1984, 18, 37–47. [Google Scholar] [CrossRef]
- Reddy, A.K.N.; Subramanian, D.K. The design of rural energy centers, Sadhana. In Proceedings of the Indian Academy of Sciences; Springer: Bangalore, India, 1979; Volume C2, Part 3, pp. 395–416. [Google Scholar]
- Ramakumar, R.; Shetty, P.S.; Ashenayi, K.A. Linear programming approach to the design of integrated renewable energy systems for developing countries. IEEE Trans. Energy Convers. 1986, 4, 18–24. [Google Scholar] [CrossRef]
- Chetty, K.M. Optimization Techniques Applied to the Design of Integrated Rural Centers. Ph.D. Thesis, Indian Institute of Science, Bangalore, India, 2005. [Google Scholar]
- Ashenayi, K.; Rmakumar, R. IRES—A program to design integrated renewable energy systems. Energy 1990, 15, 1143–1152. [Google Scholar] [CrossRef]
- Ramakumar, R.; Abouzahr, M.; Ashenay, K.A. Knowledge-based approach to the design of integrated renewable energy systems. IEEE Trans. Energy Convers. 1992, 7, 648–659. [Google Scholar] [CrossRef]
- Domínguez, J.; Costa, A.; Amador, J.; Lezcano, G. Análisis Espacio-Temporal Para la Integración de Sistemas Aislados de Generación de Energía—Electrificación Rural en el Noreste de Brasil; Centro Investigaciones Energéticas, Medioambientales y Tecnológicas (CIEMAT): Madid, Spain, 2003. [Google Scholar]
- Domínguez, J.; Pinedo, I.; Augusto, J. Herramientas SIG Para la Integración de Recursos de Energías Renovables en Electrificación Rural. Tecnologías de la Información Geográfica para el Desarrollo Territorial; Servicio de Publicaciones y Difusión Científica de la ULPGC: Las Palmas de Gran Canaria, Spain, 2008; pp. 552–563. [Google Scholar]
- Costa, A. HySyS v.1.0—Hybrid power system balance analyser. In Proceedings of the European Wind Energy Conference, Madrid, Spain, June 2003. [Google Scholar]
- IEA. Key World Energy Statics, 1st ed.; IEA Publications: Paris, France, 2017. [Google Scholar]
- Fath, H.E.S.; El-Shall, F.M.; Vogt, G.; Seibert, U. A standalone complex for the production of water, food, electrical power and salts for the sustainable development of small comunities in remotes areas. In Proceedings of the Conference on Desalination and the Environment, Santa Margherita, Italy, 22–26 May 2005; European Desalination Society: L’Aquila AQ, Italy, 2005. [Google Scholar]
- Ohta, T. Energy Technology Sources, Systems and Frontier Conversion; Yokohama National University: Pergamon, Turkey; Redwood Books: Trowbridge, UK, 1994. [Google Scholar]
- IEA. World Energy Outlook, 1st ed.; IEA Publications: Paris, France; Soregraph: Nanterre, France, 2010. [Google Scholar]
- Swan, L.G.; Ugursal, V.I. Modeling of end-use energy consumption in the residential sector: A review of modeling techniques. Renew. Sust. Energ. Rev. 2009, 13, 1819–1835. [Google Scholar] [CrossRef]
- Ibrahim, M.Z.; Yong, K.H.; Ismail, M.; Albani, A. Spatial analysis of wind potential for Malaysia. Int. J. Renew. Energ. Res. 2015, 5, 201–209. [Google Scholar]
- Molina, A.; Rondanelli, R. Explorador del Recurso Solar en Chile; Documentación y Manual de Uso; Departamento de Geofísica Facultad de Ciencias Físicas y Matemáticas Universidad de Chile: Santiago, Chile, 2012. [Google Scholar]
- Departamento de Geofísica Facultad de Ciencias Físicas y Matemáticas Universidad de Chile. El Explorador Eólico Documentación y Manual de Uso; Ministerio de Energía y la Agencia GIZ: Santiago, Chile, 2012. [Google Scholar]
- Dvoraka, M.J.; Archerb, C.L.; Jacobsona, M.Z. California offshore wind energy potential. Renew. Energ. 2010, 35, 1244–1254. [Google Scholar] [CrossRef]
- Potter, C.; Debra, L.; McCaa, J.; Cheng, S.; Eichelberger, S.; Grimit, E. Creating the dataset for the western wind and solar integration study (USA). Wind Eng. 2008, 32, 325–338. [Google Scholar] [CrossRef]
- Brandon, S.; Dudhia, J.; Basu, S.; Swift, A.; Giammanco, I. Evaluation of the weather research and forecasting model on forecasting low-level jets: Implications for wind energy. Int. J. Prog. Appl. Wind Power Convers. Technol. 2009, 12, 81–90. [Google Scholar] [CrossRef]
- Comisión Nacional de Energía y Procivil Ingenieria Ltda. Generación Hidroeléctrica en Pequeñas Centrales Asociadas a Obras de Riego; Gobierno de Chile: Santiago, Chile, 2009. [Google Scholar]
- Pontt, J.O.; Guiñez, C. Potencial de Biomasa en Chile Estudio de contribución de las ERNC al SIC al 2025; Universidad Técnica Federico Santa María: Valparaíso, Chile, 2008. [Google Scholar]
- Ministerio de Energía. NCh2911/2-Energía de Sistemas Híbridos-Especificaciones Para el uso de Energías Renovables en Electrificación Rural Descentralizada—Parte 2: Directrices Para el Diseño y Funcionamiento del Sistema; Gobierno de Chile: Santiago, Chile, 2010. [Google Scholar]
- Cámara Chilena de la Construcción. Estudio de Usos Finales y Curva de Oferta de la Conservación de la Energía en el Sector Residencial; Gobierno de Chile: Santiago, Chile, 2010. [Google Scholar]
- Ministerio de Economía Fomento y Reconstrucción. Norma Técnica que Determina Algoritmo Para la Verificación de la Contribución solar Mínima de los Sistemas Solares Térmicos Acogidos a la Franquicia Tributaria de la LEY N° 20.897; Gobierno de Chile: Santiago, Chile, 2016. [Google Scholar]
- Rajkumar, V.; Khatod, D.K. Optimal planning of distributed generation systems in distribution system. Renew. Sust. Energ. Rev. 2012, 16, 5146–5165. [Google Scholar] [CrossRef]
- Kanase-Patil, A.B.; Saini, R.P.; Sharma, M.P. Integrated renewable energy systems for off grid rural electrification of remote area. Renew. Energy 2010, 35, 1342–1349. [Google Scholar] [CrossRef]
- Kanase-Patil, A.B.; Saini, R.P.; Sharma, M.P. Sizing of integrated renewable energy system based on load profiles and reliability index for the state of Uttarakhand in India. Renew. Energy 2011, 36, 2809–2821. [Google Scholar] [CrossRef]
- Akella, A.K.; Sharma, M.P.; Saini, R.P. Optimum utilization of renewable energy sources in a remote area. Renew. Sust. Energ. Rev. 2007, 11, 894–908. [Google Scholar] [CrossRef]
- Beckman, W.A.; Klein, S.A.; Duffie, J.A. Solar Heating Design: By the f-Chart Method, 1st ed.; Jhon Wiley & Sons Inc.: New York, NY, USA, 1977; p. 218. [Google Scholar]
- Explorador de Energía Eólica. Available online: http://walker.dgf.uchile.cl/Explorador/Eolico2/ (accessed on 28 November 2015).
- Gobierno de Chile. Norma Técnica Que Determina Algoritmo Para la Verificación de la Contribución Solar Mínima de los Sistemas Solares Térmicos Acogidos a la Franquicia Tributaria de la Ley N° 20.365; Ministerio de Economía Fomento y Reconstrucción, Gobierno de Chile: Santiago, Chile, 2009. [Google Scholar]
- Ankur Scientific Energy Technology, Biomass Gasifier Manufacturers and Utilities; Ankur Scientific Energy Technology; Technology Catalogue: Baroda, India, 2009.
- Ministerio de Planificación y Cooperación. División de Evaluación Social de Inversiones. Precios Sociales Vigente; Gobierno de Chile: Santiago, Chile, 2015. [Google Scholar]


| District | Sector | N° of Homes | |
|---|---|---|---|
| 1 | Calle Larga | Álamo, Los Rosales, Patagual 1 and Patagual 2 | 25 |
| 2 | Cartagena | El Turco, La Rudilla and Chacarillas | 29 |
| 3 | San Antonio | Rinconada de San Juan, Cuncumen-Valle Abajo and San Juan | 6 |
| 4 | Zapallar | Las Lomas, Cuesta Cavilolén and Los Perales. | 10 |
| 5 | Puchuncaví | El Rincón, Potrerillos and Chilecauquen. | 6 |
| 6 | Cabildo | Cerro Negro, Guayacan, La Mora y and Ciruelo. | 32 |
| 7 | Olmué | La Vega, Las Palmitas, Los Bellotos, Naváez, El Duraznillo, Farallones, Quevarada Alvarado, 21 de Mayo and La Palma | 21 |
| 8 | Papudo | Las Salinas and Pullaly | 23 |
| 9 | San Esteban | Baños el Barro | 4 |
| 10 | Santo Domingo | Fuente Rabia, Pagui Rosa, Bucalemu, Puente Yali and Santa Blanca | 9 |
| Variable | Potential | Number of Appliances in a Basic Home | Number of Appliances in an Equipped Home | Daily Use | Energy Needed “Basic” | Energy Needed “Equipped” |
|---|---|---|---|---|---|---|
| Unit | (W) | (u) | (u) | (h) | (kWh/day) | (kWh/day) |
| Total | 865.0 | 5.0 | 14.0 | 36.5 | 1.0 | 3.64 |
| Socioeconomic Level | Nacional | A, B, C1 | C2 | C3 | D |
|---|---|---|---|---|---|
| Energy unit | (kWh) | (kWh) | (kWh) | (kWh) | (kWh) |
| Annual consumption per home | 78.3 | 70 | 70 | 59.9 | 63 |
| Sector | Average Annual Daily Heat Demand (kWh Day) | Sector | Average Annual Daily Heat Demand (kWh Day) |
|---|---|---|---|
| Olmué | 5.63 | Puchuncaví | 5.21 |
| Papudo | 5.14 | Zapallar | 5.25 |
| San Esteban | 6.70 | San Antonio | 5.34 |
| Santo Domingo | 5.30 | Cartagena | 5.34 |
| Cabildo | 5.94 | Calle Larga | 5.66 |
| Supplier | ESOL |
| Brand | Prisma Solar |
| Technology | Heat pipe STC |
| Optical efficiency () | 71.4% |
| Linear loss | 1.08 |
| Collection area | 2.84 |
| Variable | Roll Width (m) | Circumference (m) | Radius (m) | Diameter (m) | Area (m) | Length (m) | Volume (m) |
|---|---|---|---|---|---|---|---|
| DIMENSION | 1.5 | 3 | 0.48 | 0.96 | 0.72 | 6.15 | 4.45 |
| Daily bovine manure (kg/day) | Dilution ratio | Production factor (bovine) (m3/kg) | Load retention time (days) | Biogas production (m3/day) | |||
| OPERATION | 15.8 | 1:4 | 0.04 | 45 | 0.632 | ||
| Sector | Calle Larga | Cabildo | Santo Domingo |
|---|---|---|---|
| Number of PV | 4 | 4 | 6 |
| Days of autonomy | 3 | 3 | 4 |
| N° of pairs of batteries | 3 | 3 | 4 |
| Month | Number of Turbines | Month | Number of Turbines |
|---|---|---|---|
| January | 10 | July | 20 |
| February | 10 | August | 20 |
| March | 13 | September | 13 |
| April | 13 | October | 13 |
| May | 13 | November | 13 |
| June | 20 | December | 10 |
| Energy Generation Method | Ratio ($/kWh) | |
|---|---|---|
| Cabildo | Calle Larga | |
| Electricity from PVPs | 183 | 240 |
| Electricity from Wind Turbines | 301 | 271 |
| SHW production from STC technology | 92 | 122 |
| Biogas production for cooking and SHW | 7.7 | 7.7 |
| Equipment | Model | Units |
|---|---|---|
| PVP | ESOL | 3 |
| Biomass gasifier | - | 1 |
| Wind turbine + controller | Boreas 120 W | 3 |
| Inverter | Koning Sonne | 1 |
| Controller | Chisol | 1 |
| Structure | Gensolar | 4 |
| Batteries | Vision | 6 |
| Black cable | 20 cm | 2 |
| Black cable | 50 cm | 1 |
| Red cable | 50 cm | 1 |
| Cabinet | Chisol | 1 |
| Cost of Extending the Electricity Grid | $ 9,969,716 |
| Cost of SIRES | $ 4,045,130 |
| Cost of SEC technicians | $ 1,000,000 |
| Difference | $ 4,924,586 |
© 2019 by the authors. Licensee MDPI, Basel, Switzerland. This article is an open access article distributed under the terms and conditions of the Creative Commons Attribution (CC BY) license (http://creativecommons.org/licenses/by/4.0/).
Share and Cite
Masip, Y.; Gutierrez, A.; Morales, J.; Campo, A.; Valín, M. Integrated Renewable Energy System Based on IREOM Model and Spatial–Temporal Series for Isolated Rural Areas in the Region of Valparaiso, Chile. Energies 2019, 12, 1110. https://doi.org/10.3390/en12061110
Masip Y, Gutierrez A, Morales J, Campo A, Valín M. Integrated Renewable Energy System Based on IREOM Model and Spatial–Temporal Series for Isolated Rural Areas in the Region of Valparaiso, Chile. Energies. 2019; 12(6):1110. https://doi.org/10.3390/en12061110
Chicago/Turabian StyleMasip, Yunesky, Anibal Gutierrez, Joel Morales, Antonio Campo, and Meyli Valín. 2019. "Integrated Renewable Energy System Based on IREOM Model and Spatial–Temporal Series for Isolated Rural Areas in the Region of Valparaiso, Chile" Energies 12, no. 6: 1110. https://doi.org/10.3390/en12061110
APA StyleMasip, Y., Gutierrez, A., Morales, J., Campo, A., & Valín, M. (2019). Integrated Renewable Energy System Based on IREOM Model and Spatial–Temporal Series for Isolated Rural Areas in the Region of Valparaiso, Chile. Energies, 12(6), 1110. https://doi.org/10.3390/en12061110