Article

Optimization of a New Phase Change Material Integrated Photovoltaic/Thermal Panel with The Active Cooling Technique Using Taguchi Method

1
College of Architecture, Hunan University, Changsha 410082, Hunan, China
2
Design Institute of University of South China, Co., LTD, Hengyang 421001, Hunan, China
3
Hunan University Design Institute Co., LTD, Changsha 410082, Hunan, China
4
National Center for International Research Collaboration in Building Safety and Environment, Hunan University, Changsha 410082, Hunan, China
5
Department of Building Services Engineering, Faculty of Construction and Environment, The Hong Kong Polytechnic University, Hong Kong 999077, China
6
College of Civil Engineering, Hunan University, Changsha 410082, Hunan, China
7
School of Engineering, RMIT University, Melbourne 3000, Australia
8
College of Engineering and Science, Victoria University, Melbourne 8001, Australia
*
Authors to whom correspondence should be addressed.
Energies 2019, 12(6), 1022; https://doi.org/10.3390/en12061022
Submission received: 20 December 2018 / Revised: 11 March 2019 / Accepted: 11 March 2019 / Published: 15 March 2019
(This article belongs to the Special Issue Energy Efficiency in Plants and Buildings 2019)

Abstract

:
This paper investigates the energy performances of a hybrid system composed of a phase change materials-ventilated Trombe wall (PCMs-VTW) and a photovoltaic/thermal panel integrated with phase change material (PV/T-PCM). Equivalent overall output energy (QE) was proposed for energy performance evaluation regarding different energy forms, diversified conversions and hybrid thermal storages. This study focuses on parameters’ optimization of the PV/T-PCM system and parameters in the PCMs-VTW are kept optimal. Based on the experimentally validated numerical modelling, nine trial experiments have been conducted following Taguchi L9 (34) standard orthogonal array. The higher the better concept was implemented and the optimal combination of operating parameters was thereafter identified by using signal-to-noise (S/N) ratio and Analysis of Variance (ANOVA) method. The results show that QE is highly dependent on the mass flow rate, followed by the diameter of active cooling water pipe. However, the inlet cooling water temperature and the thickness of PCM have limited influence on QE. The optimal combination of each factor was identified as B3A3C2D1 (mass flow rate of 1 kg/s, diameter of water pipe of 0.6 m, inlet cooling water temperature of 15 °C and the thickness of PCM of 20 mm) with the highest QE of 20,700 kWh.

1. Introduction

Building energy consumption has been continuously increasing over the past several decades, accounting for more than 40% of the total energy consumption in numerous International Energy Agency member countries [1]. Currently, increasing the penetration of the renewable energy for domestic usage has widely attracted an increasing attention [2,3,4,5,6,7]. Renewable systems for buildings’ application can be installed on-site or nearby to reduce energy loss during energy generation, transmission and distribution processes. Meanwhile, the on-site renewable system for the buildings’ usage can reduce the total emission of carbon oxides, nitrogen oxides and sulfur oxides [8,9], mitigate the utility grid pressure [10] and thus generate economic impetus [11]. After being implemented with renewable system, the role of buildings will be changed from merely energy consumer to the energy prosumer [12,13,14]. The inherent characteristics of renewable energy, that is, dispersion, intermittency, instability and uncontrollability, result in low correspondence with the stochastic residential load. Numerous studies concentrate on the optimal configuration of the energy management system and the optimal energy control strategy to improve the self-consumption capacity of the buildings [15,16].
As a typical renewable energy generation technology, the photovoltaic (PV) cell has widely attracted the public attention, as it is able to convert solar radiation into electrical energy because the electrons are released by semiconducting materials after absorbing photons from sunlight. The problem is that, only a relatively small proportion of solar radiation (around 10−20%) [17] can be effectively converted into electricity, while the rest would be discarded as heat. The released heat increases the PV temperature and reduces the photovoltaic efficiency [18]. To meet residents’ thermal and electrical demand in different types of buildings, the hybrid photovoltaic/thermal (PV/T) system is regarded as one of the most effective technologies as it is able to convert solar radiation to both heat and electricity with little heat discarded as PV does. PV/T collector can be generally categorized into air−based PV/T system and water−based PV/T system depending on the cooling medium. Shahsavar et al. [19] experimentally and numerically studied both thermal and photovoltaic performances of a direct−coupled PV/T air collector, in which a thin aluminum sheet suspended in the middle of air channel was used. The result shows that, with the objective to maximize the electrical efficiency, there was an optimal value of the air flow rate depending on the number of fans. Slimani et al. [20] conducted a comparative study within four configurations, that is, photovoltaic module (PV−I), conventional hybrid solar air collector (PV/T−II), glazed hybrid solar air collector (PV/T−III) and glazed double−pass hybrid solar air collector (PV/T−IV). According to the results, the daily average overall energy efficiency (including both thermal and photovoltaic efficiencies) achieved its maximum value of 74% in the PV/T−IV, sequentially followed by the PV/T−III of 69.47%, the PV/T−II of 51.02% and then the PV/T−I of 29.63%. As for the water−based PV/T system, Yazdanifard numerically evaluated both total energy and exergy efficiencies of a water−based flat plate photovoltaic/thermal system. Afterwards, both the mass flow rate and the number of pipe were optimized in terms of maximizing both total energy and exergy efficiency [21]. In addition, Tse et al. [22] demonstrated the advantages of the liquid−based PV/T system regarding energy and economic savings. They concluded that integrating PV/T technologies into office buildings would realize low carbon emissions in the subtropical climate region.
The inherent characteristic of the discrepancy between the renewable generation and the energy demand proposes the challenge to efficiently utilize the renewable energy. Thermal energy storage via phase change material (PCM) is able to compensate the intermittency and instability of the renewable generation via its high energy storage density [23]. In addition to being implemented with the thermal energy storage tanks and the building façade [24], PCM being integrated with PV system would also be a promising solution in terms of mitigating the overheating of PV cell as PCM is able to absorb the heat via phase transition at nearly constant temperature. In the academic literature, numerous studies mainly focus on the thermal performance of PV system [25], the overall efficiency [26] and the net overall solar efficiency [27] of PV/T system integrated with PCM. Kibria et al. [25] developed a transient one−dimensional energy balance model of a photovoltaic module integrated with PCM. According to their results, an increasing ratio of thermal performance at 5% can be observed as the PCM was effective in limiting the temperature rise of PV devices. Su et al. [26] have conducted the comparative analysis on a hybrid PV/T system integrated with PCM. They concluded that, compared to the ‘no PCM’ mode, the overall efficiency of the hybrid PV/T system in the ‘upper PCM’ mode could be improved by over 10.7%. Qiu et al. [27] have conducted an experimental study on a novel micro−encapsulated Phase Change Material (MPCM) slurry based PV/T system. According to their results, a net overall solar efficiency of 80.8–83.9% can be realized under the recommended operational conditions: MPCM slurry weight concentration of 10%, slurry Reynolds number of 3000 and solar radiation of 500–700 W/m2.
The energy performance optimization of the PCM integrated PV/T system has also attracted an increasing attention in the academic world. The PCM integrated PV/T system is complicated as it involves different energy forms, diversified conversions and hybrid thermal storages, together with multi variables. To optimize the geometric and operational parameters of the system with numerous variables, Taguchi method has been extensively used for the trial experiments design and the determination of optimal combination levels of variables, as it is robust and efficient in addressing the multi−dimensional optimization problem [28]. In addition, several variables can be paid less attention or even ignored if the percentage contribution of each variable to the objective is low. This will reduce the redundancy of the multi−dimensional optimization problem. Lin et al. [29] concluded that Coefficients of Thermal Performance Enhancement (CTPE) could be increased to 70.2% in the most optimal combination case after adopting the Taguchi method. To address the problems with continuous and discrete variables, they [30] adopted the Taguchi−Fibonacci search method to maximize the Signal−to−Noise (S/N) ratio of CTPE of buildings. According to their results, the CTPE of the house was improved from 45.54% to 72.22% in comparison with the case without adopting the optimization methodology. Xie et al. [31] have also identified the optimal combination of design parameters of an ice thermal storage system with a thin layer ring using the Taguchi method. The reproducibility of the results was verified by the analytical results.
However, there are few studies concentrating on evaluating both thermal and photovoltaic performances of a PCM integrated PV/T collector with hybrid active cooling techniques. Furthermore, the Taguchi method has hardly been used to optimize the geometric and operational parameters of the hybrid system involving with different energy forms, diversified conversions and hybrid thermal storages. In this study, the equivalent overall output energy was proposed as the objective of the hybrid system involving with diversified energy conversions and hybrid thermal storages. The ultimate objective is to maximize the S/N ratio of the equivalent overall output energy and identify the optimal combination of both geometric and operational parameters to provide the technical guidance to the engineers. To realize the research objective, the first step is to develop an experimentally validated numerical model for the parametrical analysis. The investigated geometric and operational parameters include the diameter of active cooling water pipe, the mass flow rate and the inlet temperature of active cooling water and the thickness of PCM layer. Afterwards, Taguchi method is used to form a matrix of experiments following the orthogonal array. The numerical experiments were thereafter conducted for the comparative analysis. Finally, the Analysis of Variance is used to quantitatively identify the percentage of contribution of each factor to the overall energy performance of the hybrid system.

2. System Description

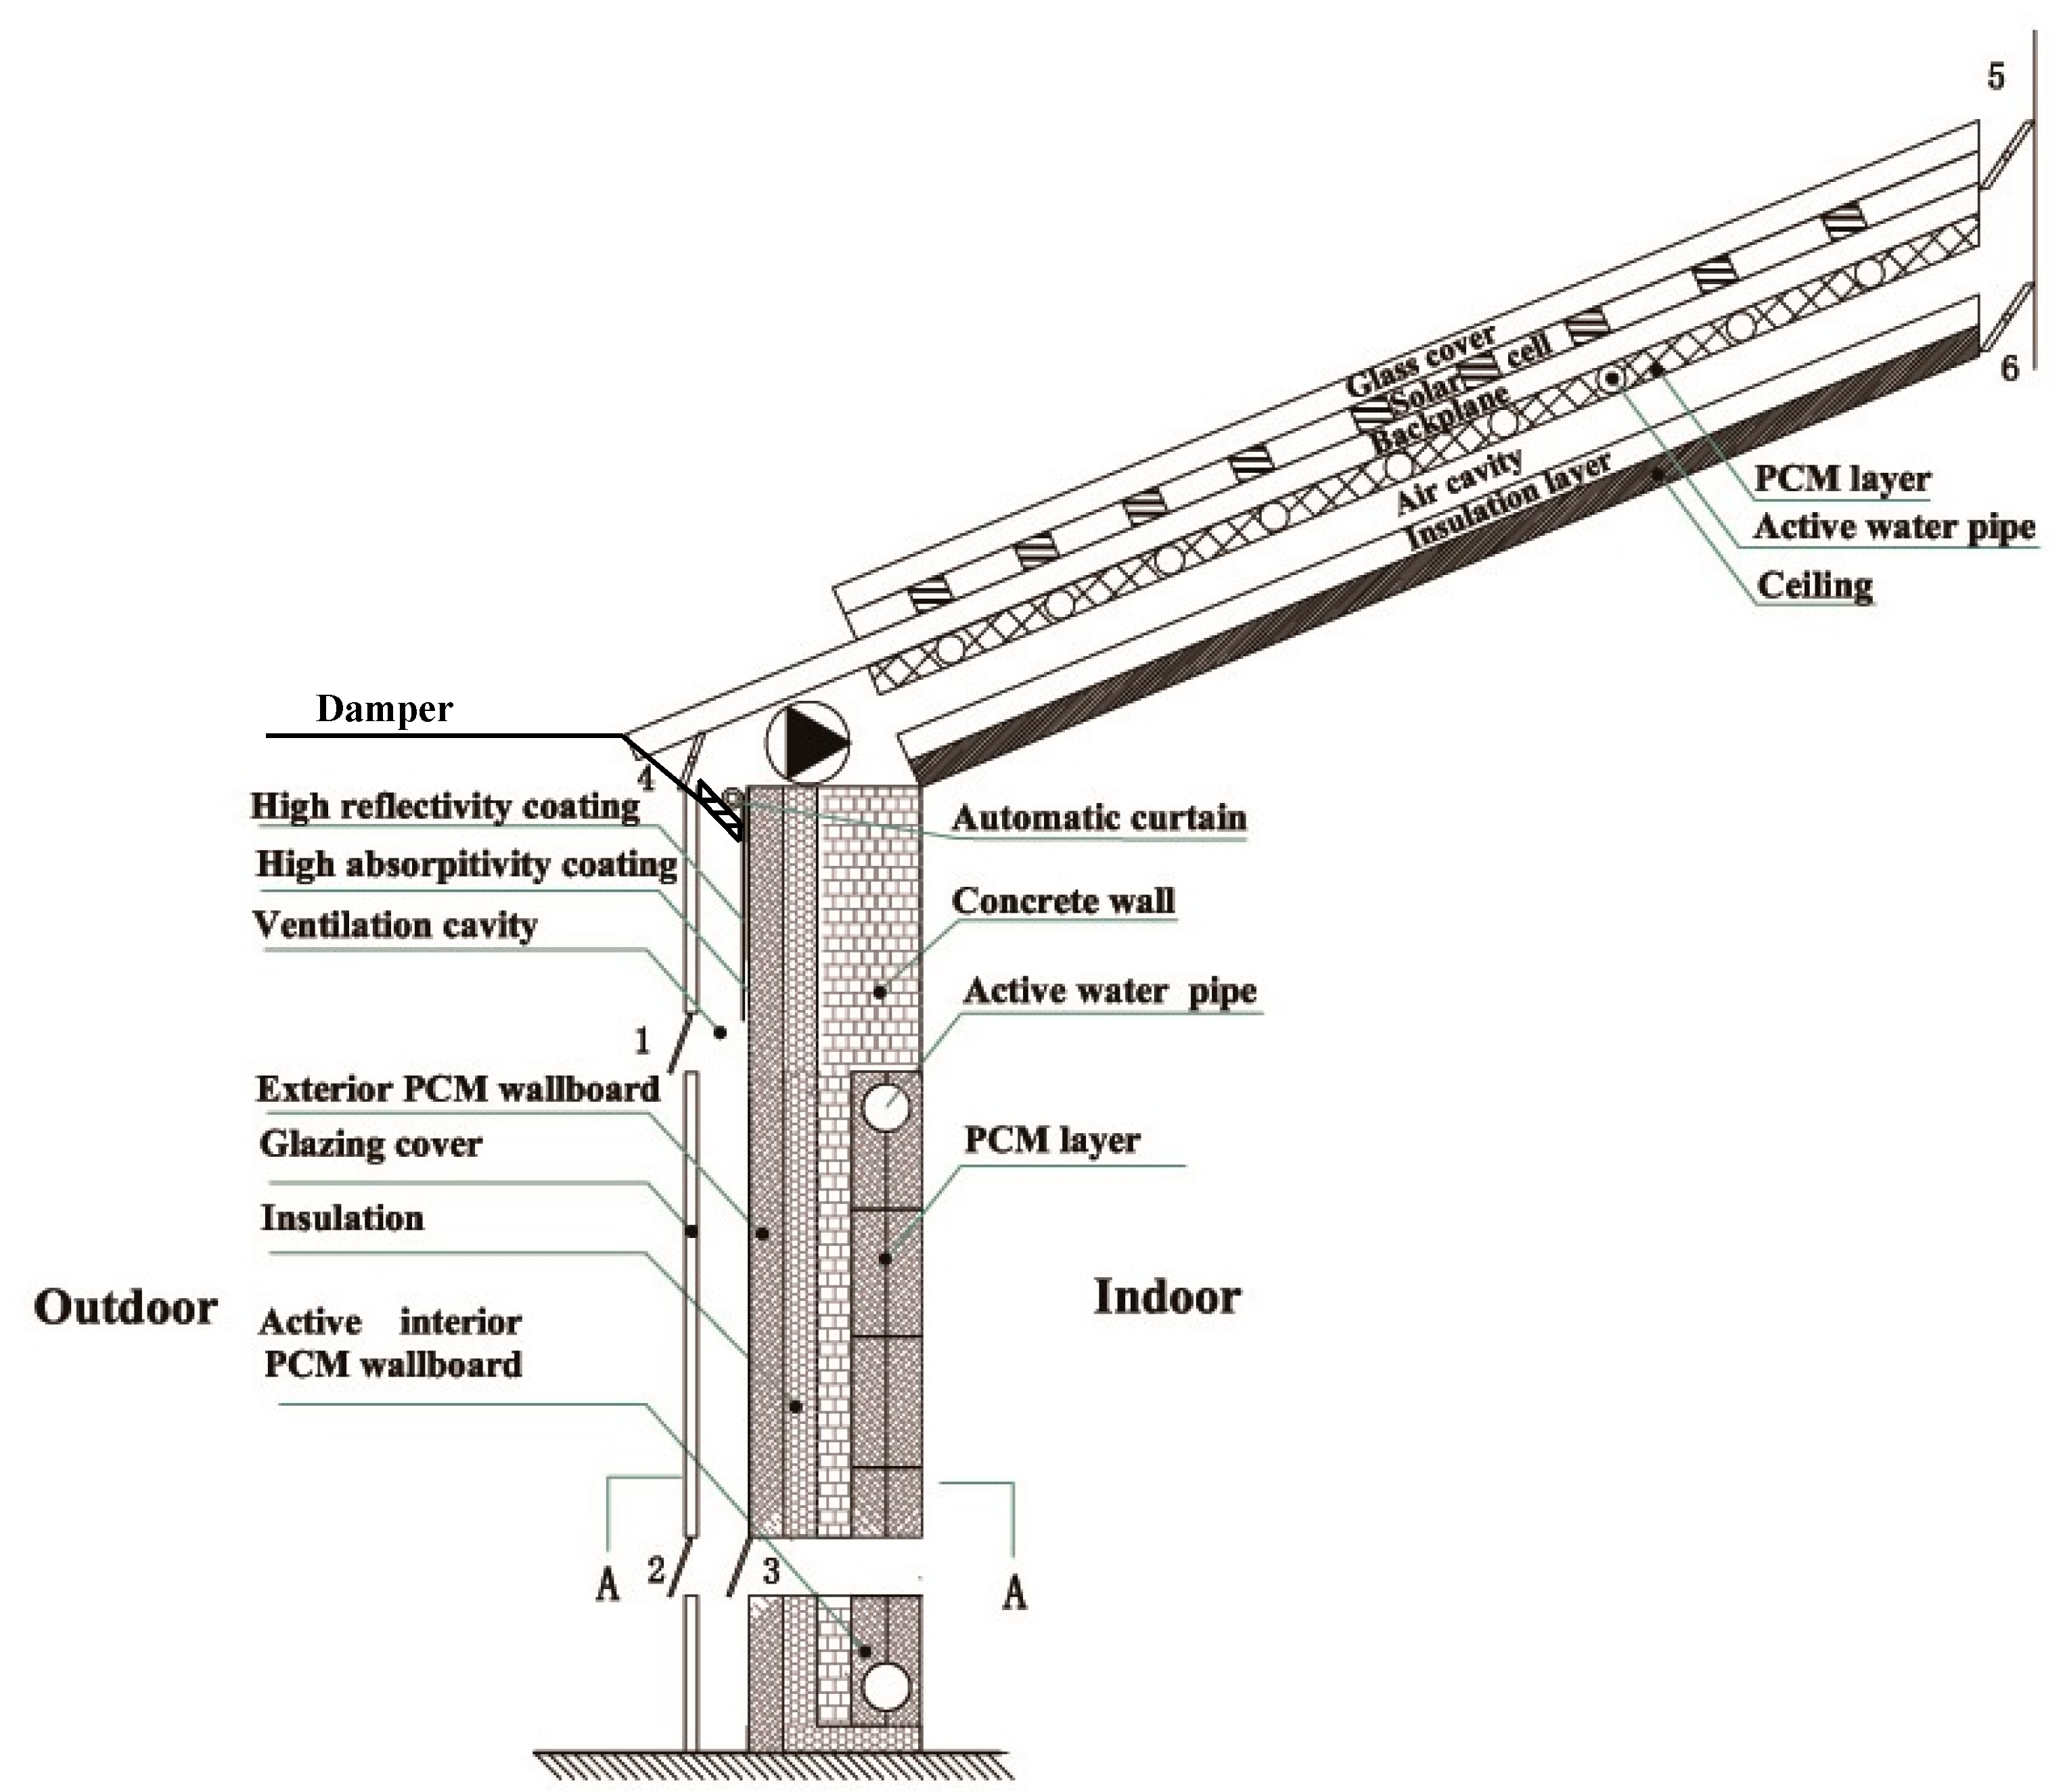
A hybrid system, which is composed of a PCM integrated ventilated Trombe wall and a PCM integrated PV/T panel, is proposed and analyzed as shown in Figure 1. There is an automatic air damper between the Vents 1 and 4. The automatic air damper is off during the summer daytime to avoid the hot air flowing into the PV air cavity, whereas the automatic air damper is on to form an air flow path during the night time. In the PV/T−PCM system, the photovoltaic/thermal panel is constituted of glass cover, solar cell, backplane, PCM layer with cooling water pipes, air cavity and insulation layer. The active cooling water is regarded as the working fluid to extract heat from the solar cell to provide hot water for the domestic usage. As mentioned in the above literature review [20,21], thermal and photovoltaic performances of the PV/T system are highly dependent on the mass flow rate of the cooling water, the temperature of cooling water, the diameter of the active cooling water pipes and the thickness of PCM layer. These parameters are quantitatively investigated in this study. Meanwhile, to avoid the moisture condensation of the PCMs−VTW radiant cooling system, active cooling water is supplied with a relatively high temperature of 20 °C, which is higher than traditional chilled water in AHU cooling coil (7 °C) or space cooling (15 °C). The availability of PCM contributes to shifting cooling energy from the off−peak period to the peak period for the domestic usage.
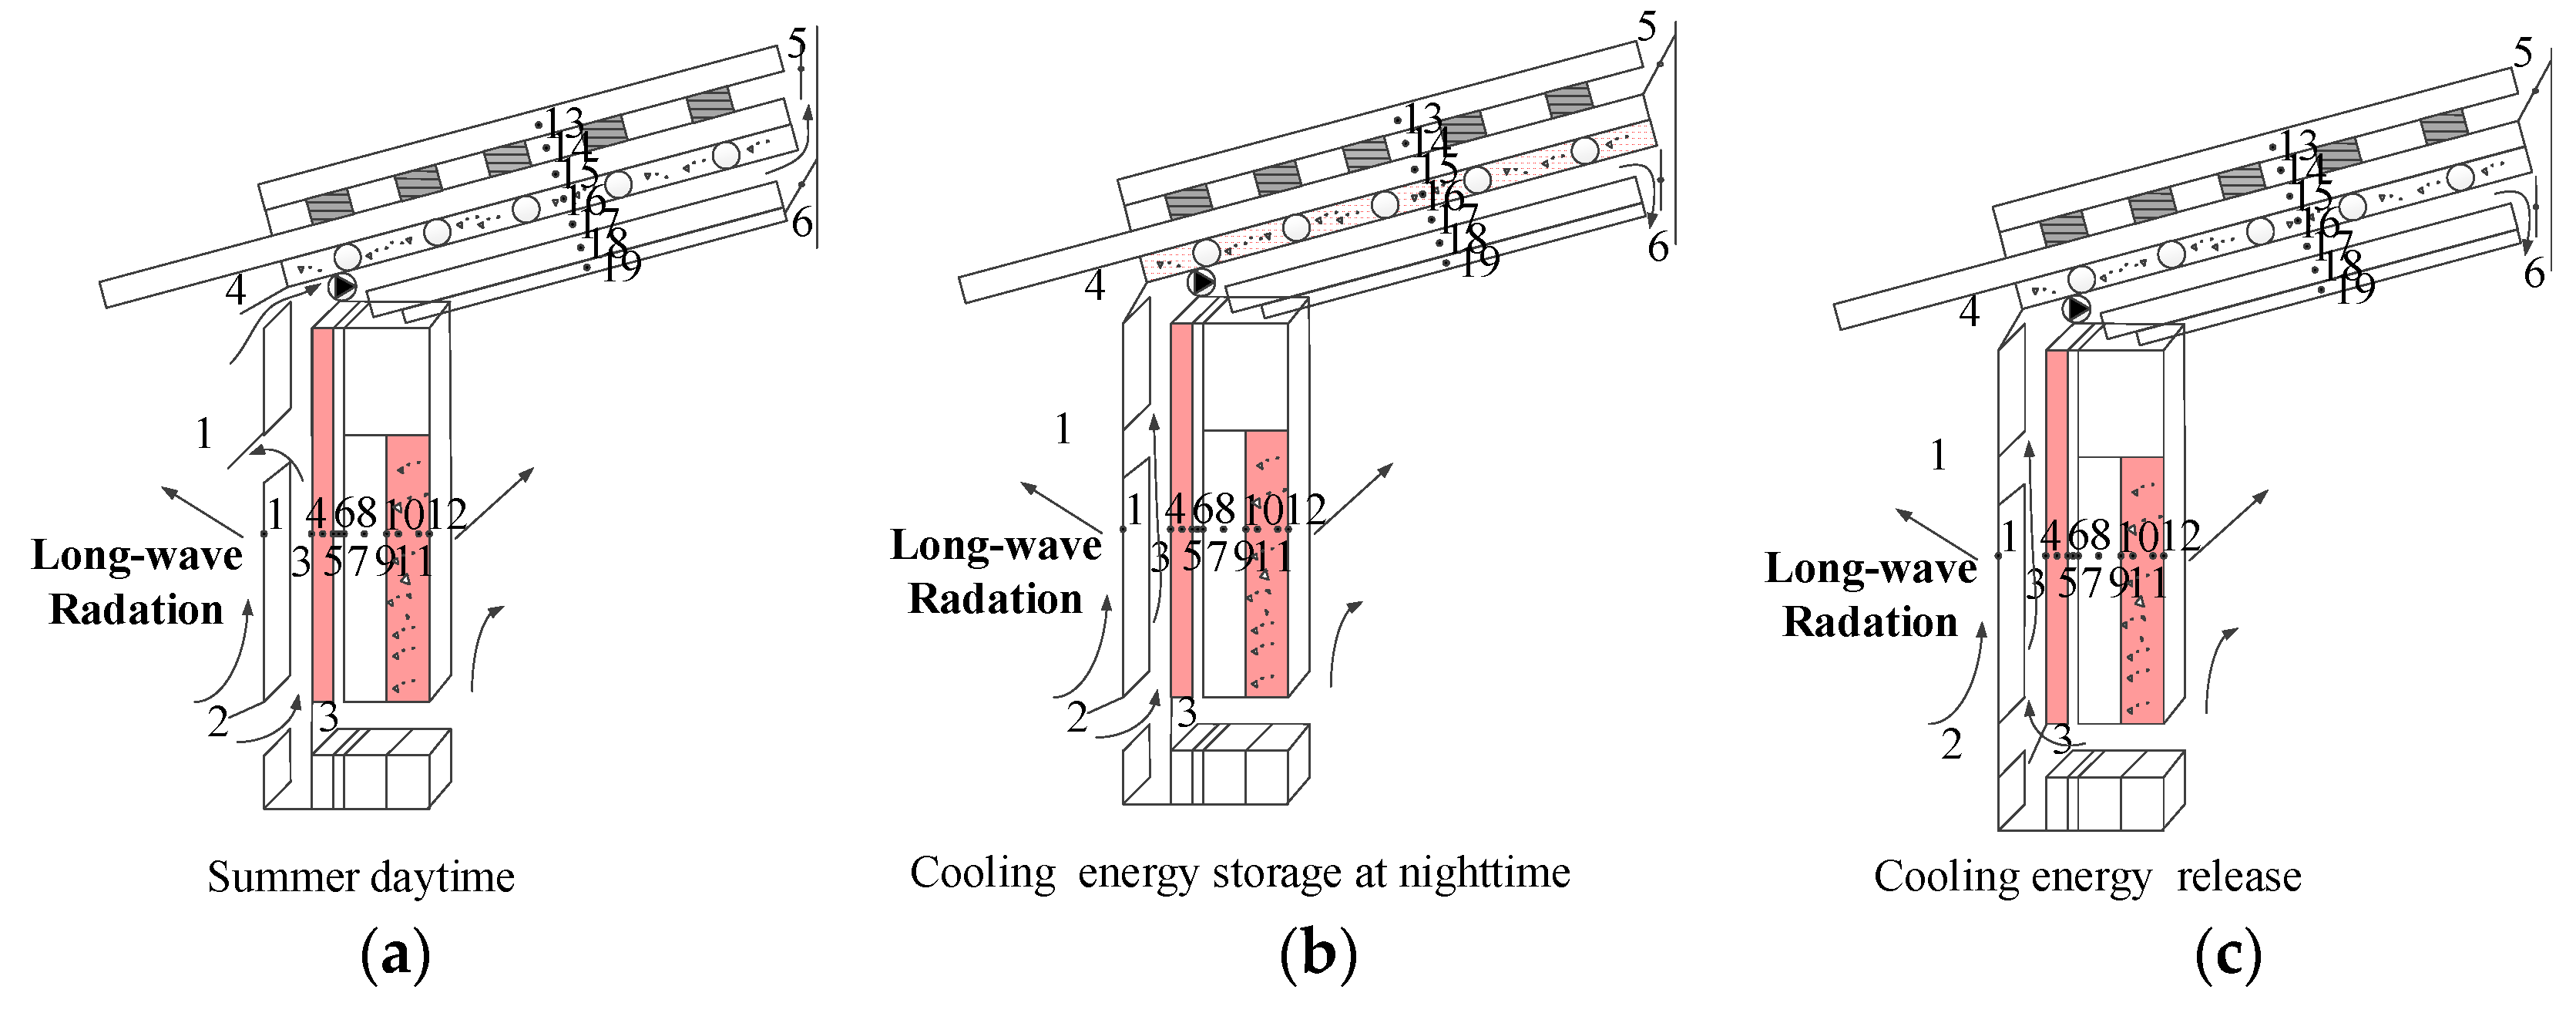
The motivation for integrating the Trombe wall is to improve the equivalent overall output energy with different technical solutions, such as the natural ventilation of the Trombe wall to resist the heat gain through the building envelope during the daytime and to store the natural cooling energy during the nighttime. Moreover, the radiative cooling can recover the heat energy for the domestic hot water applications. The advantages for coupling a Trombe Wall with the PV/T-PCM system can be summarized as follows:
1)
Cooling the supply air (consisting both outdoor fresh air and indoor return air) with the exterior PCM wallboard and re-cooling the supply air with the active PCM layer in the PV/T system. The supply air will be firstly cooled by the natural cooling energy in the exterior PCM wallboard. Afterwards, the cooling energy provided by the PV/T system for handling the supply air will be reduced. In other words, the implementation of the exterior PCM wallboard can enhance the cooling energy provided by the active cooling water in the PV/T system for cooling the PV panels.
2)
Increasing the cooling effect of the PV/T system via the heat transfer between the cooled supply air and the PCM in the PV/T system, when the stored cooling energy in the exterior PCM wallboard is released as shown in Figure 2b.
3)
The interior PCM wallboard can also reduce the cooling energy consumption of the active PV system for handling the supply air, as the radiative cooling can partially cover the building cooling load. In other words, the implementation of the interior PCM wallboard can also enhance the cooling energy provided by the active cooling water in the PV/T system for cooling the PV panels.

3. Thermodynamic Heat Transfer and Energy Equation

Figure 2 presents the computational nodes and heat transfer of three typical operational modes: 1) day time operation in summer; 2) natural energy storage at nighttime; 3) stored natural energy release. For the day time operation in summer as shown in Figure 2a, air vents 1, 2, 4, 5 are open. The automatic curtain coated with high reflectivity coating descends to reflect solar radiation in the daytime. The cavity air is heated by the solar radiation and is exhausted from vent 1 via natural ventilation. The ventilation fan is activated to cool the PV module with mechanical ventilation. For the natural energy storage at nighttime as shown in Figure 2b, the automatic curtain ascends to reflect solar radiation in the daytime. Air Vents 2 and 6 are open and the low temperature outdoor air enters the air channel from outside, solidifies the exterior PCM and the PCM in the PV/T system and is blown indoor by fans (mechanical ventilation). For cooling energy release as shown in Figure 2c, air Vents 3 and 6 are open and the indoor air enters the air channel, melts both exterior PCM and PCM in the PV/T system and is blown into room by fans (mechanical ventilation).

3.1. Active PCMs−VTW System

When the active cooling/hot water is turned on,
ρ PCM 3 α H α τ = λ brick T 8 k T 9 k Δ x + λ PCM 3 T 10 k T 9 k Δ x + q v 3 ( t )
ρ PCM 3 α H α τ = λ PCM 3 T 10 k + T 12 k 2 T 11 k Δ x 2 + q v 3 ( t )
ρ PCM 3 α H α τ = λ PCM 3 T 9 k + T 11 k 2 T 10 k Δ x 2 + q v 3 ( t )
q v 3 ( t ) = C w m w 3 [ T w 3 , in T w 3 ¯ ( t ) ]
For the water along the flow direction:
c w m w 3 α T w 3 α τ dx = [ λ PCM 3 α T α x L t 3 + h w , t ( T p T w 3 ) L t 3 ] dx
T w 3 ¯ ( t ) = 1 L 3 0 L 3 T w 3 ( x , t ) dL
where C w and m w 3 are specific heat capacity and mass flow rate of active cooling water, in J/(kg/°C) and kg/s respectively; L 3 and Dt3 are total length and diameter of the active cooling water pipe in PCMs-VTW system, in m; qv3 (t) is the heat flux of internal cold source caused by active cooling water at time t, in W; T w 3 ¯ ( t ) is the average water temperature along the length of pipe at time t, in °C; ρ PCM 3 and λ PCM 3 are density and thermal conductivity of internal PCM, in kg/m3 and W/(m·K), respectively; Δ x , the space step, changes with the thickness of the exterior PCM wallboard according to the number of set calculation nodes; Lt3, the perimeter of active cooling water pipe in PCMs-VTW system, is given as: Lt3 = π Dt3; Water temperature T w 3 (x, t) can be calculated with the initial condition T w 3 , in   = T w 3 | x=0, T w 3 , out = T w 3 | x=L3.
The convection heat transfer coefficient between the tube wall and water (hw,t) is calculated by Equation (7).
h w , t = Nu D λ w D t 3
where for fully developed laminar flow, the Nusselt number is given as NuD = 4.364; For fully developed turbulent flow, the Nusselt number is given as NuD = 0:023ReD0.8∙Pr0.4 [32].
Heat transfer between PCM and active cooling water ( Q T ) in the PCMs−VTW system is calculated by Equation (8):
Q T = 0 Δ t C w m w 3 [ T w 3 , in T w 3 , out ( t ) ] dt
where Δ t is the overall time during the active cooling water operation process, in s; T w 3 , in and T w 3 , out are inlet and outlet temperature of active cooling water in interior PCM wallboard.
Convection with outdoor air, convection with indoor air and radiation heat transfer with surroundings between external glass and the exterior PCM wallboard are calculated selectively according to corresponding operational states of the system. At the boundary points of the air channel like 1, 3 and 12, heat transfer differential equations are described as follows:
α g I + h ge ( T eq T 1 ) + h ga ( T f T 1 ) = ρ c α T α τ
ρ pcm α H α τ = σ T g 4 T 3 4 ( 1 ε 1 + 1 ε 3 1 ) + λ pcm α T α x + h pa ( T a T 3 )
ρ pcm α H α τ = λ pcm α T α x + h 12 ( T a T 12 ) + σ ( T os 4 T 12 4 ) ( 1 ε 12 1 ) + 1 X 21 + F 12 F i ( 1 ε f 1 )
where αg, ρ pcm   ,   H , λ pcm ,   σ , ε 1 , ε 3 , ε 12 and ε f are absorptivity of glass, density, enthalpy and thermal conductivity of PCM, Stefan-Boltzmann constant, emissivity of glass, emissivity of exterior PCM wallboard, emissivity of interior PCM wallboard and floor, respectively; h 12 is heat transfer coefficient between interior PCM wallboard and indoor environment, in W/(m2·K); Fi is the area of the ith surface, in m2. Ti is the temperature of the ith point; I is solar radiation; Tos is the average temperature of room surfaces; X 21 is the indoor air to wall angle factor; X 12 is the indoor air to floor angle factor; hga and h p a are heat convection coefficients between cavity air and two sides (glass and exterior PCM layer), respectively; They are deemed as equal and are determined by different air flow states: h w 1 under natural convection and h 1 under forced convection.
h w 1 is determined by:
h w 1 = Nu H · K a H
where H’ is the height of exterior wall; Ka is thermal conductivity coefficient of ventilated air. The Nusslet number Nu H is calculated as [3,4,11,14]:
Nu H = ( 0.825 + 0.328 Ra H 1 / 6 ) 2 0.1 < Ra H < 10 12
Ra H = g β H 3 · ( T 1 T f ) ʋ · a
where g is the Gravitational acceleration, in m/s2; β is the volume expansion coefficient of air, in 1/K; ʋ is the Kinematic viscosity of the ventilated air, in m2/s; a is the thermal diffusivity coefficient, in m2/s.
h 1 is the heat transfer coefficient of glazing surface under mechanical ventilation, which is formulated by Equation (15) as shown in Reference [2,33]:
h 1 = ξ ρ C p u Δ P 2 / 3 / 8
Δ P = ξ H D ρ u 2 2 g
where ξ is the resistance coefficient of ventilated air; Δ P is the pressure difference caused by mechanical fan; D is the width of the air channel; u is the flow rate of air; C p and ρ are the specific heat capacity and density of the ventilated air, respectively.
With regard to Equation (11), T o s is the average temperature for other five surfaces in the room as shown in Equation (17):
T os = ( F i T i ) F i
where Fi is the ith surface area.
T e q is solar air temperature as shown in Equation (18):
T eq = T f + [ α 1 IQ lw ] / h out
where T f is the ambient temperature, in °C; I is local solar radiation intensity, in W/m2; Q l w is long wave radiation intensity, which is calculated by Equation (19):
Q lw = σ α 1 [ ( X sky + X g α g ) T 1 4 X sky T sky 4 X g α g T g 4 ]
where X sky and X g are view factors of sky and ground, respectively; α g is absorptivity of ground. T sky and T g are temperature of sky and ground, respectively. Other parameters have been mentioned above.

3.2. PV/T−PCM System

The numerical modelling in this study is the extension of our previous modelling as shown in Reference [34]. The readers are recommended to refer reference [34] for more information.

3.2.1. Glass Cover

Temperature rise of glass cover was the result of its heat gain, which includes heat absorption by the glazing, heat loss to the environment via both convection and conduction and heat conduction to PV cell surface. Energy balance of glass cover could thus be expressed by Equation (20):
α g I + h ge ( T eq T g ) + U gc ( T c T g ) = ρ g C g α T α τ
where Tc and Tg are temperatures of PV cell module and glass, respectively; ρg and Cg are density and specific heat capacity of glass, respectively; hge is the total heat transfer coefficient of the glass to the ambient and Ugc is heat transfer coefficient of the glass to the PV cell module. The two heat transfer coefficients could be described as:
h ge = ( δ g λ g + 1 he ) 1
U gc = ( δ g λ g + δ c λ c ) 1
where λ g and λ c are heat conductivities of glass and PV cell, respectively; δ g and δ c are thicknesses of glass and PV cell, respectively. he is the convective heat transfer coefficient, which is calculated by empirical Equation (23):
h e = 5.7 + 3.8 v
where v is the air flow rate facing the glass surface.

3.2.2. PV Cell

The heat transfer process of the PV cell can be described as: (1) solar radiation transmitted through the glass cover and absorbed by PV cell and (2) conductive heat transfer between the glazing and PV cell. Similarly, total heat gains are divided into two parts: heat converted to electricity and conductive heat transfer with backplane. Energy balance equation of PV cell is thus expressed by Equation (24):
gαcF + Ugc(Tg − Tc) = ηF τgαc I + Ucb(Tb − Tc)
where F is packing factor of the solar cell; τg is transmittance of the collector glazing and αc, is the effective absorptance of the PV layer, which is given as αc = Fαpv + (1−F) αbp; αpv and αbp are absorptance of the PV cell and backplane, respectively; Tb is the temperature of backplane; the photovoltaic efficiency (η) is calculated by the empirical Equation (25) [35] and the overall heat transfer coefficient of the cell to the backplane (Ucb) is calculated by Equation (26):
η = ηref (1 − βref (Tc − Tref))
U cb = ( δ c λ c + δ b λ b ) 1
where λ b is heat conductivity coefficient of backplane. δ b is thickness of backplane. Photovoltaic power generation Qp was calculated by Equation (27):
Qp = η∙αc∙τg∙F∙A∙I
where A is the area of PV cell.

3.2.3. Other Components of the PV/T System

After transmitting through the glass, solar energy is partially absorbed by the PV cell and the rest transmits through the PV cell and is then absorbed by the backplane. The energy balance equation of the backplane cell is thus expressed by Equation (28):
For backplane:
FI τ g τ c α b + ( 1 F ) I τ g α b + U cb ( T c T b ) + U bp ( T p T b ) = ρ b C b α T α τ
where αb is absorptance of backplane; τc is the transmittance of the PV cell; ρb and cb are density and specific heat capacity of backplane, respectively. The overall heat transfer coefficient of the backplane to the PCM (Ubp) is calculated by Equation (29):
U bp = ( δ b λ b + δ p λ p ) 1
where λ p is heat conductivity of PCM and δ p is thickness of PCM.
The heat balance of the PCM layer with cooling water pipe in PV/T system can be written as:
ρ PCM α H α τ = U bp ( T b T p ) + h pa ( T a T p ) + q v ( t )
where ρPCM and H are the density and enthalpy of PCM, respectively; hpa is heat transfer coefficient between PCM surface and air; Ta is cavity air temperature; qv, is the internal heat source of internal cooling water, which is defined by Equation (31).
For the water along flow direction:
C w m w α T w α τ dx = [ λ b α T α x Lt + λ p α T α y Lt + hw , t ( Tp Tw ) Lt ] dx
where the water temperature T w (x, t) can be calculated with the initial condition T w , in = T w | x=0, T w , out = T w | x=L1. x and y are directions parallel to and vertical to cooling water pipes, respectively.
To simplify the calculation with reasonable manner, average temperature of water along the flow direction is obtained as:
T w ¯ ( t ) = 1 L 1 0 L 1 T w ( x , t ) dx
q v ( t ) = C w m w [ T w , in T w ¯ ( t ) ]
Q T = 0 t C w m w [ T w , in T w , out ( t ) ] dt
The heat transfer between PCM and active cooling water in PV/T-PCM system, Q T , can also be calculated by Equation (35):
Q T = h w π Dt , 1 0 L 1 0 t [ T PCM ( x , t ) T w ( x , t ) ] dt dx
where C w and m w are specific heat capacity and mass flow rate of active cooling water; The perimeter of active cooling water tube, Lt, is given as: Lt = π Dt,1; Dt,1 is the diameter of active cooling water pipe in PV/T_PCM system. L1 is the length of active cooling water pipe in the PV/T-PCM system; T w , in and T w , out are inlet and outlet temperatures of active cooling water; Q T is the heat transfer between PCM and active cooling water; t is the time-duration during the whole process.
Convection heat transfer coefficient between the tube wall and water is calculated by:
h w , t = Nu D λ w D t , 1
where for fully developed laminar flow, the Nusselt number is given as NuD = 4.364; For the fully developed turbulent flow, the Nusselt number is formulated by Equation (37):
NuD = 0.023RenPrm
where n = 0.8 and m = 0.4 in heating case and n = 0.8 and m = 0.3 in cooling case [32].
For cavity air:
C a m a α T α τ = h pa ( T p T a ) + h ai ( T i T a )
where Ca and ma are specific heat capacity and mass flow rate of air; hai is heat transfer coefficient between insulation surface and air; Ti is the temperature of insulation layer.
For insulation layer:
h ai ( T a T i ) + U ic ( T ceiling T i ) = ρ i C i α T α τ
where ρi and Ci are specific heat capacity and mass flow rate of insulation; Tceiling is the temperature of ceiling; The overall heat transfer coefficient of the insulation layer to the ceiling (Uic) is calculated by Equation (40),
U ic = ( δ i λ i + δ ceiling λ ceiling ) 1
where λ i and λ ceiling are thermal conductivity of insulation and ceiling; δ i and δ ceiling are thickness of insulation and ceiling, respectively.
For the ceiling:
ρ ceiling · c ceiling α T α τ = U ic ( T i T ceiling ) + h f ( T a T ceiling ) + σ ( T os 4 T ceiling 4 ) ( 1 ε ceiling   1 ) + 1 X air ceiling + F ceiling i = 1 6 F i ( 1 ε wall 1 )
where ρceiling and cceiling are specific heat capacity and mass flow rate of ceiling; Fi is the area of the ith surface; Tos is the average temperature of all room surfaces; X air ceiling is the view factor of indoor air to ceiling; hf is heat transfer coefficient between indoor air and ceiling.

3.3. Thermo-Physical Parameters of the System

Based on our previous studies of the PCMs−VTW system [36,37,38], the optimal case (the melting temperature of 26 °C for the exterior PCM and of 22 °C for the interior PCM) was adopted here to exclusively study the effect of parameters in PV/T−PCM system on both thermal and photovoltaic performances of the hybrid system. Table 1 and Table 2 list the parameters of the proposed system. The parameters are almost similar to our previous studies [34,36,37,38] except for the investigated parameters in this study, such as the thickness of the PCM in the PV/T-PCM system. It should be admitted that, as the impact of the air cavity thickness on the energy performance of the PV system has been widely studied in references [39,40,41], the parametrical study on the air cavity thickness has not been conducted to avoid the repetition.

3.4. Evaluation of Performance Parameters

In the hybrid system, electricity can be generated from the solar cell. Thermal energy can be generated by the PV/T system and the interior PCM wallboard. There are components that consume electricity, such as the active cooling water pump and the air cavity fan. In order to evaluate the energy performance of the hybrid system involved with different energy forms, diversified conversions and hybrid thermal storages, the equivalent overall output energy is calculated by subtracting the amount of energy consumption in pump and fan from the total energy generation in both photovoltaic cell and interior PCM wallboard. In terms of energy generation, the photovoltaic power generation (Qp) from PV/T collector and heat transfer between PCM and active cooling water ( Q T ) in PV/T collector can be calculated from Equations (27) and (34), respectively. With regard to energy consumption, electricity consumptions in water pumps are determined by Equations (42) and (43):
Q pump , 1 = ( f 1 + ζ ) × L 1 D t , 1 × u 1 2 2 × ρ w × A 1 × u 1
Q pump , 3 = ( f 3 + ζ ) × L 3 D t , 3 × u 3 2 2 × ρ w × A 3 × u 3
where ζ is the local resistance coefficient along the flow direction; A1 and A3 are the cross-sectional areas of active water pipe in PV/T-PCM and PCMs-VTW system, respectively; u 1 and u 3 are active cooling water flow rate in PV/T-PCM and PCMs-VTW system, respectively; ρ w is the density of water. The variation of water density with its temperature is not taken into account. f1 and f3 are friction factors, which are determined by Equation (44).
f = { 64 Rew ( Rew < 2300 ) ( 0.79 lnRew 1.64 ) 2 ( Rew > 2300 )
As for the electricity consumption in ventilation fan, it is assumed to be proportional to volume flow rate of air, as shown below:
Q fan = 800 * V air
where Vair is the volume flow rate of air, m3/s.
It is acknowledged that electricity is deemed as higher in quality than thermal energy [18,19,42]. To comprehensively evaluate both thermal and photovoltaic performances of PV/T-PCM system with respect to different energy forms, diversified energy conversions and storages, equivalent overall output energy ( Q E ) is thus proposed and identified by Equation (46).
Q E = Q T + Q T + ( Qp Q pump , 1 Q pump , 3 Q fan ) / η power
where η power is the average efficiency of power plant and its value is regarded as 0.4 [26].

3.5. Factorial Influence Analysis

The application of active cooling water and PCM has been proven to be effective in terms of enhancing both photovoltaic and thermal efficiencies of the PV/T system [3,4]. However, there is quite limited research study quantitatively evaluating the improvement of photovoltaic and thermal efficiencies of PV/T system by implementing both PCM and active cooling water. In this study, the impact of geometric and operational parameters, for example, the diameter of active cooling water pipe, the mass flow rate and the inlet cooling water temperature of active cooling water and the thickness of PCM, on the energy performance of the proposed PV/T system have been quantitatively investigated. As the city supply water temperature is between 15 and 25 °C, the inlet cooling water temperature between 15 and 25 °C is discussed. The mass flow rate of the active cooling water ranges from 0.25 to 1 kg/s according to ref. [43]. The thickness of the active PCM layer is assigned according to the ref. [38]. In reference [38], the optimized thickness of the interior PCM wallboard is 20 mm. It should also be noted that, the diameter of the active cooling water pipe depends on the PCM thickness. The baseline case with four constant parameters is listed in Table 3.

3.5.1. Effect of Diameter

Generally, with the increase in the diameter of the active cooling water pipe, the energy consumption of cooling water pumps (Qpump) decreases because of the decrease in mechanical resistance, while the heat transfer between PCM and active cooling water (QT) increases due to the enhanced heat transfer area. In this study, diameters of cooling water pipes are 0.15 m, 0.3 m and 0.6 m, while other parameters are kept the same as the value in the baseline case (as listed in Table 3).
As shown in Table 4, with the increase of the diameter of active cooling water pipe in the PV/T-PCM system, Qpump decreases while the heat transfer between PCM and active cooling water (QT) increases. More precisely, with the rise of the diameter from 0.15 mm to 0.6 mm, the heat transfer between PCM and active cooling water in PV/T collector ( Q T ) significantly increases from 5321 to 7020 kWh, while the energy consumption in pump (Qpump) decreases from 84 to 9 kWh. As a result, equivalent overall output energy ( Q E ) obviously increases from 6696 to 8583.5 kWh, indicating that the increasing magnitude of the equivalent overall output energy ( Q E ) is primarily dependent on the increase of the Q T . It should also be noted that, heat transfer between interior PCM wallboard and active cooling water ( Q T ), generated photovoltaic power (Qp) and energy consumption in fan (Qfan) are close to each other for the three studied cases, indicating that those three parts are less dependent on the diameter of the active cooling water pipe.

3.5.2. Effect of Mass Flow Rate of Cooling Water Temperature

Generally, with the increase in the mass flow rate of the cooling water, energy consumption of the cooling water pumps (Qpump) increases because of the increase in mechanical resistance. Moreover, the heat transfer between PCM and active cooling water (QT) also increases due to the enhancement of the heat transfer coefficient. Meanwhile, the generated photovoltaic power (Qp) can also be enhanced due to the decrease of the solar cell temperature. In this part, the parametrical analysis has been conducted on the mass flow rate of cooling water (0.25 kg/s, 0.5 kg/s and 1.0 kg/s) and other parameters are kept the same as the baseline case.
Table 5 lists the energy generation/consumption of each part with respect to the change of the mass flow rate. As shown in Table 5, with the rise in diameter from 0.25 kg/s to 1.00 kg/s, the most significant increasing magnitude from 84 to 1260 kWh can be seen in the energy consumption in pumps (Qpump). This is followed by the heat transfer between PCM and active cooling water in the PV/T collector ( Q T ), which increases from 5320 to 16130 kWh. Total photovoltaic power generation (Qp) also shows an increasing trend, from 30 to 49 kWh. As a result, equivalent overall output energy ( Q E ) increases from 6696 to 14,613 kWh. It should also be noted that, the heat transfer between interior PCM wallboard and active cooling water ( Q T ) and energy consumption in fan (Qfan) are less dependent on the mass flow rate of active cooling water.

3.5.3. Effect of Inlet Cooling Water Temperature

In general, the inlet cooling water temperature affects heat transfer between PCM and active cooling water in the PV/T collector ( Q T ) due to the temperature difference between cooling water and solar cell. Parametrical analysis has been conducted on the inlet cooling water temperature (15 °C, 20 °C, 25 °C) and values of other parameters are kept the same as the baseline case.
Table 6 demonstrates the energy generation/consumption of each part in the hybrid system. As expected, the heat transfer between PCM and active cooling water in the PV/T collector ( Q T ) decreases with the rise in inlet cooling water temperature. More precisely, with the rise of the inlet cooling water temperature from 15 °C to 25 °C, the heat transfer rate between PCM and active cooling water in PV/T collector ( Q T ) decreases from 5320 to 1773 kWh and the total photovoltaic power generation (Qp) decreases from 30 to 19 kWh. As a result, the equivalent overall output energy (QE) decreases from 6695 to 3120.5 kWh. It is also noteworthy that the heat transfer between the interior PCM wallboard and active cooling water ( Q T ), energy consumption in pump (Qpump) and fan (Qfan) are similar for all three cases, indicating that they are independent on the inlet cooling water temperature.

3.5.4. Effect of PCM Thickness

It is acknowledged that although the increase of the PCM thickness contributes directly to the increase of the thermal resistance, the total energy storage in PCM will increase because more PCM is available for the thermal energy storage. Meanwhile, the increase of the PCM quality is beneficial for the heat dissipation in solar cell as more heat can be absorbed by PCM and then be extracted by active cooling water. Based on this, PCM thickness with different values (20 mm, 30 mm and 40 mm) are selected to investigate the effect of PCM thickness on the equivalent overall output energy ( Q E ) and other parameters are kept the same as the baseline case.
Table 7 demonstrates the energy generation/consumption of each part as a result of PCM thickness. As expected, heat transfer rate between PCM and active cooling water in PV/T collector ( Q T ) increases with the increase in PCM thickness. More precisely, with the increase in PCM thickness from 20 mm to 40 mm, heat transfer rate between PCM and active cooling water in PV/T collector ( Q T ) increases from 5320 to 8200 kWh. Moreover, total photovoltaic power generation (Qp) increases from 30 to 53 kWh. As a result, equivalent overall output energy (QE) increases from 6695 to 9632.5 kWh. It is also noteworthy that the heat transfer between interior PCM wallboard and active cooling water ( Q T ), energy consumption in pump (QPump) and energy consumption in fan (Qfan) are similar for all three cases, indicating that those three parts are independent on the PCM thickness.

4. Taguchi Optimization Method

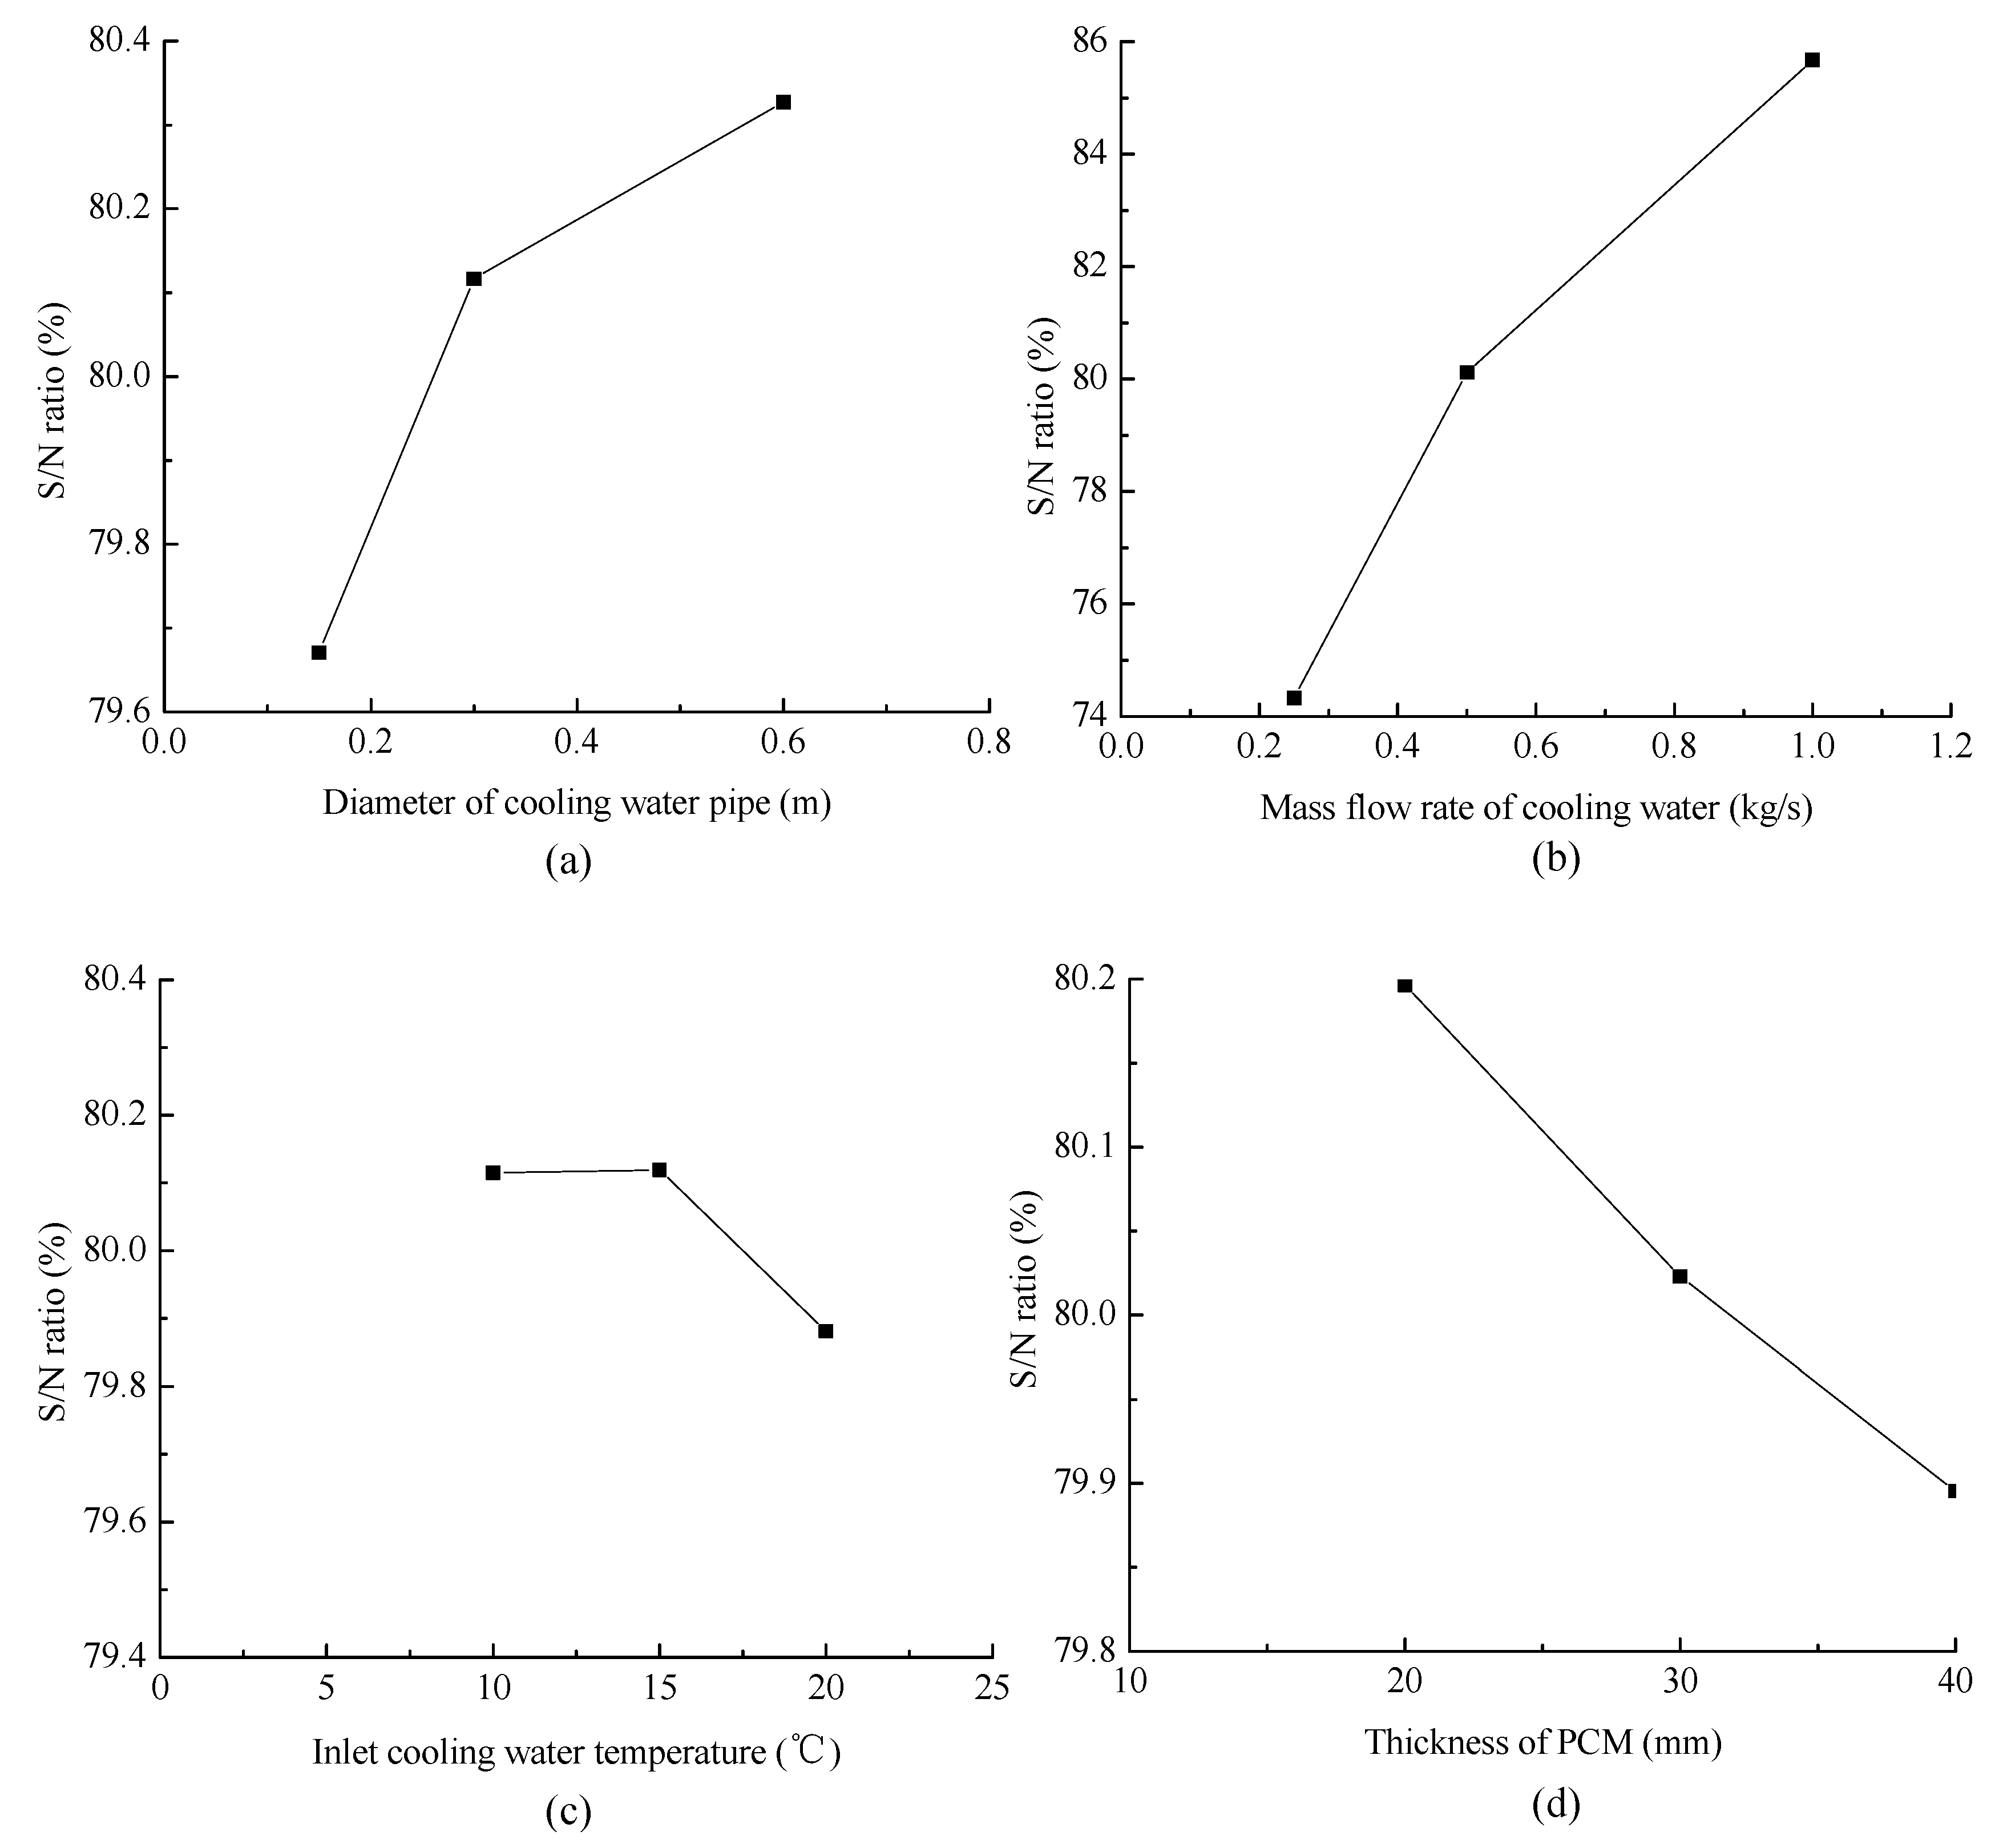
Section 3 indicates that the increase of the diameter of active cooling water pipe, the mass flow rate of the active cooling water and the thickness of PCM can improve equivalent overall output energy (QE), whereas the increase of the inlet temperature of active cooling water shows a completely contrary trend. However, it exclusively investigates the influence of each separate variable on the system performance without comprehensively considering the effect of different combinations of these parameters on the energy performance of the PV/T-PCM system. Taguchi optimization method is an experimental optimization technique that adopts the standard orthogonal arrays in matrix form of experiments for the multi-dimensional optimization in the system design [28,44,45]. Multiple variables (factors in Taguchi method) and several values of these variables (factor levels) are arranged according to standard orthogonal arrays, enabling dramatic decrease in full-factorial trial experiments. Comprehensive numerical evaluation of system performance using Taguchi optimization method is time-saving and economically beneficial. Therefore, the Taguchi optimization method is adopted here to systematically and comprehensively evaluate the effect of all performance-related variables on the equivalent overall output energy (QE) in the PV/T-PCM system.
Generally, by adopting Taguchi method, the following steps should be taken to conduct the parametrical study in the PV/T-PCM system. The optimal combination of each factor and the corresponding level will be thereafter identified.
1)
Definite the ultimate purpose and evaluate the overall performance. Meanwhile, identify evaluating index of the system;
2)
Determine the number of corresponding levels for parameters (factors) and possible interactions between parameters;
3)
Select the suitable orthogonal array and assign parameters with the orthogonal array;
4)
Conduct trial experiments according to the orthogonal array;
5)
Analysis of results: S/N, ANOVA and Response Table;
6)
Select the optimal levels of each parameter;
7)
Validate the optimal combination of parameters by conducting confirmation experiment.
As the principle objective of this research is to identify the optimal combination of all energy related variables to improve overall energy performance of the PV/T-PCM system, the signal to noise (S/N) ratio has been extensively treated as the objective function in the experimental design. Generally, three kinds of performance characteristic are selected in the analysis, including the−smaller−the−better, the−larger−the−better and the−nominal−the−better. Correspondingly, three kinds of S/N ratios are available depending on the performance characteristic chosen in the optimization problem [35]:
S / N = 10 log ( 1 n j = 1 n y T , j 2 ) , the - lower - the - better
S / N = 10 log ( 1 n j = 1 n 1 y T , j 2 ) , the - higher - the - better
S / N = 10 log ( 1 n j = 1 n y ¯ T 2 s ) , the - nominal - the - better
where y T , j is the jth observed objective value from Taguchi trial experiment; s is the variance; n is the number of the observations in a trial experiment.
This research is to identify the optimal combination and corresponding values in energy-related variables such as the diameter of active cooling water pipe, the mass flow rate and the inlet temperature of active cooling water and the thickness of PCM. The−higher−the−better S/N ratio is adopted for the analysis as shown in the Equation (50).
S / N = 10 log ( 1 Q E 2 )

5. Results and Discussion

It should be noted that, several other parameters also influence the equivalent overall output energy ( Q E ) except for the parameters mentioned in Section 3, such as solar intensity, transmissivity of glass cover, absorptivity of material, thickness of PCM wallboard in PCMs−VTW system, radius of cooling water pipes in interior PCM wallboard, melting temperature and enthalpy of PCMs, overall heat loss efficient and so on. As this is an initial research step, only four parameters are investigated in this study and others are kept constant. The uncontrollable parameters are set as: transmissivity of glass cover (τ) 0.91, absorptivity of solar cell (α) 0.8, emissivity of glass cover (ε) 0.92 and the overall heat loss coefficient of the PV/T−PCM collector (UL) 4.9 (W/m2 K).
As for meteorological parameters in Changsha, a typical summer week (from 1 August to 7 August) from Chinese Standard Weather Data (CSWD) as shown in Figure 3, is selected. As shown in Figure 3, the average air temperature and the solar radiation were 30 °C and 255.5 W/m2, respectively.

5.1. Control Factor and Levels

In this part, the optimal values of the four mentioned operational parameters will be identified to calculate the maximum value of the equivalent overall output energy ( Q E ) . To conduct the comparative study of each parameter, levels of three parameters are shown in Table 8 based on the results in Section 3. In addition, there is no interaction between different parameters. Moreover, the orthogonal array L9 (34) is selected for trial experiments as shown in Table 9 and parameter matrix of the trial experiments are shown in Table 10.

5.2. Taguchi Method−Signal to Noise Ratio

After conducting the trial experiment, trial run result will be converted into S/N ratio by using the−higher−the−better concept and the calculated S/N value is shown in Table 11. The response table for equivalent overall output energy (QE) is shown in Table 12. The order of the influence of each parameter on equivalent overall output energy (QE) can be demonstrated by the rank row in Table 12, for which the rank 1 represents the most influential factor, while the rank 4 represents the least influential factor. The optimal combination of parameters for the hybrid system is identified by choosing the level with the highest S/N ratio. As a result, the optimal levels of the selected four parameters are A3 (diameter of active cooling water pipe is 0.6m), B3 (mass flow rate is 1.0 kg/s), C2 (inlet temperature of active cooling water is 15 °C) and D1 (the thickness of PCM is 20mm). In order to better understand the parameters’ influence on the equivalent overall output energy, average values of S/N ratio shown in Table 12 are demonstrated in Figure 4. It reveals that, the diameter of cooling water pipe and the mass flow rate of the active cooling water show the positive correlation with the S/N ratio, while the temperature of inlet cooling water and the thickness of PCM are negatively correlated with S/N ratio.

5.3. Taguchi Method−ANOVA Analysis

To further investigate the influence of each control factor on energy performance, analysis of variance (ANOVA) is used to identify the relative magnitude of each factor on the percentage contribution to the equivalent overall output energy. Results using ANOVA analysis of the four parameters in the hybrid system are shown in Table 13. Sum of squares (SS) and degree of freedom (DF) are calculated as Equation (51):
SS = r n ( i = 1 r K i 2 ) 1 n ( i = 1 n y i ) 2
where n = total number of the trial experiment (n = 9); r = the degree of freedom (DF) = level − 1; K i is the sum of S/N ratio for some specific parameter at level i.
The ANOVA analysis results of equivalent overall output energy are shown in Table 13. As shown in Table 13, mass flow rate of active cooling water is the most influential factor which dramatically affects the equivalent overall output energy, followed by the diameter of active cooling water pipe. The percentage contributions of both factors are 73.98% and 25.60%, respectively.

5.4. Taguchi Method−Confirmation Test

The equivalent overall output energy has been analyzed for a typical week during the summer weather condition in Changsha. The experimental trials have been conducted according to Table 8 using the data in Table 6. The calculated result of the equivalent overall output energy is shown in Table 9. It can be concluded that, the equivalent overall output energy varies from 5405 to 20,690 kWh. The equivalent overall output energy depends on the diameter of active cooling water pipe, the mass flow rate and the inlet temperature of active cooling water and the thickness of PCM. Based on the result of the confirmation test, the optimal combination of the operating parameters are 0.58 m, 0.89 kg/s, 13.67 °C and 19.25 mm, respectively. Among those optimal values of all operating parameters, it is found that all these values are lower than those in Section 5.2. However, the equivalent overall output energy is 22,600 kWh, which is higher than equivalent overall output energy value as shown in Table 9.

6. Conclusions

In this study, both phase change materials (PCMs) integrated with ventilated Trombe wall (PCMs-VTW) and photovoltaic/thermal panel integrated with phase change material (PCM) (PV/T-PCM) are implemented in a building to fully utilize renewable energy. The equivalent overall output energy (QE) has been proposed and analyzed to comprehensively evaluate energy performance with respect to different energy forms, diversified energy conversions and hybrid energy storages. The main conclusions are summarized as follows:
(1)
The equivalent overall output energy generation is highly dependent on the mass flow rate of active cooling water, followed by the diameter of active cooling water pipe. However, the inlet cooling water temperature and the thickness of PCM have limited influence on the generation of equivalent overall output energy.
(2)
The equivalent overall output energy varies from 54.05 kW to 206.9 kW. The optimal combination of each factor (B3A3C2D1: the mass flow rate of 1 kg/s, the diameter of water pipe of 0.6 m, the inlet cooling water temperature of 15 °C and the thickness of PCM of 20 mm) is identified and the highest value in equivalent overall output energy is optimized be 20,700 kWh.
(3)
The confirmation test shows that the optimal combination of the operating parameters are 0.58 m, 0.89 kg/s, 13.67 °C and 19.25 mm, respectively, which are very closed to B3A3C2D1, with the equivalent overall output energy of 22,600 kWh.
Limitations and future research:
In this study, only four parameters related to the PV/T-PCM system is discussed and multivariable study needs to be conducted to investigate the impact of other parameters on the equivalent overall output energy, such as the thermo-physical parameters of the PCMs, the thickness of the PCMs in the PCMs-VTW system and so on. Moreover, the application of the proposed system in different types of buildings needs to be justified regarding different climate regions.

Author Contributions

Y.L., Y.Z., W.Y. and G.Z. contributed to the conception of the study, the development of the methodology. X.L. and Y.Z. developed computer models and simulated and analyzed data. Y.L., Y.Z., and W.L contributed to the whole revision process. X.L, Y.Z., Y.L., W.Y., G.Z. and C.Q.L. wrote the manuscript. All the authors have read and approved the final manuscript.

Funding

This research was funded by Australian Research Council under grants (DP140101547, LP150100413 and DP170102211).

Acknowledgments

The authors acknowledge the support from College of Architecture in Hunan University in China and The Hong Kong Polytechnic University.

Conflicts of Interest

The authors declare no conflict of interest.

References

  1. Agency, I.E. Modernising building energy codes to secure our global energy future. Energy Procedia 2017, 135, 105–114. [Google Scholar]
  2. Chakravorty, U.; Leach, A.; Moreaux, M. Cycles in nonrenewable resource prices with pollution and learning-by-doing. J. Econ. Dyn. Control 2012, 36, 1448–1461. [Google Scholar] [CrossRef]
  3. Park, J.; Kim, T.; Leigh, S.B. Application of a phase-change material to improve the electrical performance of vertical-building-added photovoltaics considering the annual weather conditions. Sol. Energy 2014, 105, 561–574. [Google Scholar] [CrossRef]
  4. Cui, T.; Xuan, Y.; Li, Q. Design of a novel concentrating photovoltaic–thermoelectric system incorporated with phase change materials. Energy Convers. Manage 2016, 112, 49–60. [Google Scholar] [CrossRef]
  5. Cao, S.; Kai, S. Matching indices taking the dynamic hybrid electrical and thermal grids information into account for the decision-making of nZEB on-site renewable energy systems. Energy Convers. Manage 2015, 101, 423–441. [Google Scholar] [CrossRef]
  6. Cao, S.; Klein, K.; Herkel, S.; Sirén, K. Approaches to enhance the energy performance of a zero-energy building integrated with a commercial-scale hydrogen fueled zero-energy vehicle under Finnish and German conditions. Energy Convers. Manage 2017, 142, 153–175. [Google Scholar] [CrossRef]
  7. Cao, S.; Hasan, A.; Kai, S. On-site energy matching indices for buildings with energy conversion, storage and hybrid grid connections. Energy Build. 2013, 64, 423–438. [Google Scholar] [CrossRef]
  8. Cao, S.; Hasan, A.; Kai, S. Analysis and solution for renewable energy load matching for a single-family house. Energy Build. 2013, 65, 398–411. [Google Scholar] [CrossRef]
  9. Liu, X.; Zhang, S.; Bae, J. The impact of renewable energy and agriculture on carbon dioxide emissions: Investigating the environmental Kuznets curve in four selected ASEAN countries. J. Clean. Prod. 2017, 164, 1239–1247. [Google Scholar] [CrossRef]
  10. Mcpherson, M.; Karney, B. A scenario based approach to designing electricity grids with high variable renewable energy penetrations in Ontario, Canada: Development and application of the SILVER model. Energy 2017, 138, 185–196. [Google Scholar] [CrossRef]
  11. Ito, K. CO2 emissions, renewable and non-renewable energy consumption, and economic growth: Evidence from panel data for developed countries. Int. Econ. 2016, 36, 1–6. [Google Scholar] [CrossRef]
  12. Baetens, R.; Jelle, B.P.; Gustavsen, A. Phase change materials for building applications: A state-of-the-art review. Energy Build. 2010, 42, 1361–1368. [Google Scholar] [CrossRef] [Green Version]
  13. Niu, X.; Xiao, F.; Ma, Z. Investigation on capacity matching in liquid desiccant and heat pump hybrid air-conditioning systems. Int. J. Refrig. 2012, 35, 160–170. [Google Scholar] [CrossRef]
  14. Delgado, B.M.; Cao, S.; Hasan, A.; Sirén, K. Thermoeconomic analysis of heat and electricity prosumers in residential zero-energy buildings in Finland. Energy 2017, 130, 544–559. [Google Scholar] [CrossRef] [Green Version]
  15. Ram, M.; Gulagi, A.; Breyer, C.; Keiner, D. Role of solar PV prosumers in enabling the energy transition towards a fully renewables based power system for India. In Proceedings of the 1st International Conference on Large-Scale Grid Integration of Renewable Energy in India, New Delhi, India, 6–8 September 2017. [Google Scholar]
  16. Velik, R.; Nicolay, P. Energy management in storage-augmented, grid-connected prosumer buildings and neighborhoods using a modified simulated annealing optimization. Comput. Oper. 2016, 66, 248–257. [Google Scholar] [CrossRef]
  17. Fu, H.; Zhao, X.; Ma, L.; Zhang, T.; Wu, Q.; Sun, H. A comparative study on three types of solar utilization technologies for buildings: Photovoltaic, solar thermal and hybrid photovoltaic/thermal systems. Energy Convers. Manage 2017, 140, 1–13. [Google Scholar]
  18. Chow, T.T. A review on photovoltaic/thermal hybrid solar technology. Appl. Energy 2010, 87, 365–379. [Google Scholar] [CrossRef]
  19. Shahsavar, A.; Ameri, M. Experimental investigation and modeling of a direct-coupled PV/T air collector. Sol. Energy 2010, 84, 1938–1958. [Google Scholar] [CrossRef]
  20. Slimani, M.E.A.; Amirat, M.; Kurucz, I.; Bahria, S.; Hamidat, A.; Chaouch, W.B. A detailed thermal-electrical model of three photovoltaic/thermal (PV/T) hybrid air collectors and photovoltaic (PV) module: Comparative study under Algiers climatic conditions. Energy Convers. Manage 2016, 133, 458–476. [Google Scholar] [CrossRef]
  21. Yazdanifard, F.; Ebrahimnia-Bajestan, E.; Ameri, M. Investigating the performance of a water-based photovoltaic/thermal (PV/T) collector in laminar and turbulent flow regime. Renew. Energy 2016, 99, 295–306. [Google Scholar] [CrossRef]
  22. Tse, K.K.; Chow, T.T.; Su, Y. Performance evaluation and economic analysis of a full scale water-based photovoltaic/thermal (PV/T) system in an office building. Energy Build. 2016, 122, 42–52. [Google Scholar] [CrossRef]
  23. Esen, M. Thermal performance of a solar-aided latent heat store used for space heating by heat pump. Sol. Energy 2000, 69, 15–25. [Google Scholar] [CrossRef]
  24. Zhou, Y.; Zheng, S.; Chen, H.; Zhang, G. Thermal performance and optimized thickness of active shape-stabilized PCM boards on side-wall cooling and under-floor heating system. Indoor Built Environ. 2016, 25, 1279–1295. [Google Scholar] [CrossRef]
  25. Kibria, M.A.; Saidur, R.; Al-Sulaiman, F.A.; Aziz, M.M.A. Development of a thermal model for a hybrid photovoltaic module and phase change materials storage integrated in buildings. Sol. Energy 2016, 124, 114–123. [Google Scholar] [CrossRef]
  26. Su, D.; Jia, Y.; Alva, G.; Liu, L.; Fang, G. Comparative analyses on dynamic performances of photovoltaic–thermal solar collectors integrated with phase change materials. Energy Convers. Manage 2017, 131, 79–89. [Google Scholar] [CrossRef]
  27. Qiu, Z.; Ma, X.; Zhao, X.; Li, P.; Ali, S. Experimental investigation of the energy performance of a novel Micro-encapsulated Phase Change Material (MPCM) slurry based PV/T system. Appl. Energy 2016, 165, 260–271. [Google Scholar] [CrossRef]
  28. Taguchi, G.; Chowdhury, S.; Wu, Y. Taguchi’s Quality Engineering Handbook, 1st ed.; Wiley: Hoboken, NJ, USA, 2005; pp. 3–124. [Google Scholar]
  29. Lin, W.; Ma, Z.; Cooper, P.; Sohel, M.I.; Yang, L. Thermal performance investigation and optimization of buildings with integrated phase change materials and solar photovoltaic thermal collectors. Energy Build. 2016, 116, 562–573. [Google Scholar] [CrossRef]
  30. Lin, W.; Ma, Z. Using Taguchi-Fibonacci search method to optimize phase change materials enhanced buildings with integrated solar photovoltaic thermal collectors. Energy 2016, 106, 23–37. [Google Scholar] [CrossRef]
  31. Xie, J.; Yuan, C. Parametric study of ice thermal storage system with thin layer ring by Taguchi method. Appl. Therm. Eng. 2016, 98, 246–255. [Google Scholar] [CrossRef] [Green Version]
  32. Holman, J.P. Heat Transfer, 10th ed.; McGraw Hill: Boston, MA, USA, 2010; p. 280. [Google Scholar]
  33. John, A.D.; William, A.B. Solar Engineering of Thermal Processes, 4th ed.; Wiley: Hoboken, NJ, USA, 2013; pp. 149–154. [Google Scholar]
  34. Zhou, Y.; Liu, X.; Zhang, G. Performance of buildings integrated with a photovoltaic–thermal collector and phase change materials. Procedia Eng. 2017, 205, 1337–1343. [Google Scholar] [CrossRef]
  35. Bergman, T.L.; Incropera, F.P.; DeWitt, D.P.; Lavine, A.S. Fundamentals of Heat and Mass Transfer, 7th ed.; Wiley: Hoboken, NJ, USA, 2011; pp. 112–131. [Google Scholar]
  36. Liu, X.; Zhou, Y.; Zhang, G. Numerical study on cooling performance of a ventilated Trombe wall with phase change materials. Build. Simul. 2018, 11, 1–18. [Google Scholar] [CrossRef]
  37. Zhou, Y.; Yu, C.W.F. The year-round thermal performance of a new ventilated Trombe wall integrated with phase change materials in the hot summer and cold winter region of China. Indoor Built Environ. 2018. [Google Scholar] [CrossRef]
  38. Zhou, Y.; Yu, C.W.F.; Zhang, G. Study on heat-transfer mechanism of wallboards containing active phase change material and parameter optimization with ventilation. Appl. Therm. Eng. 2018, 144, 1091–1108. [Google Scholar] [CrossRef]
  39. Chowdhury, M.G.; Goossens, D.; Goverde, H.; Francky, C. Experimentally validated CFD simulations predicting wind effects on photovoltaic modules mounted on inclined surfaces. Sustain. Energy Technol. Assess. 2018, 30, 201–208. [Google Scholar] [CrossRef]
  40. Shahrestani, M.; Yao, R.; Essaha, E.; Shao, L.; Oliveira, A.C.; Hepbasli, A.; Biyik, E.; del Caño, T.; Rico, E.; Lechónd, J.L. Experimental and numerical studies to assess the energy performance of naturally ventilated PV façade systems. Solar Energy 2017, 147, 37–51. [Google Scholar] [CrossRef]
  41. Saadon, S.; Gaillard, L.; Giroux-Julien, S.; Ménézo, C. Simulation Study of a Naturally Ventilated Building Integrated Photovoltaic (BIPV) Envelope. Renew. Energy 2016, 87, 517–531. [Google Scholar] [CrossRef]
  42. Aste, N.; Del Pero, C.; Leonforte, F. Water flat plate PV–thermal collectors: A review. Sol. Energy 2014, 102, 98–115. [Google Scholar] [CrossRef]
  43. Salem, M.R.; Elsayed, M.M.; Abd-Elaziz, A.A.; Elshazly, K.M. Performance enhancement of the photovoltaic cells using Al2O3/PCM mixture and/or water cooling-techniques. Renew. Energy 2019. [Google Scholar] [CrossRef]
  44. Sivasakthivel, T.; Murugesan, K.; Thomas, H.R. Optimization of operating parameters of ground source heat pump system for space heating and cooling by Taguchi method and utility concept. Appl. Energy 2014, 116, 76–85. [Google Scholar] [CrossRef]
  45. Verma, V.; Murugesan, K. Optimization of solar assisted ground source heat pump system for space heating application by Taguchi method and utility concept. Energy Build. 2014, 82, 296–309. [Google Scholar] [CrossRef]
Figure 1. Detailed construction of the proposed hybrid system.
Energies 12 01022 g001
Figure 2. Computational nodes and heat transfer of three typical operational modes.
Energies 12 01022 g002
Figure 3. Solar radiation and outdoor temperature in Changsha.
Energies 12 01022 g003
Figure 4. Average value of S/N ratios for the equivalent overall output energy.
Energies 12 01022 g004
Table 1. Thermo-physical properties of the PCMs-VTW system [36].
MaterialPhysical PropertiesValue
Hydrated salt CaCl2·6H2Odensity1380 kg/m3
Cps2.53 kJ/(kg/K)
Cpl2.53 kJ/(kg/K)
enthalpy176 kJ/kg
Melting temperature of exterior PCM26 °C
Thickness of exterior PCM8 mm
Melting temperature of interior PCM22 °C
Thickness of interior PCM28 mm
λs0.5 W/(m/K)
λl0.4 W/(m/K)
degree of super-cooling0.5
absorbance of the exterior PCM wallboard (α3)0.6
emittance of the interior PCM wallboard (ε12)0.8
Coatingabsorptance of high-absorptive coating0.85
reflectance of high-reflective coating0.85
Expanded Polystyrene (EPS)ρeps30 kg/m3
λeps0.035 W/(m∙K)
Ceps1.3 kJ/(kg/K)
thickness10 mm
BrickCb0.75 kJ/(kg/K)
ρb2000-2500 kg/m3
λb0.39-0.42 W/(m/K)
Thickness of interior brick30 mm
Glassemittance (ε1)0.92
absorbance (α1)0.1
ρg2500 kg/m3
Cg760 kJ/(kg/K)
transmittance (τ1)0.85
Table 2. Thermo-physical properties of the PV/T-PCM system [34].
SystemMaterialsλ (W m−1 K−1)ταεδ (mm)C (kJ kg−1K−1)ρ (kg/m3)Melting Temperature (Tm) (°C)Enthalpy (kJ/kg)
PV/T-PCMGlass10.910.050.9232500
Solar cell1480.090.80.3
PCM0.45Case dependent2.53138045226
Backplane1440.00040.40.5
Air cavity10
Insulation (EPS)0.035201.330
Ceiling0.920
Table 3. Baseline case of PV/T system.
Diameter (m)Mass Flow Rate (kg/s)Inlet Cooling Water Temperature (°C)Thickness of PCM (mm)
0.150.251520
Table 4. Time−wise results of diameter study.
Diameter (m)QT (kWh)QT’ (kWh)QP (kWh)Qpump (kWh)Qfan (kWh)Equivalent Overall Output Energy QE (kWh)
0.15532115803084286696
0.30611115813022287642
0.670201581309288583.5
Table 5. Time−wise results of mass flow rate study.
Mass Flow Rate (kg/s)QT (kWh)QT’ (kWh)QP (kWh)Qpump (kWh)Qfan (kWh)Equivalent Overall Output Energy QE (kWh)
0.25532015803084286696
0.5092631580363202810062
1.001613015804912602814613
Table 6. Time−wise results of inlet cooling water temperature study.
Inlet Cooling Water Temperature (°C)QT (kWh)QT’ (kWh)QP (kWh)Qpump (kWh)Qfan (kWh)Equivalent Overall Output Energy QE (kWh)
15.00532015803084286695
20.00266015802684284025
25.00177315801984283120.5
Table 7. Time−wise results of PCM thickness study.
PCM Thickness (mm)QT (kWh)QT’ (kWh)QP (kWh)Qpump (kWh)Qfan (kWh)Equivalent Overall Output Energy (QE) (kWh)
20.00532015803084286695
30.00685315804684288268
40.00820015805384289632.5
Table 8. Parameters and corresponding levels.
CodeFactorsLevel 1Level 2Level 3
ADiameter (m)0.150.30.6
Bmass flow rate (kg/s)0.250.51
CInlet cooling water temperature (°C)101520
DThickness of PCM (mm)203040
Table 9. Taguchi L9 (34) standard orthogonal array.
Number of TestABCD
11111
21222
31333
42123
52231
62312
73132
83213
93321
Table 10. Taguchi L9 (34) experimental plan.
Number of TestABCD
10.150.251020
20.150.51530
30.1512040
40.30.251540
50.30.52020
60.311030
70.60.252030
80.60.51040
90.611520
Table 11. SN ratio for each case in the trial experiment.
Experimental NumberABCDQE (kWh)S/N Ratio
1.001.001.001.001.00540574.66
2.001.002.002.002.0010,07080.06
3.001.003.003.003.0018,07085.14
4.002.001.002.003.00549074.80
5.002.002.003.001.0010,51080.43
6.002.003.001.002.0019,80085.93
7.003.001.003.002.00555074.89
8.003.002.001.003.0010,68080.57
9.003.003.002.001.0020,69086.32
Table 12. Response table for QE.
LevelABCD
S/N ratio1.0079.9574.7880.3980.47
2.0080.3980.3580.5080.30
3.0080.5985.8080.1580.17
Δ (max-min)12.190.6411.010.350.30
Contribution ratio (%) 5.2289.532.812.43
Rank 2134
Table 13. Taguchi method−ANOVA analysis of equivalent overall output energy.
Control FactorsDegree of Freedom (DF)Sum of Squares (SS)Mean of Squares (MS)FPPercentage Contributions (%)
Diameter (m)2.000.640.325.250.0825.60
mass flow rate (kg/s)2.00181.9590.981480.600.0073.98
Inlet cooling water temperature (°C)2.000.110.061.000.440.19
Thickness of PCM (mm)2.000.140.071.100.420.23
All other/error4.000.20.06
Total8182.84

