Article

Evaluation of the Nitrous Oxide Emission Reduction Potential of an Aerobic Bioreactor Packed with Carbon Fibres for Swine Wastewater Treatment

1
Animal Waste Management and Environment Division, NARO Institute of Livestock and Grassland Science, Tsukuba, Ibaraki 305-0901, Japan
2
Research Institute for Livestock Science, Okayama Prefectural Technology Center for Agriculture, Forestry and Fisheries, Misakicho, Okayama 709-3494, Japan
3
Institute of Science and Engineering, Kanazawa University, Kanazawa, Ishikawa 920-1192, Japan
*
Author to whom correspondence should be addressed.
Energies 2019, 12(6), 1013; https://doi.org/10.3390/en12061013
Submission received: 15 February 2019 / Revised: 6 March 2019 / Accepted: 11 March 2019 / Published: 15 March 2019
(This article belongs to the Special Issue Recent Research Progress for Energy Policy)

Abstract

:
Nitrous oxide (N2O) is a potent greenhouse gas that is emitted from wastewater treatment plants. To reduce emissions of N2O from swine wastewater treatment plants, we constructed an experimental aerobic bioreactor packed with carbon fibres (ca. 1 m3 bioreactor) as an alternative to conventional activated sludge treatment. The N2O emission factor for the aerobic bioreactor packed with carbon fibres (CF) was 0.002 g N2O-N/g TN-load and the value for the typical activated sludge (AS) reactor was 0.013 g N2O-N/g TN-load. The CF treatment method achieved more than 80% reduction of N2O emissions, compared with the AS treatment method. The experimental introduction of a CF carrier into an actual wastewater treatment plant also resulted in a large reduction in N2O generation. Specifically, the N2O emission factors decreased from 0.040 to 0.005 g N2O-N/g TN-load following application of the carrier. This shows that it is possible to reduce N2O generation by more than 80% by using a CF carrier during the operation of an actual wastewater treatment plant. Some bacteria from the phylum Chloroflexi, which are capable of reducing N2O emissions, were detected at a higher frequency in the biofilm on the CF carrier than in the biofilm formed on the AS reactor.

1. Introduction

Greenhouse gases, such as carbon dioxide (CO2), methane (CH4) and nitrous oxide (N2O), are emitted from wastewater treatment plants. These gases enhance the warming of Earth’s surface. In particular, N2O is a potent greenhouse gas that accounts for 7.9% of global anthropogenic greenhouse gas emissions; it has an approximately 300-fold stronger effect than CO2 over a 100-year period [1]. N2O is produced during biological nitrogen conversions in wastewater treatment plants. Most soluble nitrogen in wastewater exists as ammonium ions (NH4+). NH4+ is oxidized to nitrite ions (NO2) and nitrate ions (NO3) under aerobic conditions and these are reduced to N2 gas under anoxic conditions by microorganisms. During denitrification, unlike nitrification, N2O is a regular intermediate. If denitrification occurs completely, N2O becomes N2 gas and the release of N2 gas to the atmosphere removes nitrogen from the reaction tank. N2 gas is not a greenhouse gas (GHG); therefore, converting these ions into N2 gas is important. Nitrification and denitrification progress smoothly in the environment when conditions encourage the growth of microbes. However, N2O emissions often increase when nitrification and denitrification are inhibited by water temperature, dissolved oxygen (DO) concentrations or organic matter concentrations [2,3]. In the conventional wastewater treatment process, nitrification and denitrification proceed simultaneously in a single tank, so it is not clear which reaction is the principal cause of emissions of N2O. In practice, it is known that N2O emissions increase to accumulate nitrite (NO2) or nitrate (NO3) in both the nitrification and denitrification stages [2,4]. In the current study, N2O gas from wastewater treatment using the activated sludge process was monitored for one year. Kosonen et al. reported annual N2O emissions of 168 g/PE/year and 0.019 g N2O-N/g N load from a fully covered underground wastewater treatment plant [5]. Daelman et al. reported N2O emissions of 0.028 g N2O-N/g N load from a full-scale municipal wastewater treatment plant [3]. The N2O emission factor for the treatment of swine wastewater is 0.0287 g N2O-N/g N load according to the 2015 National GHG Inventory Report of Japan (NIES 2015) [6]. The N2O emission factor of the activated sludge process has a similar value regardless of the category of the industry.
Among the current reports that describe technology for reducing N2O in the field of wastewater treatment, Sun et al. reported that the oxidation ditch process is a more effective method for N2O reduction from wastewater treatment than the anoxic-oxic process and sequencing batch reactor. The emission factor of the oxidation ditch process was 0.0025 N2O-N/g N load [7]. Their report indicates that to encourage denitrification, it is necessary to control DO concentration at an appropriate level and raise the rate of organic matter utilization in influent. Massara et al. reported that there are several N2O mitigation strategies. In these strategies, operators select the optimal operational conditions such as aeration rate and DO. Wastewater treatment operates at an optimal combination of pH 7 and water temperature of 20 °C. It uses models to predict the N2O hotspots [8]. Santín also reported that it is important to control the DO for N2O reduction [9]. Zhang et al. reported that the N2O emission from synthetic nitrogen-rich wastewater could be reduced by four-tenths by using mannitol as the carbon source [10]. Meanwhile, in the field of livestock wastewater treatment, in particular, only a few such reports are available [11,12,13].
Consequently, we utilized biofilms to develop treatment methods capable of reducing N2O emissions. We expected redox reactions in the biofilm method to be different from those in the activated sludge (AS) method. The biofilm method proposed in this study involves the use of carriers where microbes can attach and consequently enhance wastewater treatment. Carbon fibres (CFs) were employed as the carrier here because microbes adhere thickly to CFs and remain on them for longer durations and at higher biomass concentrations than what is possible in the AS method. The biofilms grown on CFs become thick and they can hold both aerobic microorganisms and anaerobic microorganisms. The CFs expand by themselves when soaked in water. Biofilms form on these expanded CFs and assist in the treatment of wastewater using the AS method. In a previous laboratory-scale test, in which we investigated an aeration tank fixed with a CF carrier during AS treatment of swine wastewater effluent, we successfully reduced the N2O emissions by more than 60–90% compared to those generated by a system not fixed with the carrier [4,13]. The biochemical oxygen demand (BOD) treatment performance in this test was, at a minimum, on par with that of a device not filled with the carrier and the accumulation of NO3 and NO2 ions in the treated water was remarkably low. Thus, the proposed system was able to substantially reduce N2O emissions and improve the wastewater treatment performance [4].
In this study, with the goal of enabling practical use of the technology, firstly, to determine the reproducibility of N2O emission reduction from a full-scale swine wastewater treatment plant, we investigated the performance of an aerobic bioreactor packed with CFs (ca. 1 m3 bioreactor), as an alternative to conventional AS treatment under conditions that involved fluctuating water temperatures. Furthermore, we performed an experiment that verified, as shown by previous results, that inserting a CF carrier into an actual wastewater treatment plant can reduce the generation of N2O during six months of operation.

2. Materials and Methods

2.1. Bioreactor Construction and Operation

The experiments were performed in a wastewater treatment plant at a swine farm (~6000 heads) located in Okayama Prefecture, Japan. Figure 1 shows the treatment flow of this plant. The plant, which performs continuous aeration, uses the membrane bioreactor (MBR) method for wastewater treatment. For details of the operating conditions of this plant and the quality of the treated water, see the report by Osada et al. [14]. In this study, two experiments were performed; namely, a comparison experiment using a 1 m3 scale bioreactor and an experiment conducted by directly inserting the carrier into the actual plant.
The operating characteristics of the aerobic bioreactor are shown in Table 1. We first used equipment with a 1 m3 capacity for wastewater to perform an initial experiment to collect data useful for demonstrating the performance of the system (Figure 2). One aerobic bioreactor was packed with carbon fibres (CF reactor) and a second was mixed with activated sludge (AS reactor). The influent used was the effluent from the primary clarifier 1 in the wastewater treatment plant. The flow rate of the influent was approximately 30 L/day. The hydraulic retention time (HRT) was calculated to be about 23 days and the BOD loading rate was 0.43 kg/m3/day. The experiment was performed outdoors, so the water temperature fluctuated. The aeration rate in both the CF reactor and the AS reactor was 6 m3/h. Effluent from the bioreactors was collected as supernatant liquid in the secondary tanks. Samples of bioreactor influent and effluent were collected once per week and BOD, chemical oxygen demand (COD), suspended solids (SS), total nitrogen (TN), NH4-N, NO2-N, NO3-N, total phosphorus (TP) and pH were measured. Diurnal fluctuations in water temperature and dissolved oxygen (DO) in the liquid layer of the aerobic bioreactors were also measured. The amount of mixed liquor suspended solids (MLSS) was measured once per week. In addition, concentrations of N2O in the emissions from the reactors were measured.
For the N2O generation reduction experiment performed by introducing CFs into the actual plant, the CF carrier was placed in a portion of aeration tank 2 of the treatment plant. The CFs (T700SC-24000, Toray Industries, Inc., Tokyo, Japan), shown in Figure S1, were cut to a length of 50 cm and 20 units of carriers with 300 of these attached in parallel at intervals of 1 cm were installed. The quantity of the GHG generated was monitored for six months. The operating conditions of the treatment plant during the experimental period were as follows. The flow rate of the influent was 20 m3/day. The HRT was calculated to be 37 days and the BOD loading rate was 0.3 kg/m3/day. The aeration rate in the aeration tank was 15 m3/min. The gas was measured in accordance with the method reported by Osada et al. [14] and the water quality was analysed using the same method described above; these methods are described briefly in the next section.

2.2. Analytical Methods for Determining Water Quality and Measuring N2O Emissions

Water temperature was measured with a TR-72 temperature and humidity data logger (T&D Corporation, Nagano, Japan). The DO was measured with a YSI 626281 ProODO Optical Dissolved Oxygen Meter (Xylem Japan [YSI/Nanotech, Ltd.], Kanagawa, Japan). These measurements were taken at a depth of 30 cm below the water surface. The pH was determined with a glass electrode. The BOD was determined by a modified procedure using sodium azide and COD was determined by heating with potassium permanganate for 30 min. The SS was assessed according to Standard Methods for the Examination of Water and Wastewater [15] by using glass-fibre filters. The TN was determined by using an ultraviolet spectrophotometric method. Statistical analyses were conducted with the R Statistical Computing Environment version 3.1.1. The results were reported as the mean and standard deviation (SD). The concentrations of NH4-N, NO2-N and NO3-N were determined by the Bremner method. N2O emissions from the reactor were measured at 10-min intervals with an Innova 1312 Multi Gas Monitor (LumaSense Technologies, Santa Clara, CA, USA).

2.3. Characterization of Bacterial Species

Next-generation sequencing was performed by using the MiSeq Illumina sequencing platform (Illumina Inc., San Diego, CA, USA) on the V4 region of the 16S rRNA gene [16]. After the bioreactor was operated with the swine wastewater for four months, a portion of the CF was sampled. This CF material was extensively washed with distilled water until visible biofilms were washed out. Then, the washed portion of the fibre was cut off and the genomic DNA of the bacteria tightly attached to the fibre was extracted with an UltraClean™ Soil DNA Isolation Kit (Mo Bio Laboratories, Carlsbad, CA, USA). Libraries were constructed from bacterial genomic DNA via a polymerase chain reaction using 563F and 802R primers, which included Illumina overhang adapter sequences. The libraries were sequenced on a 300PE MiSeq run and paired-end read data were processed with QIIME software [17]. The read sequences were joined, quality-checked and clustered into operational taxonomic units (OTUs) via the Uclust method [18]. After a chimera check, taxonomic classification, rarefaction curves and alpha diversity indices were computed with QIIME.

3. Results

3.1. Water Quality and Gas Emissions from the Bioreactor

The average water qualities of the influent and effluent during bioreactor operation are shown in Table 2. The MLSS amount was approximately 8000 mg/L in both the AS and the CF reactors. The average BOD, SS, COD and TN removal efficiencies in the AS reactor were 99.8%, 99%, 97%, 88%, respectively. Dissolved inorganic nitrogen (DIN) removal as NH4-N was an average of approximately 1400 mg/L in the AS reactor and the average NO3-N and NO2-N accumulated was 282 mg/L. The average BOD, SS, COD and TN removal efficiencies in the CF reactor were 99.8%, 99%, 97%, 89%, respectively. DIN removal as NH4-N was an average of approximately 1400 mg/L in the CF reactor and the average NO3-N and NO2-N accumulated was 195 mg/L. A statistically significant difference (p < 0.05) between the AS and CF reactors was observed in terms of the accumulation of NO3 and NO2 (Figure 3). The range of pH in the AS reactor was 5.9 to 8.0 and the range of pH in the CF reactor was 6.9 to 7.9. The pH of the AS reactor tended to decrease during the accumulation of NO3 and NO2. The average DO was 1.3 mg/L in the AS reactor and 2.0 mg/L in the CF reactor. The average water temperature was 23.8 ± 5.7 °C in the AS reactor and 24.1 ± 5.3 °C in the CF reactor.
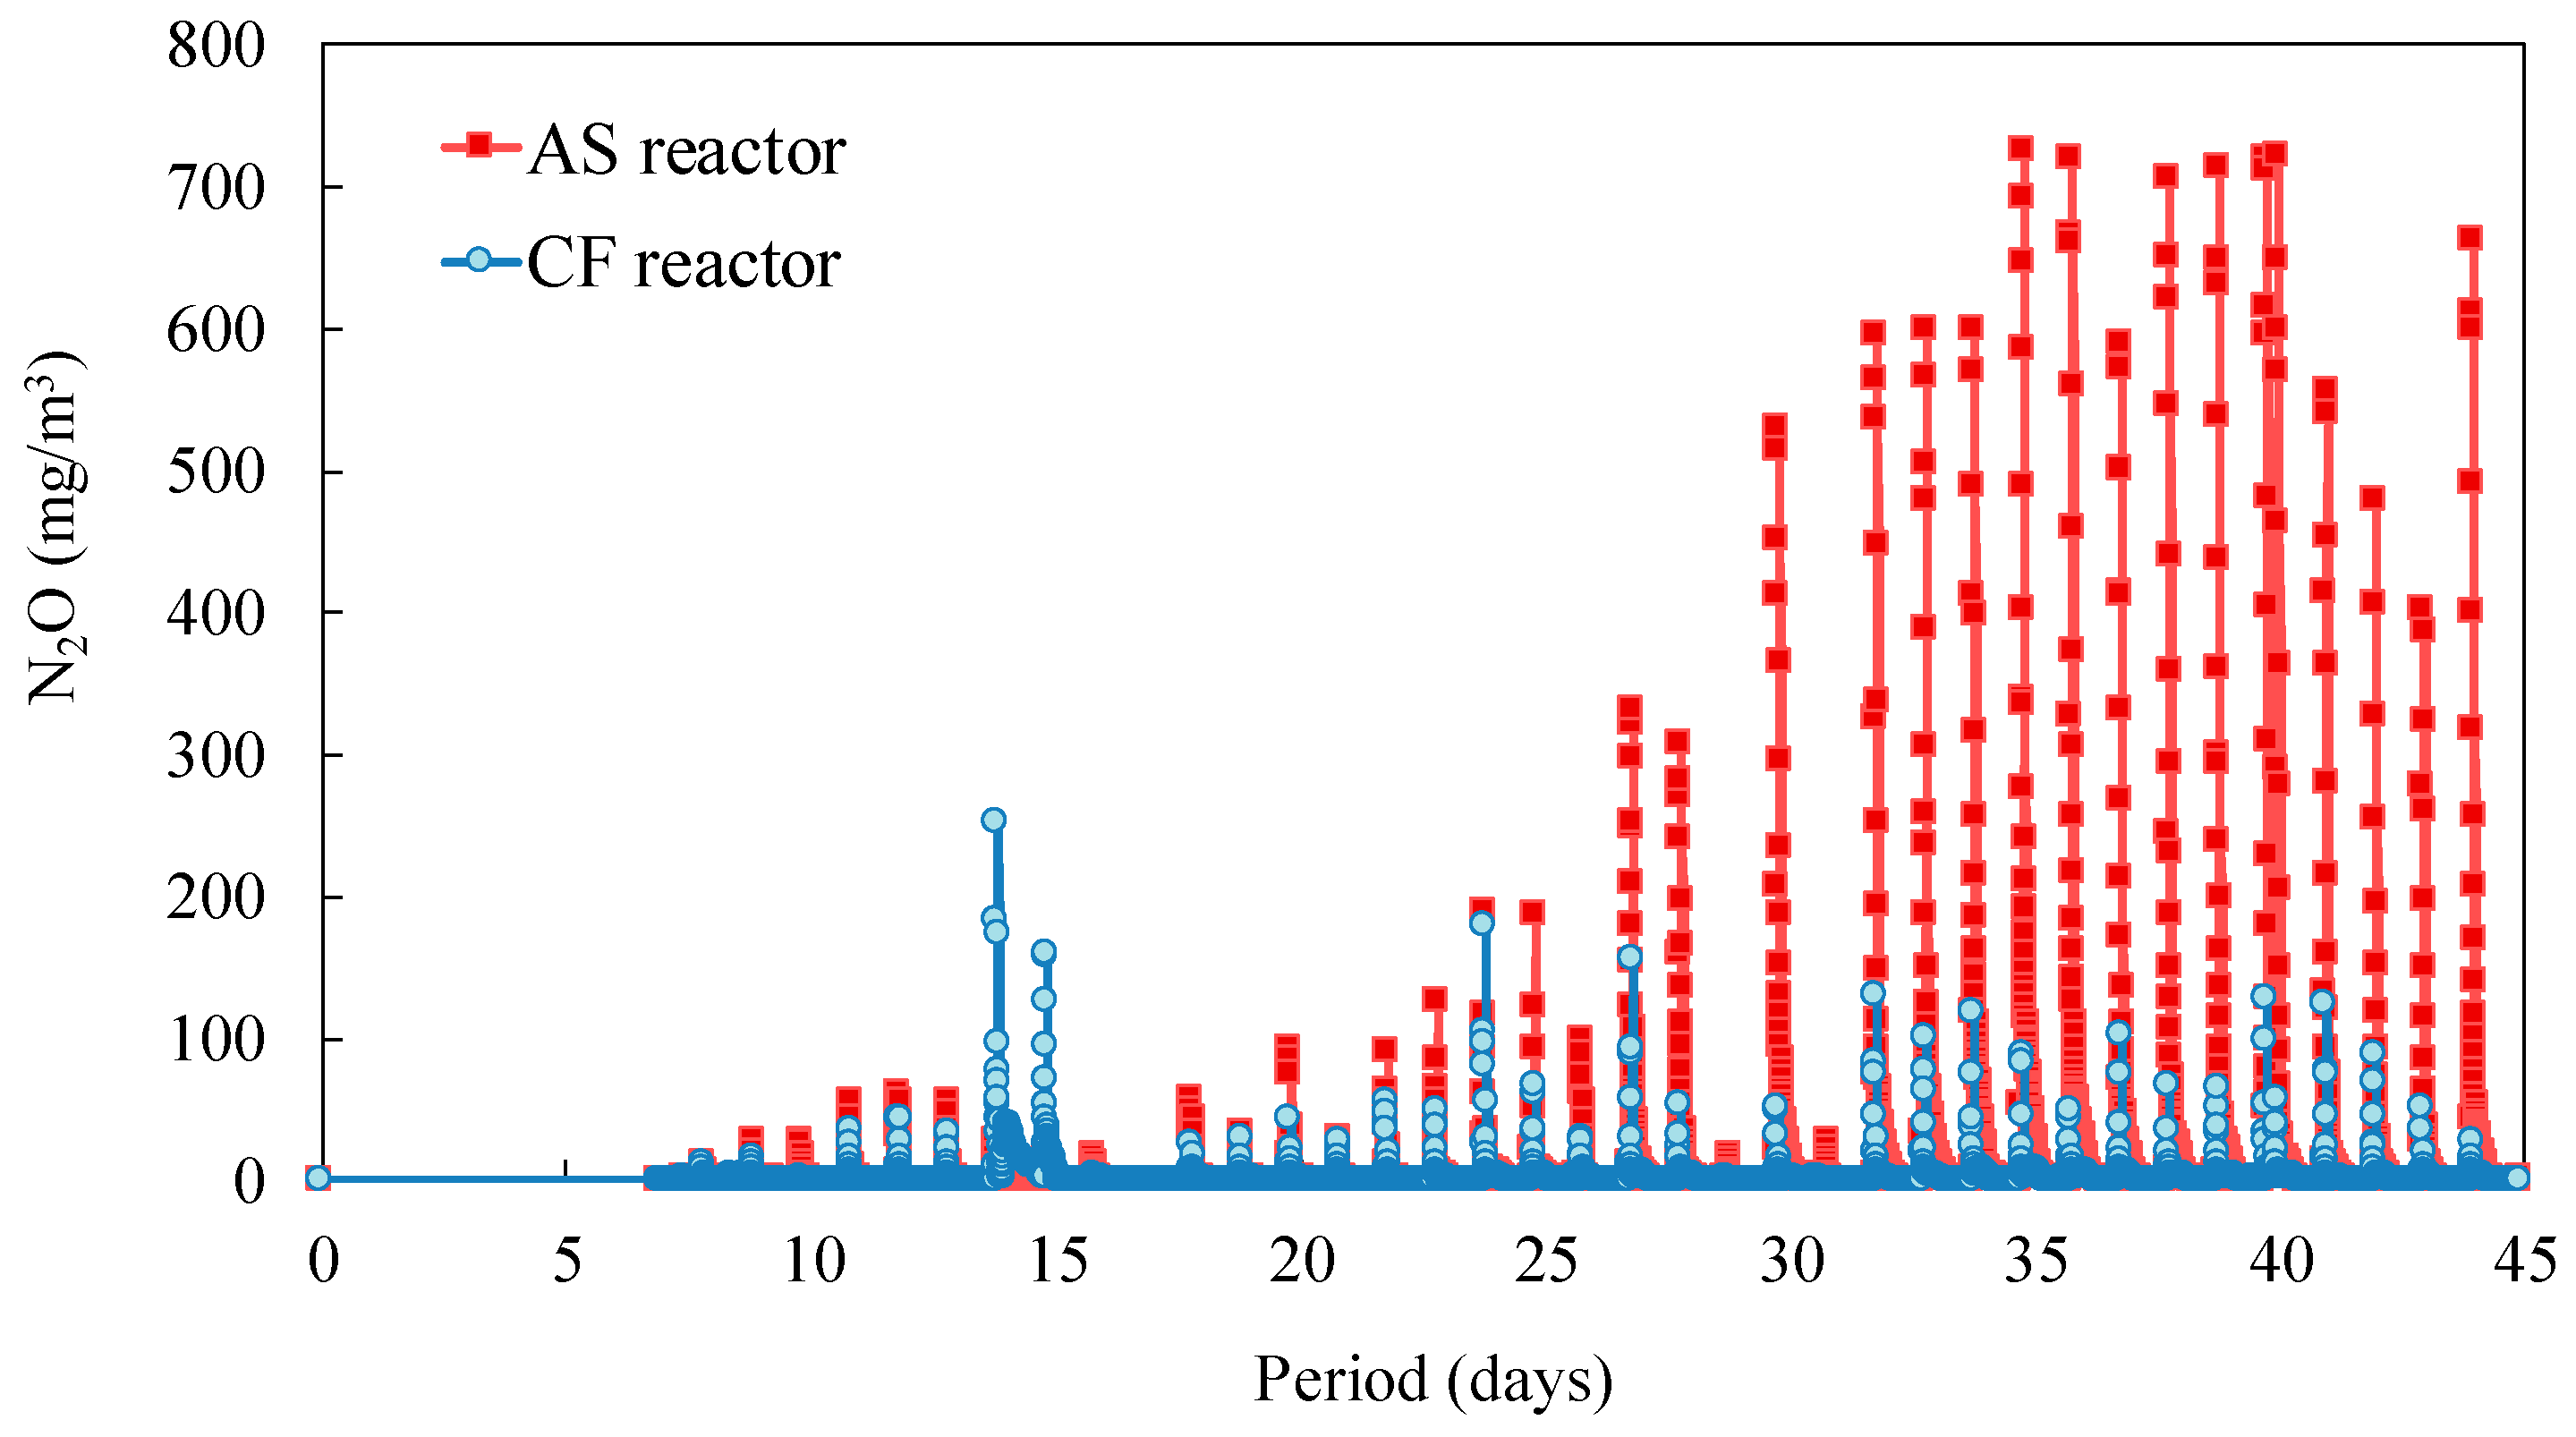
In situ measurements of N2O emissions from the AS and CF reactors during operation are shown in Figure 4. The gas emissions from the AS reactor amounted to 1824 mg/day of N2O. The gas emissions from the CF reactor amounted to 270 mg/day of N2O. Thus, the N2O emissions from the AS reactor were significantly higher than those from the CF reactor. The global warming potential (an index for the contribution of atmospheric GHGs to global warming) was calculated in accordance with Intergovernmental Panel on Climate Change (IPCC) 2013 statutes [19], considering CO2 eq; the values obtained were 1 for CO2 and 298 for N2O. The N2O emissions from the AS and CF reactors were determined to be 777 and 115 g CO2 eq/m3·day, respectively. The N2O emission factors were 0.013 g N2O-N/g TN-load and 0.002 g N2O-N/g TN-load in the AS and CF reactors, respectively. These data indicate that more than 80% of N2O emissions from the swine wastewater treatment process could be inhibited by using the CF reactor instead of the AS reactor.

3.2. Bacterial Community Structure of the Biofilms in the Bioreactor

Bacterial community analyses of the samples collected from the AS reactor (AS), the biofilms adhering to the surfaces of the CFs in the CF reactor (CF-biofilm (SL)) and the biofilms adhering to the inside of the CFs in the CF reactor (CF-biofilm (DL)) were performed. In all samples, Planctomycetes and Chloroflexi were detected at high frequencies (27–32% and 15–27%, respectively) and Proteobacteria and Bacteroidetes were the second most abundant types present (8–14% and 5–10%, respectively) (Figure 5). Chloroflexi was more abundant in the biofilms of the CF reactor (23–27%) than in the AS (15%) but no other significant differences were detected in the comparisons between the AS and the biofilms of the CF reactor. In the order-to-genus level analysis (Figure 6), the genus Planctomyces was observed at a higher frequency in the CF-biofilm (SL) sample (12%) than in the AS sample (7%). The phylum Chloroflexi occurred at higher frequencies in the CF-biofilm (SL) and CF-biofilm (DL) samples (18–27%) than in the AS sample (13%), and, especially, the family Caldilineaceae was observed at a significantly higher frequency in the CF-biofilm (SL) sample (16%) than in the AS sample (5%). The order envOPS12 was observed at a significantly higher frequency in the CF-biofilm (DL) sample (7%) than in the AS sample (1%). The family Chthonomonadaceae was observed at a higher frequency in the CF-biofilm (SL) sample (4%) than in the AS sample (1%). Additionally, the order WD2101 and the family Cytophagaceae were observed at significantly higher frequencies in the AS sample (6% and 4%, respectively) than in the CF-biofilm (SL) and CF-biofilm (DL) samples (2–3% and 1%, respectively).

3.3. N2O Generation Reduction Following Introduction of Carbon Fiber into the Actual Plant

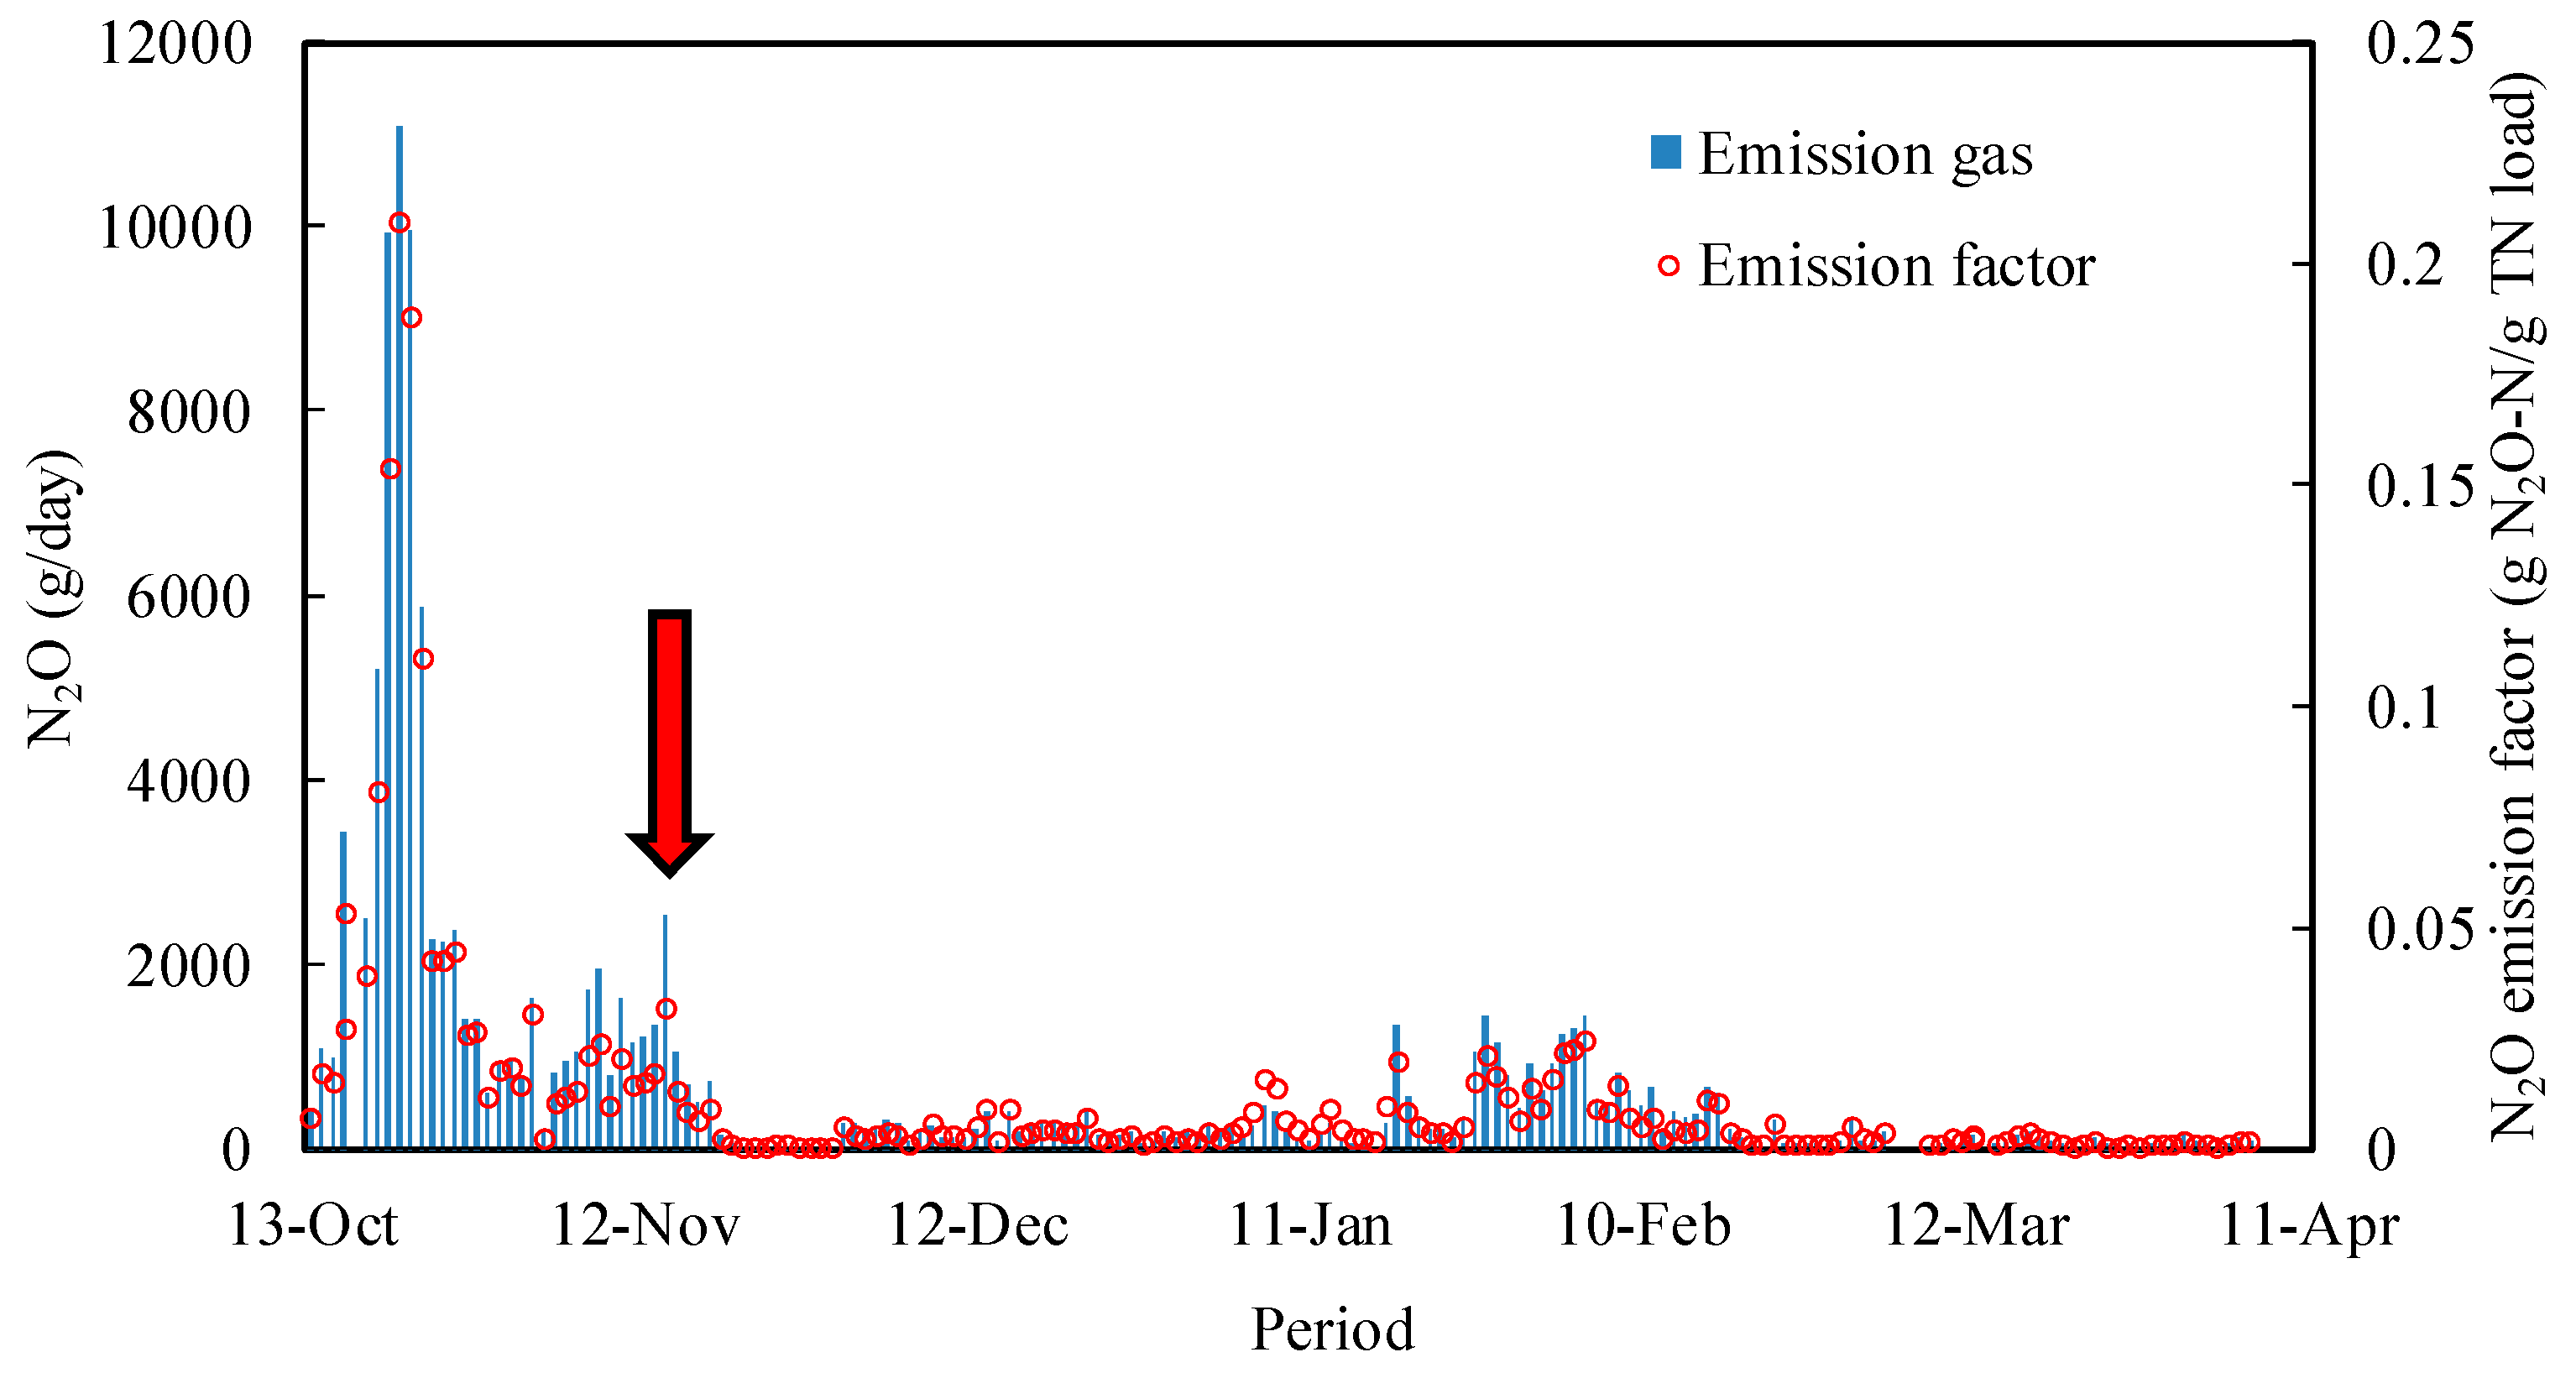
The CF carrier was inserted into the actual wastewater treatment plant and the quantities of GHG generated were monitored. The average DO, water temperature and pH in the wastewater treatment plant during the monitoring period were 4.4 ± 1.7 mg/L, 21.8 ± 4.0 °C and 7.4–8.2, respectively. The average TN was 2132 ± 545 mg/L in the influent and 157 ± 31 mg/L in the effluent (the treated wastewater). The average quantity of N2O generated prior to CF carrier insertion was 2500 g/day; following CF carrier insertion, the average was reduced to less than 300 g/day (Figure 7).
The N2O emission factors decreased from 0.040 to 0.005 g N2O-N/g TN-load following application of the carrier. Conversely, methane and ammonia gas, which were also monitored during the period of the experiment, showed no significant differences between the results before and after insertion of the CF carrier (Figures S2 and S3).

4. Discussion

The AS method is the treatment method that is generally applied in wastewater treatment plants. This method involves feeding air to floc-like AS to remove organic matter from the wastewater. An aerobic environment exists within the aeration tank. Therefore, NH4+ in the wastewater is converted to NO3 and NO2 by nitrification under the aerobic conditions but in many cases, most of these ions are not denitrified. It is possible to encourage denitrification to remove nitrogen by performing intermittent aeration but because the organic material removal capacity achieved by intermittent aeration is inferior to that of the continuous aeration method, it can be stated that the method is not suited for wastewater treatment plants with high BOD loads or wastewater treatment plants that treat source water such as swine wastewater with high organic matter concentrations. On the other hand, Sabba et al. reported that nitrate reduction occurs when the O2 concentration approaches zero in the case where biofilm thickness is below 320 μm and conditions are aerobic [20]. The formation of thick biofilms (the thickness was >1 mm) by the CF carrier creates an ecological niche in both the aerobic region and the anaerobic region. Nitrifying bacteria that prefer aerobic conditions and denitrifying bacteria that prefer anaerobic conditions coexist in a single tank and the microorganisms mature under conditions that minimize external stress, thus resulting in restriction of the generation of excess N2O. Hence, less N2O is generated than in the case of AS treatment. Moreover, the CF reactor utilized in this study can treat organic matter up to levels handled by the AS reactor. In addition, the CF reactor has improved wastewater treatment functions because of the reduced amounts of NO3 and NO2 remaining in the treated water. Judging from the gas emission measurement results, more than 80% of the N2O emissions from the swine wastewater treatment process were inhibited by using the CF reactor instead of the AS reactor. This suggests that treatment without the accumulation of NO3 and NO2 is important for N2O emission reductions.
According to the results of the microbial community analyses, microbial communities that contributed to nitrogen removal were detected from the biofilms of the CF reactor in larger quantities than in the AS reactor. Caldilinea aerophile, of the family Caldilineaceae and belonging to the phylum Chloroflexi, are multicellular filamentous organisms that are capable of fermentative metabolism and O2 respiration [21,22]. The genus Caldilinea is affiliated with Eikelboom type 0803 [23]. Eikelboom types are filamentous bacteria that have been isolated from AS [24,25]. Sanford et al. indicated that a part of the phylum Chloroflexi is capable of N2O to N2 reduction [26]. As bacteria of the phylum Chloroflexi were more significantly detected in the CF-biofilm than in AS, it implies that the phylum Chloroflexi contributed to reducing N2O emission to adhere within the CF carrier. In addition, the order envOPS12, which belongs to the phylum Chloroflexi, has been found in a wide range of anaerobic environments, such as freshwater, sediments, marine water, sponges, anaerobic sludge bioreactors and anammox reactors [27,28]. Because envOPS12 grows in anaerobic conditions, it was hypothesized that a large quantity of envOPS12 was detected because the CF-biofilm (DL) was in an anaerobic condition. Certain members of the phylum Planctomycetes, which are conventional ammonia oxidizers, oxidize NH4+ and NO2 to N2 [29]. The genus Planctomyces is capable of oxidizing NH4+ under anaerobic conditions, such as by anammox [30]. More bacteria of the genus Planctomyces were detected in the CF-biofilm than in AS, which suggests that this microbial community might have contributed to the removal of nitrogen. The family Chthonomonadaceae belongs to the phylum Armatimonadetes, which includes aerobic bacteria that have been isolated from geothermally heated soil [31]. The CF-biofilm (SL) sample was taken from the surface of the CF, so it was hypothesized that the family Chthonomonadaceae bacteria detected there proliferated in an aerobic condition. However, this group was almost completely undetected in the AS sample regardless of aerobic conditions. The family Cytophagaceae belongs to the phylum Bacteroidetes, which consists of heterotrophic and mostly aerobic bacteria that engage in primarily respiratory metabolism [32]. The order WD2101 was recently assigned to the order Tepidisphaerales. The order Tepidisphaerales consists of moderately thermophilic and facultative aerobic bacteria that have been isolated from terrestrial hot springs [33]. It is thought that the above-described family Cytophagaceae and the order WD2101 were detected at higher levels in the AS treatment because the entire interior of the tanks in this treatment comprised an aerobic environment.
It can be assumed that the generation of the GHG N2O is related to a variety of causes, not only in the livestock industry but also in all wastewater treatment operations [2]. Wunderlin et al. [34] reported on the generation of N2O in experimental studies of both the nitrification reaction (aerobic conditions) and the denitrification reaction (anaerobic conditions) in municipal wastewater treatment operations and it was thought that the two reactions interacted in the tank to generate N2O. As noteworthy causes of the generation of N2O in tanks, the DO concentration, COD/N ratio and pH are often cited. The DO concentration in a tank is an important parameter that controls the generation of N2O [35] and it is thought that limiting the DO concentration during the nitrification reaction may lead to the generation of N2O by the reaction pathway of denitrification (reduction), rather than by the oxidization pathway by nitrifying bacteria [36]. In the denitrification reaction, oxygen restricts the synthesis and activation of denitrification enzymes but because nitrous oxide reductase reacts with and is restricted more sensitively by oxygen than other enzymes, it has been pointed out that even if the oxygen concentration is low, generation of N2O might be encouraged during the denitrification reaction process [37]. The COD/N ratio is another parameter that plays an important role in restricting the generation of N2O. It is known that if the biodegradable organic matter concentration in the denitrification reaction decreases, more N2O is generated [38]. Hanaki et al. [39] reported that N2O emitted 10% of the maximum nitrogen load at the lowest COD/N ratio; this result was based on denitrification experiments conducted for a variety of COD/NO3-N ratios (1.5, 2.5, 3.5 and 4.5). In addition, Park et al. [40] reported that adding methanol as a source of organic carbon effectively suppresses the generation of N2O. For this reason, it can be considered that treatment accompanied by control of the COD/N is important for reducing the generation of N2O. In this study, the COD/N of the wastewater was approximately two but use of the CF carrier encouraged denitrification and thus successfully helped to reduce the generation of N2O below that of the AS system. The other parameter assumed to play an important role in reducing the generation of N2O is pH. Thörn et al. [41] reported that N2O was generated during the denitrification process only when the pH was lower than 6.8. Additionally, Hanaki et al. [39] reported N2O being generated by the denitrification reaction when the pH was reduced from 8.5 to 6.5. In this study, the range of pH in the AS reactor was 5.9 to 8.0 and the range of pH in the CF reactor was 6.9 to 7.9. In the AS reactor, there was a time when the pH was lower than 6.8, so this result supports the aforementioned reports. The accumulation of nitrite ions and nitrate ions likely contributed to the low pH. In this study, in the AS and CF reactors, these components accumulated at an average of 282 and 195 mg/L NO3-N and NO2-N, respectively. The environment in the AS reactor was more aerobic than that in the CF reactor, so nitrite ions and nitrate ions accumulated easily in the AS reactor and the pH tended toward acidity. During AS treatment of municipal wastewater, the pH inside the reaction tanks typically varies around seven, so the above issue is not a concern but in the treatment of swine or dairy wastewater, the nitrogen concentration is high and the resulting nitrate ions and nitrite ions accumulate easily, which often leads to pH values lower than six. Therefore, it is important to observe carefully for any change of pH while operating such a system.
The results of the test with the CF carrier inserted into an actual treatment plant demonstrated the successful large-scale reduction of the generated N2O from 0.040 to 0.005 g N2O-N/g TN-load. A large quantity of N2O was generated before the CF carrier was inserted and according to the report by Osada et al. [14], referred to above, the N2O emission factor of this treatment system (Okayama 1) was 0.029 g N2O-N/g TN-load using this estimated value. We showed that it is possible to reduce the generation of N2O by more than 80% by using the CF carrier. In this experiment, the results were obtained after the placement of the carrier in a portion of the aeration tank, which did result in reduction of the generated N2O, thus clearly showing the important role of the CF carrier. With regard to water quality, no conspicuous nitrite and nitrate ion accumulation reduction effects were found. The likely reason for this observation is that the carrier was placed in only about 10% of the volume of the reaction tanks of the treatment system, so a sufficient anaerobic environment could not form, which prevented denitrification. Therefore, it is presumed that if the anaerobic environment inside the tank could be improved by increasing the volume of CF placed, denitrification would be encouraged and this would reduce the accumulation of nitrite ions and nitrate ions. It was feared that inserting the CF carrier into an actual plant could harm plant operations but no particular troubles, such as clogging of pipes, mechanical failure of operating machinery, deterioration of the sludge or reduction of water quality, occurred during the experiment. The results of this study confirm that applying CFs in actual plants will not cause any problems.

5. Conclusions

With the goal of implementing technologies to reduce greenhouse gas (GHG) emissions to prevent global warming, we demonstrated a reduction in GHG emissions from a swine wastewater treatment plant following introduction of carbon fibre (CF) carrier equipment. The CF method has a biochemical oxygen demand (BOD) removal performance equal to that of the activated sludge (AS) method and its nitrogen removal performance was found to be superior to that of the AS method. The CF method also reduced the emissions of N2O, a strong GHG. Similar to the results of past reports, the N2O generation reduction effect was high and the results were clearly very reproducible. In the bacterial community structure analysis, some bacteria from the phylum Chloroflexi, which are capable of reducing N2O, were detected at a relatively high frequency in the biofilm on the CF carrier. This study also demonstrated that introducing a CF carrier into an actual plant can result in reductions of N2O emissions. The results of both experiments also show that it is possible to reduce N2O emissions by more than 80% by using a CF carrier. The CF method can be implemented in operational wastewater treatment plants without the need for accompanying special equipment. This reduces the initial investment cost. The CF method is, therefore, likely to be adopted for use in livestock farms and other areas. In the future, to reduce GHG emissions and improve water quality further, it will be necessary to verify the effectiveness of CF carriers under broader conditions.

Supplementary Materials

The following are available online at https://www.mdpi.com/1996-1073/12/6/1013/s1, Figure S1: Photograph of the carbon fibre carriers, Figure S2: Time series of gas concentrations of CH4 in the wastewater treatment plant for the swine farm. The time at which the carbon fibre carriers were applied is indicated by the red arrow, Figure S3: Time series of gas concentrations of NH3 in the wastewater treatment plant for the swine farm. The time at which the carbon fibre carriers were applied is indicated by the red arrow.

Author Contributions

Conceptualization, T.Y. and R.Y.-I.; methodology, T.Y. and T.O.; validation, M.S.; formal data analysis, A.O. and T.O.; experimental analysis, T.Y. and H.Y.; writing, T.Y. All authors read and approved the final manuscript.

Funding

This research was funded by the Ministry of Agriculture, Forestry and Fisheries of Japan, via a commissioned project, named “Development study for the mitigation measures for climate change in Livestock sector”.

Acknowledgments

We thank Takeshi Mizuki and Mieko Yoshida for their skilful technical assistance with the experiments.

Conflicts of Interest

The authors declare no conflict of interest.

References

  1. Eggleston, H.S.B.L.; Miwa, K.; Ngara, T.; Tanabe, K. (Eds.) Chapter 10: Emissions from Livestock and Manure Management in Volume 4 Agriculture, Forestry and Other Land Use. In IPCC (Intergovernmental Panel on Climate Change), 2006 IPCC Guidelines for National Greenhouse Gas Inventories, Prepared by the National Greenhouse Gas Inventories Programme; IPCC: Kanagawa, Japan, 2006. [Google Scholar]
  2. Kampschreur, M.J.; Temmink, H.; Kleerebezem, R.; Jetten, M.S.M.; van Loosdrecht, M.C.M. Nitrous oxide emission during wastewater treatment. Water Res. 2009, 43, 4093–4103. [Google Scholar] [CrossRef] [PubMed]
  3. Daelman, M.R.J.; van Voorthuizen, E.M.; van Dongen, U.G.J.M.; Volcke, E.I.P.; van Loosdrecht, M.C.M. Seasonal and diurnal variability of N2O emissions from a full-scale municipal wastewater treatment plant. Sci. Total Environ. 2015, 536, 1–11. [Google Scholar] [CrossRef] [PubMed]
  4. Yamashita, T.; Yamamoto-Ikemoto, R.; Yokoyama, H.; Kawahara, H.; Ogino, A.; Osada, T. Mitigation of nitrous oxide (N2O) emission from swine wastewater treatment in an aerobic bioreactor packed with carbon fibers. Anim. Sci. J. 2015, 86, 358–368. [Google Scholar] [CrossRef] [PubMed]
  5. Kosonen, H.; Heinonen, M.; Mikola, A.; Haimi, H.; Mulas, M.; Corona, F.; Vahala, R. Nitrous Oxide Production at a Fully Covered Wastewater Treatment Plant: Results of a Long-Term Online Monitoring Campaign. Environ. Sci. Technol. 2016, 50, 5547–5554. [Google Scholar] [CrossRef]
  6. NIES. National Greenhouse Gas Inventory Report of Japan (NIR); Ministry of the Environment: Tokyo, Japan, 2015. Available online: http://www-gio.nies.go.jp/aboutghg/nir/nir-e.html (accessed on 21 July 2014).
  7. Sun, S.; Bao, Z.; Sun, D. Study on emission characteristics and reduction strategy of nitrous oxide during wastewater treatment by different processes. Environ. Sci. Pollut. Res. 2015, 22, 4222–4229. [Google Scholar] [CrossRef] [PubMed]
  8. Massara, T.M.; Malamis, S.; Guisasola, A.; Baeza, J.A.; Noutsopoulos, C.; Katsou, E. A review on nitrous oxide (N2O) emissions during biological nutrient removal from municipal wastewater and sludge reject water. Sci. Total Environ. 2017, 596–597, 106–123. [Google Scholar] [CrossRef]
  9. Santín, I.; Barbu, M.; Pedret, C.; Vilanova, R. Control strategies for nitrous oxide emissions reduction on wastewater treatment plants operation. Water Res. 2017, 125, 466–477. [Google Scholar] [CrossRef]
  10. Zhang, X.; Wang, X.; Zhang, J.; Huang, X.; Wei, D.; Lan, W.; Hu, Z. Reduction of nitrous oxide emissions from partial nitrification process by using innovative carbon source (mannitol). Bioresour. Technol. 2016, 218, 789–795. [Google Scholar] [CrossRef]
  11. Osada, T.; Kuroda, K.; Yonaga, M. Reducing nitrous oxide gas emissions from fill-and-draw type activated sludge process. Water Res. 1995, 29, 1607–1608. [Google Scholar] [CrossRef]
  12. Ikeda-Ohtsubo, W.; Miyahara, M.; Kim, S.W.; Yamada, T.; Matsuoka, M.; Watanabe, A.; Fushinobu, S.; Wakagi, T.; Shoun, H.; Miyauchi, K.; et al. Bioaugmentation of a wastewater bioreactor system with the nitrous oxide-reducing denitrifier Pseudomonas stutzeri strain TR2. J. Biosci. Bioeng. 2013, 115, 37–42. [Google Scholar] [CrossRef]
  13. Yamashita, T.; Shiraishi, M.; Yamamoto-Ikemoto, R.; Yokoyama, H.; Ogino, A.; Osada, T. Swine wastewater treatment technology to reduce nitrous oxide emission by using an aerobic bioreactor packed with carbon fibres. Anim. Prod. Sci. 2016, 56, 330–336. [Google Scholar] [CrossRef]
  14. Osada, T.; Shiraishi, M.; Hasegawa, T.; Kawahara, H. Methane, nitrous oxide and ammonia generation in full-scale swine wastewater purification facilities. Front. Environ. Sci. Eng. 2017, 11, 10. [Google Scholar] [CrossRef]
  15. Rice, E.W.; Bridgewater, L.; Association, A.P.H.; Association, A.W.W.; Federation, W.E. Standard Methods for the Examination of Water and Wastewater; American Public Health Association: Washington, DC, USA, 2012. [Google Scholar]
  16. Kozich, J.J.; Westcott, S.L.; Baxter, N.T.; Highlander, S.K.; Schloss, P.D. Development of a Dual-Index Sequencing Strategy and Curation Pipeline for Analyzing Amplicon Sequence Data on the MiSeq Illumina Sequencing Platform. Appl. Environ. Microbiol. 2013, 79, 5112–5120. [Google Scholar] [CrossRef] [PubMed] [Green Version]
  17. Caporaso, J.G.; Kuczynski, J.; Stombaugh, J.; Bittinger, K.; Bushman, F.D.; Costello, E.K.; Fierer, N.; Peña, A.G.; Goodrich, J.K.; Gordon, J.I.; et al. QIIME allows analysis of high-throughput community sequencing data. Nat. Methods 2010, 7, 335–336. [Google Scholar] [CrossRef] [PubMed] [Green Version]
  18. Edgar, R.C. Search and clustering orders of magnitude faster than BLAST. Bioinformatics 2010, 26, 2460–2461. [Google Scholar] [CrossRef] [Green Version]
  19. IPCC. IPCC (Intergovernmental Panel on Climate Change), Climate Change 2013: The Physical Science Basis. Intergovernmental Panel on Climate Change, Stockholm; Cambridge University Press: Cambridge, UK, 2014. [Google Scholar]
  20. Sabba, F.; Picioreanu, C.; Nerenberg, R. Mechanisms of nitrous oxide (N2O) formation and reduction in denitrifying biofilms. Biotechnol. Bioeng. 2017, 114, 2753–2761. [Google Scholar] [CrossRef] [PubMed]
  21. Yamada, T.; Sekiguchi, Y.; Hanada, S.; Imachi, H.; Ohashi, A.; Harada, H.; Kamagata, Y. Anaerolinea thermolimosa sp. nov., Levilinea saccharolytica gen. nov., sp. nov. and Leptolinea tardivitalis gen. nov., sp. nov., novel filamentous anaerobes, and description of the new classes Anaerolineae classis nov. and Caldilineae classis nov. in the bacterial phylum Chloroflexi. Int. J. Syst. Evol. Microbiol. 2006, 56, 1331–1340. [Google Scholar] [Green Version]
  22. Sekiguchi, Y.; Yamada, T.; Hanada, S.; Ohashi, A.; Harada, H.; Kamagata, Y. Anaerolinea thermophila gen. nov., sp. nov. and Caldilinea aerophila gen. nov., sp. nov., novel filamentous thermophiles that represent a previously uncultured lineage of the domain Bacteria at the subphylum level. Int. J. Syst. Evol. Microbiol. 2003, 53, 1843–1851. [Google Scholar] [CrossRef] [Green Version]
  23. Kragelund, C.; Thomsen, T.R.; Mielczarek, A.T.; Nielsen, P.H. Eikelboom’s morphotype 0803 in activated sludge belongs to the genus Caldilinea in the phylum Chloroflexi. FEMS Microbiol. Ecol. 2011, 76, 451–462. [Google Scholar] [CrossRef]
  24. Eikelboom, D.H. Filamentous organisms observed in activated sludge. Water Res. 1975, 9, 365–388. [Google Scholar] [CrossRef]
  25. Martins, A.M.P.; Pagilla, K.; Heijnen, J.J.; van Loosdrecht, M.C.M. Filamentous bulking sludge—A critical review. Water Res. 2004, 38, 793–817. [Google Scholar] [CrossRef] [PubMed]
  26. Sanford, R.A.; Wagner, D.D.; Wu, Q.; Chee-Sanford, J.C.; Thomas, S.H.; Cruz-García, C.; Rodríguez, G.; Massol-Deyá, A.; Krishnani, K.K.; Ritalahti, K.M.; et al. Unexpected nondenitrifier nitrous oxide reductase gene diversity and abundance in soils. Proc. Natl. Acad. Sci. USA 2012, 109, 19709–19714. [Google Scholar] [CrossRef] [PubMed] [Green Version]
  27. Wu, P.; Xiong, X.; Xu, Z.; Lu, C.; Cheng, H.; Lyu, X.; Zhang, J.; He, W.; Deng, W.; Lyu, Y.; et al. Bacterial Communities in the Rhizospheres of Three Mangrove Tree Species from Beilun Estuary, China. PLoS ONE 2016, 11, e0164082. [Google Scholar] [CrossRef]
  28. Pereira, A.D.; Leal, C.D.; Dias, M.F.; Etchebehere, C.; Chernicharo, C.A.; de Araujo, J.C. Effect of phenol on the nitrogen removal performance and microbial community structure and composition of an anammox reactor. Bioresour. Technol. 2014, 166, 103–111. [Google Scholar] [CrossRef] [PubMed] [Green Version]
  29. Zehr, J.P.; Ward, B.B. Nitrogen Cycling in the Ocean: New Perspectives on Processes and Paradigms. Appl. Environ. Microbiol. 2002, 68, 1015–1024. [Google Scholar] [CrossRef] [PubMed] [Green Version]
  30. Jetten, M.S.M.; Wagner, M.; Fuerst, J.; van Loosdrecht, M.; Kuenen, G.; Strous, M. Microbiology and application of the anaerobic ammonium oxidation (‘anammox’) process. Curr. Opin. Biotechnol. 2001, 12, 283–288. [Google Scholar] [CrossRef]
  31. Lee, K.C.-Y.; Dunfield, P.F.; Morgan, X.C.; Crowe, M.A.; Houghton, K.M.; Vyssotski, M.; Ryan, J.L.J.; Lagutin, K.; McDonald, I.R.; Stott, M.B. Chthonomonas calidirosea gen. nov., sp. nov., an aerobic, pigmented, thermophilic micro-organism of a novel bacterial class, Chthonomonadetes classis nov., of the newly described phylum Armatimonadetes originally designated candidate division OP10. Int. J. Syst. Evol. Microbiol. 2011, 61, 2482–2490. [Google Scholar] [CrossRef]
  32. McBride, M.J.; Liu, W.; Lu, X.; Zhu, Y.; Zhang, W. The Family Cytophagaceae. In The Prokaryotes: Other Major Lineages of Bacteria and the Archaea; Rosenberg, E., DeLong, E.F., Lory, S., Stackebrandt, E., Thompson, F., Eds.; Springer: Berlin/Heidelberg, Germany, 2014; pp. 577–593. [Google Scholar]
  33. Kovaleva, O.L.; Merkel, A.Y.; Novikov, A.A.; Baslerov, R.V.; Toshchakov, S.V.; Bonch-Osmolovskaya, E.A. Tepidisphaera mucosa gen. nov., sp. nov., a moderately thermophilic member of the class Phycisphaerae in the phylum Planctomycetes, and proposal of a new family, Tepidisphaeraceae fam. nov., and a new order, Tepidisphaerales ord. nov. Int. J. Syst. Evol. Microbiol. 2015, 65 Pt 2, 549–555. [Google Scholar] [CrossRef]
  34. Wunderlin, P.; Mohn, J.; Joss, A.; Emmenegger, L.; Siegrist, H. Mechanisms of N2O production in biological wastewater treatment under nitrifying and denitrifying conditions. Water Res. 2012, 46, 1027–1037. [Google Scholar] [CrossRef]
  35. Zheng, H.; Hanaki, K.; Matsuo, T. Production of nitrous oxide gas during nitrification of wastewater. Water Sci. Technol. 1994, 30, 133–141. [Google Scholar] [CrossRef]
  36. Tallec, G.; Garnier, J.; Billen, G.; Gousailles, M. Nitrous oxide emissions from secondary activated sludge in nitrifying conditions of urban wastewater treatment plants: Effect of oxygenation level. Water Res. 2006, 40, 2972–2980. [Google Scholar] [CrossRef]
  37. Otte, S.; Grobben, N.G.; Robertson, L.A.; Jetten, M.S.; Kuenen, J.G. Nitrous oxide production by Alcaligenes faecalis under transient and dynamic aerobic and anaerobic conditions. Appl. Environ. Microbiol. 1996, 62, 2421–2426. [Google Scholar]
  38. Schulthess, R.V.; Gujer, W. Release of nitrous oxide (N2O) from denitrifying activated sludge: Verification and application of a mathematical model. Water Res. 1996, 30, 521–530. [Google Scholar] [CrossRef]
  39. Hanaki, K.; Hong, Z.; Matsuo, T. Production of Nitrous Oxide Gas during Denitrification of Wastewater. Water Sci. Technol. 1992, 26, 1027–1036. [Google Scholar] [CrossRef]
  40. Park, K.Y.; Inamori, Y.; Mizuochi, M.; Ahn, K.H. Emission and control of nitrous oxide from a biological wastewater treatment system with intermittent aeration. J. Biosci. Bioeng. 2000, 90, 247–252. [Google Scholar] [CrossRef]
  41. Thörn, M.; Sörensson, F. Variation of nitrous oxide formation in the denitrification basin in a wastewater treatment plant with nitrogen removal. Water Res. 1996, 30, 1543–1547. [Google Scholar] [CrossRef]
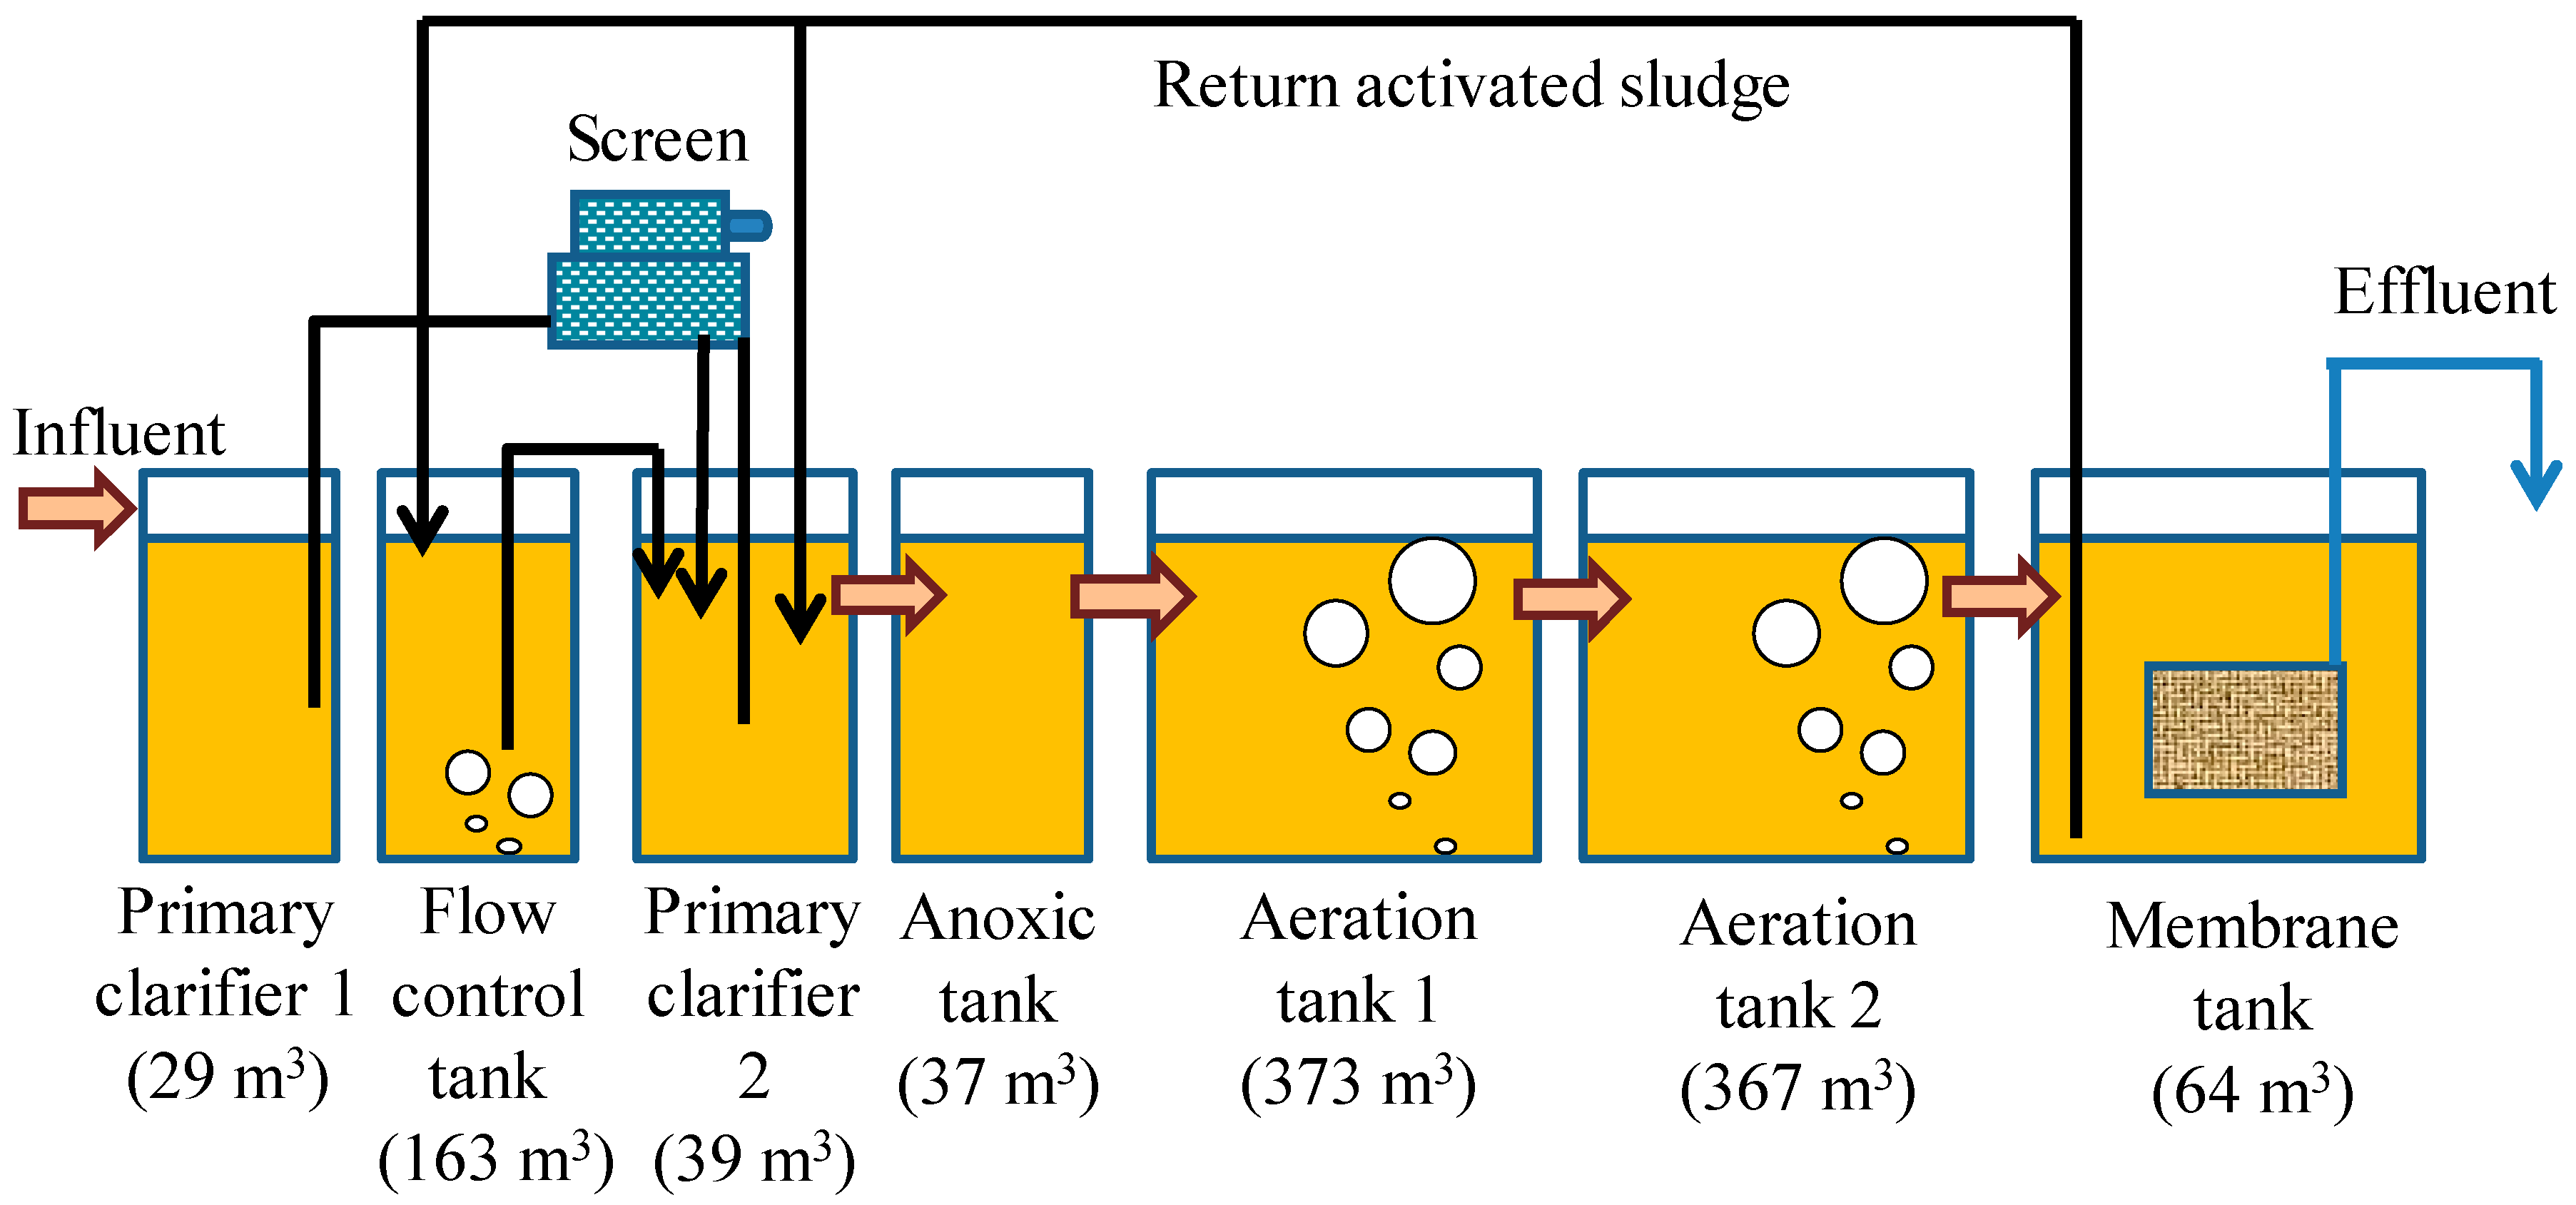
Figure 1. Schematic of the wastewater treatment plant for the swine farm in Okayama Prefecture.
Energies 12 01013 g001
Figure 2. Schematic of the bioreactors.
Energies 12 01013 g002
Figure 3. Influent and effluent concentrations of NH4-N, NO2-N and NO3-N in the reactors during operation.
Energies 12 01013 g003
Figure 4. Time series of gas emissions of N2O in the bioreactors.
Energies 12 01013 g004
Figure 5. Phylum distribution within the activated sludge in the AS reactor and the biofilm formed on the carbon fibres (CF) in the CF reactor.
Energies 12 01013 g005
Figure 6. Phylogenetically clustered heat map of the major orders identified in microbial communities of the bioreactor based on analysis of the 16S rRNA gene.
Energies 12 01013 g006
Figure 7. Time series of emission gas and emission factor of N2O in the wastewater treatment plant for the swine farm. The time at which the carbon fibre carriers were applied is indicated by the red arrow.
Energies 12 01013 g007
Table 1. Aerobic bioreactor operating characteristics.
AS ReactorCF Reactor
Bioreactor
Height (cm)110110
Width (cm)9090
Depth (cm)9090
Water phase (L)700700
Carbon Fiber Carrier
Diameter (µm)-7
Number of fibers -24,000
Length (cm)-25
Fixed carbon fiber units-104
Feed cycle (h)2424
Average feed volume (L/day)3030
Aeration rate (m3/h)66
Table 2. Water qualities of the influent and effluent flow in this study.
InfluentEffluent from AS ReactorEffluent from CF Reactor
MLSS (mg/L)-8301 ± 4557542 ± 835
BOD (mg/L)9936 ± 217920 ± 2519 ± 23
COD (mg/L)5898 ± 2654181 ± 80170 ± 69
SS (mg/L)12,972 ± 787090 ± 39139 ± 86
TN (mg/L)2658 ± 1002311 ± 116300 ± 103
NH4+-N (mg/L)1392 ± 3214 ± 54 ± 6
NO2-N (mg/L)5 ± 848 ± 6826 ± 44
NO3-N (mg/L)5 ± 4234 ± 137169 ± 73
TP (mg/L)412 ± 15290 ± 3469 ± 29
pH6.7 to 7.85.9 to 8.06.9 to 7.9
(mean ± SD)
AS, activated sludge; CF, carbon fiber; MLSS, mixed liquor suspended solids; BOD, biochemical oxygen demand; COD, chemical oxygen demand; SS, suspended solids; TN, total nitrogen; TP, total phosphorus.