1. Introduction
The optimal use of energy resources, especially renewable energy, requires a certain level of flexibility in an industrial production system. Thermal energy storages, for example Ruths steam storages (RSS), can be used to enable the desired flexibility of the system. A RSS is a pressure vessel filled with liquid water and steam. For charging, steam is introduced in the liquid phase where the majority of the steam condenses and the pressure inside the vessel increases. For discharging, steam is taken out of the vessel and the pressure decreases while liquid water evaporates to maintain a thermodynamic equilibrium. González–Roubaud et al. [
1] stated that the fast reaction time and the high charging and discharging rates are advantages of RSS. The required wall thicknesses due to the internal pressure and during discharging, decreasing pressure and the low volumetric energy density, are disadvantageous.
In order to store energy at a nearly constant temperature level, phase change materials (PCMs) are used in latent thermal energy storages (LHTESs). A high amount of energy is absorbed or released during the phase change of such materials, for example between liquid and solid state. A disadvantage is the low thermal conductivity of most PCMs which determines the heat transfer between the energy source and the PCM. In recent years, the development of methods to increase the heat transfer between the heat transfer medium and PCM, thus improving the performance of LHTES, has been a major research topic. A large number of studies on this topic have been published. Tao and He [
2] summarized some of these methods, for example, increasing the heat transfer area by using fins or thermal conductivity by adding highly thermally conductive material to the PCM. The integration of LHTES with steam as the heat transfer medium in direct steam generation power plants is also discussed in scientific literature. Pirasaci and Goswami [
3] analyzed the influence of different parameters such as the storage length and flow rate of a shell-and-tube LHTES with water/steam as the heat transfer medium. Among other findings, they found out that there is an optimal value for the flow rate, because both the thermophysical properties of the heat transfer medium when the flow in the tubes is completely laminar and the low heat transfer from the PCM when the heat transfer medium flow is too fast, has a negative impact on the efficiency of the LHTES. A comparison between different storage technologies for the integration into direct steam generation solar plants is presented by Prieto et al. [
4]. The study showed that for longer discharging times, longer than six hours, a combination of LHTES and molten salt storage is preferable to steam storages.
In this contribution, a combination between an RSS and PCM in the hybrid storage concept is discussed. The extension of sensible energy storages by using PCM is analyzed in scientific literature. Underwood et al. [
5] and Zhao et al. [
6] analyzed the integration of PCM inside water storage tanks for increasing the energy density. Among other possibilities to combine RSS with other technologies, the method of placing PCM inside the pressure vessel was mentioned by Steinmann and Eck [
7]. Buschle et al. [
8] and Tamme et al. [
9] presented two possibilities to improve RSS with PCM. The first method is to install PCM encapsulated in tubes inside the pressure vessel. The second method uses tubes surrounded with PCM, which are connected to the RSS vessel. Therefore, the RSS pressure vessel is used as a water separator and reservoir for the two-phase fluid. The tube register arranged outside the pressure vessel provides better results in terms of solidification time than the arrangement at the internal side of the pressure vessel [
8].
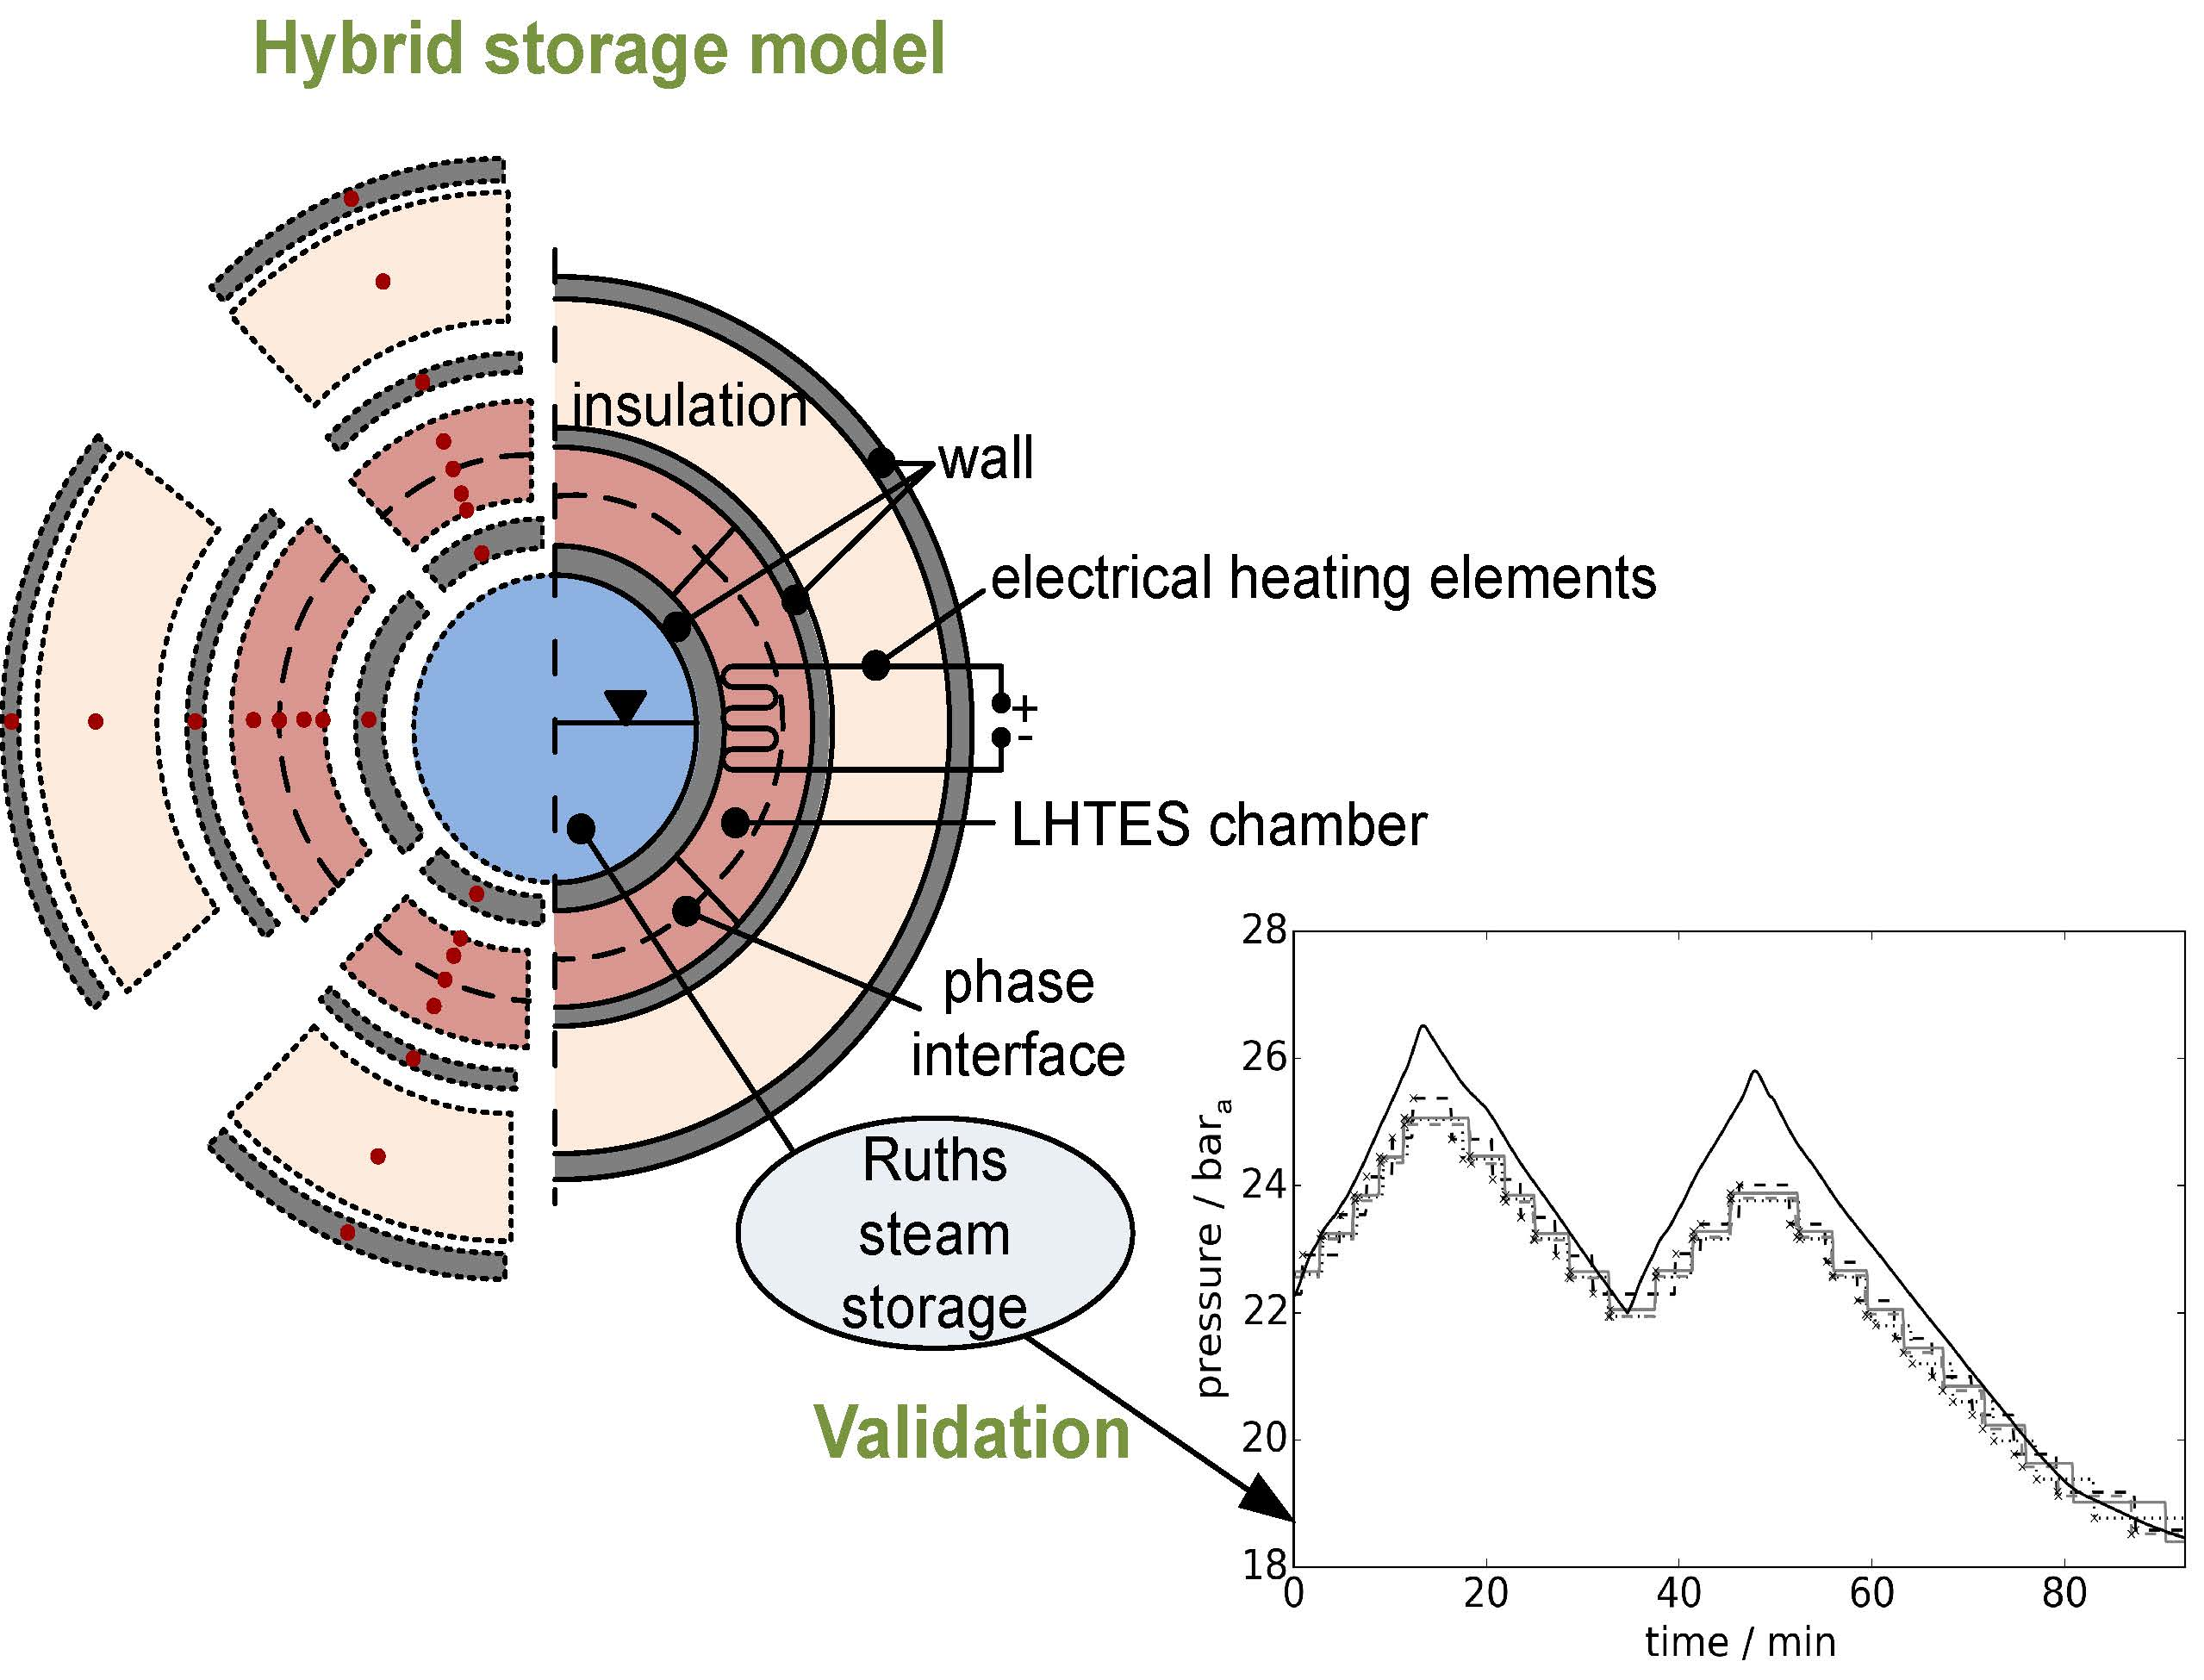
In this study, a dynamic model of an innovative hybrid storage concept which enables the combination of an RSS with an LHTES in a single component is presented. Compared to the above described concepts, the LHTES is placed at the shell surface of the RSS pressure vessel, as presented in
Figure 1. The concept also includes the division of the LHTES which surrounds the RSS vessel, into several chambers. Therefore, the arrangement of PCMs with different material properties is enabled. In addition, heat exchangers or electrical heating elements are integrated at the internal side of the LHTES chambers to store waste heat or electrical energy in terms of thermal energy. The hybrid storage concept has the advantages of the high charging and discharging rates of the RSS and the high energy density of phase change material. The aim of this hybrid storage approach is to increase the adaptability of the storage to the operating condition without an additional external component. In the following sections, the model is described in detail using a bond graph. This model, which is an extension of the model presented by Dusek and Hofmann [
10,
11], can be used to study the interaction between the different storage parts. This extension applies different heat transfer coefficients for each water phase inside the RSS vessel. Also, the division of the LHTES in several containers in the peripheral direction around the pressure vessel and the possibility to activate an additional heat source (AHS) in each LHTES container is included. This heat source represents the above mentioned electrical heating elements or heat exchangers.
The model consists of different sub-models. The two main sub-models are the RSS and LHTES sub-models. Different ways to model an RSS have been presented in scientific literature. One way is to assume that the two-phase fluid at the internal side of the vessel is in a thermodynamic equilibrium at all times which means that liquid and steam have the same temperature [
7,
8,
12]. Another approach is presented by Stevanovic et al. [
13,
14], in which no equilibrium is assumed to model the RSS. Therefore, the two phases can have different temperatures and the energy and mass balance equations are calculated for each phase separately. Finite condensation and evaporation rates are used for connecting the two phases. Furthermore, a model validation for charging an RSS was shown. Also, Sun et al. [
15] presented a model validation of an RSS model based on the non-equilibrium approach for different charging and discharging conditions. Moreover, Sun et al. [
16] modeled an RSS by neglecting the steam phase inside the RSS to optimize the RSS operation to reduce the volume which leads to a reduction of investment costs.
To model the phase change process of a PCM, Mehling and Cabeza [
17] presented analytical solutions and two numerical approaches. The first approach uses an effective specific heat capacity and the second approach uses the enthalpy to consider the latent energy which is stored or released. Several model approaches, such as the above mentioned enthapy and effective heat capacity method, as well as the front tracking method, were summarized by Liu et al. [
18]. A comparison of the front tracking method and the so-called interface capturing methods, for example the enthalpy method and the effective heat capacity method, was presented by Klimeš et al. [
19]. The interface tracking method provides more accurate results than the interface capturing methods. Fortunato et al. [
20] presented a numerical model to analyze the heat transfer between air and PCM in a shell-and-tube arrangement where the heat transfer fluid flows at the internal side of the tubes. Energy balance equations for the heat transfer fluid, the wall and the PCM are used in this model. The enthalpy is used to determine the temperature inside the PCM. Gallego et al. [
21] described a validated simplified model for a shell-and-tube LHTES where water is used as the heat transfer medium. The Stefan solution is used for describing the phase change. Stamatiou et al. [
22] presented a quasi-stationary model of a tube surrounded with a PCM. The stored sensible energy of the liquid phase is considered and the stored sensible energy of the solid phase is neglected during phase change. Stefan condition is applied at the phase interface. The model is validated with a latent heat storage test rig where paraffin is used as PCM. The accuracy was found to be sufficient. Zauner et al. [
23] tested two approaches for modeling a hybrid sensible-latent heat storage where the PCM is placed inside tubes of a shell-and-tube arrangement and the heat transfer fluid (thermal oil) flows around these tubes. In the first model, the Stefan problem is formulated to calculate the position of the phase interface dynamically and in the second model an effective specific heat capacity method is used. Both models provide satisfactory results in comparison with measurement results.
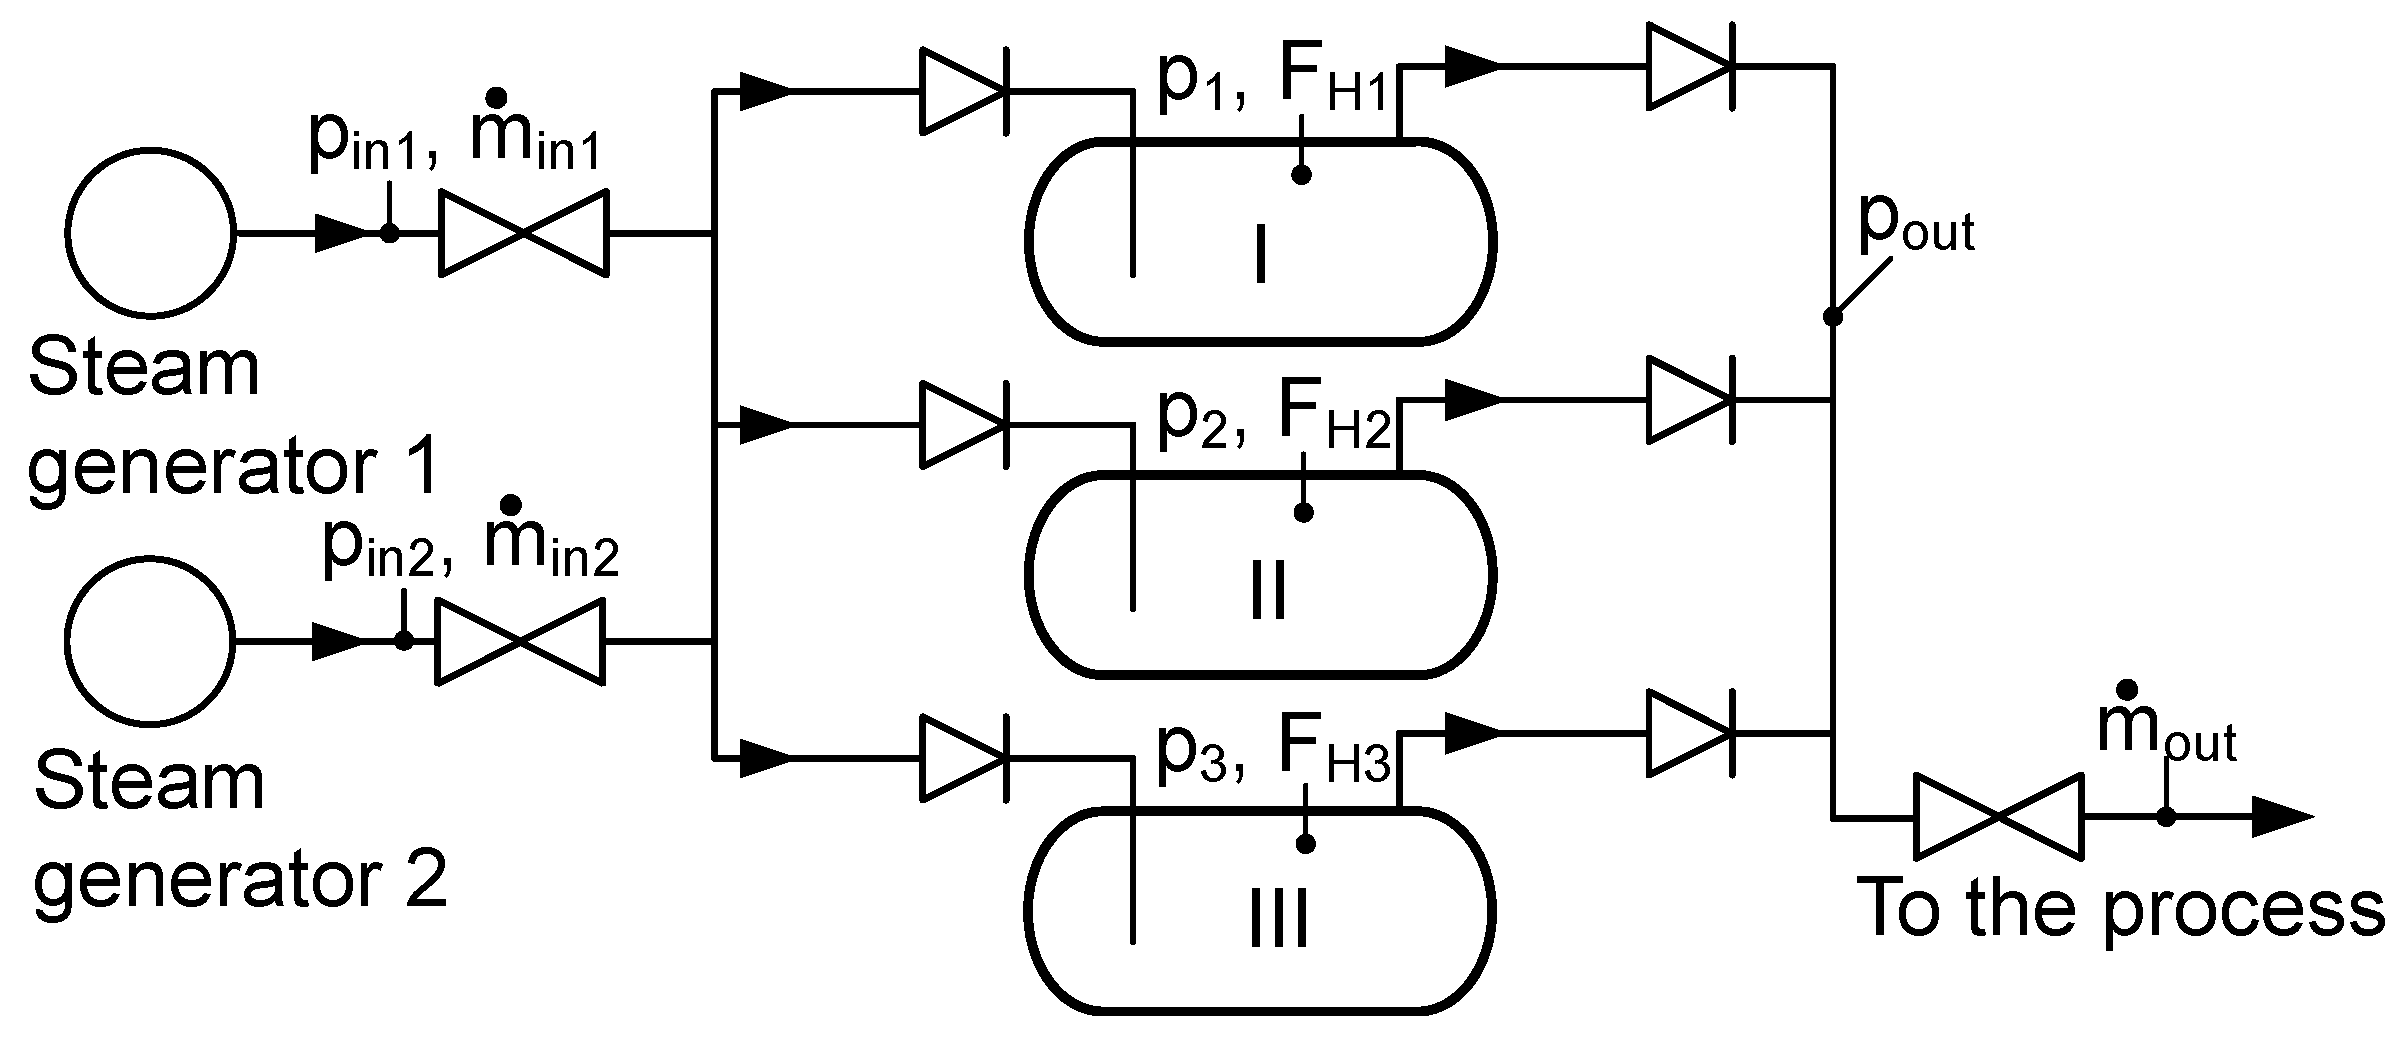
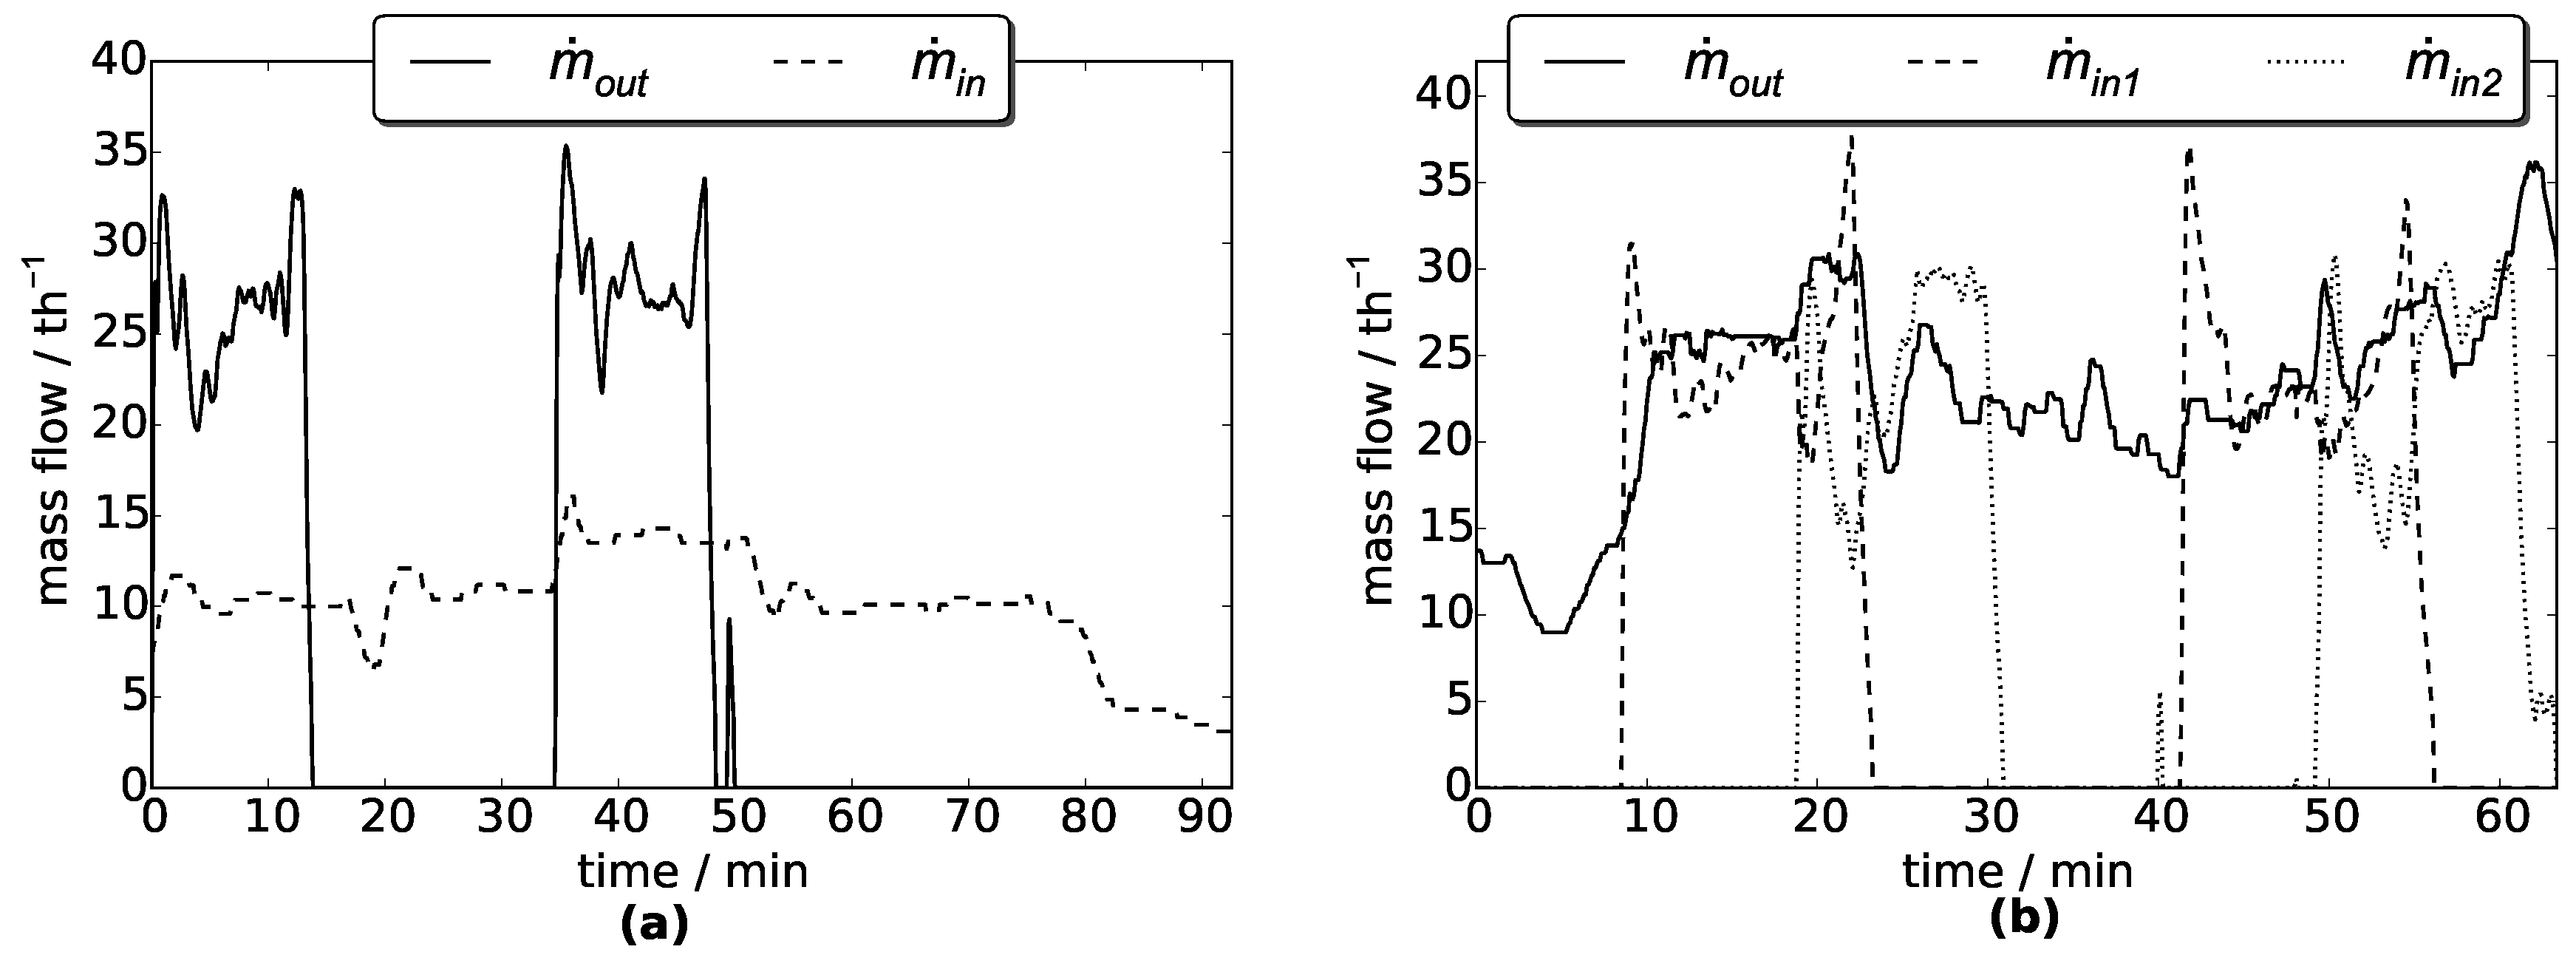
For the hybrid storage model presented in this paper, the equilibrium approach is chosen for the RSS sub-model, because fewer equations and variables are needed. Also, the validation of the RSS sub-model will be presented. Compared to the above mentioned RSS model validations in this paper, operational measurement data of an RSS system integrated in a steel production process are used. The RSS system consists of three pressure vessels arranged in a storage line. The prosition of the face interface between the solid and liquid PCM is also calculated dynamically in the LHTES sub-model similar to first model presented by Zauner et al. [
23]. Moreover, the sensible energy stored or released during phase change of both phases is considered in this sub-model, also during phase change. A verification of the simulation results with the analytic solution was done. In one case, the stored sensible energy is considered and in the other case this stored sensible energy is neglected. The presented model allows a first estimation of the interaction of the two combined storage types, which is illustrated by the simulation results of a hybrid storage example.
2. Hybrid Storage Model
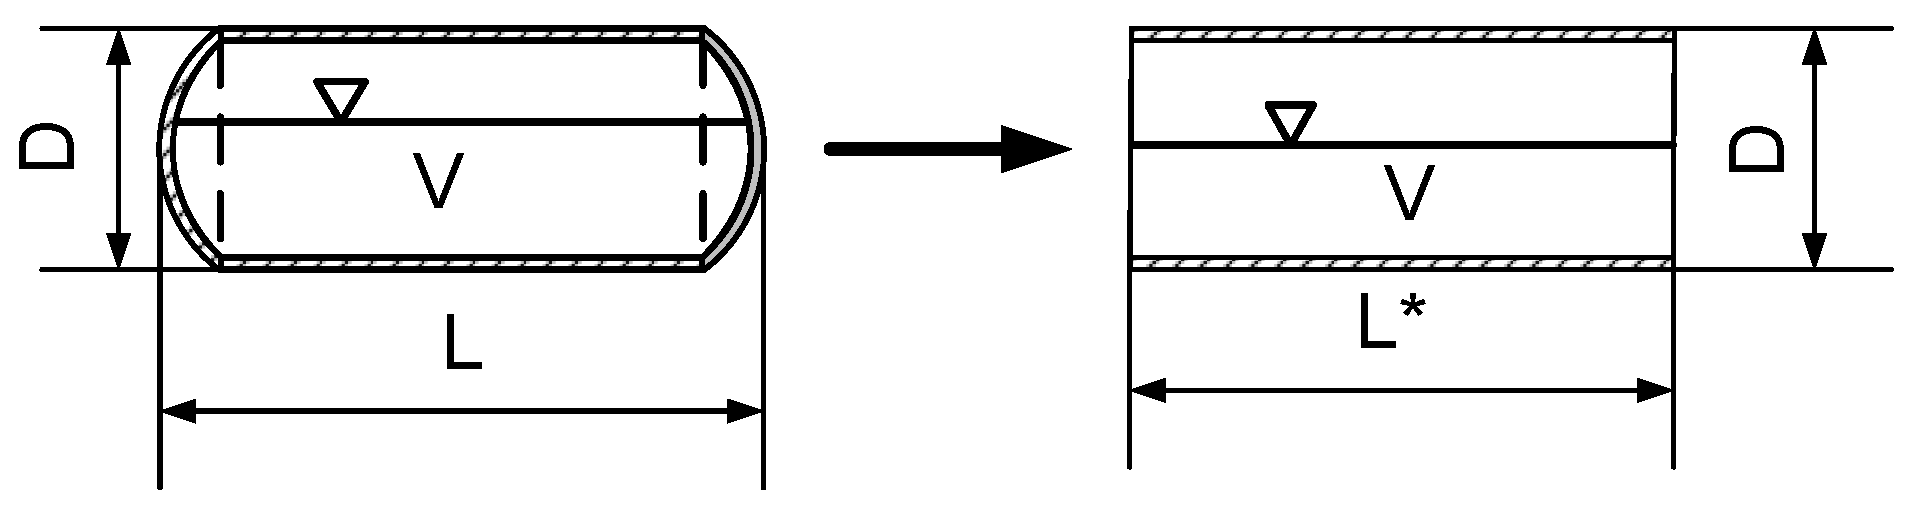
The pressure vessel of an RSS is a cylinder with elliptical or hemispherical sides [
12]. The hybrid storage concept presented in this paper proposes the installation of the LHTES at the cylindrical shell surface only. Therefore, the hybrid storage is modeled as a cylinder, and the end surfaces and volumes are neglected. The heat loss at the end surfaces is assumed to be small compared to the heat transfer at the shell surface. Therefore, the end surfaces of the pressure vessel are regarded as adiabatic. A schematic representation of the hybrid storage model is shown in
Figure 1. The LHTES chamber sizes are defined by an angle vector
. Each chamber can have a different size, where a symmetrical structure related to the vertical axis of symmetry is assumed. This means that the design on both, the left and the right half of the circular cross-section, are equal (
Figure 1). The hybrid storage model was created in Dymola 2015 FD01 [
24] with the TIL 3.3-library and TILMedia 3.3-library [
25] and consists of the following sub-models:
wall (W)
heat resistor (HR)
latent heat thermal energy storage (LHTES)
additional heat source (AHS)
Ruths steam storage (RSS)
The sub-models and the connections between them are presented in
Figure 2a. In
Figure 2b, a bond graph of the hybrid storage system, from the surrounding environment to the two-phase fluid inside the pressure vessel, is presented. The bond graph method shows the power exchange graphically which results by multiplying the effort and flow variable in a system. Based on the graphical representation, the set of equations for modelling can be derived directly [
26]. In the bond graph, in
Figure 2b, the half arrows show the positive direction of the heat flows in the system. The half arrows with circles mark those bonds in which more than one effort and flow variable are needed to describe the state. Moreover, a possible causality is shown in
Figure 2b marked with vertical strokes. In this bond graph, it is mainly the temperature that is used as an effort variable and the heat flow is used as a flow variable. The result of the multiplication of heat flow and temperature does not have the unit of power. Therefore, this bond graph is also called a pseudo bond graph [
26]. The walls and the insulation are divided into the same number of volumes as the LHTES. In the wall sub-model, the heat transfer between the different wall volumes in the peripheral direction is also considered. The dashed bonds in
Figure 2b represent this connection. In the following chapters, the sub-models and therefore the different parts of the bond graph are described.
2.1. Wall and Heat Resistor Sub-Model
The HR sub-model is used to model the heat transfer between the environment and the outer wall elements of the storage vessel. The thermal resistance
presented in
Figure 2b, which is used in the HR model, is calculated with Equation (
1). In the following equations,
j (
) is the number of regarded partial elements of the sub-model.
The wall sub-model is used four times inside the hybrid storage model. The wall W3 in
Figure 2 is used to model the insulation of the storage vessel. For the most inner wall W1 (
Figure 3), the equations of the wall sub-model are presented. With the mean diameter, the thermal capacity of the wall is considered. The mean diameter is calculated in relation to the volume. The thermal capacity
and the resistances for the heat flow in the radial direction
and
are calculated with Equations (
2)–(
4).
In the wall sub-model, the heat flows in the peripheral direction between the adjacent wall elements are also taken into account. Assuming an isotropic material, the corresponding thermal resistance
is calculated with Equation (
5).
2.2. Latent Heat Thermal Energy Storage Sub-Model
For modeling the LHTES part, the following assumptions were made:
material properties are constant and equal for the liquid and solid phase,
phase transition takes place at a certain temperature,
at the beginning of the simulation, the PCM is completely liquid or solid, depending on charging or discharging mode,
convective heat transfer is neglected,
the walls between the different LHTES chambers are not considered and the contact is regarded as adiabatic,
only one-dimensional heat transfer in the radial direction is considered.
In
Figure 4, the energy flow inside a LHTES chamber is presented. The latent energy per unit time
which is absorbed or released during phase transition is considered in a node located on the moving phase interface and calculated with Equation (
6). During phase transition, the phase interface moves from the inner to the outer diameter of the LHTES cylinder, therefore the mass of each phase changes during phase change. In Equation (
6), the mass for calculating the stored latent energy per unit time was chosen equal to the solid mass to realize a negative value during melting and a positive value during solidifying. In Equation (
7), the mass balance equation at the node on the phase interface is presented.
In
Figure 2b, the LHTES sub-model is graphically represented during phase change. The latent energy flow for a PCM chamber
is represented by a effort source, because the temperature
is set constant and equal to the phase change temperature during the phase change. The stored sensible energy per unit time resulting from the temperature change of the regarding phase
and
is calculated with Equations (
8) and (
9). As the mass of both phases changes, an additional term depending on this temporal change of mass occurs by differentiating the energy content of the corresponding phase. This additional term is represented as a flow source in the bond graph (
Figure 2b). Therefore, the sensible energy flow presented in
Figure 4 is calculated with Equations (
10) and (
11). This stored sensible energy per unit time, is taken into account in a node at the mean diameter related to the volume of the corresponding phase. The nodes are connected by heat conduction as in the wall sub-model.
If only one single phase exists, the temperature will be equal to the temperature at the inner or outer diameter of the PCM cylinder (, ), depending on whether the temperature at the inner diameter is lower or higher than the phase change temperature.
Two limiting cases have to be avoided in the sub-model. These cases occur if the PCM does not change phase and only one phase exists. To avoid problems during simulation, neither phase disappears completely; each phase has at least a very small volume for simulation reasons even if it does not exist in reality.
The distinction between charging and discharging is made by the energy flow transferred at the inner wall of the PCM container. This distinction is obligatory because the phase interface always moves from the inner to the outer diameter, independent of whether the PCM melts or solidifies.
As already mentioned, it is possible to store energy from additional sources, for example, electrical heating elements inside the LHTES. Therefore, an additional heat source for each LHTES chamber is placed at the inner diameter of the LHTES sub-model to avoid the appearance of a second phase interface. This leads to the following Equation (
12) for calculating the energy flow at the inner diameter of the LHTES chamber.
The additional heat source is connected to the AHS sub-model. In the AHS, the additional energy flow can be set to zero or to a defined value. For each container, the additional heat source can be activated independently under the above mentioned conditions for symmetry. The additional energy flow is equal for all activated heat sources.
2.3. Ruths Steam Storage Sub-Model
The energy content of the RSS volume is, on the one hand, influenced by the energy which is transferred over the system boundaries by the incoming and outgoing mass flows of liquid and steam. On the other hand, it is influenced by the heat flow between the RSS and the connected sub-models. This can be seen in
Figure 5. In standard operation, the RSS is only charged and discharged with steam. Charging or discharging of liquid water only takes place to adjust the liquid filling level (ratio between the liquid volume and total volume).
As already mentioned, a thermodynamic equilibrium is assumed between the two fluid phases. According to the bond graph presented in
Figure 2b, a mass (Equation (
13)) and energy balance equation (Equation (
14)) is used in the RSS sub-model to determine the current state.
In Equation (
14), the potential and kinetic energy are neglected and the specific enthalpies of the outgoing flows are equal to the specific enthalpy of the corresponding phase inside the volume. In the saturated state, there is a direct correlation between pressure and temperature. Therefore, another property, for example the specific enthalpy, is needed to define the state of the two-phase fluid. The TILMedia library [
25] is used to determine the properties of the two-phase fluid.
For calculating the heat flow
, which is also part of Equation (
14), the heat transfer coefficient between the two-phase fluid and the surrounding wall is required. In this model, the heat flow for each phase is calculated separately, therefore two different heat transfer coefficients are used. Furthermore, it is assumed that each phase can have two different heat transfer coefficients depending on whether the temperature difference between the two-phase fluid and the inner wall is positive or negative. For example, during charging, the steam will condense at the wall because of its lower temperature. So, a heat transfer coefficient for condensing steam will be used. By contrast, for the liquid phase, a heat transfer coefficient of liquid water is chosen. If the temperature of the two-phase fluid is lower than the temperature of the adjacent inner wall, the liquid water will evaporate and a heat transfer coefficient for boiling water is used. In this case, a heat transfer coefficient for steam is chosen for the steam phase. The heat flow between each phase and the connected wall volume
j is calculated with Equations (
15)–(
17).
Two angles,
and
, are used to determine the heat transfer areas between the wall volumes and the corresponding phases. The angle
(
Figure 5) describes the position of the liquid/steam phase interface. To define the position of the different LHTES chambers with respect to each phase inside the RSS volume, the angle
is used;
The heat transfer areas used in Equations (
15) and (
16) are calculated with Equations (
19) and (
20).
For example, if
is smaller than
, the total heat transfer area of the corresponding wall volume is in contact with the liquid phase only, which is shown in
Figure 5 for the lowest LHTES chamber (
). Thus, the first case of Equation (
20) occurs to calculate the heat transfer between the wall volume and each phase. Furthermore, in the sub-model, the liquid filling level
F which specifies the volumetric proportion of the liquid
compared to the total volume
V is calculated as follows:
4. Hybrid Storage Example
This section presents an example of a hybrid storage component, which shows how the model can be used to study the hybrid storage concept. For the pressure vessel used in this example, the geometry of the first storage vessel from
Section 3.1.1 is used. A PCM layer with a thickness of 5 cm surrounds the pressure vessel, and between the insulation layer and the PCM layer there is an additional wall with a thickness of 1 mm. The latent heat storage section is divided into six chambers and thus the wall and the insulation layer are also divided into six volumes in the peripheral direction. The LHTES chambers are filled with the same PCM, and the material properties based on PCM 3 shown in
Table 3 are selected. For the thermal conductivity of the PCM, 6 W·m
−1·K
−1 was used. Therefore, an ideal mixture between aluminum and PCM was assumed and the PCM properties were adapted accordingly, where the density of the mixture corresponds to the density of the PCM. The aluminum material properties and the resulting PCM properties are presented in
Table 5. The other material properties are taken from
Table 2. For the minimum pressure inside the liquid/steam volume, 14
was assumed.
The storage vessel was charged for 90 min with a constant steam flow of 0.69 kg·s−1. The charging steam quality was determined for a constant pressure of 28 and a temperature of 231 °C. Therefore, the steam charging power was equal to 1.94 MW. After 90 min charging with steam, the additional heat source in all chambers was activated for 60 min. During these 60 min, a total thermal power of 780 kW was introduced in the hybrid storage system. After a 10 min break, the storage was discharged with a constant steam mass flow of 0.51 kg·s−1 for 150 min, which resulted in around 1.43 MW steam power being discharged. It must be noted that the specific enthalpy of the discharging steam changes during discharging, because of the decreasing pressure inside the storage vessel. In the example, heat losses are considered, so 25 °C was assumed for the ambient temperature. At initial state the temperatures inside all hybrid storage parts were set equal and the Dassl solver was used. The RSS (without the PCM) was also simulated under the same conditions. Therefore, the additional heat source was placed inside the liquid/steam volume of the RSS vessel.
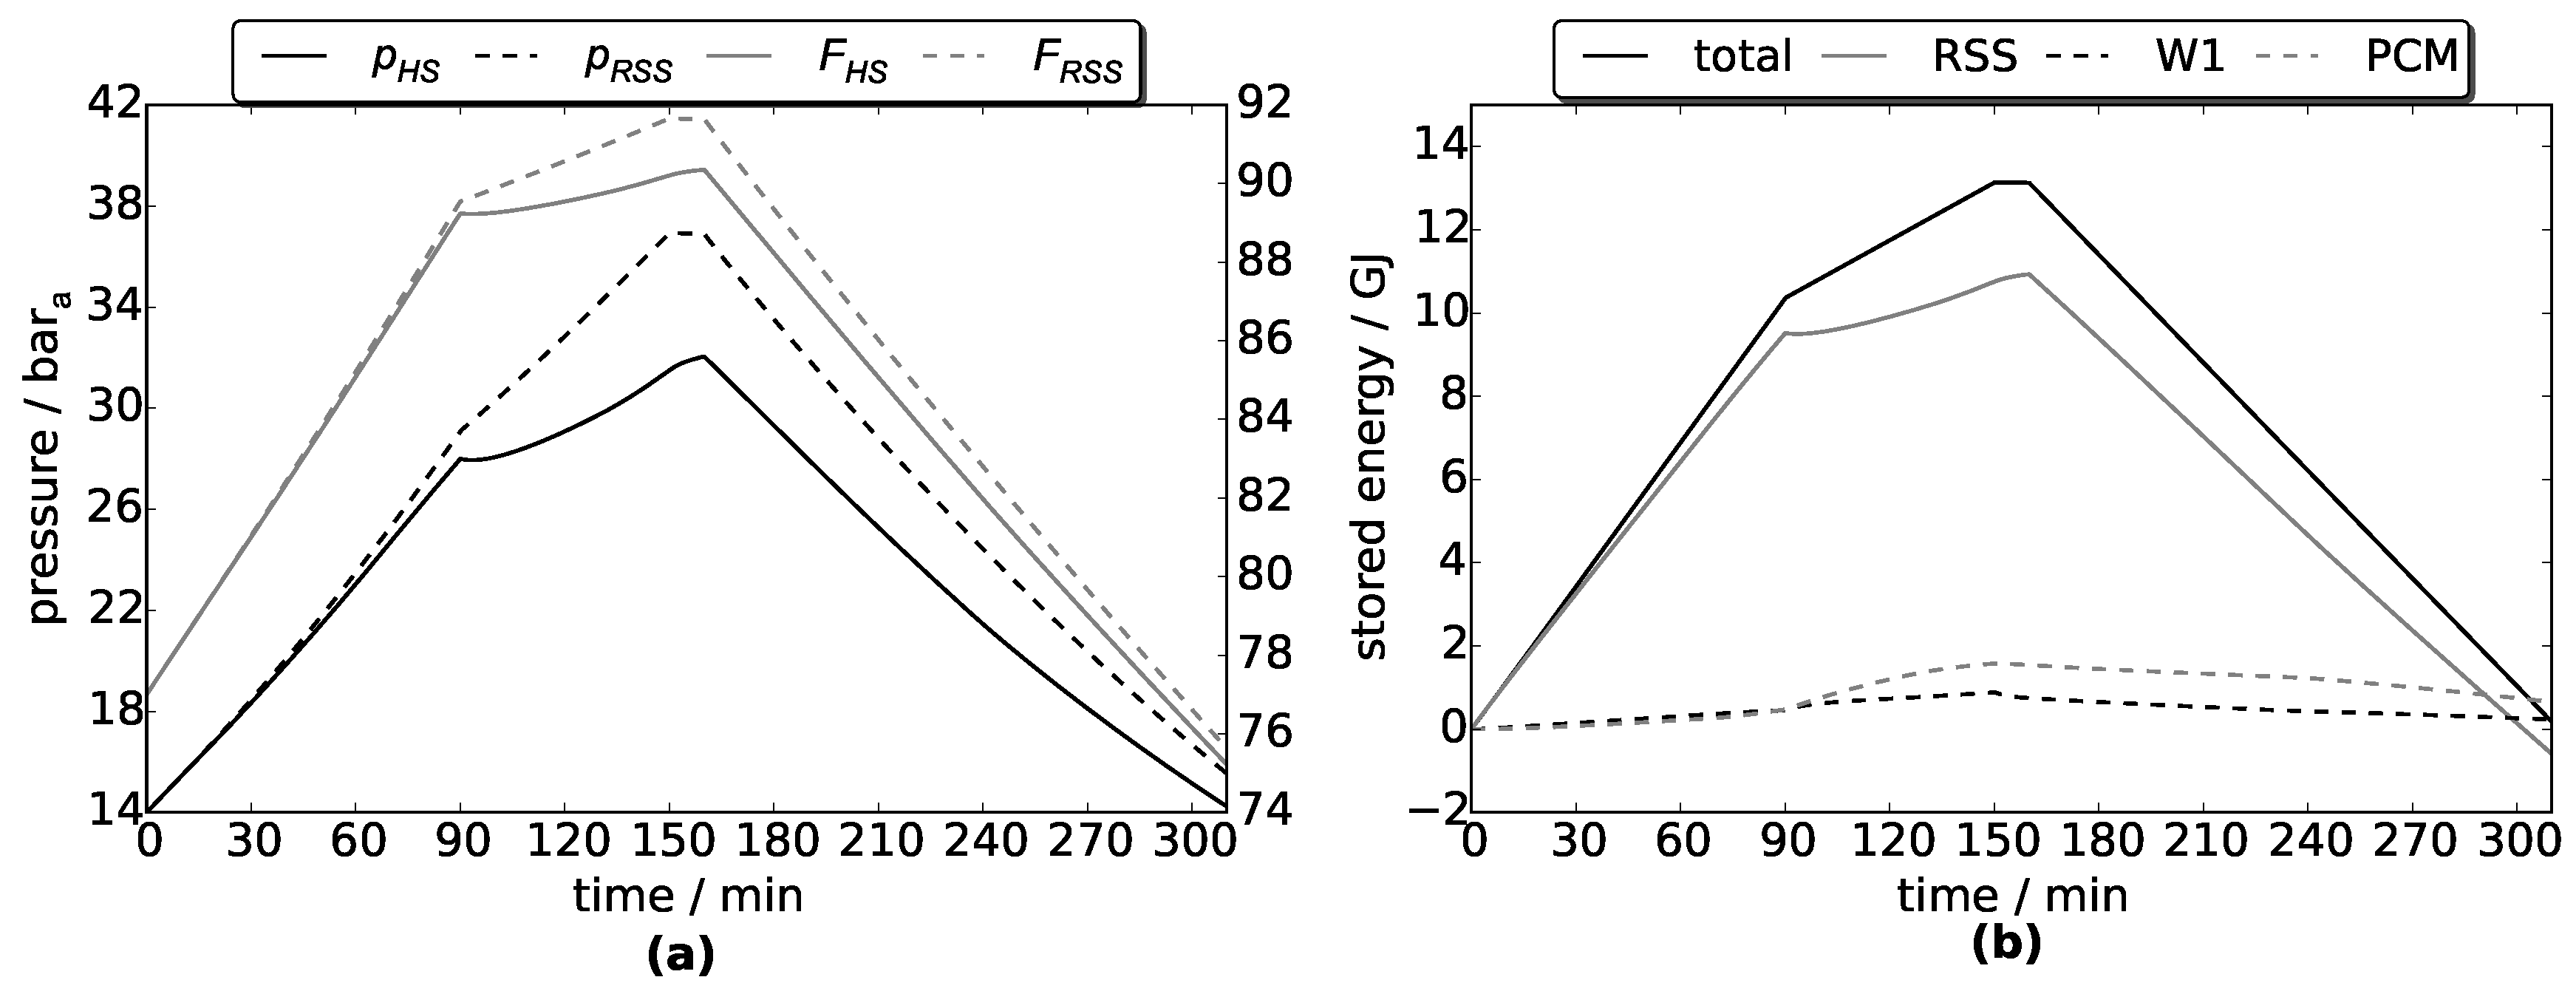
Figure 13 shows the pressure and the liquid filling level inside the liquid/steam volume for the hybrid storage and the RSS. It can be seen that during charging with the additional heat source, the pressure in the vessels rises above the charging steam pressure. It should be noted that the storage vessel can only be charged with steam if the pressure inside the vessel is lower than the charging steam pressure. It can also be observed that the pressure in the RSS increases more than the pressure in hybrid storage. The maximum pressure of the RSS is approximately 5 bar higher than in the hybrid storage. Therefore, the same energy can be stored in the hybrid storage component with a lower maximum pressure. This is an advantage because it means that lower wall thicknesses for the pressure vessel are needed, which results in lower vessel costs.
At the end of the simulation, the pressure in the RSS was slightly higher than the minimum pressure. This allowed further discharging of steam until the minimum pressure was attained. Also, the hybrid storage was not completely discharged at the end of the simulation, which will be discussed later.
For both storage types, the liquid filling level at the end of the simulation is around 1% lower than the liquid filling level at the beginning of the simulation (
Figure 13a). The main reason is the additional stored energy from the additional heat source which makes it possible to discharge more steam mass. This further leads to a higher amount of evaporated liquid water mass. Therefore, the storage has to be charged with liquid water to maintain the liquid filling level.
The effect can also be seen in
Figure 13b. The energy stored in the RSS part of the hybrid storage was negative at the end of the simulation as more steam mass was discharged than was charged. Also, a relatively high amount of energy was stored in the pressure vessel wall (W1) because of the high wall thickness. This example shows that it is very important to increase the heat transfer between the liquid/steam volume and the phase change material in order to obtain a good performance of the hybrid storage component, because significantly more energy is stored in the liquid/steam volume. A significantly smaller total volume or lower maximum pressure for the same total stored energy could be reached if more energy were stored inside the PCM. The maximum thermal power to the PCM is approximately 0.2 MW during charging with steam. During discharging, a maximum thermal power of approximately 0.15 MW is transported from the PCM chambers to the pressure vessel wall. During charging with additional heat sources, almost at the beginning, a maximum total thermal power of 0.5 MW to the PCM occurs. The thermal power decreases with time, because the phase interface moves from the inner diameter to the outer diameter of the PCM chambers where the additional heat sources are placed and therefore the heat resistance to the phase interface increases. Thus, the positions of the additional heat sources are important, as this can influence the part of the hybrid storage component in which most of this introduced additional energy is stored.
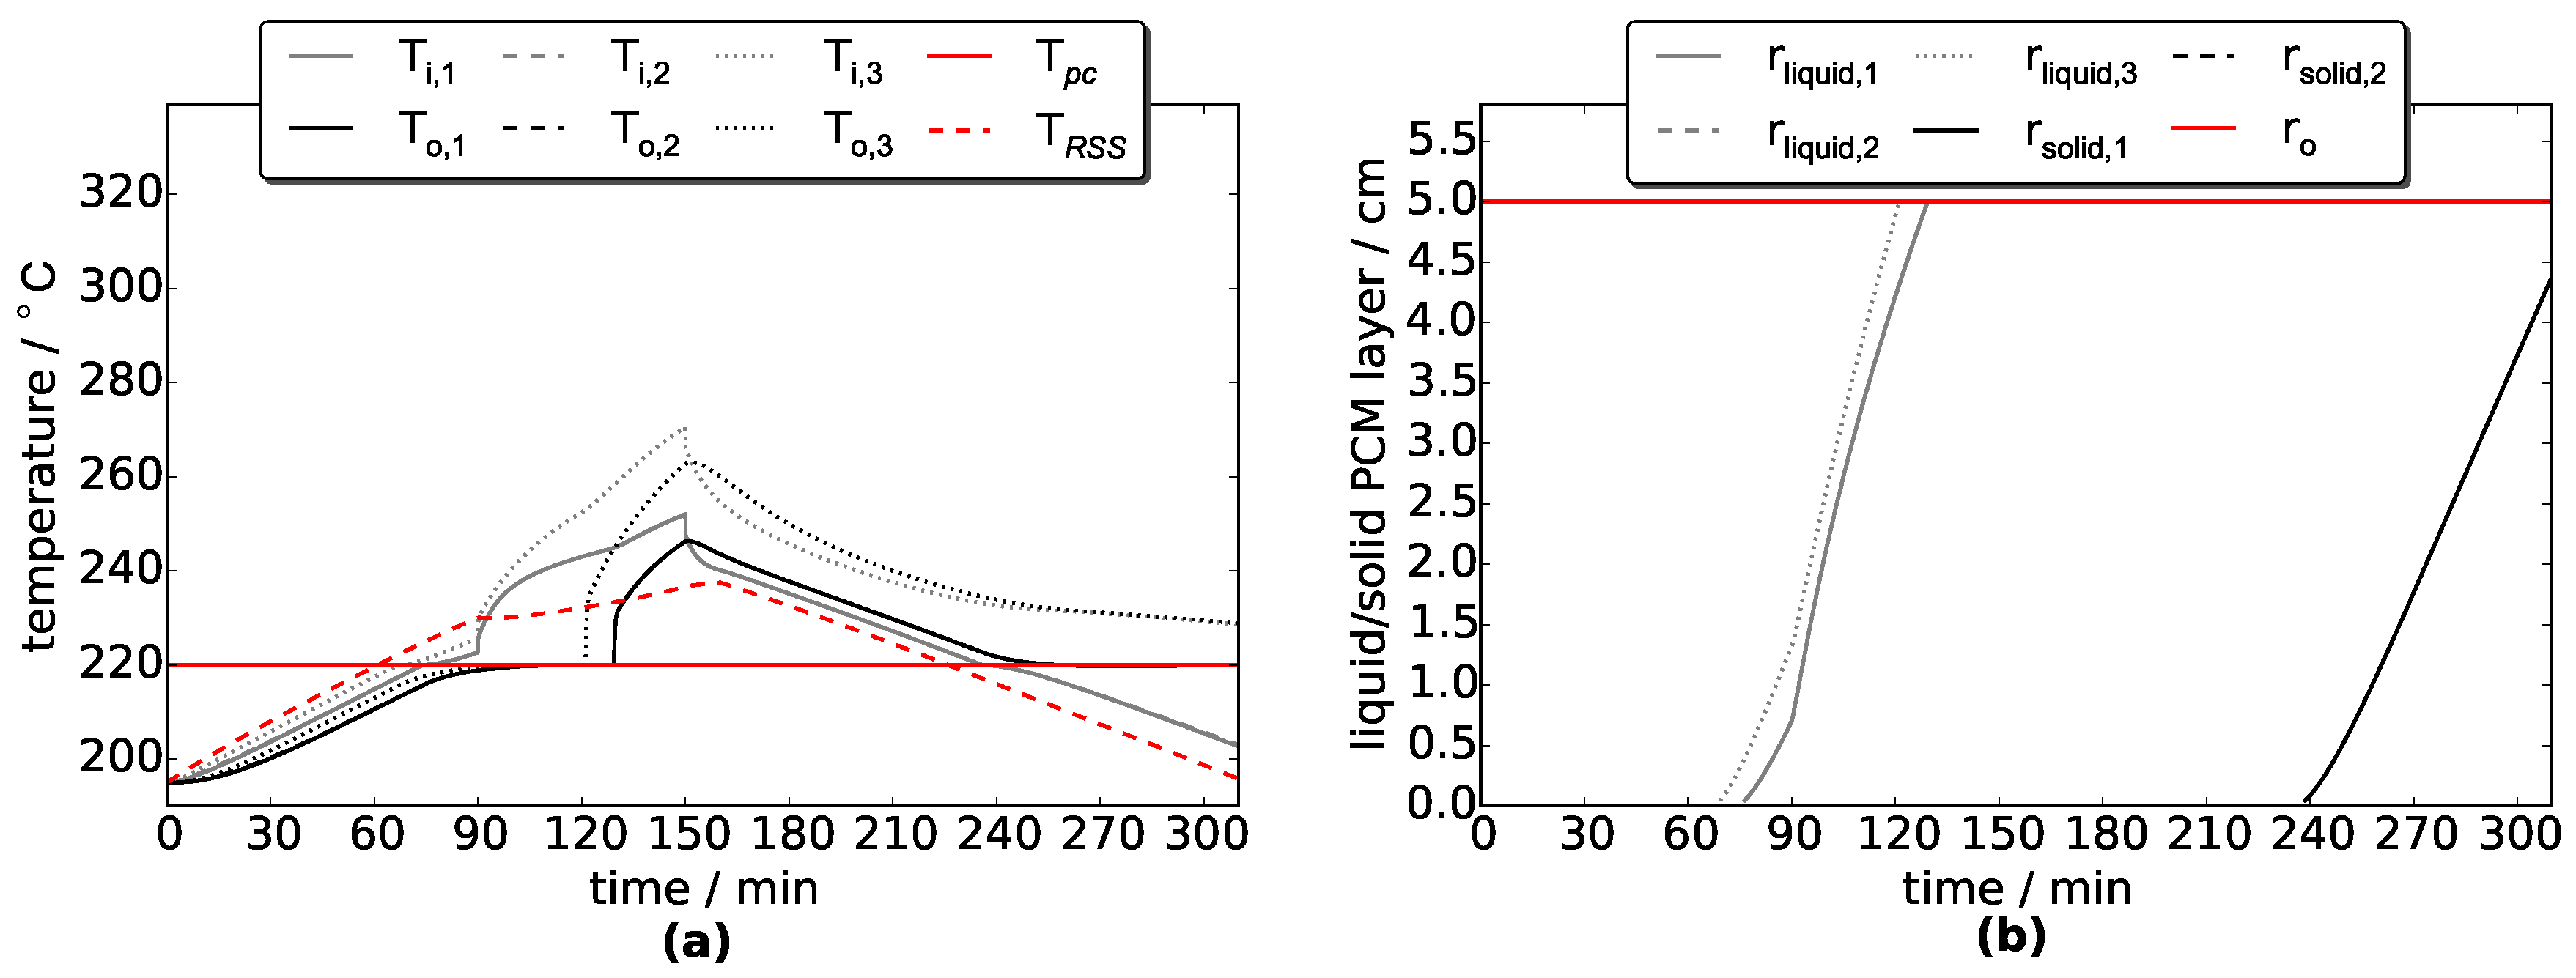
Figure 14 shows the temperatures at the inner and outer diameter of the PCM cylinder for each chamber on one side of the circular cross section and also the temperature inside the liquid/steam volume. During charging, the inner temperatures of the respective chambers rise more rapidly as more of the heat transfer area of the corresponding wall element comes into contact with the steam phase. When the additional heat source is activated for 60 min, the inner temperature of the third PCM chamber
increases rapidly. The reason for this is the significantly low heat transfer coefficient of steam which occurs when the temperature of the connected wall increases above the temperature of the two-phase fluid. The third chamber is installed at the highest position and thus the wall volume between the liquid/steam volume and the third PCM volume is mostly in contact with the steam phase. As a result, the energy from the additional source at the inner diameter of the third chamber is usually stored in the connected pressure vessel wall and the PCM volume. When the PCM in the third chamber is completely melted, the outer temperature
of the PCM chamber also increases significantly. The low heat transfer coefficient of the steam is also a limiting factor during discharging. During 150 min discharging, the temperature in the third chamber did not reach the phase change temperature. Thus, the PCM did not start solidifying. The PCM in the other chambers began to solidify, but was not finished at the end of the simulation, as shown in
Figure 14b, wherein the curves for the solidified layers of the first and second chambers are congruent. Therefore, the LHTES was not completely discharged at the end of the simulation. Since heat losses were not neglected, it is possible that the outer temperature of the PCM cylinder decreases below the phase change temperature before the whole PCM mass is solidified. In
Figure 14a, it is hardly noticeable that the outer temperatures of the first (
) and second (
) chamber fall just below the phase change temperature when the PCM is not fully solidified. In reality, the PCM would start to solidify at the outer diameter. This effect was neglected in the presented model. The example shows that the model is very useful for understanding the limits and the interaction between the two different storage types. However, practical experiments must be carried out to validate the whole hybrid storage model. Convective heat transfer inside the PCM should increase the performance of the hybrid storage during charging and will be part of further investigations.
5. Conclusions
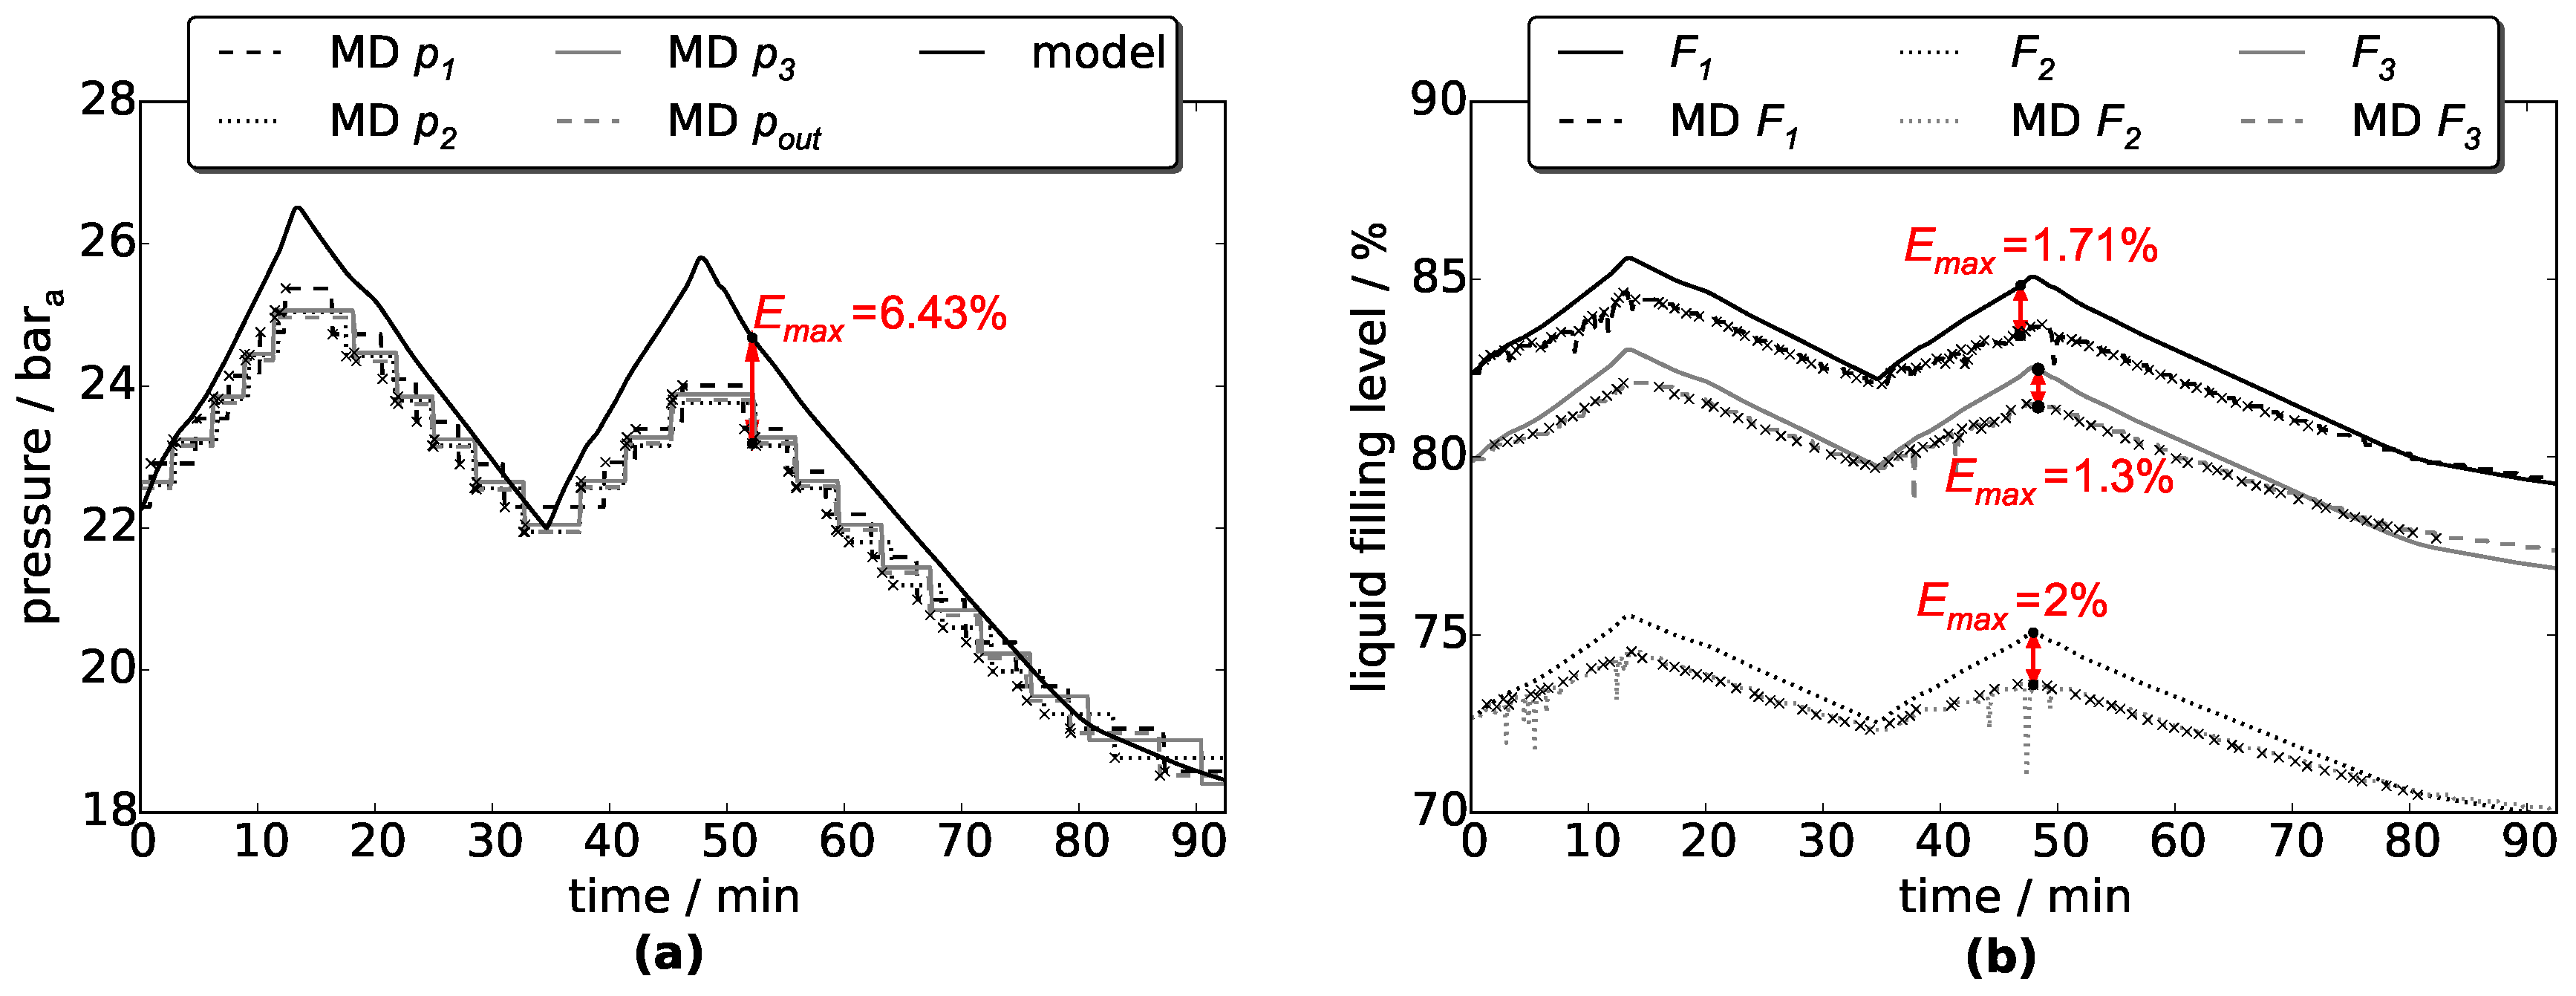
In this contribution, a model of an innovative hybrid storage concept is presented. This hybrid storage model consists of sub-models. The main sub-models are the LHTES and the RSS sub-models. In the model, it is possible to divide the LHTES sub-model into several chambers and define different PCM properties for each chamber, where a symmetric structure related to the vertical axis of symmetry for the arrangement must be considered. Furthermore, the activation of an additional heat source at the inner diameter of each LHTES chamber is possible. To model the heat transfer between the two-phase fluid inside the RSS and the surrounding wall, different heat transfer coefficients are used, depending on the water phase and the temperature at the internal side of the RSS. Furthermore, two examples are presented to validate the RSS sub-model with operational measurement data of an RSS line consisting of three storage vessels. For the presented examples, a maximum deviation of 6.43%, in terms of pressure inside the storage vessel, occurs by comparing the simulation results with operational measurement data. The validation examples show that the RSS sub-model provides very good results to describe the state inside an RSS compared to operational measurement data. The LHTES sub-model is verified by comparing the simulation results with the analytic solution for the total solidification time.
Moreover, the simulation results of a hybrid storage example show that the maximum pressure in the hybrid storage is 5 bar lower compared to the Ruths steam storage for the same amount of stored energy. The limiting effect of a low heat transfer coefficient between the pressure vessel wall and the steam phase is noticeable in the results. The hybrid storage can be an interesting component for industrial processes if the heat transfer in the PCM is improved, as it combines the fast reaction time of a Ruths steam storage with the high storage capacity of PCMs. Practical investigations are required to validate the entire hybrid storage model and to determine the heat transfer between the two-phase fluid and the surrounding PCM. The inclusion of convective heat transfer inside the PCM, as well as temperature-dependent material properties, will be part of future investigations.


