Article

Analyzing National and Local Pathways to Carbon-Neutrality from Technology, Emissions, and Resilience Perspectives—Case of Finland

Aalto University, School of Science, New Energy Technologies Group, P.O. Box 15100, FI-00076 Aalto, Espoo, Finland
*
Author to whom correspondence should be addressed.
Energies 2019, 12(5), 949; https://doi.org/10.3390/en12050949
Submission received: 30 January 2019 / Revised: 28 February 2019 / Accepted: 6 March 2019 / Published: 12 March 2019

Abstract

:
The Paris Climate Accord calls for urgent CO2 reductions. Here we investigate low and zero carbon pathways based on clean electricity and sector coupling. Effects from different spatialities are considered through city and national cases (Helsinki and Finland). The methodology employs techno-economic energy system optimization, including resilience aspects. In the Finnish case, wind, nuclear, and biomass coupled to power-to-heat and other flexibility measures could provide a cost-effective carbon-neutral pathway (annual costs −18%), but nuclear and wind are, to some extent, exclusionary. A (near) carbon-neutral energy system seems possible even without nuclear (−94% CO2). Zero-carbon energy production benefits from a stronger link to the broader electricity market albeit flexibility measures. On the city level, wind would not easily replace local combined heat and power (CHP), but may increase electricity export. In the Helsinki case, a business-as-usual approach could halve emissions and annual costs, while in a comprehensive zero-emission approach, the operating costs (OPEX) could decrease by 87%. Generally, electrification of heat production could be effective to reduce CO2. Low or zero carbon solutions have a positive impact on resilience, but in the heating sector this is more problematic, e.g., power outage and adequacy of supply during peak demand will require more attention when planning future carbon-free energy systems.

1. Introduction

The recent report from the UN International Panel of Climate Change (IPCC) enforces the urgency to meet the emission targets set in the Paris Climate Accord from December 2015 [1]. Basically, the whole energy production needs to be brought to carbon neutrality by 2050, i.e., sources and sinks of CO2 emissions need to be in balance by then. Considering that 80% of global energy is still based on fossil fuels, the transition required to carbon neutrality will be a huge technological and societal challenge in the coming decades. The transition ahead touches all sectors of society and energy.
IPCC and the International Energy Agency (IEA) [2] show in their future climate-energy scenarios that new and renewable energy technologies along with energy efficiency will play a major role in the up-coming sustainable energy transition. Around three-fourths of required emission reductions could originate from this ‘clean new energy’ pool. At the same time, recent market trends indicate that the variable renewable technologies, such as solar photovoltaics and wind power are taking increasing shares of new investments in power [2], driven by the reduction of costs of new technologies which have led in cost-parity in major markets. Their future share is expected to even increase from the present level [2]. Actually, solar and wind are often considered as the key technologies in energy change. The challenges with variable renewable electricity are well-known, ranging from the temporal mismatch challenge between supply and demand to increasing price fluctuations of electricity [3,4,5], which will need innovative technological and systemic solutions.
In spite of these challenges, solar and wind power offer a highly potential alternative for the future not just for power production, but for the energy sector as a whole. Larger amounts of variable renewable electricity (VRE) could be integrated to the power system not only through large energy storage schemes, but also through sector coupling, i.e., coupling power to heating, cooling, mobility, gas, and other end-use sectors through power-to-X conversion (P2X, X standing here for the end-use or final form of energy) [6]. In the case of P2X schemes, energy sectors (other than power sector) having inherent storage could participate in providing flexibility. The power-to-X has been extensively researched recently as part of the energy transition and in particular in connection with 100%-renewable energy systems [7,8,9,10].
A key focus of this paper is applying sector coupling to energy transition analysis, in particular power-to-heat (P2H) as a key technology for incorporating large-scale VRE schemes in a national and a city context, to also investigate the difference incurring from the size of spatiality (country–city). P2H is relevant as thermal energy actually dominates final energy use and as it is cheap and easy to store, e.g., in Finland 83% goes for household heating [11], in Europe 80% [12]. We use cold-climate cases Finland and Helsinki for our analyses, which offer further interesting perspectives, such as a trade-off between nuclear and renewables, limits of P2H for heating, a trade-off of forest bioenergy use between energy and CO2 sinks, upper limits of VRE utilization, etc. These dimensions offer new perspectives to the issue of carbon-neutrality pathways. Also, Finland has among the highest CO2 emissions per capita in the EU [13]. The recent decisions of the Finnish government to ban coal for energy use and halve the oil use [13] is a step in this direction with international relevance as well. We depict here technological pathways to carbon neutrality by 2050, analyzing the cases through three major framings, namely technologies, emissions, and resilience. We mainly focus on the power and heating sectors, but in the national analysis all end-use sectors in energy are included.
Carbon-neutral pathways has received increasing interest in literature, e.g., for Canada [14], the US [15], the UK [16], Switzerland [17], the Nordic countries [18] and the EU [10,19]. Pathways to a carbon-neutral Finland have also been previously analyzed: Lehtilä et al. [20] presented several pathways a low-carbon economy in Finland by 2050, whereas Child et al. focused on a 100%-renewable energy system in Finland [21] and in the Åland islands [22]. Zakeri et al. [23] discussed the compromise between nuclear and wind power. However, these previous national studies have not considered energy system optimization while considering a wide range of nuclear power (both high and low) and limitations of biomass use. In addition, national-level and city-level pathways are hitherto rarely considered together in literature, which is the subject of this paper.
Cities’ role in the energy and environmental transition, whether based on IPCC’s emission mitigation, adaptation, or both strategies, is becoming a priority for local decision makers. Many cities world-wide have set goals to reach carbon neutrality already before 2050 [24]. Strategies chosen include e.g., green energy schemes to cut CO2 emissions or urban green zones to create carbon sinks. Previous work in this field for Helsinki include e.g., developing matching profiles for local decentralized energy production and consumption, optimization of local energy production, and wind curtailment schemes [25,26]. Essential technology improvements, such as electric vehicles, zero-emissions space heating, and carbon capture and storage for low-carbon pathways in cities have been analyzed for Beijing [27], Tokyo [28], Madrid [29] and Mexico City [30]. Advanced approaches to managing large renewable energy schemes have been studied for e.g., Shanghai and New Delhi [31].
The clean energy transition means a radical change in energy sources and the whole energy system. This affects the security and risks of energy systems, but is often overlooked in energy pathway analyses. Traditionally, the International Energy Agency (IEA) has defined energy security through availability and affordability of energy sources [32], but also further definitions are used, such as including accessibility and acceptability in the definition [33]. Azzuni and Breyer defined energy security through optimal and sustainable functioning in all system dimensions, freely from any threats [34]. Definitions and metrics are listed in reviews [33,34,35].
As the energy transition includes profound changes in the whole energy system, broadening energy security to resilience issues will be highly important, discussed also in this paper. Resilience is defined through four ‘Rs’: Robustness, redundancy, resourcefulness, and recovery [36,37]. For example, the resilience of a decentralized power production system differs considerably from a centralized one against factors, such as geopolitics [38,39,40], climate-change-induced extreme weather events [41,42,43], or digitalization-linked cybersecurity [44,45]. We include here a systematic resilience analysis of the national and city-level clean energy pathway scenarios.
The paper is organized as follows. We first present the methods and tools used in our analysis, followed by presenting the input data and scenarios used in the analysis, followed by the key results and discussion and conclusions.

2. Methods

An energy transition involves several co-evolving systems such a techno-economic, socio-technical, and political system, which all need to be ‘optimally’ in place to enable a change into carbon neutrality [46]. Often, as also in this paper, the focus is on the techno-economical system.
Therefore, our approach uses a modeling approach based on techno-economic optimization of the energy system. The mathematical task is to seek for a minimum-cost solution under different constraints and boundary conditions, originating from endogenous and exogenous factors. Two optimization models are included here: A macro-level model intended for national level analysis aimed at demonstrating carbon-neutral pathways for the energy system as a whole, and a micro- level model with more detailed description of the local energy system considering e.g., transient operation of the various power plants and how they interact on a short time interval. Instead of using a single model, the two scales of modeling (the whole national energy system with courser resolution, but all-inclusive in energy sectors, and a detailed closer to ‘real-time’ simulation of the energy system of a city) allow focusing on the investigating the dynamic and systemic effects of different options and degrees of freedom which may be different in a city and a country, and thus yield different outcomes for the pathways to carbon-neutrality. Finland is used as the case study for the national analysis and Finland’s capital Helsinki for the city-level analysis.

2.1. National-Level Model

The national-level energy system analyses are conducted with a macro-scale energy system simulation and optimization model, which is described in detail in Reference [47]. The model incorporates all aspects of an energy system, including electricity, heat, and fuel; also, all end-use energy sectors are included. The model employs a one-hour time step for electricity and heat, while fuel demands are considered on an annual scale; the energy system is simulated on an hourly basis over a year to consider the dynamics and interactions of its different segments. The model seeks for a cost-optimal solution of the energy system while securing the supply–demand balance. The cost optimization problem is defined as
M i n i m i z e   Total annual   cost = t = 1 t e c h ( Investment   cost t + O & M t ) + f = 1 f u e l s Fuel   cost f + Net   cos t   of   power   import + Emission   costs .
The optimization is subject to several conditions:
  • Balance of final energy supply and demand;
  • Available renewable energy resources;
  • Energy system constraints, e.g., cross-border transmission capacity;
  • Environmental constrains, e.g., CO2 emission target.
The variables in the optimization are the amounts of the primary energy sources, including renewable energy sources, and the amounts of different energy conversion technologies, such as combined heat and power (CHP), separate production, and heat pumps (HP). Also, more advanced final energy conversion paths can be considered: Power-to-X technologies (P2X), such as power-to-heat and power-to-gas, biomass-to-liquid (BTL), gas-to-liquid (GTL) and vehicle-to-grid (V2G). The energy system composition is thus endogenous to the model. The hourly distribution of the conventional production, such as CHP, is based on historical production data (2013) to mimic the hourly distribution, whereas the operation of power-to-X and other advanced conversion is rule-based. The main optimization outputs are the primary energy composition, power and heat production, and the energy balance of the system, while the main inputs are historical consumption and temporal data, cost assumptions, and system constraints, such as the cross-border power exchange capacity.
The model uses 2013 as the reference year for input data; a more detailed description of the input data can be found in Reference [47]. The level of industrial CHP and residential heat production, which accounted for 43% of the heat demand in Finland in 2013, are assumed non-variable.

2.2. City-Level Model

The details of the optimization-based model for the city-level analysis are explained in Reference [25]. The model simulates the operation of all energy plants of a city, in this case Helsinki, where more than 90% of the building stock uses district heating (DH). The optimization is based on one-hour-timestep simulations over a year using a mixed-integer linear programming (MILP) approach, written in Matlab code. The objective function of the optimization is given as
M i n i m i z e   Yearly running   costs = t = 1 t i m e i = 1 t e c h ( Fuels t , i + Emission   costs t , i + O & M t , i Revenues   from   sales t , i ) ,
where t stands for time and i is the applied energy production technology. The model thus basically minimizes the running cost of a given energy system (OPEX) and its energy plants, whereas adding the annuity of the investments (CAPEX), as in the national model, would also enable optimization of a whole energy system. The latter option was not, however, relevant here as typically a city has already an existing system to which the new energy and variable renewable electricity (VRE) technologies are integrated. The running cost of thermal storage and power-to-heat conversion (P2H) were assumed negligible. The model considers three main constraint categories: Technical limitations of individual power plants, such as maximum power and heat outputs, ramping, start-up and shutdown times; limitations on system components e.g., power-to-heat conversion, storage capacity, and power transmission; and balance requirement between energy demand and supply.
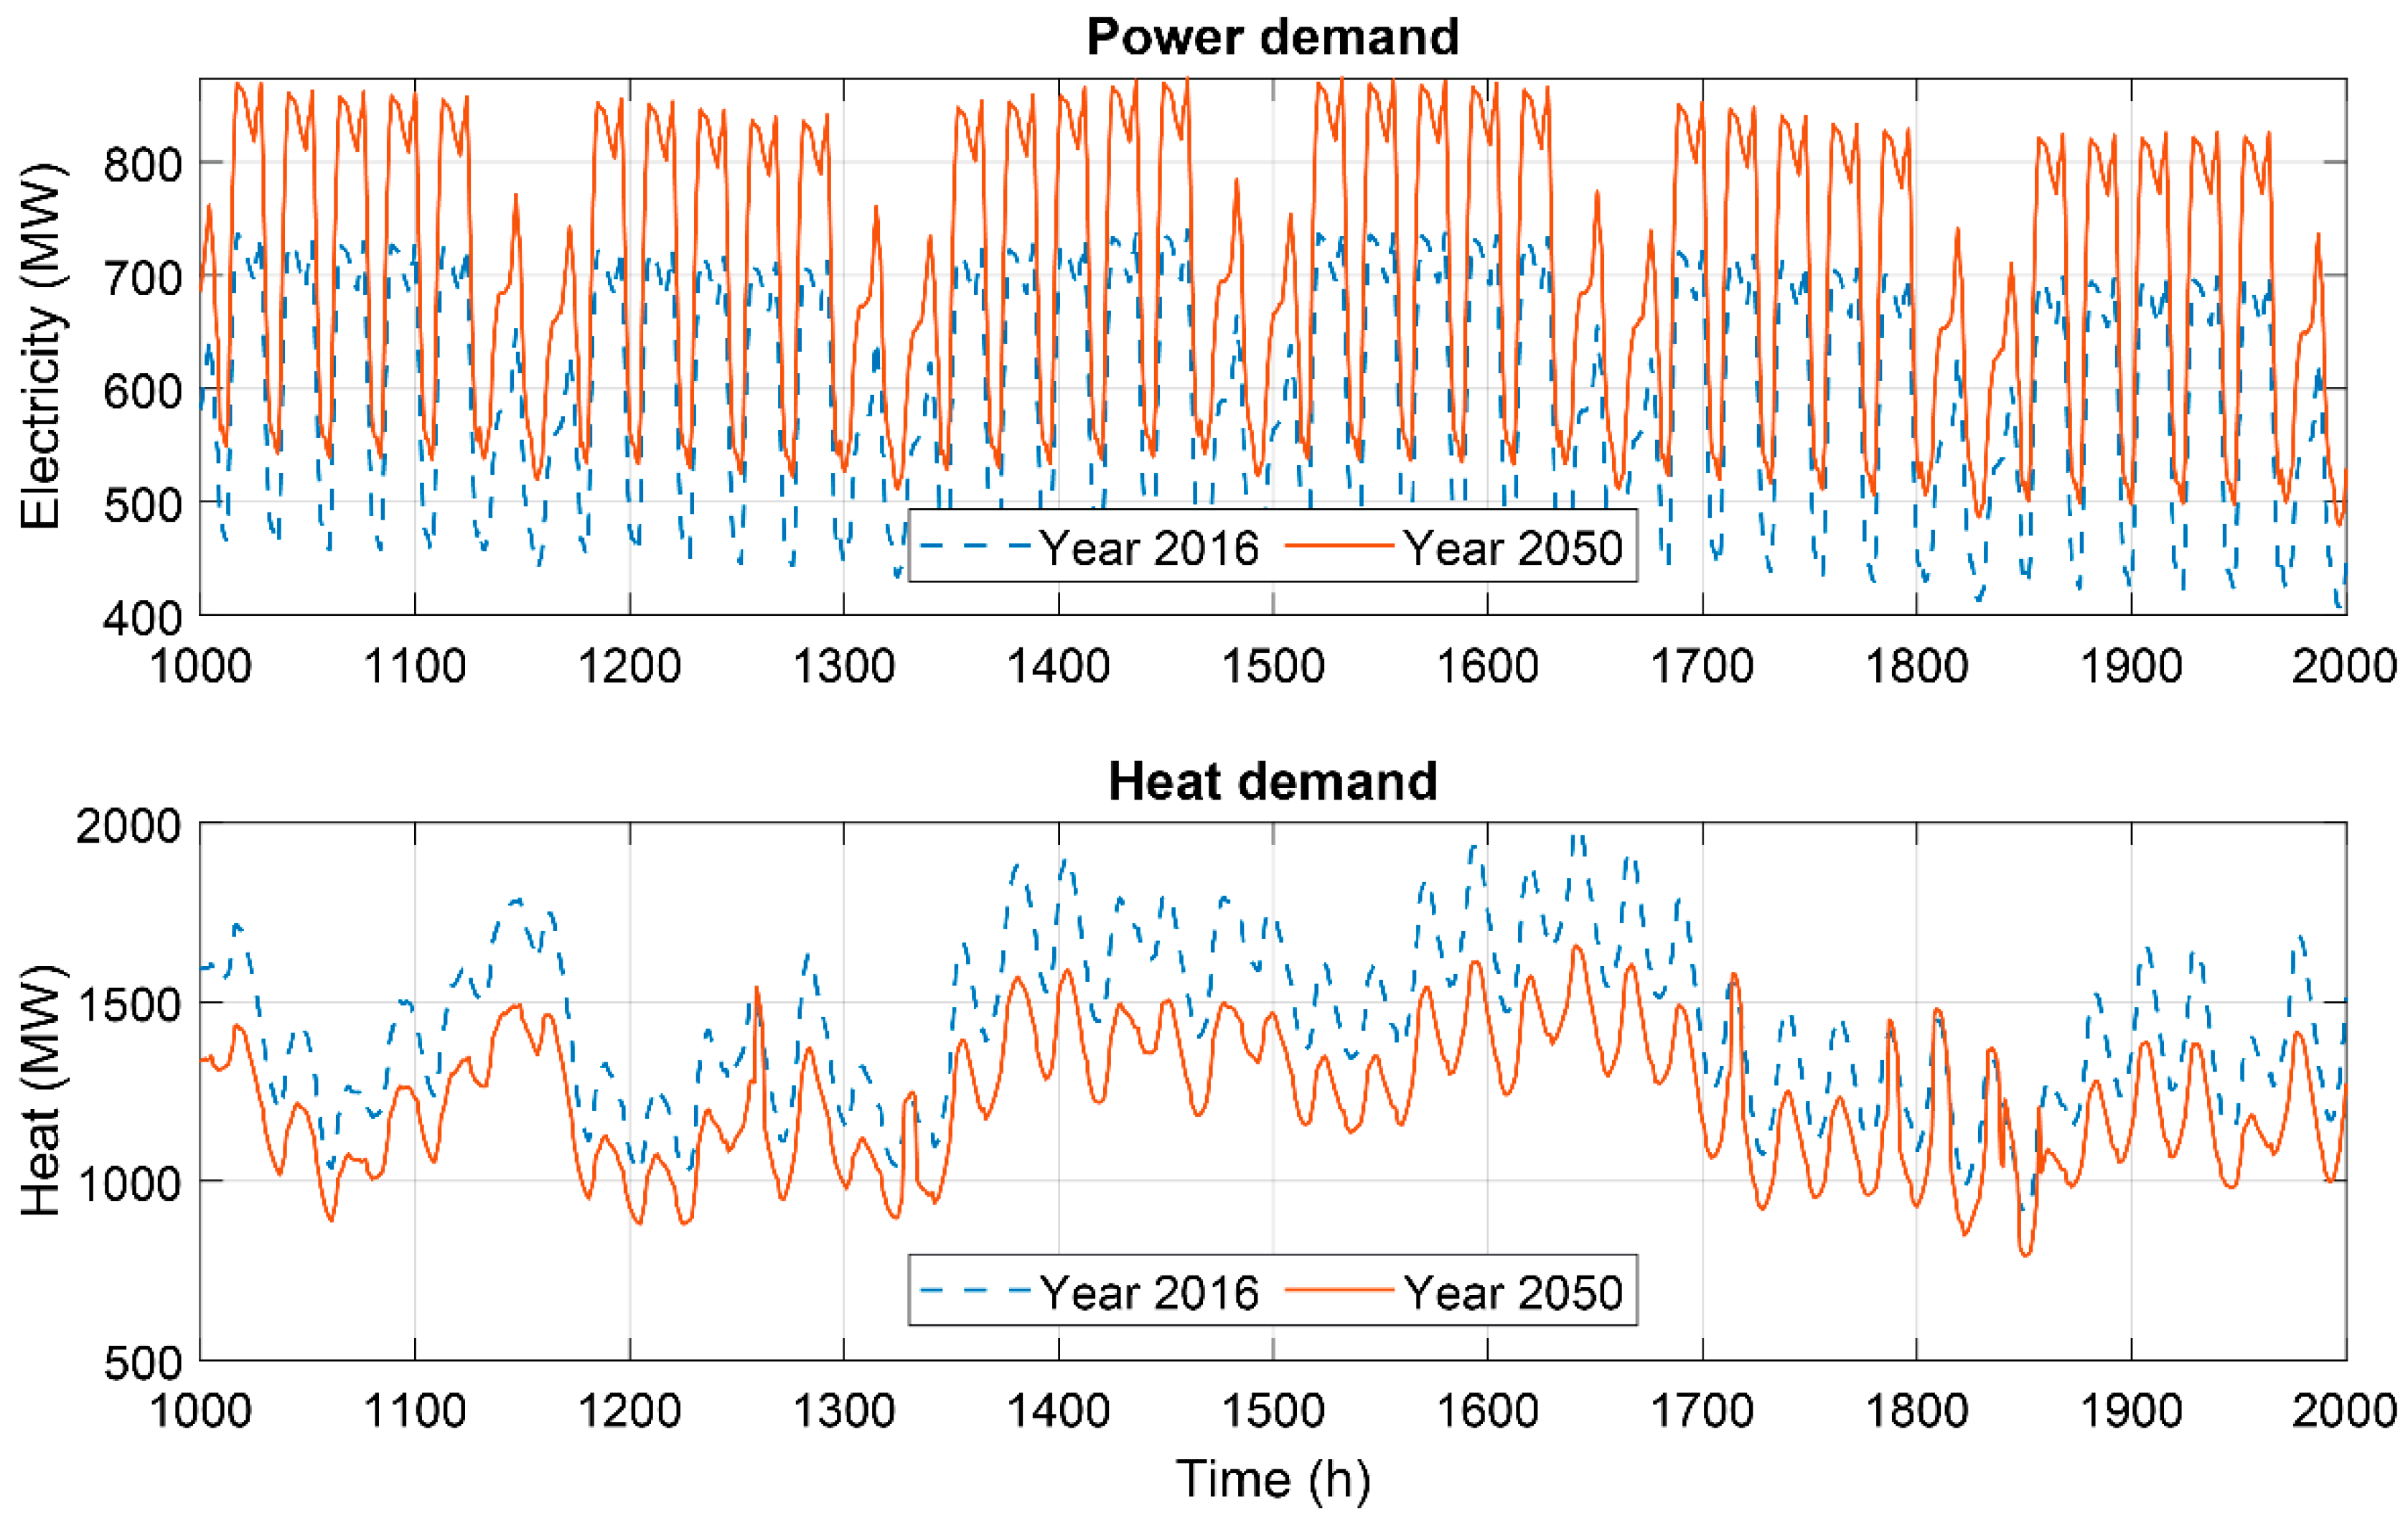
For the 2050 analyses, the heat and electrical demand profiles were also modified from the reference case (2016) to reflect changes in population and building energy efficiency improvements. The mean building energy efficiency was assumed to improve by 20% from the 2016 level through better thermal insulation, heat recovery, advanced windows, thermostat control, etc. The domestic hot water (DHW) demand was scaled to perceived population changes in 2050 [11]. The heat demand profile was modified using the following approximation:
Heat   demand ( t ) = p o p 2050 p o p 2016 D H W 2016 ( t ) + α   U 2016 [ T i n d o o r ( t ) T a m b ( t ) ] + , where   [ X ] + = X   if   [ X ] + > 0   and   [ X ] + = 0   if   [ X ] + 0 .
where U is the average U-value for the whole building stock, p o p stands for population, T i n d o o r = 17 °C considering the internal gains in the buildings, α is the building energy efficiency improvements from the base year, 2016, and T a m b is the hourly ambient temperature. The electrical demand is also altered based on population increment.

2.3. Resilience Assessment

The resilience assessment of the energy system focuses here on the technical robustness and versatility of the energy systems and their ability to cope with different disruptions. For this purpose, we developed a resilience matrix described in Tables 5 and 6. The values for the different resilience factors were obtained from the scenario calculations for the national and city cases, some factors were also assessed quantitatively by expert elucidation.
The resilience factors are grouped into the following categories. Environmental resilience is based on CO2 emissions and the share of renewable energy in the primary energy. The sustainability of bioenergy is analyzed separately in a qualitative way considering possible effects on biodiversity. Power system resilience considers the robustness and flexibility of the power system infrastructure; the share of decentralized power production and supply adequacy during peak demand are considered as well. Supply adequacy is defined as a ratio between the total production capacity and the peak demand—the effect of VRE is considered via its yearly capacity factor (excluding the production that exceeds the demand) to account for its temporal variability and actual contribution in demand coverage. For power system flexibility methods, hydropower, P2H, and vehicle-to-grid (in national case only) are considered here. The heating sector is analyzed separately, due to its high importance at high latitudes. Factors included in the analysis are the robustness of the (district) heating networks, share of decentralized heat production, total heat production capacity vis-à-vis peak heat demand, and heat storage capacity. The resilience category ‘system independence and geopolitics’ both in case of electricity and heating was more related to traditional energy security emphasizing energy self-sufficiency to mitigate possible geopolitical threats and to secure local energy supply in crisis situations. In this category, the imports of electricity and fuels and the diversity of primary energy sources are considered. The level of diversity is defined with the Shannon–Wiener diversity index (SWDI) [48,49]:
SWDI = e p e ln p e
where p e is the share of the energy source e in the total primary energy supply.

3. Description of Scenarios

This section describes the various scenarios used to analyze the national and local pathways to carbon neutrality, as well as their input data. The scenarios aim for the year 2050.

3.1. National-Level Scenarios

On the national level, we mainly focus on different levels of nuclear power, wind power, and bioenergy as these may be the major future options for the Finnish case. Forest biomass offers a notable renewable energy source in Finland, as it forms 75% of all renewable primary energy [50]. However, the sustainability of forest biomass is under debate. To assess the pathways to carbon neutrality, a −95% CO2 emission reduction target (compared to year 1990 with 53.9 MtCO2) is included in the optimization, in addition to the cost minimization.
Scenarios with six different levels of nuclear power in 2050 were analyzed, ranging between 0 and 9450 MW (67% of electricity demand). At present, nuclear stands for 27% of electricity supply in Finland. The nuclear scenarios are based on combinations of existing, planned, and hypothetical nuclear units, presented in Table 1. The most extreme nuclear scenarios assume life-time extensions of existing Loviisa 1–2 and Olkiluoto 1–2 units, planned originally to be decommissioned by 2030. Apart from the level of nuclear power, the rest of the primary energy mix is subject to the optimization. As the scenarios aim for near carbon neutrality, limitations to renewable energy use have to be considered, e.g., their potential (Table A1). The production level of heat pumps is limited to one third of the residential heat demand reflecting the diversity in the heating market, but also possible limitations in heat source availability during the main heating season in the winter. The wind power curtailment is limited to 5% of the total wind power production. The biomass sustainability is considered by including two levels of forest biomass: “BIO norm” includes all biomass potential listed in Table A1, whereas in “BIO low”, the level of non-industrial forest biomass use is limited to residential firewood only.
The consumption in 2050 is assumed to follow the “Low 2050” consumption scenario in Reference [47] (based on Reference [20]), incorporating strong energy efficiency measures. The cross-border power exchange capacity is assumed to be 6760 MW (now 5176 MW). The cost data is presented in Table A2 and Table A3. The carbon price in 2050 is assumed to be 115 €/tCO2 [54], and the average Nordpool electricity price 57 €/MWh [20]. Otherwise, the input data is based on the reference year 2013, described in Reference [47].

3.2. City-Level Scenarios

For the city-level analyses, we take the existing energy system of Helsinki in 2016 as a starting point. Two options for 2050 are considered: Firstly, the preliminary plans of Helen (municipal utility in Helsinki) are used as the Business-As-Usual case, denoted BAU-2050 [55]. This option includes the closure of coal CHP and coal boilers, which are replaced with three biomass boilers; also heat-pump use is increased and peak oil boilers are redefined (see Table 2). The second option, denoted ZeroCO2, aims at total carbon neutrality, i.e., closure of all fossil fuel plants in Helsinki. The main clean energy options considered for ZeroCO2 are wind power, photovoltaics, and biomass (heat), but also large heat pump schemes which could make use of renewable electricity surplus through the P2H conversion. Large-scale thermal storage facilities based on existing infrastructure are also included. Large cities, such as Helsinki, are in general linked to the national grid which enables import and export of electricity though limited by the transmission capacity; here we use the Nordpool electricity exchange as the market place for Helsinki.
The HP capacity in the reference case (2016) is 90 MW and for the BAU-2050 we use 129 MW [55]. For the ZeroCO2 case, the HP output is set to 1024 MW corresponding to 50% of the peak heat load and a bio-boiler is employed to cover the rest of the heat demand along with some aid from heat storage as well. As in the national case, biomass is considered carbon neutral, and emissions from power import are excluded, since the focus of the scenarios is on local emissions.
The annual heat and electricity demand is 6.4 TWh and 4.4 TWh in the reference case, respectively. For BAU-2050 and ZeroCO2, the heat demand is 6.2 TWh and the electricity demand is 5.2 TWh. According to the model, the net import of electricity (=import-export) of Helsinki was 0.23 TWh of electricity in 2016. It is noteworthy to observe that the municipal energy company in Helsinki, HELEN, has also shares of power production outside Helsinki, which were not considered here. If accounting for those as well, the net import would turn to net electricity export of 2.04 TWh in 2016. Examples of the modified heat and electricity demands are shown in Figure A1.
The details of the energy system modifications are presented in Table 2. The reference system has an inherent heat storage capacity of 5000 MWh originating from the water volume of the district heating network, while in 2050, 11,600 MWh of active heat storage capacity is added to the 2016 level. In all scenarios different levels of wind power are considered: 0 MW, 750 MW (2 TWh/yr), and 1500 MW (4 TWh/yr) of wind power is considered, but in the ZeroCO2 scenario also 2500 MW (7 TWh/yr), which exceeds by 34% the annual electricity demand.

4. Results and Discussion

In this section, we analyze the options for future energy systems in 2050 on a national (Finland) and city-scale (Helsinki) energy system based on the scenarios described in Section 3. The aim is to minimize system costs, while considering technical constraints, energy supply and demand, and emission targets. In addition, resilience aspects are considered.

4.1. National Case (Finland)

In the national case, scenarios with six different levels of nuclear power were analyzed, while the rest of the energy system was subject to the optimization. All scenarios had a CO2 emission reduction target of −95%, in addition to cost minimization. The resulting primary energy composition (presented in Figure 1) illustrates clearly the main components of a possible (nearly) carbon-neutral Finnish energy system: Nuclear power, VRE (especially wind), and biomass. These three components form 88–95% of the primary energy consumption in the “BIO norm” cases, with the share of wind and biomass increasing with decreasing nuclear power. By including hydropower, the share of low-carbon primary energy is 94–99%. The biomass is particularly prominent in the transport sector, as 84–100% of transport fuel demand is covered by biofuels, enabling elimination of oil. Overall, 14% of transport energy demand will be based on electricity. Limiting the forest biomass availability (“BIO low”), however, causes the missing biomass to be replaced by natural gas to be used in heat and synthetic fuel production for transport, decreasing the share of renewables. The share of renewables in the primary energy is 43–93% in the “BIO norm” cases and 32–76% in the “BIO low” cases, whereas the share of renewables in the final consumption is 76–96% and 57–80%, respectively.
On the electricity production side (Figure 2), there is a clear trade-off between the two dominant forms of power production in the scenarios, namely nuclear and wind power: Wind power increases up to 68% of the electricity production with decreasing nuclear power capacity. In other words, the use of nuclear power seems to limit wind power integration, which is in line with [23]. Together, nuclear and wind power cover 66–80% of all electricity production in the scenarios, the rest being mainly hydropower, solar power, and industrial CHP. However, electricity import is also increasing (up to 18 TWh) with increasing wind power, suggesting that wind power integration to the energy system demands more interaction with the international power markets to balance the supply and demand. This is most likely caused by the highly variable temporal profile of wind power, compared with the constant nuclear profile. On the other hand, the net power export is higher with a higher share of nuclear power (up to 18% of production), as well as the overall power production, suggesting that the constant nuclear production does not always match all domestic consumption. In addition, increasing wind power increases the use of P2H, suggesting that wind power is more likely to be directed to P2H than nuclear power.
Heat production (Figure 3) in the scenarios shows a clear trend toward electrification: 58–78% of the heat production would be electricity-based, the higher shares occurring in cases of a higher amount of wind power. Simultaneously, the share of CHP in heat production drops dramatically, from 40% in 2013 to 6–11% in 2050. The −34% decrease in heat demand between 2013 and 2050 is based on the consumption scenario used in the study, assuming major energy efficiency improvements in new and old buildings. The electrification of heating is mainly due to the abundance of low-carbon electricity, compared to the limited supply of low-carbon fuels, i.e., biomass for CHP. The ratio between electric boilers and heat pumps is set by the heat pump limitation (one third of the residential heat demand, see Section 3.1). A sensitivity study reveals that if this limitation was removed, all P2H would go to heat pumps and no electric boilers, leading also to lower electricity demand as the overall P2H efficiency is improved. The limitations to biomass (“BIO norm” versus “BIO low”) do not seem to affect either the electricity or the heat production portfolio, the only exception being the addition of solar heat in the “BIO low” scenarios.
Finally, the CO2 emissions and annual system costs of the scenarios are presented in Table 3. Almost all “BIO norm” scenarios reach the given −95% emission reduction target, with the exception of the zero-nuclear case. Limiting the forest biomass supply, however, increases CO2 emissions on average by 16%-points, due to the increasing amount of natural gas, and the emission target is not reached in any of the “BIO low” cases (reduction being at most −80%). The biomass limitation also increases the annual system costs by 19% on average. However, the different levels of nuclear power seem to have little effect on the annual costs, as the difference between NUC 9450 and NUC 0 scenarios is only 12%. Compared to the reference case, the costs decrease on average 18% in “BIO norm” and 2% in “BIO low”.
One solution to the issues arising from limited biomass use is power-to-gas (P2G). P2G would eliminate the need for replacing the missing biomass with fossil natural gas, as synthetic gas could be produced by no-carbon electricity. P2G was absent in the previous scenarios as it was deemed too expensive in the optimization. However, to explore the possibilities of P2G, we conducted a separate sensitivity analysis on “NUC 2800 BIO low” scenario, in which all excess electricity would be directed to P2G instead of export. In this case, 21% of electricity production was used by P2G, and less natural gas was needed to cover for the missing biomass. The CO2 emissions decreased by 9%-points and the annual costs increased by 6%, suggesting that encouraging P2G use by disabling export seems to be beneficial, especially in the case of limited biomass potential. A similar conclusion was reached by Child et al. [21] whose 100% renewable scenarios leaned on P2G.
Overall, the national results suggest that with the assumed cost data, the level of nuclear power affects mainly the nuclear–wind balance and, consequently, the levels of power import and heat electrification, but the annual costs and CO2 emissions are affected only to a minor extent. The results also highlight that wind power, nuclear power, and biomass, coupled with power-to-heat and other flexibility measures, seem to be the key pillars in a carbon-neutral Finland. Even without any nuclear power, a nearly carbon-neutral Finland could be possible (−94% CO2 emissions with “BIO norm”), but reaching a 100% renewable Finland would require additional measures, such as expanding the renewable energy resource base or utilizing P2G, especially if forest biomass use is limited. Limiting the biomass availability mainly causes the changes in the fuel mix, as natural gas substitutes for the missing biomass, which consequently increases emissions and costs and prevents reaching the −95% emission reduction target. However, the increase in CO2 emissions may be compensated by the increasing carbon sink of forests, as less forest biomass is harvested, but a more detailed carbon sink analysis was outside the scope of this study. In 2017 the forest sinks were 27 MtCO2/yr [11].

4.2. City Case (Helsinki)

Three scenarios are considered for clean energy pathways. The details of these scenarios are explained in Section 3. In all scenarios, two wind power levels, 750 MW and 1500 MW, are studied, and in the ZeroCO2 scenario, also 2500 MW.

4.2.1. Case with the Reference System (2016) and Wind Power Integration

The first case deals with integrating wind power into the existing energy system in Helsinki (excl. shares of power production outside Helsinki) using 2016 as the reference. Figure 4 shows the associated changes in electricity and heat production. Due to the large need for local heat production, adding wind power would not lead to a dramatic decrease in fossil-based energy production. Most of the heat (85–87%) in Helsinki is produced by CHP, in which power and heat are produced at the same time. Therefore, adding wind power would not actually reduce much CHP production as heat must be produced anyway. Instead, the integration of wind power would lead to increased power exports to the Nordic electricity market. For example, in the scenario with 1500 MW of wind power, 46% of the local annual power production would be exported, which is significantly higher than 16% in the reference scenario. Due to the low CO2 emission cost (8 €/tCO2) and advantageous coal to gas price in 2016, adding wind power would actually favor coal over gas in CHP. In this scenario, the emissions would be around 2.7 MtCO2/yr, which is 20% lower than in 1990.

4.2.2. BAU-2050 Scenario

In the BAU-2050 scenario, large wind power schemes are analyzed in a business-as-usual case in Helsinki for the year 2050. Figure 5 displays the changes in power and heat production. Though all fossil-based CHP generation cannot be eliminated, i.e., 63–67% of the heat comes from gas-CHP, a notable share of fossil-free heating is achieved through biomass-boilers (20%) and electric heat pumps (9–13%). Increasing wind power leads to significant power export, e.g., with 1500 MW of wind power, 38% of the local annual power production is exported to the Nordic electricity market (with no wind power, the exports are only around 3%). The CO2 emission reduction from the 1990 level is 1.7 MtCO2/yr (−50%) and 21% lower than the 2016 level with 1500 MW wind power.

4.2.3. ZeroCO2 Scenario

The third scenario targets for a 100% fossil-free energy production system in Helsinki in 2050, eliminating fossil-based plants by incorporating large PV and HP schemes along with wind power (0–2500 MW) (see Table 2 for details). Figure 6 shows the optimal energy system operation when varying wind power from 0 to 2500 MW. The bulk of the heat (92%) now comes through the heat pumps, which were sized to 50% of the peak heat load; the rest of the heat is covered through biomass boiler sized to meet the rest of the peak demand together with the heat storage.
With none of the existing CHPs in use and with zero wind power, the annual electricity import would exceed the basic electricity use in the city by 15% as electricity would also be needed for heating (HP), but this would lead to almost the same running costs as in the reference case (see Table 4). Adding wind power would reduce the share of imported electricity. However, higher wind shares would also lead to increased export of power, due to the increasing mismatch between supply and demand even if surplus wind power could be converted into heat through heat pumps and having major thermal storage capacity available. For example, with 2500 MW of wind power, the share of the imported power would be reduced by 60% compared to 0 MW wind, but the amount of exported power would also increase from close to zero to 3.5 TWh (67% of electricity consumption, excl. electricity for heating). This would emphasize the linkage of a city to the larger power market as one important strategy for energy system flexibility when targeting for zero emissions.
Comparing the emissions of all three scenarios in Table 4 (emissions are compared to 1990 level which is the base year for calculating emissions reductions) shows that in case of the reference system, introducing large wind power schemes would not much affect the total emissions, due to heat and system limitations described in previous sections. We see the same kind of insensitivity of emission reductions to the share of wind power in the other scenarios as well, again explained by the major share of heat in the total final energy. However, the yearly running costs compared to the year 2016 level would drop with increasing wind share: In the BAU-2050 scenario with 1500 MW of wind power the drop in running costs was 50%, whereas in the ZeroCO2 scenario with 2500 MW of wind the costs dropped 87%.

4.3. Resilience Analysis

Two future scenarios both for the national and city case were chosen for the resilience analysis: In the national case, a high-nuclear scenario (“NUC 9450 BIO norm”) and a zero-nuclear scenario (“NUC 0 BIO norm”) represent the two extremes among the national nuclear scenarios (this also applies for the wind power share). As far the resilience is concerned, the “BIO norm” and “BIO low” were assumed to be similar, the only difference being increased CO2 emissions and fuel imports, due to increased use of natural gas. In the city case, we consider the BAU-2050 case and the zeroCO2 case, both with 1500 MW of wind power.
The results of the resilience analysis are presented in Table 5 and Table 6. In general, all scenarios improve the overall resilience from the reference case, but with respect to some single resilience factors, the change could, however, be negative.
All scenarios chosen cut the CO2 emissions radically from the reference case, and also increase the share of renewable primary energy sources, both of which enhance environmental resilience. On the other hand, the increased use of bio-energy might raise risks of biodiversity losses, due to excessive forest logging, which could have negative environmental effects. However, in these scenarios, the harvest levels are below the national sustainability levels [20,56], and most biomass used for energy is based on residues from the forest industry.
The power system resilience increases in the scenarios as well, mostly due to the decentralization and the flexibility from the heat sector coupling. Decentralization improves resilience, since the failure of a small local production unit does not affect the whole system in such a way than a large central unit. In the scenarios, the share of decentralized production (wind and solar) increase remarkably, although the ZeroCO2 city case relies somewhat on power imports (which we assumed here carbon neutral). Furthermore, decentralization of production means that investments are needed to the distribution and transmission system as stronger connections must be built to the new energy production sites, and old links may need to be strengthened to meet the new-kind-of variable production [57]. Thus, power grids are expected to become more robust in the future. In addition, connections to neighboring countries are also expected to strengthen [57,58]. A possible drawback is a decrease in the adequacy of production during peak demand, especially in the city case. Today, Finland is dependent on electricity imports (19% of all electricity demand), whereas Helsinki City is capable of producing all its power locally. In the scenarios, the national situation does not remarkably change, but in the city case, the adequacy drops quite much, especially in the ZeroCO2 scenario. The nominal capacity of the plants would be sufficient both nationally and on city-level, but the variability of wind and solar production implies that the adequacy of peak power does not reach 100%. The three factors related to the flexibility of production (hydropower, heat sector coupling, and energy storage) do not show a clear improvement to the reference case, except for some strengthening in heat sector coupling. The relative share of hydropower actually decreases, and the role of vehicle-to-grid storage in the future scenarios is only slightly higher than in the reference case. Demand response and batteries can provide flexibility as well [6,59], but they were excluded from our scenarios.
In the heating sector, it is more questionable whether resilience improves at all. The role of decentralized production (here heat pumps, and electric and residential boilers) strengthens, which enhances the independence from large centralized units. This could, however, lead to reduced need for DH systems and the loss of their advantages, such as intrinsic storage capacity and balancing the spatial differences in demand and supply. Thus, we have estimated that the change in resilience (factor 3.a in Table 5 and Table 6) is neutral. The total production capacity in the national case is calculated as the maximum production divided by the peak demand, since our national model does not explicitly include the total production capacity. In general, the capacity in combustion-based heating plants is sufficient even during extreme cold seasons, whereas the electricity-based production is vulnerable to black-outs and also their production capacity is typically more limited. In the city case, the heat production capacity (Table 2) was chosen so that it can still satisfy the peak demand, but not providing back-up over that. In practice, the capacity should be larger, since the heat supply must be guaranteed during even colder periods than modeled here (thus notation “>100”) and during a possible power outage.
From the system independence and geopolitical perspective, the positive change from the scenarios chosen is the clear decrease in electricity imports (except the city ZeroCO2 case). A remarkable improvement in the city scenarios and the national zero-nuclear scenario is the reduction in foreign fuel imports. The increased fuel imports in the high-nuclear scenario are because of the higher demand for uranium fuel. Here we have assumed that all biomass is domestic, even though some foreign biomass could be used [56]. The versatility of the primary energy sources (SWDI) increases in the city case, but decreases on the national level.

4.4. Limitations of the Study

The main limitation of this study is the lack of detailed spatial analysis, though spatiality is considered through national and city-level cases. On both spatial levels, we have modelled the country and the city as a single node, without power and heat flow restrictions within the energy system. Conducting a grid-based analysis would be useful to highlight potential issues related to power distribution, and regional demand and supply balance. However, this was outside the scope of the present study and modelling approach used. Future work will, however, include extending the models to better cover spatial dimensions and to integrate resilience factors to these as well.
The resilience question of energy systems is a highly complex and multidisciplinary topic, for which reason not all resilience aspects could be included here. These include e.g., cybersecurity issues (see e.g., References [44,45,60,61]), occurrence of extreme weather events [62,63], terrorist attacks [64,65,66], human operator errors [67,68,69], faulty investment decision making [70,71,72], and the resilience of the whole transport system and related infrastructure [73,74].
Another point of importance is that only deterministic costs were employed without uncertainty ranges. Including uncertainties in the future costs could potentially affect the outcomes. Furthermore, the city-level linear optimizer applied does not consider nonlinear factors in order to take advantage of convexity of linear problems in finding a globally optimal solution, which may slightly idealize the performance of some of the technical systems.

5. Conclusions

In this study, we have analyzed low-carbon and carbon-neutral scenarios simultaneously for a country (Finland) and a city (Helsinki) for 2050, with interest in possible systemic differences in solutions and consequences. Both cases were handled with different energy system models based on techno-economic optimizations: The national-level model focused on macro-scale optimization incorporating all aspects of an energy system, including electricity, heat, and fuel, while the city-level model optimized in detail the operation of a local energy system with all energy plants. Both models include options for energy system flexibility, such as power-to-heat and thermal energy storage. In addition, we assessed the energy system resilience in the national and the city-level scenarios as this may change with energy system developments.
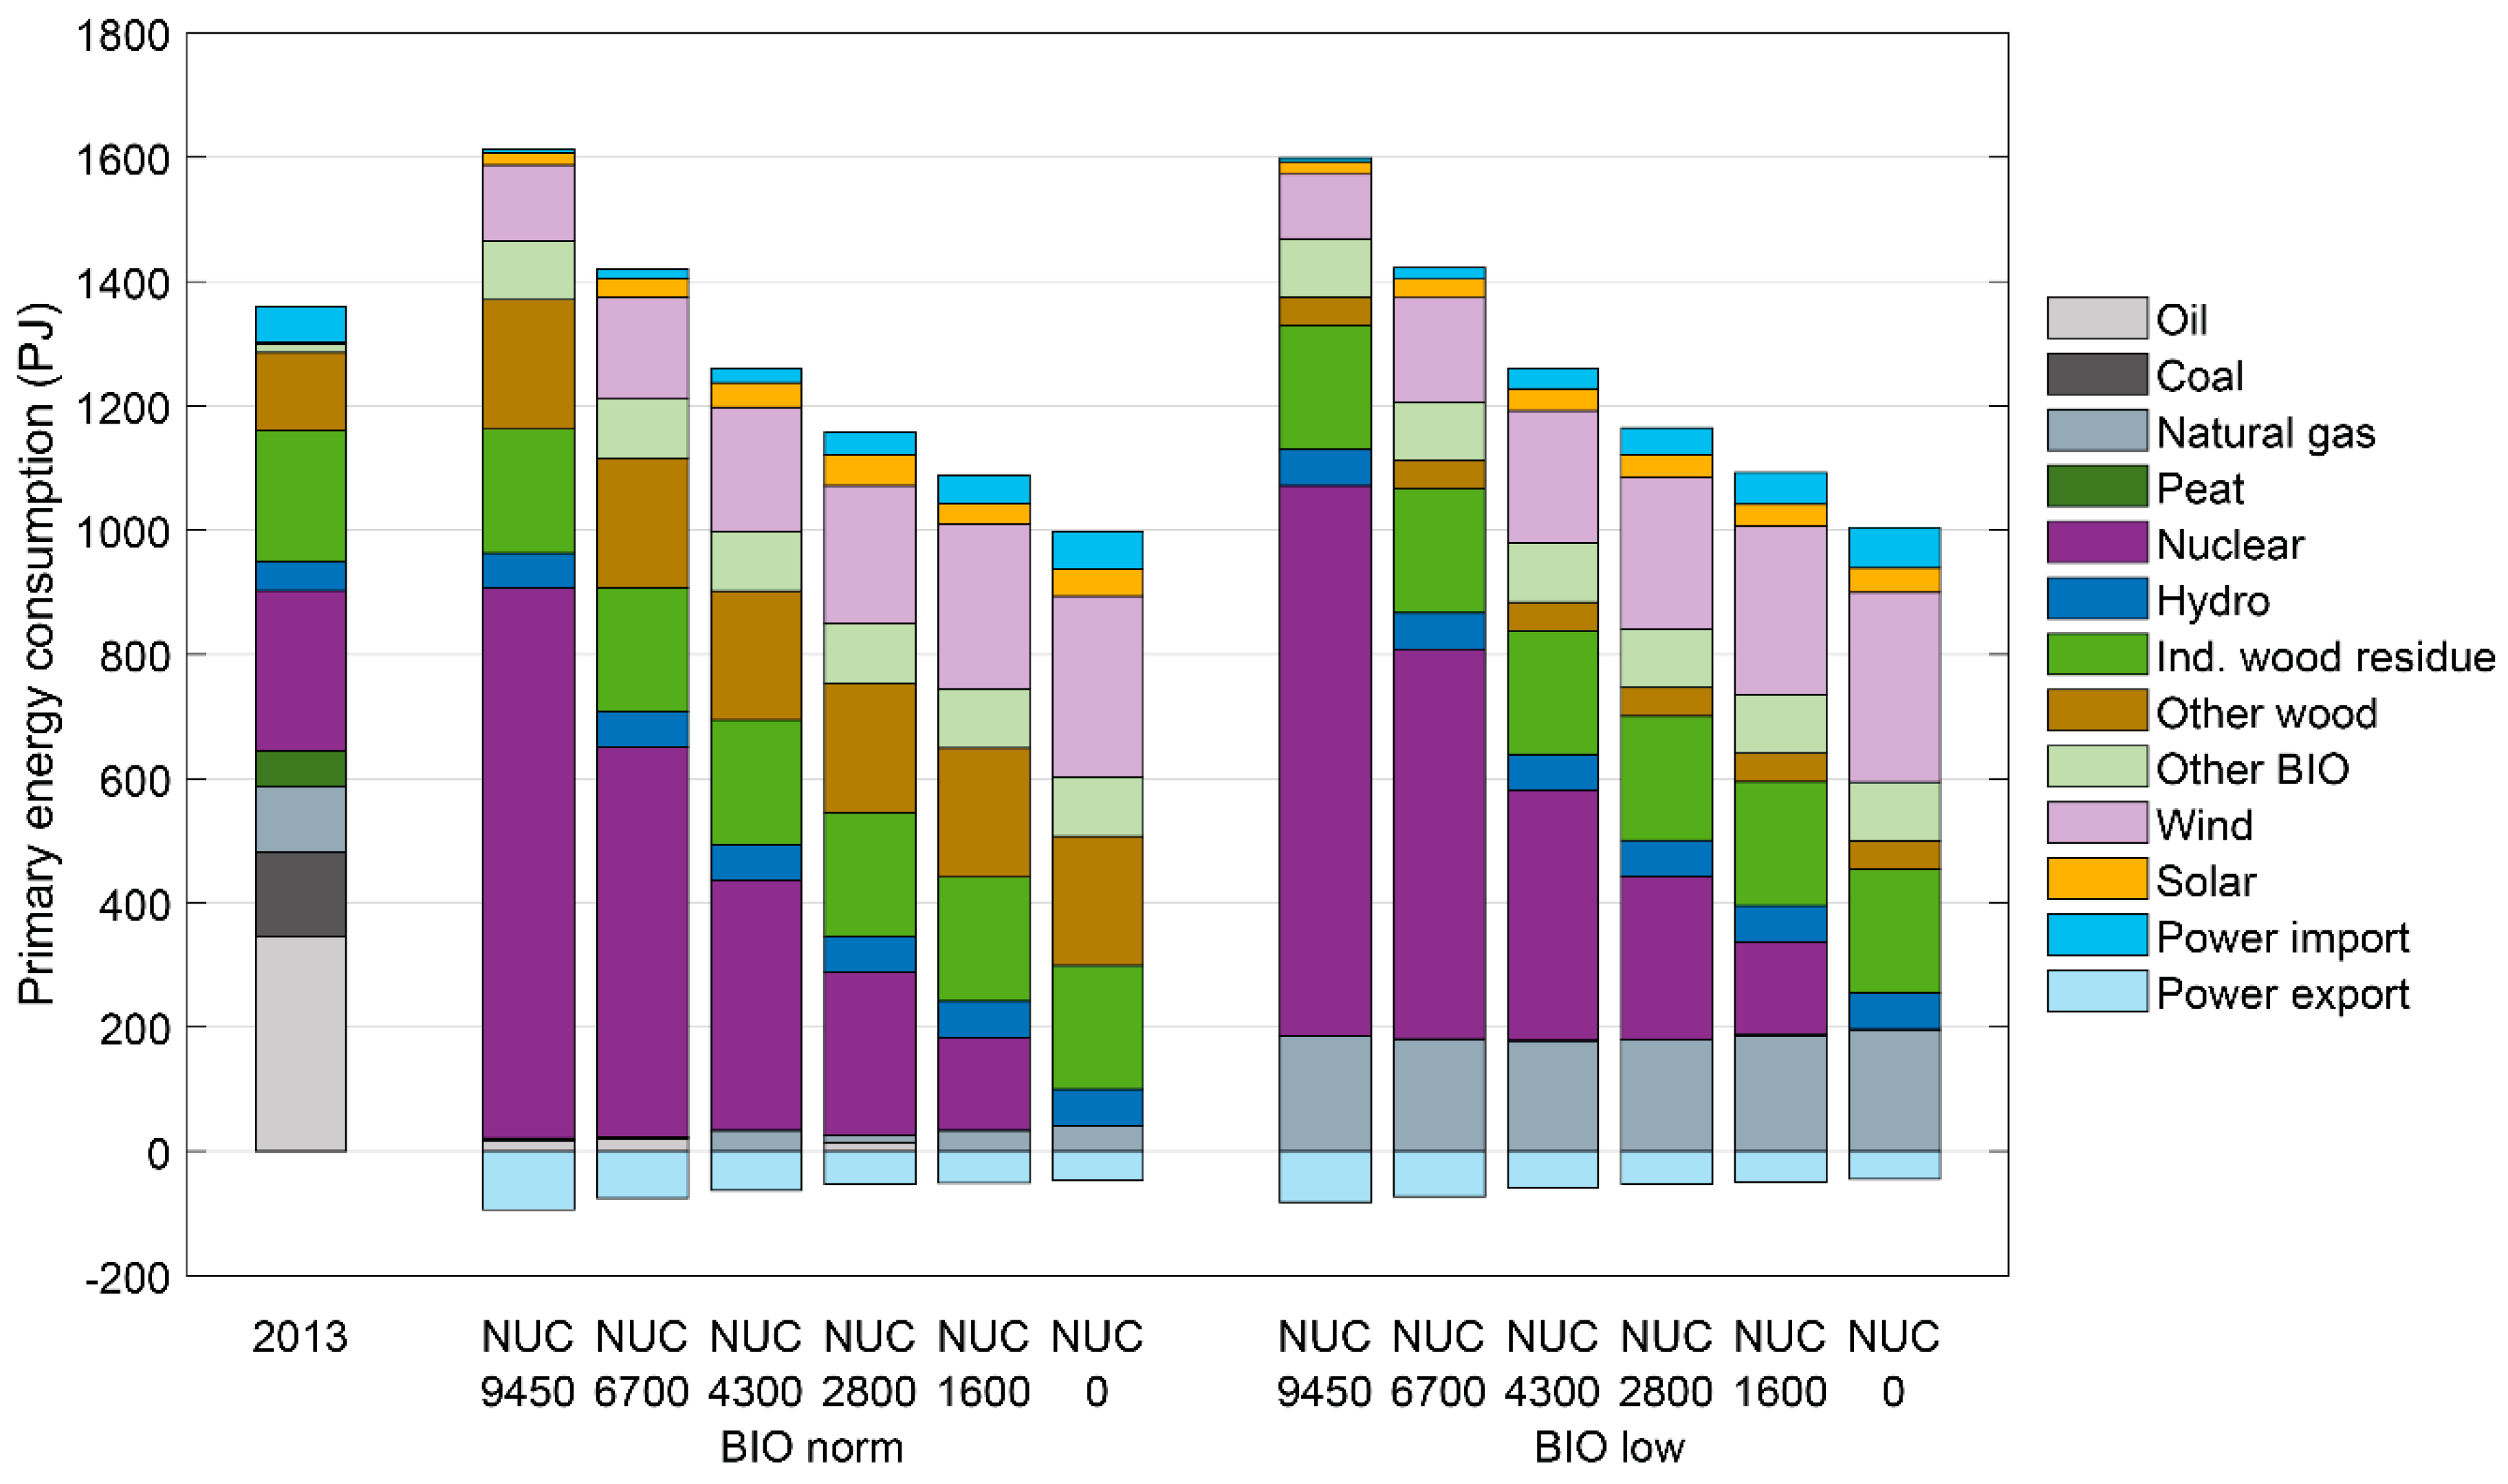
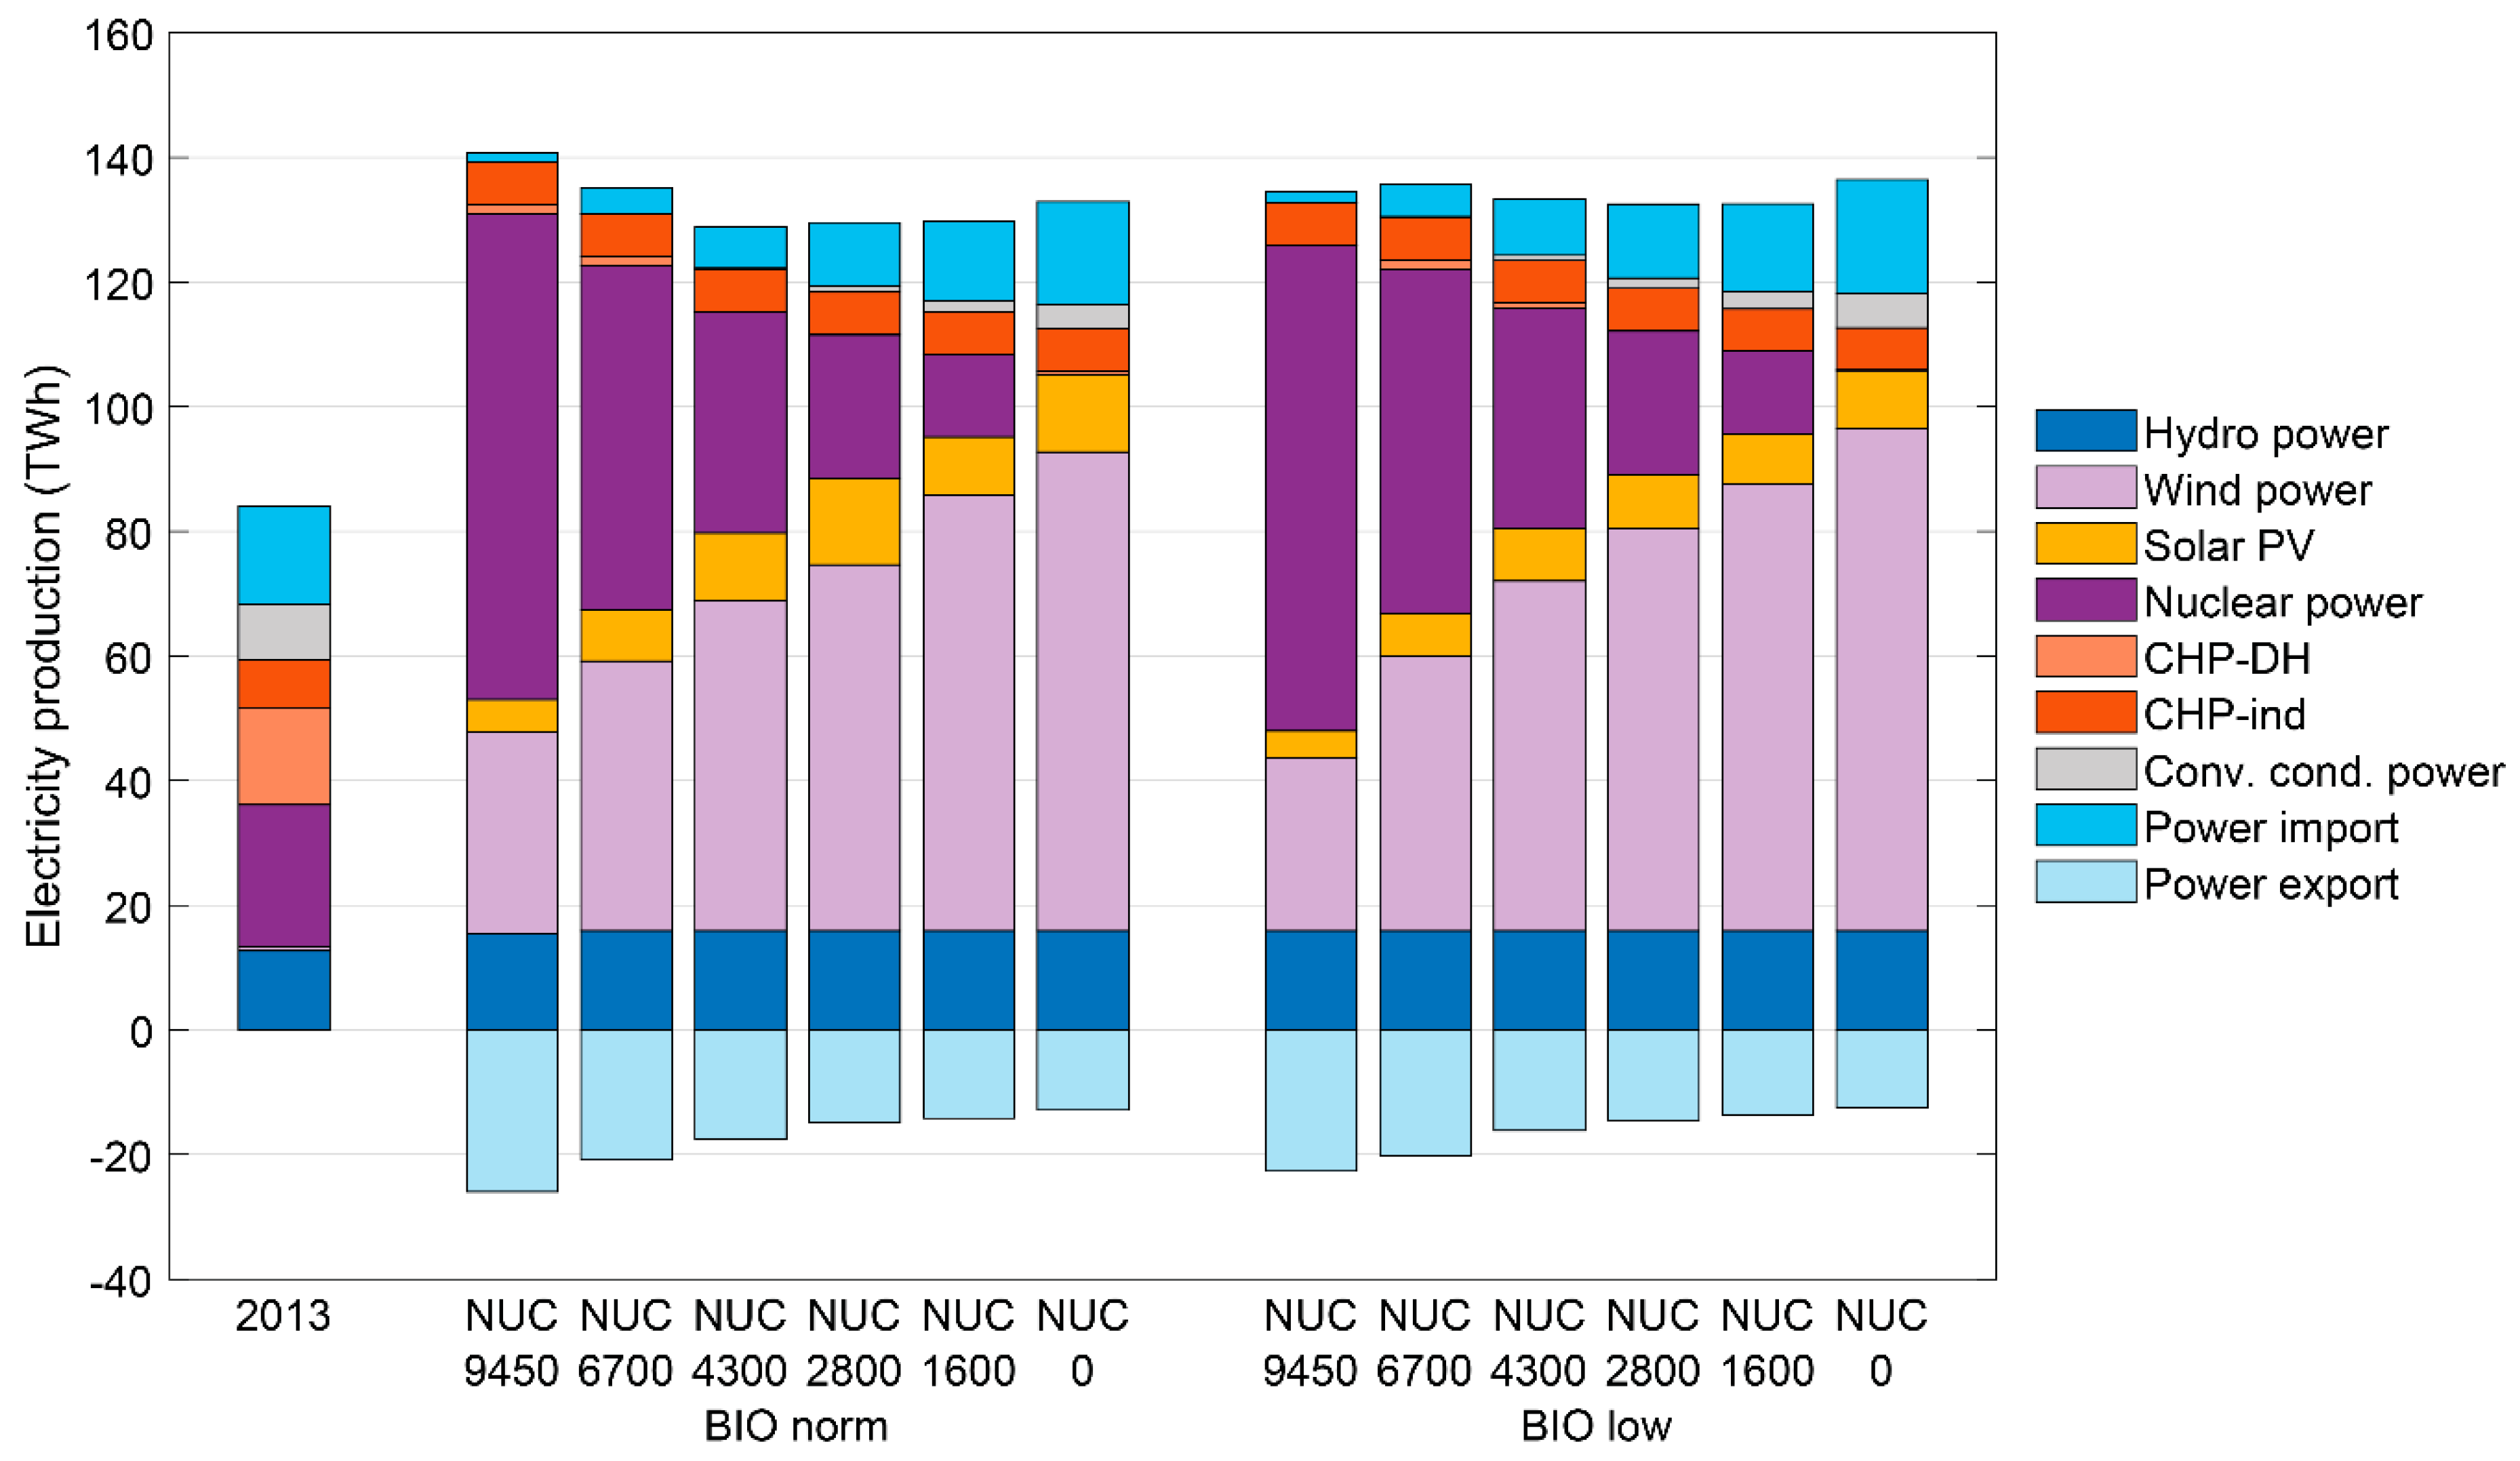
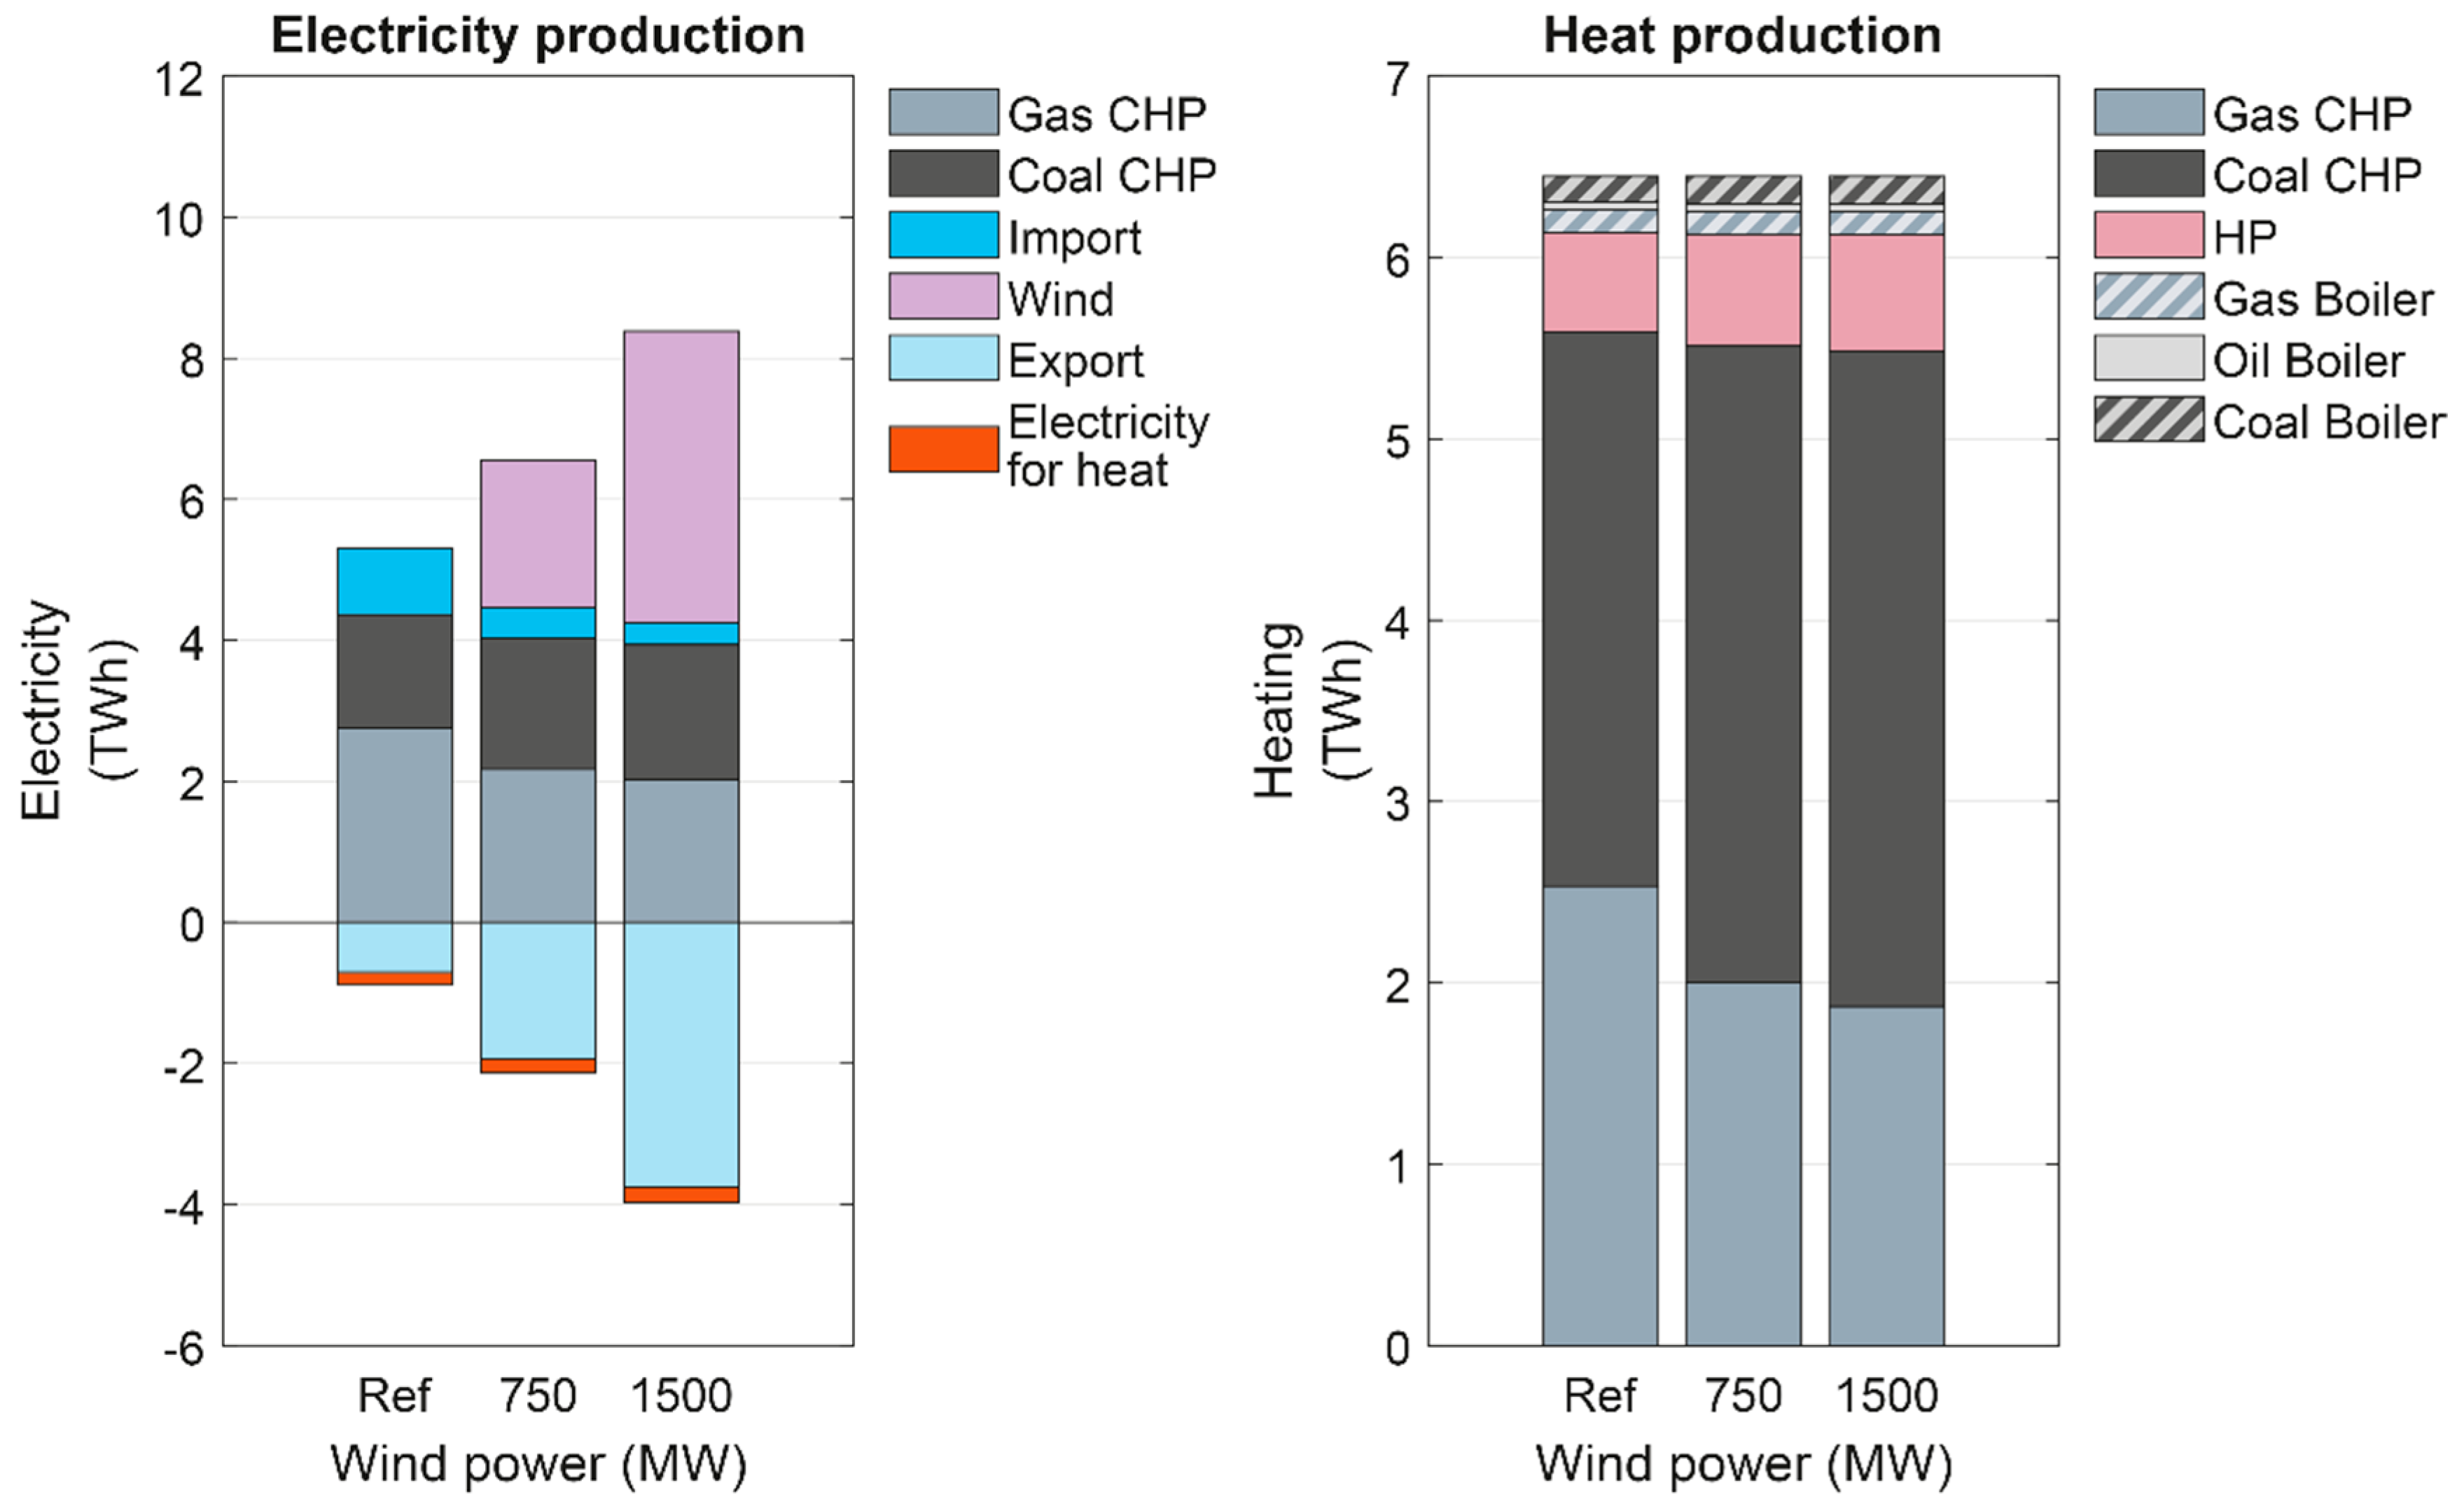
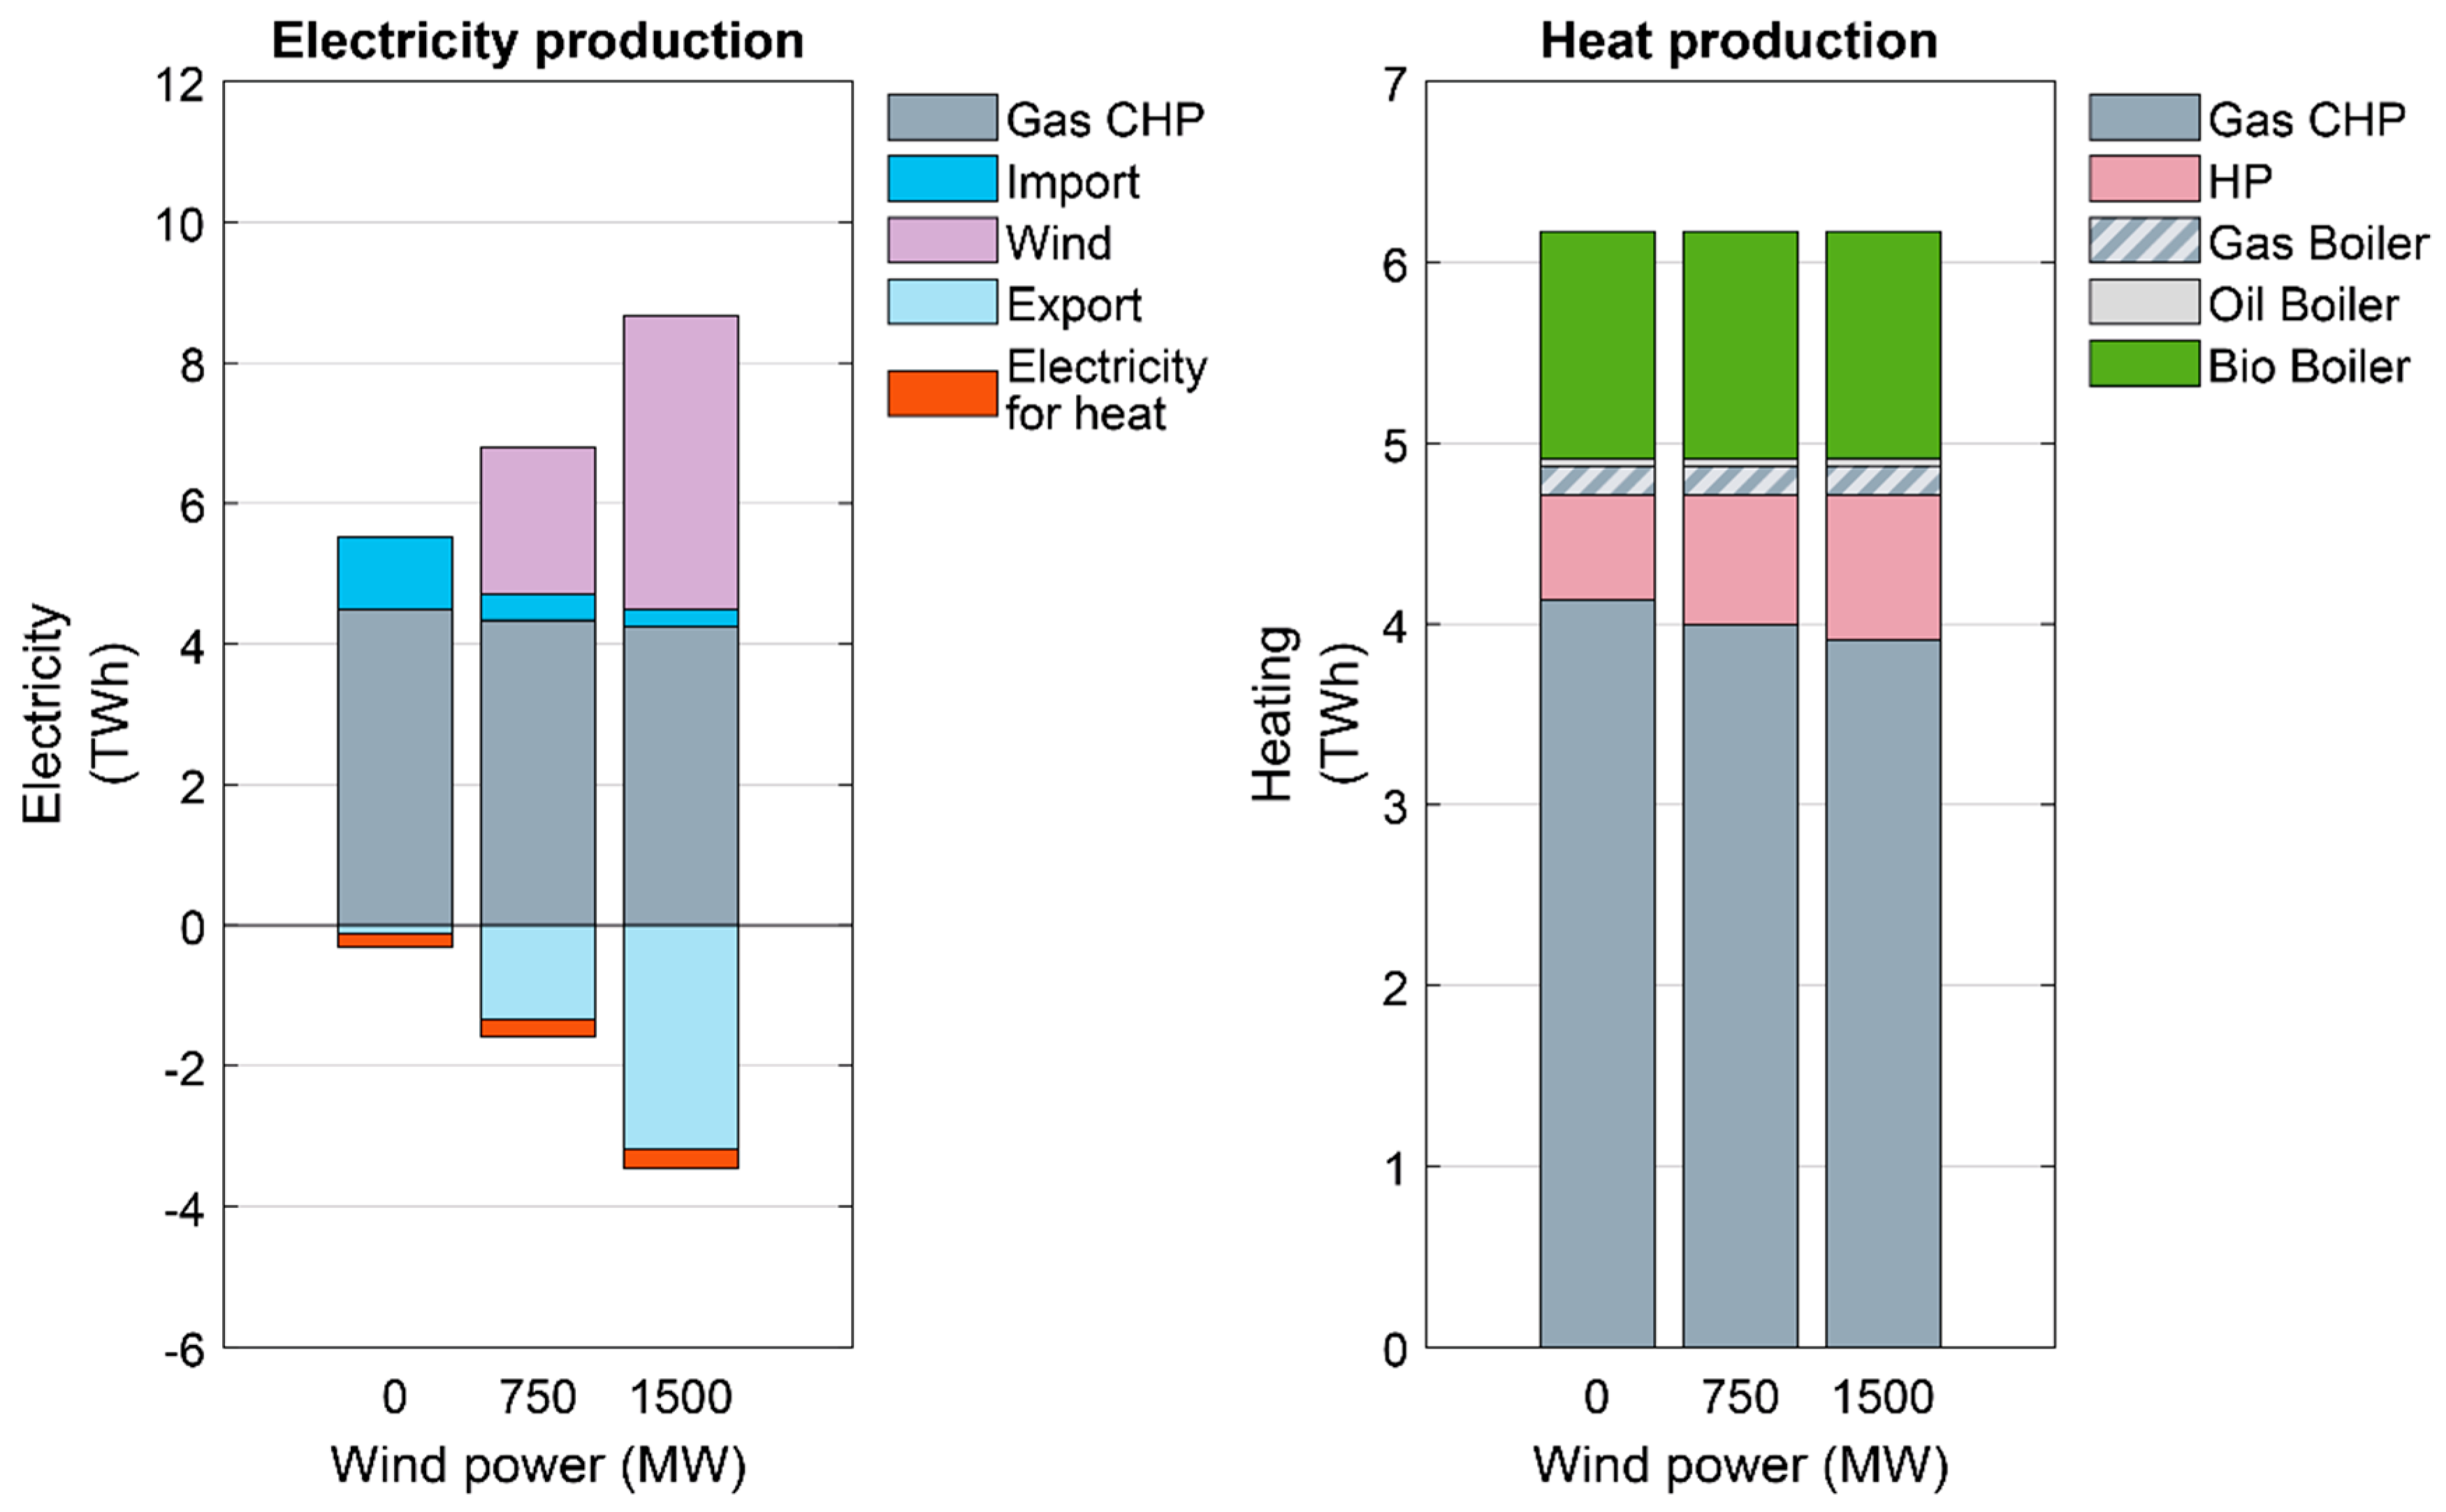
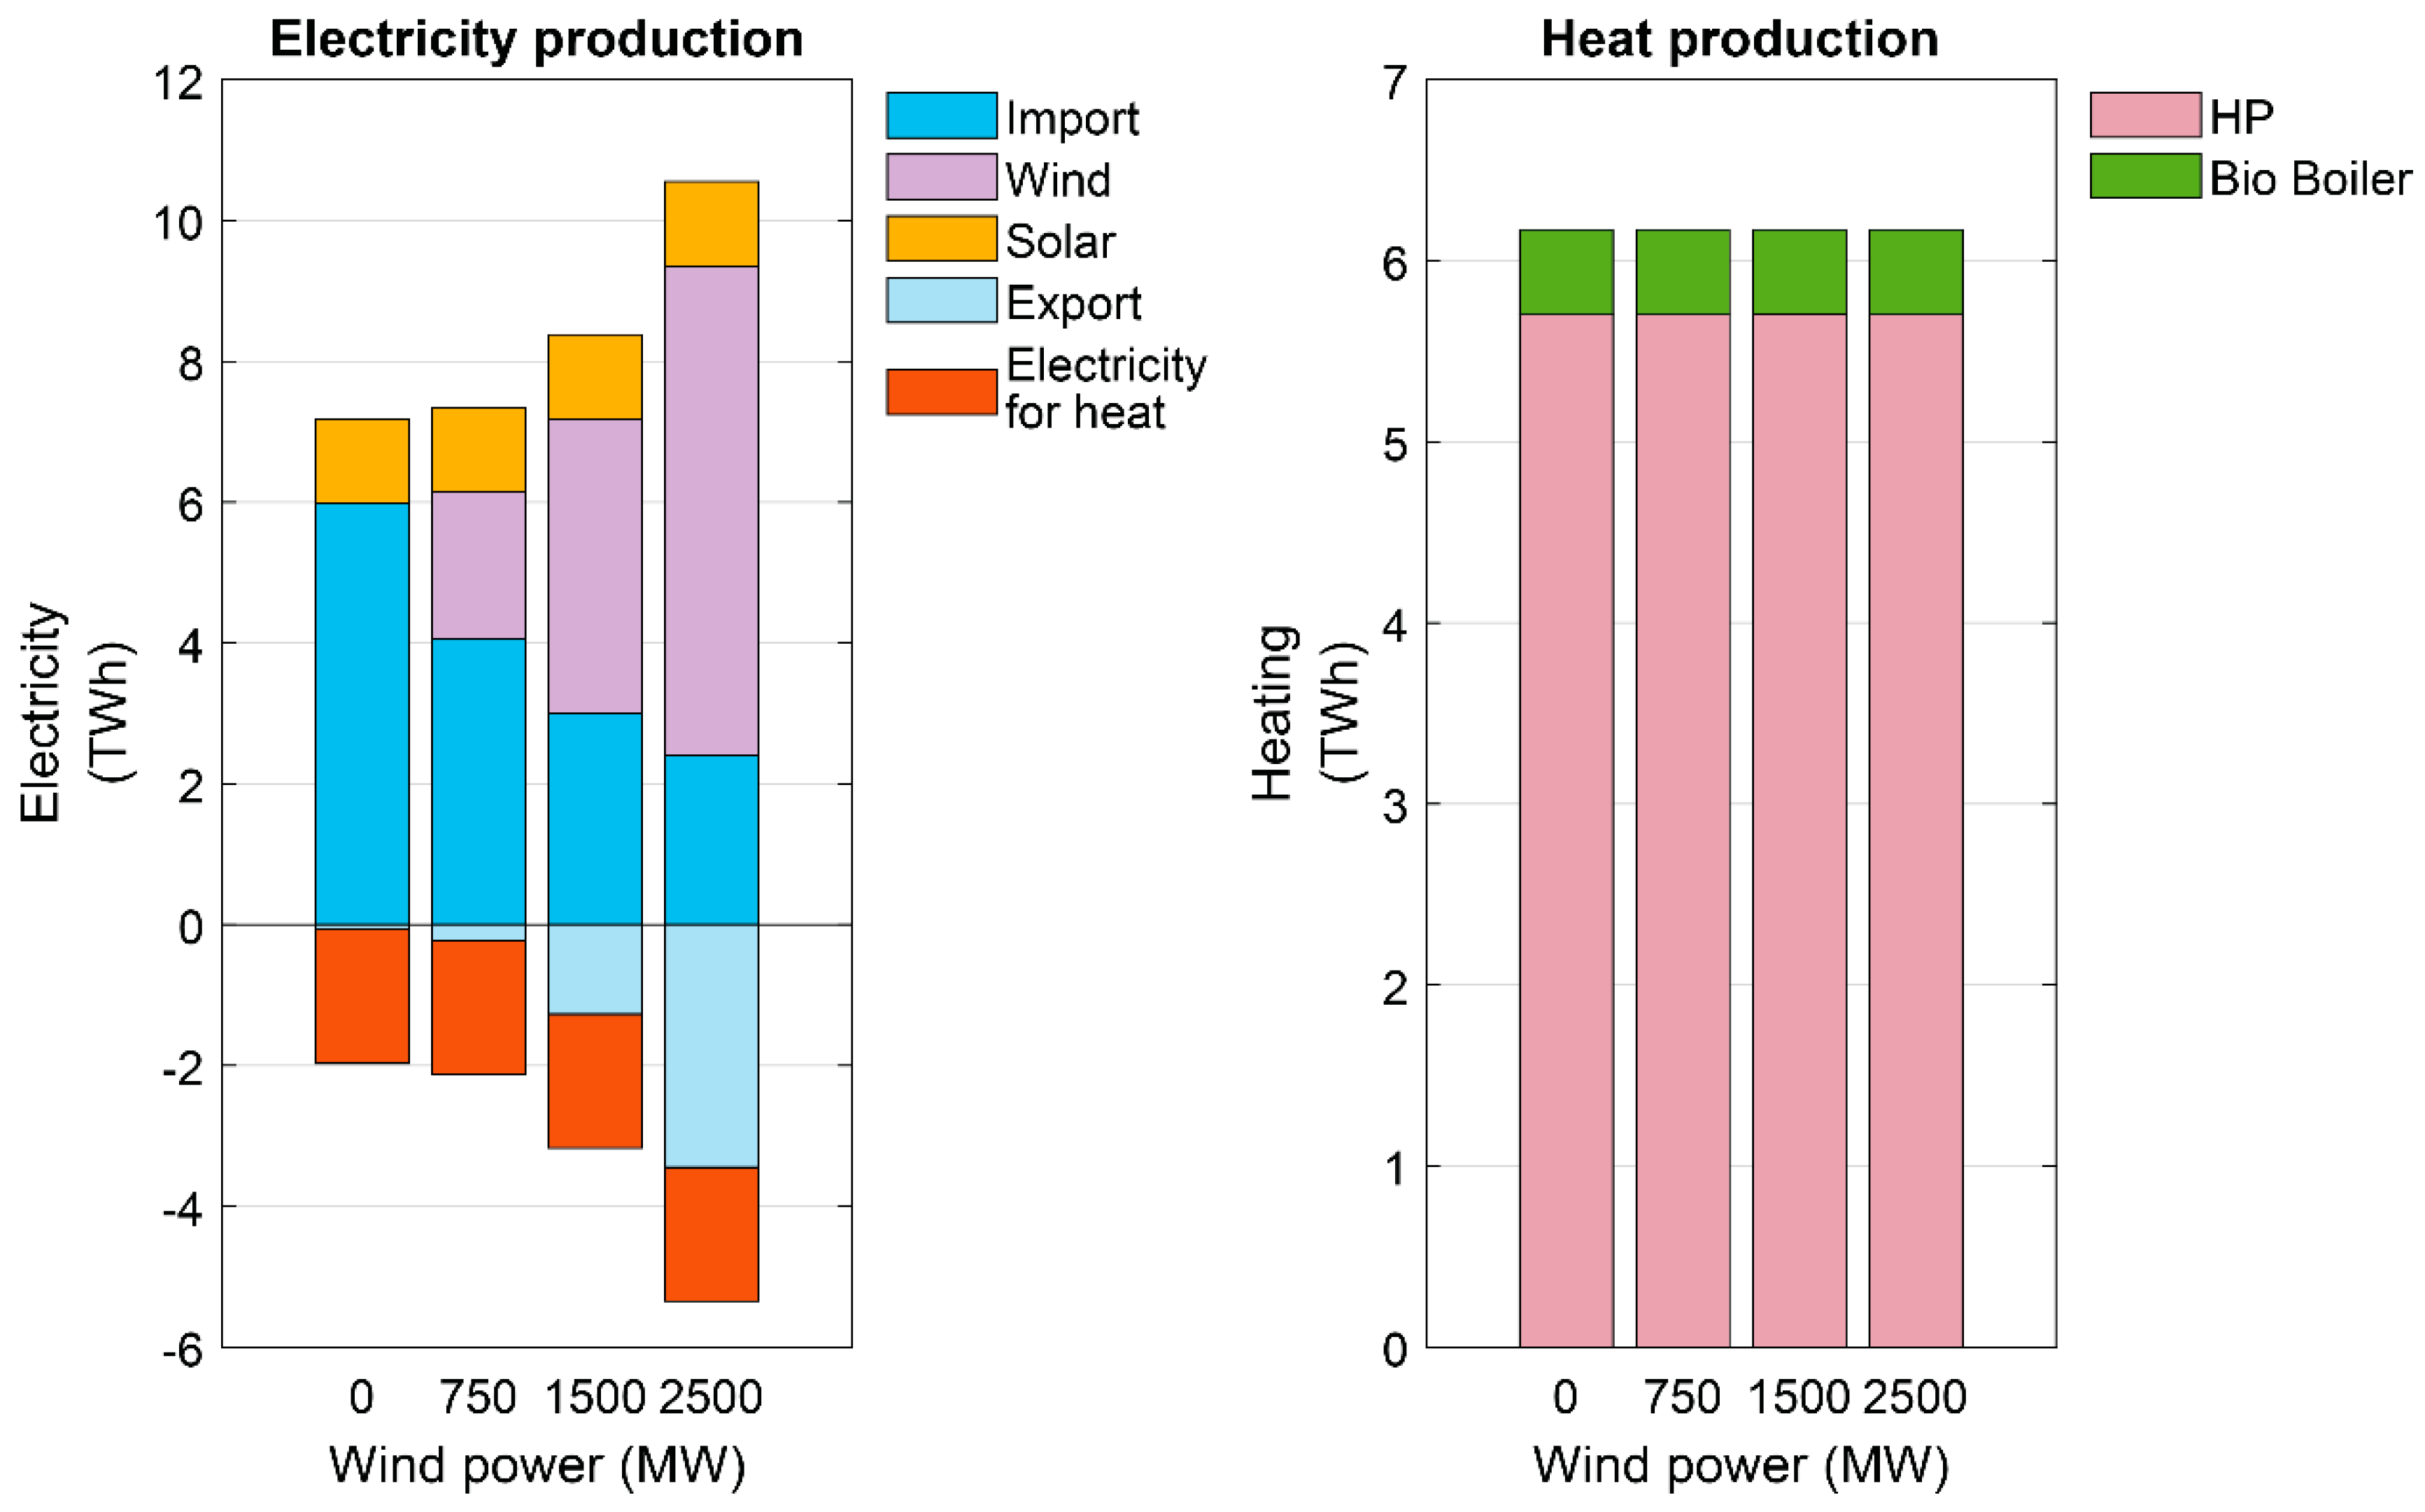
In the national case, the results indicate that wind power, nuclear power, and biomass, coupled with power-to-heat and other flexibility measures, could provide a carbon-neutral pathway, but nuclear and wind are, to some extent, exclusionary. There seemed to be a trade-off between the levels of nuclear and wind power, though with our cost assumptions, the national system’s annual costs seemed to be insensitive to the level of nuclear power. In the Helsinki case, a large wind-power scheme combined with heat pumps and biomass boilers could help to transform the current fossil-fuel-based energy system into a carbon-neutral one. On both levels, (near) carbon-neutral energy system would seem possible, even without any nuclear power on the national level. Large-scale wind power integration, however, requires more interaction with the Nordic power market, due to increased temporal mismatch of power supply and demand. For Helsinki case, without any flexibility means incorporating large-scale wind power would lead to high power exports, meaning that the wind power would less replace fossil fuels. This is mostly due to the high heat demand which requires running the fossil-based CHP plants, even when wind power production would be plentiful. In the national scenarios in particular, leaning in large-scale on forestry biomass may include some future risks, if its use had to be limited due to sustainability concerns. In such a situation, reaching carbon neutrality could not be reached without expanding e.g., wind power with P2G.
Due to the role of heating in the final energy in northern climates, reaching overall carbon-neutrality in energy production would require special attention on heat production. Our results indicated that electrification of heat production could be an effective way to reduce CO2 emissions on both city and national levels and to provide the required flexibility to the energy system. On the national level, power-to-heat schemes to generate CO2-free heat are powered by a mix of zero-carbon energy sources, i.e., nuclear, wind and (to a lesser extent) hydro and solar power. Power import would reduce on the national level, but increasing nuclear power in particular expands power export. Our analysis indicates also that striving for zero-carbon energy production as a whole would benefit from a strong link to the electricity market to compensate for increased energy mismatch albeit introducing energy system flexibility measures. This would actually be more pronounced on the city level with less spatial smoothing effects.
The low or zero carbon energy solutions in the scenarios have a positive impact on resilience from an environmental and power system point of view: CO2 emissions are radically lower from the present level, the share of local (decentralized) power production increases and the grid infrastructure is strengthened. Furthermore, geopolitical threats decrease as the dependence on foreign imports diminish with increasing renewable energy utilization. However, the resilience improvement of the heating sector is more problematic, as even though the role of local heat production strengthens, the electrification of heat supply poses new kind of threats, such as power outage and adequacy of supply during peak demand, which may require further attention in planning future carbon-free energy systems.

Author Contributions

S.P. carried out the national analysis and provided the cost data, V.A. carried out the city-scale analysis, J.M. was responsible for the resilience analysis, and P.D.L. actively supervised and guided the process. All authors contributed to the design of the scenarios, and to writing and reviewing the manuscript.

Funding

This work was supported by the Nordic Energy Research (project Flex4RES, grant number 76084), the Academy of Finland (project DEFEND, grant number 285353), and the Research Council at the Academy of Finland (project WISE, grant number 312626).

Conflicts of Interest

The authors declare no conflict of interest.

Appendix A

Figure A1. Power and heat consumption for Helsinki (2016 and 2050).
Energies 12 00949 g0a1
Table A1. Renewable energy potentials in the national case. The potentials are based on Reference [47], with the exception of wind power (50 GW, [54]).
Renewable Energy SourcePresent Use (2013) (PJ/a)Potential in 2050 (PJ/a)
Hydropower4658
Industrial wood residue212199
Other wood125208 (BIO norm)/46 (BIO low)
Agro-biomass458
Waste425
Biogas07
Wind power3308
Solar PV053
Solar heat05.4
Table A2. Assumed fuel costs (excl. taxes) in 2050, based on References [54,75,76,77]. Fuels not listed are assumed to have zero costs.
FuelCost (€/GJ)
Oil9.8
Coal4.2
Natural gas9.7
Peat5.4
Nuclear1.1
Other wood 17.7
Agro-biomass7.4
Biogas11.4
1 Forest biomass that is not a direct residue from the forest industry.
Table A3. Assumed technology costs in 2050, based on References [78,79,80].
TechnologyInvestment Cost (€/kW)Fixed O&M (€/kW)Variable O&M (€/kWh)Lifetime (Years)
Hydropower280035460
Wind power79021230
Nuclear power380060360
Solar PV4106040
CHP110026425
Condensing power110026425
Heat-only boiler502225
Heat pump5302425
Electric boiler601120
Solar heat (€/MWh)33000.430
Residential fuel boiler59044020
Residential electric boiler8407030
Power-to-gas27811-30
Gas-to-liquid (€/TJ)4600180-30
Biomass conversion (€/TJ)14,000420-25
Heat storage (€/MWh)4603025

References

  1. IPCC. Global warming of 1.5 °C. An IPCC Special Report on the Impacts of Global Warming of 1.5 °C above Pre-Industrial Levels and Related Global Greenhouse Gas Emission Pathways, in the Context of Strengthening the Global Response to the Threat of Climate Change. 2018. Available online: https://www.ipcc.ch/sr15/ (accessed on 28 January 2019).
  2. International Energy Agency. World Energy Outlook 2017; International Energy Agency: Paris, France, 2017. [Google Scholar]
  3. Auer, H.; Haas, R. On integrating large shares of variable renewables into the electricity system. Energy 2016, 115, 1592–1601. [Google Scholar] [CrossRef]
  4. Holttinen, H. Wind integration: Experience, issues, and challenges. Wiley Interdiscip. Rev. Energy Environ. 2012, 1, 243–255. [Google Scholar] [CrossRef]
  5. Flynn, D.; Rather, Z.; Ardal, A.; D’Arco, S.; Hansen, A.D.; Cutululis, N.A.; Sorensen, P.; Estanquiero, A.; Gómez, E.; Menemenlis, N.; et al. Technical impacts of high penetration levels of wind power on power system stability. Wiley Interdiscip. Rev. Energy Environ. 2017, 6, 1–19. [Google Scholar] [CrossRef]
  6. Lund, P.D.; Lindgren, J.; Mikkola, J.; Salpakari, J. Review of energy system flexibility measures to enable high levels of variable renewable electricity. Renew. Sustain. Energy Rev. 2015, 45, 785–807. [Google Scholar] [CrossRef] [Green Version]
  7. Papaefthymiou, G.; Dragoon, K. Towards 100% renewable energy systems: Uncapping power system flexibility. Energy Policy 2016, 92, 69–82. [Google Scholar] [CrossRef]
  8. Mathiesen, B.V.; Lund, H.; Connolly, D.; Wenzel, H.; Østergaard, P.A.; Möller, B.; Nielsen, S.; Ridjan, I.; Karnøe, P.; Sperling, K.; et al. Smart Energy Systems for coherent 100% renewable energy and transport solutions. Appl. Energy 2015, 145, 139–154. [Google Scholar] [CrossRef]
  9. Jacobson, M.Z.; Howarth, R.W.; Delucchi, M.A.; Scobie, S.R.; Barth, J.M.; Dvorak, M.J.; Klevze, M.; Katkhuda, H.; Miranda, B.; Chowdhury, N.A.; et al. Examining the feasibility of converting New York State’s all-purpose energy infrastructure to one using wind, water, and sunlight. Energy Policy 2013, 57, 585–601. [Google Scholar] [CrossRef]
  10. Connolly, D.; Lund, H.; Mathiesen, B.V. Smart Energy Europe: The technical and economic impact of one potential 100% renewable energy scenario for the European Union. Renew. Sustain. Energy Rev. 2016, 60, 1634–1653. [Google Scholar] [CrossRef]
  11. Statistics Finland. Available online: https://www.stat.fi/index_en.html (accessed on 10 January 2019).
  12. European Commission. Available online: https://ec.europa.eu (accessed on 26 January 2019).
  13. Lund, P.D. Implications of Finland’s plan to ban coal and cutting oil use. Energy Policy 2017, 108, 78–80. [Google Scholar] [CrossRef]
  14. Vaillancourt, K.; Bahn, O.; Frenette, E.; Sigvaldason, O. Exploring deep decarbonization pathways to 2050 for Canada using an optimization energy model framework. Appl. Energy 2017, 195, 774–785. [Google Scholar] [CrossRef]
  15. Frew, B.A.; Becker, S.; Dvorak, M.J.; Andresen, G.B.; Jacobson, M.Z. Flexibility mechanisms and pathways to a highly renewable US electricity future. Energy 2016, 101, 65–78. [Google Scholar] [CrossRef] [Green Version]
  16. Barton, J.; Davies, L.; Dooley, B.; Foxon, T.J.; Galloway, S.; Hammond, G.P.; O’Grady, Á.; Robertson, E.; Thomson, M. Transition pathways for a UK low-carbon electricity system: Comparing scenarios and technology implications. Renew. Sustain. Energy Rev. 2017, 82, 2779–2790. [Google Scholar] [CrossRef]
  17. Volkart, K.; Weidmann, N.; Bauer, C.; Hirschberg, S. Multi-criteria decision analysis of energy system transformation pathways: A case study for Switzerland. Energy Policy 2017, 106, 155–168. [Google Scholar] [CrossRef]
  18. Pursiheimo, E.; Holttinen, H.H.; Koljonen, T. Path towards 100 % renewable energy future and feasibility of power-to-gas technology in Nordic Countries. IET Renew. Power Gener. 2017, 11, 1695–1706. [Google Scholar] [CrossRef]
  19. Capros, P.; Paroussos, L.; Fragkos, P.; Tsani, S.; Boitier, B.; Wagner, F.; Busch, S.; Resch, G.; Blesl, M.; Bollen, J. European decarbonisation pathways under alternative technological and policy choices: A multi-model analysis. Energy Strateg. Rev. 2014, 2, 231–245. [Google Scholar] [CrossRef]
  20. Lehtilä, A.; Koljonen, T.; Airaksinen, M.; Tuominen, P.; Järvi, T.; Laurikko, J.; Similä, L.; Grandell, L. Low Carbon Finland 2050 -Platform: Energy System Pathways towards a Low Carbon Society; VTT Technology Report 165; VTT Technical Research Centre of Finland: Espoo, Finland, 2014; Available online: http://www.vtt.fi/inf/pdf/technology/2014/T165.pdf (accessed on 18 February 2016). (In Finnish)
  21. Child, M.; Breyer, C. Vision and initial feasibility of a recarbonized Finnish energy system. Renew. Sustain. Energy Rev. 2016, 66, 517–536. [Google Scholar] [CrossRef]
  22. Child, M.; Nordling, A.; Breyer, C. Scenarios for a sustainable energy system in the Åland Islands in 2030. Energy Convers. Manag. 2017, 137, 49–60. [Google Scholar] [CrossRef]
  23. Zakeri, B.; Rinne, S.; Syri, S. Wind Integration into Energy Systems with a High Share of Nuclear Power—What Are the Compromises? Energies 2015, 8, 2493–2527. [Google Scholar] [CrossRef] [Green Version]
  24. City of Helsinki. Renewable Energy Sources. Available online: https://www.hel.fi/helsinki/en/housing/construction/construction-urban/efficiency/renewable/ (accessed on 14 January 2019).
  25. Mikkola, J.; Lund, P.D. Modeling flexibility and optimal use of existing power plants with large-scale variable renewable power schemes. Energy 2016, 112, 364–375. [Google Scholar] [CrossRef]
  26. Arabzadeh, V.; Pilpola, S.; Lund, P.D. Coupling Variable Renewable Electricity Production to the Heating Sector through Curtailment and Power-to-heat Strategies for Accelerated Emission Reduction. Futur. Cities Environ. 2019, 5, 1–10. [Google Scholar] [CrossRef]
  27. He, C.; Jiang, K.; Chen, S.; Jiang, W.; Liu, J. Zero CO2 emissions for an ultra-large city by 2050: Case study for Beijing. Curr. Opin. Environ. Sustain. 2018, 30, 1–15. [Google Scholar] [CrossRef]
  28. Long, Y.; Yoshida, Y. Quantifying city-scale emission responsibility based on input-output analysis—Insight from Tokyo, Japan. Appl. Energy 2018, 218, 349–360. [Google Scholar] [CrossRef]
  29. Jimenez, G.; Flores, J.M. Reducing the CO2 emissions and the energy dependence of a large city area with zero-emission vehicles and nuclear energy. Prog. Nucl. Energy 2015, 78, 396–403. [Google Scholar] [CrossRef]
  30. Manzini, F. Inserting renewable fuels and technologies for transport in Mexico City Metropolitan Area. Int. J. Hydrogen Energy 2006, 31, 327–335. [Google Scholar] [CrossRef]
  31. Lund, P.D.; Mikkola, J.; Ypyä, J. Smart energy system design for large clean power schemes in urban areas. J. Clean. Prod. 2015, 103, 437–445. [Google Scholar] [CrossRef]
  32. International Energy Agency. Energy Security. Available online: https://www.iea.org/topics/energysecurity/ (accessed on 28 January 2019).
  33. Cherp, A.; Jewell, J. The concept of energy security: Beyond the four As. Energy Policy 2014, 75, 415–421. [Google Scholar] [CrossRef] [Green Version]
  34. Azzuni, A.; Breyer, C. Definitions and dimensions of energy security: A literature review. Wiley Interdiscip. Rev. Energy Environ. 2018, 7, e268. [Google Scholar] [CrossRef]
  35. Ang, B.W.; Choong, W.L.; Ng, T.S. Energy security: Definitions, dimensions and indexes. Renew. Sustain. Energy Rev. 2015, 42, 1077–1093. [Google Scholar] [CrossRef]
  36. Panteli, M.; Mancarella, P. The Grid: Stronger, Bigger, Smarter?: Presenting a Conceptual Framework of Power System Resilience. IEEE Power Energy Mag. 2015, 13, 58–66. [Google Scholar] [CrossRef]
  37. Roege, P.E.; Collier, Z.A.; Mancillas, J.; McDonagh, J.A.; Linkov, I. Metrics for energy resilience. Energy Policy 2014, 72, 249–256. [Google Scholar] [CrossRef]
  38. O’Sullivan, M.; Overland, I.; Sandalow, D. The Geopolitics of Renewable Energy; Columbia University: New York, NY, USA, 2017. [Google Scholar]
  39. Scholten, D.; Bosman, R. The geopolitics of renewables; exploring the political implications of renewable energy systems. Technol. Forecast. Soc. Chang. 2016, 103, 273–283. [Google Scholar] [CrossRef] [Green Version]
  40. Paltsev, S. The complicated geopolitics of renewable energy. Bull. At. Sci. 2016, 72, 390–395. [Google Scholar] [CrossRef] [Green Version]
  41. Wang, Y.; Chen, C.; Wang, J.; Baldick, R. Research on Resilience of Power Systems Under Natural Disasters—A Review. IEEE Trans. Power Syst. 2016, 31, 1604–1613. [Google Scholar] [CrossRef]
  42. Panteli, M.; Mancarella, P. Influence of extreme weather and climate change on the resilience of power systems: Impacts and possible mitigation strategies. Electr. Power Syst. Res. 2015, 127, 259–270. [Google Scholar] [CrossRef]
  43. Varianou Mikellidou, C.; Shakou, L.M.; Boustras, G.; Dimopoulos, C. Energy critical infrastructures at risk from climate change: A state of the art review. Saf. Sci. 2018, 110, 110–120. [Google Scholar] [CrossRef]
  44. Arghandeh, R.; von Meier, A.; Mehrmanesh, L.; Mili, L. On the definition of cyber-physical resilience in power systems. Renew. Sustain. Energy Rev. 2016, 58, 1060–1069. [Google Scholar] [CrossRef] [Green Version]
  45. Pearson, I.L.G. Smart grid cyber security for Europe. Energy Policy 2011, 39, 5211–5218. [Google Scholar] [CrossRef]
  46. Bolwig, S.; Bazbauers, G.; Klitkou, A.; Lund, P.D.; Blumberga, A.; Gravelsins, A.; Blumberga, D. Review of modelling energy transitions pathways with application to energy system flexibility. Renew. Sustain. Energy Rev. 2019, 101, 440–452. [Google Scholar] [CrossRef]
  47. Pilpola, S.; Lund, P.D. Effect of major policy disruptions in energy system transition: Case Finland. Energy Policy 2018, 116, 323–336. [Google Scholar] [CrossRef]
  48. Lo, L. Diversity, security, and adaptability in energy systems: A comparative analysis of four countries in Asia. In Proceedings of the World Renewable Energy Congress, Linköping, Sweden, 8–13 May 2011; pp. 2401–2408. [Google Scholar]
  49. Jewell, J.; Cherp, A.; Riahi, K. Energy security under de-carbonization scenarios: An assessment framework and evaluation under different technology and policy choices. Energy Policy 2014, 65, 743–760. [Google Scholar] [CrossRef]
  50. Statistics Finland. Energy Table Service. Available online: https://pxhopea2.stat.fi/sahkoiset_julkaisut/energia2017/start.htm (accessed on 15 January 2019).
  51. Teollisuuden Voima Oyj. Construction of the Olkiluoto 4 Nuclear Power Plant Unit in Olkiluoto—General Description. 2014. Available online: https://www.tvo.fi/uploads/julkaisut/tiedostot/TVO_Yleispiirteinen_selvitys_su_120614_web.pdf (accessed on 23 January 2019). (In Finnish).
  52. Tekniikka & Talous. Rosatom Wants Another Reactor for Hanhikivi—“Usually There Must Be Two Units in a Nuclear Power Plant”. Tekniikka & Talous, 2015. Available online: https://www.tekniikkatalous.fi/tekniikka/energia/rosatom-haluaa-toisenkin-reaktorin-hanhikivelle-yleensa-ydinvoimalassa-on-oltava-kaksi-yksikkoa-3483646 (accessed on 23 January 2019). (In Finnish).
  53. Fortum Power and Heat Oy. Application for a Principle Decision Concerning the Construction of a Nuclear Power Plant Unit—Loviisa 3. 2009. Available online: https://www.hel.fi/static/helsinki/paatosasiakirjat/Kh2009/Esityslista23/liitteet/Periaatepaatoslupahakemus_5.2.2009.pdf (accessed on 23 January 2019). (In Finnish).
  54. IEA; Nordic Energy Research. Nordic Energy Technology Perspectives 2016; International Energy Agency: Paris, France, 2016. [Google Scholar]
  55. Helen Oy. Available online: https://www.helen.fi/ (accessed on 10 January 2019).
  56. Kallio, M.; Lehtilä, A.; Koljonen, T.; Solberg, B. Best Scenarios for Forest and Energy Sectors—Implications for the Biomass Market; Cleen Oy Research Report No D 1.2.1; Cleen Oy: Helsinki, Finland, 2015. [Google Scholar] [CrossRef]
  57. Fingrid Oyj. Main Grid Development Plan 2017–2027. 2017. Available online: https://www.fingrid.fi (accessed on 22 January 2019).
  58. European Commission Expert Group. Towards a Sustainable and Integrated Europe; European Commission: Brussels, Belgium, 2017. [Google Scholar]
  59. Gils, H.C. Assessment of the theoretical demand response potential in Europe. Energy 2014, 67, 1–18. [Google Scholar] [CrossRef]
  60. Hawk, C.; Kaushiva, A. Cybersecurity and the Smarter Grid. Electr. J. 2014, 27, 84–95. [Google Scholar] [CrossRef] [Green Version]
  61. Wang, W.; Lu, Z. Cyber security in the Smart Grid: Survey and challenges. Comput. Netw. 2013, 57, 1344–1371. [Google Scholar] [CrossRef]
  62. National Academies of Sciences, Engineering, and Medicine. Attribution of Extreme Weather Events in the Context of Climate Change; National Academies Press: Washington, DC, USA, 2016; ISBN 978-0-309-38094-2. [Google Scholar]
  63. Stott, P.A.; Christidis, N.; Otto, F.E.L.; Sun, Y.; Vanderlinden, J.-P.; van Oldenborgh, G.J.; Vautard, R.; von Storch, H.; Walton, P.; Yiou, P.; et al. Attribution of extreme weather and climate-related events. Wiley Interdiscip. Rev. Clim. Chang. 2016, 7, 23–41. [Google Scholar] [CrossRef] [PubMed]
  64. Argomaniz, J. The European Union Policies on the Protection of Infrastructure from Terrorist Attacks: A Critical Assessment. Intell. Natl. Secur. 2015, 30, 259–280. [Google Scholar] [CrossRef]
  65. Spellman, F.R. Energy Infrastructure Protection and Homeland Security, 2nd ed.; Bernan Press: Lanham, MD, USA, 2016; ISBN 9781598888171. [Google Scholar]
  66. MacFarlane, A. How to Protect Nuclear Plants From Terrorists; U.S. News & World Report: Washington, DC, USA, 2016. [Google Scholar]
  67. Rajendran, G.B. A Resilience Engineering Approach for Preventing Accidents due to Human Factors. Master’s Thesis, University of Stavanger, Stavanger, Norway, 2016. [Google Scholar]
  68. Jang, S.; Jae, M. An Estimation of Human Error Probability of Filtered Containment Venting System Using Dynamic HRA Method. In Proceedings of the Korean Nuclear Society 2016 Autumn Meeting, Gyeongju, Korea, 26–28 October 2016. [Google Scholar]
  69. Shuvro, R.A.; Wangt, Z.; Das, P.; Naeini, M.R.; Hayat, M.M. Modeling cascading-failures in power grids including communication and human operator impacts. In Proceedings of the 2017 IEEE Green Energy and Smart Systems Conference (IGESSC), Long Beach, CA, USA, 6–7 November 2017; pp. 1–6. [Google Scholar] [CrossRef]
  70. Yergin, D. Ensuring Energy Security. Foreign Aff. 2006, 85, 69. [Google Scholar] [CrossRef]
  71. Strantzali, E.; Aravossis, K. Decision making in renewable energy investments: A review. Renew. Sustain. Energy Rev. 2016, 55, 885–898. [Google Scholar] [CrossRef]
  72. Codina Gironès, V.; Moret, S.; Maréchal, F.; Favrat, D. Strategic energy planning for large-scale energy systems: A modelling framework to aid decision-making. Energy 2015, 90, 173–186. [Google Scholar] [CrossRef]
  73. Reggiani, A. Network resilience for transport security: Some methodological considerations. Transp. Policy 2013, 28, 63–68. [Google Scholar] [CrossRef]
  74. Reggiani, A.; Nijkamp, P.; Lanzi, D. Transport resilience and vulnerability: The role of connectivity. Transp. Res. Part A Policy Pract. 2015, 81, 4–15. [Google Scholar] [CrossRef]
  75. Statistics Finland. Energy Prices. Available online: http://www.stat.fi/til/ehi/index_en.html (accessed on 21 September 2015).
  76. Energy Analyses. Analysis of Biomass Prices, Future Danish Prices for Straw, Wood Chips and Wood Pellets “Final Report”; Ea Energy Analyses: Copenhagen, Denmark, 2013. [Google Scholar]
  77. Seljom, P.; Tomasgard, A. The impact of policy actions and future energy prices on the cost-optimal development of the energy system in Norway and Sweden. Energy Policy 2017, 106, 85–102. [Google Scholar] [CrossRef]
  78. Danish Energy Agency. Technology Data. Available online: https://ens.dk/en/our-services/projections-and-models/technology-data (accessed on 27 November 2018).
  79. Publications Office of the European Union. ETRI 2014—Energy Technology Reference Indicator Projections for 2010–2050; Publications Office of the European Union: Luxembourg, 2014. [Google Scholar] [CrossRef]
  80. IEA-ETSAP. Energy Supply Technologies Data. Available online: https://iea-etsap.org/index.php/energy-technology-data/energy-supply-technologies-data (accessed on 27 November 2018).
Figure 1. Primary energy consumption of the national case, without (“BIO norm”) and with biomass limitations (“BIO low”). The reference case, Finland in 2013, is shown on the left.
Energies 12 00949 g001
Figure 2. Electricity production of the national case, without (“BIO norm”) and with biomass limitations (“BIO low”). The reference case, Finland in 2013, is shown on the left.
Energies 12 00949 g002
Figure 3. Heat production of the national case without (“BIO norm”) and with biomass limitations (“BIO low”). “CHP-DH” refers to district heating CHP, and “CHP-ind” to industrial CHP. Residential production is abbreviated “Res.”. The reference case, Finland in 2013, is shown on the left.
Energies 12 00949 g003
Figure 4. Changes in the power and heat production shares when wind power is integrated into the present energy system of Helsinki (Reference system, 2016).
Energies 12 00949 g004
Figure 5. Power and heat production system of Helsinki in the BAU-2050 scenario for 2050.
Energies 12 00949 g005
Figure 6. Power and heat production of Helsinki in the ZeroCO2 scenario (zero-emissions).
Energies 12 00949 g006
Table 1. Nuclear power scenarios in the national case for 2050. “X” denotes inclusion in the scenario.
Nuclear Power PlantPower (MW)Scenarios
NUC 9450NUC 6700NUC 4300NUC 2800NUC 1600NUC 0
Loviisa 1–2990X
Olkiluoto 1–21760X
Olkiluoto 31600XXXXX
Hanhikivi 11200XXXX
Olkiluoto 4 11500XXX
Hanhikivi 2 11200XX
Loviisa 3 11200XX
1 Based on tentative partly hypothetical public discussion on future nuclear power plants in Finland [51,52,53].
Table 2. Nominal energy plants output in Helsinki (MW) in the different scenarios for 2050.
Scenario Gas CHPCoal CHP 1Coal CHP 2Gas BoilerOil BoilerCoal BoilerBiomass BoilerHeat PumpSolarWind
Reference (2016) Power630220160------0–1500
Heat5804203003601900180-90--
BAU-2050Power630--------0–1500
Heat580--360500-490129--
ZeroCO2Power--------15000–2500
Heat------9501024--
Table 3. CO2 emissions and relative annual system costs of the national case. The CO2 emissions are reported as the change from 1990 levels, while the annual system costs are reported with a relative scale, 100 = costs of the national reference system (Finland in 2013).
CO2 EmissionsAnnual Costs
ScenarioBIO Norm (%)BIO Low (%)BIO NormBIO Low
NUC 9450−96−797994
NUC 6700−96%−808095
NUC 4300−95%−808097
NUC 2800−95%−808298
NUC 1600−95%−7984100
NUC 0−94%−7888105
Table 4. Emissions and running costs in Helsinki for different scenarios with different levels of wind power (MW). Emissions are compared to the year 1990 level, the relative yearly running costs in brackets are compared against 2016 costs (100 = 2016 costs).
ScenarioWind Power
075015002500
Reference−21% (100)−20% (83)−20% (55)-
BAU-2050−48% (95)−50% (73)−51% (50)-
ZeroCO2−100% (98)−100% (52)−100% (41)−100% (13)
Table 5. Resilience factors and their development in two national case scenarios. Positive changes with respect to resilience are shown in +-column, negative changes in −-column, and if no significant change occurs, the new value is in 0-column. Factors marked with ‘qual’ in the Ref. column are analyzed qualitatively (− = reduced resilience, 0 = neutral, + = increased resilience).
2013NUC 9450 BIO NormNUC 0 BIO Norm
1. Environmental resilienceRef.0+0+
 1. (a) CO2 emissions (MtCO2)49.2 2.3 3.1
 1. (b) Share of renewables in TPES (%)30 44 93
 1. (c) Bio-sustainabilityqual
2. Power system resilienceRef.0+0+
 2. (a) Power grid robustness and versatilityqual + +
 2. (b) Share of decentralized production (%)1 27 77
 2. (c) Adequacy of peak supply (%)8680 87
 2. (d) Share of hydropower (% in production)1911 14
 2. (e) Heat sector coupling (% in total power supply)20 21 29
 2. (f) Vehicle-to-grid output (% in total power supply)0 1 3
3. Heat system resilienceRef.0+0+
 3. (a) District heating network robustnessqual 0 0
 3. (b) Share of decentralized production (%)44 77 85
 3. (c) Maximum hourly production (% of peak demand)103 102 101
 3. (d) Heat storage output (% in heat supply)1 0 0
4. System independence and geopoliticsRef.0+0+
 4. (a) Gross electricity imports (TWh)15.7 1.6 16.4
 4. (b) Share of net electricity imports (% in total supply)19 0 3
 4. (c) Foreign fuel imports (PJ)845905 41
 4. (d) Versatility of energy sources (SWDI)2.051.51 1.87
Table 6. Resilience factors and their development in two Helsinki case scenarios. Positive changes with respect to resilience are shown in +-column, negative changes in −-column, and if no significant change occur, the new value is in 0-column. Factors marked with ‘qual’ in the Ref. column are analyzed qualitatively (− = reduced resilience, 0 = neutral, + = increased resilience). Ref. means Reference.
2016BAU-2050 (1500 MW Wind Power)ZeroCO2 (1500 MW Wind Power)
1. Environmental resilienceRef.0+0+
 1. (a) CO2 emissions (MtCO2)2.7 1.6 0
 1. (b) Share of renewables in TPES (%)0 37 80
 1. (c) Bio-sustainabilityqual
2. Power system resilienceRef.0+0+
 2. (a) Power grid robustness and versatilityqual + +
 2. (b) Share of decentralized production (%)0 98 100
 2. (c) Adequacy of peak supply (%)12498 37
 2. (d) Share of hydro power (%)0 0 0
 2. (e) Heat sector coupling (% in total power supply)4 6 22
3. Heat system resilienceRef.0+0+
 3. (a) District heating network robustnessqual 0 0
 3. (b) Share of decentralized production (%)13 36 100
 3. (c) Adequacy of peak supply (%)150>100 >100
 3. (d) Heat storage (%)11 10 14
4. System independence and geopoliticsRef.0+0+
 4. (a) Share of net electricity imports (% in total supply)0 0 34
 4. (b) Gross electricity imports (TWh)0.9 0.23
 4. (c) Foreign fuel imports (TJ)11 0.9 0
 4. (d) Versatility of energy sources (SWDI)0.72 0.90 1.1

