Article

Optimal Operation Strategies into Deregulated Markets for 50 MWe Parabolic Trough Solar Thermal Power Plants with Thermal Storage

by
Jorge M. Llamas
1,*,
David Bullejos
1 and
Manuel Ruiz de Adana
2
1
Department of Electrical Engineering, Escuela Politécnica Superior de Córdoba (EPSC), University of Cordoba, Ctra. Madrid-Cádiz Km. 396, 14071- Cordoba, Spain
2
Department of Thermal Engines, Escuela Politécnica Superior de Córdoba (EPSC), University of Cordoba, Ctra. Madrid-Cádiz Km. 396, 14071- Cordoba, Spain
*
Author to whom correspondence should be addressed.
Energies 2019, 12(5), 935; https://doi.org/10.3390/en12050935
Submission received: 17 February 2019 / Revised: 4 March 2019 / Accepted: 6 March 2019 / Published: 11 March 2019
(This article belongs to the Section F: Electrical Engineering)

Abstract

:
The evolution of electric generation systems, according to relevant legislation, allows for the parallel evolution of the installed power capacity of renewable resources with the development of technologies for renewable resources, therefore optimizing the choice of energy mix from renewable resources by prioritizing the implementation of concentrating solar thermal plants. Thanks to their great potential, parabolic trough solar thermal power plants have become the most widely spread type of electricity generation by renewable solar energy. Nonetheless, the operation of the plant is not unique; it must be adapted to the parameters of solar radiation and market behavior for each specific location. This work focuses on the search for the optimal strategies of operation by a mathematical model of a 50 MWe parabolic trough thermal power plant with thermal storage. The analysis of the different ways of operation throughout a whole year, including model verification via a currently operating plant, provides meaningful insights into the electricity generated. Focused to work under non-regulated electricity markets to adjust this type of technology to the European directives, the presented model of optimization allows for the adaptation of the curve of generation to the network demands and market prices, rising the profitability of the power plant. Thus, related to solar resources and market price, the economic benefit derived from the electricity production improves between 5.17% and 7.79%.

1. Introduction

At present, the generation of electricity by renewable resources from solar energy depends on solar availability, regardless of the specific plant location and the electrical market. The selection of parameters and specific variables, such as storage capacity, reception surface, or generation systems, allows high efficiency proposals for optimal operation to be obtained [1].
Nevertheless, the current trend of solar thermal power plants is to assume the characteristics of the electricity market, either regulated or free, according to each location. The adaptation of generation-to-demand therefore improves the integration of solar thermal energy into the electricity market [2].
This work presents an analysis of and the plans for power generation by a parabolic trough (PT) solar thermal power plant, enabling better integration into the grid, as well as a presentation of the best offers on the most favorable periods of purchase price [3].
In [4] a thermal model of electricity production by renewable resources is developed. In [5] an optimization model is used to calculate the cost-effectiveness of PT plants’ solar heating systems through different constructive hypotheses and operations. However, the relationship with the physical model of the plant is not described in this work.
The optimization procedure mentioned in [6] includes the equations corresponding to the physical parameters of the solar plant, although the optimization method and its equations are not detailed. This reference shows the curves of the operation of the plant and its power output for some days, without detailed reviews of the results obtained.
In [7], the optimum behavior of plants in isolated days is shown, neither showing the equations of the model of optimization nor providing a comprehensive assessment of the benefits obtained. In [8], the proposed optimization in production models starts from a simplified hypothesis of operation that does not serve the technical limitations inherent to the operation of the plant. In all these cases, the optimization method would require a complete modeling of the solar plant and an adjustment of the equations corresponding to this model.
The main objective of this work is the optimization of the operation procedures of PT Plants, where both the exchange of production rules and the reduction of economic support have forced the optimization of production of electricity, according to the dynamics of the plant, to consider the sale of energy in free markets, where prices depend on supply and demand. According to these needs, this study began with fieldwork in a real plant, located in Córdoba (Spain), using a double tank molten salts system for thermal storage. The plant of study has 50 MW of net electrical power and directly operates in the Spanish electricity market. Through the construction of the plant model, and its subsequent validation, it will be possible to analyze production situations based on solar radiation parameters, thermal storage, and generation dynamics. This previous analysis of different scenarios allows for the evaluation of strategies to obtain a greater generation volume, under better economic conditions.

2. Materials and Methods

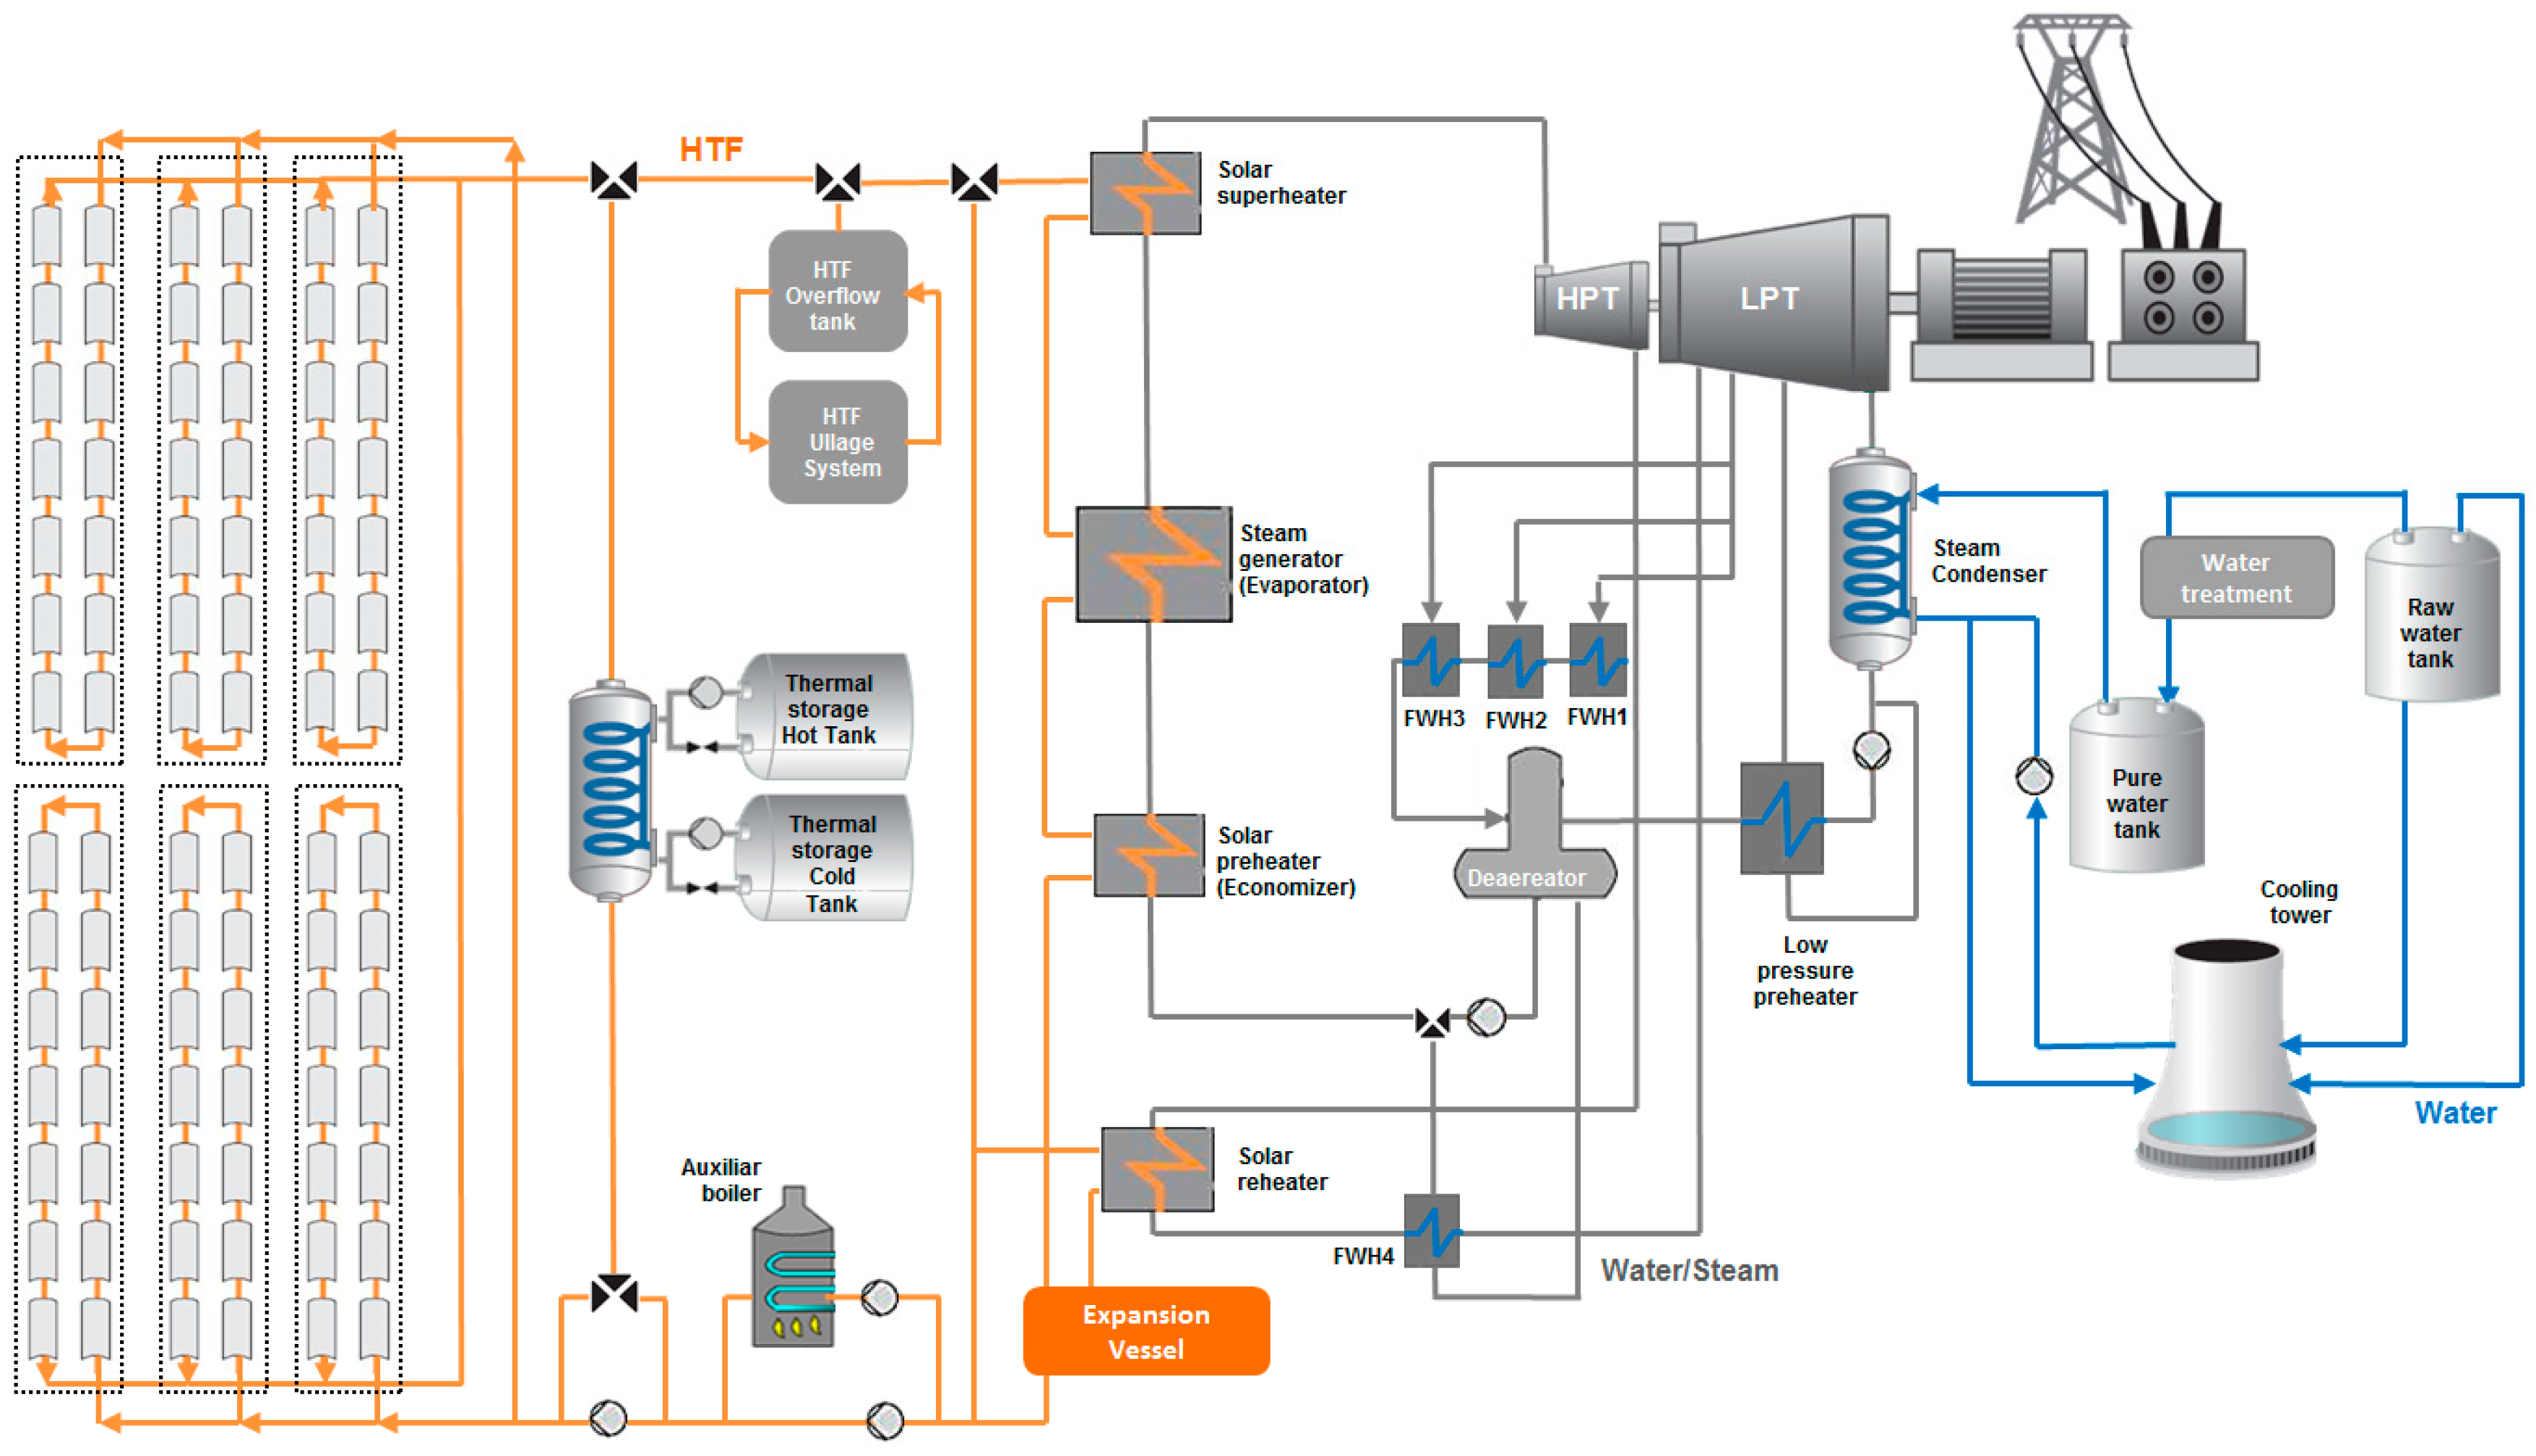
2.1. Solar Thermal Power Plant and Thermal Energy Management

2.1.1. Solar Field and Heat Transfer Fluid (HTF)

The economic benefit and reduction of costs by the implementation and maintenance of the solar field are directly related to the layout of the thermal fluid transport systems. The use of efficient technologies that minimize layout spaces has a significant impact on the performance and loss coefficients of the final installation. As shown in [9], the low uniformity of solar capture in the field, due to different parameters and meteorology, makes it necessary for collectors to use partial blurs or loops that increase the transient effect of solar capture, making the operation of the real PT plant more difficult. Likewise, it is necessary to know the actual absorption conditions in large loops of collectors with an exhaustive control of the temperature of each component in the loop [10]. The inspection systems of these concentrators allow for analysis of the degradation of materials, thermal losses, and losses of vacuum [11].
In [12], a solar thermal plant with 15 h of capacity in thermal storage and a turboalternator of 20 MWe, which needs a collection surface of 250,000 m2 with parabolic receptors to generate a power of 120 MWth, is presented. About 1,000,000 m2 of the whole surface of the solar plant has been analyzed. For this sizing, a high capacity factor (CF) has been demonstrated. Furthermore, a low dependence on supporting fossil fuels is obtained, thus reducing the levelized cost of electrical energy production (LCOE).
The design of the paths must reduce losses as much as possible, as well as enable the maximum generation on demand, with short-duration peaks and acceptable thermal inertia [13].
In relation to HTF, the oil normally used in current PT plants is Therminol VP-1, an eutectic mixture of diphenyl and diphenyl oxide [14]. This synthetic oil works efficiently at 400 °C, although its freezing point is 12 °C, which obliges maintaining the whole oil circuit at a constant temperature above this value. The PT Plant oil type considered for this work is Therminol VP-1. The range of working temperatures with PT collectors is 150 °C to 420 °C. For higher temperatures, thermal losses in these types of collectors are high, reaching the degradation of the material at 420 °C.

2.1.2. Thermal Storage System

The Direct Storage System shown in Figure 1 has two tanks of thermally insulated molten salts (hot tank and cold tank) in which the entire fluid is contained [15]. During the loading process, the molten salt in the hot tank raises its working temperature by heat exchange with the HTF from the solar field. In the discharge process, the molten salt transfers its energy to the power block.
The storage in two tanks is essential when fluids of relatively high thermal conductivity, such as sodium and molten salts, are used. Due to its capacity and characteristics, this system is the most common for PT plants and is the one analyzed in the present work.
The storage system, using a double tank and molten salt as a thermal exchange fluid, is usually called a Delayed Intermediate Production System (DIPS). For a storage system with an autonomy of 6 h with maximum power, the equivalent energy storage of 1010 MWhth is required, as shown in Table 1.
The mathematical model for the PT Plant implements the generation and storage operation mode with sufficient solar radiation (7 kWh/m2/day) [16] or the generation and recovery mode for minor radiation levels.
This type of plant would correspond to the system of production of an intermediate load with a DIPS storage system and with periods of operation at peak load (PLP - Peak Load Plant). The average operation time of this model in regime of production, production storage, and production recovery is 2159 h per year.

2.1.3. Reference Values for the PT Plant Model

In Table 1 the main reference design values for a 50 MWe PT Plant with thermal storage by molten salt is shown [17]. The information therein will be used to configure the mathematical model proposed for the plant. These parameters vary among plants, taking into account the solar collection capacity and oversizing by solar multiple (SM), as well as the capacity of thermal storage (equivalent hours of electricity production) [18,19].

2.2. Mathematical Model and Optimization

For the study of the operation and optimization of the solar plant, as well as for the construction of the different operation models for the plant, the plant operation and electricity market parameters have been considered. The first ones have been taken from the analysis of the characteristics of the PT plant, as well as from the detailed study of the elements that should be introduced in the design of an operation model. Next, the market parameters show the obtained operation limitations of the model in order to adapt it to the needs of the network of supply, independent from the generation, technical viability, or availability of potency.
For the achievement of the present study and the optimization of a model of electrical production, the economic information and solar radiation correspond to the year 2017 [20]. The known data for prices and production allow us to validate the model of production, which is possible through prediction tools.

2.2.1. Mathematical Simulation Model

In order to optimize the operation strategy, a plant model has been designed using the ©THERMOLIB library [21]. Starting from initial data on solar radiation, electricity price in the market, and nominal parameters of the plant, the operation parameters, such as the amount of thermal energy to be stored, the amount of thermal energy to be recovered, the degree of defocusing of the collectors, the thermal energy flow of the plant, and the final energy generated are obtained.
Created in ©MATLAB [22], the structure of the model proposed for this plant is presented in accordance with its architecture and operation mode. The use of a parallel simulation structure will allow for comparison of the different solutions adopted by minimizing the complexity of the data comparison processes, as well as the storage of the same ones. Figure 2 shows the structure of the simulation environment, with detail of the input and output data flow in each execution. Furthermore, the calibration of the model using data from the current plant validates the tools used.
The solar collection model used was obtained from a functional block in charge of collecting the solar radiation depending on the time and day of the year, starting from direct solar radiation per unit of area data and introduced from the external data table. The set of links that make up the solar field have been modeled using a basic unit that consists of an operational amplifier linear to its entry, which would replicate as many times as there are collectors in the field, which for the simulated plant is 624. The relationship between the number of collectors and the solar radiation received (model of global blur) was considered linear.
The plant operation algorithm defines the thermal energy sent to the power block, storage in the solar field, HTF buffering discharging, or a combination of both direct discharge and buffer storage. The gross electric energy generated is affected by the technical characteristics of the power block and the electric generator elements. Finally, net electricity generation is the gross energy production subtracted by the generation efficiency. Figure 3 shows the functional unit for a power block and the net electricity generation model [19].

2.2.2. Implementation of the Model in Real PT Plants

The implementation of the mathematical model and optimization in a 50 MW PT plant must be done by a system of continuous simulation. It is necessary to introduce the hourly updates of corrections in the matrix of vectors of the model due to deviations in final solar radiation, final prices of market, energy accounting in the storage system, and electric power finally produced. The results of production shown in this work were obtained after the execution of the model without feedback by deviations, considering real results were not available. This supposes the execution of the model of the plant over two vectors of 8760 values, corresponding to the solar radiation available and the price of the electricity on market. The first was obtained using a predictive model and the second one through historical values.
The proposed model uses a total of 67 parameters of positive real values and 25 continuous variables described in Equations (3)–(7), formed by vectors of 8760 elements of real numbers. The optimization function used 8 variables ( R D N I ( j ) , A C t , P A + ( j ) , P A ( j ) , E A ( j ) , P S p i l l , and Π D M ( j ) ) formed by vectors of 8760 elements of real numbers.

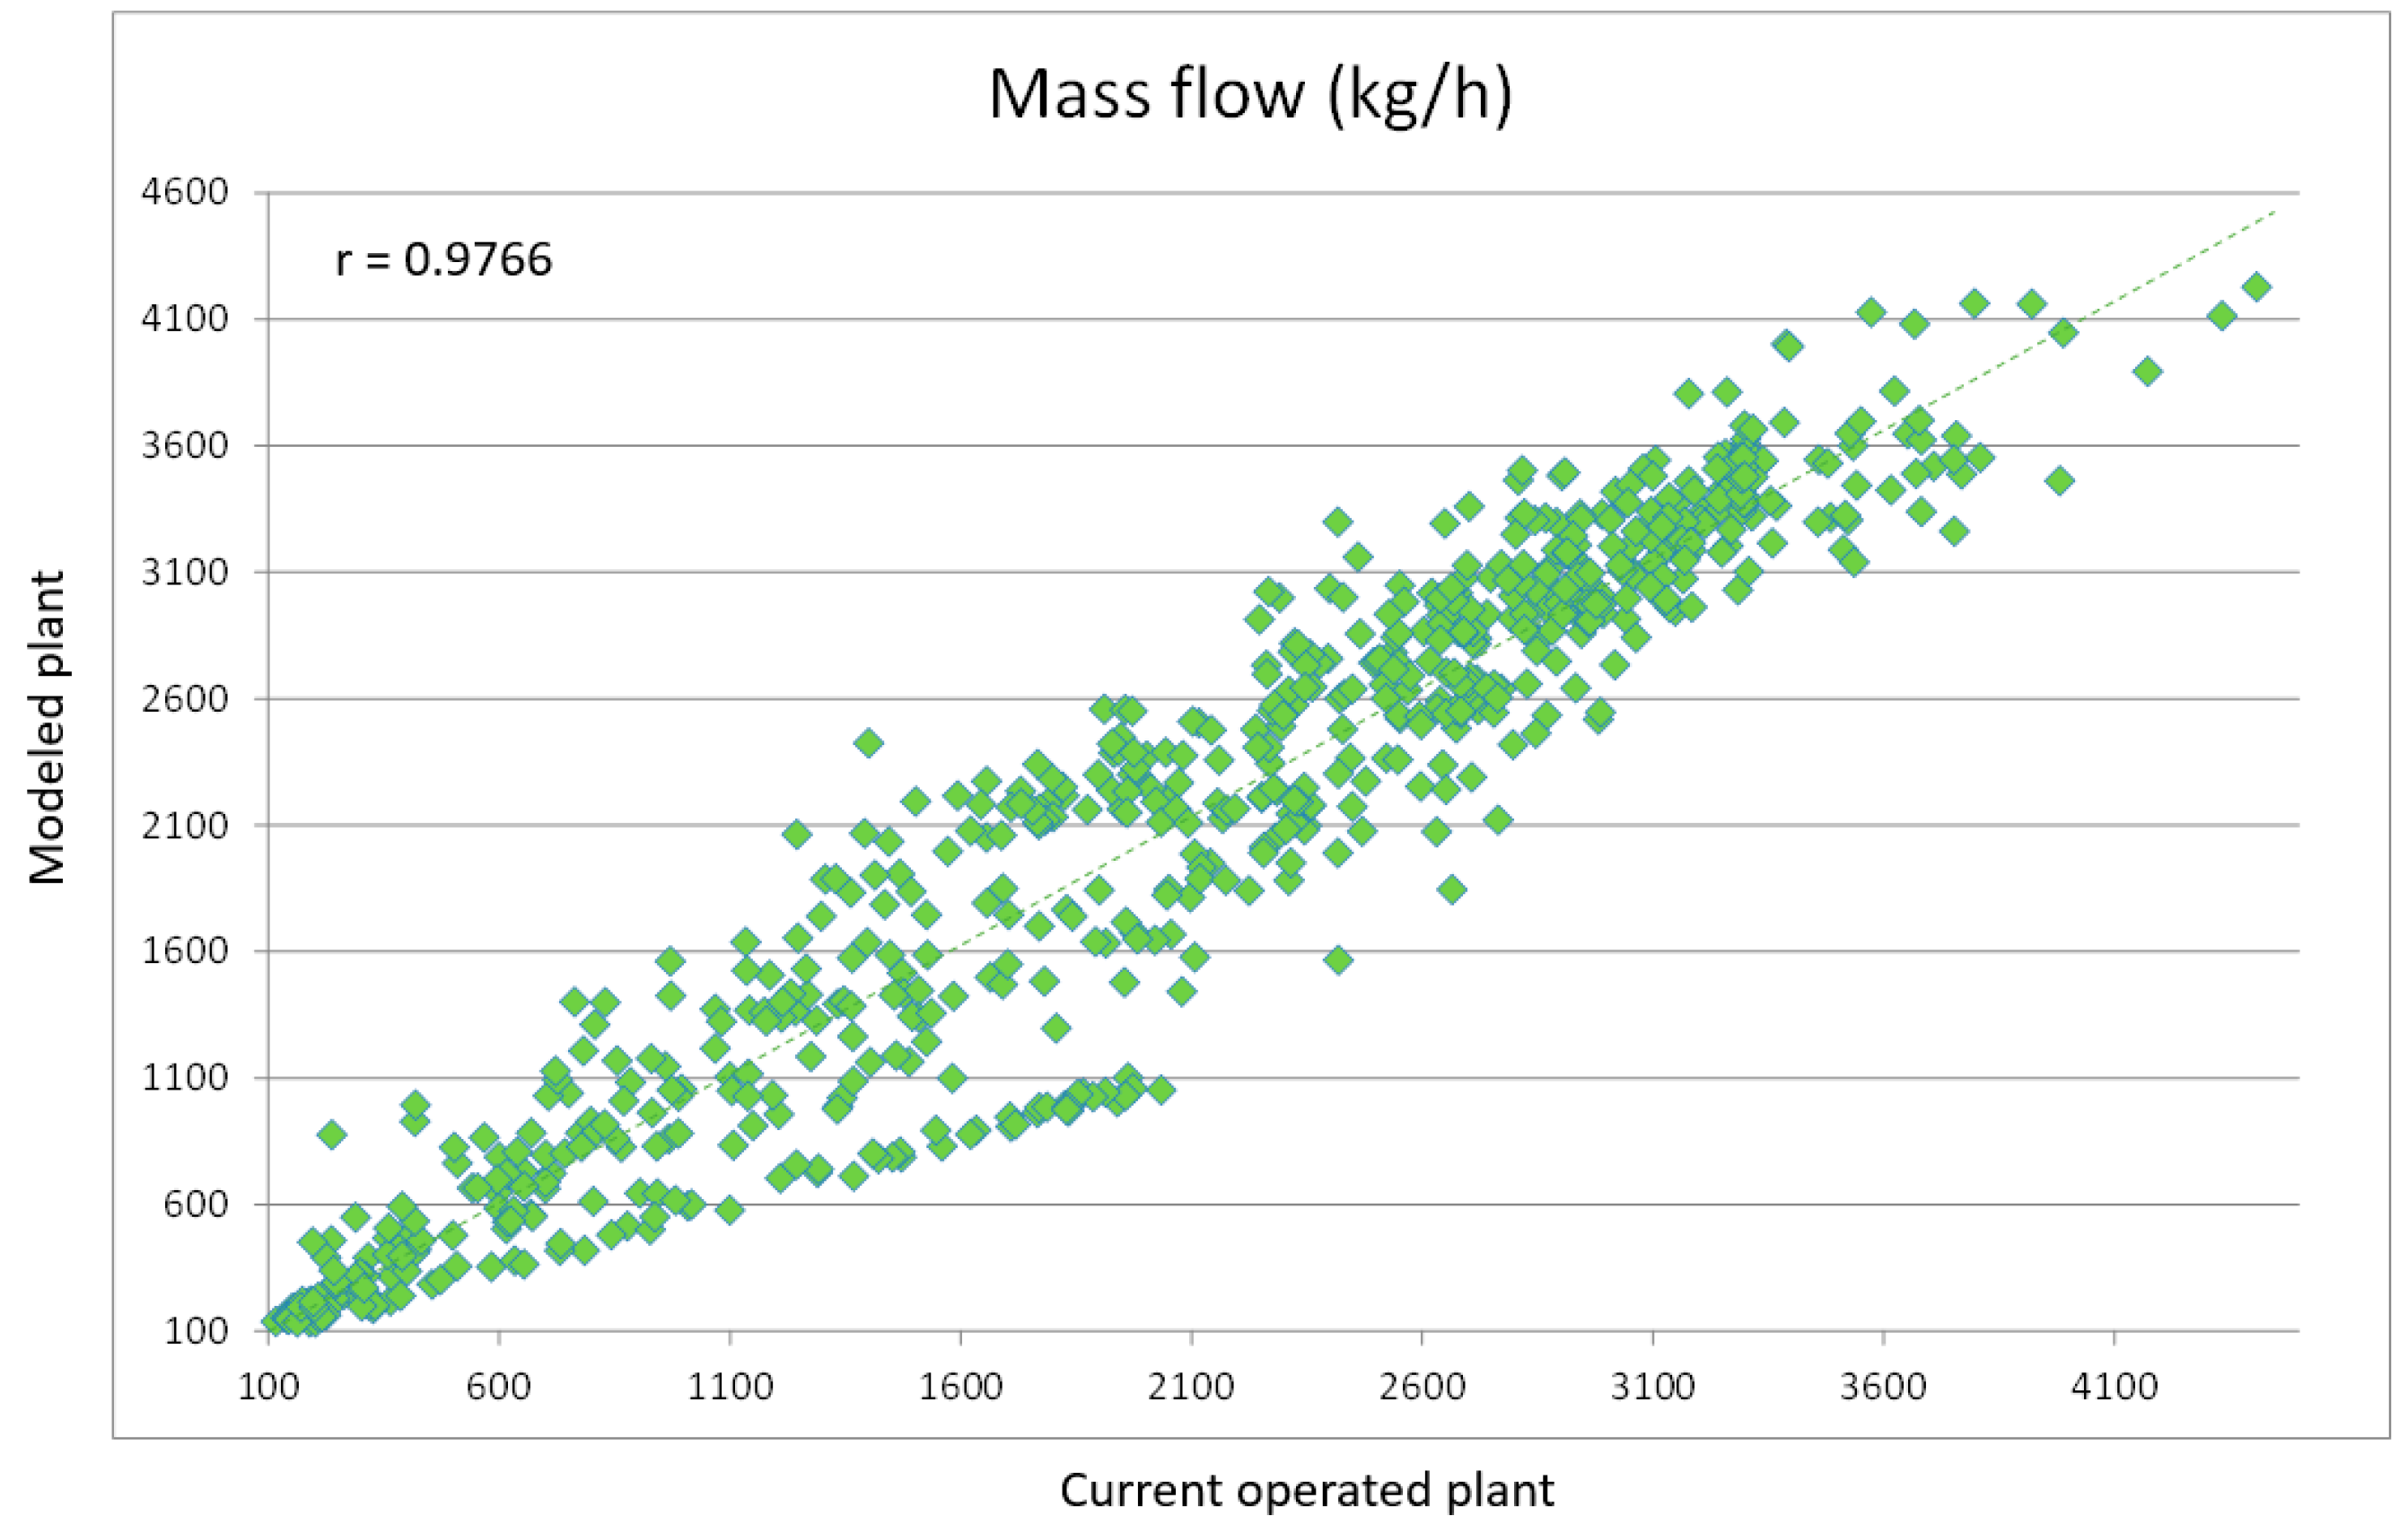
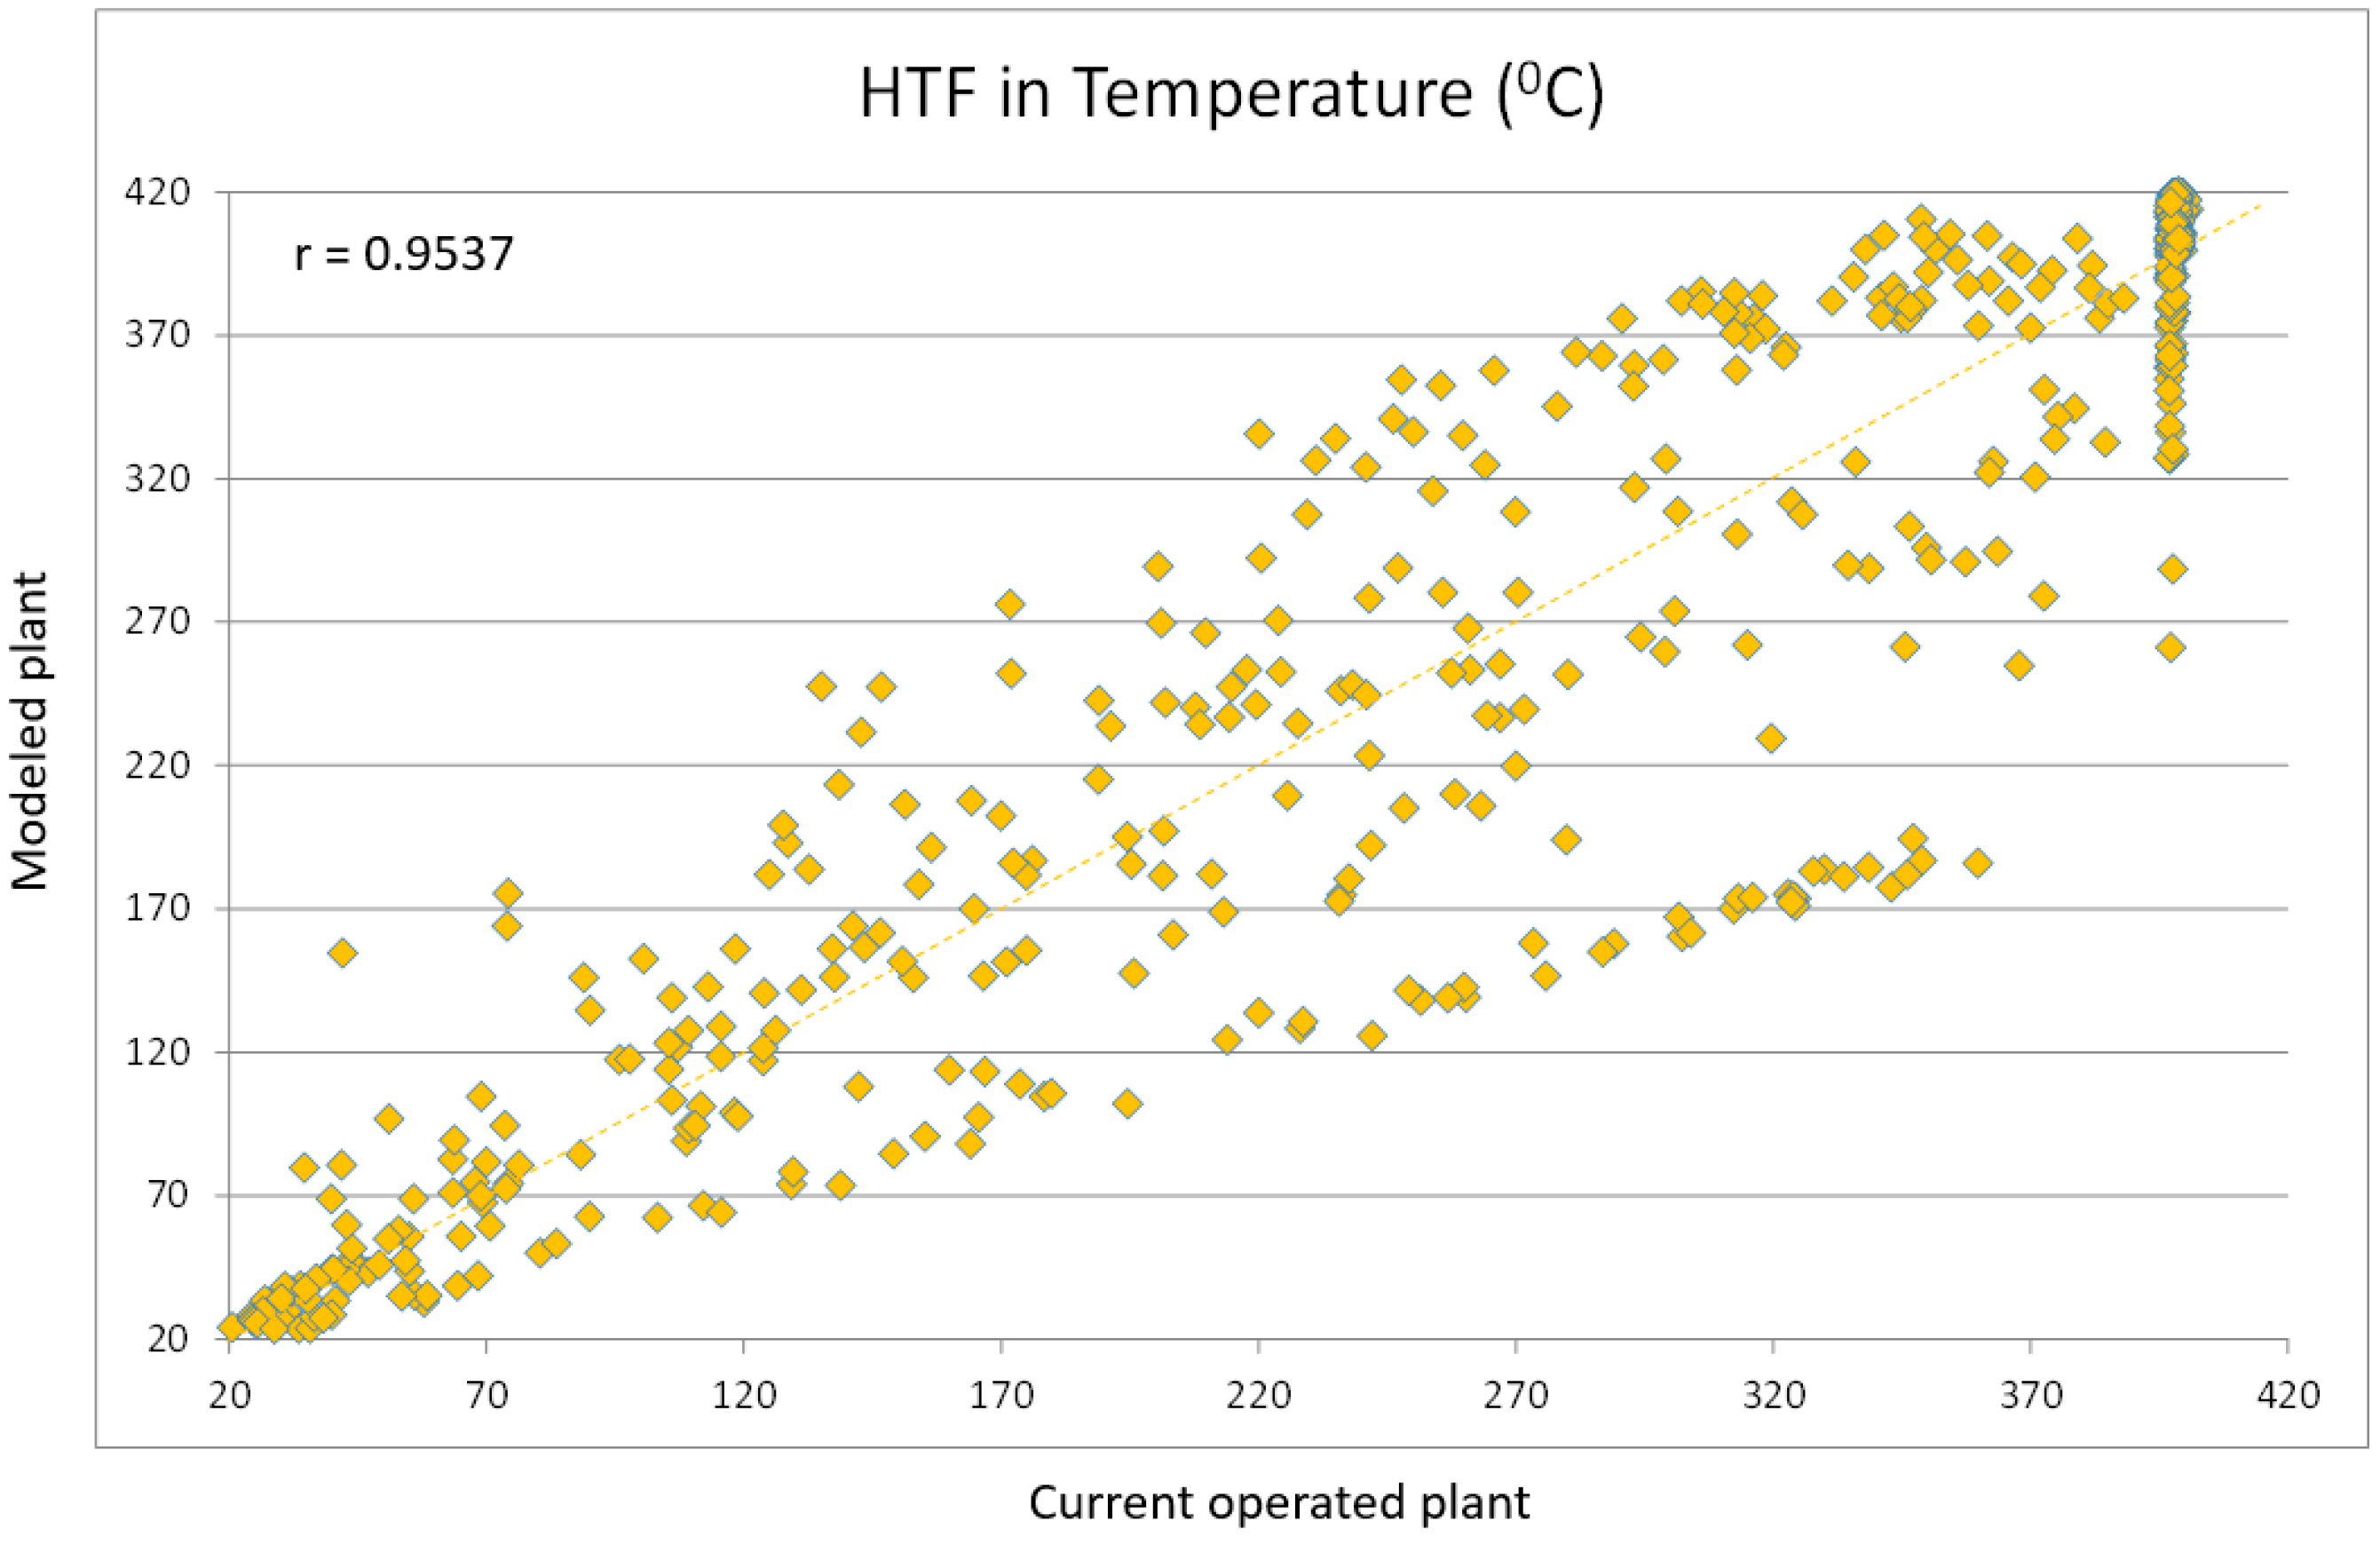
Calibration of the PT Solar Thermal Power Plant Model

The validation of the model is required to determine if the model is a good representation of the system. The proposed method of validation is the calibration of the model in a process of comparing the behavior of some of its significant variables with the behavior of them in the real system of the plant. For this validation, real data from “La Africana Energía” PT solar thermal plant, located in Cordoba (SPAIN), have been used. After completing this process, it is possible to determine whether the proposed model can anticipate the behavior of the real system in a reliable way.
For the validation of the model, it is necessary to consider that the operation depends on physical, economic, and logistics factors. Some of them, being fundamental criteria for the operation of the PT solar thermal power plant, have been identified as significant parameters. Two of them are the mass flow of synthetic oil at the exit of the pressure group in the solar field and the temperature of the fluid at the same point.
In order to analyze the correspondence between actual and obtained values using the plant model it is necessary to analyze the coefficient of determination (R2) which allows the percentage of the total variation observed in each of the compared variables to be determined. To do this, the first step is calculating the Pearson correlation coefficient according to Equation (1), which will indicate the type of correspondence between the data analyzed. The two compared variables, HTF temperature, and flow rate, are chosen in pairs using a bin hour yearly interval schedule [19].
r = ( x i x ) ( y i y ) ( x i x ) 2 ( y i y ) 2 ,
where Xi and Yi are the values of X and Y for the individual i.
The correlation coefficient gives the percentage of points of the group that comply with the correlation between the values of the plant and the model, according to the dispersion curves shown in Figure 4 and Figure 5. The results of correlation of the analyzed data are summarized in each figure.
With this result it is possible to conclude that the regression line explains the 97.66% of the total variation observed was about the HTF mass flow and 95.37% of the total variation observed related to the HTF inlet temperature of the solar field.

Short Time Analysis

To improve the applicability of the model of the power plant it its execution time needs to change and adapt to the range of planning for the operation of the plant, whose usual value for this type of production is 72 h. After the execution of the model in the first 72 h, using real plant values in the input to the model, the operation values must update every hour with the corresponding deviations of intermediate vectors (radiation, prices, and thermal management of storage). Then, it is necessary to run the model iteratively in continuous intervals of 72 h, with hourly updates of results and intermediate vectors. This means the scheduled execution of the plant model for 72 h a total of 8760 times throughout the year is required to obtain optimal results of operation in the 72 h following its continuous execution.
The result of the execution of this iterative model will show the optimal strategy for thermal storage in the plant and the auxiliary load heat sources and electricity generation in each hour of operation throughout the year, allowing the plant operator to make appropriate decisions on different power plant control systems.

2.2.3. Economic Parameters

To participate in the electricity market, the PT Plant must bid an hourly sale price of energy to the market, including the capacity production for each hour of the day. The meteorological variables can introduce a stochastic element of variation, which can lead to non-compliance penalties with the energy commitment acquired from the PT Plant [20]. Thermal storage must attenuate these variations for commitment to generation and reduce the influence of meteorological variables that are difficult to predict and control.
The proposed plant model in the present work calculates, by optimization process, the benefits of the programming of electrical energy production, according to the characteristics of the plant.
For the simulation of direct power sales in the electricity market an annual series of values in the price of electrical energy was used. This annual series was created from the arithmetic mean of the 24 series of prices negotiated for each of the hours of the following day in the daily market, expressed in Euros per kilowatt-hour (€/kWhe), during the period between 1 January and 31 December 2017 (8760 values).

2.2.4. Electricity Generation Optimization Functions

The optimization of the PT plant has been oriented toward the improvement of production through different operation alternatives, considering a plant with thermal storage, as well as an unregulated regime of the electricity market.
For the optimization of the production of electricity, the model of the solar plant with thermal storage using molten salt was analyzed as described. According to the plant architecture it proceeded with its simulation considering its participation in the daily market of electricity. The set of electricity sales results allows us to determine the circumstances that optimize the operation of the plant, improving its economic profit.
The optimization of the system of generation, concentrated solar thermal with thermal storage, uses linear functions and coupling times among the variables. In this approach, it is considered to be a daily change horizon with hourly discretization. To improve the determinist approach, an annual database, corresponding to the real information from the year 2017, is analyzed. energy and electrical aspects are both studied simultaneously, which reflects the reality of the system being considered.
The optimization function presented maximizes the electrical energy generated in the solar plant, parameterized by the electric energy price values in each production hour. Thus, the index of performance (or objective function) is, finally, the economic benefit of the plant activity, subject to a set of equations and inequalities that represent the behavior and the physical limitations (or restrictions) of the system.
The equality restrictions express the equations of the power flow. The restrictions of inequality can be physical (limitations of the capacity of system components), operational (limits of practice of system operation, that must be considered in the model), and of security (determined by a set of contingencies determined by the real-time security analysis) [23].
Next, the formulation of the Thermal Group Hourly Program (TGHP) [23,24,25] is taken into account in order to study the processes of loading and unloading, at least, a complete cycle of operation. For the formulation of this problem (linear type) the variables used are continuous in the intervals (J) considered.

Solar Field and Thermal Storage System

In reference to the solar field, the relationship between the Direct Normal Irradiation R D N I ( j ) on the PT collectors and the thermal energy supplied to the thermal storage system and electricity generation system P S o l a r ( j ) is shown in Equation (2).
( 1 c C t ) R D N I ( j ) A C t = 1 3600 1 η C t P S o l a r ( j ) j J ,
where c C t represents the losses of the solar field as well as the solar radiation not captured by the collectors; A C t is the total acquisition surface; and η C t is the conversion efficiency of solar radiation into heat energy.
For the thermal storage system, the relationship between the thermal energy storage in the molten salt tanks in the hour j, E A ( j ) , the thermal capacity flow from the solar field collectors, P A ( j ) , and the thermal capacity flow to the power block, P A + ( j ) , is shown in Equation (3). Technical restrictions in the thermal storage system, minimum stored thermal energy in the tanks ( E A min ), and nominal power in the steam turbine ( P T max ), are included in Equations (4)–(7).
E A ( j ) = E A ( j 1 ) P A + ( j ) η + + η P A ( j ) j J ,
E A ( j ) E A min j J ,
E A ( j ) h e q P T max j J ,
0 P A + ( j ) P T max / η f u l l _ l o a d j J ,
0 P A ( j ) P T max / η f u l l _ l o a d j J .

Electricity Supply to Power Grid

The power balance of the PT plant is shown in Equation (8), where storage loading and unloading has been independently considered. Thus, the expression includes the two technical storage constraints, thermal capacity flow to the thermal storage system, P A ( j ) , and the thermal capacity flow from the storage tanks, P A + ( j ) . The value P S p i l l represents the power reduction due to the fact that the blur of collectors is very high for radiation periods.
In Equation (8) the solar plant’s electric power output is proportional to the amount of energy from the solar field, Psolar, at hour j, increased by the capacity obtained from the thermal storage system in the hour j, P A + ( j ) , and affected by the efficiency factor η s t o .
As described in Equation (2), the electricity generation is also limited by the effects of the thermal storage system and blur of the solar field collectors.
P T ( j ) η P B = P s o l a r ( j ) + P A + ( j ) η s t o P A ( j ) P S p i l l ( j ) j J .
The total production variation of the plant is obtained through (9). This value is proportional to the absolute value of the electric power variation generated along two sequential hours [26].
Δ P T ( j ) = P T ( j ) P T ( j 1 ) j J ,
Equations (10) and (11) introduce the variation limits of production (maximum ramps supported) in the production of electricity.
Δ P T ( j ) Δ P u p j J ,
Δ P T ( j ) Δ P d o w n j J .

Objective Function, Power Limits, and Restrictions

The Objective function represented in Equation (12), expresses the optimum benefit of the total energy production for each hour in the PT Plant, considering the price of the sale in the electricity market ( Π D M ), as well as the mathematical Equations (8)–(11).
Max j J [ ( Π D M ( j ) ) P T ( j ) ] .
The objective function is composed by the sales benefit from P T ( j ) as a variable parameter of optimization. Equations (13) and (14) show the limits of the PT plant generated power P T ( j ) .
P T min P T ( j ) P T max j J ,
j J P T ( j ) h A e q P T max .
The value P T ( j ) is the power of electricity generation of the PT Plant along the entire connection interval. This power is limited by P T M a x as the nominal power of the plant. This limitation influences the amount of energy stored and generated related to the thermal energy obtained through the solar concentrators.
In this work it is considered that, by using the solar multiple defined by the design of the plant, the collection surface is sufficient to obtain the thermal needs of the plant, both in storage and electricity generation.
To obtain the maximum storage capacity of the solar plant an electrical energy amount equivalent to the product of h e q storage hours multiplied by P T M a x , the maximum power of the steam turbine, is required. Under nominal conditions, this term must be increased, according to the turbine’s own performance and losses, heat storage efficiency through molten salts, and the plant’s self-consumption energy, for the regulation and maintenance of latent heat of recirculation. The formulation of the TGHP by optimization procedures is as shown in Equations (12) and (14).

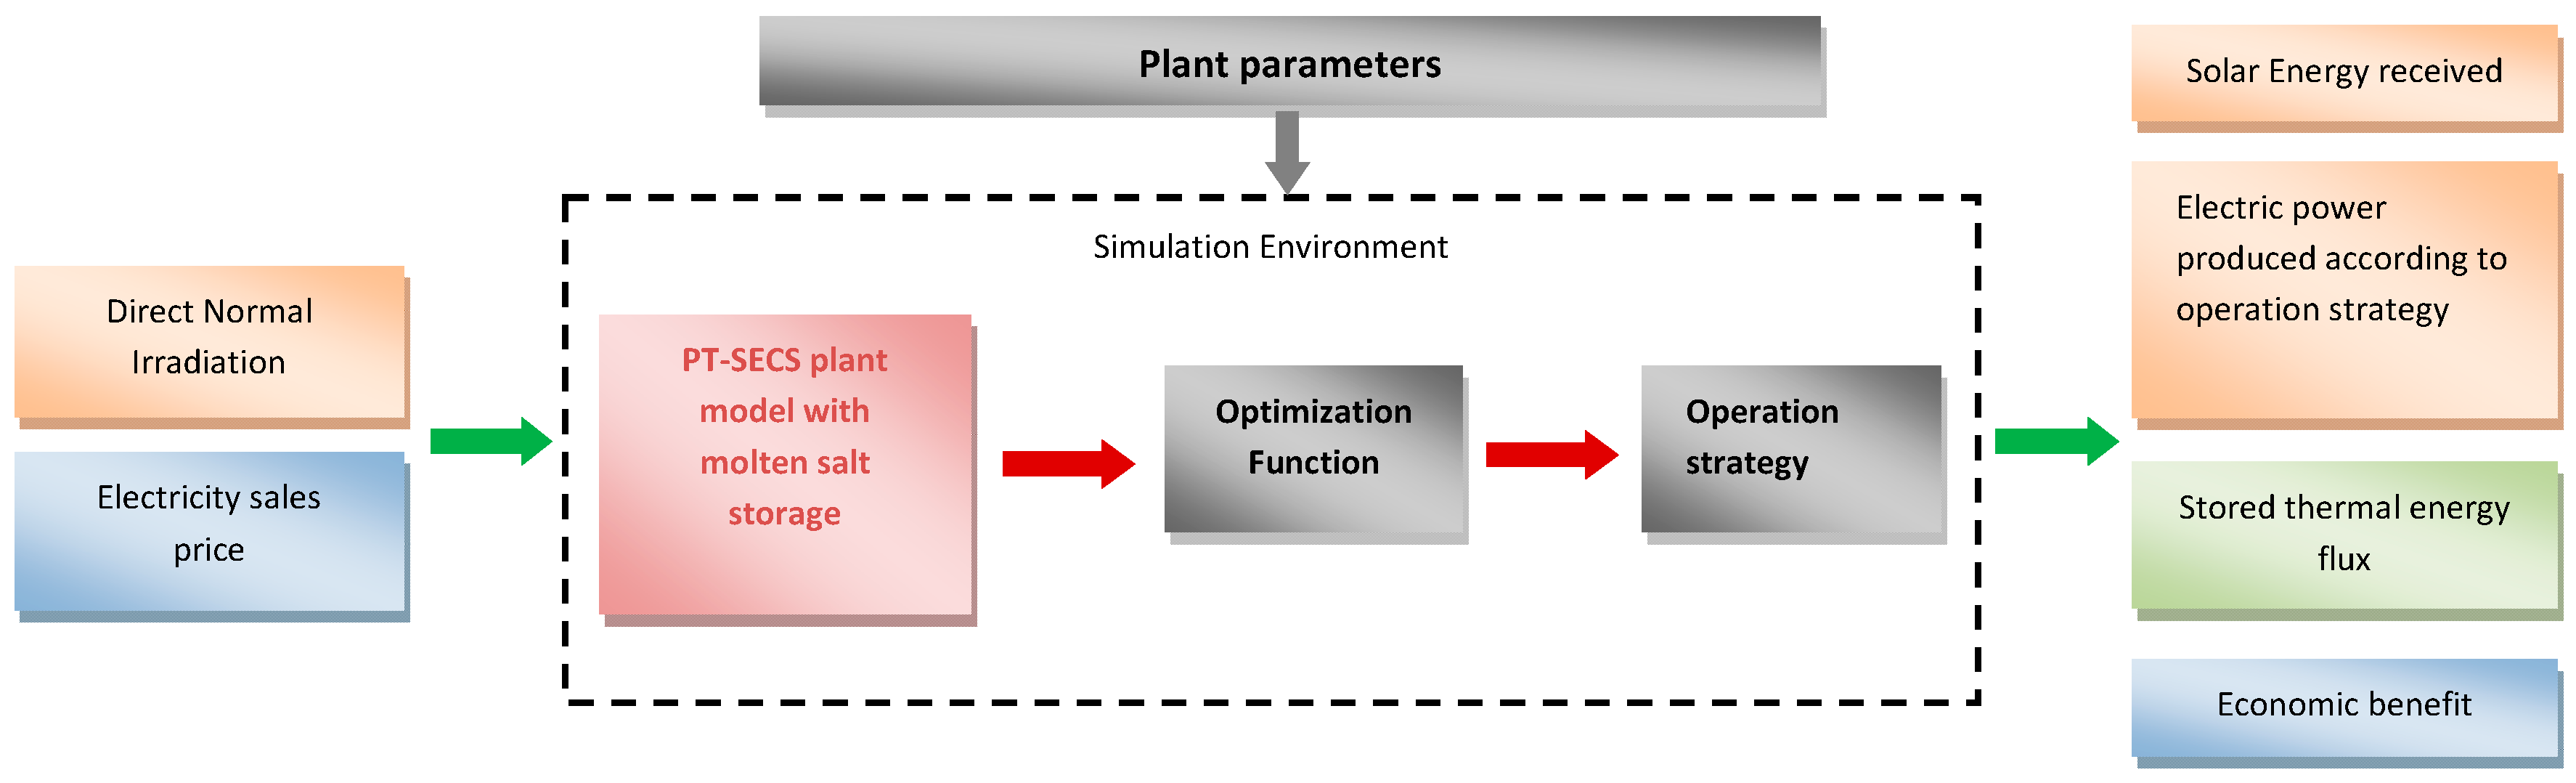
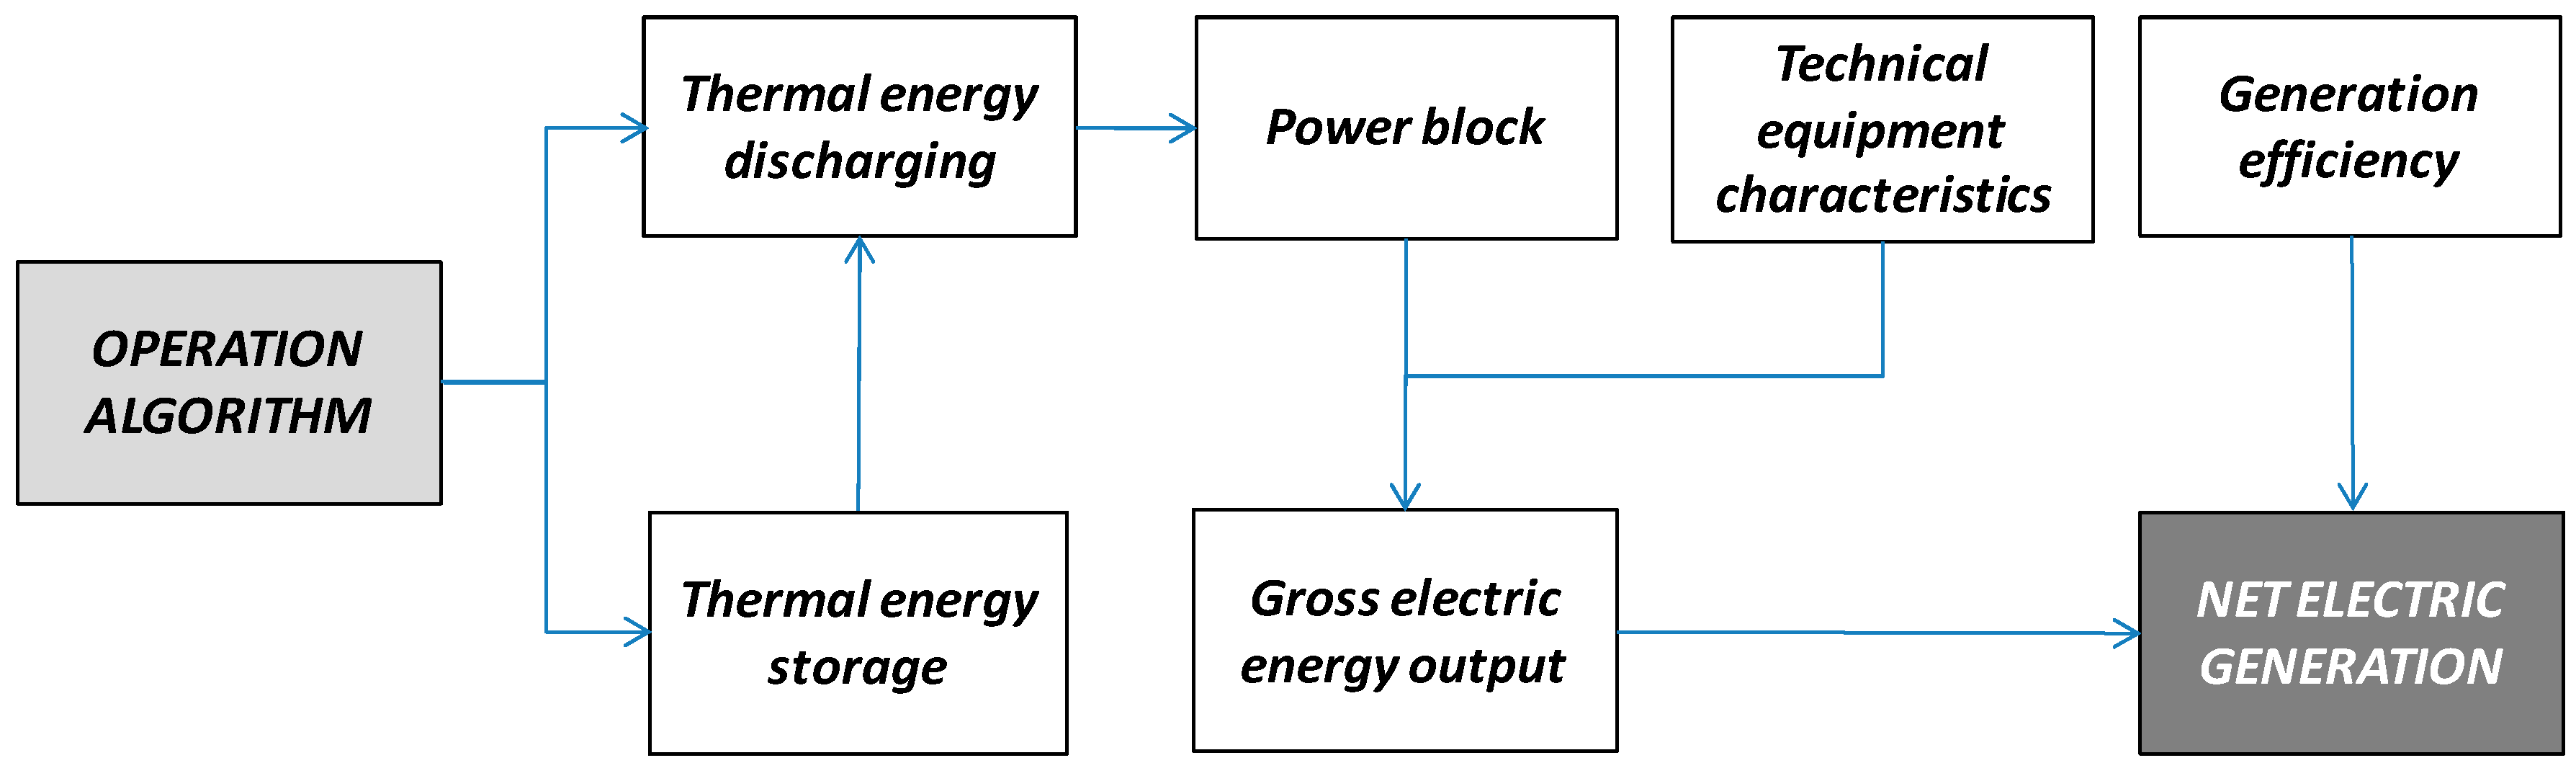
2.3. Simulation Environment and Model Implementation

For the simulation of the operation through sale, consideration of the hourly prices from the previous year is the better option for comparing the results of this system with the specific remuneration in real markets. Knowing the annual production, as well as the arithmetic average of the price of electricity in the daily market, is necessary for the calculation of profit and remunerations.
For the adjustment value by deviations in the market price calculation it is necessary to consider the arithmetic mean of the hourly values in the price of electricity in the daily market throughout the year of study as the reference price.
As limitations of the considered model, neither the start and stoppage of PT plant generation, nor the dynamics of heating in the solar field, have been modeled. Likewise, the consumption of gas as an auxiliary functional source of heat has been limited attending to the annual operation of its use in the model. Finally, a constant performance in the production of electricity and conversion of radiation has been considered, leaving the inclusion of the functions of temperature for these parameters for future works. The calculations and Case Studies (CS) are shown below, in which the described PT Plant models and the optimization equations have been applied.
The first aim of this storage optimization model is to maximize the economic profit of the production, according to the market price of the electric energy. This will allow an optimal electricity generation forecast to be made in the daily market. The optimization approach has been presented through Equation (11), for sale with daily market price, as an objective function. Equations (3)–(7) are added as constraints. The coefficients η C t , c C t , η + , and η have been considered, according to the values shown in Table 1.
Considering either the solar radiation or the selling price of the electricity generated, these parameters are going to set the case studies, establishing the different scenarios for analysis and comparison. Thus, in reference to the available solar resource, the direct normal radiation throughout the year is distributed into two main families. These scenarios have been defined based on current operating values of the PT plant.
The series of results are presented according to the case study of Table 2. In each case, the operation in a 50 MWe PT plant with thermal storage using double tank of molten salt, with a thermal capacity of 4 equivalent hours of full load production, is considered. The results of the plant operation in this case, as well as the optimal results of operation in absolute values, are represented hereinafter.
Results have been extracted from the full implementation through annual vectors of each entry (8760 values). However, to facilitate the analysis and presentation of results, it is necessary to consider significant intervals of 72 h. These intervals are presented as the most representative ones for the PT plant operation and generation decision-making strategy in the short term.
The first, Low Solar Resource (LSR), corresponds to periods when the radiation received is not sufficient for the production of electrical energy in a continuous manner. Energy storage is a fundamental resource both for the optimization of production and for the maintenance of safety of the solar field temperature (<260 °C). In this stage, the fade out phase, due to excessive solar resources, is not usual. The second family, High Solar Resource (HSR), corresponds to periods when the solar radiation is aimed at production and storage and when the fade out of some collectors of the solar field is frequent, due to excessive solar resources at the plant (>393 °C).
Related to the selling price of the electricity generated in the solar system, there are two periods of classification to determine two forms of operation. The first, High Market Prices (HP), correspond to business days (usually from Monday to Friday) when the high demand for electrical energy raises market values and selling prices, related to the basis of production, availability of different types of plants, and the curve of demand, mainly (65–74 €/MWhe) [20]. The second period, Low Market Prices (LP), occurs during public holidays or non-working days (mainly Saturdays and Sundays) when the reduction of electric energy demand marks a notable decrease of price in the electricity market (55–65 €/MWhe) [20].

3. Results

The cases studies analyzed herein consider a solar plant whose size corresponds, in its main characteristics, to the generic plant, with a thermal storage system using a double tank of molten salts with a thermal capacity equivalent to 4 h of full load production. The storage system using a double tank of molten salt is considered to calculate the optimal profit results of the sale of electricity production.

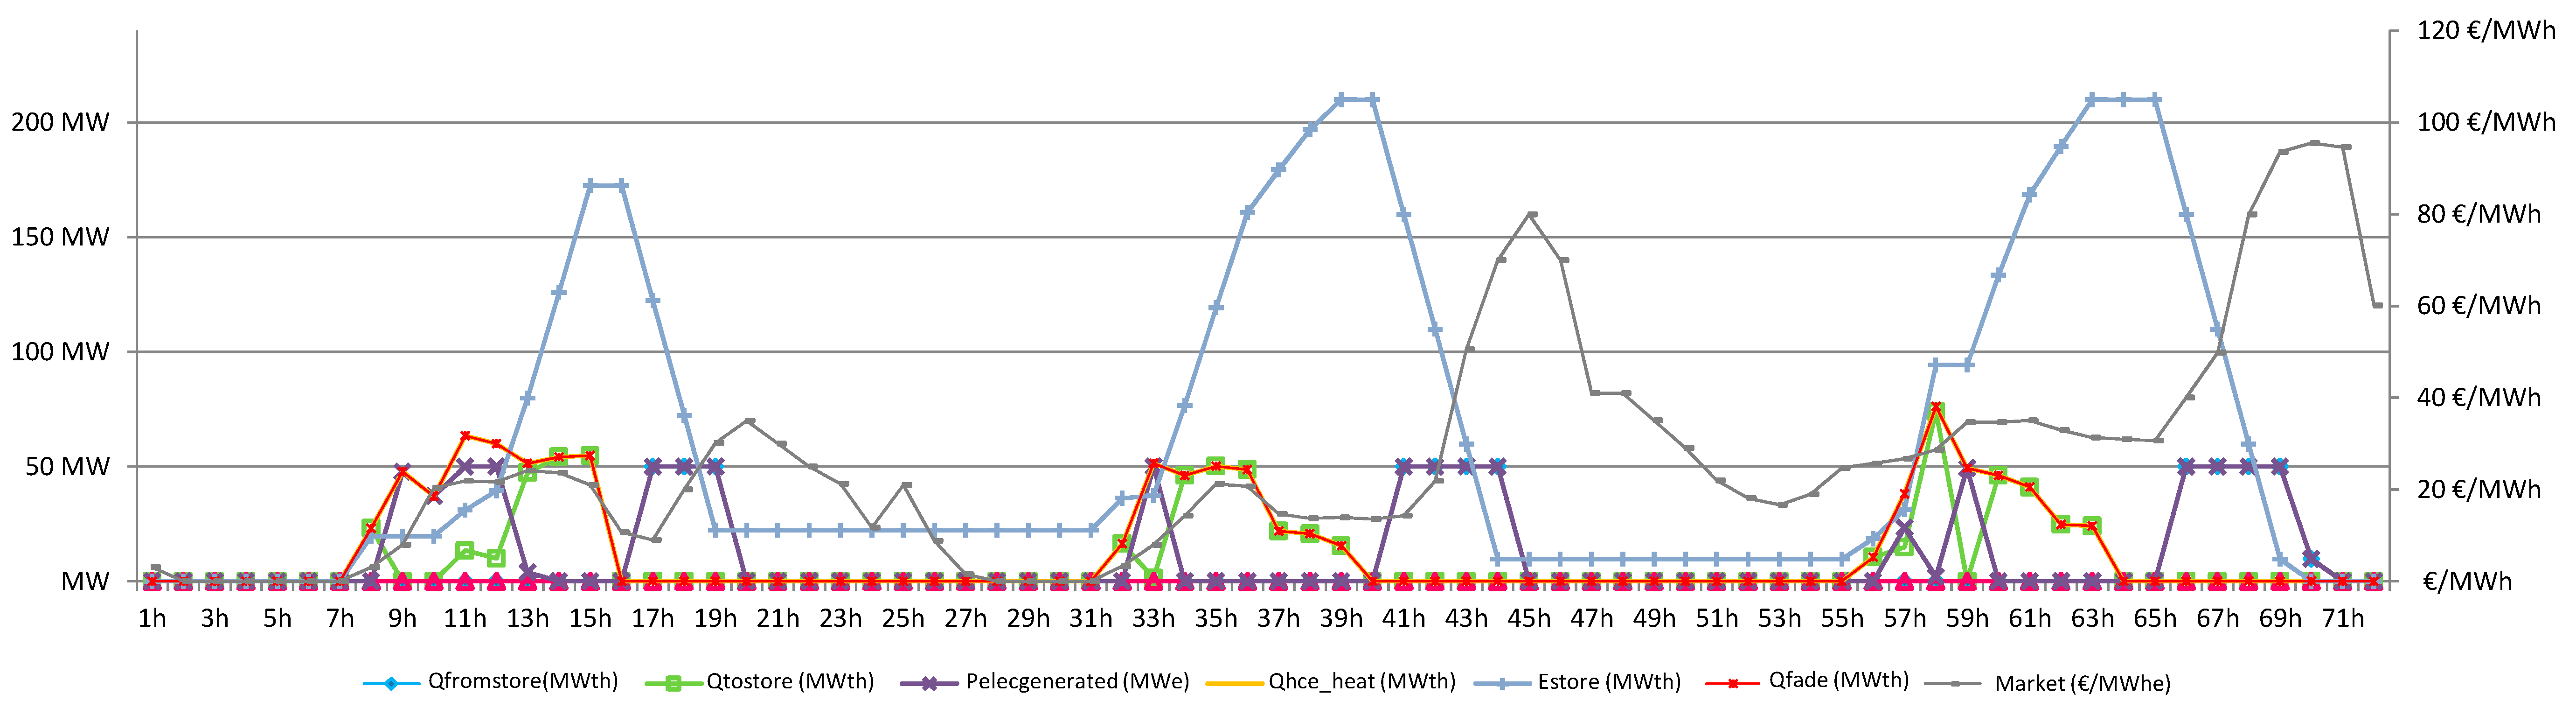
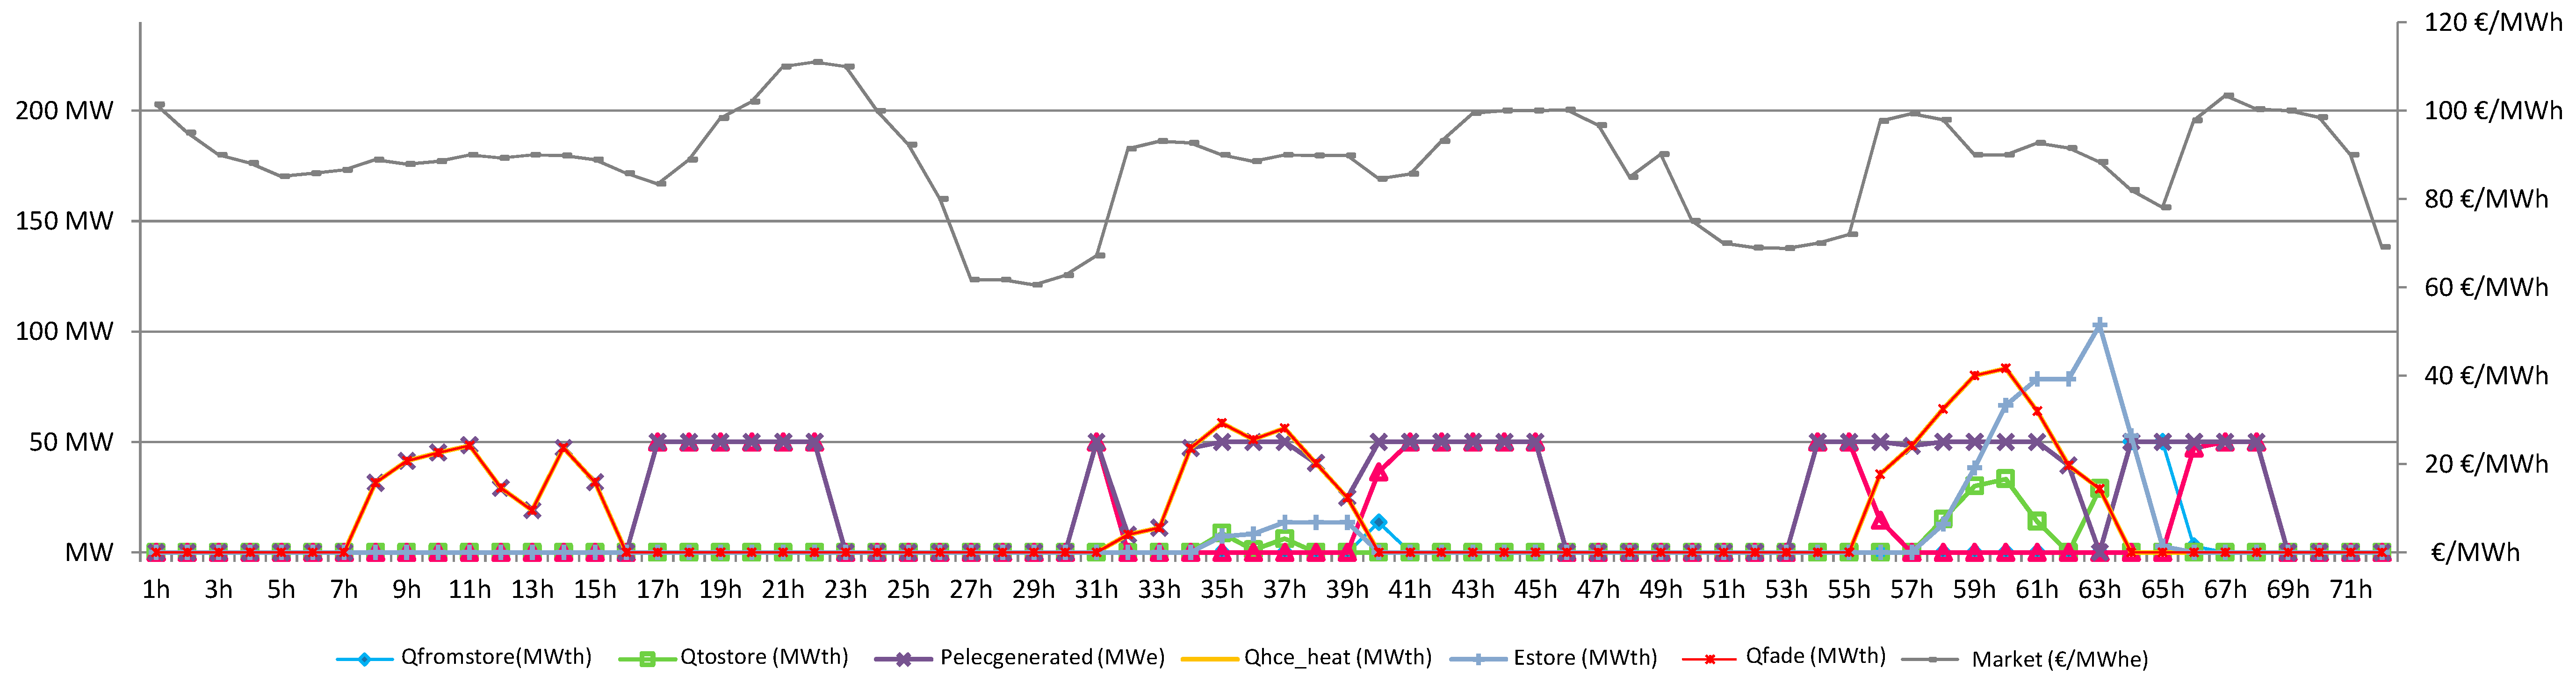
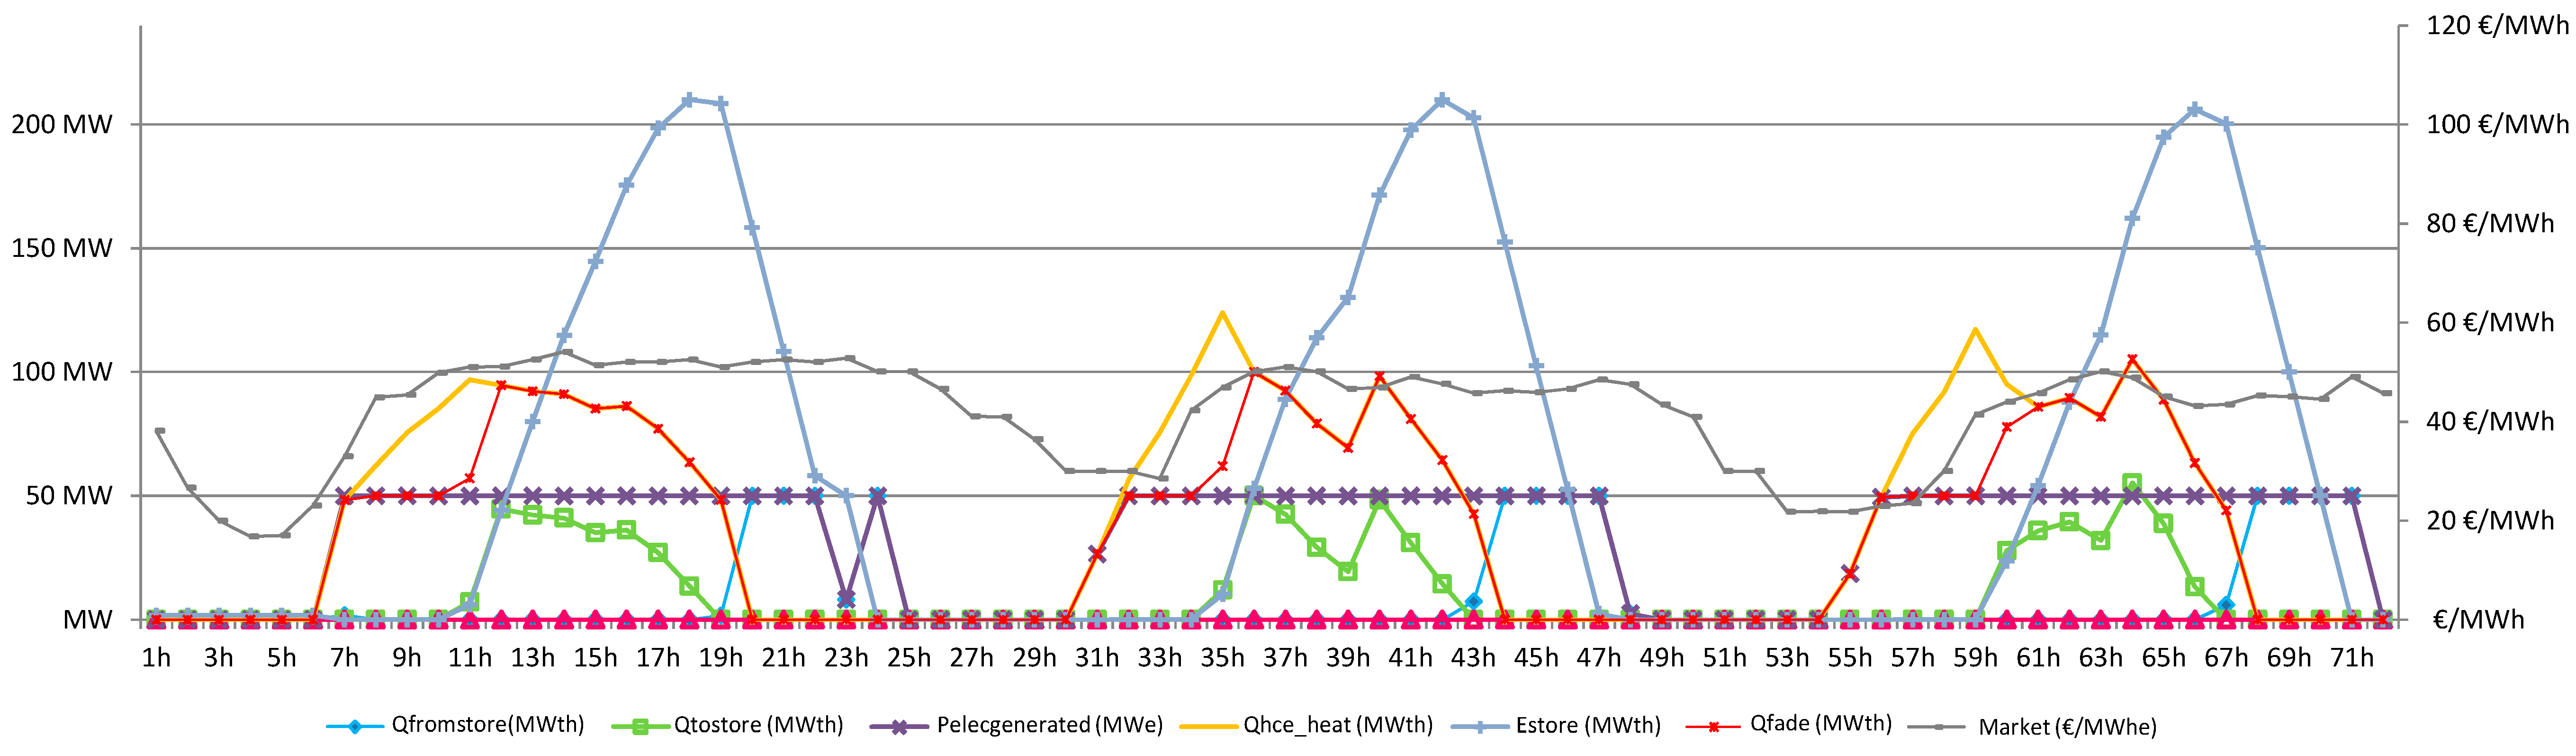
3.1. Optimization of the Daily Operation in Plant

The results of the generation optimization for the proposed system are shown in Figure 6, Figure 7, Figure 8 and Figure 9. As described in 2.3, this result is obtained according to four selected simulation intervals of 72 h throughout 2017 (from 5–7 July, 17–19 July, 8–10 December, and 27–29 December).
In Figure 6 and Figure 7, the optimization of operation, solved by the PT solar thermal model plant, can be observed, in which the solar radiation received is used for both the direct generation of electricity through the steam turbine and for the thermal storage as deferred power generation, according to the price changes and tendency of each hour. This storage occurs when the solar radiation received is higher than is necessary for direct generation, considering the gradient of charging for molten salt storage. When the gradient of the thermal storage load is lower than the received solar radiation, the focus system must reduce the thermal solar reception to avoid superheating thermal fluid in the solar field.
When the solar radiation received in the field of collectors is not sufficient to maintain the full load in the steam turbine, the thermal discharge of the deposits of molten salt is an important factor. which depends on the electricity sale price. In a situation of low or zero DNI, the simulated plant model makes use of the discharge gradient of recovery which, in case of being insufficient, is complemented by the use of natural gas support (technically dispensable uses) whenever the rise of the sale price of generated electricity allows it.
In Figure 8 and Figure 9, as in the previous figures, the operation optimization, solved by the model of solar thermal plant and algorithms with linear continuous solution, can be observed, in which the received solar radiation is used for the electricity generation or to operate in the recovery mode and heat storage. In this case, as it occurs in the plant model without storage in summer periods, it can be seen how the simulation model makes the use of natural gas support for electricity generation unnecessary in optimal operation, thus relegating this support to technically essential uses for the solar power plant.
In descending electrical energy prices periods, the solar field begins the recovery phase to raise the temperature of the thermal fluid of the field (recirculation), storing unused solar thermal energy in the double tank of molten salts system. If these descending price periods, usually on weekends, are coincident with a period of high radiation or high temperature gradients, the modeling system will defocus sequential loops of collectors to adapt the radiation received to the electricity production that is required. Table 3 shows a summary of the optimal production results with thermal storage.
The main complexity in the model solar plant operation is caused by the control of inertia and thermal gradient of each block of the plant (collection, storage, and generation), in order to prevent situations of either overheating or temperature reduction to below safe values in the solar field.
The plant model optimization is evaluated by comparing the results of the 72 h simulation intervals with the vectors from the Equation (8), constrained by Equations (3) to (7). Table 4 shows the comparative results of operation of the 50MWe PT plant with thermal storage. The result variations due to the optimization process, both from energy production and economic benefit of selling in the market, is expressed by (∆).

3.2. Economical Results

Table 5 summarizes the operation results of the plant according to the described model and according to the case studies shown in Table 2. In this overview it is possible to see, as a rule, a 50 MWe PT solar thermal plant, with a thermal storage system, improves the economic benefit derived from its electricity production in a meaningful way (from 5.17% to 7.79%), related to market prices. This storage system manages to operate for a higher number of hours throughout the year and, in the case of reduced availability of solar resource, as shown in CS[LSR][LD], defers to periods in which the price of electricity is highest. Thus, it can be seen that for a similar production, or even a lower one for the second of the scenarios studied, greater economic benefit can be obtained by moving production into hours with more favorable electricity prices. Therefore, the novel strategy shown in this work improves the benefits of energy production for the same solar radiation and TES sizing.

4. Discussion

In this work, an operation analysis on a currently operating PT solar thermal power plant, with a double tank molten salt energy storage system, is carried out according to the physical parameters of the plant, as well as to a non-regulated electricity market.
The designed model of the PT plant is validated through real data from the different plant systems. This optimized model is applied to 4 case studies, which compare the obtained results with the operational values of the real PT plant. These 4 case studies have been structured in intervals of 72 h, which represent the four possible scenarios of the plant operation related to the availability of the solar resource and the market price of the electricity produced.
Direct algebraical results, shown in Table 4, represent the standard production of the real PT plant, operating since 2014. The results obtained in the optimized operation of the plant allow for improvement of solar resource utilization in periods when the price of the energy produced is more favorable, thus increasing the general operation benefit throughout the year. As a results summary, Table 6 shows the improvement in energy production, according to each scenario.
The adaptation of this operation model to another type of plant involves the adaptation of the different parts of the model as well as the input data (solar resource and selling price of electricity). For the solar resource adaptation, either the radiation databases from the town of study or the simulations for their predictions are needed.
To obtain the market prices of electricity, as well as its future estimation, it is necessary to take different tools and platforms, put at the disposal of the production agents by that market operator, into account. According to the European Directives [27], data on electricity sales prices used for this work can be applied to any other installation that participates in these types of markets.

5. Conclusions

This work presents a novel operation strategy for PT plants according to non-regulated electrical markets. A mathematical operation model has been created and calibrated with real values from a currently operated plant. The results obtained in the optimized operation of the plant allow for improvements in solar resource use in periods in which the price of the energy produced is more favorable, thus increasing the general operation benefit throughout the year.
The dynamic parameters of the PT plant are modeled for future studies to improve the results of the operation, as well as to obtain conclusions which allows for optimization of the design of the whole system.
Furthermore, deviations over the expected daily load, which imply penalties applied on the sales of energy production, are under study. The minimization of these deviations is one of the objectives for future research works, due to its influence in the final electricity price and plant benefits.

Author Contributions

J.M.L. and D.B. conceived and designed the mathematical model and its calibration, set up the data acquisition from the currently operating PT power plant, and developed the environment of study and the simulation model; M.R.A. helped with the simulation model and performed the calibration model process; J.M.L. and D.B. analyzed the data; J.M.L. and D.B. wrote the paper.

Funding

This research received no external funding.

Acknowledgments

The authors would like to acknowledge the collaboration in this work with the Engineering team of Africana Energía Parabolic Trough solar thermal power plant, located in Cordoba (Spain).

Conflicts of Interest

The authors declare no conflict of interest.

Nomenclature

Solar parameters
A c t Real Collection surface for 50 MW solar thermal plant (m2)
c C t Thermal loses coefficient in solar field (%)
E A ( j ) Stored energy in period j (MWth)
E A min Minimum stored thermal energy in tanks (MWhth)
F S o l a r F a c t o r Oversize of solar collection surface referred to the 50MW solar thermal plant without storage (%)
h e q Equivalent time of production of electricity under full load regime (h)
h A e q Equivalent time of operation of the plant in annual period (h)
N M a x H o u r S t o r a g e Maximum stored energy in thermal tanks (equiv. hours of max. production (h))
P A + ( j ) Thermal flow from storage system to power block in period j (MWth)
P A ( j ) Thermal power to storage system in period j (MWth)
P S o l a r ( j ) Solar power received from the concentrators in the hour j (kWth)
P S p i l l ( j ) Reduction of radiation by fade out when production peaks occur (kWth)
P T ( j ) Electrical power generated in steam turbine for the period j (kWe)
P T max Nominal power in steam turbine (kWe)
P T min Min output power in power block (MWe)
Δ P T ( j ) Gradient of power generation (MWe)
Δ P U p Max slope of generation in power plant
Δ P D W N Maximum slope of thermal discharge or power off
Q H C E H e a t M a x Nominal thermal energy received from the solar field (kWhth)
Q T o S t o r e _ j Thermal energy input to the hot tank in period j (kWth)
Q F r o m S t o r e _ j Thermal energy from the hot tank to the steam turbine in period j (kWth)
Q D T u r b i n e G r o s s Nominal thermal energy to the steam turbine (kWth)
Q T u r b i n e T h e r m a l I n p u t _ j Thermal energy to the steam turbine in period j (kWth)
R D N I ( j ) Direct Normal Radiation as solar resource (kWhth/m2)
η C t Solar thermal efficiency (optical efficiency and loses in pumps and pipes (%)
η H E D T o S t Storage load efficiency (%)
η H E D F r o m S t Storage unload efficiency (%)
η D T u r b i n e G r o s s Thermal-electrical conversion efficiency by design (%)
η P B Efficiency coefficient in power block (%)
η s t o Coefficient of efficiency of thermal energy storage (%)
Π D M Price of electricity in Spanish daily market (€/MWhe)
Index
CtSolar thermal field parameters
DMDaily market
DTurbineGrossDesign parameters for steam turbine
DWNDischarge
HCEHeat from the solar field
HEDFROMSTHeat from storage system
HEDTOSTHeat to storage system
j Time, as variable
J Planning of operating period in hours
MaxMaximum value
MinMinimum value
SpillDefocus factor
UpCharge
Acronyms
CSCase Study
CFCapacity Factor
DIPSDelayed Intermediate Production System
DNIDirect Normal Irradiance
HPHigh Market Price
HSRHigh solar Resource
HTFHeat Transfer Fluid
LCOELevelized cost of energy
LPLow Market price
LRSLow Solar Resource
PLPPeak Load Plant
PTParabolic Trough
SMSolar Multiple
TGHPThermal Group Hourly Program

References

  1. Llamas, J.; Bullejos, D.; Barranco, V.; de Adana, M.R. World location as associated factor for optimal operation model of Parabolic Trough Concentrating Solar Thermal Power Plants. In Proceedings of the IEEE 16th International Conference on Environment and Electrical Engineering (EEEIC), Florence, Italy, 7–10 June 2016; IEEE: Florence, Italy, 2016; pp. 1–6. [Google Scholar] [CrossRef]
  2. Zervos, A. Renewables 2018 Global Status Report; REN21 Secretariat: Paris, France, 2018. [Google Scholar]
  3. Osório, G.J.; Lujano-Rojas, J.M.; Matias, J.C.O.; Catalão, J.P.S. A new scenario generation-based method to solve the unit commitment problem with high penetration of renewable energies. Int. J. Electr. Power Energy Syst. 2015, 64, 1063–1072. [Google Scholar] [CrossRef]
  4. Zsiborács, H.; Pintér, G.; Bai, A.; Popp, J.; Gabnai, Z.; Pályi, B.; Farkas, I.; Baranyai, N.; Gützer, C.; Trimmel, H.; et al. Comparison of Thermal Models for Ground-Mounted South-Facing Photovoltaic Technologies: A Practical Case Study. Energies 2018, 11, 1114. [Google Scholar] [CrossRef]
  5. Sioshanshi, R.; Denholm, P. The Value of Concentrating Solar Power and Thermal Energy Storage; Technical Report NREL-TP-6A2-45833; National Renewable Energy Laboratory: Golden, CO, USA, 2010.
  6. Wittman, M.E.; Eck, M.; Pitz-Paal, R.; Müller-Steinhagen, H. Methodology for optimized operation strategies of solar thermal power plants with integrated heat storage. Sol. Energy 2011, 85, 653–659. [Google Scholar] [CrossRef]
  7. Porras, M.; Serrano, E.; Wiesenberg, R. Optimization in the operation of a solar thermal power plant using the S2M solver 1.0 tool. In Proceedings of the 2010 Solar PACES Symposium, Perpignan, France, 21–24 September 2010. [Google Scholar]
  8. Usaola, J. Operation of concentrating solar power plants with storage in spot electricity markets. IET Renew. Power Gener. 2012, 6–1, 59–66. [Google Scholar] [CrossRef]
  9. Almasabi, A.; Alobaidli, A.; Zhang, T.J. Transient Characterization of Multiple Parabolic Trough Collector Loops in a 100 MW CSP Plant for Solar Energy Harvesting. Energy Procedia 2015, 69, 24–33. [Google Scholar] [CrossRef] [Green Version]
  10. Habib, L.; Hassan, M.I.; Shatilla, Y. A Realistic Numerical Model of Lengthy Solar Thermal Receivers Used in Parabolic Trough CSP Plants. Energy Procedia 2015, 75, 473–478. [Google Scholar] [CrossRef] [Green Version]
  11. García de Jalón, A.; Pérez, D.; Benito, P.; Zaversky, F. Inspection Receiver Tubes Device for CSP Plants. Energy Procedia 2015, 69, 1868–1876. [Google Scholar] [CrossRef] [Green Version]
  12. Boudaoud, S.; Khellaf, A.; Mohammedi, K.; Behar, O. Thermal performance prediction and sensitivity analysis for future deployment of molten salt cavity receiver solar power plants in Algeria. Energy Convers. Manag. 2015, 89-02, 655–664. [Google Scholar] [CrossRef]
  13. Enjavi-Arsanjani, M.; Hirbodi, K.; Yaghoubi, M. Solar Energy Potential and Performance Assessment of CSP Plants in Different Areas of Iran. Energy Procedia 2015, 69, 2039–2048. [Google Scholar] [CrossRef] [Green Version]
  14. Zarza, E. Generación directa de vapor con colectores solares cilindro parabólicos. Proyecto DIrect Solar Steam (DISS). Ph.D. Thesis, Universidad de Sevilla, Seville, Spain, 2002. [Google Scholar]
  15. Kelly, B. Thermal Storage Commercial Plant Design Study for a 2-Tank Indirect Molten Slat System; Report No. NREL/SR-550-40166; National Renewable Energy Laboratory: Golden, CO, USA, 2006.
  16. Bullejos, D.; Llamas, J.; De Adana, M.R. Spanish regulated scenarios for renewable energy and CSP plants. Arpn J. Eng. Appl. Sci. 2015, 10, 7217–7222. [Google Scholar]
  17. Turchi, C. Parabolic Trough Reference Plant for Cost Modeling with the Solar Advisor Model (SAM); Technical Report NREL/TP-550-47605; National Renewable Energy Laboratory: Golden, CO, USA, 2010.
  18. Blake, D. Overview on Use of a Molten Salt HTF in a Trough Solar Field. In Proceedings of the NREL: Parabolic Trough Thermal Energy Storage Workshop, Golden, CO, USA, 20–21 February 2003. [Google Scholar]
  19. Llamas, J.; Bullejos, D.; Ruiz de Adana, M. Techno-Economic Assessment of Heat Transfer Fluid Buffering for Thermal Energy Storage in the Solar Field of Parabolic Trough Solar Thermal Power Plants. Energies 2017, 10, 1123. [Google Scholar] [CrossRef]
  20. Operador del Mercado (Ibérico) de Electricidad (OMEL/OMIE). Available online: http://www.omel.es (accessed on 8 January 2019).
  21. Eutech Scientific Engineering. Thermolib User Manual. Available online: https://www.thermolib.de/media/thermolib/downloads/Thermolib-UserManual.pdf (accessed on 24 August 2015).
  22. Mathworks. The Mathwork, SymPowerSystems 5. Available online: http://www.mathworks.com. (accessed on 28 February 2019).
  23. Castronuovo, E. Optimization Advances in Electric Power Systems; Nova Science Publishers Inc.: New York, NY, USA, 2008; ISBN 978-1-60692-613-0. [Google Scholar]
  24. International Energy Agency Technology Roadmap. Concentrating Solar Power. Available online: http://www.iea.org (accessed on 11 December 2018).
  25. Kalogirou, S. Solar Energy Engineering: Processes and Systems; Elsevier Inc.: Burlington, MA, USA, 2009; ISBN 978-0-12-374501-9. [Google Scholar]
  26. Soleymani, S.; Ranjbar, A.M.; Shirani, A.R. Strategic bidding of generating units in competitive electricity market with considering their reliability. Electr. Power Energy Syst. 2008, 30, 193–201. [Google Scholar] [CrossRef]
  27. Union, E. Directive 2009/28/EC of the European Parliament and of the Council of 23 April 2009 on the promotion of the use of energy from renewable sources and amending and subsequently repealing Directives 2001/77/EC and 2003/30/EC. Eur. Parliam. Off. J. 2009, 5, 2009. [Google Scholar]
Figure 1. Double tank direct storage system.
Energies 12 00935 g001
Figure 2. Structure of the simulation environment and data flow.
Energies 12 00935 g002
Figure 3. Functional unit for power block and net electric energy output models [19].
Energies 12 00935 g003
Figure 4. Representation of the correlation of HTF mass flow in the solar field.
Energies 12 00935 g004
Figure 5. Representation of the correlation of HTF temperature at the inlet of the solar field.
Energies 12 00935 g005
Figure 6. Hourly programming of optimal production CS[LSR][LP].
Energies 12 00935 g006
Figure 7. Hourly programming of optimal production CS[LSR][HP].
Energies 12 00935 g007
Figure 8. Hourly programming of optimal production CS[HSR][LP].
Energies 12 00935 g008
Figure 9. Hourly programming of optimal production CS[HSR][HP].
Energies 12 00935 g009
Table 1. Reference design values for a 50 MWe PT plant with thermal storage.
Solar Field
PT CollectorsUnits624
Total collectors’ surfacem2475438
Solar Multiple-2
Solar-thermal efficiency η C t ( η S o l a r )%51.6
Solar field loses c C t %<1
Operation average temperatures°C260–393
Solar field input temperature°C293
Solar field output temperature°C393
Pressure in checkpoints
Thermal fluid pumps outputbar15.30
Solar field inputbar14–28
Solar field outputbar10–15
Steam generation system input/outputbar393/293
Molten salt exchange input/outputbar293–380
Yearly received thermal energyMWhth1090000
Total thermal energy collected by the HTF systemMWhth465000
Collectors thermal efficiency%43
Total average efficiency%16
Thermal Storage (Double Tank of Molten Salt)
Total storage capacityMWhth1010
Storage efficiency η + ( η H E D F r o m S t )%98
Storage recovery efficiency η ( η H E D T o S t )%97
Steam Turbine. Single Recirculation, 4 Steam Extractions
Nominal electric powerMWe49.9
Residual losesMWe5.0
Efficiency ( η D T u r b i n e G r o s s )%99
Net energy productionMWhe160000
Input steam to turbinebar100 (370°C)
Recirculationbar16.5 (370°C)
Steam nominal fluxkg/s59
Table 2. Defined case studies.
Scenario
CS[SR][ME]
Solar Resource Availability
[Low DNI; High DNI]
Market of Electricity Behavior
[Low price; High price]
CS[LSR][LP]LSRLP
CS[LSR][HP]LSRHP
CS[HSR][LP]HSRLP
CS[HSR][HP]HSRHP
DNI: Direct Normal Irradiance, LSR: Low Solar Resource, HSR: High Solar Resource, LP: Low Price, HP: High Price.
Table 3. Summary of results of simulation. Period 72 h with thermal storage.
ScenarioGenerated Energy (MWhe)Auxiliary Energy Needed (MWhth)
CS [LSR][LP]920.820.0
CS [LSR][HP]2061.31898.20
CS [HSR][LP]2716.690.0
CS [HSR][HP]2734.020.0
Table 4. Comparative evaluation of optimal operation results in 72 h periods.
ScenarioGenerated energy (MWhe)
Direct Algebraical ResultsOptimized REsults
CS [LSR][LP]873.23920.825.45%
CS [LSR][HP]1912.692061.317.77%
CS [HSR][LP]2505.022716.698.45%
CS [HSR][HP]2534.552734.027.87%
Table 5. Summary of operation results for each study case.
ScenarioSales Incomings Gross in Spanish Market (€)Improved Incomings Gross in Spanish Market (€)Sales Incomings Improvement (%)
CS[LSR][LP]20373.68 21426.995.17%
CS[LSR][HP]169714.86 181951.307.21%
CS[HSR][LP]84295.8890862.527.79%
CS[HSR][HP]111104.39119215.017.30%
Table 6. Summary of operation production of electrical energy and incomings for each study case.
ScenarioGenerated Energy (MWhe)Optimization of Generation (%)Improved Incomings Gross in Spanish Market (€)Sales Incomings Improvement (%)
CS[LSR][LP]920.825.45%21426.995.17%
CS[LSR][HP]2061.317.77%181951.307.21%
CS[HSR][LP]2716.698.45%90862.527.79%
CS[HSR][HP]2734.027.87%119215.017.30%

