Article

Fuzzy Rule-Based and Particle Swarm Optimisation MPPT Techniques for a Fuel Cell Stack

Department of Electrical Electronic and Computer Engineering, Cape Peninsula University of Technology, P.O. Box 1906, Bellville Cape Town 7535, South Africa
*
Author to whom correspondence should be addressed.
Energies 2019, 12(5), 936; https://doi.org/10.3390/en12050936
Submission received: 2 January 2019 / Revised: 4 February 2019 / Accepted: 5 February 2019 / Published: 11 March 2019

Abstract

:
The negative environmental impact and the rapidly declining reserve of fossil fuel-based energy sources for electricity generation is a big challenge to finding sustainable alternatives. This scenario is complicated by the ever-increasing world population growth demanding a higher standard of living. A fuel cell system is able to generate electricity and water with higher energy efficiency while producing near-zero emissions. A common fuel cell stack displays a nonlinear power characteristic as a result of internal limitations and operating parameters such as temperature, hydrogen and oxygen partial pressures and humidity levels, leading to a reduced overall system performance. It is therefore important to extract as much power as possible from the stack, thus hindering excessive fuel use. This study considers and compares two Maximum Power Point Tracking (MPPT) approaches; one based on the Mamdani Fuzzy Inference System and the other on the Particle Swarm Optimisation (PSO) algorithm to maintain the output power of a fuel cell stack extremely close to its maximum. To ensure that, the power converter interfaced to the fuel cell unit must be able to continuously self-modify its parameters, hence changing its voltage and current depending upon the Maximum Power Point position. While various methods exist for Maximum Power Point tracker design, this paper analyses the response characteristics of a Mamdani Fuzzy Inference Engine and the Particle Swarm Optimisation technique. The investigation was conducted on a 53 kW Proton Exchange Membrane Fuel Cell interfaced to a DC-to-DC boost converter supplying 1.2 kV from a 625 V input DC voltage. The modelling was accomplished using a Matlab/Simulink environment. The results showed that the MPPT controller based on the PSO algorithm presented better tracking efficiency as compared to the Mamdani controller. Furthermore, the rise time of the PSO controller was slightly shorter than the Mamdani controller and the overshoot of the PSO controller was 2% lower than that of the Mamdani controller.

1. Introduction

Fuel cells (FCs) are likely to play a key role in the current and future power industries, as they are potential candidates to replace fossil fuel-based electric generators for clean electricity production. They show great capabilities for use in microgrids [1], and unlike other green energy technologies such as wind and solar power systems, they can operate at any site without geographic limitations to provide optimal services [2]. Their functioning is such that energy from an electro-chemical reaction is continuously converted into electricity in the form of direct current with water and heat as by-products [3]. In this electro-chemical reaction, hydrogen is the main fuel while oxygen is the oxidant. However, various other fuels are available for use depending upon the FC type. The most current FC technologies include Polymer Electrolytic or Proton Exchange Membrane Fuel Cell (PEMFC), Alkaline Fuel Cell (AFC), Phosphoric Acid Fuel Cell (PAFC), Solid Oxide Fuel Cell (SOFC), Molten Carbonate Fuel Cell (MCFC) and Direct Methanol Fuel Cell (DMFC) [3,4,5,6,7]. Among all the technologies mentioned above, PEMFCs are the most popular; a report of production revealed that in 2010, 97% of fuel cells in markets were PEMFC [8].
A PEMFC consists of three active parts: an anode, a cathode, and an electrolyte in between them. The electrodes are composed of a porous material enveloped by a layer of catalysts in platinum. Molecular hydrogen (H2) migrates from a gas-flow stream to the anode for the electrochemical reaction. The hydrogen is oxidised to create hydrogen ions and electrons based on the following equation:
H 2 2 H + + 2 e .
The hydrogen ions migrate to the acidic electrolyte, whereas the electrons head toward an outside circuit to go to the negative electrode. At the cathode, water is formed through the reaction between electrons and hydrogen with the oxygen supplied from an external gas-flow stream as expressed in Equation (2):
1 2 O 2 + 2 H + + 2 e H 2 O .
The general reaction in a fuel cell produces electricity, water and heat as shown in Equation (3):
H 2 + 1 2 O 2 H 2 O + W ele + Q heat .
The water by-products and heat are removed endlessly to maintain appropriated conditions for power generation.
In general, fuel cells present many benefits in comparison with conventional power sources such as internal combustion engines and renewable generators. These benefits are [9,10,11]:
  • Higher power efficiency;
  • Noise-free operation;
  • Less maintenance requirement;
  • Economical, as it does not need any fossil fuel for its operation.
However, they also have critical limitations such as poor voltage profile against current density, slower dynamics and the presence of higher current ripples.
In general, a typical PEMFC stack displays a nonlinear output power because of internal limitations and operating parameters which include the temperature, hydrogen and oxygen partial pressures, humidity levels, gas speed and stoichiometry, and membrane water content, leading to a reduced system performance [1,12,13]. It is crucial to extract as much power as possible from the stack knowing that at any operating condition, there is only one Maximum Power Point. This prevents excessive fuel use and avoids low system efficiency. To ensure this, a switch mode power converter referred to as a Maximum Power Point Tracker (MPPT) is interfaced between the FC and the load and operates such that the converter’s duty cycle is adjusted continuously, hence modifying the voltage and current depending upon the Maximum Power Point position. If a proper algorithm is used, the MPPT will be able to locate and track the PEMFC MPP.
As of now, diverse techniques are utilised to extract maximum power [14,15,16,17,18,19,20,21,22,23,24,25,26,27,28]. Most of these techniques are employed for photovoltaic [29] and wind generators [22,30], and vary from each other in several respects such as efficiency, complexity, convergence speed, sensors needed, hardware implementation and cost, to name a few [16,31,32].
This study considered and compared two maximum power point tracking approaches; one based on the Mamdani Fuzzy Inference System and the other on the Particle Swarm Optimisation algorithm to maintain the output power of a fuel cell stack as close as possible to its designed power. The main objective was to analyse the responses of both MPPT controllers. The investigation was conducted on a 53 kW Proton Exchange Membrane Fuel Cell coupled to a power electronics converter and a DC load. The simulation was performed under a Matlab/Simulink environment.
The rest of the paper is organised as follows: the next section is dedicated to the system modelling, Section 3 focuses on the MPPT design, Section 4 gives the simulation results, Section 5 compares both MPPT controllers and the last section deals with the conclusion.

2. System Modelling

The proposed system depicted in Figure 1 consists of a 53 kW Proton Exchange Membrane Fuel cell (PEMFC) stack, a DC-to-DC boost converter and a MPPT controller. The voltage and current of the fuel cell stack are sensed and used as inputs to the MPPT controller, which in turn delivers a signal for the PWM generator to drive the converter switch. The converter delivers 1.2 kV from a 625 V input voltage.

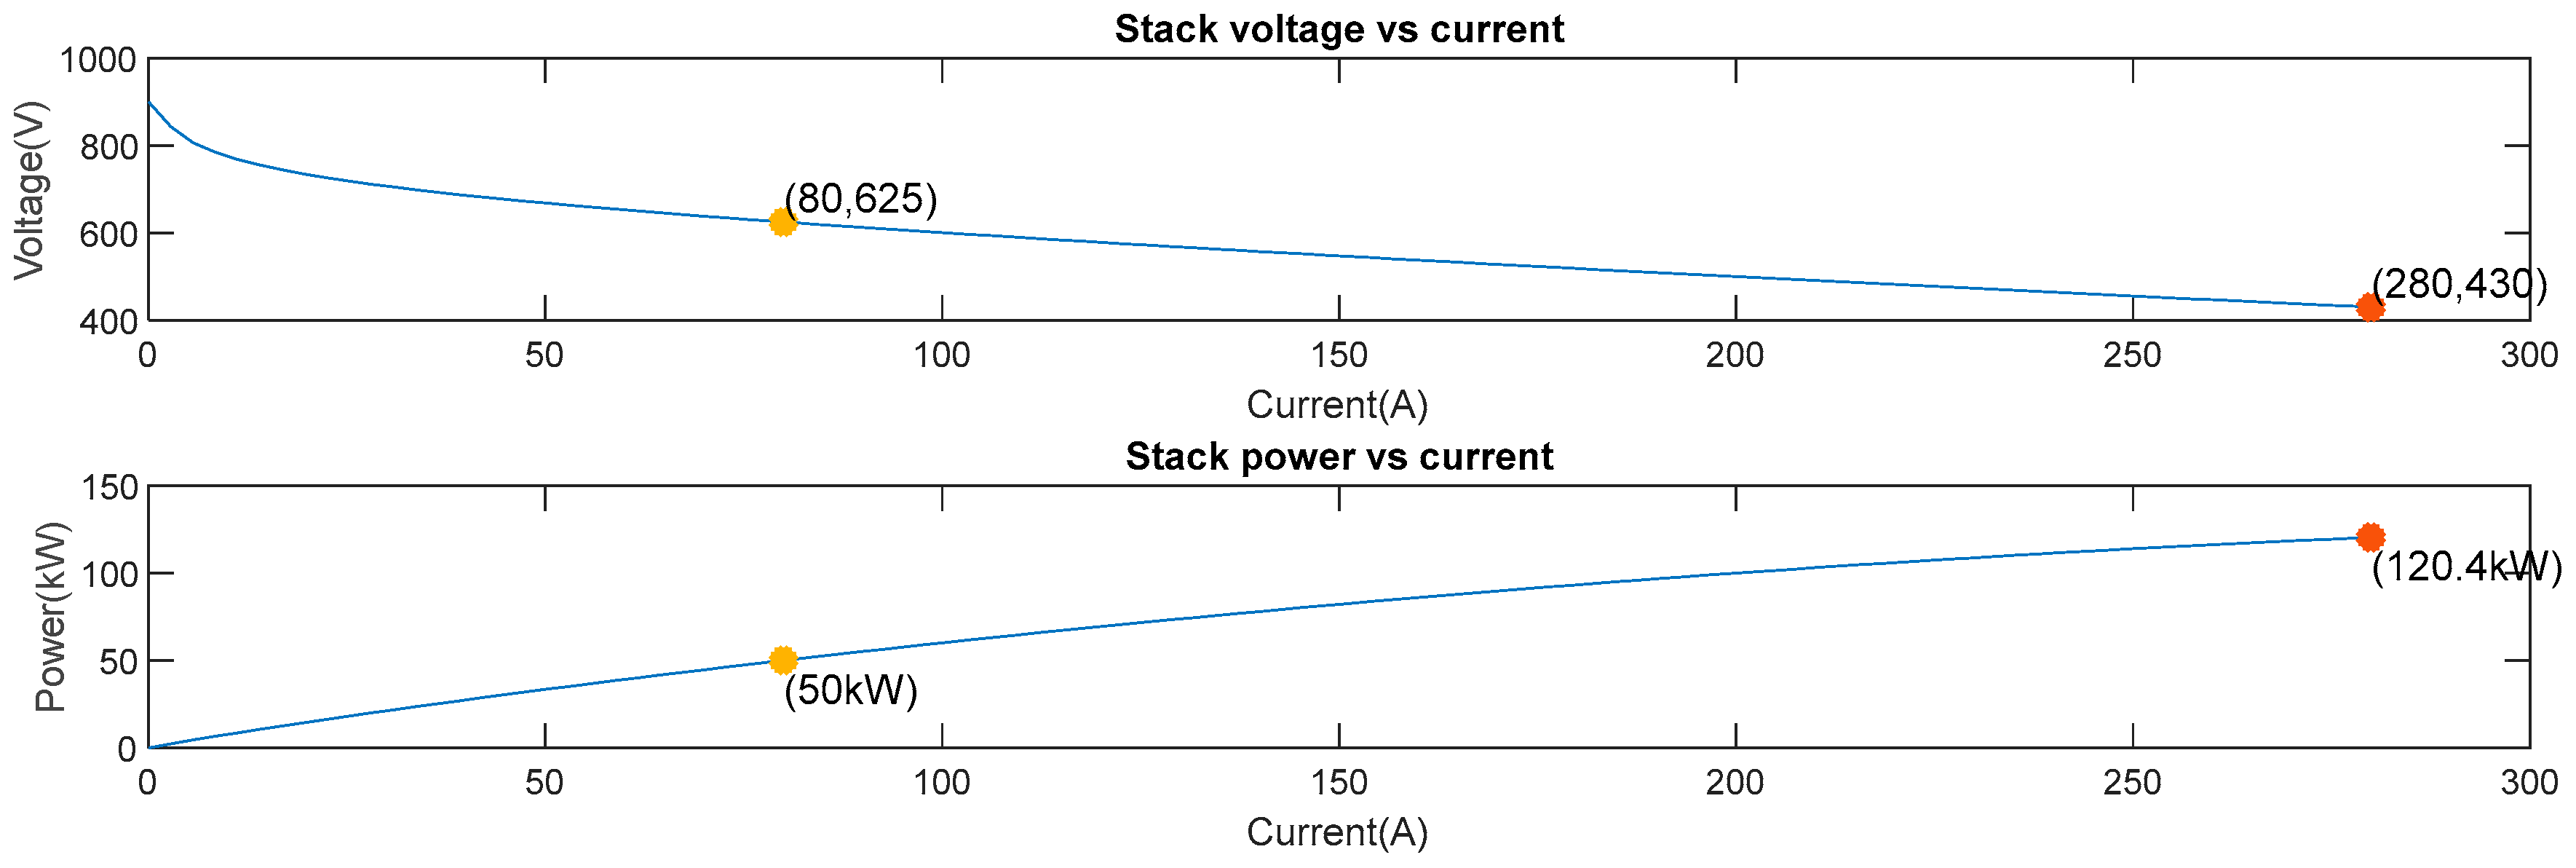
2.1. PEMFC Characteristics

The FC model adopted in this investigation is a modified version of the approach proposed by [17], whereby the dynamics of the reactant flow are negligible.
The voltage resulting from the electro-chemical reactions is expressed by the Nernst equation as [33]:
E n = 1.229 + ( T 298 ) . 44.43 2 F + RT 2 F ln ( P H 2 P O 2 1 2 )
where P H 2 and P O 2 are the hydrogen and oxygen partial pressures, respectively, T is the temperature, F is the Faraday constant and R is the ideal gas constant.
The partial pressures are defined as function of reactant utilisation by the equations [33]:
P H 2 = ( 1 U f H 2 ) x % P fuel
P O 2 = ( 1 U f O 2 ) y % P air
where U fH 2 and U fO 2 are the hydrogen and oxygen utilisation, respectively, P fuel and P air are the supply pressures of the hydrogen and oxygen, respectively, and x and y are the percentages of hydrogen and oxygen compositions.
The rates of reactant utilisation are given as follows [34]:
U f H 2 = 60000 RTi fc 2 FP hydr V hydr x %
U f O 2 = 60000 RTi fc 4 FP oxyg V oxyg y %
where V hydr and V oxyg are the hydrogen and oxygen flow rates, i fc is the cell current.
The lack of oxygen in the cell leads to the increase of its utilisation over the nominal value; hence, Equation (4) is adjusted as [34]:
E n = 1.229 + ( T 298 ) . 44.43 2 F + RT 2 F ln ( P H 2 P O 2 1 2 ) K u ( U f O 2 U f O 2 nom )
where K u is the voltage undershoot constant and U f O 2 nom is defined as the nomination oxygen utilisation.
The open circuit voltage of a single cell is given by Equation (9) as follows:
E O = K C E n
where K C is the voltage constant.
Taking into consideration losses, including the activation losses and resistive and diffusion losses, the open circuit voltage of a single cell is expressed as:
V = E O V act V r
where
V act = Aln ( i fc i o ) . 1 S T d 3 + 1
V r = r ohm . i fc
where T d is the cell settling time to a current step and r ohm is the cell resistance,
A = RT 2 α F
and i o is given as [33]:
i o = 2 Fk ( P H 2 + P O 2 ) Rh . exp ( G RT )
where α is the charge transfer coefficient, G is the activation energy barrier, k is the Boltzmann constant and h is the Plank constant.
The complete PEMFC stack voltage is given as follows:
V fc = N . V
where N is the number of cells in the stack.
The polarisation curve of the PEMFC used in this study is shown in Figure 2 and is based on Equations (4) to (16) using parameters in Table 1.

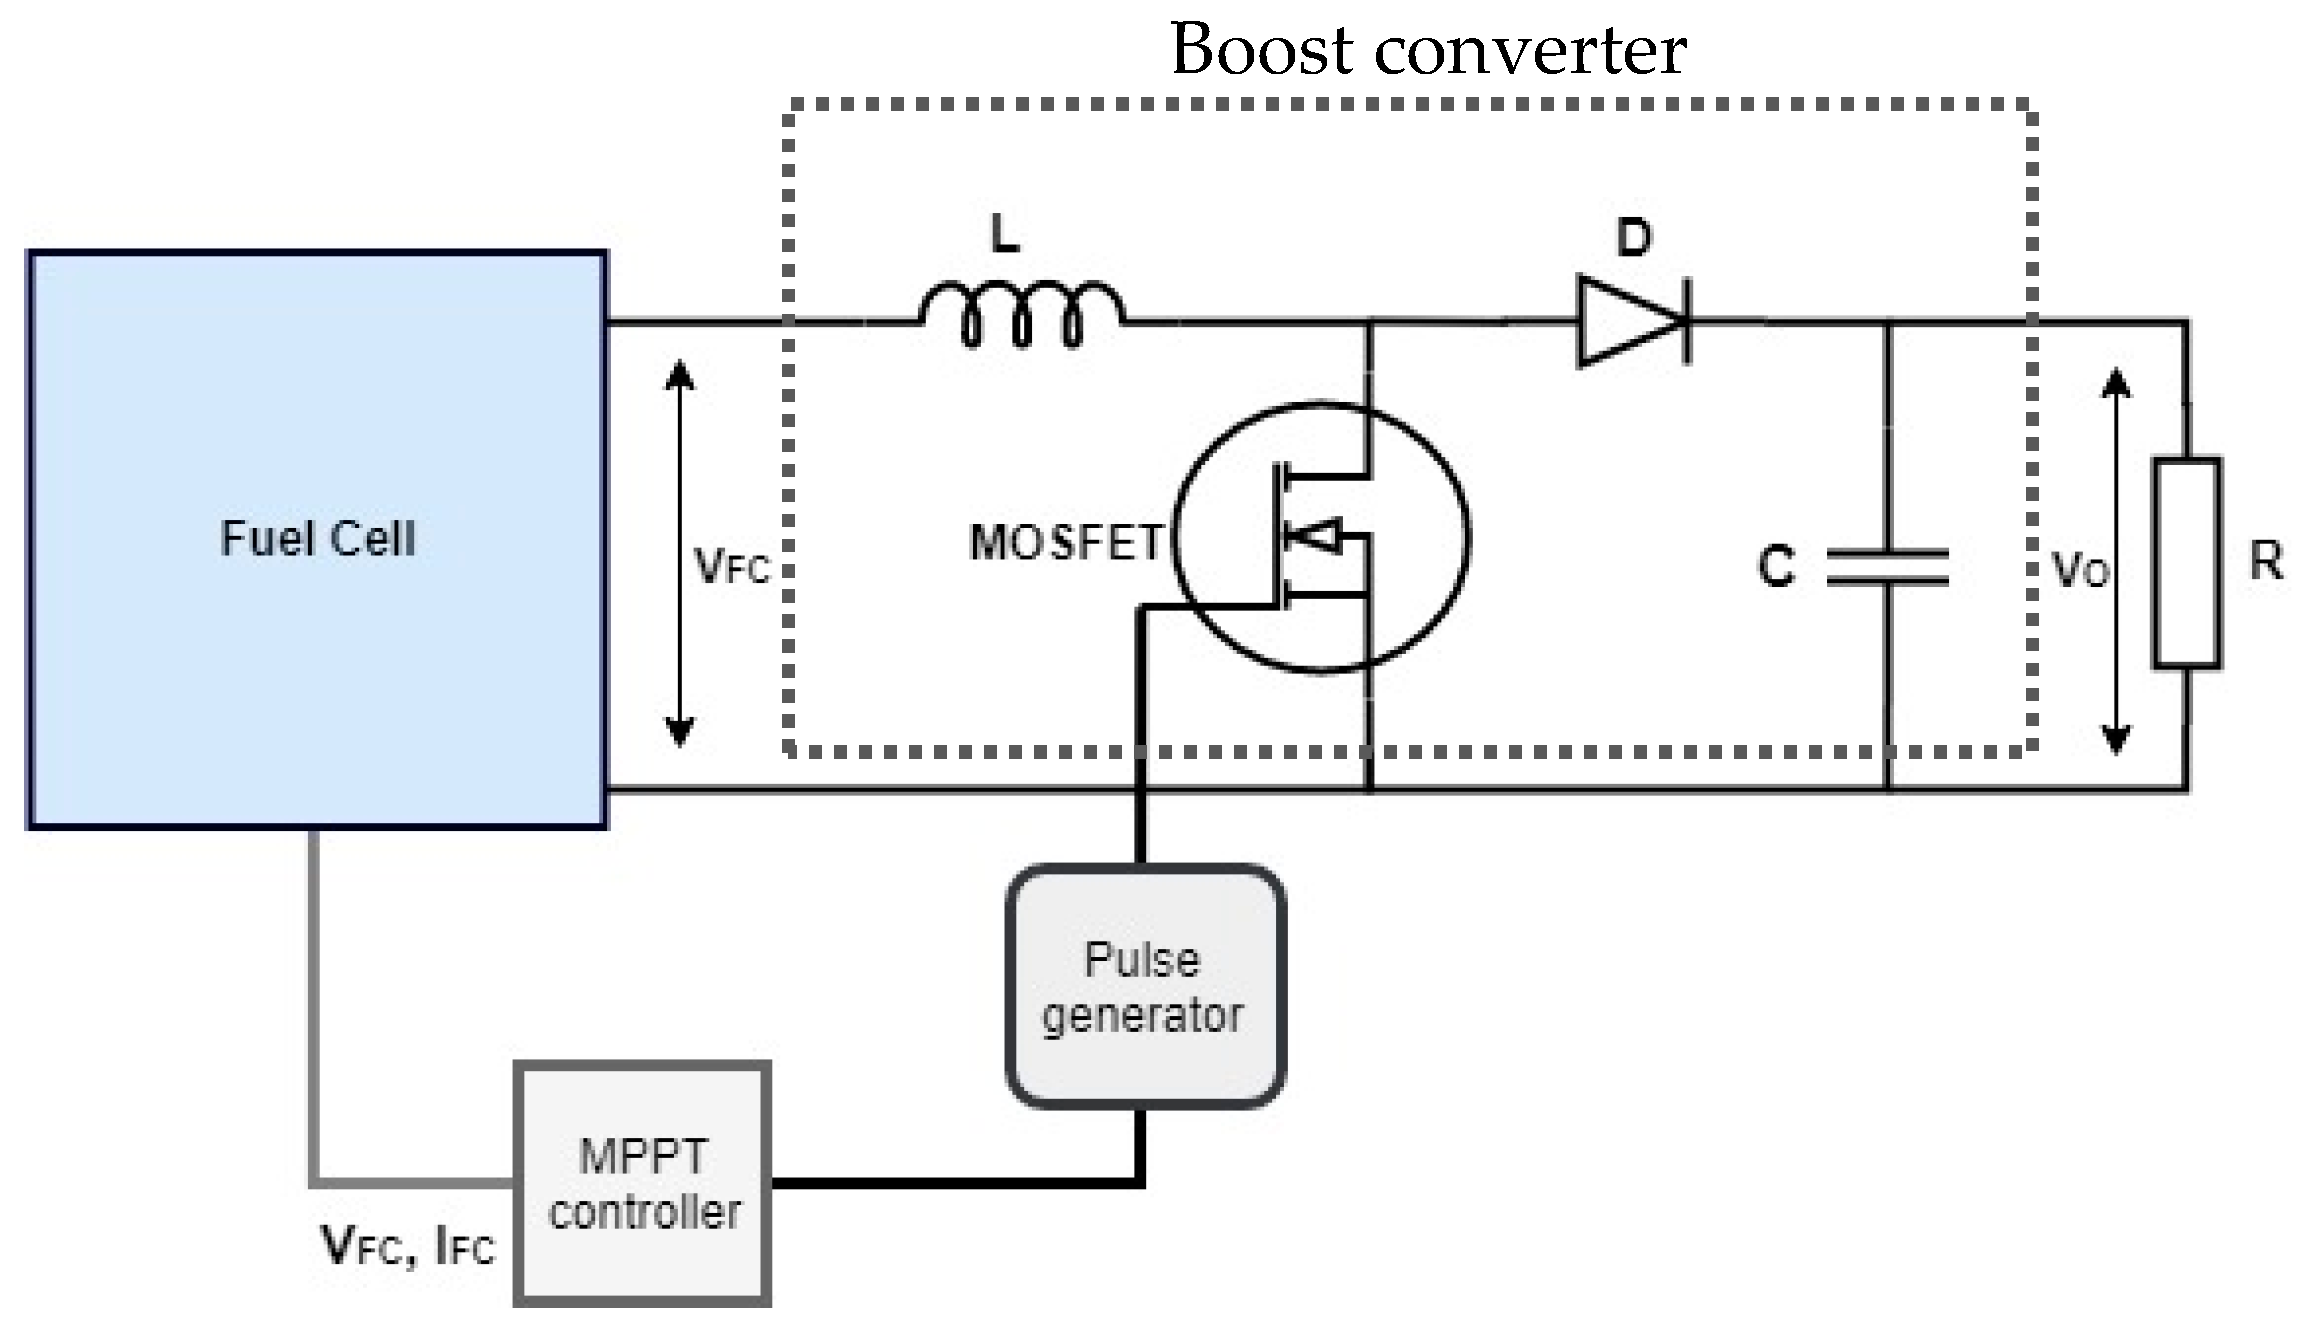
2.2. DC-to-DC Converter

In this study, a boost converter functioning at a switching frequency of 30 kHz is designed to step-up a 625 V DC voltage of the fuel cell to 1.2 kV. A boost converter (see Figure 1) transforms an unregulated voltage to a required voltage by readjusting the duty cycle at a high switching frequency. The choice of components such as the inductor and capacitor is crucial to decrease the ripple generation depending on the switching frequency. In a continuous conduction mode, a boost converter operates with inductance greater than the critical inductance, LC defined as:
L C = ( 1 D ) 2 . D . R 2 . f
where
D = V O V FC V O
where f is the switching frequency and R is the load.
To hinder high ripple voltage, a boost converter requires a filter capacitor as the current supplied to the RC circuit is discontinuous. Whenever the diode is turned off, the capacitor supplies the output current. Thus, the capacitor must be higher than a certain value. The minimum value of the capacitor C Min is expressed as:
C Min = V O . D V O . f . R
where V O is the ripple voltage.
The boost converter parameters as calculated using Equations (17)–(19) are given in Table 2.

3. Maximum Power Point Tracking Controllers Design

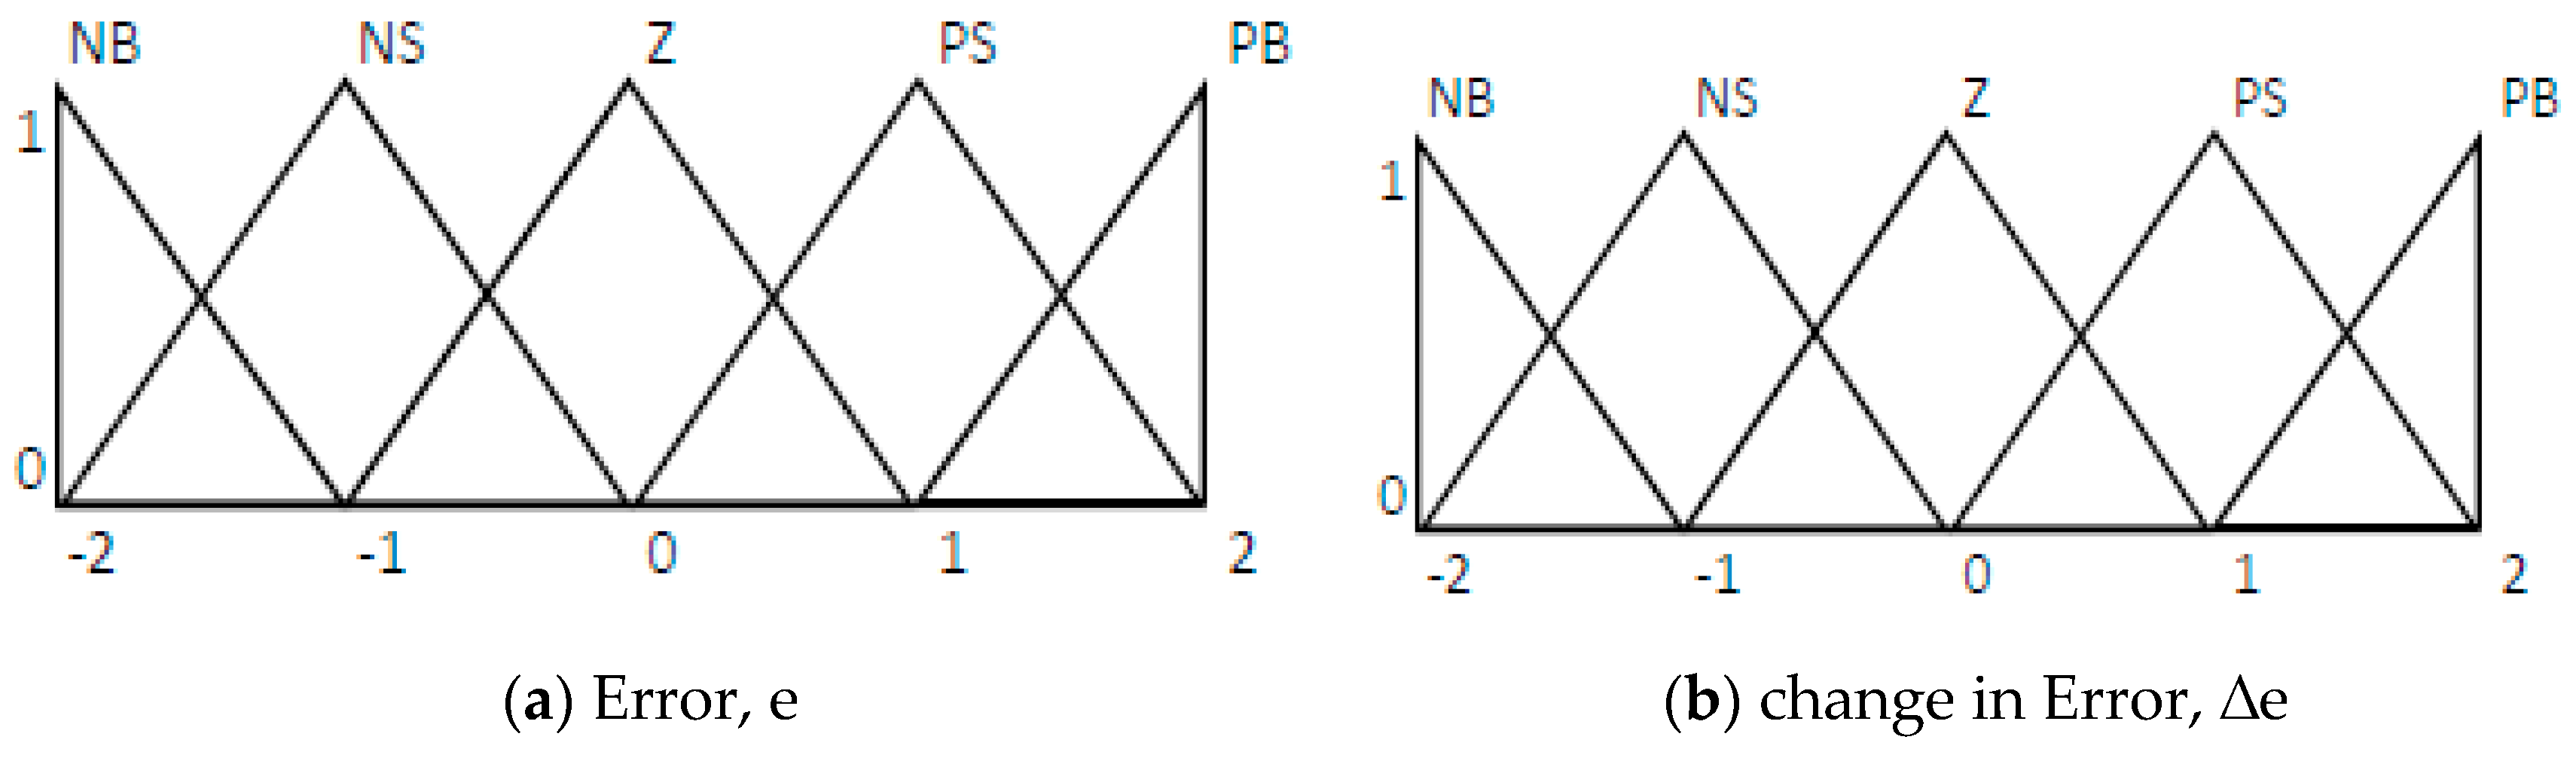
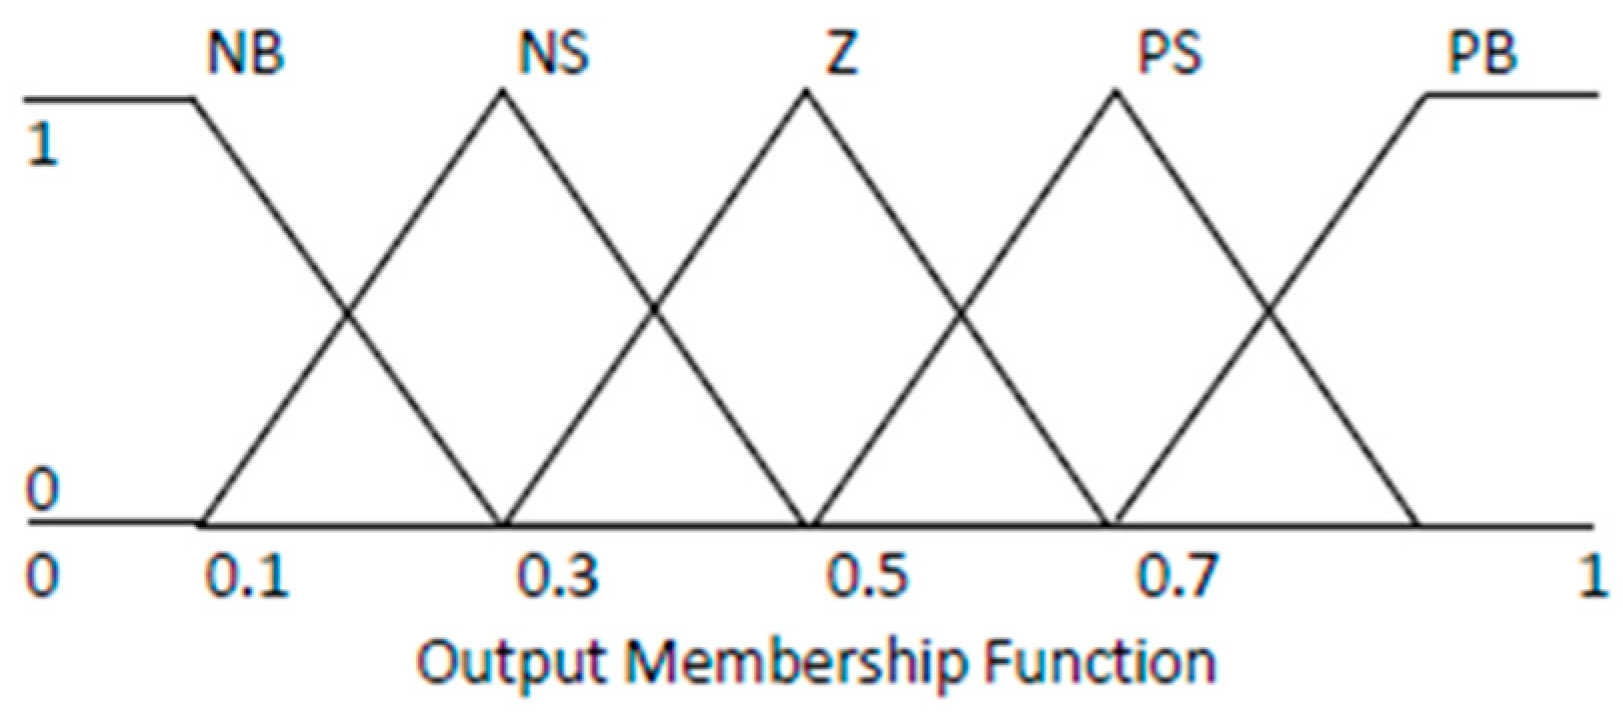
3.1. Mamdani Fuzzy Inference MPPT Controller Design

Fuzzy Inference Systems are based on two methods: the Mamdani Fuzzy Inference technique [21,35,36,37,38,39,40] and the Takagi–Sugeno–Kang Inference method [35,36,38,39,41,42,43,44,45,46,47,48]. The major difference between them lies in the consequent fuzzy rules and defuzzification procedures; the Mamdani Inference method uses fuzzy sets as rule consequent, while Sugeno Inference considers linear functions of input variables. In the Mamdani approach, the crisp output of the fuzzy system y crisp is determined using the “Centre of Gravity” defuzzification by supposing that the consequent fuzzy set of Rule i is Q i , characterised by membership u Q i and by defining the centre of areas of u Q i to be the point q i in the universe. Equation (20) gives the crisp output of the Mamdani method [40]:
y crisp = i = 1 R q i u Q i i = 1 R u Q i .
For MPPT controller design, two inputs are required, namely the error e and the change in error Δe. The error is expressed as:
e ( k ) = p ( k ) p ( k 1 ) v ( k ) v ( k 1 )
where p ( k ) , p ( k 1 ) , v ( k ) and v ( k 1 ) are the powers and voltages at instants k and k 1 respectively.
The change in error Δek is given as follows:
e k = e k e k 1
where e k and e k 1 are the error at instants k and k 1.
The proposed Mamdani Fuzzy Inference System MPPT controller uses two inputs, as shown in Figure 3. Each input consists of five triangular membership functions with a normalised universe of discourse ranging from −2 to 2. These inputs are the error and the change in error as expressed in Equations (21) and (22). They include five variables, namely negative big (NB), negative small (NS), zero (Z), positive small (PS) and positive big (PB).
The output of the Mamdani Inference Engine consisted of five membership functions (two trapezoidal and three triangular membership functions), namely negative big (NB), negative small (NS), zero (Z), positive small (PS) and positive big (PB) (see Figure 4). The universe of discourse ranged from 0 to 1.
The rules are designed based on the provided inputs and Table 3 shows the relationship between the inputs and output.

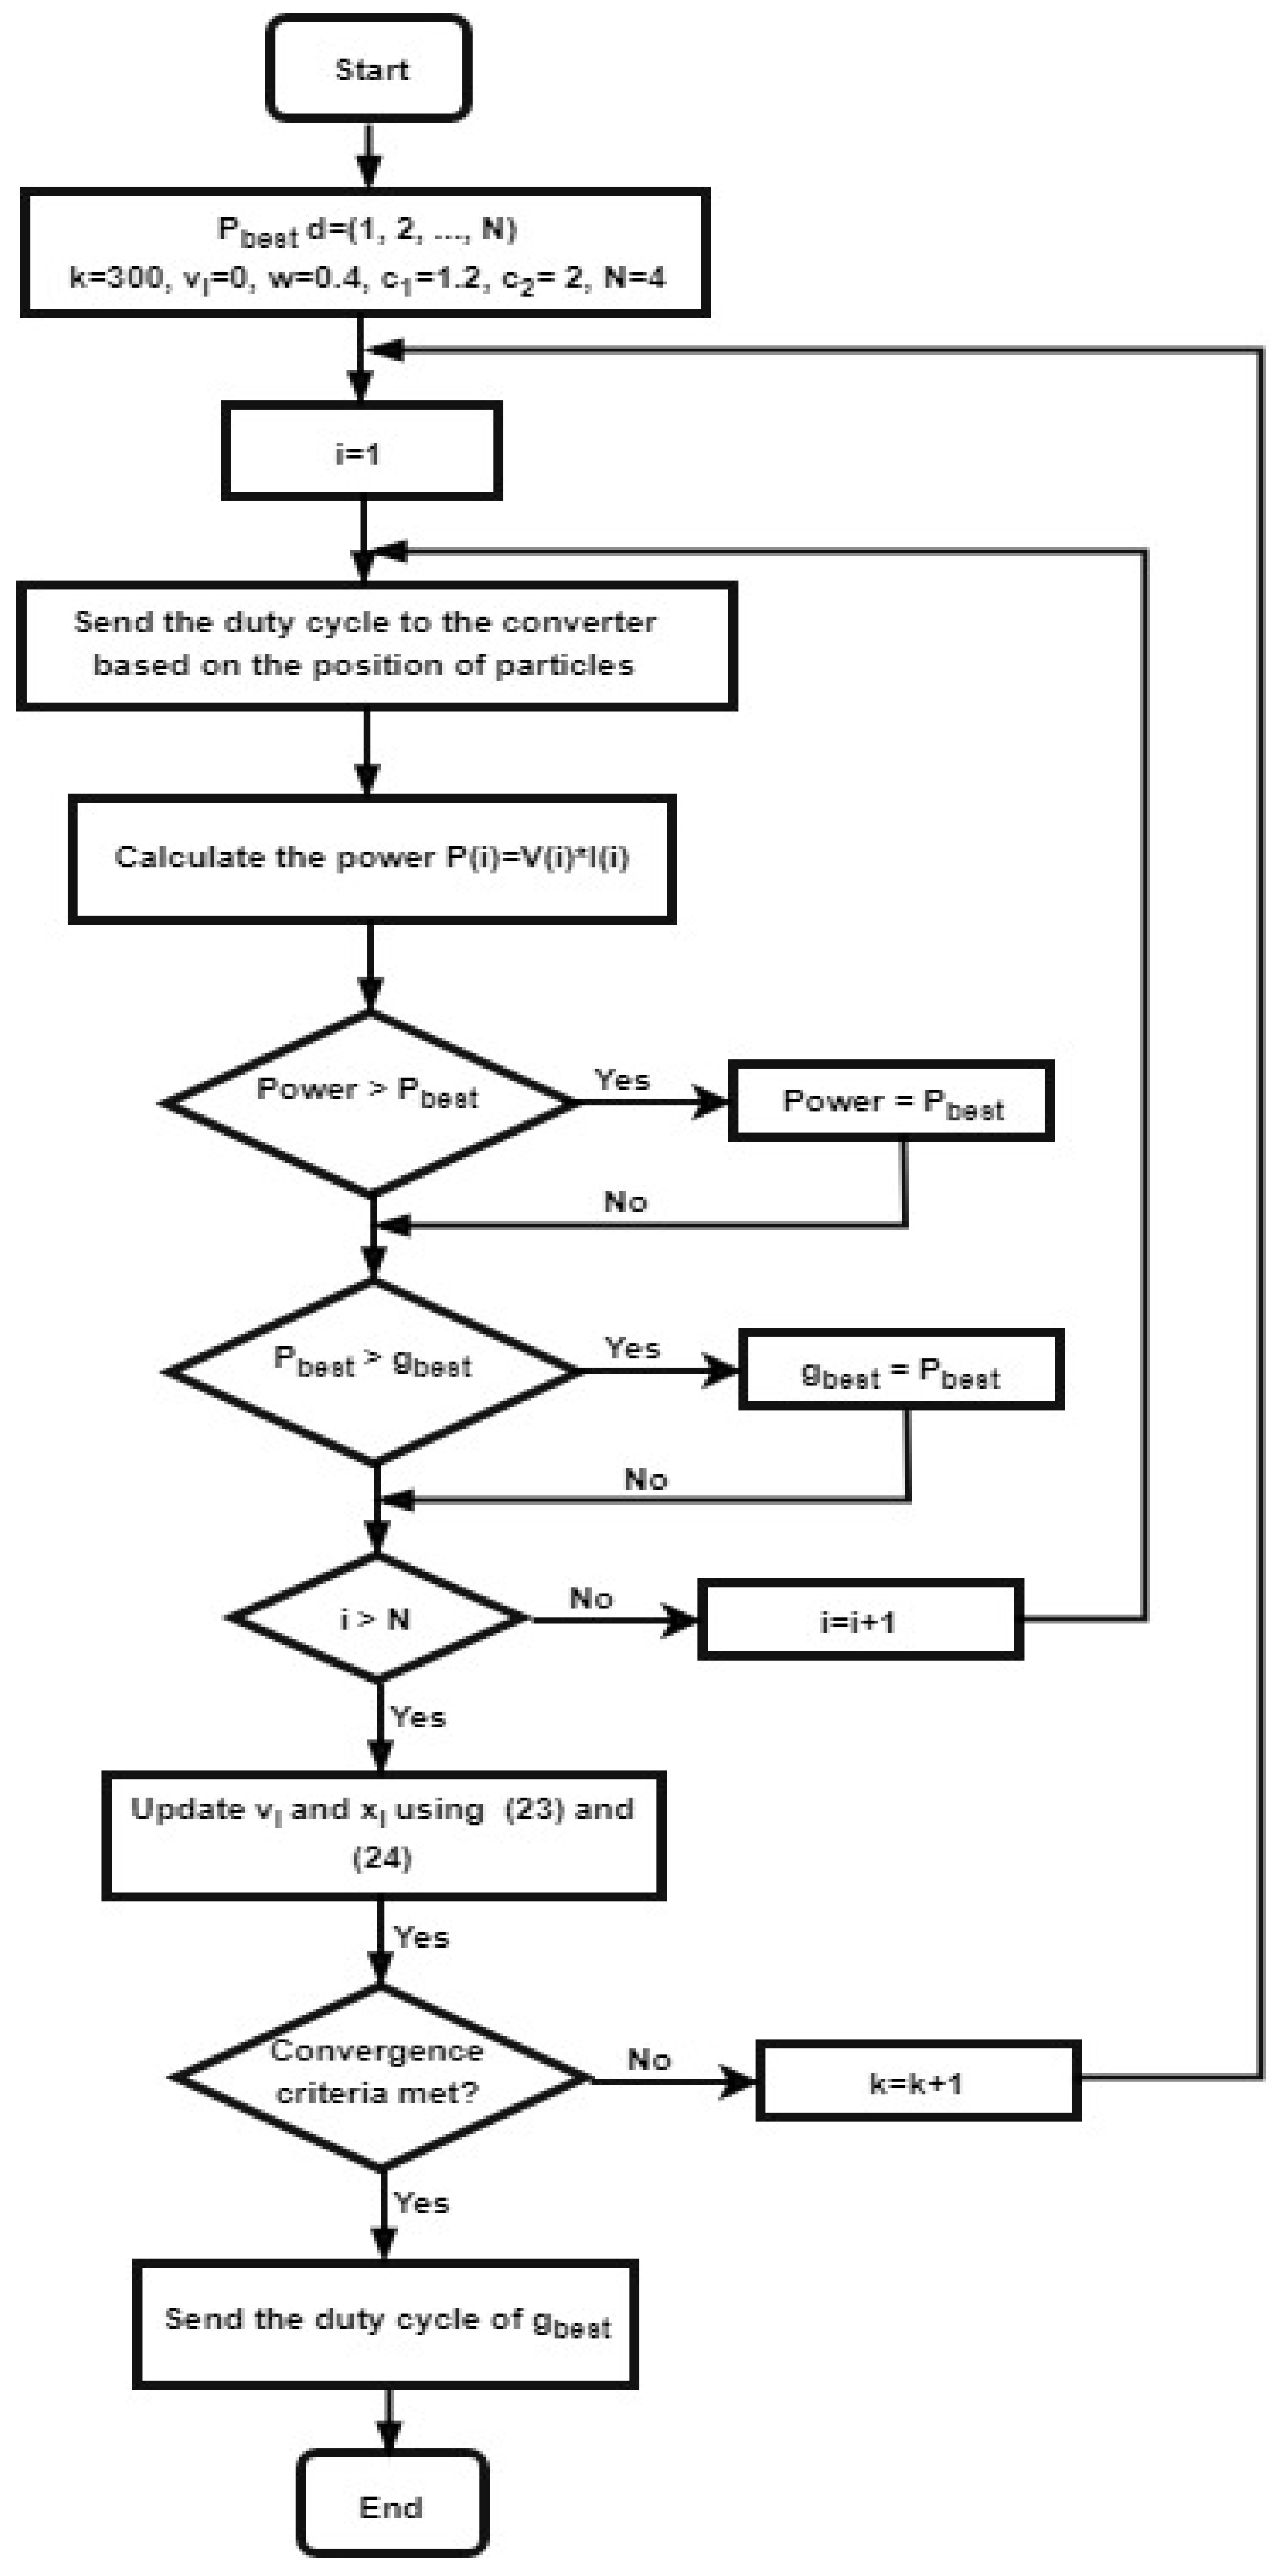
3.2. Particle Swarm Optimisation MPPT Controller Design

Particle Swarm Optimisation (PSO) is one of the most current nature-inspired optimisation algorithms, and was developed by James Kennedy and Russell Eberhart in 1995 [49,50]. Lately, PSO has arisen as a promising algorithm in solving many optimisation problems in science and engineering. For MPPT applications, the PSO method is easy to implement, exhibits fast computation capabilities and allows the determination of the MPP regardless of environmental conditions [26]. The method is based on the behaviour of bird flocks; a number of collaborative particles are used in an n dimensional space and each particle has a position pi (distributed randomly) and velocity vi (vi = 0 in initiation). The position of a particle is determined by the best position found by the particle so far Pbest, and the best position of all particles so far Gbest. The equations defining the standard PSO approach are as follows:
v i ( k + 1 ) = wv i ( k ) + c 1 r 1 ( P best x i ( k ) ) + c 2 r 2 ( G best x i ( k )
x i ( k + 1 ) = x i ( k ) + v i ( k + 1 )
i = 1 ,   2 ,   3 , ,   N
where xi and vi are the velocity and position of a particle i, respectively, w represents the inertia weight, k is the iteration number. r1 and r2 are random variables uniformly distributed in the range of [0,1], Pbest is the best position of particle i, Gbest is the best position of all the particles in the swarm and c1 and c2 are the cognitive and social coefficients, respectively.
The operational procedure of a PSO algorithm involves the following five steps:
  • The first step consists of randomly initialising the particles in the same distribution either over the search space or on grid nodes covering the search space in equidistant points.
  • The second step concerns the evaluation of the fitness of particles one by one, by giving the possible solution to the objective function.
  • In the third step, individual and global best fitness values (Pbest and Gbest) are updated through the comparison of their previous values against the newly calculated and the replacement of Pbest and Gbest including their corresponding positions.
  • The fourth step involves the update of the velocity and position of particles one by one in the swarm using Equations (23) and (24).
  • The last step consists of verifying if the convergence criterion is satisfied in order to end the process or to increase the number of iteration by 1 and move to step 2.
The PSO MPPT controller used in this study is based on the flowchart depicted in Figure 5.

4. Simulation and Results

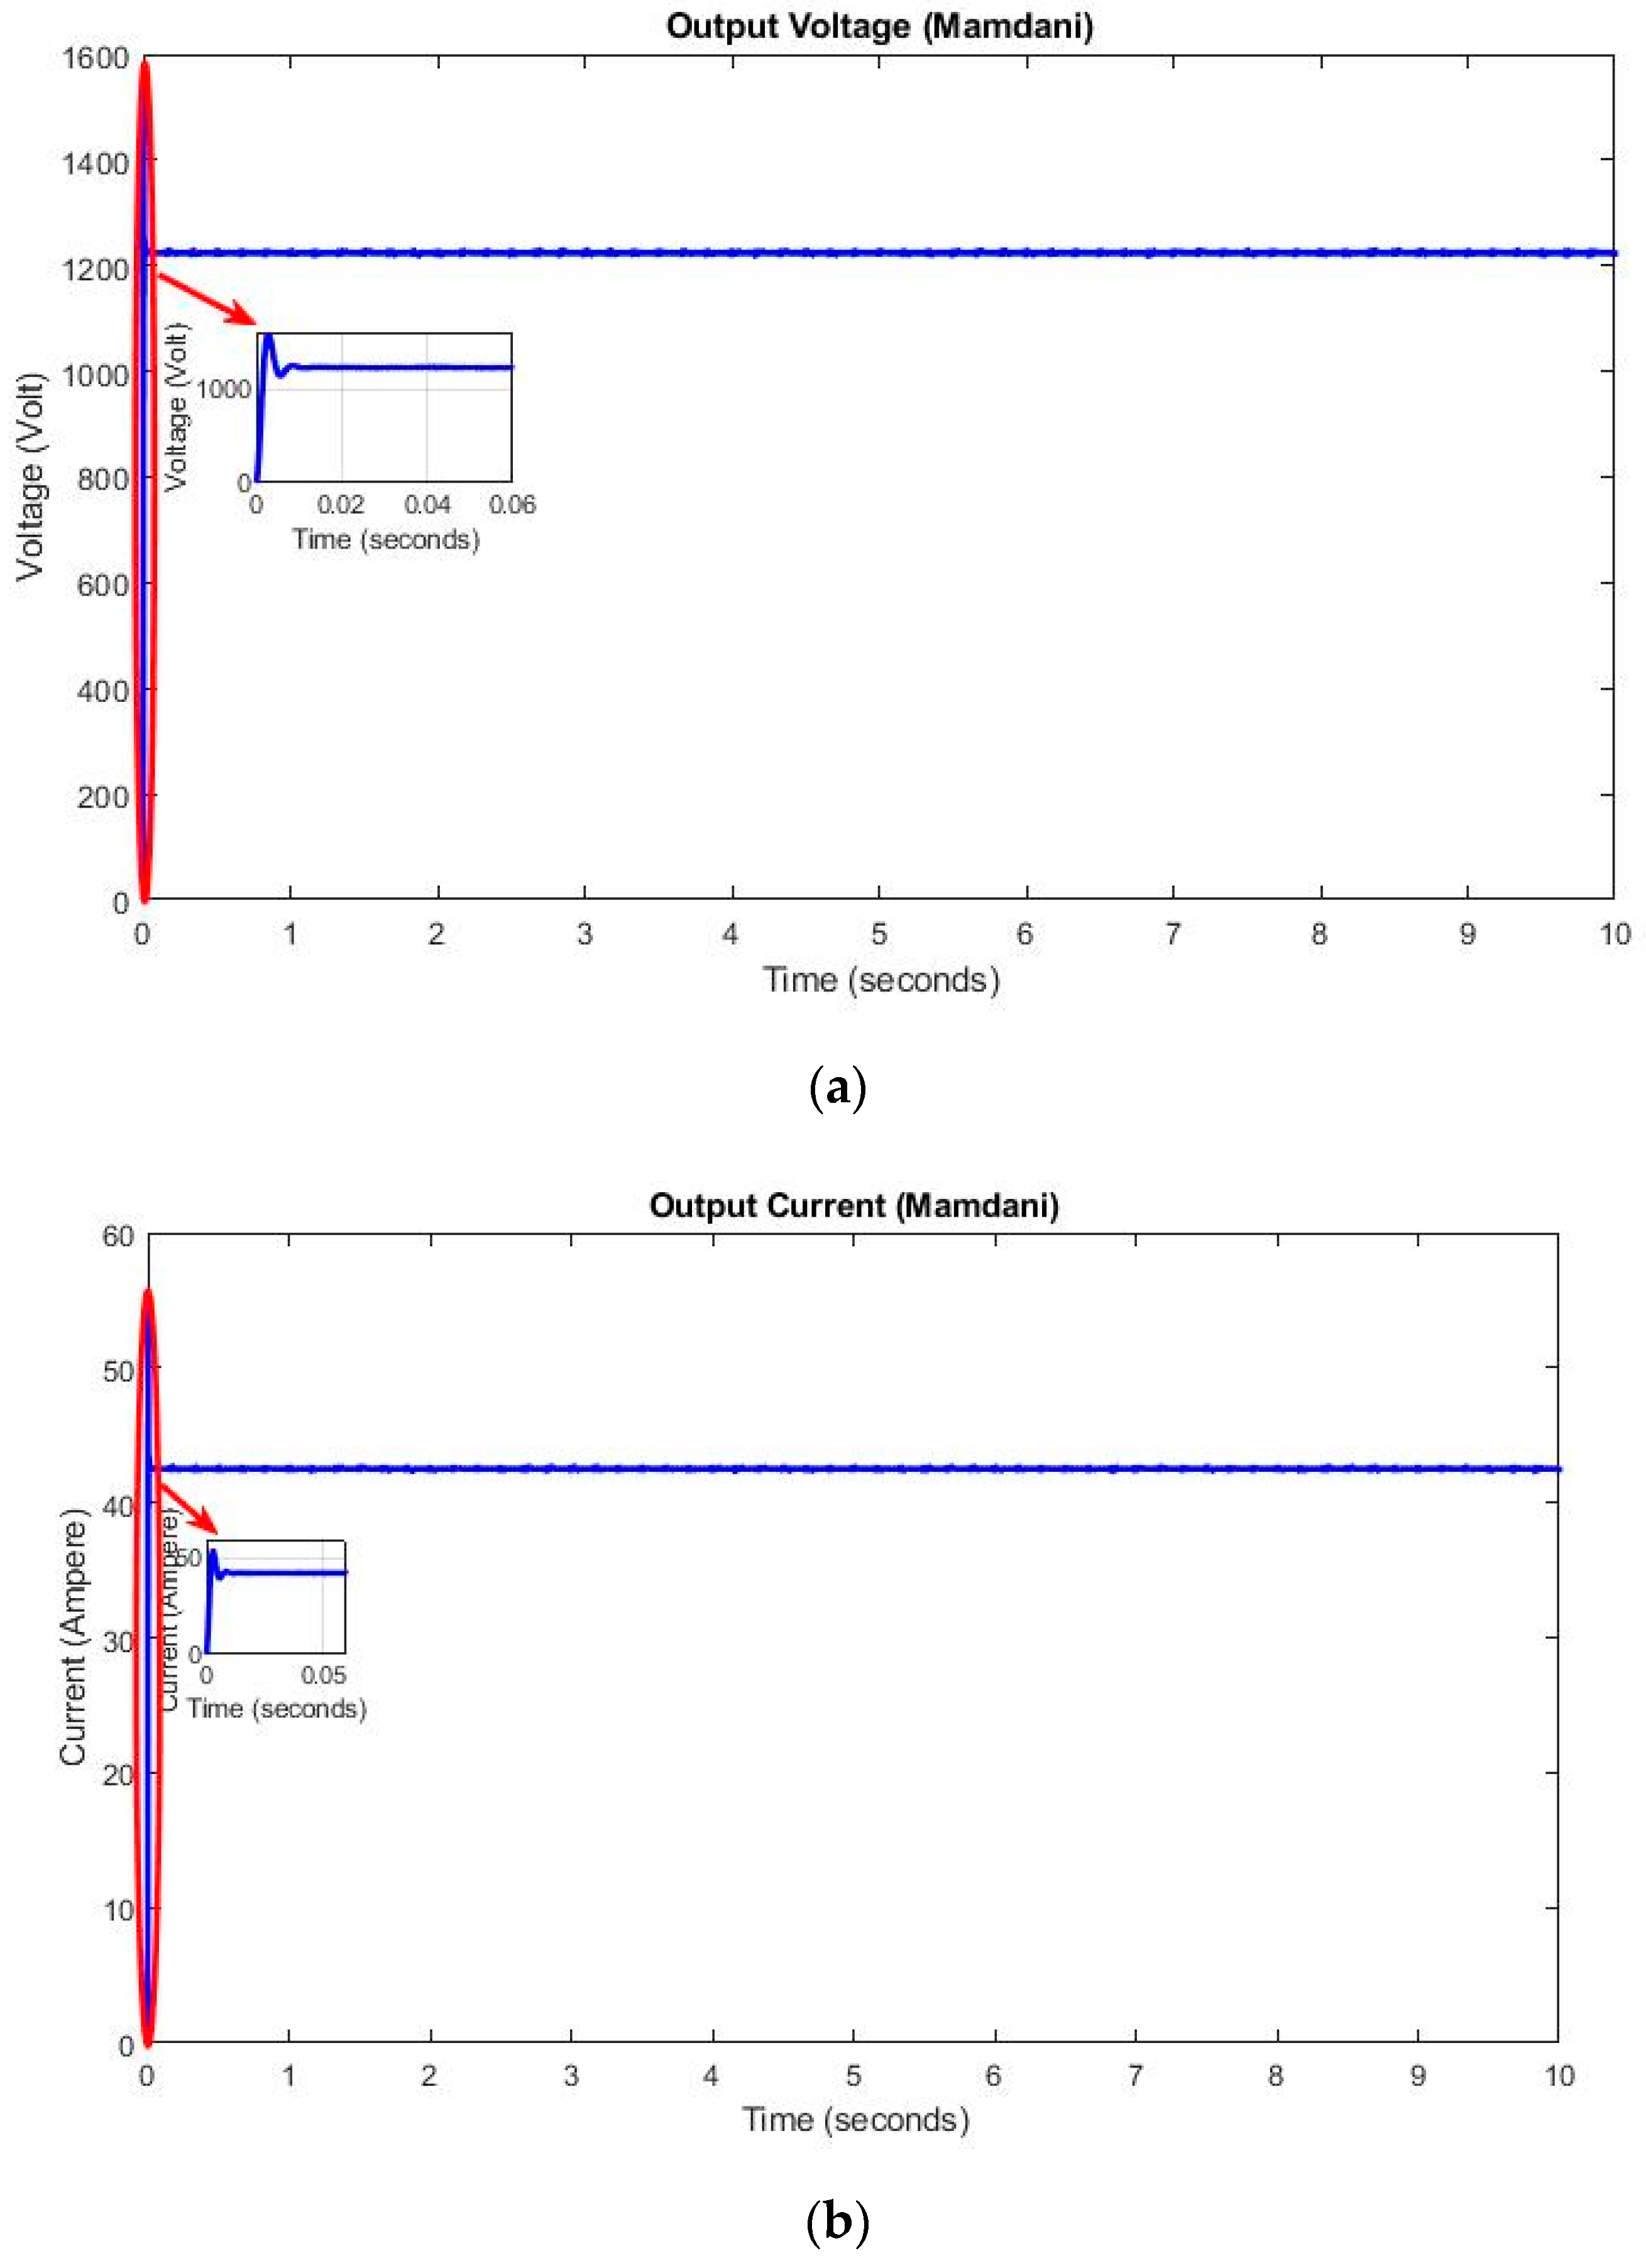
4.1. Results Using the Mamdani MPPT Controller

A simulation of the system shown in Figure 1 was carried out under a Matlab/Simulink environment for a duration of 10 s using an MPPT controller based on the Mamdani Fuzzy Inference Engine to evaluate the response characteristics of the current, voltage and power curves. Figure 6 depicts the corresponding results.
The output voltage of the system at the load side was about 1.214 kV, as shown in Figure 6a. The fuel cell hydrogen flow rate, hydrogen pressure and temperature were unchanged, and the operating voltage was at a constant value. It had a rising time of about 1.172 ms, which corresponded to the time required for the voltage to rise from 0 to 100% of its final value. In addition, the overshoot and undershoot were 29.221% and 5.816%, respectively. These percentages of undershoot and overshoot show the appearance of the signal exceeding 1.214 kV and the occurrence of the signal below 1.214 kV, respectively. The settling time of the voltage signal was 8.072 ms.
The output current at the terminals of the converter is shown in Figure 6b and had a value of about 42.17 A. It had a rising time of about 1.172 ms, and an overshoot and undershoot of 29.221% and 5.816%, respectively. In the same vein, the power at the terminals of the converter is displayed in Figure 6c, and corresponds to 51.83 kW. Its rising time was 896.288 µs, with an overshoot and undershoot of 65.833% and 1.121%, respectively. Its settling time, which refers to the time needed for the power curve to reach and stay within its final value by the absolute percentage of 2% or 5%, was 10.53 ms.
Moreover, the tracking efficiency, which was an important parameter to assess the accuracy of the MPPT algorithm, was determined as 97.79% of the fuel cell designed power using the equation:
η ( % ) = P MPPT P MPP × 100
where P MPPT expresses the output power of the implemented MPPT controller (51.83 kW) and P MPP is the maximum power of the fuel cell stack (53 kW).

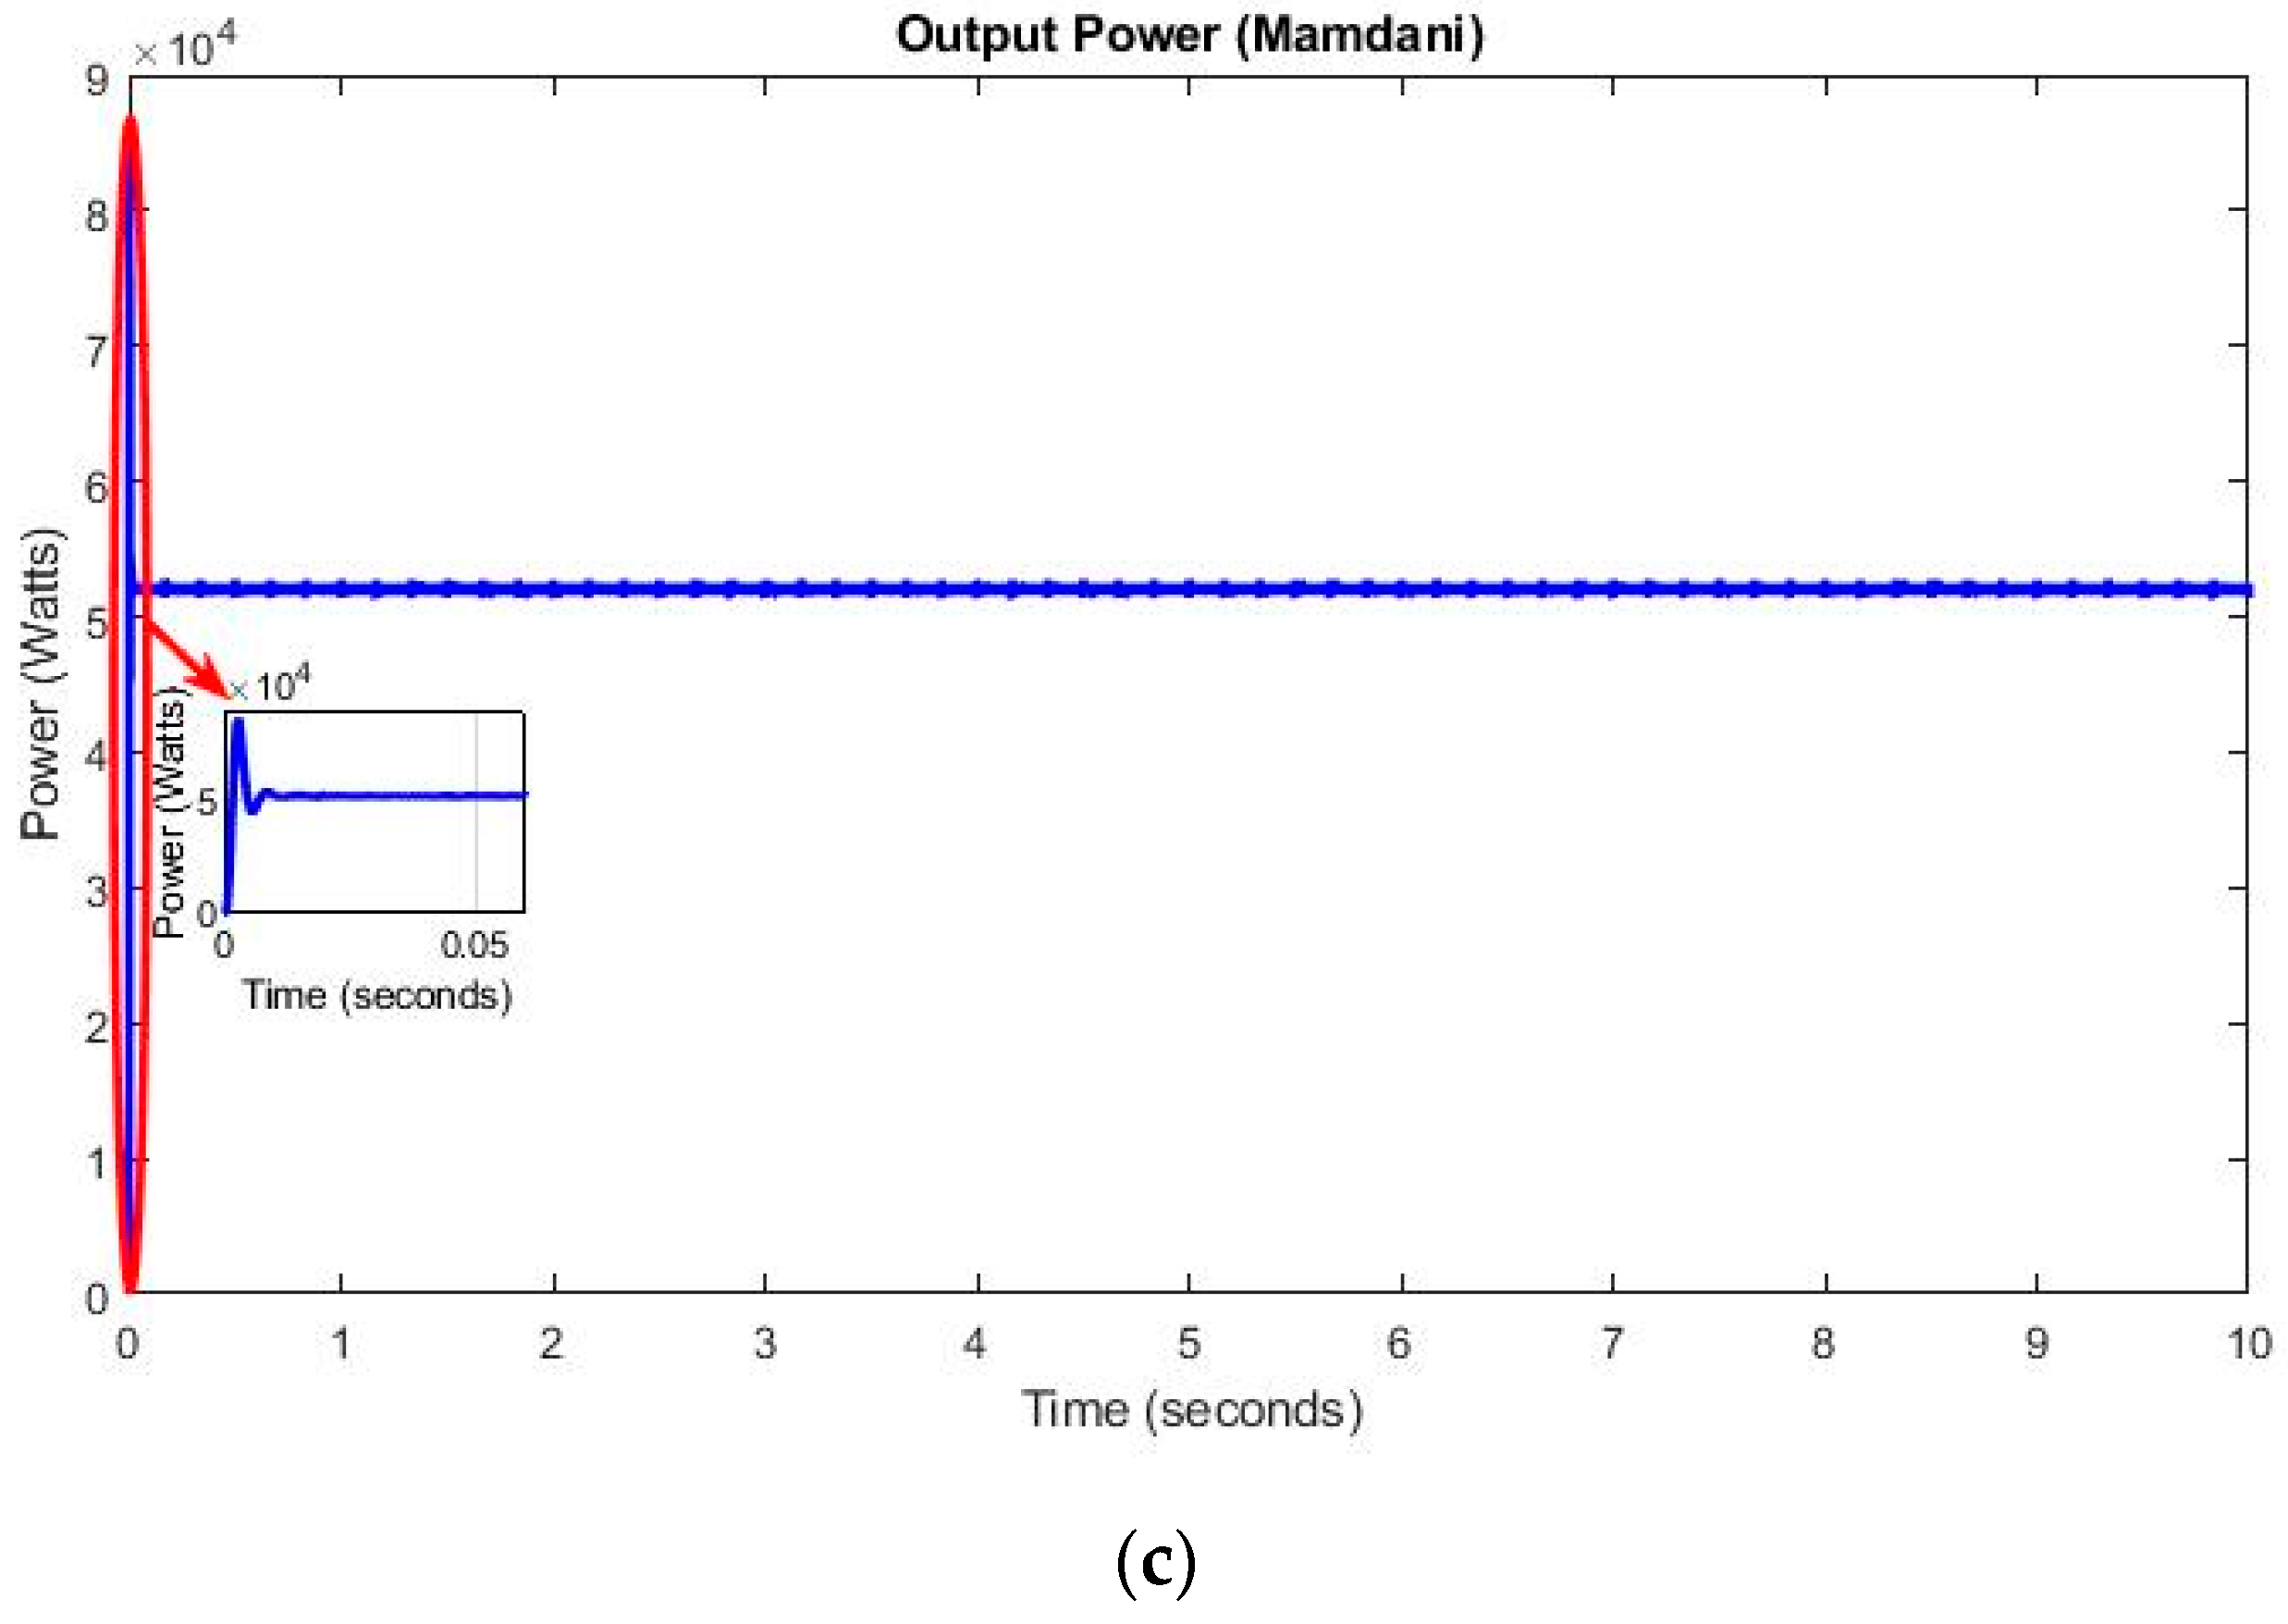
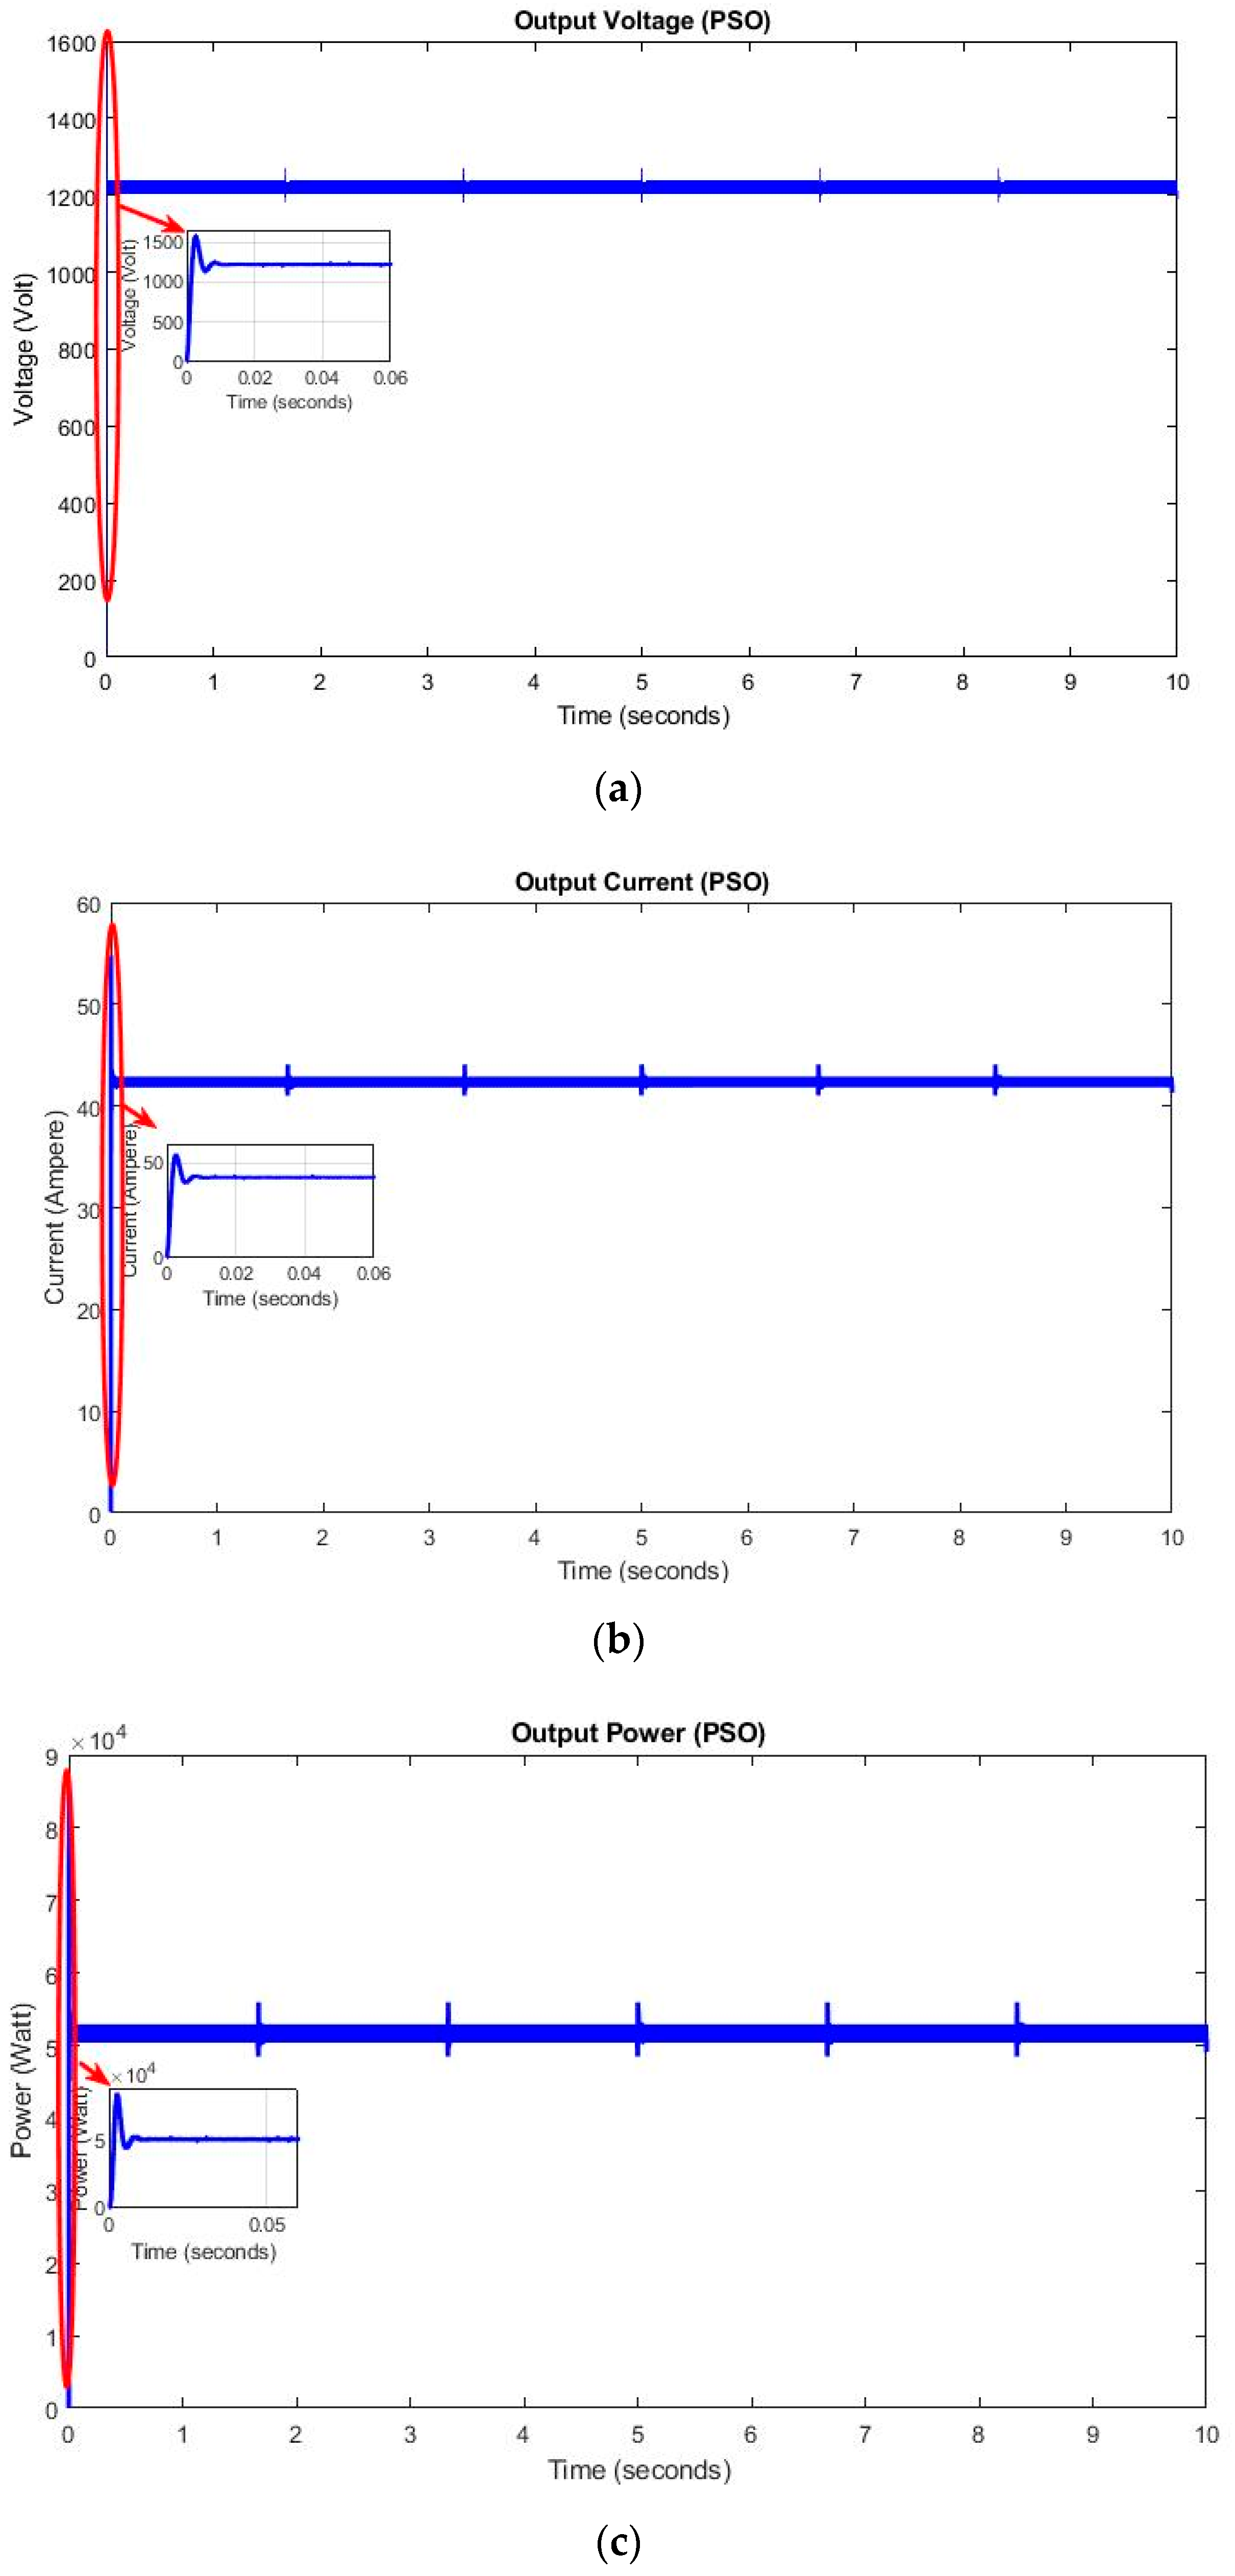
4.2. Results Using the PSO MPPT Controller

The system shown in Figure 1 was simulated under a Matlab/Simulink environment for a duration of 10 s using an MPPT controller based on the Particle Swarm Optimisation approach to analyse the response characteristics of the current, voltage and power curves. The curves resulting from the simulation are shown in Figure 7.
The output voltage at the terminals of the converter was 1.228 kV (see Figure 7a). The fuel cell hydrogen flow rate, hydrogen pressure and temperature were unchanged, and this voltage was constant throughout the simulation. The voltage had a rising time of about 1.177 ms. In addition, the overshoot and undershoot were 27.564% and 7.925%, respectively. The time that this voltage required to reach and stay within a range of its final value was 19.981 ms.
Similarly, the output current of this system is shown in Figure 7b and had a value of about 42.66 A, it has a rising time of about 1.177 ms, and an overshoot and undershoot of 27.564% and 7.925%, respectively. The settling time corresponding to the output current was 19.981 ms. In the same vein, the power at the terminals of the converter is displayed in Figure 7c, and was around 52.68 kW. Its rising time was 834.688 μs, with an overshoot and undershoot of 63.115% and 3.736%, and a settling time of 20.009 ms.
The tracking efficiency of the PSO algorithm was calculated as 99.39% of the fuel cell maximum power (53 kW) using Equation (25).

5. Discussion

When comparing both controllers with respect to the simulation processing time, it was observed that the Mamdani MPPT controller required more time compared to the controller based on the PSO algorithm. Thus, the PSO controller reached the MPP faster than the Mamdani controller did. Table 4 shows the response characteristic parameters of both controllers; the PSO MPPT controller displayed better tracking efficiency compared to the Mamdani MPPT controller. Additionally, the rise time of the PSO controller was slightly shorter than the Mamdani controller. Furthermore, the overshoot of the PSO controller was about 2% lower than the Mamdani Controller. However, the voltage, current and power curves obtained from the PSO controller show some short sporadic and undesirable oscillations (see Figure 7).
Even though the Mamdani controller was less accurate in terms of the tracking efficiency, it showed better dynamic response in the settling time and undershoot, as the values obtained were lower than those proposed by the PSO controller. The voltage, current and power curves resulting from this controller presented no oscillation.

6. Conclusions

The negative environmental impact and the rapidly declining reserve of fossil fuel-based energy sources for electricity generation is a big challenge to finding sustainable alternatives. This scenario is complicated with the ever-increasing world population growth demanding a higher standard of living. A fuel cell system is able to generate high-grade electricity and water with higher energy efficiency while producing near-zero emissions.
This study compared two Maximum Power Point Tracking approaches; one based on the Mamdani Fuzzy Inference System and another on the Particle Swarm Optimisation algorithm to constrain a fuel cell stack to deliver its maximum power. The main objective was to analyse the response characteristics of both MPPT controllers. The investigation was conducted on a 53 kW Proton Exchange Membrane Fuel Cell coupled to a DC-to-DC converter delivering 1.2 kV from 625 V and a DC load. The results showed that the MPPT controller based on the PSO algorithm presented better tracking efficiency as compared to the Mamdani controller. Furthermore, the rise time of the PSO controller was slightly shorter than that of the Mamdani controller, and the overshoot of the PSO controller was 2% lower than that of the Mamdani controller. However, the voltage, current and power curves obtained from the PSO controller presented some short sporadic and undesirable oscillations. On the other hand, the Mamdani controller showed better performances in the settling time and undershoot.

Author Contributions

Conceptualization, D.N.L. and A.K.R.; Methodology, D.N.L. and A.K.R.; Software, D.N.L.; Validation, D.N.L.; Formal Analysis, D.N.L.; Investigation, D.N.L.; Writing-Original Draft Preparation, D.N.L. and A.K.R.; Writing-Review & Editing, D.N.L. and A.K.R..; Supervision, A.K.R.

Funding

This research received no external funding.

Conflicts of Interest

The authors declare no conflict of interest.

References

  1. Caisheng, W.; Nehrir, M.H.; Shaw, S.R. Dynamic models and model validation for PEM fuel cells using electrical circuits. IEEE Trans. Energy Convers. 2005, 20, 442–451. [Google Scholar] [CrossRef]
  2. Nehrir, M.H.; Caisheng, W.; Shaw, S.R. Fuel cells: Promising devices for distributed generation. IEEE Power Energy Mag. 2006, 4, 47–53. [Google Scholar] [CrossRef]
  3. Larminie, J.; Dicks, A. Fuel Cell Systems Explained, 2nd ed.; John Wiley & Sons Ltd.: Hoboken, NJ, USA, 2003; ISBN 047084857X. [Google Scholar]
  4. Revankar, S.; Majumdar, P. Fuel Cells: Principles, Design and Analysis; CRC Press: Boca Raton, FL, USA, 2014. [Google Scholar]
  5. Luta, D.N.; Raji, A.K. Optimal sizing of hybrid fuel cell-supercapacitor storage system for off-grid renewable applications. Energy 2018, 166, 530–540. [Google Scholar] [CrossRef]
  6. Luta, D.N.; Raji, A.K. Decision-making between a grid extension and a rural renewable off-grid system with hydrogen generation. Int. J. Hydrogen Energy 2018, 43, 1–14. [Google Scholar] [CrossRef]
  7. Luta, D.N.; Raji, A.K. Comparing fuzzy rule-based MPPT techniques for fuel cell stack applications. Energy Procedia 2019, 156, 177–182. [Google Scholar] [CrossRef]
  8. Lucia, U. Overview on fuel cells. Renew. Sustain. Energy Rev. 2014, 30, 164–169. [Google Scholar] [CrossRef]
  9. Luta, D.N.; Raji, A.K. Potential benefits of renewable fuel cell systems for rural communities’ power supply. In Proceedings of the 2nd EAI International Conference for Research, Innovation and Development for Africa, European Alliance for Innovation, Victoria Falls, Zimbabwe, 20–21 June 2017. [Google Scholar]
  10. Das, V.; Padmanaban, S.; Venkitusamy, K.; Selvamuthukumaran, R.; Blaabjerg, F.; Siano, P. Recent advances and challenges of fuel cell based power system architectures and control—A review. Renew. Sustain. Energy Rev. 2017, 73, 10–18. [Google Scholar] [CrossRef]
  11. Raji, A.K.; Kahn, M.T.E. Can Fuel Cell Systems Be Efficient and Effective As Domestic Distributed Generation Units? In Proceedings of the Domestic Use of Energy Conference (DUE), Cape Town, South Africa, 2–5 November 2003. [Google Scholar]
  12. Harrag, A.; Messalti, S. How fuzzy logic can improve PEM fuel cell MPPT performances? Int. J. Hydrogen Energy 2018, 43, 537–550. [Google Scholar] [CrossRef]
  13. Mann, R.F.; Amphlett, J.C.; Hooper, M.A.I.; Jensen, H.M.; Peppley, B.A.; Roberge, P.R. Development and application of a generalised steady-state electrochemical model for a PEM fuel cell. J. Power Sources 2000, 86, 173–180. [Google Scholar] [CrossRef]
  14. Gupta, A.K.; Saxena, R. Review on widely-used MPPT Techniques for PV Applications. In Proceedings of the International Conference on Innovation and Challenges in Cyber Security, Greater Noida, India, 3–5 February 2016; pp. 270–273. [Google Scholar]
  15. Amir, A.; Amir, A.; Selvaraj, J.; Rahim, N.A.; Abusorrah, A.M. Conventional and modified MPPT techniques with direct control and dual scaled adaptive step-size. Sol. Energy 2017, 157, 1017–1031. [Google Scholar] [CrossRef]
  16. Karami, N.; Moubayed, N.; Outbib, R. General review and classification of different MPPT Techniques. Renew. Sustain. Energy Rev. 2017, 68, 1–18. [Google Scholar] [CrossRef]
  17. Aslam, M.; Tariq, A.; Hameed, S.; Bin, M.S. Comparative assessment of maximum power point tracking procedures for photovoltaic systems. Green Energy Environ. 2017, 2, 5–17. [Google Scholar]
  18. Rezk, H.; Eltamaly, A.M. A comprehensive comparison of different MPPT techniques for photovoltaic systems. Sol. Energy 2015, 112, 1–11. [Google Scholar] [CrossRef]
  19. Stosovic, M.A.; Dimitrijevic, M.; Litovski, V. MPPT controller design for a standalone PV system. In Proceedings of the 11th International Conference on Telecommunication in Modern Satellite, Cable and Broadcasting Services (TELSIKS 2013), Nis, Serbia, 16–19 October 2013; Volume 2, pp. 501–504. [Google Scholar] [CrossRef]
  20. Eltawil, M.A.; Zhao, Z. MPPT techniques for photovoltaic applications. Renew. Sustain. Energy Rev. 2013, 25, 793–813. [Google Scholar] [CrossRef]
  21. Cheng, P.C.; Peng, B.R.; Liu, Y.H.; Cheng, Y.S.; Huang, J.W. Optimization of a fuzzy-logic-control-based MPPT algorithm using the particle Swarm optimization technique. Energies 2015, 8, 5338–5360. [Google Scholar] [CrossRef]
  22. Kumar, D.; Chatterjee, K. A review of conventional and advanced MPPT algorithms for wind energy systems. Renew. Sustain. Energy Rev. 2016, 55, 957–970. [Google Scholar] [CrossRef]
  23. Venkateshkumar, M.; Ieee, M.; Description, A. Intelligent Control Based MPPT Method for Fuel Cell Power System. In Proceedings of the 2013 International Conference on Renewable Energy and Sustainable Energy (ICRESE), Coimbatore, India, 5–6 December 2013; pp. 253–257. [Google Scholar]
  24. Raj, A.; Sreekumar, M. A Comparison of MPPT Control of Photovoltaic System using Conventional and Artificial Intelligence Techniques. Int. J. Eng. Trends Technol. 2016, 38, 16–19. [Google Scholar] [CrossRef]
  25. Mohapatra, A.; Nayak, B.; Das, P.; Mohanty, K.B. A review on MPPT techniques of PV system under partial shading condition. Renew. Sustain. Energy Rev. 2017, 80, 854–867. [Google Scholar] [CrossRef]
  26. Koad, R.B.A.; Zobaa, A.F.; El-Shahat, A. A Novel MPPT Algorithm Based on Particle Swarm Optimization for Photovoltaic Systems. IEEE Trans. Sustain. Energy 2017, 8, 468–476. [Google Scholar] [CrossRef]
  27. Khaldi, N.; Mahmoudi, H.; Zazi, M.; Barradi, Y. Implementation of a MPPT neural controller for photovoltaic systems on FPGA circuit. WSEAS Trans. Power Syst. 2014, 9, 471–478. [Google Scholar] [CrossRef]
  28. Penella, M.T.; Gasulla, M. A simple and efficient MPPT method for low-power PV cells. Int. J. Photoenergy 2014, 2014, 1–8. [Google Scholar] [CrossRef]
  29. Das, N.; Wongsodihardjo, H.; Islam, S. A Preliminary Study on Conversion Efficiency Improvement of a Multi-junction PV Cell with MPPT. In Smart Power Systems and Renewable Energy System Integration; Jayaweera, D., Ed.; Springer: Berlin, Germany, 2016; pp. 49–73. ISBN 9783319304250. [Google Scholar]
  30. Esram, T.; Chapman, P.L. Comparison of Photovoltaic Array Maximum Power Point Tracking Techniques. IEEE Trans. Energy Convers. 2007, 22, 439–449. [Google Scholar] [CrossRef] [Green Version]
  31. Wolfs, P.; Li, Q. A current-Sensor-Free Incremental Conductance Single Cell MPPT for High Performance Vehicle Solar Arrays. In Proceedings of the 37th IEEE Power Electronics Specialists Conference, Jeju, Korea, 18–22 June 2006. [Google Scholar]
  32. Li, Q.; Wolfs, P. Experimental Evaluation of the MPPT Hardware for Vehicle Solar Arrays with Silicon Junction Cells. In Proceedings of the Australasian Universities Power Engineering Conference, Perth, Australia, 9–12 December 2007. [Google Scholar]
  33. Njoya Motapon, S. Design and Simulation of a Fuel Cell Hybrid Emergency Power System for a More Electric Aircraft: Evaluation of Energy Management Schemes; University du Quebec: Quebec City, QC, Canada, 2013. [Google Scholar]
  34. Motapon, S.N.; Tremblay, O.; Ieee, M.; Dessaint, L.; Ieee, S.M. A Generic Fuel Cell Model for the Simulation of Fuel Cell Vehicles. In Proceedings of the Vehicle Power and Propulsion Conference, Dearborn, MI, USA, 7–10 September 2009; pp. 1722–1729. [Google Scholar] [CrossRef]
  35. Dos Reis, J.V.; Raddo, T.R.; Sanches, A.L.; Borges, B.H.V. Comparison between Mamdani and Sugeno fuzzy inference systems for the mitigation of environmental temperature variations in OCDMA-PONs. In Proceedings of the 2015 17th International Conference on Transparent Optical Networks (ICTON), Budapest, Hungary, 5–9 July 2015. [Google Scholar] [CrossRef]
  36. Sari, W.E.; Wahyunggoro, O.; Fauziati, S. A comparative study on fuzzy Mamdani-Sugeno-Tsukamoto for the childhood tuberculosis diagnosis. In AIP Conference Proceedings; AIP Publishing: Melville, NY, USA, 2016; p. 070003. [Google Scholar] [CrossRef]
  37. Takagi, T.; Sugeno, M. Fuzzy identification of systems and its applications to modeling and control. IEEE Trans. Syst. Man Cybern. 1985, SMC-15, 116–132. [Google Scholar] [CrossRef]
  38. Hamam, A.; Georganas, N.D. A comparison of mamdani and sugeno fuzzy inference systems for evaluating the quality of experience of hapto-audio-visual applications. In Proceedings of the IEEE International Workshop on Haptic Audio Visual Environments and Games, Ottawa, ON, Canada, 18–19 October 2008; pp. 87–92. [Google Scholar] [CrossRef]
  39. Blej, M.; Azizi, M. Comparison of Mamdani-Type and Sugeno-Type Fuzzy Inference Systems for Fuzzy Real Time Scheduling. Int. J. Appl. Eng. Res. 2016, 11, 11071–11075. [Google Scholar]
  40. Lilly, J.H. Fuzzy Control and Identification; Wiley & Sons Ltd.: Hoboken, NJ, USA, 2010; ISBN 9780470542774. [Google Scholar]
  41. Egaji, O.A.; Griffiths, A.; Hasan, M.S.; Yu, H.N. A comparison of Mamdani and Sugeno fuzzy based packet scheduler for MANET with a realistic wireless propagation model. Int. J. Autom. Comput. 2015, 12, 1–13. [Google Scholar] [CrossRef] [Green Version]
  42. Ariff, R.M.; Hanafi, D.; Utomo, W.M.; Sim, S.Y.; Bohari, A.A. Comparison of Sugeno-Type and Mamdani-Type Speed Controller for Induction Motor Drive System. In Proceedings of the 3rd International Conference on Computer Engineering and Mathematical Sciences (ICCEMS 2014), Langkawi, Malaysia, 4–5 December 2014; pp. 387–391. [Google Scholar] [CrossRef]
  43. Subhedar, M.; Birajdar, G. Comparison of mamdani and sugeno inference systems for dynamic spectrum allocation in cognitive radio networks. Wirel. Pers. Commun. 2013, 71, 805–819. [Google Scholar] [CrossRef]
  44. Wong, L.K.; Leung, F.H.F.; Tam, P.K.S. Design of fuzzy logic controllers for Takagi–Sugeno fuzzy model based system with guaranteed performance. Int. J. Approx. Reason. 2002, 30, 41–55. [Google Scholar] [CrossRef] [Green Version]
  45. Kaur, A.; Kaur, A. Comparison of Mamdani-Type and Sugeno-Type Fuzzy Inference Systems for Air Conditioning System. Int. J. Soft Comput. Eng. 2012, 2, 323–325. [Google Scholar]
  46. Zaher, H.; Kandil, A.E.; Fahmy, R. Comparison of Mamdani and Sugeno Fuzzy Inference Systems for Prediction (With Application to Prices of Fund in Egypt). Br. J. Math. Comput. Sci. 2014, 4, 3014–3022. [Google Scholar] [CrossRef]
  47. Saepullah, A.; Romi, S.W. Comparative Analysis of Mamdani, Sugeno And Tsukamoto Method of Fuzzy Inference System for Air Conditioner Energy Saving. J. Intell. Syst. 2015, 1, 143–147. [Google Scholar]
  48. ElNounou, K.T. Design of GA-Sugeno Fuzzy Controller for Maximum Power Point And Sun Tracking in Solar Array Systems; Islamic University of Gaza: Gaza City, Palestine, 2013. [Google Scholar]
  49. Shi, J.; Zhang, W.; Zhang, Y.; Xue, F.; Yang, T. MPPT for PV systems based on a dormant PSO algorithm. Electr. Power Syst. Res. 2015, 123, 100–107. [Google Scholar] [CrossRef]
  50. Ahmadi, S.; Abdi, S.; Kakavand, M. Maximum power point tracking of a proton exchange membrane fuel cell system using PSO-PID controller. Int. J. Hydrogen Energy 2017, 42, 20430–20443. [Google Scholar] [CrossRef]
Figure 1. System layout.
Energies 12 00936 g001
Figure 2. 53 kW PEMFC polarisation curves.
Energies 12 00936 g002
Figure 3. Input membership functions.
Energies 12 00936 g003
Figure 4. Output membership function.
Energies 12 00936 g004
Figure 5. Output membership function.
Energies 12 00936 g005
Figure 6. (a) Output voltage, (b) output current and (c) output power using the Mamdani Fuzzy Inference System.
Energies 12 00936 g006aEnergies 12 00936 g006b
Figure 7. (a) Output voltage, (b) output current and (c) output power using the Particle Swarm Optimisation algorithm.
Energies 12 00936 g007
Table 1. Proton Exchange Membrane Fuel Cell (PEMFC) model parameters.
Model Input Parameters for A 53 kW PEMFC Stack
Voltage at 0 A and 1A900 V and 895 V
Nominal operating point80 A and 625 V
Maximum operating point280 A and 430 V
Number of cells900
Nominal stack efficiency55%
Operating temperature338 K
Nominal air flow rate2100 litre per minute
Nominal supply pressure1.5 bar for hydrogen and 1 bar for oxygen
Nominal composition99.95% for hydrogen, 21% for oxygen and 1% for water
Voltage response time 1 s
Table 2. Converter parameters.
Boost Converter Design Parameters
Inductor2.9 × 10−3 H
Capacitor70 × 10−6 F
Switching frequency30 kHz
Input voltage625 V
Output voltage1.2 kV
Efficiency90%
Load28.8 Ω
Table 3. Rules table.
Change in Error
E/ΔENBNSZPSPB
ErrorNBZZZPSPB
NSZZNBPSPB
ZNBNSNSPSPB
PSNBNSNSZZ
PBNBNSPSZZ
Table 4. Characteristic parameters.
ComparisonMamdani Fuzzy Inference SystemParticle Swarm Optimisation Algorithm
Voltage
Amplitude1.214 kV1.228 kV
Rise Time1.172 ms1.177 ms
Overshoot29.221%27.564%
Undershoot5.816%7.925%
Settling Time8.072 ms19.981 ms
Current
Amplitude42.17 A42.66 A
Rise Time1.172 ms1.177 ms
Overshoot29.221%27.564%
Undershoot5.816%7.925%
Settling Time8.072 ms19.981 ms
Power
Amplitude51.83 kW52.68 kW
Rise Time896.288 μs834.688 μs
Overshoot65.833%63.115%
Undershoot1.121%3.736%
Settling Time10.53 ms20.009 ms
Tracking efficiency97.79%99.39%

