Optimal Sizing of Storage Elements for a Vehicle Based on Fuel Cells, Supercapacitors, and Batteries


Abstract
1. Introduction
- The vehicle can recover a fraction of the kinetic energy while braking (regenerative breaking)
- The main power source might be shut down during idle periods and low-load phases without compromising vehicle drivability
- The main power source can operate at high efficiency points independently of the vehicle trajectory.
- The main power source can be designed with a slightly lower capacity.
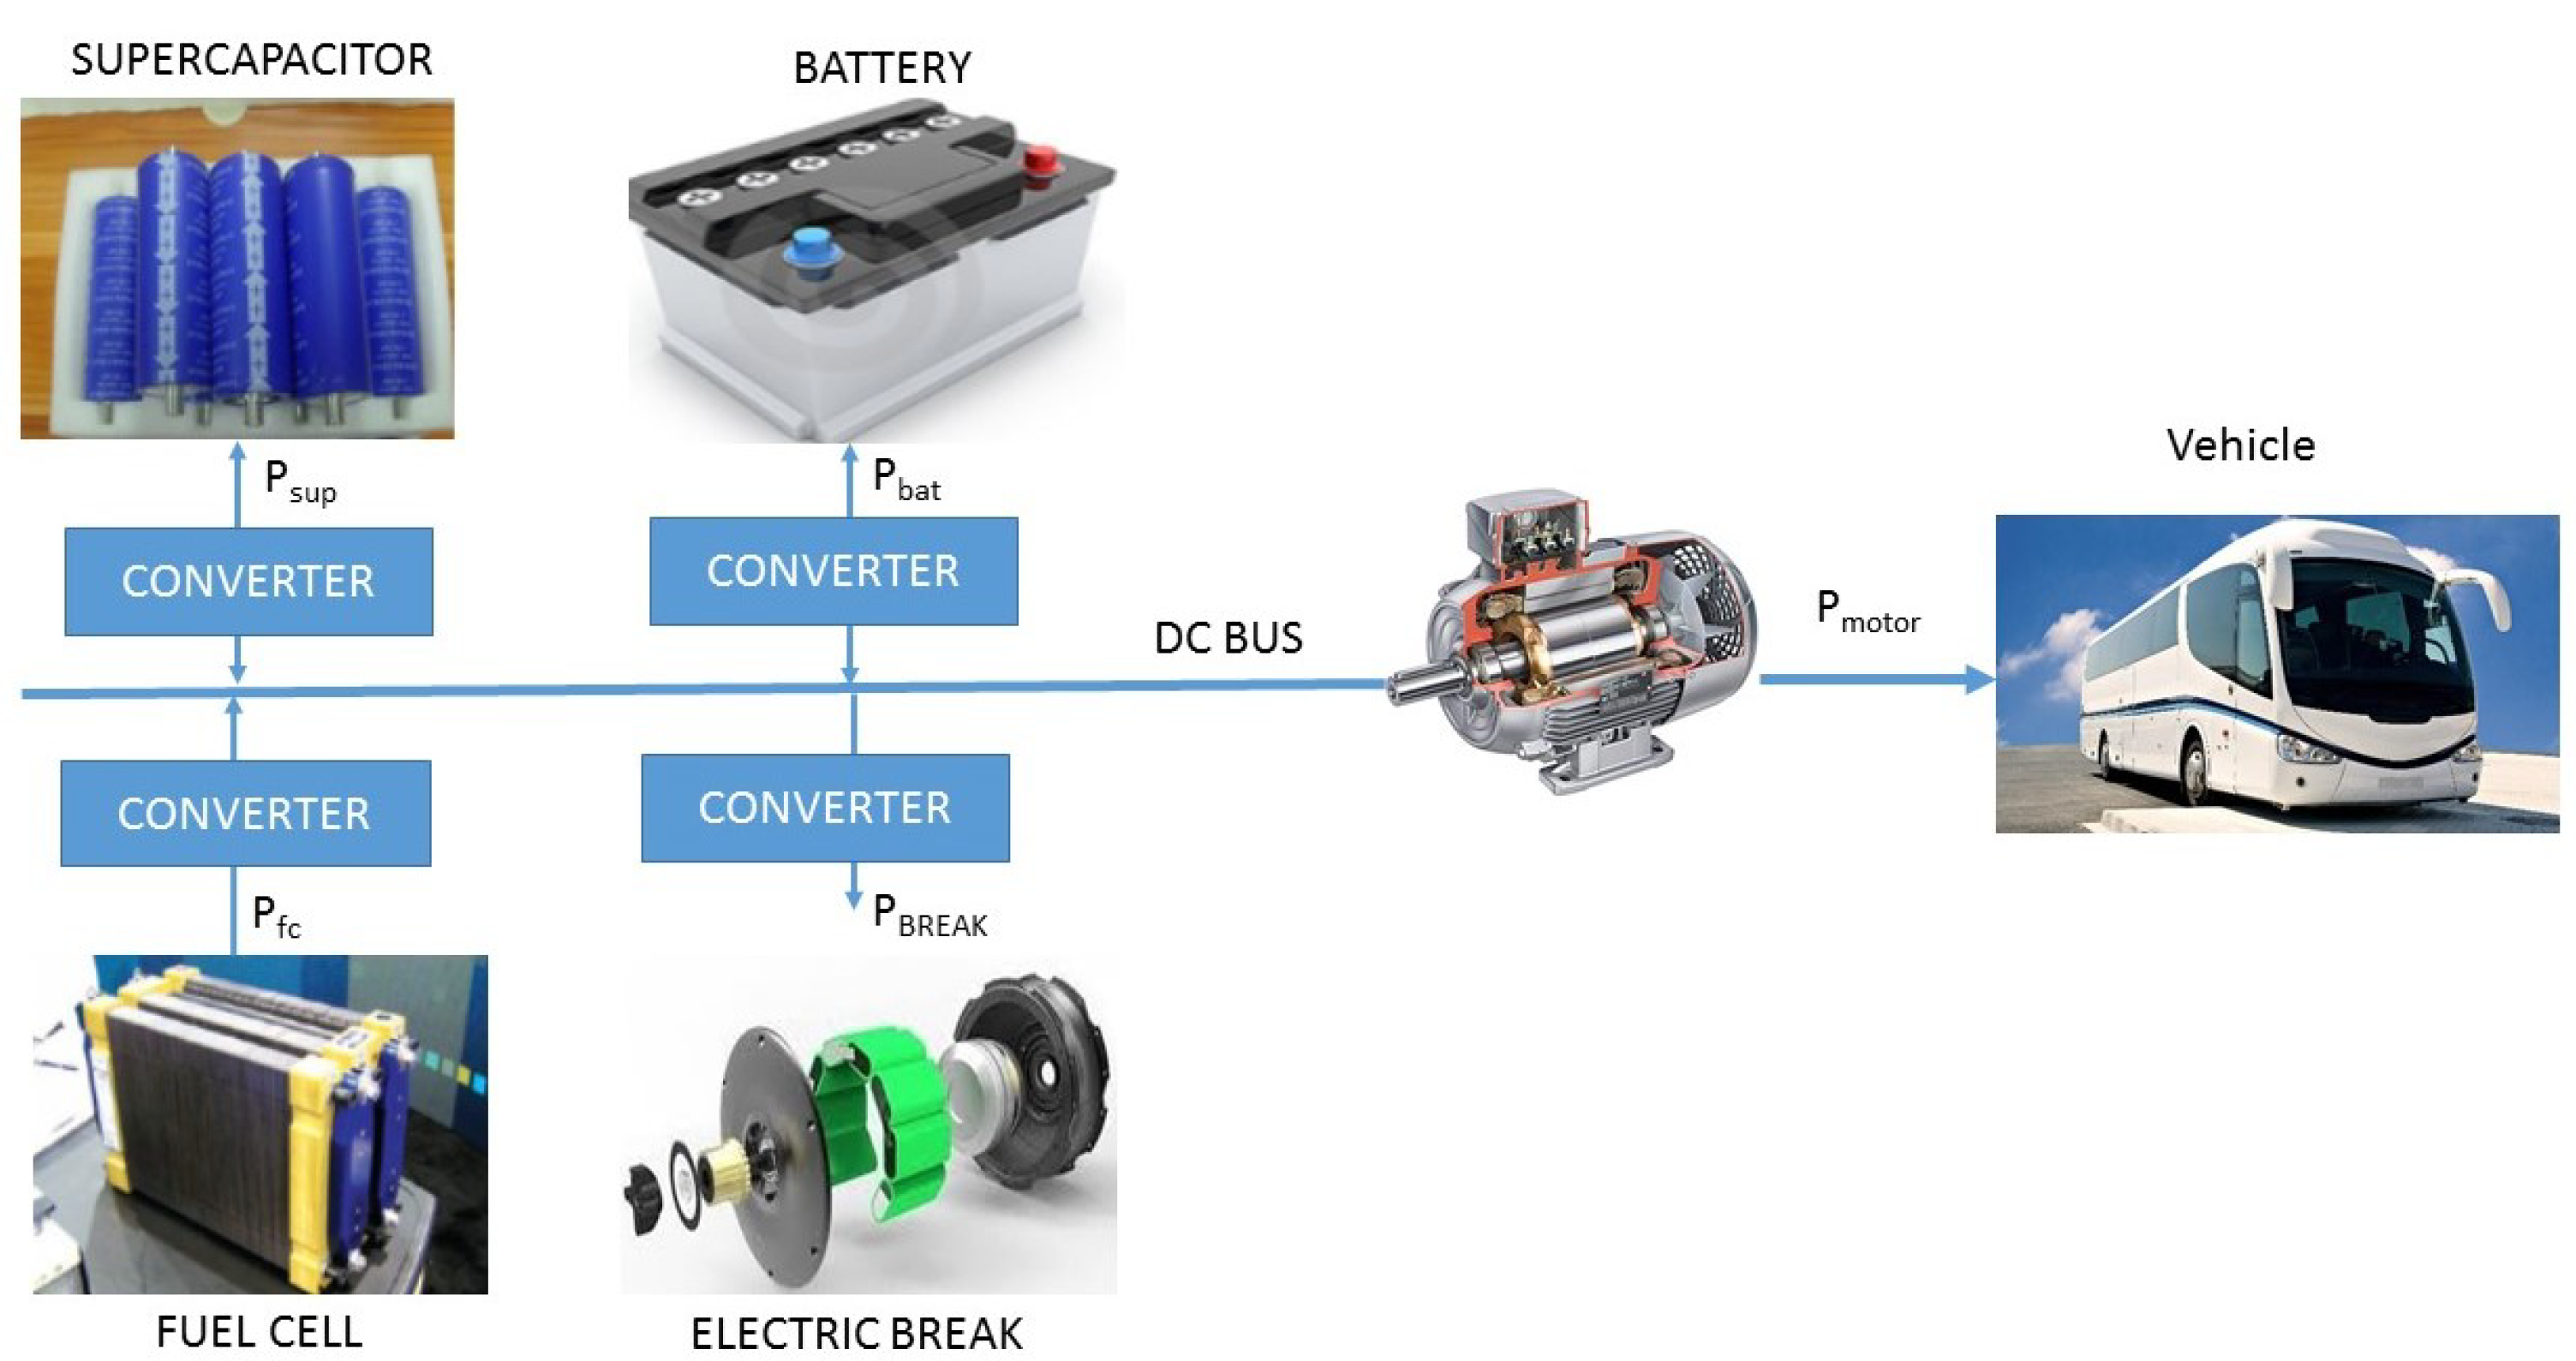
2. Vehicle Architecture
2.1. Battery Modelling
2.2. Supercapacitor Model
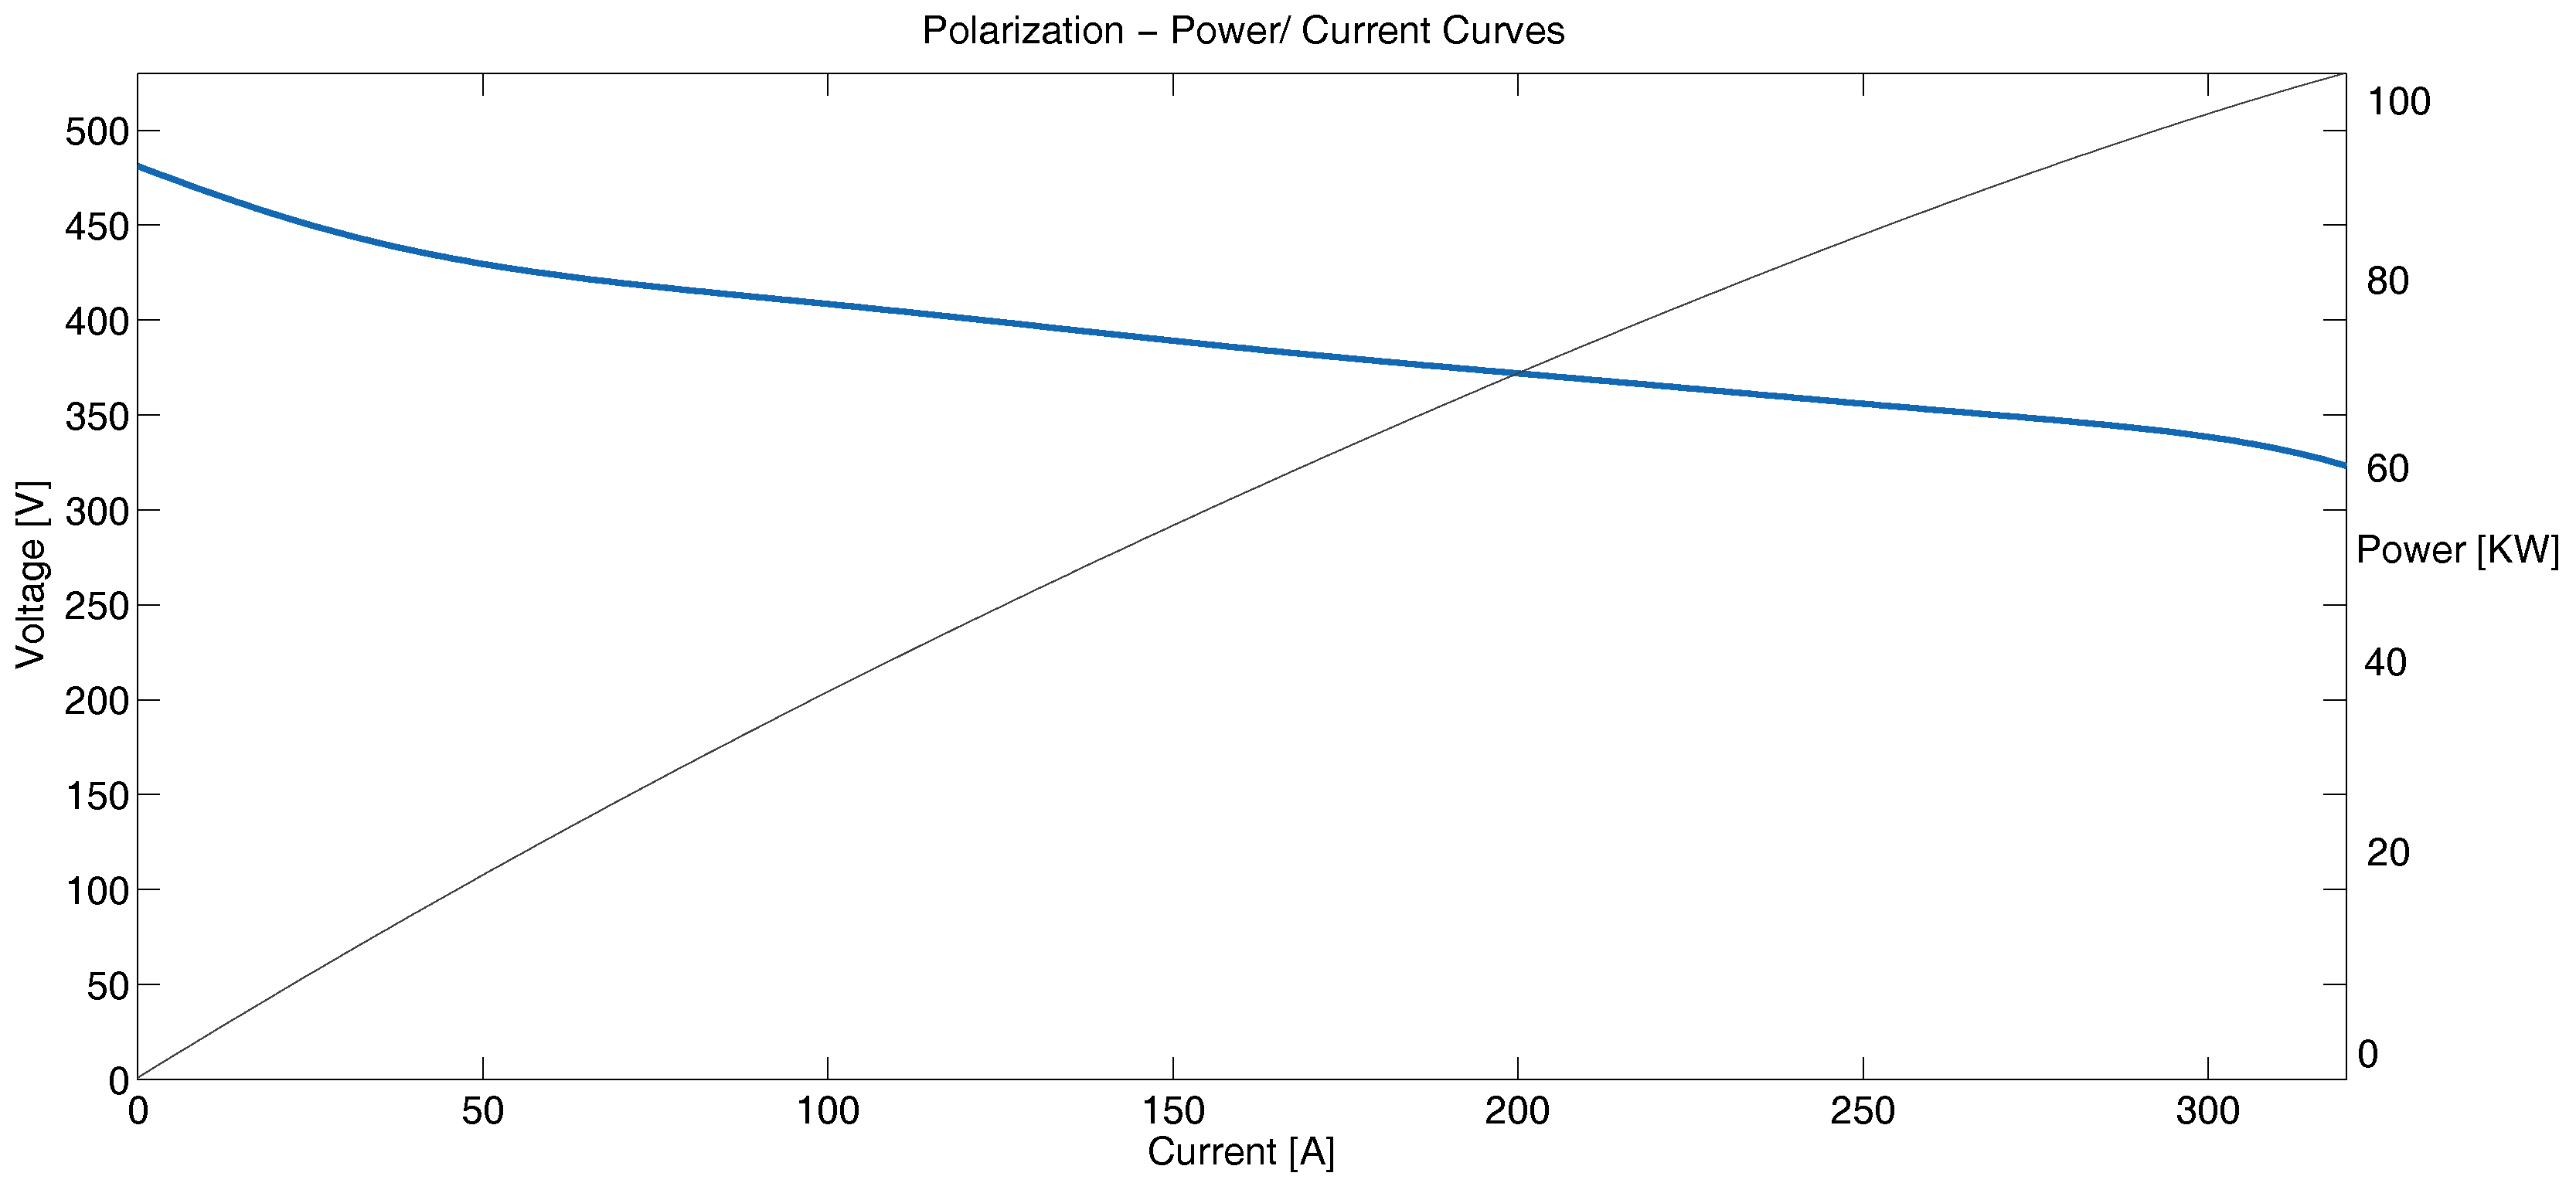
2.3. Fuel Cell Model
- Supply of oxidant.
- Fuel supply.
- Heat management.
- Water management.
- Power conditioning, instrumentation, and controls.
3. Driving Profiles
3.1. Buenos Aires City Driving Cycle
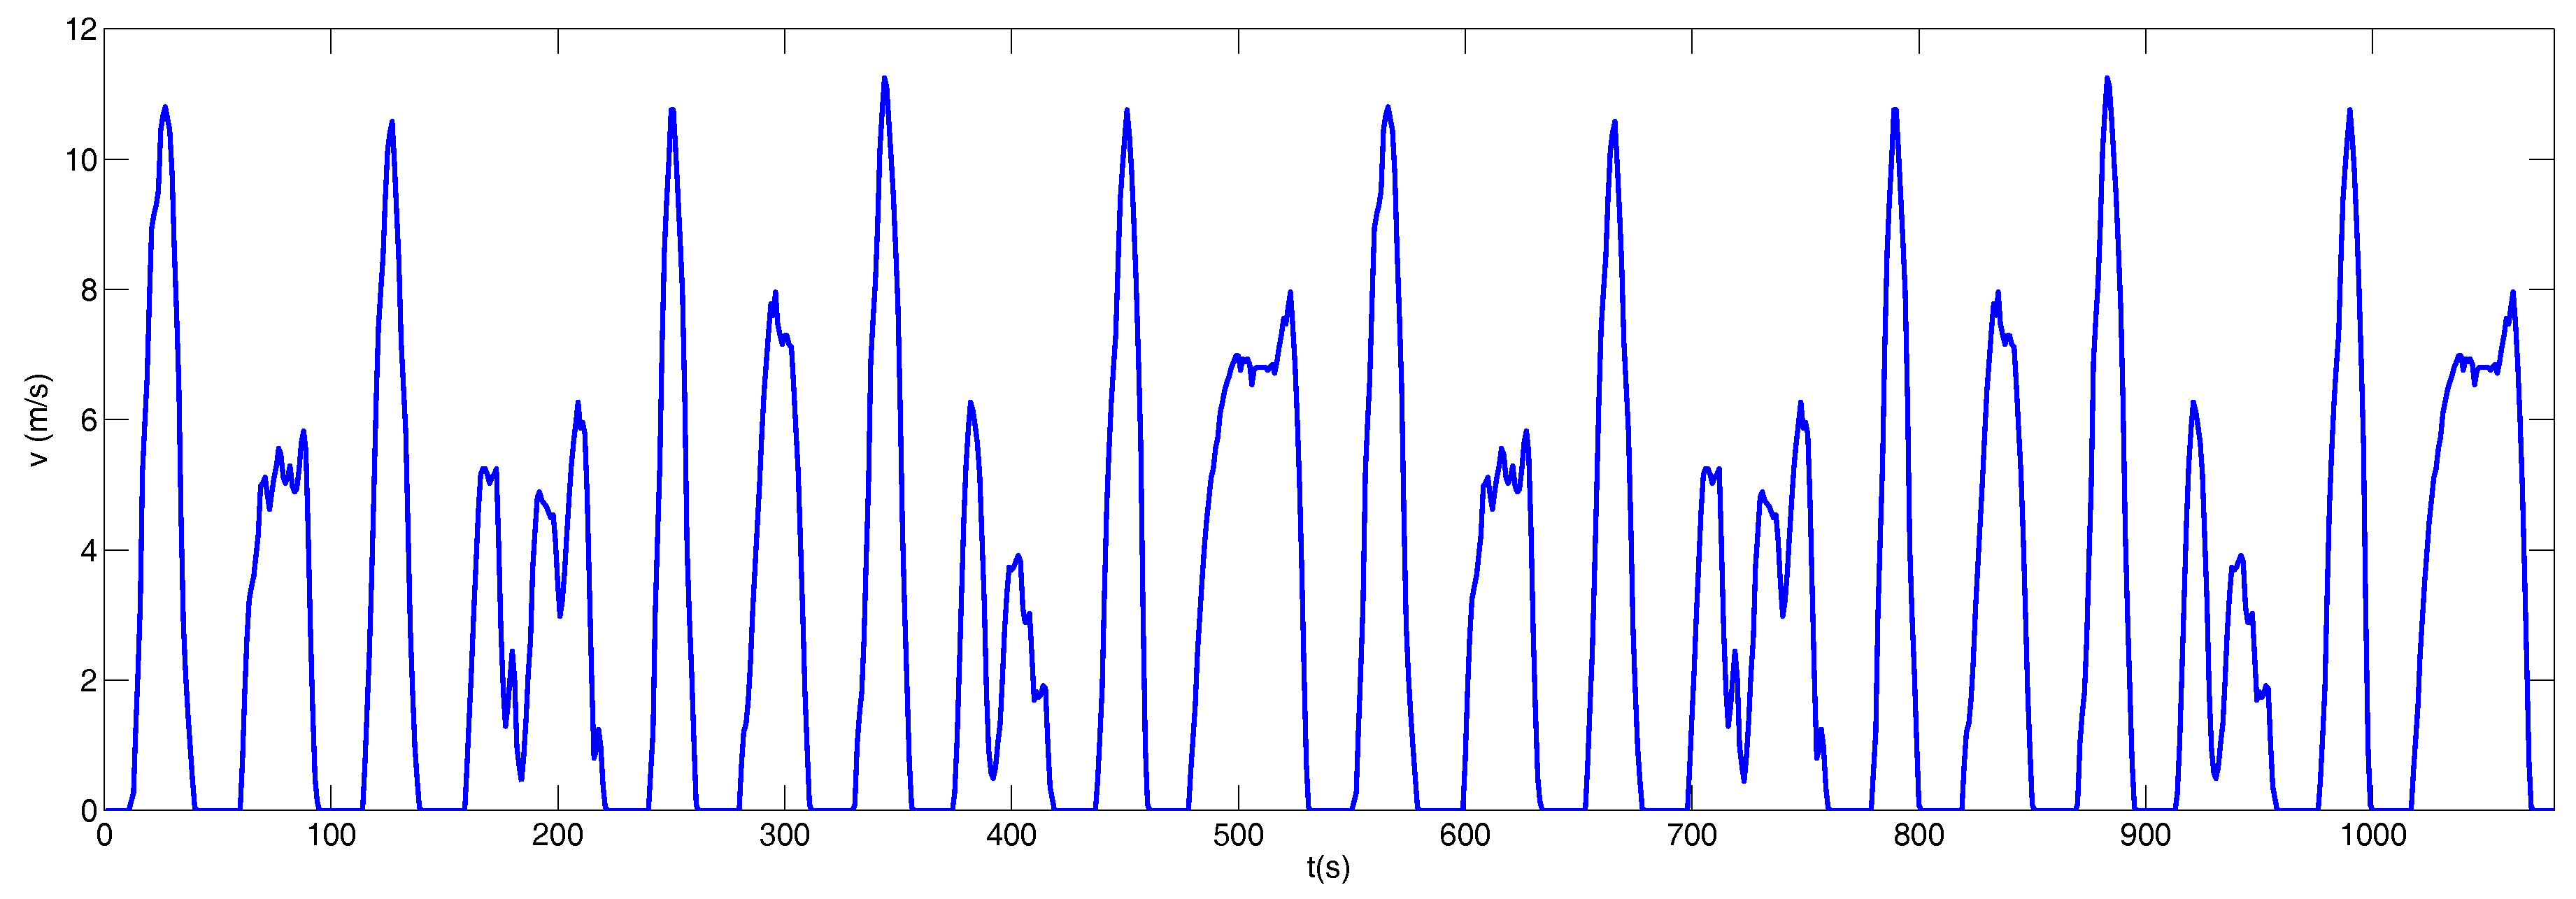
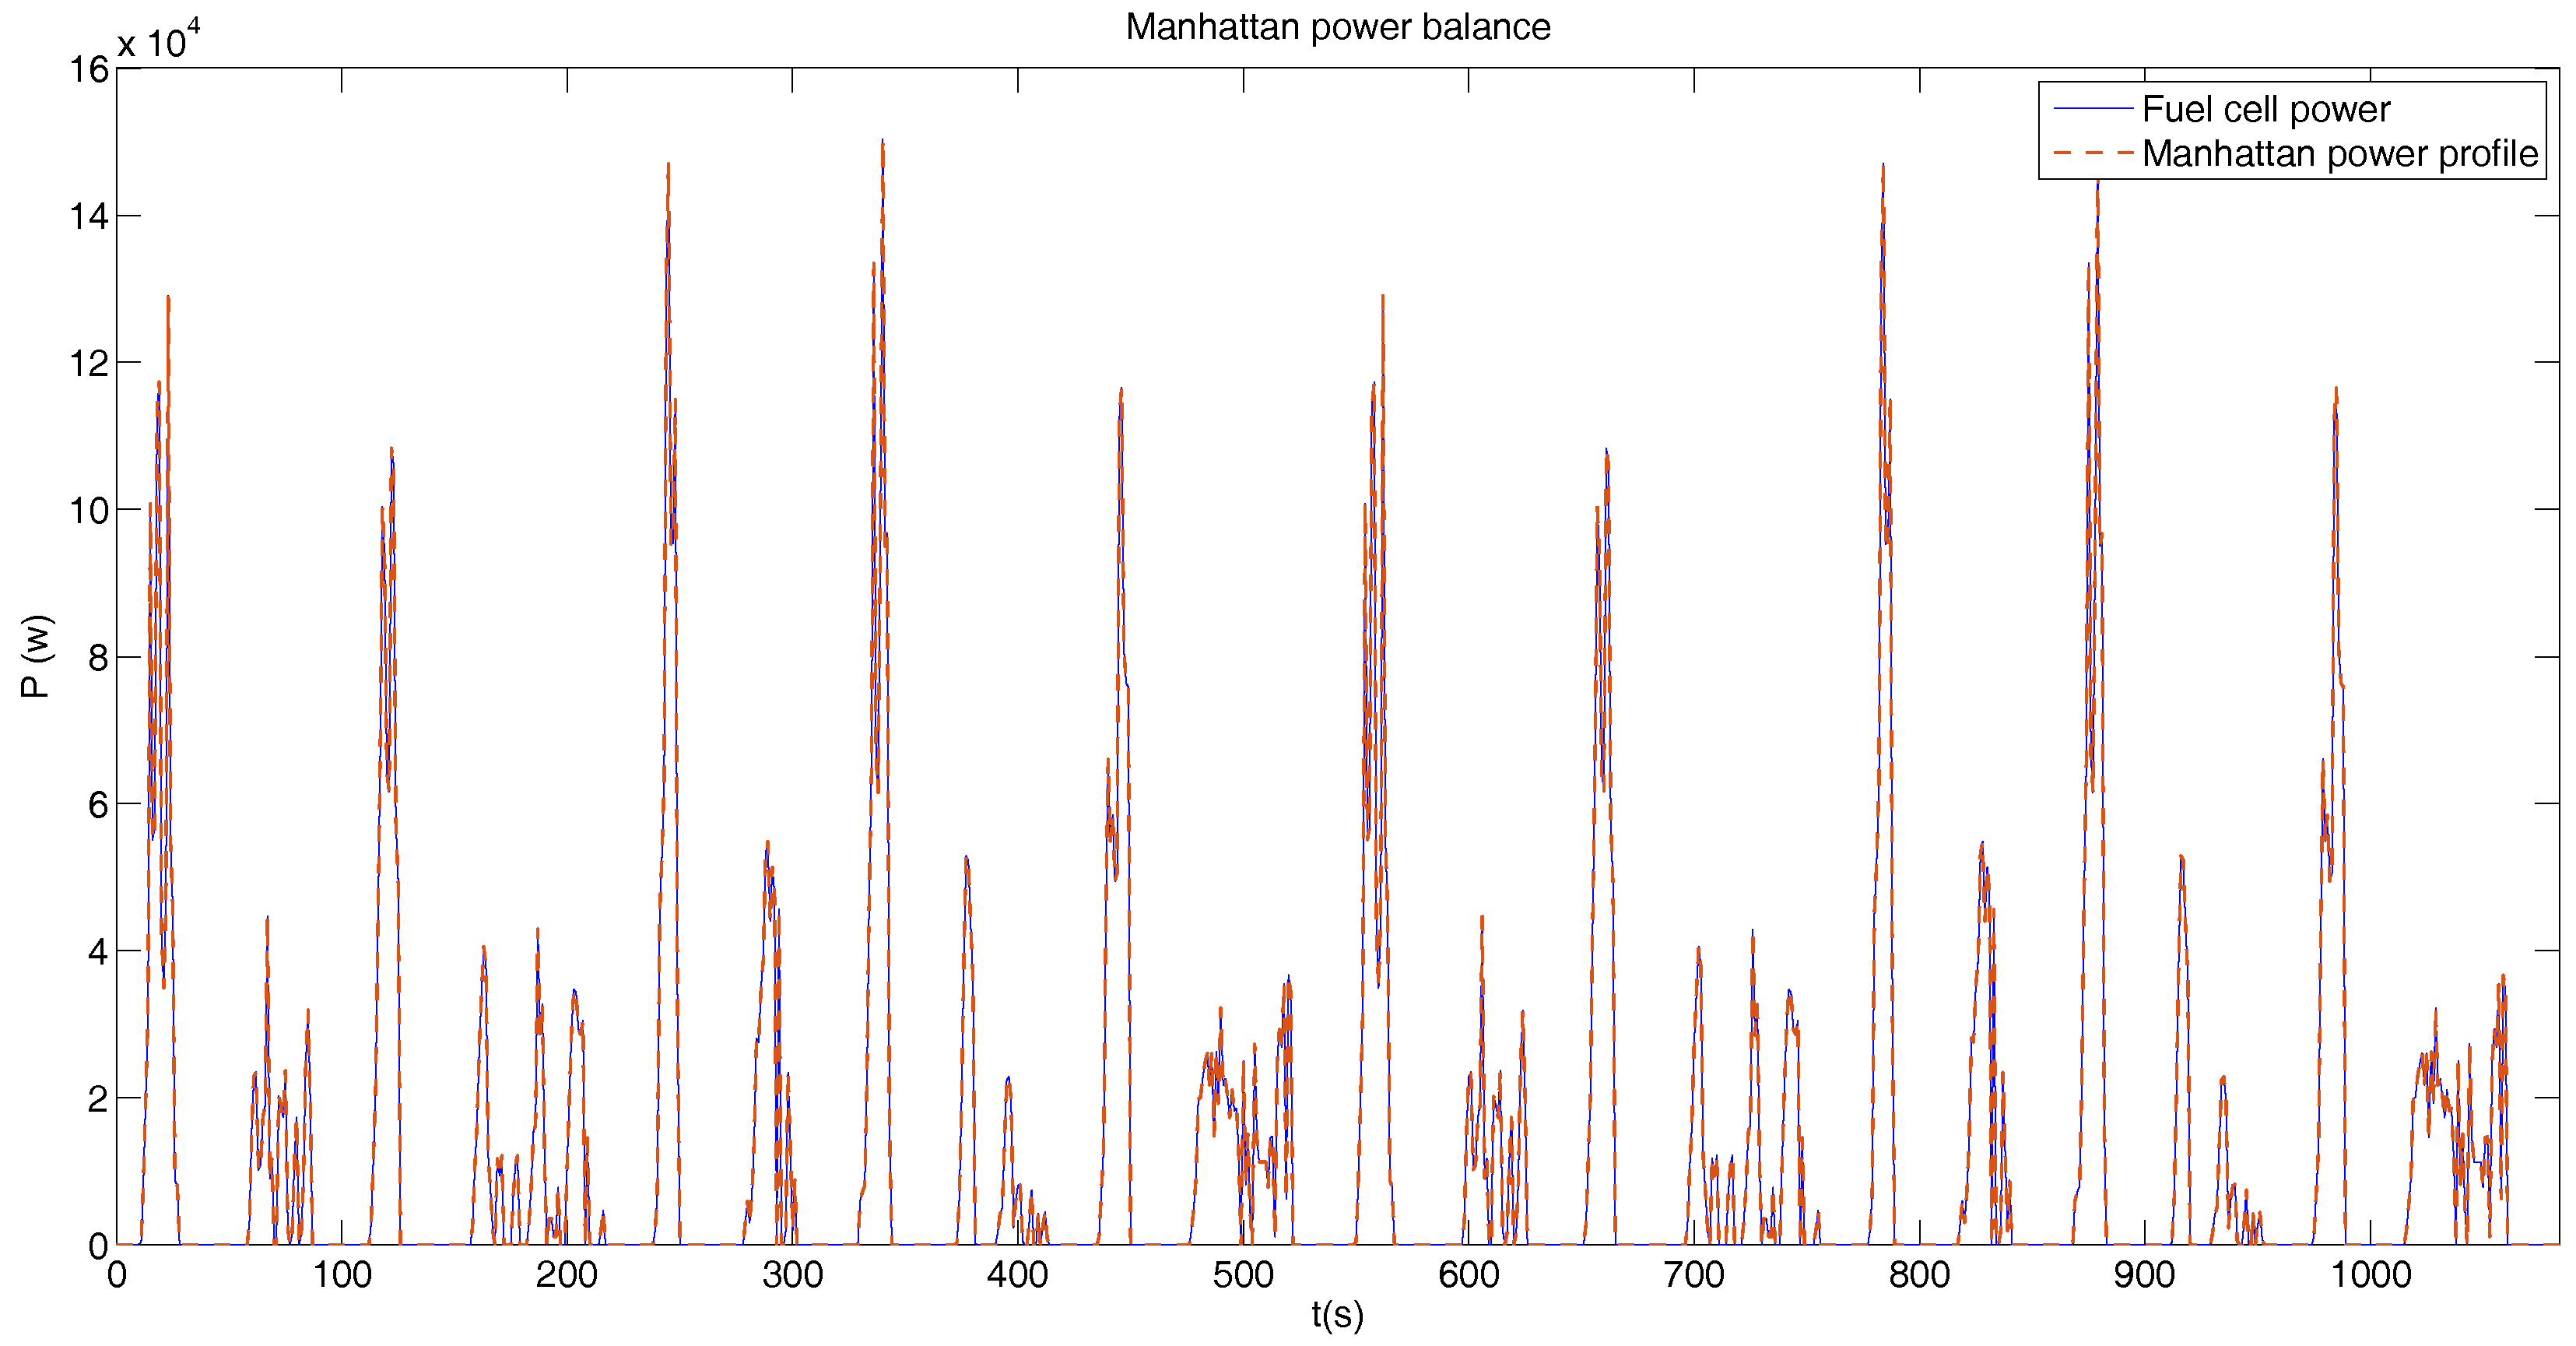
3.2. Manhattan Driving Cycle
4. Dynamic Programming
4.1. Cost Function
- The operational life of the elements.
- The amount of hydrogen consumed.
- To preserve the operational life of the elements (state of health of the elements) abrupt variations
- The amount of hydrogen consumed by the fuel cell, expressed as a function of the power delivered, , which determines the economic cost should be minimized.
4.1.1. Coefficient Sweep for BADC
4.1.2. Coefficient Sweep for Manhattan Driving Cycle
5. Results
5.1. Fuel Cell Operation Only
5.1.1. Buenos Aires Driving Cycle
5.1.2. Manhattan Driving Cycle
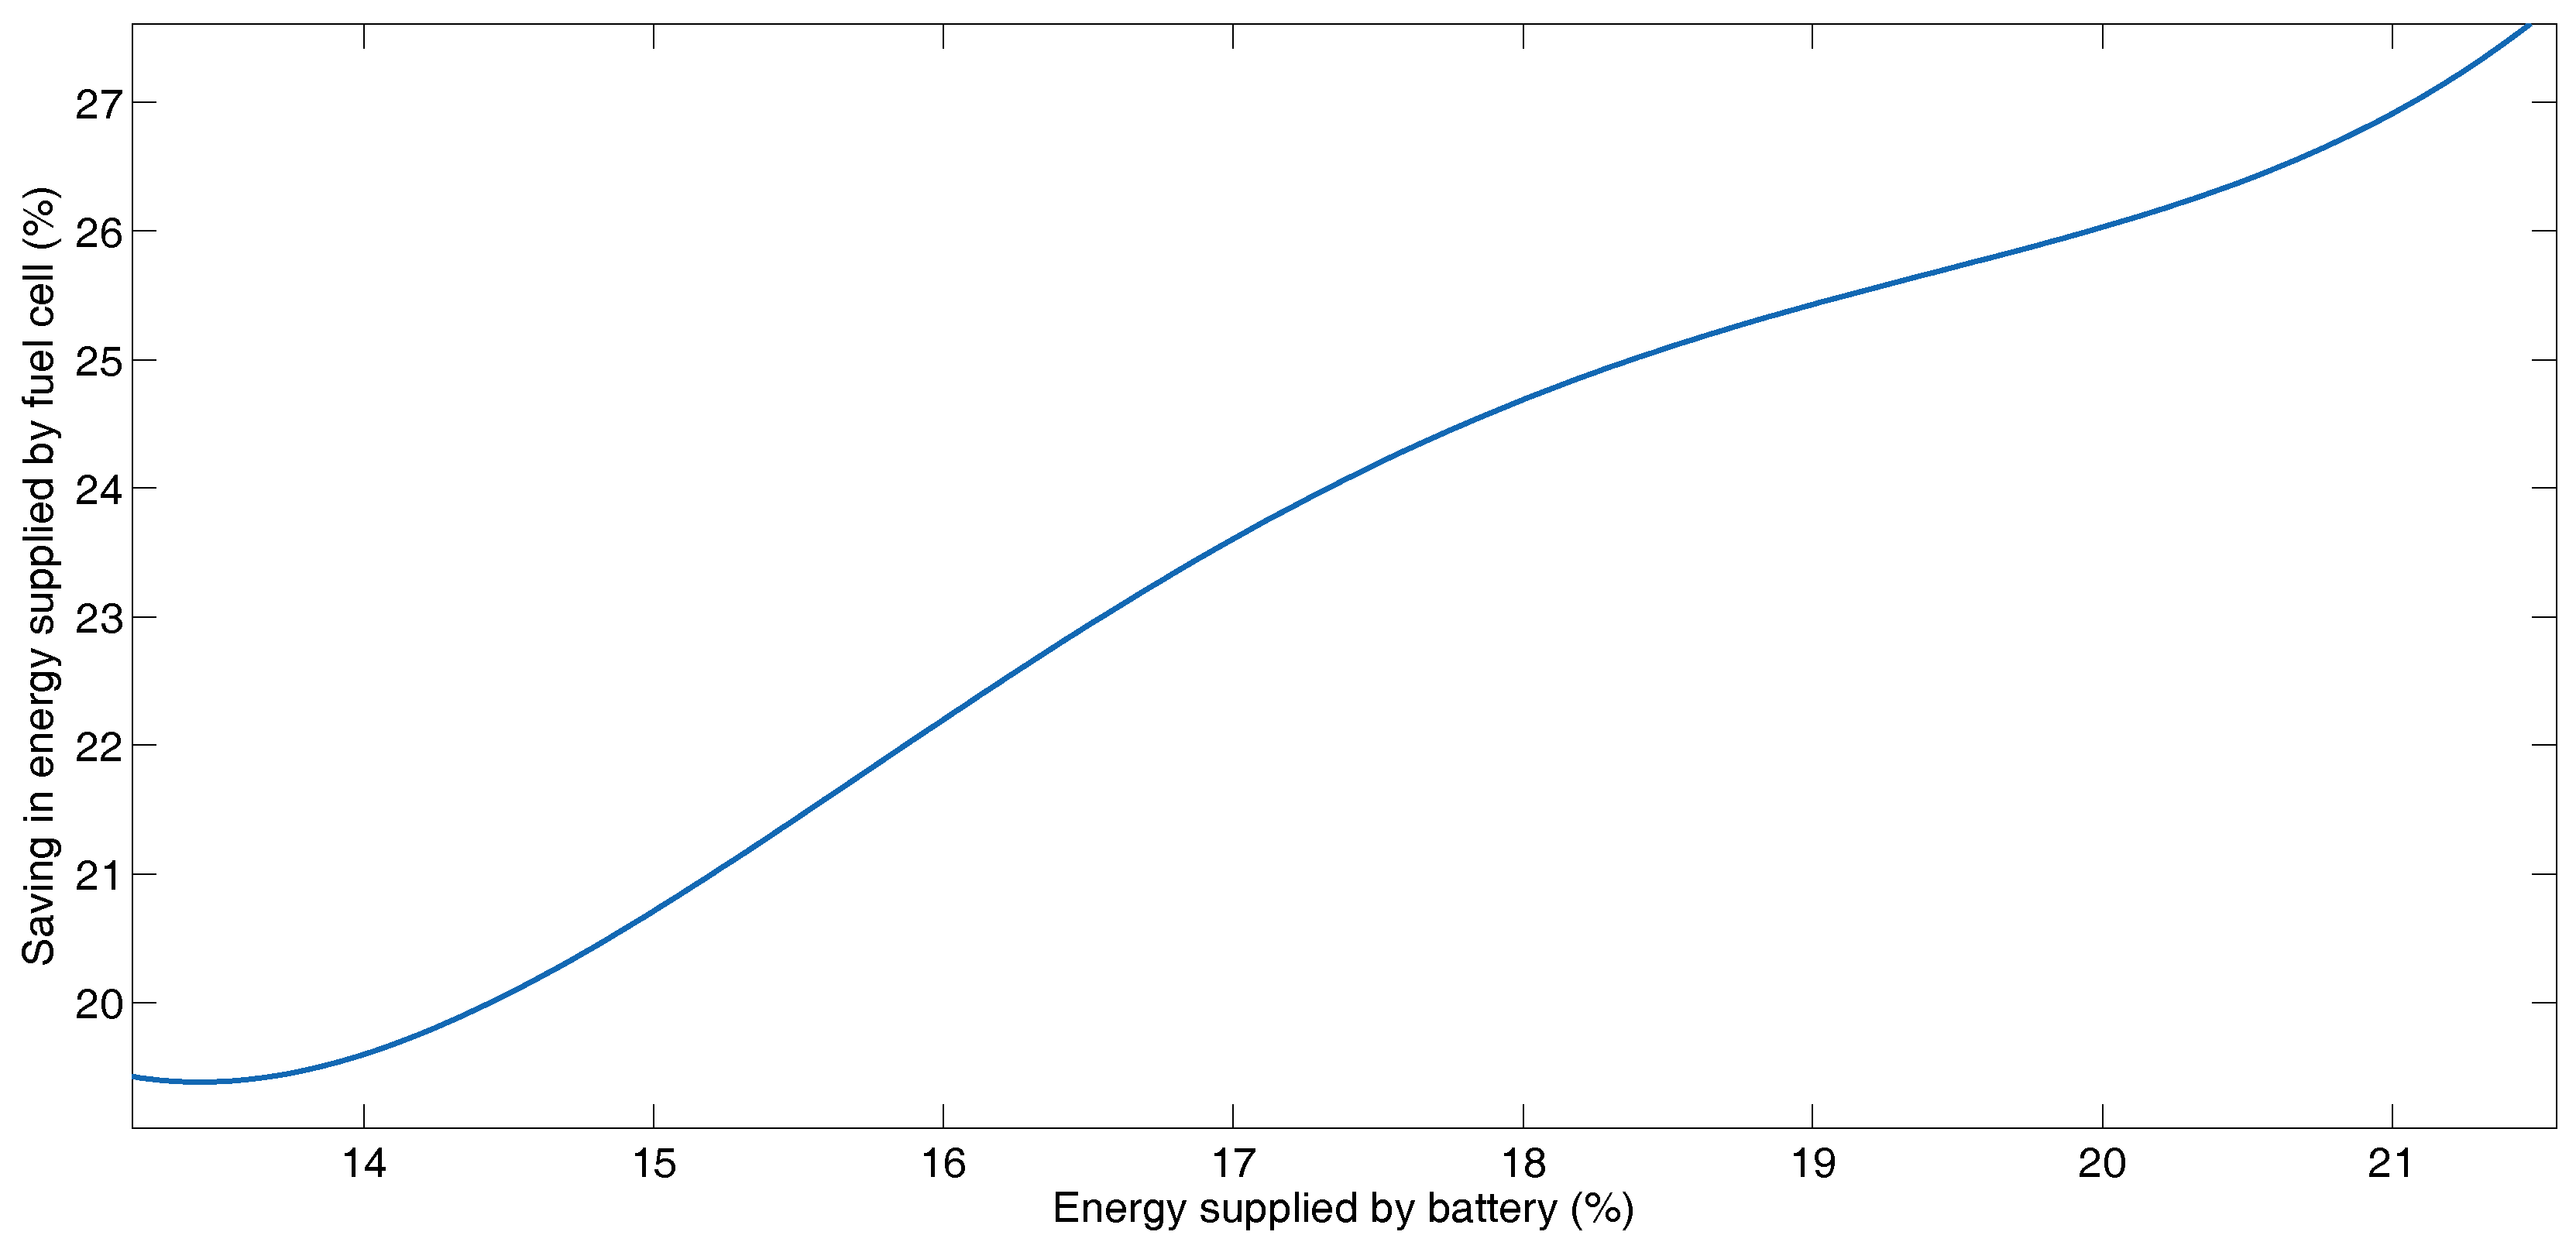
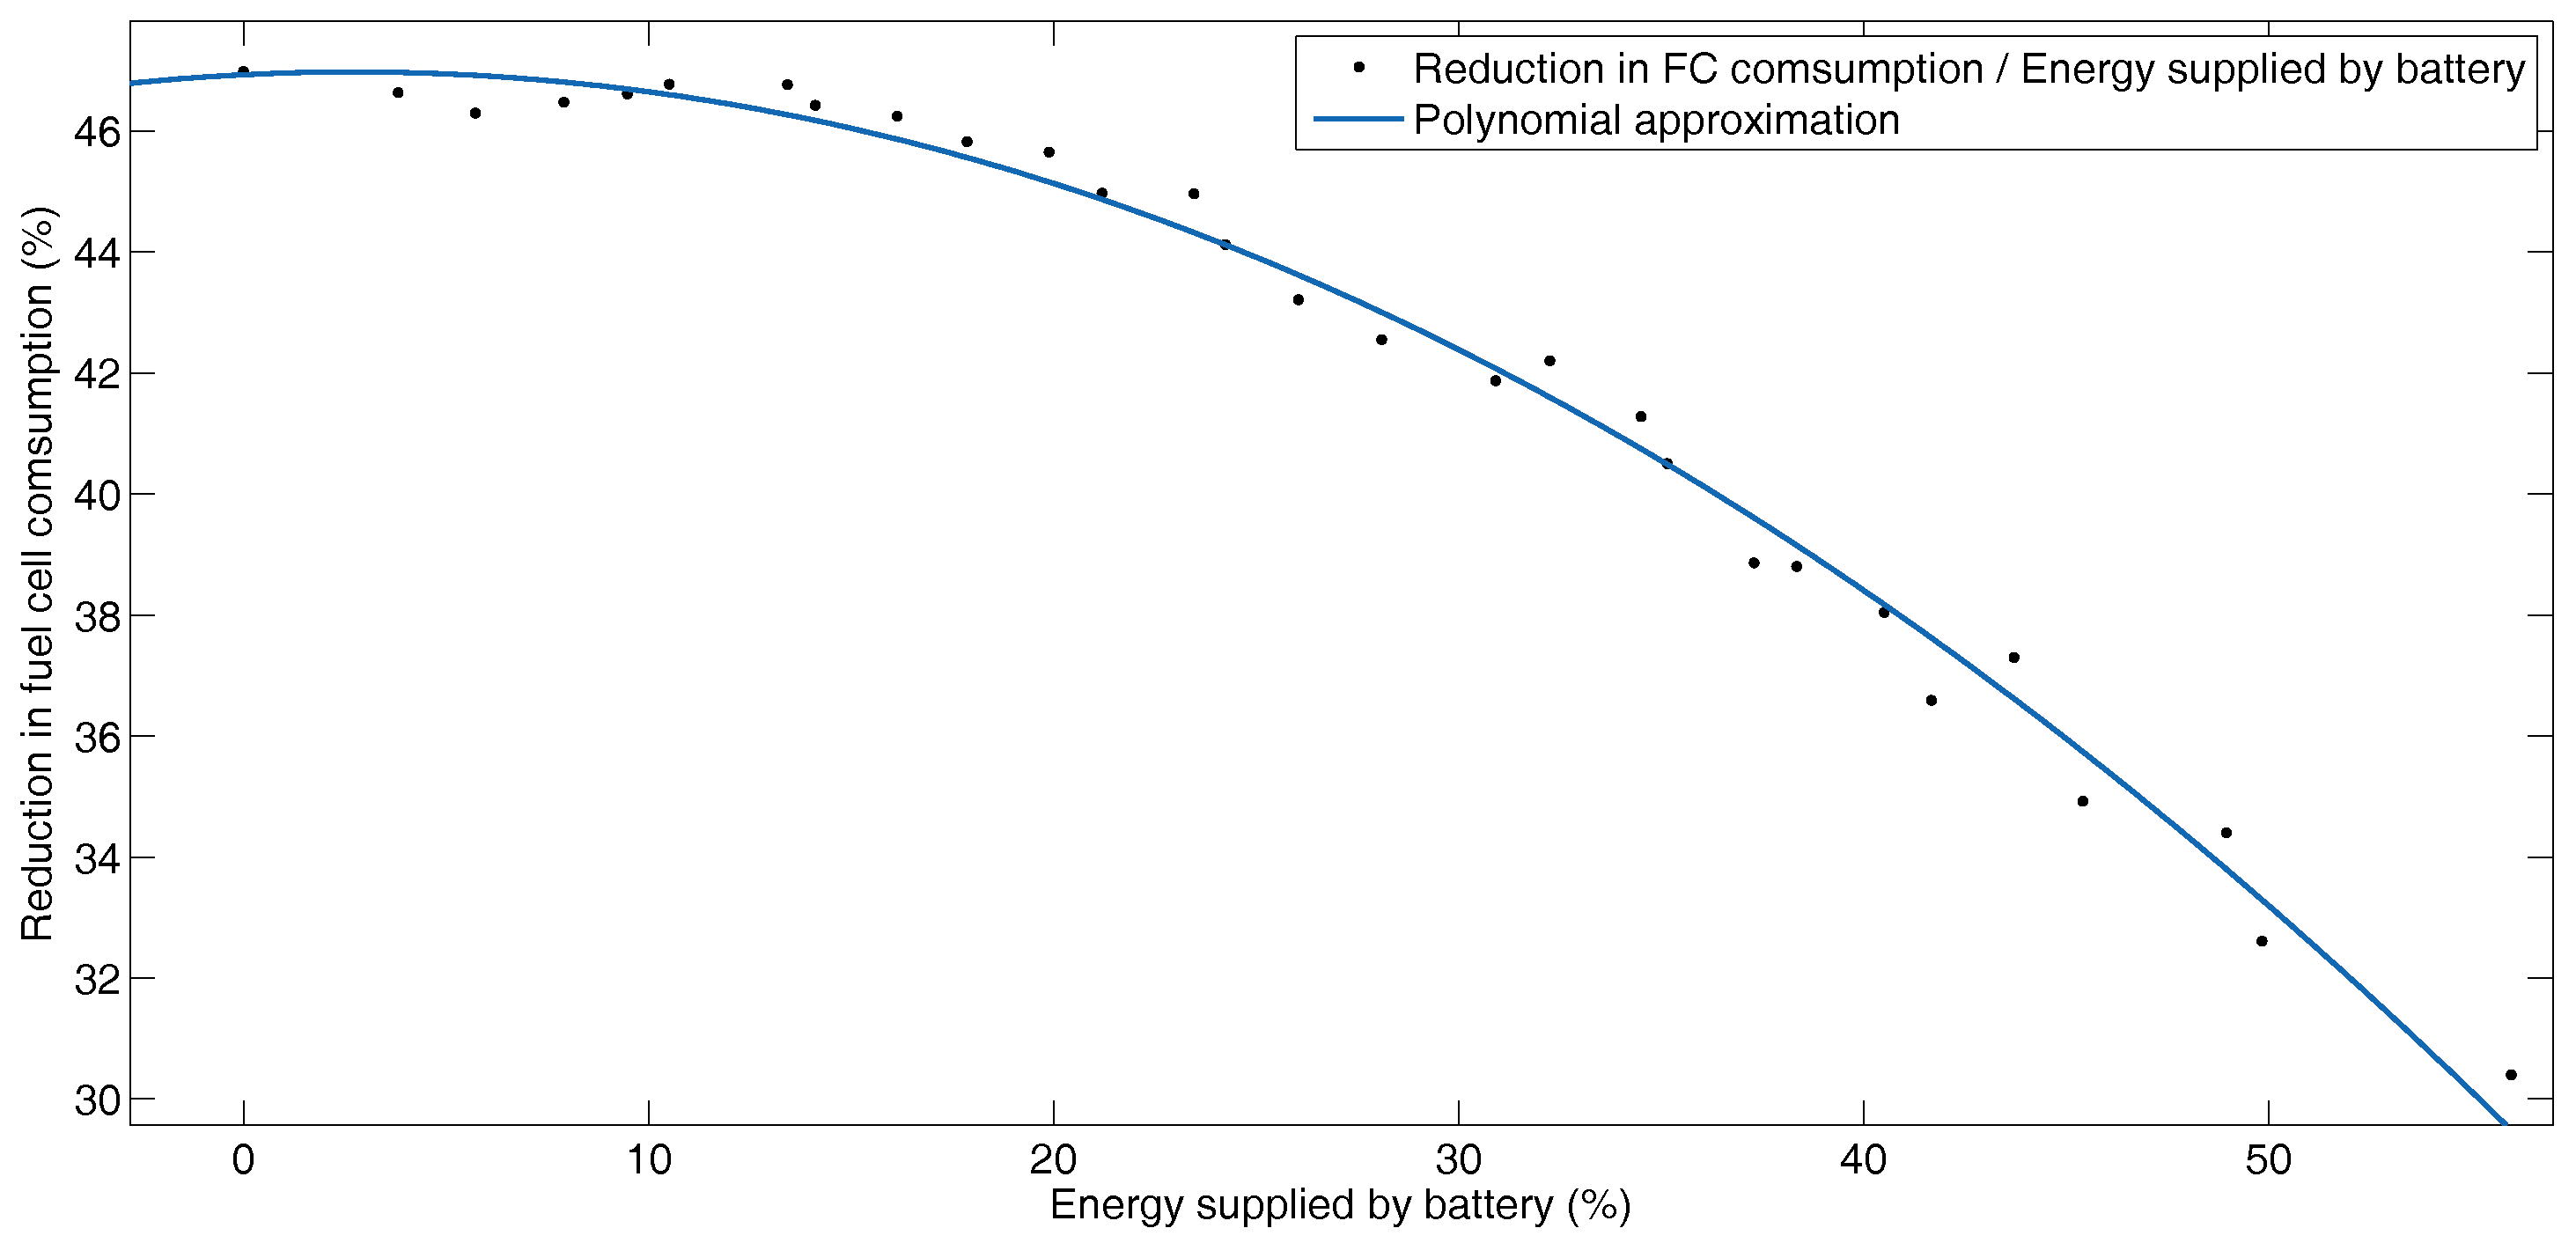
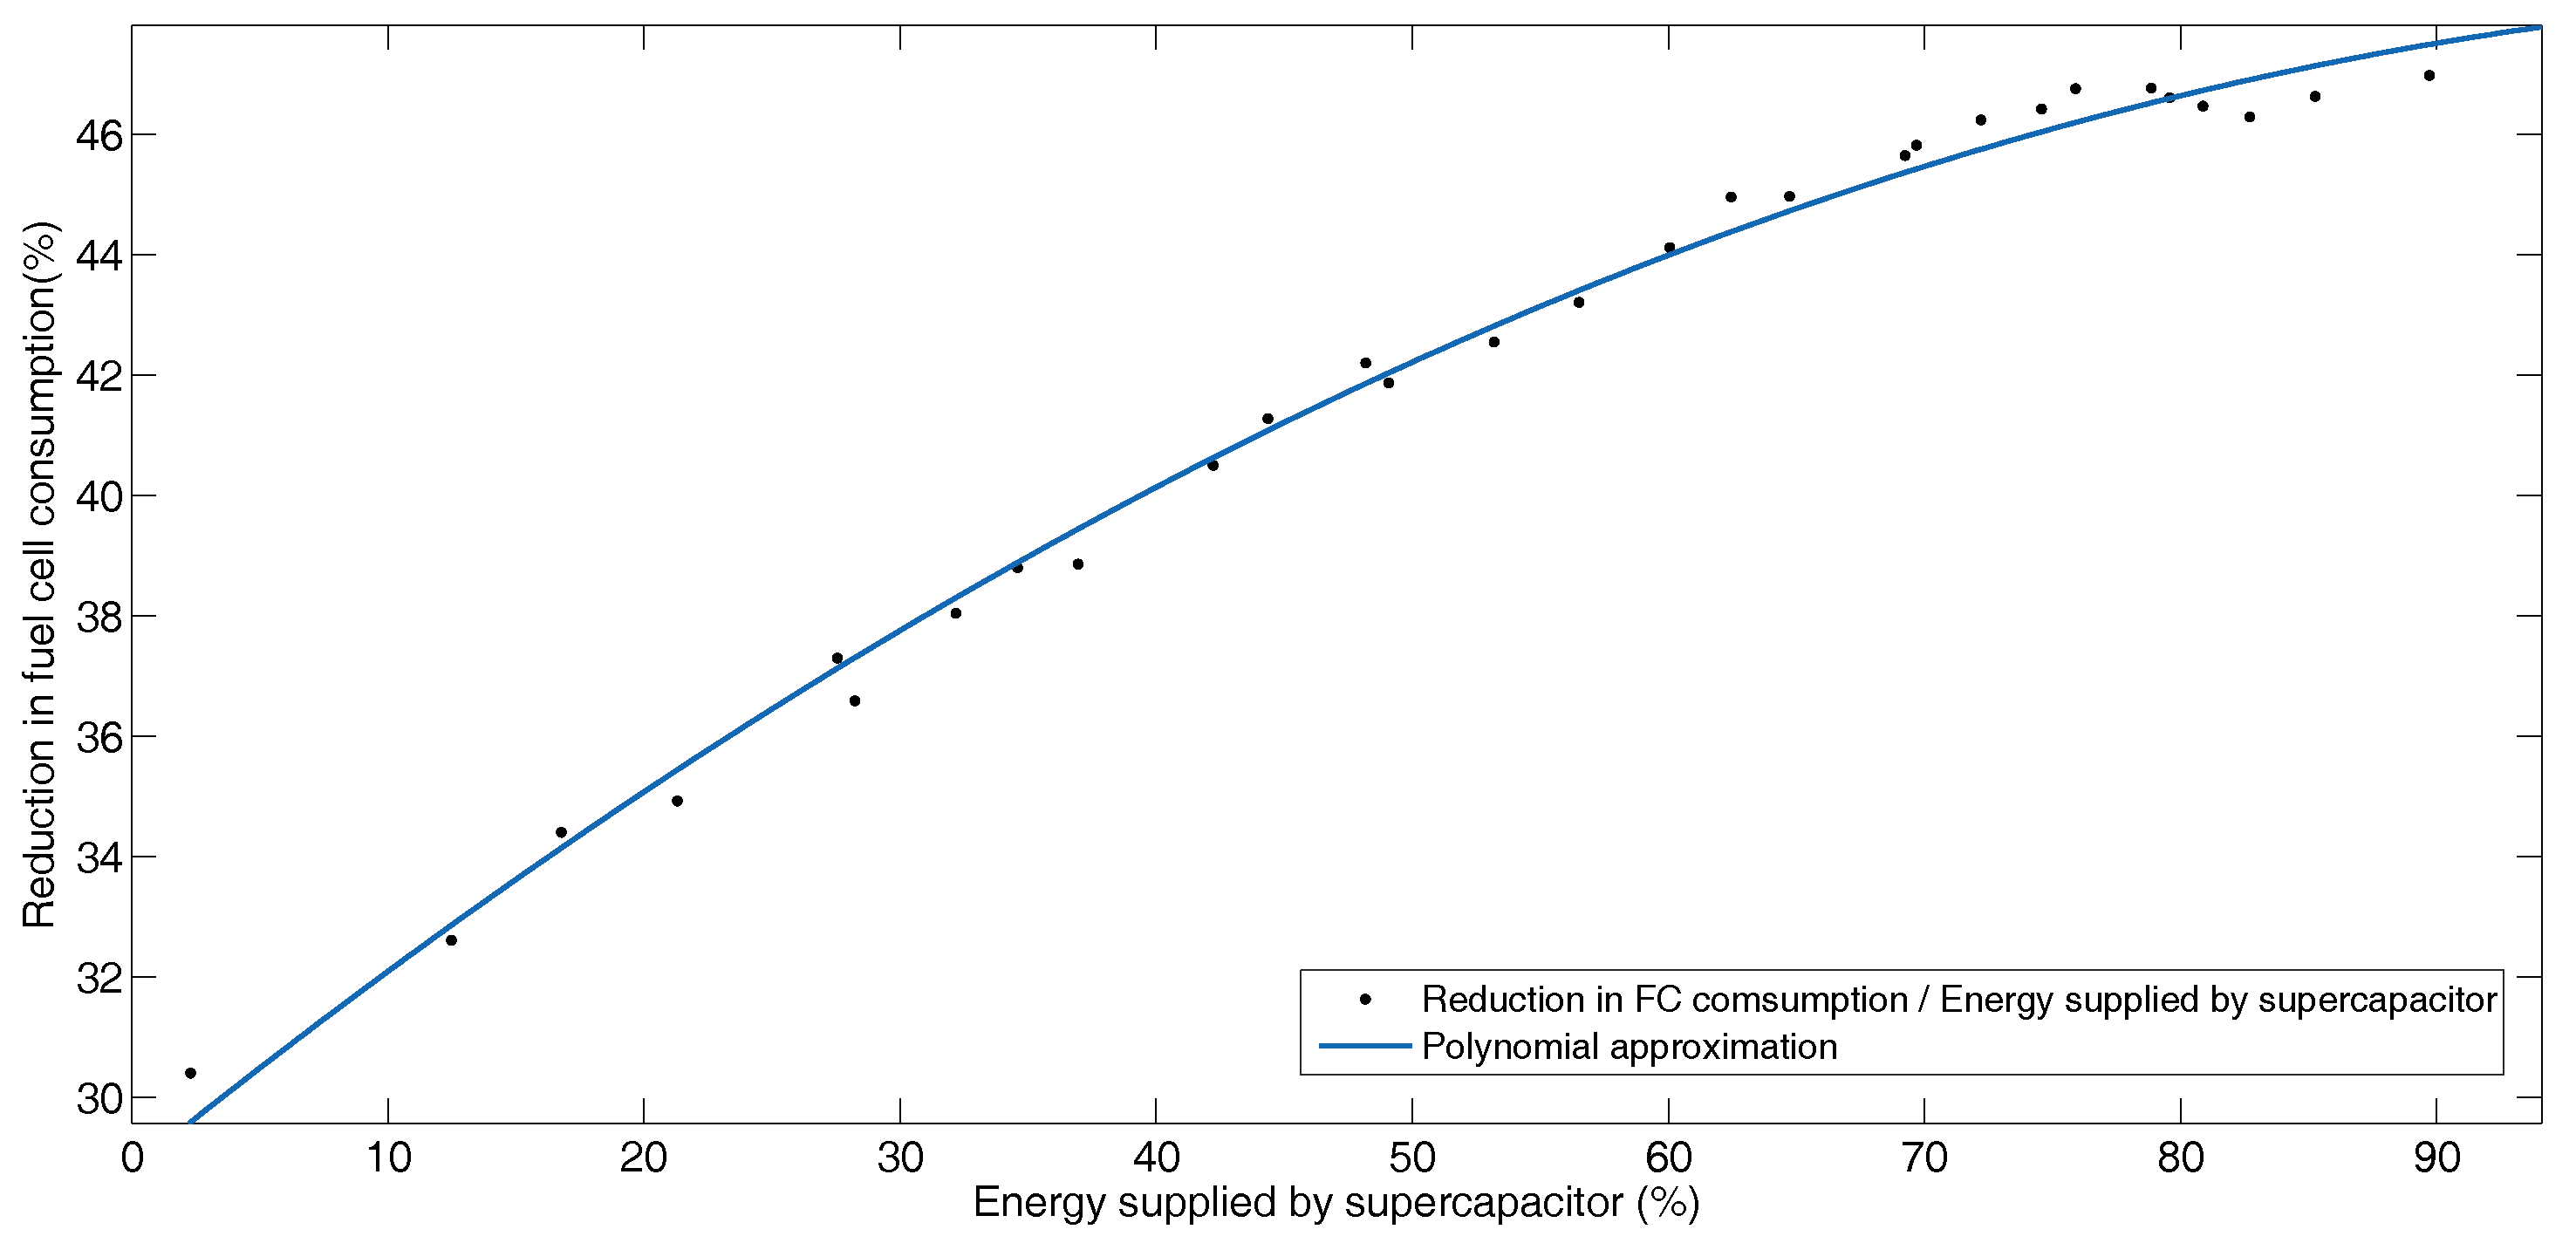
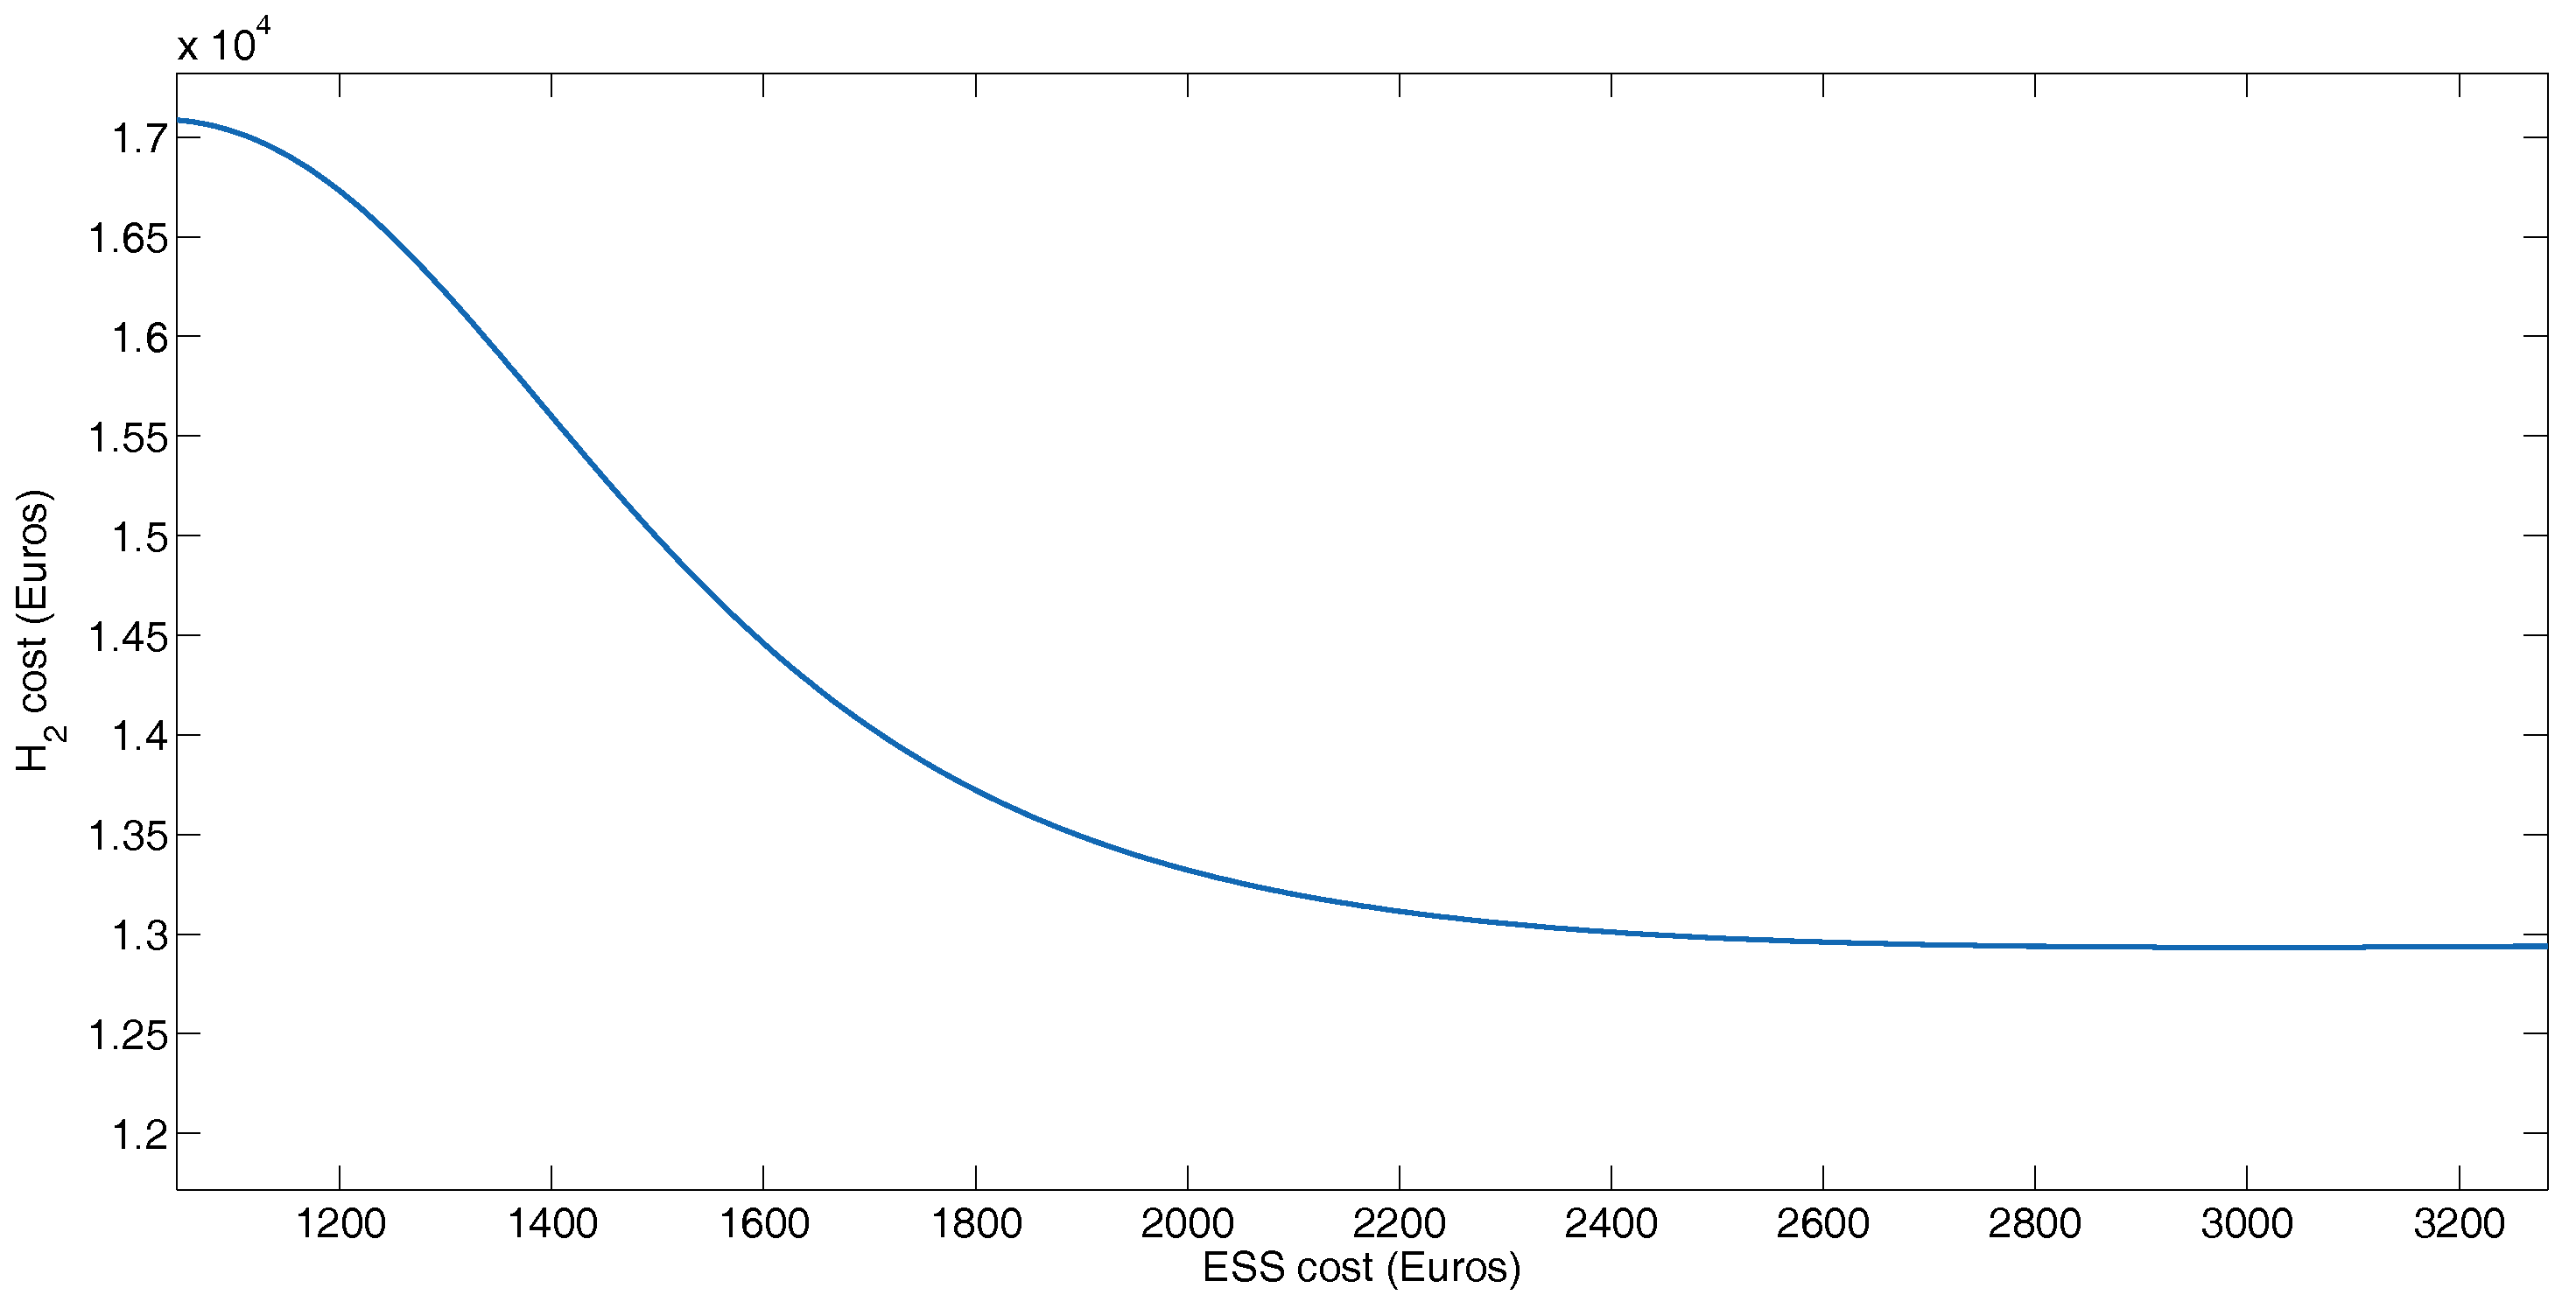
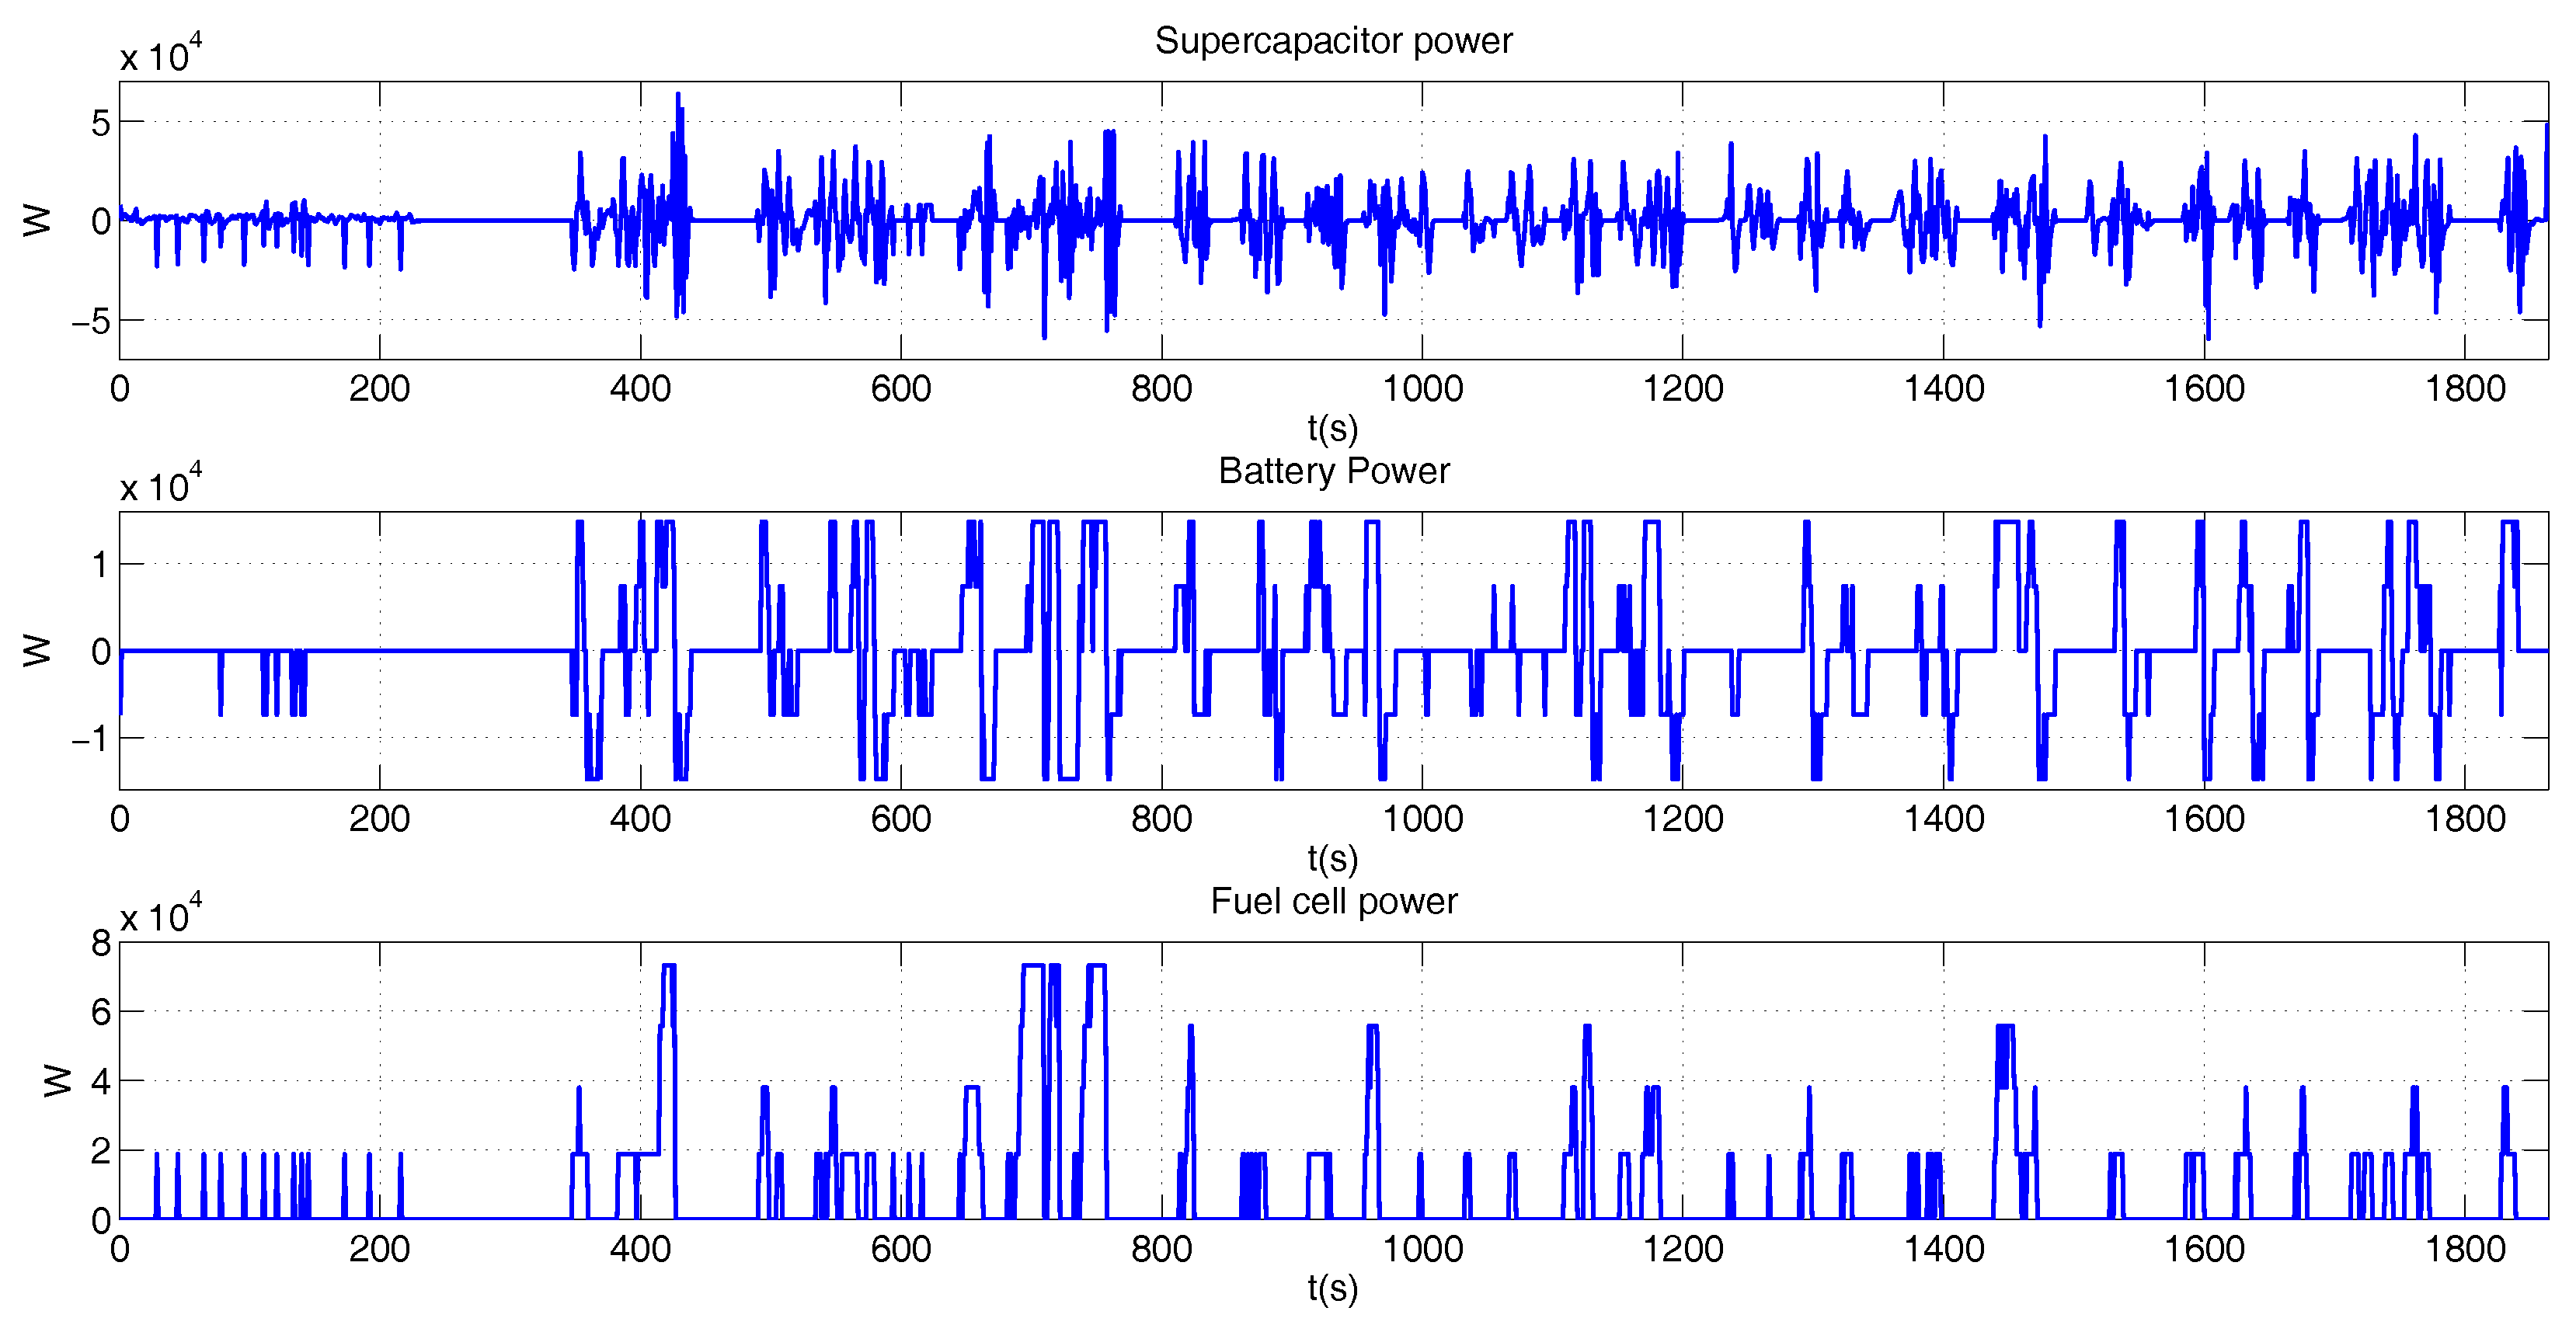
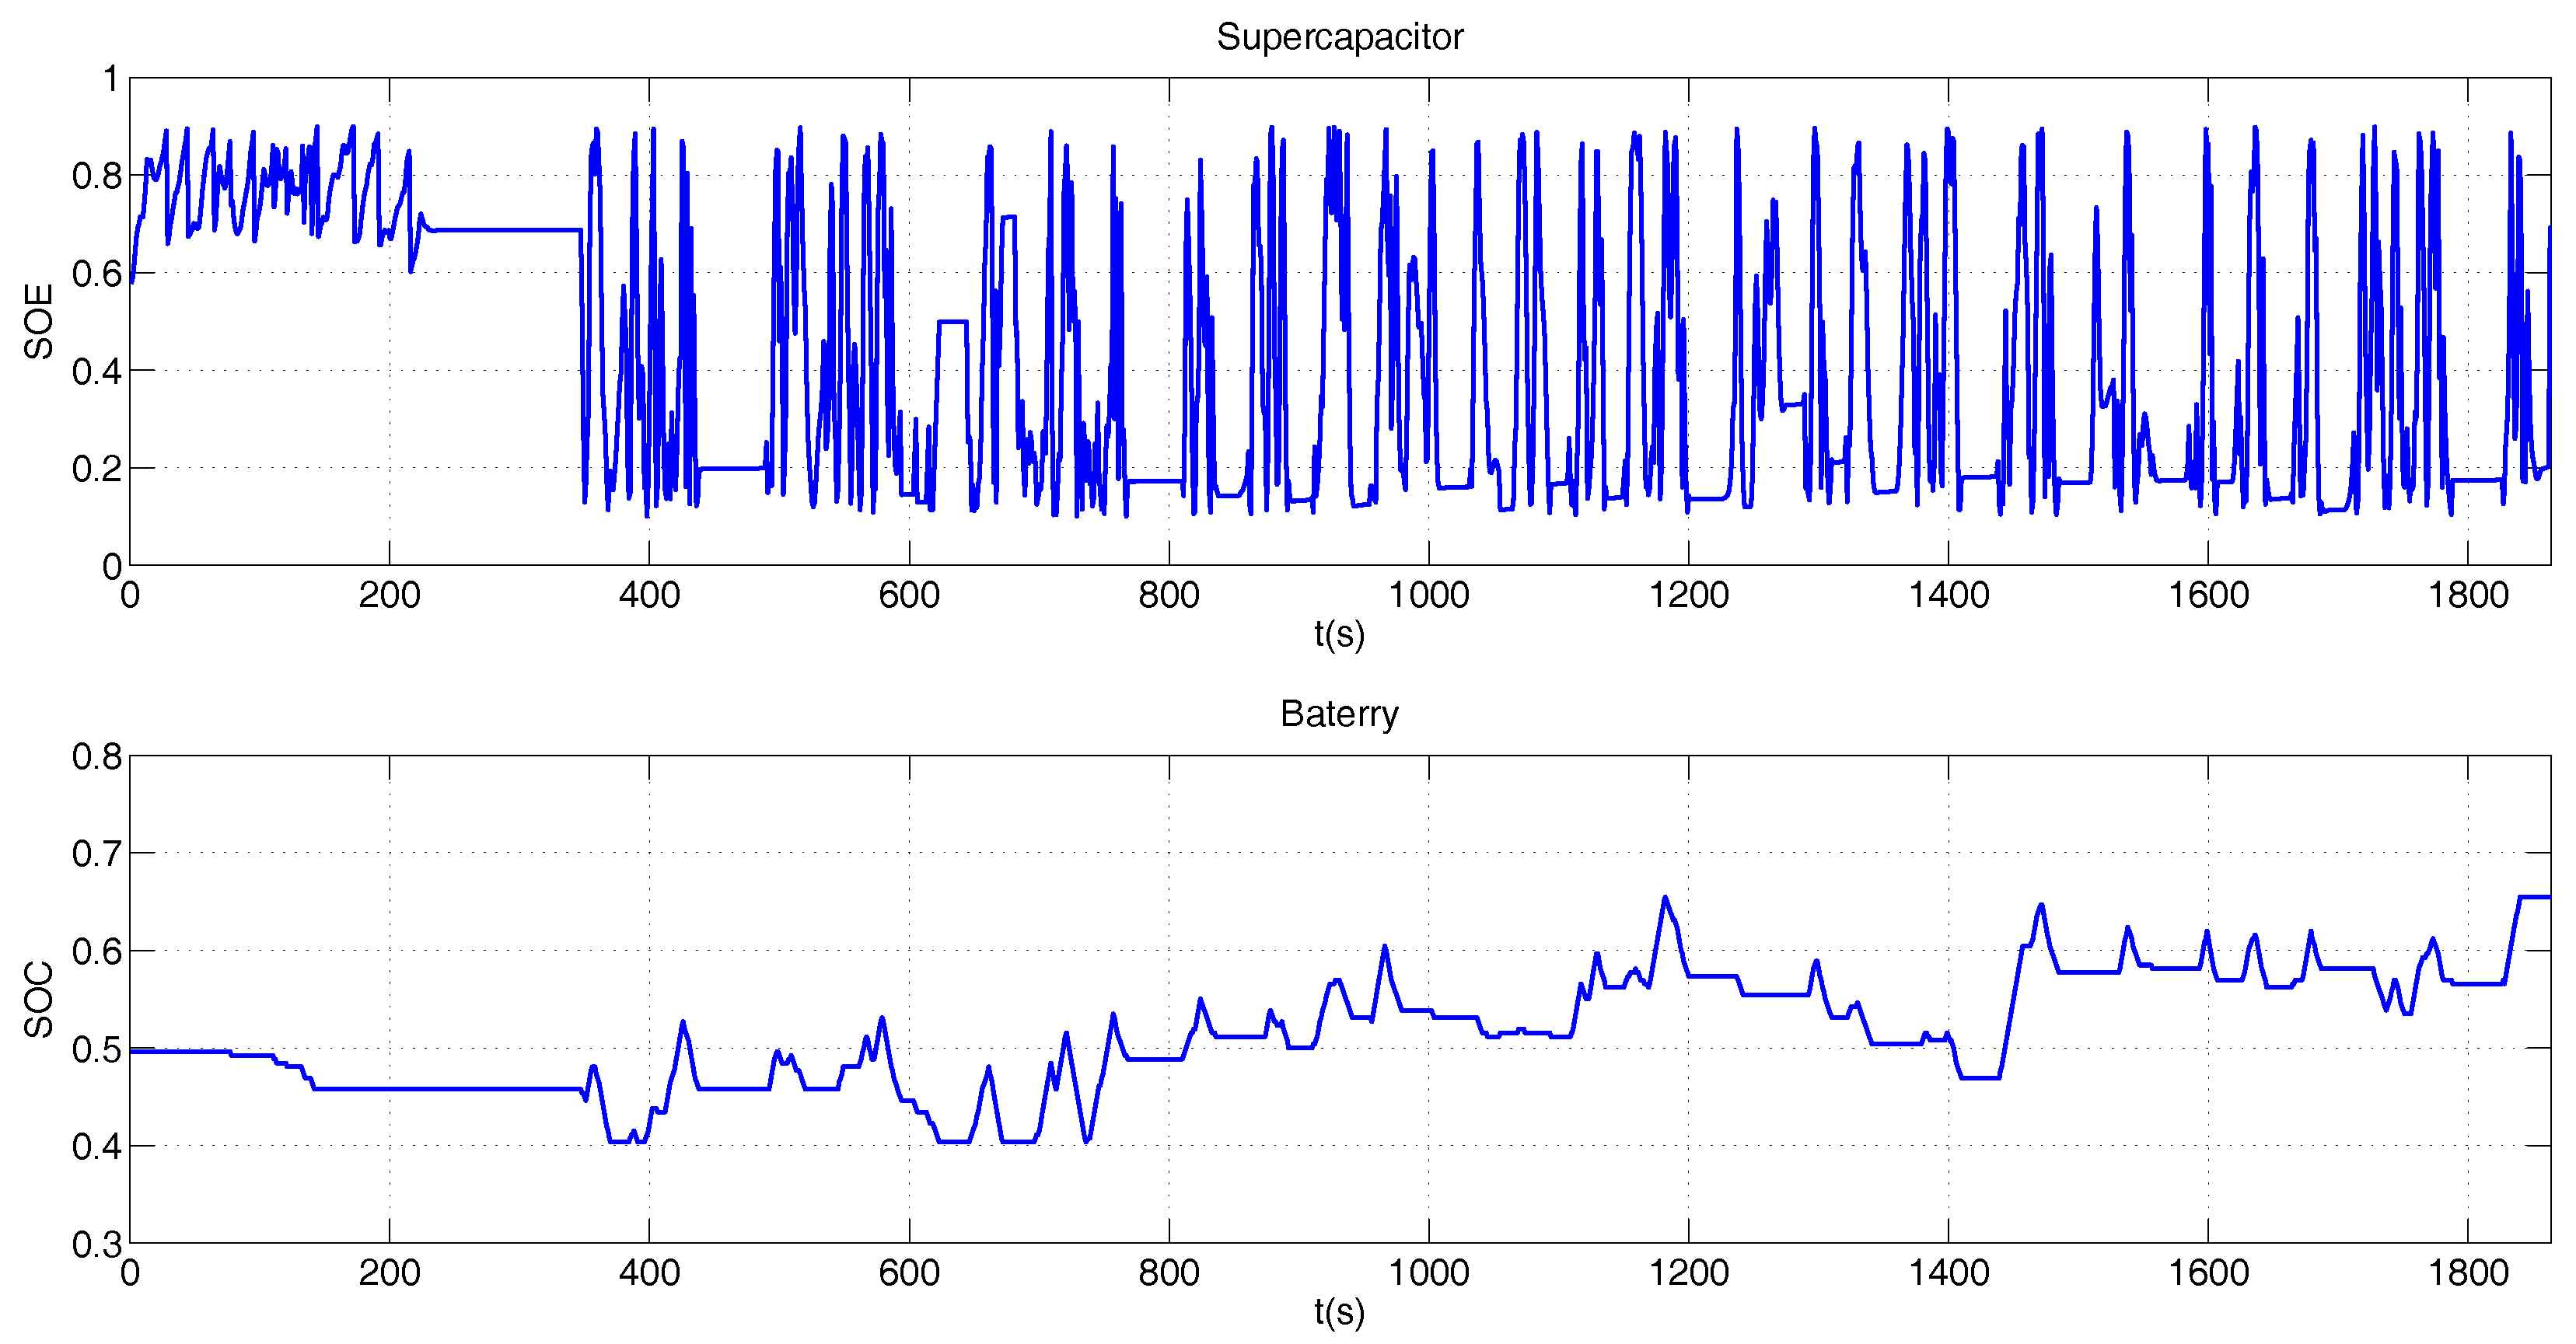
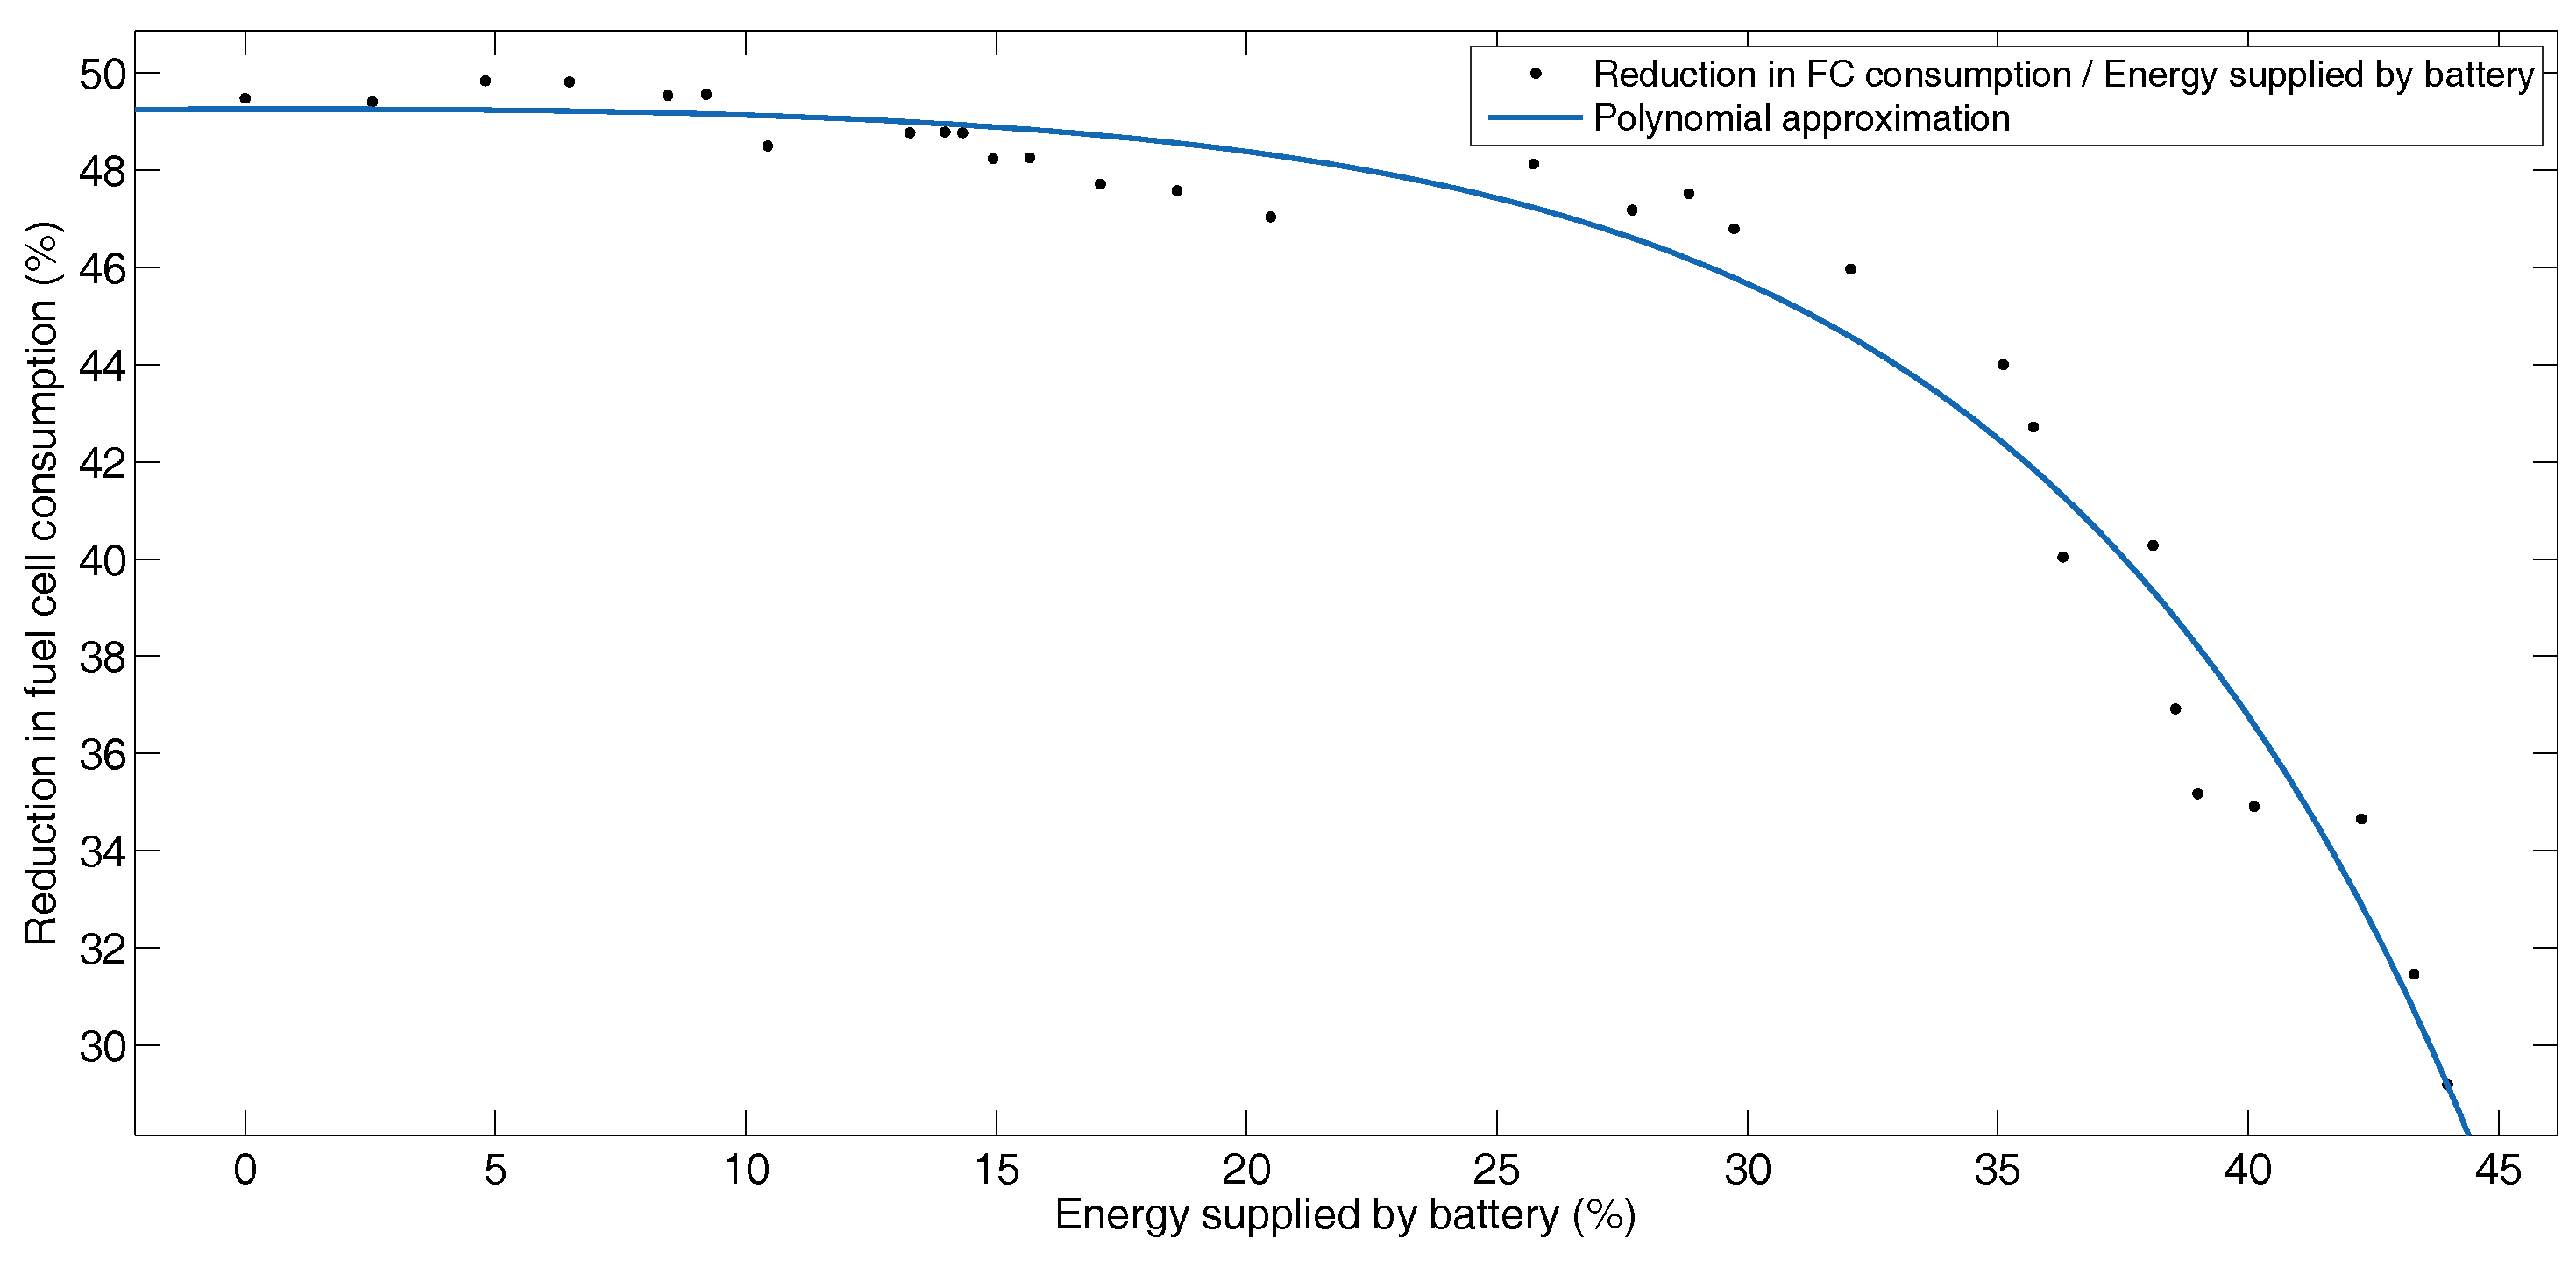
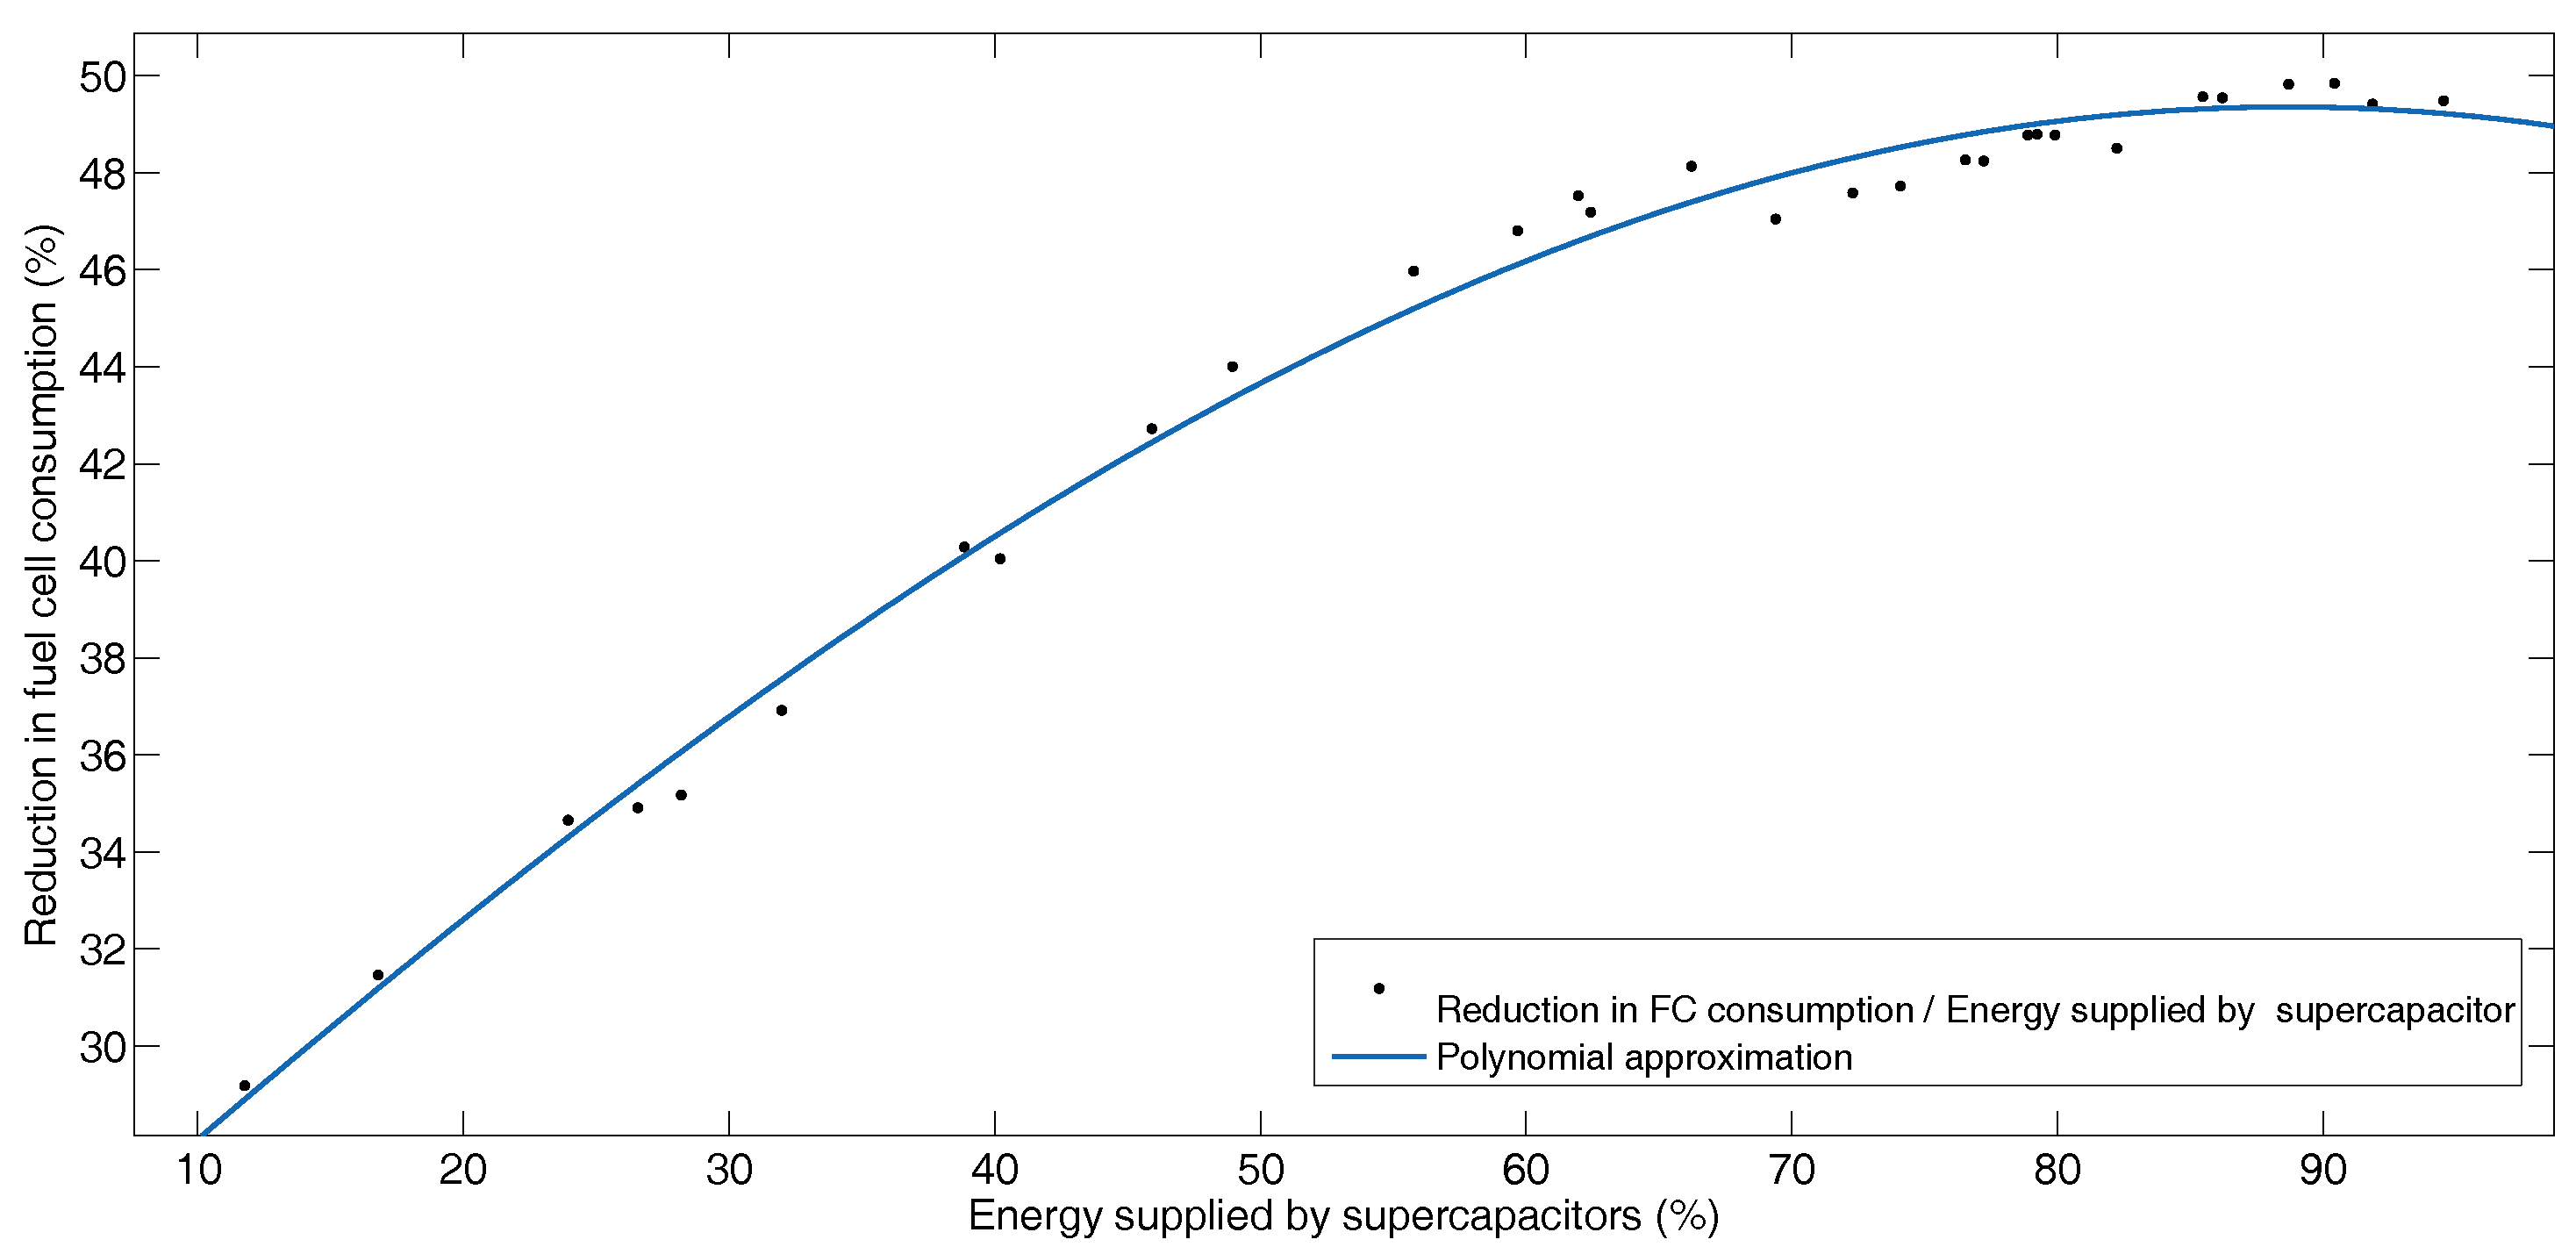
5.2. Hybrid Operation
BADC Driving Profile
5.3. Manhattan Driving Profile
6. Conclusions
Author Contributions
Funding
Conflicts of Interest
Abbreviations
| DP | Dynamic Programing |
| ESS | Energy storage system |
| SC | Supercapacitor |
| FC | Fuel cell |
| Battery power | |
| Supercapacitor power | |
| Fuel cell power | |
| Break power | |
| SOC | Battery state of charge |
| SOH | Battery state of health |
| SOE | Supercapacitor state of energy |
| EV | Electric vehicle |
| HEV | Hybrid electric vehicle |
| BADC | Buenos Aires Driving Cycle |
References
- Jia, S.; Peng, H.; Liu, S.; Zhang, X. Review of Transportation and Energy Consumption Related Research. J. Transp. Syst. Eng. Inf. Technol. 2009, 9, 6–16. [Google Scholar] [CrossRef]
- Mahlia, T.; Saidur, R.; Memon, L.; Zulkifli, N.; Masjuki, H. A review on fuel economy standard for motor vehicles with the implementation possibilities in Malaysia. Renew. Sustain. Energy Rev. 2010, 14, 3092–3099. [Google Scholar] [CrossRef]
- Sciarretta, A.; Guzzella, L. Control of hybrid electric vehicles. IEEE Control Syst. 2007, 27, 60–70. [Google Scholar] [CrossRef]
- Mesbahi, T.; Khenfri, F.; Rizoug, N.; Chaaban, K.; Bartholomeüs, P.; Moigne, P.L. Dynamical modeling of Li-ion batteries for electric vehicle applications based on hybrid Particle Swarm–Nelder–Mead (PSO–NM) optimization algorithm. Electr. Power Syst. Res. 2016, 131, 195–204. [Google Scholar] [CrossRef]
- Hu, X.; Moura, S.J.; Murgovski, N.; Egardt, B.; Cao, D. Integrated Optimization of Battery Sizing, Charging, and Power Management in Plug-In Hybrid Electric Vehicles. IEEE Trans. Control Syst. Technol. 2016, 24, 1036–1043. [Google Scholar] [CrossRef]
- Hoke, A.; Brissette, A.; Smith, K.; Pratt, A.; Maksimovic, D. Accounting for Lithium-Ion Battery Degradation in Electric Vehicle Charging Optimization. IEEE J. Emerg. Sel. Top. Power Electron. 2014, 2, 691–700. [Google Scholar] [CrossRef]
- Redelbach, M.; Özdemir, E.D.; Friedrich, H.E. Optimizing battery sizes of plug-in hybrid and extended range electric vehicles for different user types. Energy Policy 2014, 73, 158–168. [Google Scholar] [CrossRef]
- Sakti, A.; Michalek, J.J.; Fuchs, E.R.; Whitacre, J.F. A techno-economic analysis and optimization of Li-ion batteries for light-duty passenger vehicle electrification. J. Power Sources 2015, 273, 966–980. [Google Scholar] [CrossRef]
- Hemi, H.; Ghouili, J.; Cheriti, A. Combination of Markov chain and optimal control solved by Pontryagin’s Minimum Principle for a fuel cell/supercapacitor vehicle. Energy Convers. Manag. 2015, 91, 387–393. [Google Scholar] [CrossRef]
- Zou, Z.; Cao, J.; Cao, B.; Chen, W. Evaluation strategy of regenerative braking energy for supercapacitor vehicle. ISA Trans. 2015, 55, 234–240. [Google Scholar] [CrossRef] [PubMed]
- Rodatz, P.; Paganelli, G.; Sciarretta, A.; Guzzella, L. Optimal power management of an experimental fuel cell/supercapacitor-powered hybrid vehicle. Control Eng. Pract. 2005, 13, 41–53. [Google Scholar] [CrossRef]
- Ayad, M.; Becherif, M.; Henni, A. Vehicle hybridization with fuel cell, supercapacitors and batteries by sliding mode control. Renew. Energy 2011, 36, 2627–2634. [Google Scholar] [CrossRef]
- Shen, J.; Dusmez, S.; Khaligh, A. Optimization of Sizing and Battery Cycle Life in Battery/Ultracapacitor Hybrid Energy Storage Systems for Electric Vehicle Applications. IEEE Trans. Ind. Inform. 2014, 10, 2112–2121. [Google Scholar] [CrossRef]
- Choi, M.E.; Lee, J.S.; Seo, S.W. Real-Time Optimization for Power Management Systems of a Battery/Supercapacitor Hybrid Energy Storage System in Electric Vehicles. IEEE Trans. Veh. Technol. 2014, 63, 3600–3611. [Google Scholar] [CrossRef]
- Thounthong, P.; Chunkag, V.; Sethakul, P.; Davat, B.; Hinaje, M. Comparative Study of Fuel-Cell Vehicle Hybridization with Battery or Supercapacitor Storage Device. IEEE Trans. Veh. Technol. 2009, 58, 3892–3904. [Google Scholar] [CrossRef]
- Hannan, M.; Azidin, F.; Mohamed, A. Hybrid electric vehicles and their challenges: A review. Renew. Sustain. Energy Rev. 2014, 29, 135–150. [Google Scholar] [CrossRef]
- Hemi, H.; Ghouili, J.; Cheriti, A. A real time fuzzy logic power management strategy for a fuel cell vehicle. Energy Convers. Manag. 2014, 80, 63–70. [Google Scholar] [CrossRef]
- Fotouhi, A.; Yusof, R.; Rahmani, R.; Mekhilef, S.; Shateri, N. A review on the applications of driving data and traffic information for vehicles energy conservation. Renew. Sustain. Energy Rev. 2014, 37, 822–833. [Google Scholar] [CrossRef]
- Hu, X.; Murgovski, N.; Johannesson, L.M.; Egardt, B. Optimal Dimensioning and Power Management of a Fuel Cell; Battery Hybrid Bus via Convex Programming. IEEE/ASME Trans. Mechatron. 2015, 20, 457–468. [Google Scholar] [CrossRef]
- Sharaf, O.Z.; Orhan, M.F. An overview of fuel cell technology: Fundamentals and applications. Renew. Sustain. Energy Rev. 2014, 32, 810–853. [Google Scholar] [CrossRef]
- Fatás, E.; Pérez-Flores, J.C.; Ocón, P. Pilas de combustible: una alternativa limpia de producción de energía. Revista Española de Física 2013, 27, 26–34. [Google Scholar]
- Tie, S.F.; Tan, C.W. A review of energy sources and energy management system in electric vehicles. Renew. Sustain. Energy Rev. 2013, 20, 82–102. [Google Scholar] [CrossRef]
- Ren, G.; Ma, G.; Cong, N. Review of electrical energy storage system for vehicular applications. Renew. Sustain. Energy Rev. 2015, 41, 225–236. [Google Scholar] [CrossRef]
- Gao, L.; Dougal, R.A.; Liu, S. Power enhancement of an actively controlled battery/ultracapacitor hybrid. IEEE Trans. Power Electron. 2005, 20, 236–243. [Google Scholar] [CrossRef]
- Schupbach, R.M.; Balda, J.C.; Zolot, M.; Kramer, B. Design methodology of a combined battery-ultracapacitor energy storage unit for vehicle power management. In Proceedings of the 34th Annual Power Electronics Specialist Conference, Acapulco, Mexico, 15–19 June 2003; Volume 1, pp. 88–93. [Google Scholar] [CrossRef]
- Nielson, G.; Emadi, A. Hybrid energy storage systems for high-performance hybrid electric vehicles. In Proceedings of the 2011 IEEE Vehicle Power and Propulsion Conference, Chicago, IL, USA, 6–9 September 2011; pp. 1–6. [Google Scholar] [CrossRef]
- Qu, X.; Wang, Q.; Yu, Y. Power Demand Analysis and Performance Estimation for Active-Combination Energy Storage System Used in Hybrid Electric Vehicles. IEEE Trans. Veh. Technol. 2014, 63, 3128–3136. [Google Scholar] [CrossRef]
- Chen, Z.; Mi, C.C.; Xu, J.; Gong, X.; You, C. Energy Management for a Power-Split Plug-in Hybrid Electric Vehicle Based on Dynamic Programming and Neural Networks. IEEE Trans. Veh. Technol. 2014, 63, 1567–1580. [Google Scholar] [CrossRef]
- Jeong, J.; Kim, N.; Lim, W.; Park, Y.I.; Cha, S.W.; Jang, M.E. Optimization of power management among an engine, battery and ultra-capacitor for a series HEV: A dynamic programming application. Int. J. Automot. Technol. 2017, 18, 891–900. [Google Scholar] [CrossRef]
- Sabri, M.M.; Danapalasingam, K.; Rahmat, M. A review on hybrid electric vehicles architecture and energy management strategies. Renew. Sustain. Energy Rev. 2016, 53, 1433–1442. [Google Scholar] [CrossRef]
- Wu, G.; Zhang, X.; Dong, Z. Powertrain architectures of electrified vehicles: Review, classification and comparison. J. Frankl. Inst. 2015, 352, 425–448. [Google Scholar] [CrossRef]
- Feroldi, D.; Serra, M.; Riera, J. Energy management strategies based on efficiency map for fuel cell hybrid vehicles. J. Power Sources 2009, 190, 387–401. [Google Scholar] [CrossRef]
- Carignano, M.G.; Adorno, R.; van Dijk, N.; Nieberding, N.; Nigro, N.; Orbaiz, P. Assessment of Energy Management Strategies for a Hybrid Electric Bus. In Proceedings of the 5th International Conference on Engineering Optimization, Iguassu Falls, Brazil, 19–23 June 2016. [Google Scholar]
- Feroldi, D.; Carignano, M. Sizing for fuel cell/supercapacitor hybrid vehicles based on stochastic driving cycles. Appl. Energy 2016, 183, 645–658. [Google Scholar] [CrossRef]
- Aditya, J.P.; Ferdowsi, M. Comparison of NiMH and Li-ion batteries in automotive applications. In Proceedings of the Vehicle Power and Propulsion Conference, Harbin, China, 3–5 September 2008; pp. 1–6. [Google Scholar]
- Parvini, Y.; Siegel, J.B.; Stefanopoulou, A.G.; Vahidi, A. Supercapacitor electrical and thermal modeling, identification, and validation for a wide range of temperature and power applications. IEEE Trans. Ind. Electron. 2016, 63, 1574–1585. [Google Scholar] [CrossRef]
- Hoogers, G. Fuel Cell Technology Handbook; CRC Press: Boca Raton, FL, USA, 2002. [Google Scholar]
- Barbir, F. PEM Fuel Cells: Theory and Practice; Academic Press: Cambridge, MA, USA, 2013. [Google Scholar]
- Zhou, R.; Zheng, Y.; Jaroniec, M.; Qiao, S.Z. Determination of the electron transfer number for the oxygen reduction reaction: from theory to experiment. ACS Catal. 2016, 6, 4720–4728. [Google Scholar] [CrossRef]
- Tzirakis, E.; Pitsas, K.; Zannikos, F.; Stournas, S. Vehicle emissions and driving cycles: comparison of the Athens driving cycle (ADC) with ECE-15 and European driving cycle (EDC). Glob. NEST J. 2006, 8, 282–290. [Google Scholar]
- Bellman, R. Dynamic programming; Dover Publications: Mineola, NY, USA, 2003. [Google Scholar]
- Bertsekas, D.P.; Bertsekas, D.P.; Bertsekas, D.P.; Bertsekas, D.P. Dynamic Programming and Optimal Control; Athena Scientific: Belmont, MA, USA, 1995; Volume 1. [Google Scholar]
- Haifeng, D.; Xuezhe, W.; Zechang, S. A new SOH prediction concept for the power lithium-ion battery used on HEVs. In Proceedings of the Vehicle Power and Propulsion Conference, Dearborn, MI, USA, 7–11 September 2009; pp. 1649–1653. [Google Scholar]
- Zou, C.; Manzie, C.; Nešić, D.; Kallapur, A.G. Multi-time-scale observer design for state-of-charge and state-of-health of a lithium-ion battery. J. Power Sources 2016, 335, 121–130. [Google Scholar] [CrossRef]
- Ouyang, M.; Feng, X.; Han, X.; Lu, L.; Li, Z.; He, X. A dynamic capacity degradation model and its applications considering varying load for a large format Li-ion battery. Appl. Energy 2016, 165, 48–59. [Google Scholar] [CrossRef]
- Wang, J.; Liu, P.; Hicks-Garner, J.; Sherman, E.; Soukiazian, S.; Verbrugge, M.; Tataria, H.; Musser, J.; Finamore, P. Cycle-life model for graphite-LiFePO4 cells. J. Power Sources 2011, 196, 3942–3948. [Google Scholar] [CrossRef]
- Hu, X.; Johannesson, L.; Murgovski, N.; Egardt, B. Longevity-conscious dimensioning and power management of the hybrid energy storage system in a fuel cell hybrid electric bus. Appl. Energy 2015, 137, 913–924. [Google Scholar] [CrossRef]
- Johannesson, L.; Murgovski, N.; Ebbesen, S.; Egardt, B.; Gelso, E.; Hellgren, J. Including a battery state of health model in the HEV component sizing and optimal control problem. IFAC Proc. Vol. 2013, 46, 398–403. [Google Scholar] [CrossRef]
- Ebbesen, S.; Elbert, P.; Guzzella, L. Battery State-of-Health Perceptive Energy Management for Hybrid Electric Vehicles. IEEE Trans. Veh. Technol. 2012, 61, 2893–2900. [Google Scholar] [CrossRef]
- Das, V.; Padmanaban, S.; Venkitusamy, K.; Selvamuthukumaran, R.; Blaabjerg, F.; Siano, P. Recent advances and challenges of fuel cell based power system architectures and control—A review. Renew. Sustain. Energy Rev. 2017, 73, 10–18. [Google Scholar] [CrossRef]
- Dicks, A.; Rand, D.A.J. Fuel Cell Systems Explained; Wiley Online Library: Hoboken, NJ, USA, 2018. [Google Scholar]
- Kongkanand, A.; Mathias, M.F. The priority and challenge of high-power performance of low-platinum proton-exchange membrane fuel cells. J. Phys. Chem. Lett. 2016, 7, 1127–1137. [Google Scholar] [CrossRef] [PubMed]
- Li, L.; You, S.; Yang, C.; Yan, B.; Song, J.; Chen, Z. Driving-behavior-aware stochastic model predictive control for plug-in hybrid electric buses. Appl. Energy 2016, 162, 868–879. [Google Scholar] [CrossRef]
- Song, Z.; Hofmann, H.; Li, J.; Hou, J.; Han, X.; Ouyang, M. Energy management strategies comparison for electric vehicles with hybrid energy storage system. Appl. Energy 2014, 134, 321–331. [Google Scholar] [CrossRef]
- Sockeel, N.; Shi, J.; Shahverdi, M.; Mazzola, M. Pareto Front Analysis of the Objective Function in Model Predictive Control Based Power Management System of a Plug-in Hybrid Electric Vehicle. In Proceedings of the 2018 IEEE Transportation Electrification Conference and Expo (ITEC), Long Beach, CA, USA, 13–15 June 2018; pp. 1–6. [Google Scholar]
- Sockeel, N.; Shi, J.; Shahverdi, M.; Mazzola, M. Sensitivity Analysis of the Battery Model for Model Predictive Control: Implementable to a Plug-In Hybrid Electric Vehicle. World Electr. Veh. J. 2018, 9, 45. [Google Scholar] [CrossRef]


| Name | Symbol | Value | Unit |
|---|---|---|---|
| Air density | p | 1.2 | kg/m |
| Coefficient of resistance to movement | 0.008 | s/u | |
| Coefficient of resistance to movement | 0.00012 | s/m | |
| Aerodynamic coefficient | 0.65 | s/u | |
| Front area | s | 8.06 | m |
| Total mass | m | 14,000 | kg |
| Gravity | g | 9.8 | m/s |
| Parameter | Data |
|---|---|
| Manufacturer | PEVE |
| Shape | Prismatic |
| Case | Plastic |
| Cell capacity (Ah) | 6.5 |
| Cell voltage (V) | 7.2 |
| Specific energy (Wh/kg) | 46 |
| Specific power (W/kg) | 1300 |
| Mass (kg) | 1.04 |
| Operation temperature (°C) | −20 to 50 |
| Cost (€/kg) | 33.88 |
| Parameter | Data |
|---|---|
| Manufacturer | Maxwell Technologies |
| Packaging | Bulk |
| Cell capacitance (F) | 3000 |
| Rated Voltage (V) | 125 |
| Temperature (°C) | −40 to 65 |
| Mass (kg) | 1.3 |
| Specific power (W/Kg) | 1700 |
| Specific energy (Wh/Kg) | 2.3 |
| 1 | |
| 0 | |
| Cost (€/Kg) | 88.34 |
| Parameter | Data |
|---|---|
| Maximum voltage | 580 V |
| Maximum current | 288 A |
| Number of cells | 560 |
| Operating temperature | 330 K |
| Nominal air pressure | 2.24 bar |
| Maximum power | 100 kW |
| Mass | 285 kg |
| Temperature of reference | 298 K |
| Temperature constant | 44.43 |
| Cost | 100 k€ |
| Parameter | Value |
|---|---|
| Total cycle time | 1864 s |
| Average Speed | 3.92 m/s |
| Maximum speed | 15.6 m/s |
| Maximum acceleration | 9.2155 × 10 m/s |
| 22,678.62 kJ | |
| 11,870.63 kJ |
| Parameter | Value |
|---|---|
| Total cycle time | 1089 s |
| Average Speed | 3.033 m/s |
| Maximum speed | 11.24 m/s |
| Maximum acceleration | 2.044 m/ |
| 13,747.04 kJ | |
| 8090.08 kJ |
| Component | Mass | Power | Energy |
|---|---|---|---|
| Battery | 8 kg | 10.4 kW | 368 Wh |
| Supercapacitor | 12 kg | 20.4 kW | 27.6 Wh |
| Weights | Energy | ||||||
|---|---|---|---|---|---|---|---|
| Battery (%) | Supercapacitor (%) | Fuel cell (%) | |||||
| 0 | 0.33 | 0.33 | 0.33 | 0 | 13.24 | 23.84 | 19.41 |
| 0.05 | 0.3 | 0.3 | 0.3 | 0.05 | 16.79 | 27.74 | 23.31 |
| 0.1 | 0.267 | 0.267 | 0.267 | 0.1 | 18.00 | 29.35 | 24.78 |
| 0.15 | 0.23 | 0.23 | 0.23 | 0.15 | 18.76 | 29.48 | 25.25 |
| 0.2 | 0.2 | 0.2 | 0.2 | 0.2 | 18.99 | 29.57 | 25.32 |
| 0.25 | 0.167 | 0.167 | 0.167 | 0.25 | 19.68 | 29.80 | 25.73 |
| 0.3 | 0.13 | 0.13 | 0.13 | 0.3 | 19.96 | 30.15 | 26.22 |
| 0.35 | 0.1 | 0.1 | 0.1 | 0.35 | 20.96 | 30.19 | 26.72 |
| 0.4 | 0.067 | 0.067 | 0.067 | 0.4 | 21.71 | 30.84 | 27.22 |
| Weights | Energy | ||||||
|---|---|---|---|---|---|---|---|
| Battery (%) | Supercapacitor (%) | Fuel cell (%) | |||||
| 0 | 0.33 | 0.33 | 0.33 | 0 | 11.02 | 25.66 | 19.57 |
| 0.05 | 0.3 | 0.3 | 0.3 | 0.05 | 13.20 | 25.89 | 20.33 |
| 0.1 | 0.267 | 0.267 | 0.267 | 0.1 | 14.52 | 26.36 | 21.16 |
| 0.15 | 0.23 | 0.23 | 0.23 | 0.15 | 15.51 | 27.89 | 22.73 |
| 0.2 | 0.2 | 0.2 | 0.2 | 0.2 | 15.84 | 28.08 | 23.56 |
| 0.25 | 0.167 | 0.167 | 0.167 | 0.25 | 16.43 | 28.47 | 23.76 |
| 0.3 | 0.13 | 0.13 | 0.13 | 0.3 | 17.21 | 28.83 | 24.38 |
| 0.35 | 0.1 | 0.1 | 0.1 | 0.35 | 18.15 | 29.23 | 24.58 |
| 0.4 | 0.067 | 0.067 | 0.067 | 0.4 | 21.29 | 30.72 | 25.19 |
© 2019 by the authors. Licensee MDPI, Basel, Switzerland. This article is an open access article distributed under the terms and conditions of the Creative Commons Attribution (CC BY) license (http://creativecommons.org/licenses/by/4.0/).
Share and Cite
Sampietro, J.L.; Puig, V.; Costa-Castelló, R. Optimal Sizing of Storage Elements for a Vehicle Based on Fuel Cells, Supercapacitors, and Batteries. Energies 2019, 12, 925. https://doi.org/10.3390/en12050925
Sampietro JL, Puig V, Costa-Castelló R. Optimal Sizing of Storage Elements for a Vehicle Based on Fuel Cells, Supercapacitors, and Batteries. Energies. 2019; 12(5):925. https://doi.org/10.3390/en12050925
Chicago/Turabian StyleSampietro, José Luis, Vicenç Puig, and Ramon Costa-Castelló. 2019. "Optimal Sizing of Storage Elements for a Vehicle Based on Fuel Cells, Supercapacitors, and Batteries" Energies 12, no. 5: 925. https://doi.org/10.3390/en12050925
APA StyleSampietro, J. L., Puig, V., & Costa-Castelló, R. (2019). Optimal Sizing of Storage Elements for a Vehicle Based on Fuel Cells, Supercapacitors, and Batteries. Energies, 12(5), 925. https://doi.org/10.3390/en12050925