Article

Simulation of Thermal Behaviour of a Lithium Titanate Oxide Battery

Department of Energy Technology, Aalborg University, DK-9220 Aalborg, Denmark
*
Author to whom correspondence should be addressed.
Energies 2019, 12(4), 679; https://doi.org/10.3390/en12040679
Submission received: 29 January 2019 / Revised: 13 February 2019 / Accepted: 15 February 2019 / Published: 20 February 2019
(This article belongs to the Special Issue Energy Storage and Management for Electric Vehicles)

Abstract

:
One of the reasonable possibilities to investigate the battery behaviour under various temperature and current conditions is the development of a model of the lithium-ion batteries and then by employing the simulation technique to anticipate their behaviour. This method not only can save time but also they can predict the behaviour of the batteries through simulation. In this investigation, a three-dimensional model is developed to simulate thermal and electrochemical behaviour of a 13Ah lithium-ion battery. In addition, the temperature dependency of the battery cell parameters was considered in the model in order to investigate the influence of temperature on various parameters such as heat generation during battery cell operation. Maccor automated test system and isothermal battery calorimeter were used as experimental setup to validate the thermal model, which was able to predict the heat generation rate and temperature at different positions of the battery. The three-dimensional temperature distributions which were achieved from the modelling and experiment were in well agreement with each other throughout the entire of discharge cycling at different environmental temperatures and discharge rates.

1. Introduction

Lithium-ion batteries are one of the most developing categories of batteries on the market these days because of their high energy density and capacity. A large amount of energy is stored inside them and they have great sensitivity to the operating conditions. Therefore, safety is an important issue in lithium-ion batteries. In addition, demands on safety of these batteries is increasing with their utilization in more applications.
With the intention of reaching out to safety requirements of the lithium-ion batteries on electronic device applications, researchers are resuming to do supplementary investigations on the essential issues in relation to the lithium-ion batteries.
System safety, cycle life, and cell performance are influenced by temperature distribution in the cell. Consecutively, it depends on heat dissipation rate at surface of the cell and heat generation rate within the cell.
Although lithium-ion batteries are susceptible to extreme heat load under severe or abnormal functional conditions, thermal management has been one of the considerable issues in developing lithium-ion batteries in hybrid electric vehicle and battery system applications.
A pseudo 2D electrochemical model for modelling electrochemical systems subject to realistic automotive operation situations was proposed [1]. The model was developed for a lithium ion battery. It consists of complicated electrochemical phenomena, which were generally eliminated in online battery performance forecasters such as over potentials owing to mass transport restrictions and the full current-over potential relation and variable double layer capacitance. The model was able to simulate battery cell behaviour under dynamic procedures [1].
Electrochemical characteristics of layered transition metal oxide cathode materials for lithium ion batteries were investigated by considering different parameters such as thermal properties, surface, and bulk behaviour [2].
The electrochemical behaviour of vapour grown carbon nanofibers was optimized for lithium-ion batteries by hydrothermal and thermal treatments and impregnation [3]. It was concluded that the surface of the untreated carbon nanofibers experiences an aging process during the earliest cycles [3].
In recent years, research on lithium-ion batteries heat loss has become very popular. However, most of the previous studies did not quantify the reversible and irreversible heat sources in lithium-ion batteries. A simple transformation of coordinates was proposed which simplifies the efficient simulation of the non-isothermal lithium-ion pseudo 2D battery cell model [4].
Model reformulation and efficient simulation of two-dimensional electrochemical thermal behaviour of lithium-ion batteries were investigated [5]. The two dimensional battery model was presented and developed by using Chebyshev-based orthogonal collocation. It was concluded that great changes in internal variables could appear, even under approximately mild situations [5].
A coupled continuum formulation for the mechanical processes—thermal, chemical, and electrostatic—in battery materials was proposed [6]. The main improvement was to model the evolution of porosity because of strains, which was induced by mechanical stresses, thermal expansion, and intercalation [6].
A mathematical model was developed to anticipate the time dependent behaviour of a cell [7]. It was concluded that the reaction current was concentrated neighbouring the terminals at the start of the discharging process, continuously became more homogeneous over the electrode surface, and developed into a concentrated situation underneath the electrode neighbouring the ending of the discharge process [7].
A 1D model appertaining to electrochemical and physical processes of a lithium ion cell was employed to explain hybrid pulse power characterization and constant current data from a battery cell [8]. It was designed for hybrid electric vehicle utilization. It was concluded that depending on battery cell operating situation and design, the end of discharge pulse might be attributable to positive electrode solid phase Li saturation, electrolyte phase Li discharge, or negative electrode solid phase Li discharge [8].
Electrodes modelling was accomplished for three different battery cell geometries to investigate the influence of the positioning of current collecting tabs and the aspect ratio of the electrodes on the discharge behaviours of the battery [9]. In addition, with the intention of predicting the thermal behaviour of the lithium-polymer battery cell the heat generation rate as a function of the location on the electrodes and discharge time was determined. The modelling outcomes were compared with the experimental discharge curves at different discharge rates [9]. It was concluded that that the parameters, which were adjusted for the electrodes of one geometry, could be used for the electrodes of other geometries. It should be noted that to accomplish this the manufacturing processes, compositions, and materials of the electrodes should be the same [9].
Four distinct battery cell designs were investigated to appraise the effects of cell stack aspect ratio, size, and tab configuration for similar electrode-level designs [10]. The model outcomes demonstrated that the internal battery cell kinetics is considerably affected by the macroscopic battery cell design for heat transport and electrical current [10].
The current density and potential distribution on the electrodes of a lithium-polymer battery were investigated by employing the finite element procedure [11]. The outcomes demonstrated that the placing and size of current collecting tabs and the aspect ratio of the electrodes have a considerable impact on the current density and potential distribution on the electrodes to affect the SOC distribution on the electrodes, hence influencing the homogeneous usage of the active material of electrodes [11].
A procedure was designed for dependency modelling of the discharge behaviour of a lithium-ion battery cell on the environmental temperature [12]. The two-dimensional modelling of the potential was validated by the modelling outcomes. The heat generation rates as a function of the position on the electrodes and the discharge time were determined in order to anticipate the temperature distributions of the lithium-ion battery [12]. This was according to the modelling outcomes of current density and the potential distributions. The temperature distributions, which were achieved from experimental measurements, were in good agreement with the modelling [12].
A battery cell model, which is flexible to investigate the thermal, electrochemical, physical phenomena, and advance over extensive length scales in battery cell systems of different assemblies, is necessary.
Unfortunately, thermal parameter measurement explanations and electrical parameters determination for lithium-ion batteries were not conveniently found in the literature. Many researchers commonly address the thermal parameters without reporting measurement procedures. A detailed description of thermal parameter measurement is reported in this investigation. Notwithstanding, to the author’s best knowledge, only very few publications [13,14,15] are available in the literature that discuss the thermal simulation of lithium-ion batteries by considering all of the influential parameters such as thermal, electrical, and chemical processes on the thermal behaviour of the lithium-ion batteries. In addition, most of the previous studies did not take into account all of the electrochemical phenomena. In this investigation, the Multi-Scale Multi-Dimensional (MSMD) battery module was used for a lithium titanate oxide battery, which to the author´s best knowledge, it has not been done yet. The investigated model is able to determine the surface temperature distribution of the battery cell at various operating conditions with high accuracy.

2. The Battery Modelling
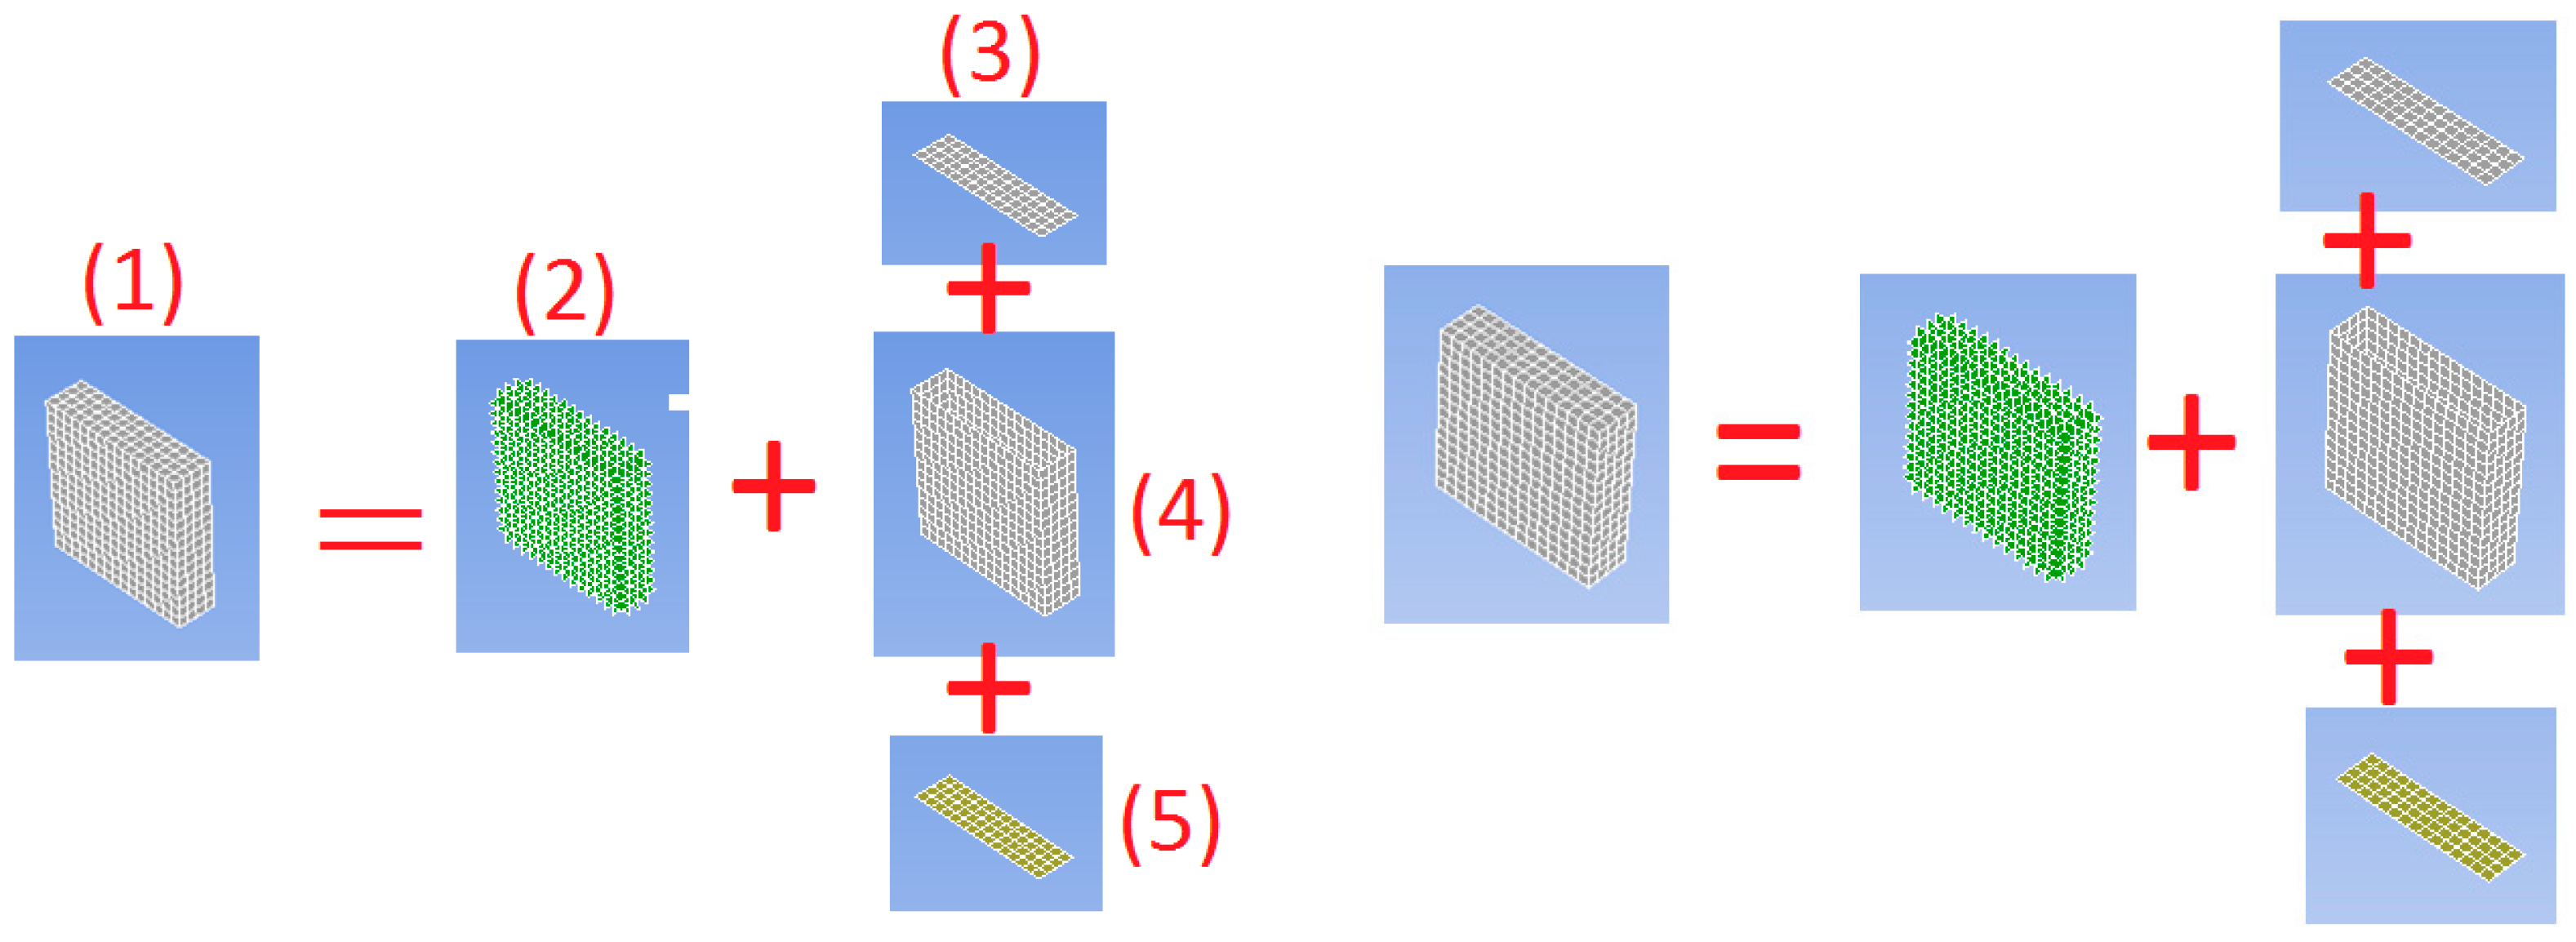
A 13 Ah pouch type commercial lithium-ion battery cell with dimensions of 204 mm width, 129 mm length, and 7.7 mm thickness and a lithium titanate oxide based anode was modelled for all simulations. The picture of the battery cell inside fixture, which was chosen for this investigation, is illustrated in Figure 1.
In accordance with the construction and geometry of the battery cell, a three-dimensional model was constructed in ANSYS (2018) and the battery geometry was generated and analysed in an appropriate manner for additional analysis. Different components of positive and negative current tabs are illustrated in Figure 2. The negative tab and positive tab are used to accumulate the current flow via the battery cell. As shown in the figure five parts comprise the model:
(1)
Positive current tab meshing structure;
(2)
Interior part of positive current tab;
(3)
Positive current tab;
(4)
Skin of positive current tab;
(5)
Contact region of positive current tab.
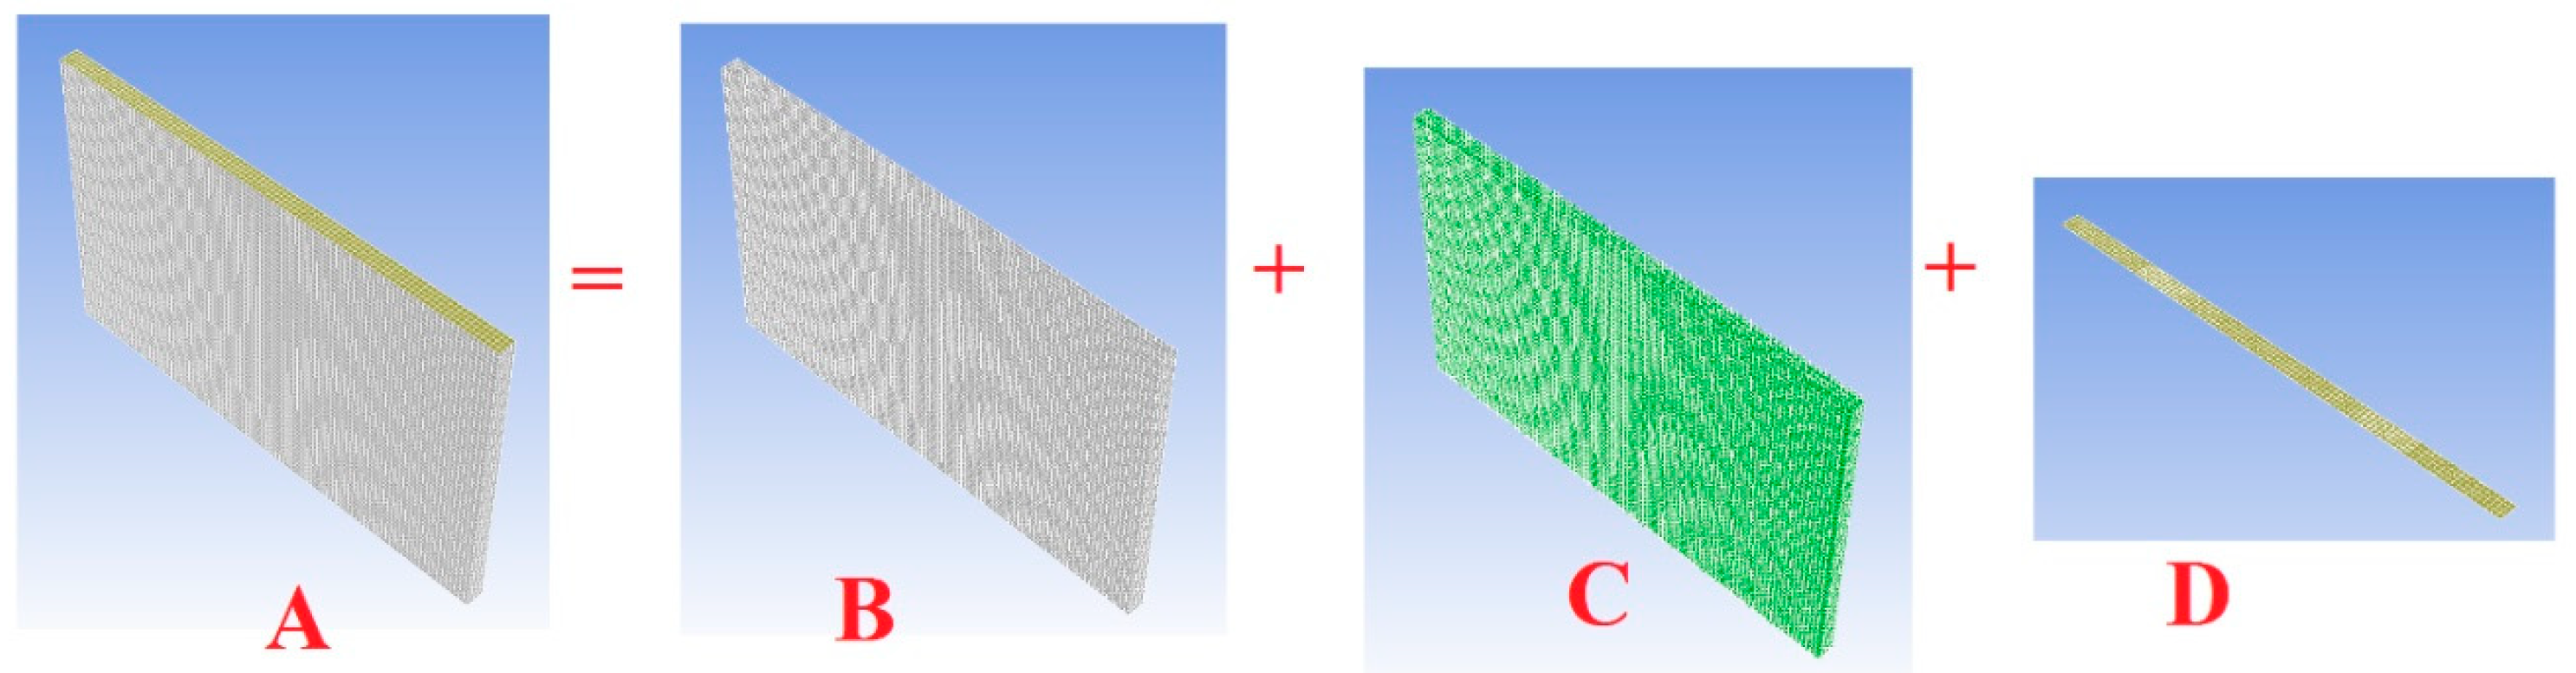
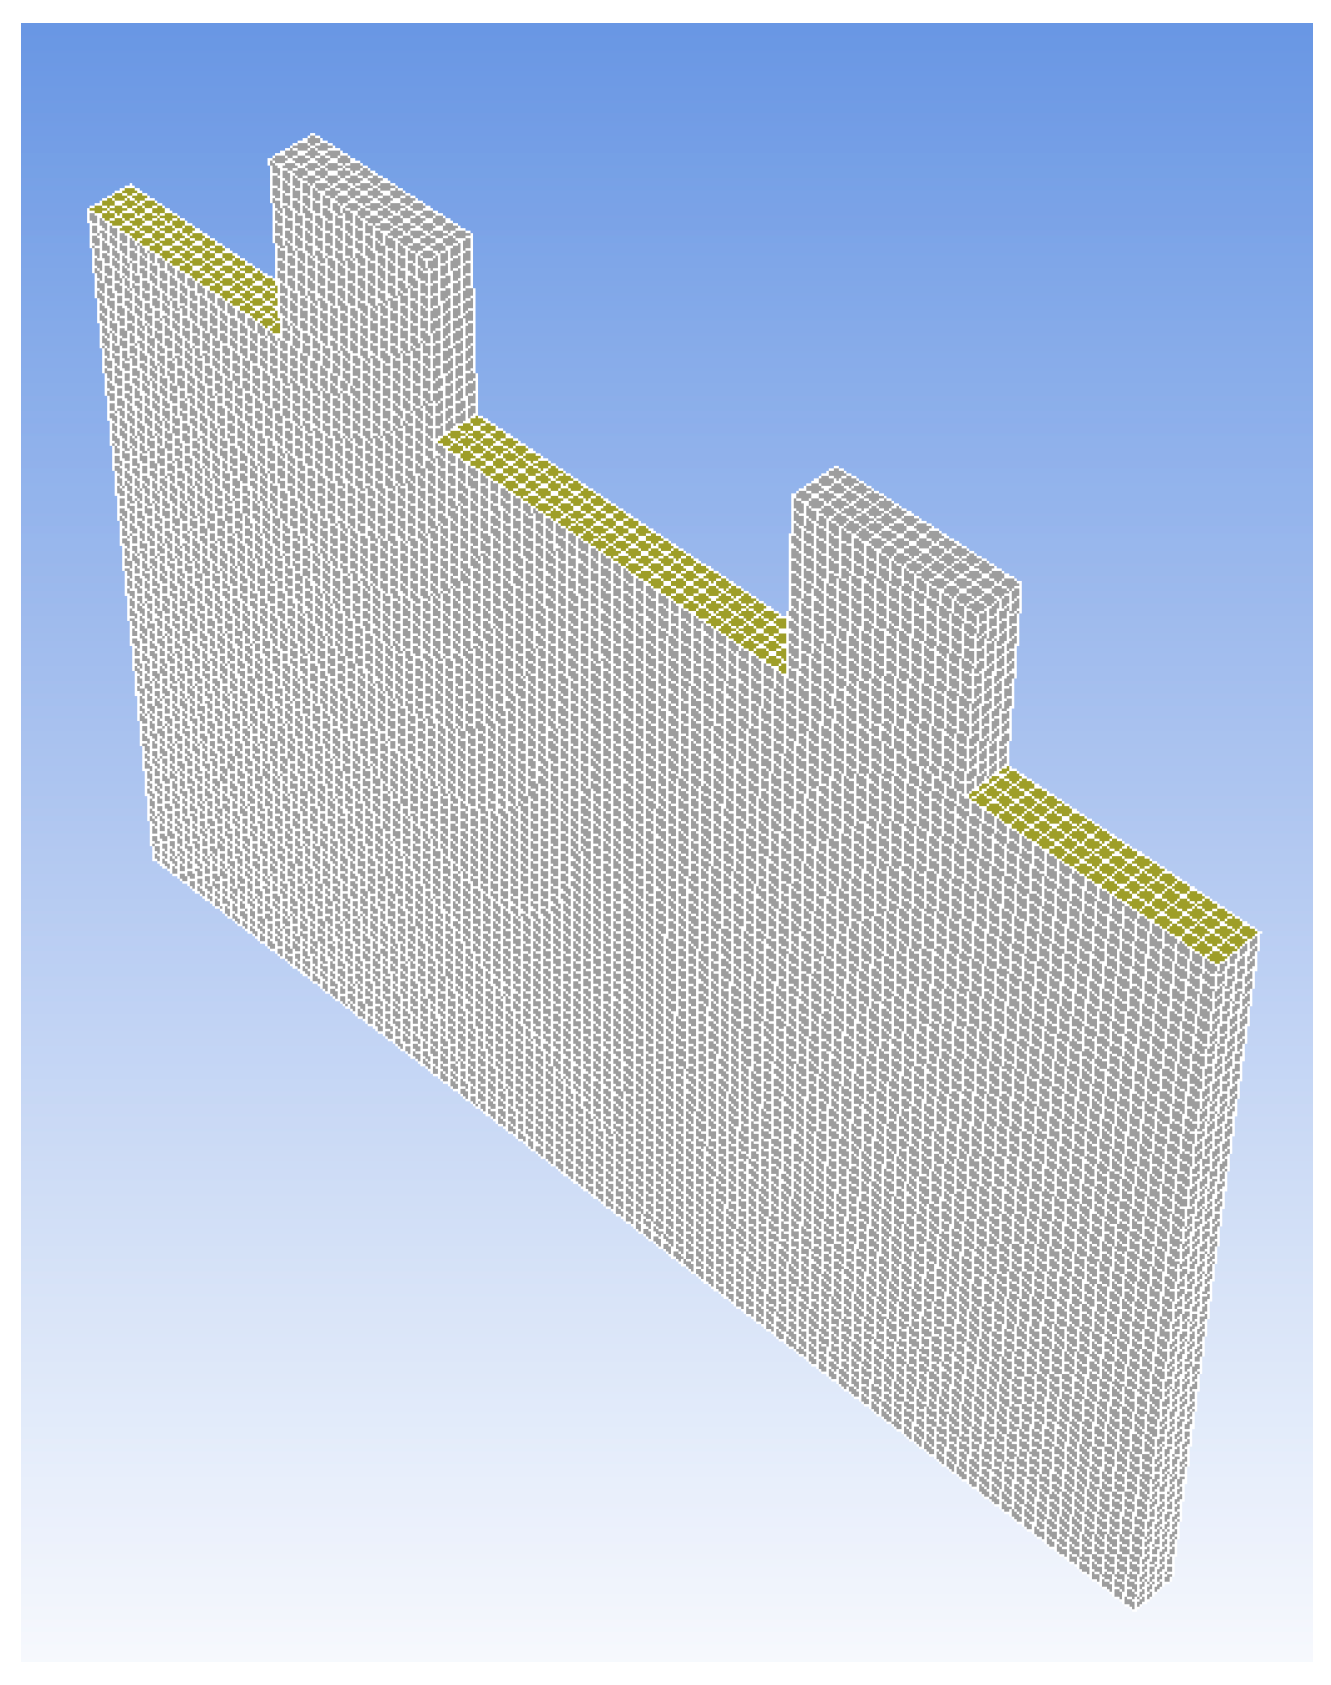
The active volume, contact region, and skin of the battery cell are illustrated in Figure 3. The active volume demonstrates the stacked construction, comprising separator layers, negative and positive active materials, and aluminium foils. The thin skin enclosing the active volume. Geometrical structured meshing of lithium titanate oxide battery cell is shown in Figure 4. As shown in Figure 3 four parts comprise the model:
(A)
Meshing of battery cell stacked construction;
(B)
Skin of active volume;
(C)
Active volume;
(D)
Contact region of active volume.

3. Identification of Model Parameters

3.1. Determination of Thermal Parameters

The general energy balance differential equation, which explains the distribution of generated local, conducted, and accumulated heats and the variation of temperature within a battery cell or pack, can be written as follows:
x ( k x T x ) + y ( k y T y ) + z ( k z T z ) = ρ C p T t λ
where
  • C p : Specific heat capacity
  • λ : Volumetric heat generation
  • ρ : Physical mass
  • k i : Thermal conduction in direction i
  • T : Temperature
Free convection is the main heat transfer process from the surfaces of the battery cell. The dissipated heat flux from the battery surface to the surrounding can be considered by both the convection and the radiation heat contributions:
Q s = h ( T s T a ) + ε σ ( T s 4 T a 4 )
where
  • σ : Stefan–Boltzmann constant
  • ε : Emissivity of the battery cell surface
  • T a : Ambient temperature
  • h : Convective heat transfer
  • T s : Battery surface temperature
Natural convection on a surface is a function of the orientation besides the geometry of the surface. In addition, it depends on the thermos physical properties of the fluid and the variation of temperature on the surface [16]. The complicatedness of the fluid flow makes it hard to achieve straightforward analytical relations for natural convection. The Rayleigh number, which controls the flow regime in natural convection, is defined as the product of the Prandtl and Grashof numbers [16]:
R a = P r × G r = g β ( T s T a ) δ 3 v 2 P r
where
  • v : Kinematics viscosity of the fluid
  • β : Coefficient of volume expansion
  • g : Gravitational acceleration
  • δ : Characteristic length of the geometry
The Nusselt number for natural convection could be determined in the following form [16]:
Nu = h δ k = C R a n = 0.54 R a 1 / 4
where the constants n and C depend on the flow and the geometry of the surface.
In this investigation natural convection process was considered for heat transfer from the surfaces of the battery cell. A procedure was used for the determination of the thermal parameters of the lithium-ion batteries. The method is able to determine a single thermal parameter such as specific heat capacity or thermal conductivity.
The heat capacity is quantifiable physical parameters of a substance, which characterizes the amount of heat, which is required to alter the temperature of the substance by one degree. In other words, heat capacity or specific heat is the amount of heat, which is needed to heat or cool 1 kg of a material by 1 °C. It determines how quickly a battery heats or cools down from its primary temperature in a given surrounding condition. The outcome of the heat capacity characterization process depends on the amount of absorbed heat, which consecutively depends on the ambient circumstances of the process.
In this investigation, isothermal battery calorimeter was employed for determination of specific heat. In order to measure the heat capacity of the battery cell with known mass (m) a thermal procedure was selected. At first, the battery was placed in the Maccor chamber for 3 h to be equilibrated at initial temperature T1. The chamber temperature was set to T1. Then it was placed rapidly in the isothermal battery calorimeter. The isothermal battery calorimeter temperature was set to T2. After a period, the battery cell temperature reached to the chamber temperature. This procedure was repeated several times and the average amount was considered. The heat (Q) which was transferred between the isothermal battery calorimeter and battery cell was measured by using heat flux sensors inside chamber. Consequently, by having the temperature difference (T1T2) and the mass (m) of the battery cell the heat capacity was calculated by using the following equation:
C P = Q / m ( T 1 T 2 )
Transient and steady state methods are the main methods, which could be used for the determination of the thermal conductivity of batteries. Guarded hot plate is a steady state method, which can approximately estimate the thermal conductivity. In this method, the battery is placed between a heat sink and heat source. The thermal conductivity could be determined by knowing the battery cell thickness, temperature difference across the battery, and heat flux.
K = q Δ x Δ T
where
  • q : Heat flux
  • Δ T : Temperature gradient
  • Δ x : Thickness
To assure of the accuracy of the results different ways were used for determining the battery cell density. The battery density was calculated based on the battery material. In addition, the density of the lithium-ion battery was calculated by measuring the mass and volume of the battery cell. In order to determine precisely the physical and thermal parameters of the lithium titanate oxide battery cell and to assure of the accuracy of the previous estimations a procedure was selected. In this method, the battery cell was divided to different parts such as negative current collector, negative electrode, separator, positive electrode and positive current collector. The battery cell cross-section along with the thickness of different layers is illustrated in Figure 5. The material properties of the battery cell were estimated by employing the following formulations [17]:
K = 0.5 ( K P c ) ( T P c ) + ( K P e ) ( T P e ) + ( K S ) ( T S ) + ( K N e ) ( T N e ) + 0.5 ( K N c ) ( T N c ) 0.5 ( T P c ) + T P e + T S + T N e + 0.5 ( T N c )
ρ = 0.5 ( ρ P c ) ( T P c ) + ( ρ P e ) ( T P e ) + ( ρ S ) ( T S ) + ( ρ N e ) ( T N e ) + 0.5 ( ρ N c ) ( T N c ) 0.5 ( T P c ) + T P e + T S + T N e + 0.5 ( T N c )
C P = 0.5 ( C P P c ) ( T P c ) + ( C P P e ) ( T P e ) + ( C P S ) ( T S ) + ( C P N e ) ( T N e ) + 0.5 ( C P N c ) ( T N c ) 0.5 ( T P c ) + T P e + T S + T N e + 0.5 ( T N c )
σ p = 0.5 ( σ P c ) ( T P c ) + ( σ P e ) ( T P e ) 0.5 ( T P c ) + T P e + T S + T N e + 0.5 ( T N c )
σ n = 0.5 ( σ N c ) ( T N c ) + ( N e ) ( T N e ) 0.5 ( T P c ) + T P e + T S + T N e + 0.5 ( T N c )
α = k ρ C p
where
  • α : Thermal diffusivity
  • T N c 
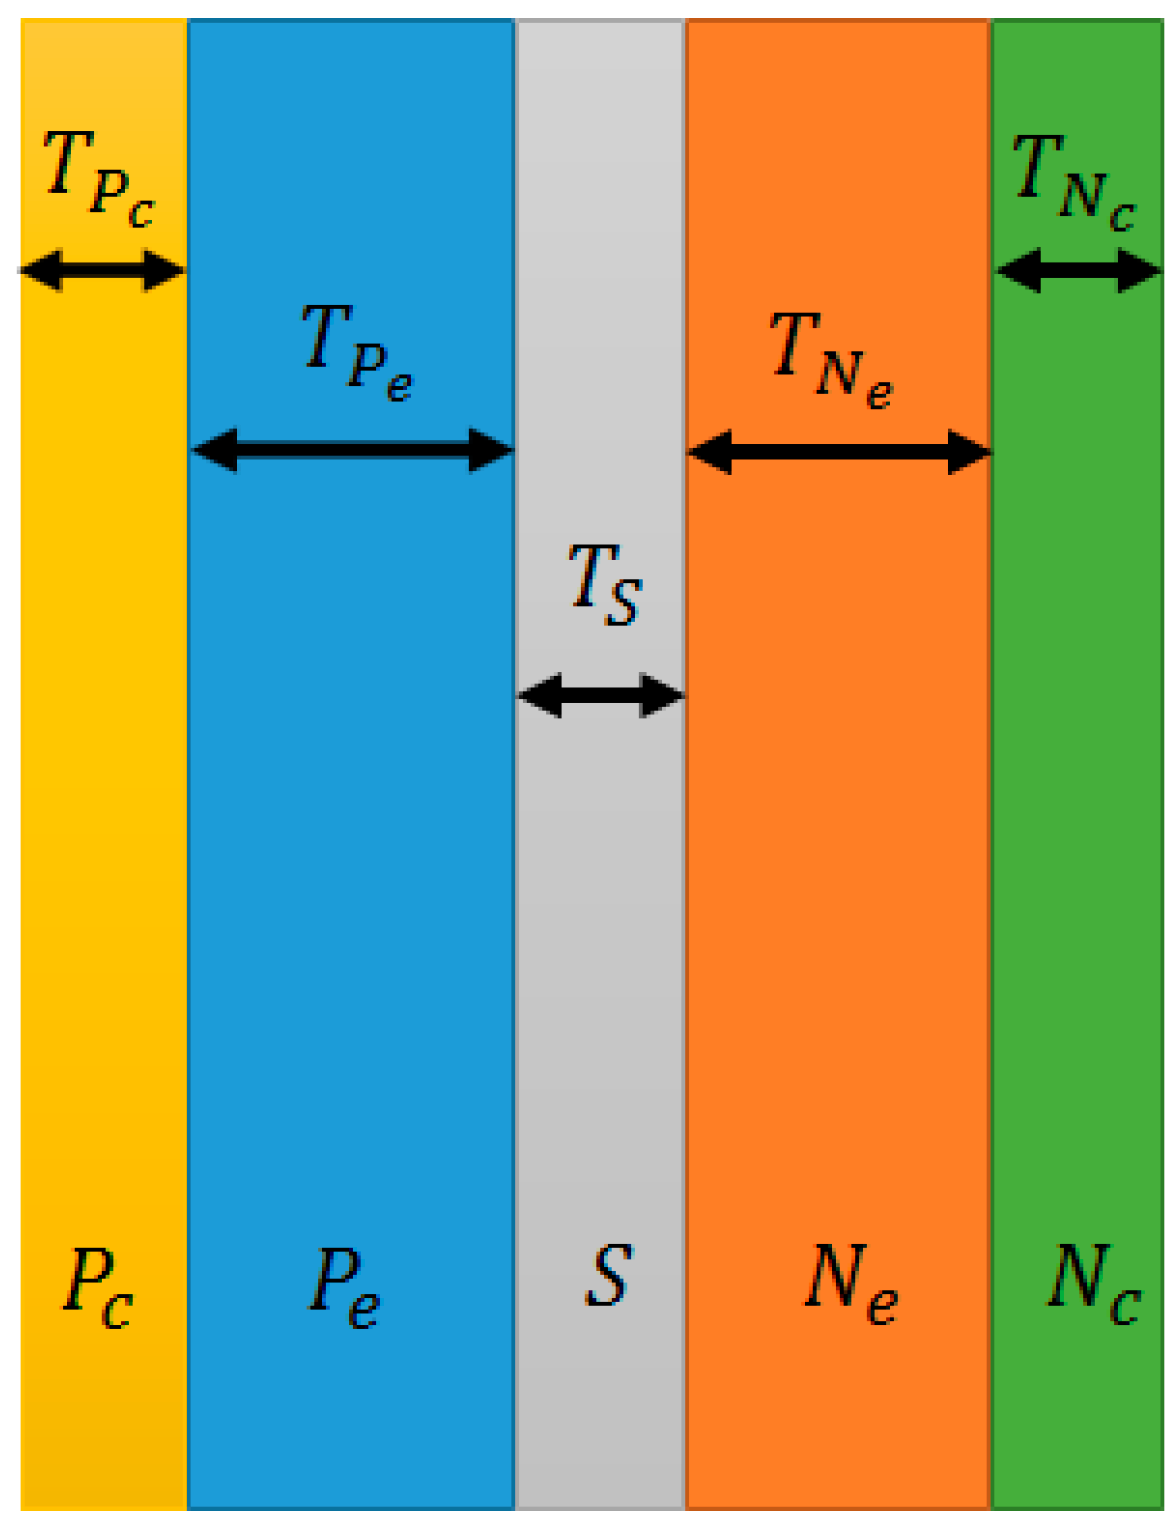
: Thickness of negative current collector
  • T N e : Thickness of negative electrode
  • T S : Thickness of separator
  • T P e : Thickness of positive electrode
  • T P c : Thickness of positive current collector
  • K P c : Thermal conductivity of positive current collector
  • K P e : Thermal conductivity of positive electrode
  • K S : Thermal conductivity of separator
  • K N e : Thermal conductivity of negative electrode
  • K N c : Thermal conductivity of negative current collector
  • ρ P c : Density of positive current collector
  • ρ P e : Density of positive electrode
  • ρ S : Density of separator
  • ρ N e : Density of negative electrode
  • ρ N c : Density of negative current collector
  • C P P c : Heat capacity of positive current collector
  • C P P e : Heat capacity of positive electrode
  • C P S : Heat capacity of separator
  • C P N e : Heat capacity of negative electrode
  • C P N c : Heat capacity of negative current collector
  • σ P c : Electric conductivity of positive current collector
  • σ P e : Electric conductivity of positive electrode
  • σ N c : Electric conductivity of negative current collector
  • σ N e : Electric conductivity of negative electrode

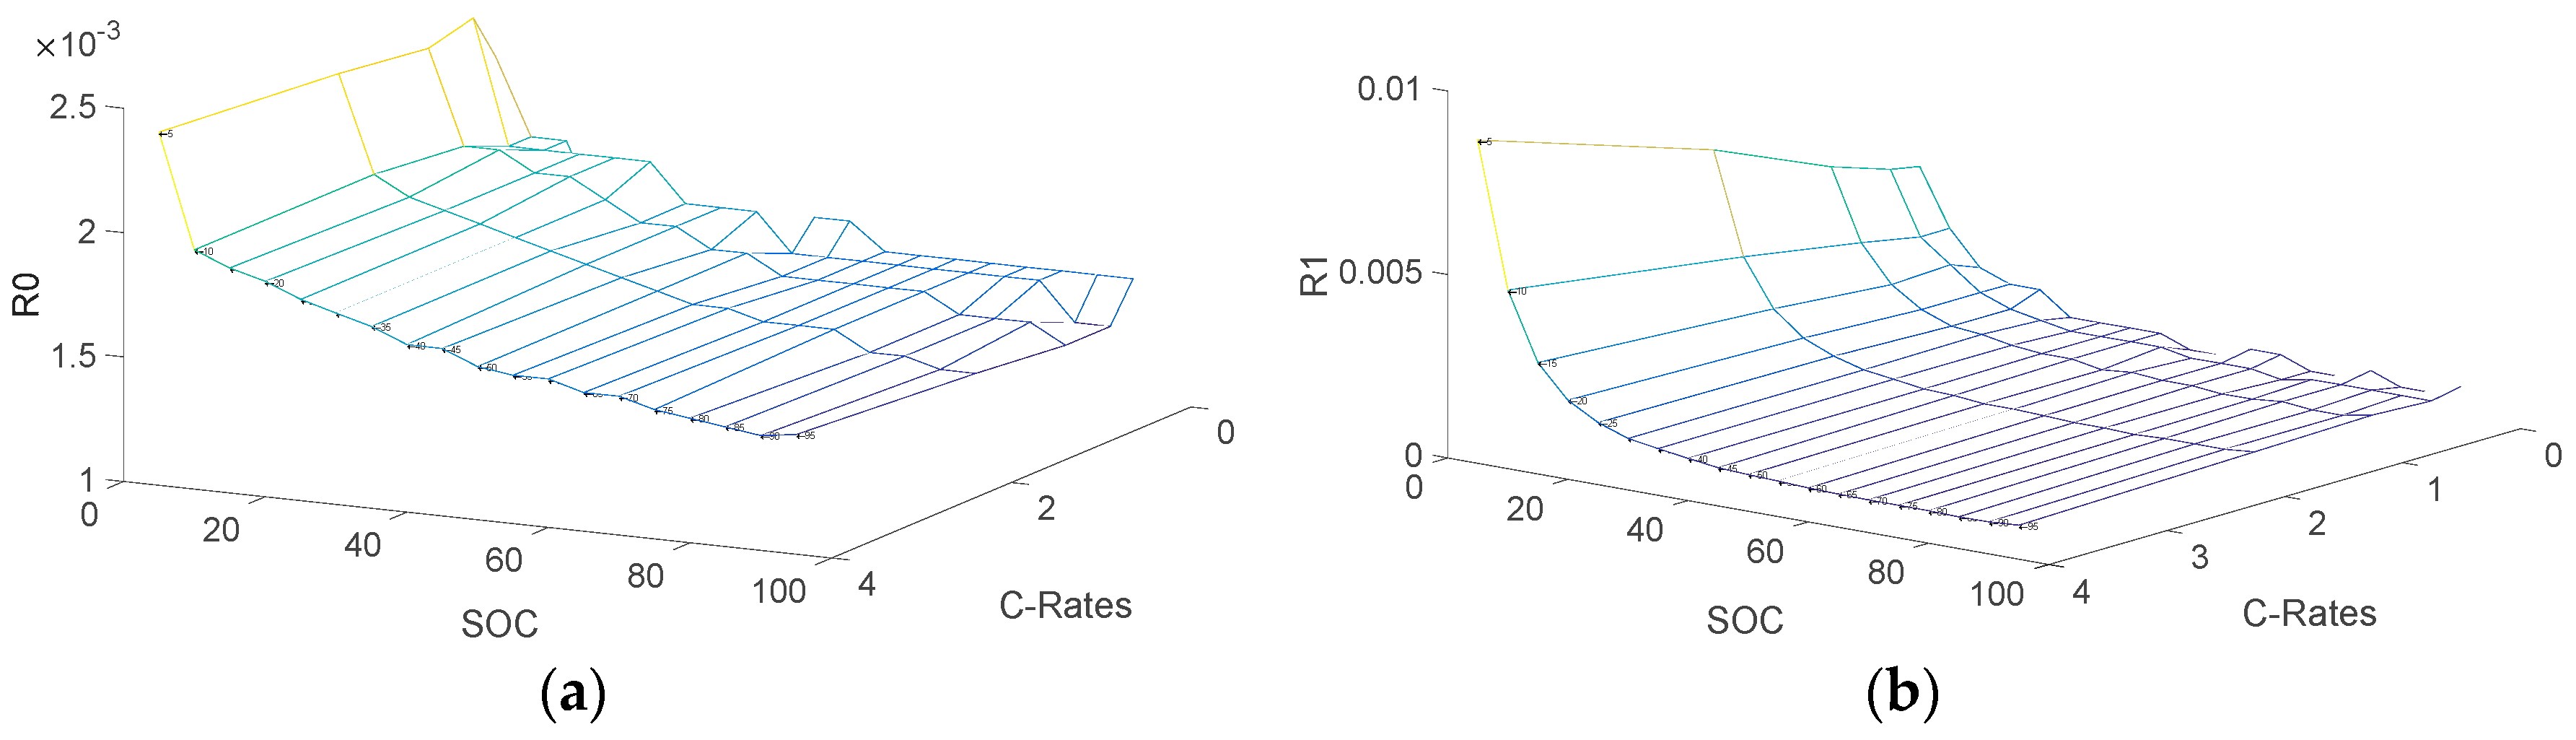
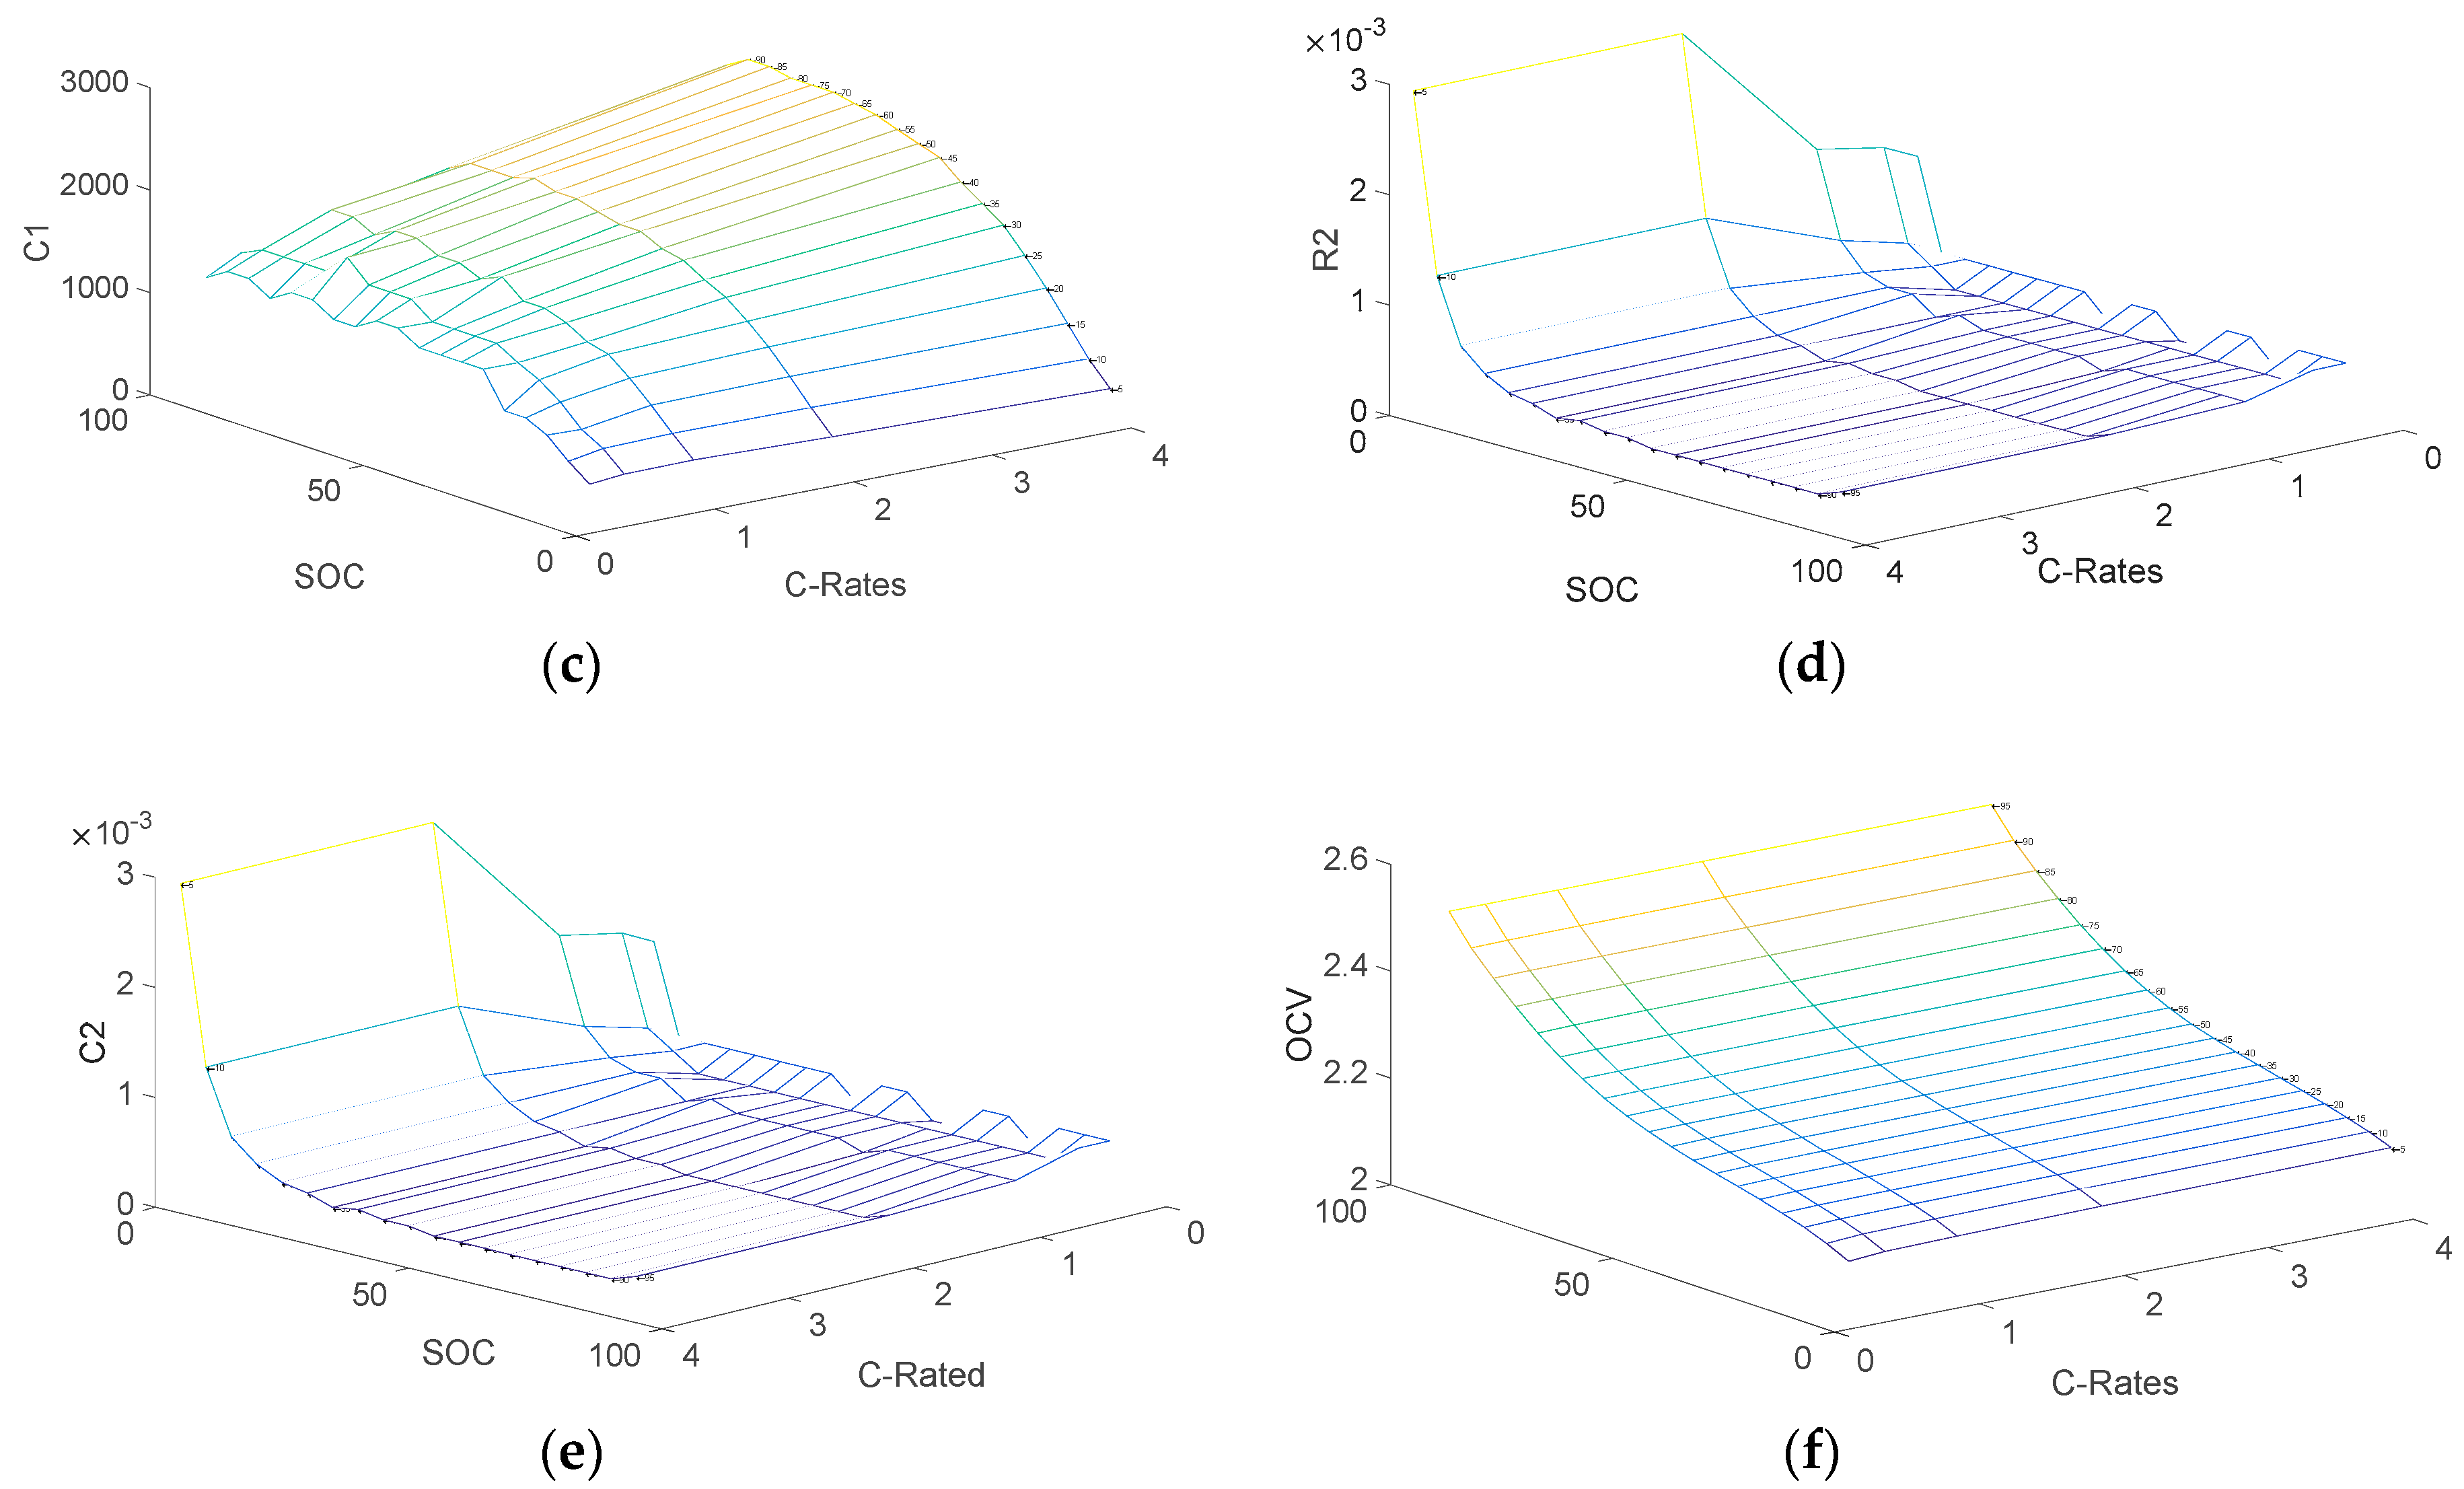
3.2. Determination of Electrical Parameters

A 2RC equivalent circuit model was used in this investigation. The model is presented in Figure 6. To achieve the parameters of the equivalent circuit model different loading profile were applied to the battery cell. The loads consist of charge and discharge cycles with different C-rates. The voltage variation of load profiles at different temperature and C-rates is illustrated in Figure 7. An example of the voltage response when a 4 C-rate (52 Ah) current is applied to the battery cell at 27 °C is illustrated in Figure 8.
The values of open circuit voltage, resistances, and capacitances of the 2RC equivalent circuit model are illustrated in Figure 9. The parameters of the 2RC equivalent circuit model were determined by using the following equations [18,19]:
R 0 = V 0 V 1 I ,   R 1 = V 1 V 2 I ,   R 2 = V 2 V 3 I
C 1 = t 1 t 2 ln ( V 1 ( t 2 ) V 1 ( t 1 ) ) × R 1 ,   C 2 = t 2 t 3 ln ( V 2 ( t 3 ) V 2 ( t 2 ) ) × R 2
where
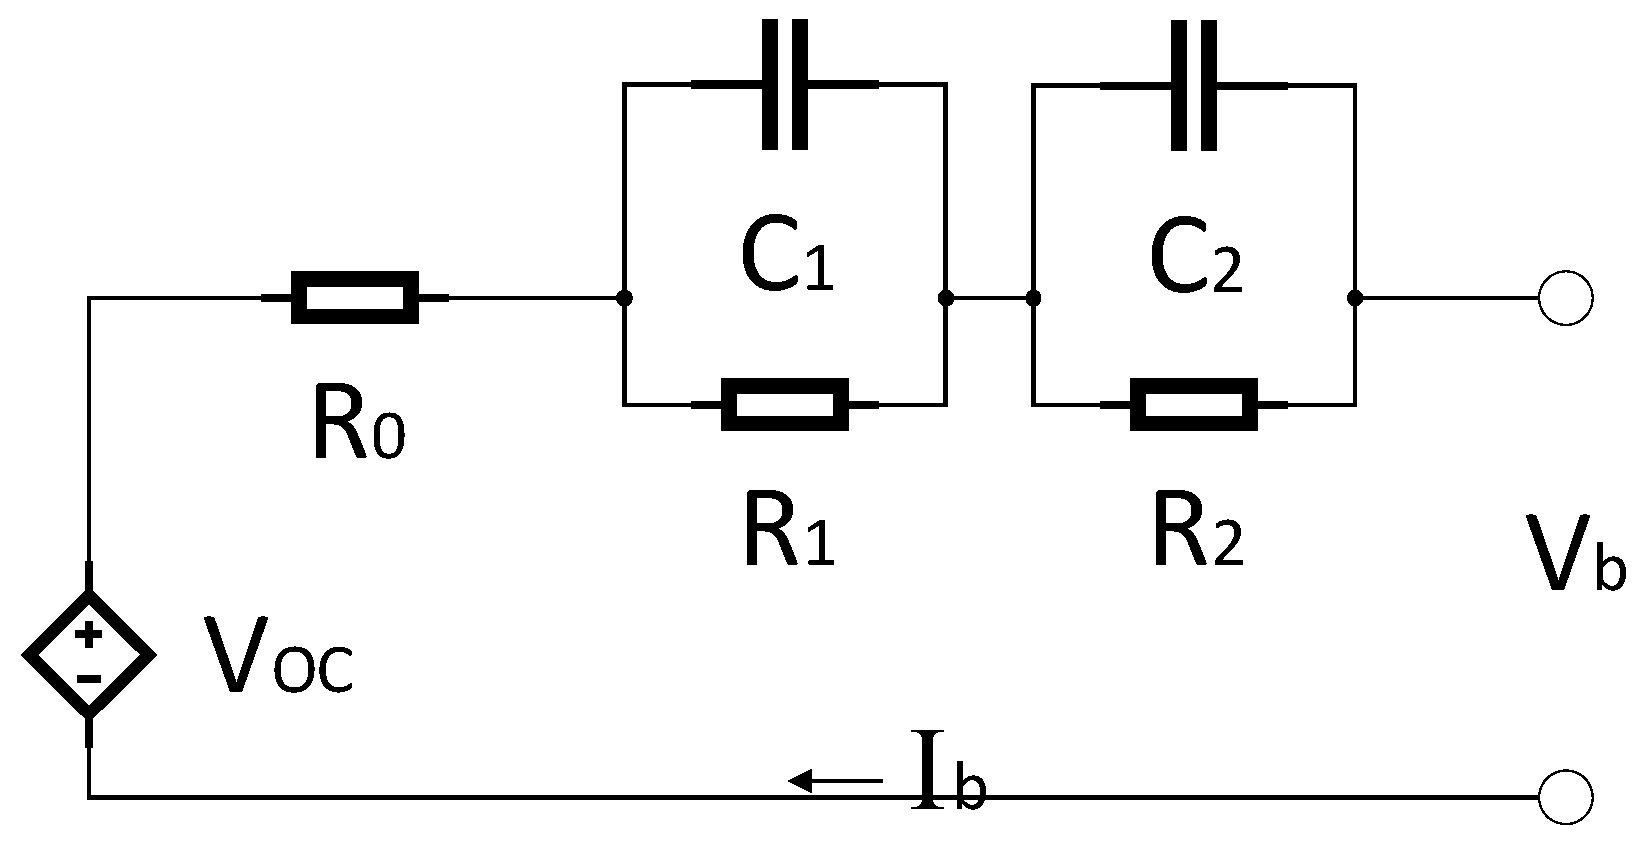
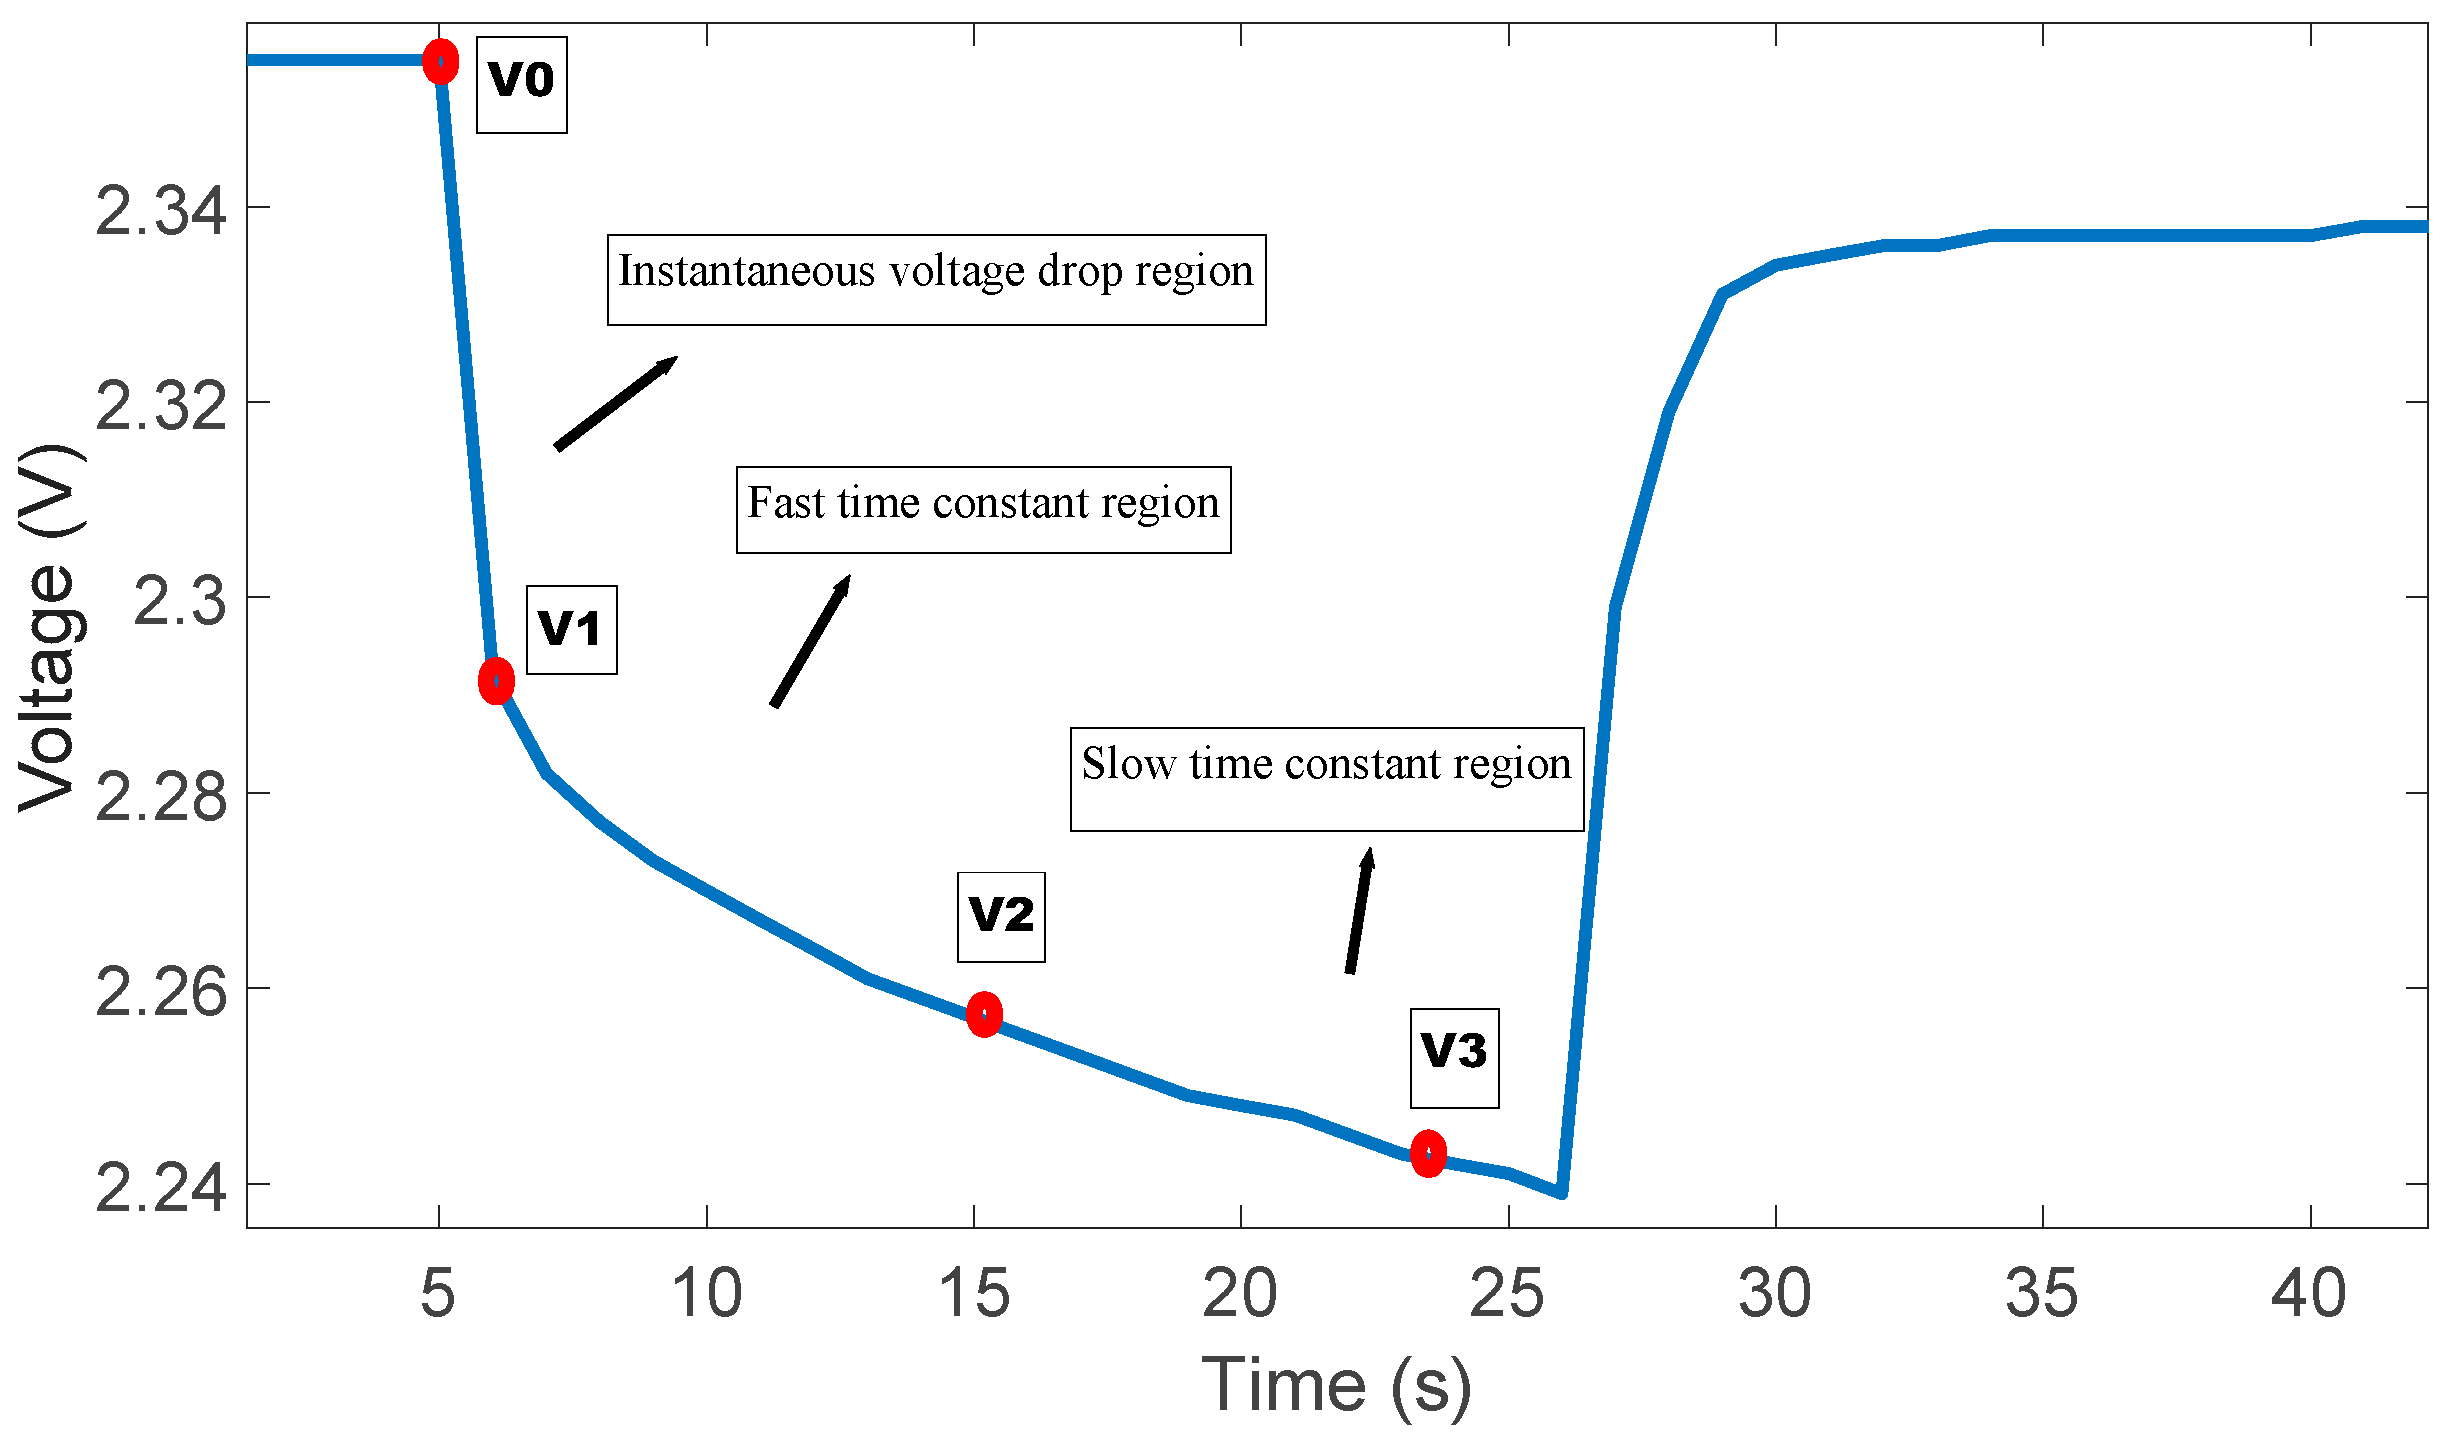
  • V0: Battery voltage before the discharge current pulse is applied.
  • R0: Ohmic resistance
  • I: Amplitude of the current pulse.
  • V1: Battery voltage one seconds (t1) after the discharge current is applied.
  • R1, C1: Resistance and capacitance of the first RC network
  • V2: Battery voltage ten seconds (t2) after the discharge current is applied.
  • V3: Battery voltage eighteen seconds (t3) after the discharge current is applied.
  • R2, C2: Resistance and capacitance of the second RC network
For the investigated battery cell, the open circuit voltage, resistances, and capacitances of the 2RC equivalent circuit model were considered as functions of the battery state of charge (SOC). The coefficients of fifth order polynomial are illustrated in Table 1. These functions were expressed in fifth order polynomial form:
[ R 0 R 1 R 2 C 1 C 2 V 0 ] = [ A 1 A 2 A 3 A 4 A 5 A 6 B 1 B 2 B 3 B 4 B 5 B 6 C 1 C 2 C 3 C 4 C 5 C 6 D 1 D 2 D 3 D 4 D 5 D 6 E 1 E 2 E 3 E 4 E 5 E 6 F 1 F 2 F 3 F 4 F 5 F 6 ] × [ 1 S O C ( S O C ) 2 ( S O C ) 3 ( S O C ) 4 ( S O C ) 5 ]

4. Modelling Method

The model was solved in ANSYS by employing the Multi-Scale Multi-Dimensional (MSMD) battery module. The model combines the principal design parameters of the battery cell such as corresponding physical parameters, materials, and dimensions to computational fluid dynamics and heat transfer. In addition, the battery model is able to simulate a single battery cell or a battery pack to investigate their electrochemical and thermal behaviour. At the solution phase of the model, unsteady state problem and the thermal time interdependent were solved numerically assuming the heat generation in the battery cell as a dynamic source. The amount of heat generation inside a lithium-ion battery cell, which was proportionate to the temperature and current rate, was measured by an isothermal battery calorimeter and was considered as an input to the thermal model. The thermal and electrical fields were solved by using the following equations [17]:
ρ C p T t ( k T ) = G + Q ˙ G = σ + | ϕ + | 2 + σ | ϕ | 2 ( σ + φ + ) = ( σ φ ) = J
where
  • J : Volumetric transfer
  • C p : Heat capacity
  • Q ˙ : Heat generation
  • k : Thermal conductivity
  • σ : Effective electric conductivities
  • ϕ : Phase potential
  • T : Temperature

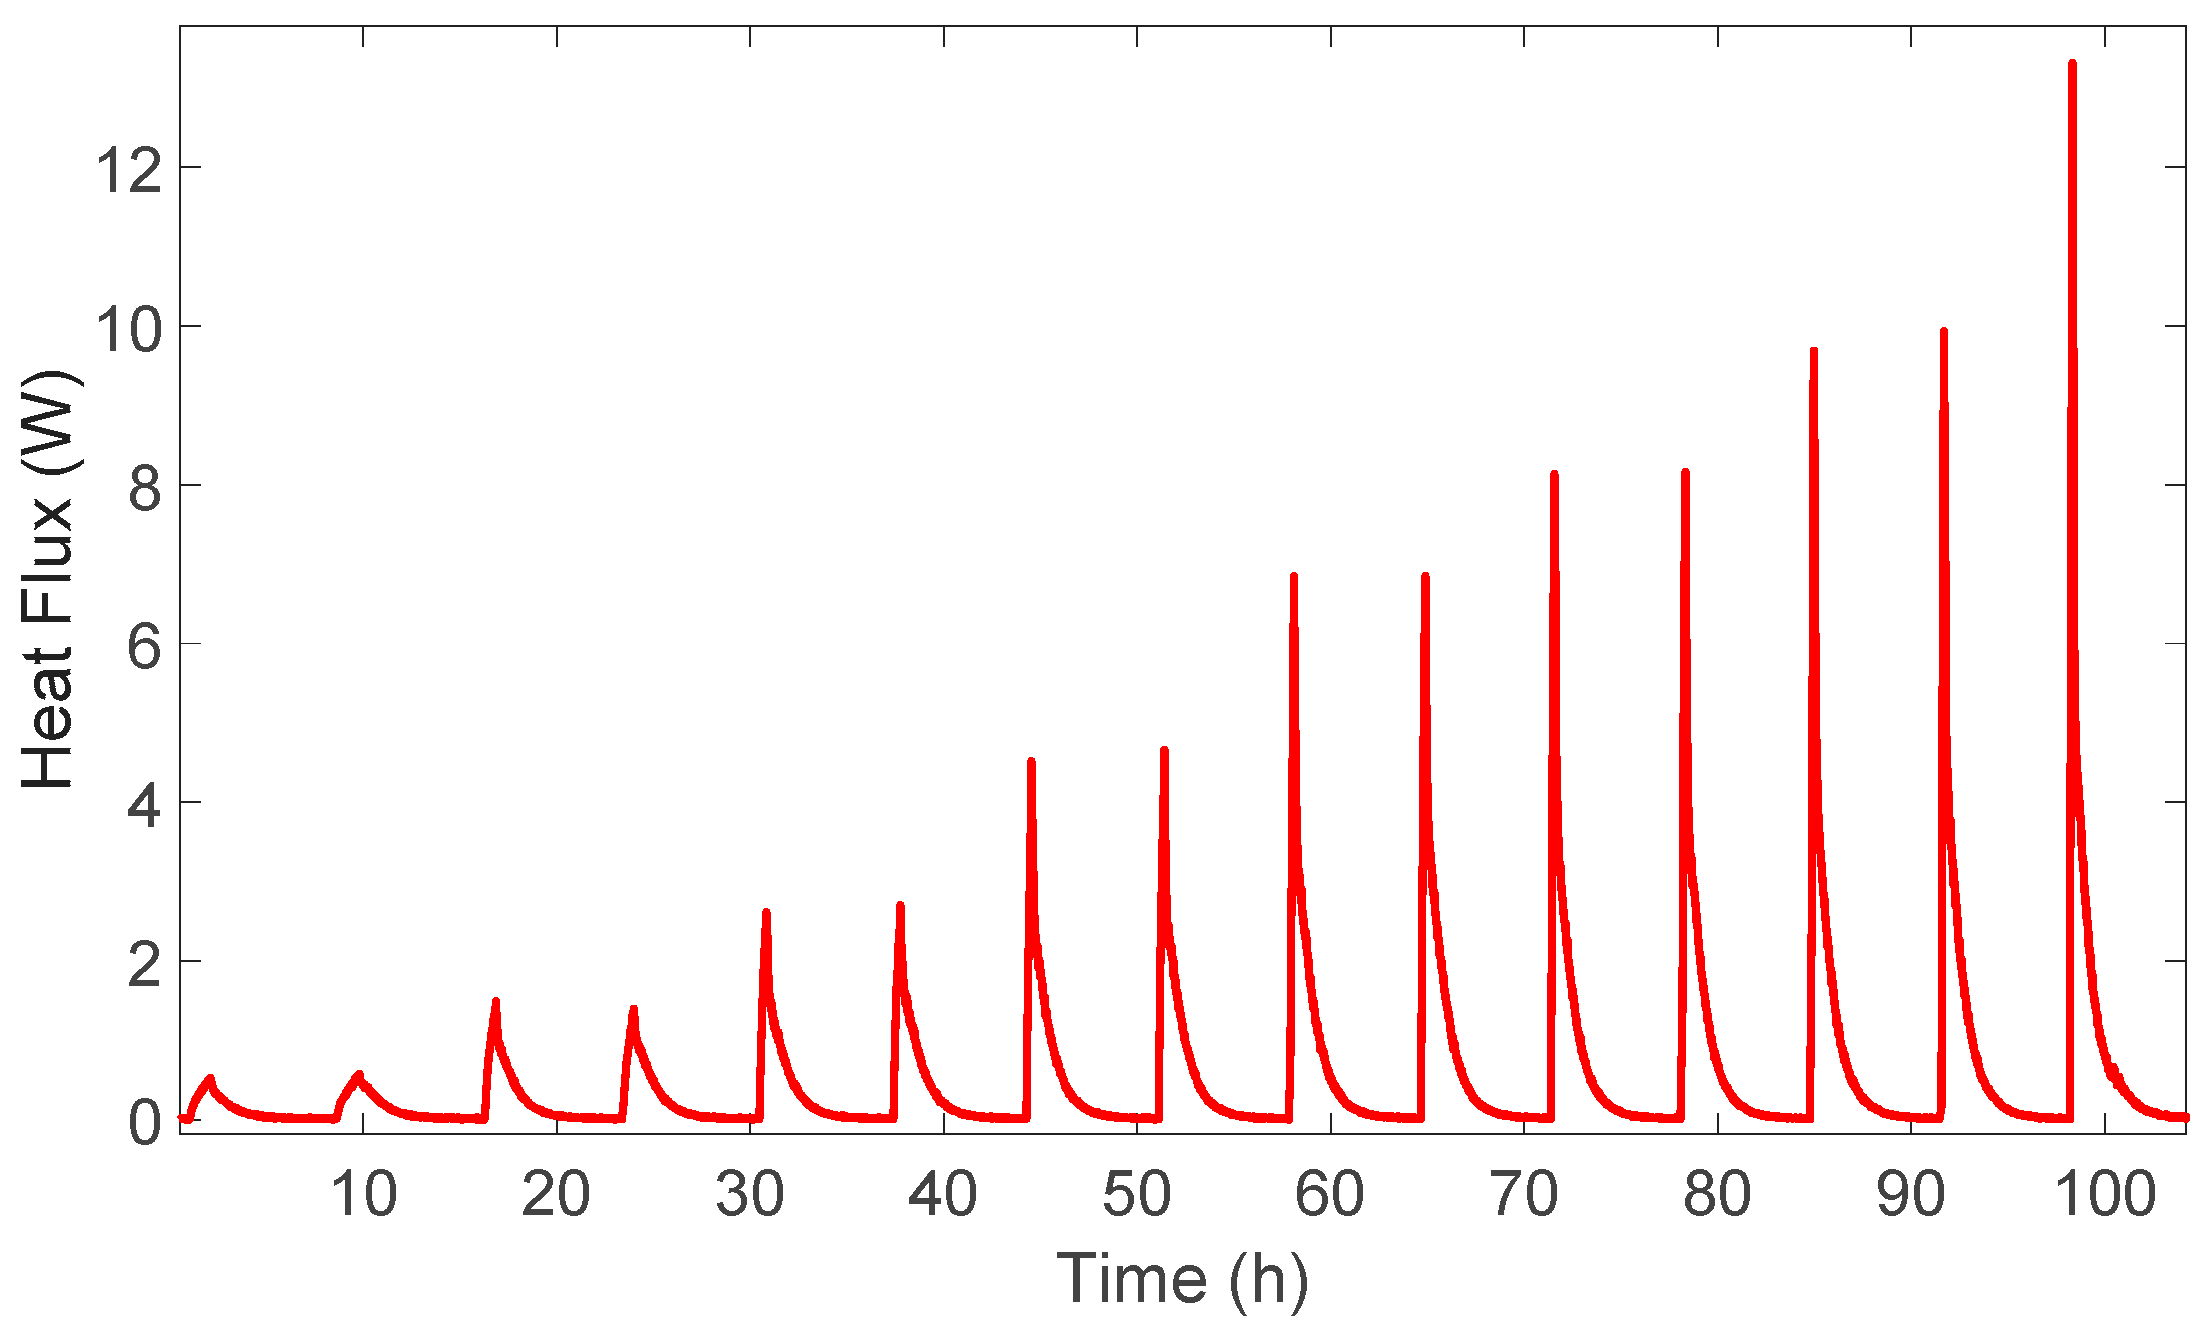
5. Measurement of Heat Generation Rates

Heat generation inside batteries is a complicated process, which could be divided into reversible and irreversible parts. Experimental setup, which was used in this investigation, is illustrated in Figure 10. Isothermal battery calorimeter was employed for heat loss measurement. The detailed experimental procedures and setup, as well as corresponding equipment and materials, could be found in [20]. Maccor automated system was used as a battery cycler for the whole experiments. The battery cycler charged and discharged the battery with different current rates. Heat flux determination of lithium titanate oxide battery cell by using isothermal calorimeter is shown in Figure 11.

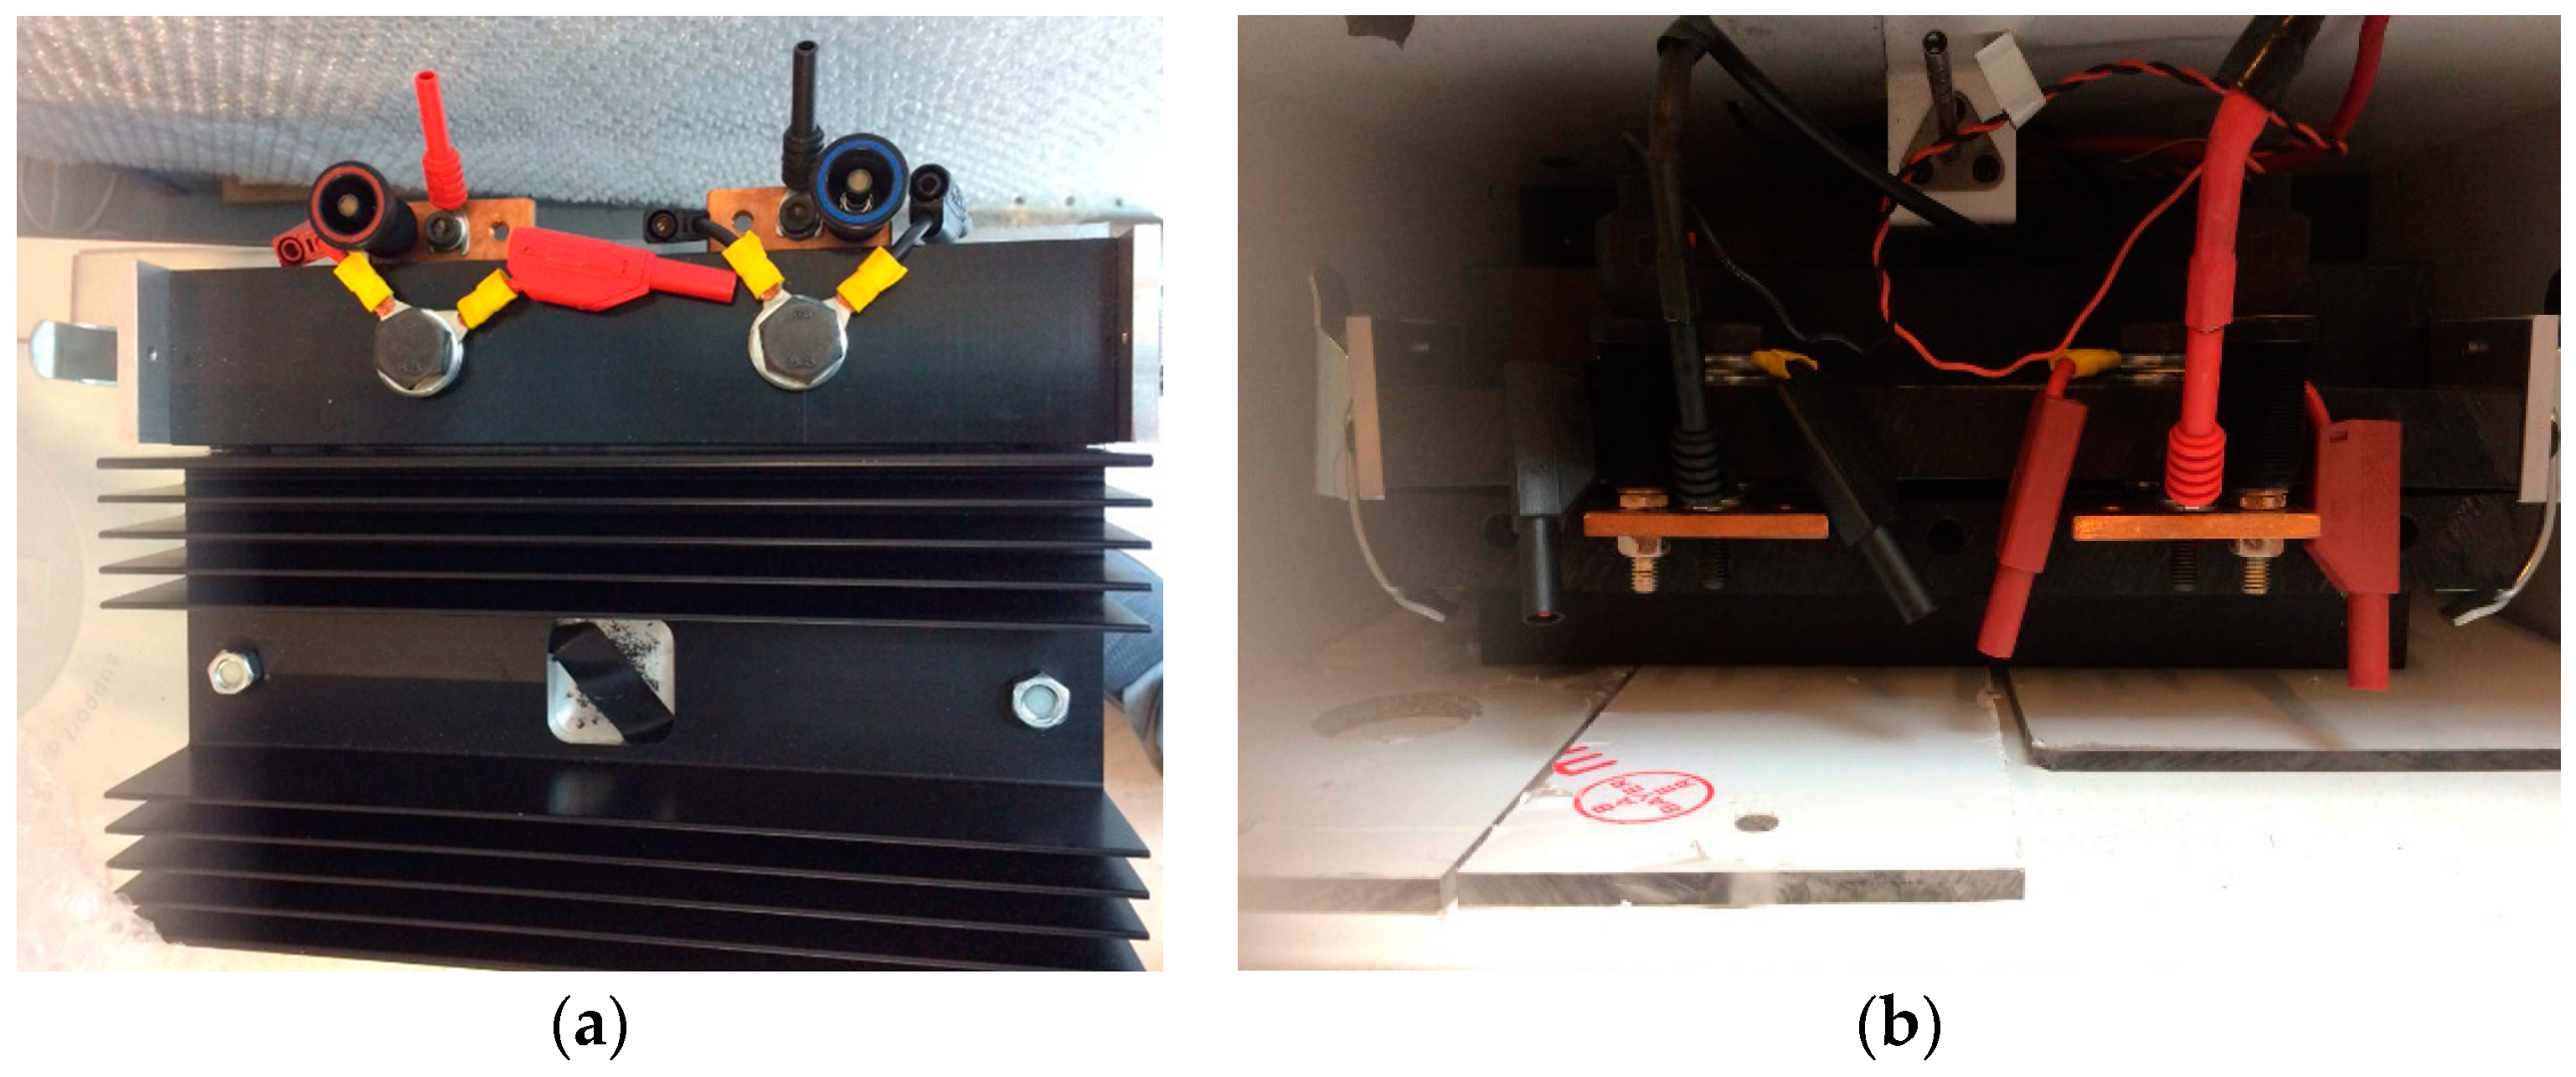
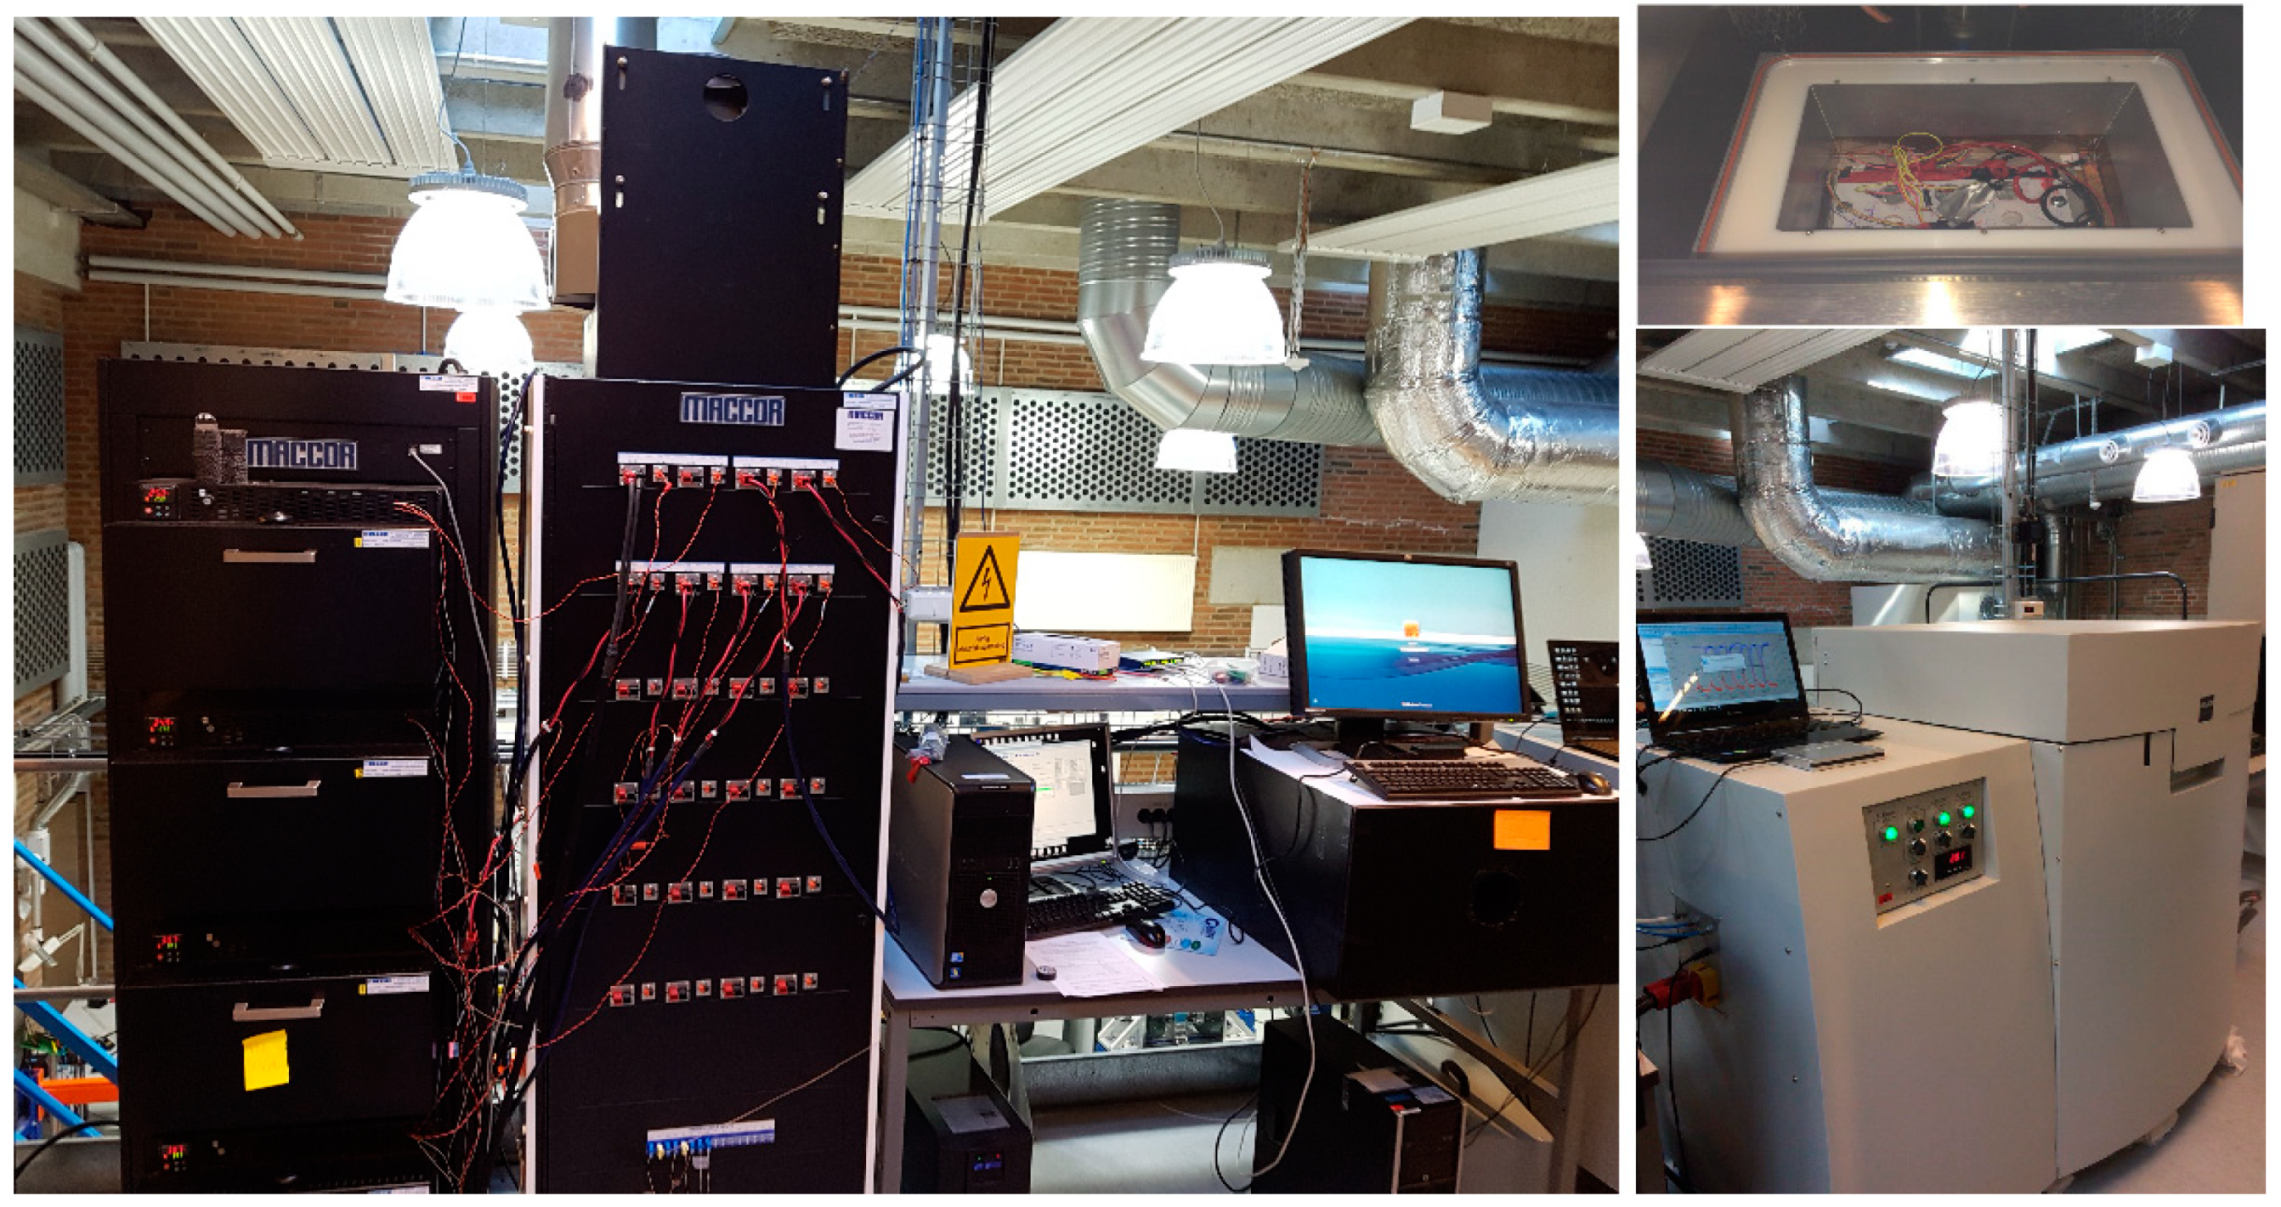
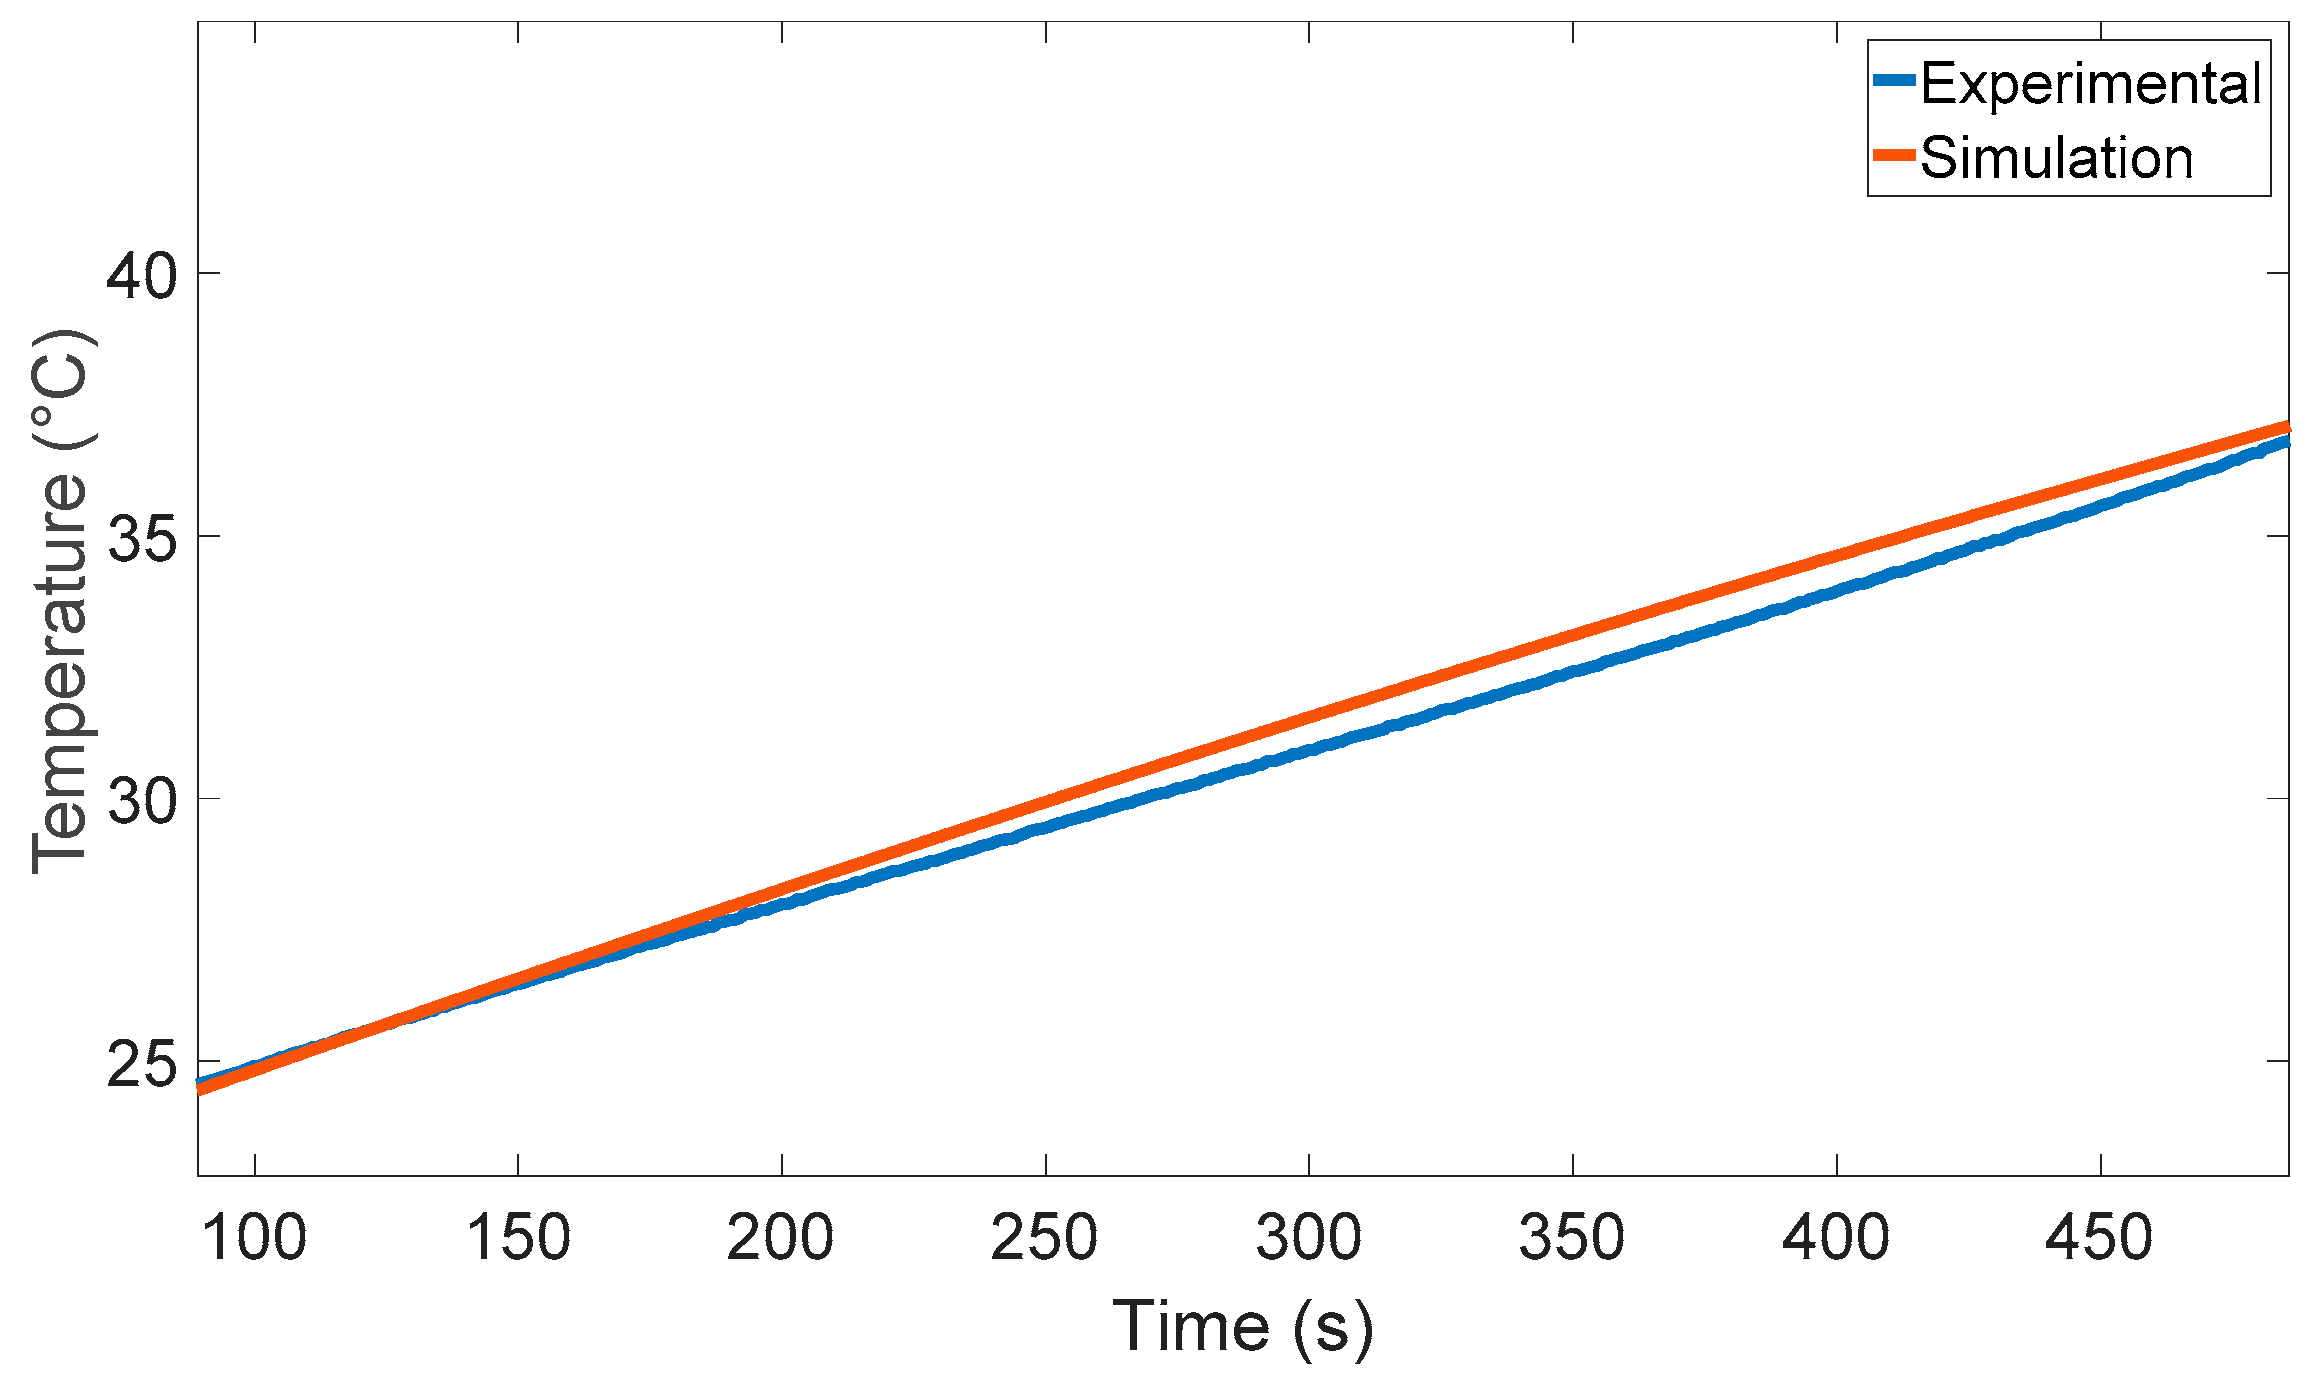
6. Experimental Validation

Several sets of experiments were accomplished to validate model performance at different temperature by using a 13 Ah battery, which was fabricated by Altairnano and is shown in Figure 4. A 45A discharge process was used to validate the temperature, which was anticipated by the model. FLIR thermal camera and contact thermocouples were used to monitor the surface temperature of the battery cell at different positions. Experimental temperature results and temperature simulation for 45 A discharge process is illustrated in Figure 12. It could be seen from the figure that the temperature increase of the simulation is in good agreement with the experimental data. This demonstrate that the model is capable of simulating the real battery cell. The experimental temperature increase data, which was used in this investigation, was the average amount of several thermocouples and FLIR thermal camera measurements. In addition, the simulation temperature increase was the average value of entire battery cell temperature.
During the charge and discharge cycling, the battery cell was made to be isothermal by situating it in an isothermal battery calorimeter. The calorimetric measurements were used as a heat generation source in the battery cell. A Maccor automated test system was employed as the discharge apparatus with the intention of monitoring the current and voltage. The simulated and experimental outcomes for 52 A discharge process and 300 K environmental temperature are illustrated in Figure 13. The experimental temperature data, which were used for model validation, are the value of surface temperature of the battery at four different locations, which were measured by four contact thermocouples. Temperature value of the experimental data compare good to the simulation, demonstrating that the model could simulate the real battery cell.

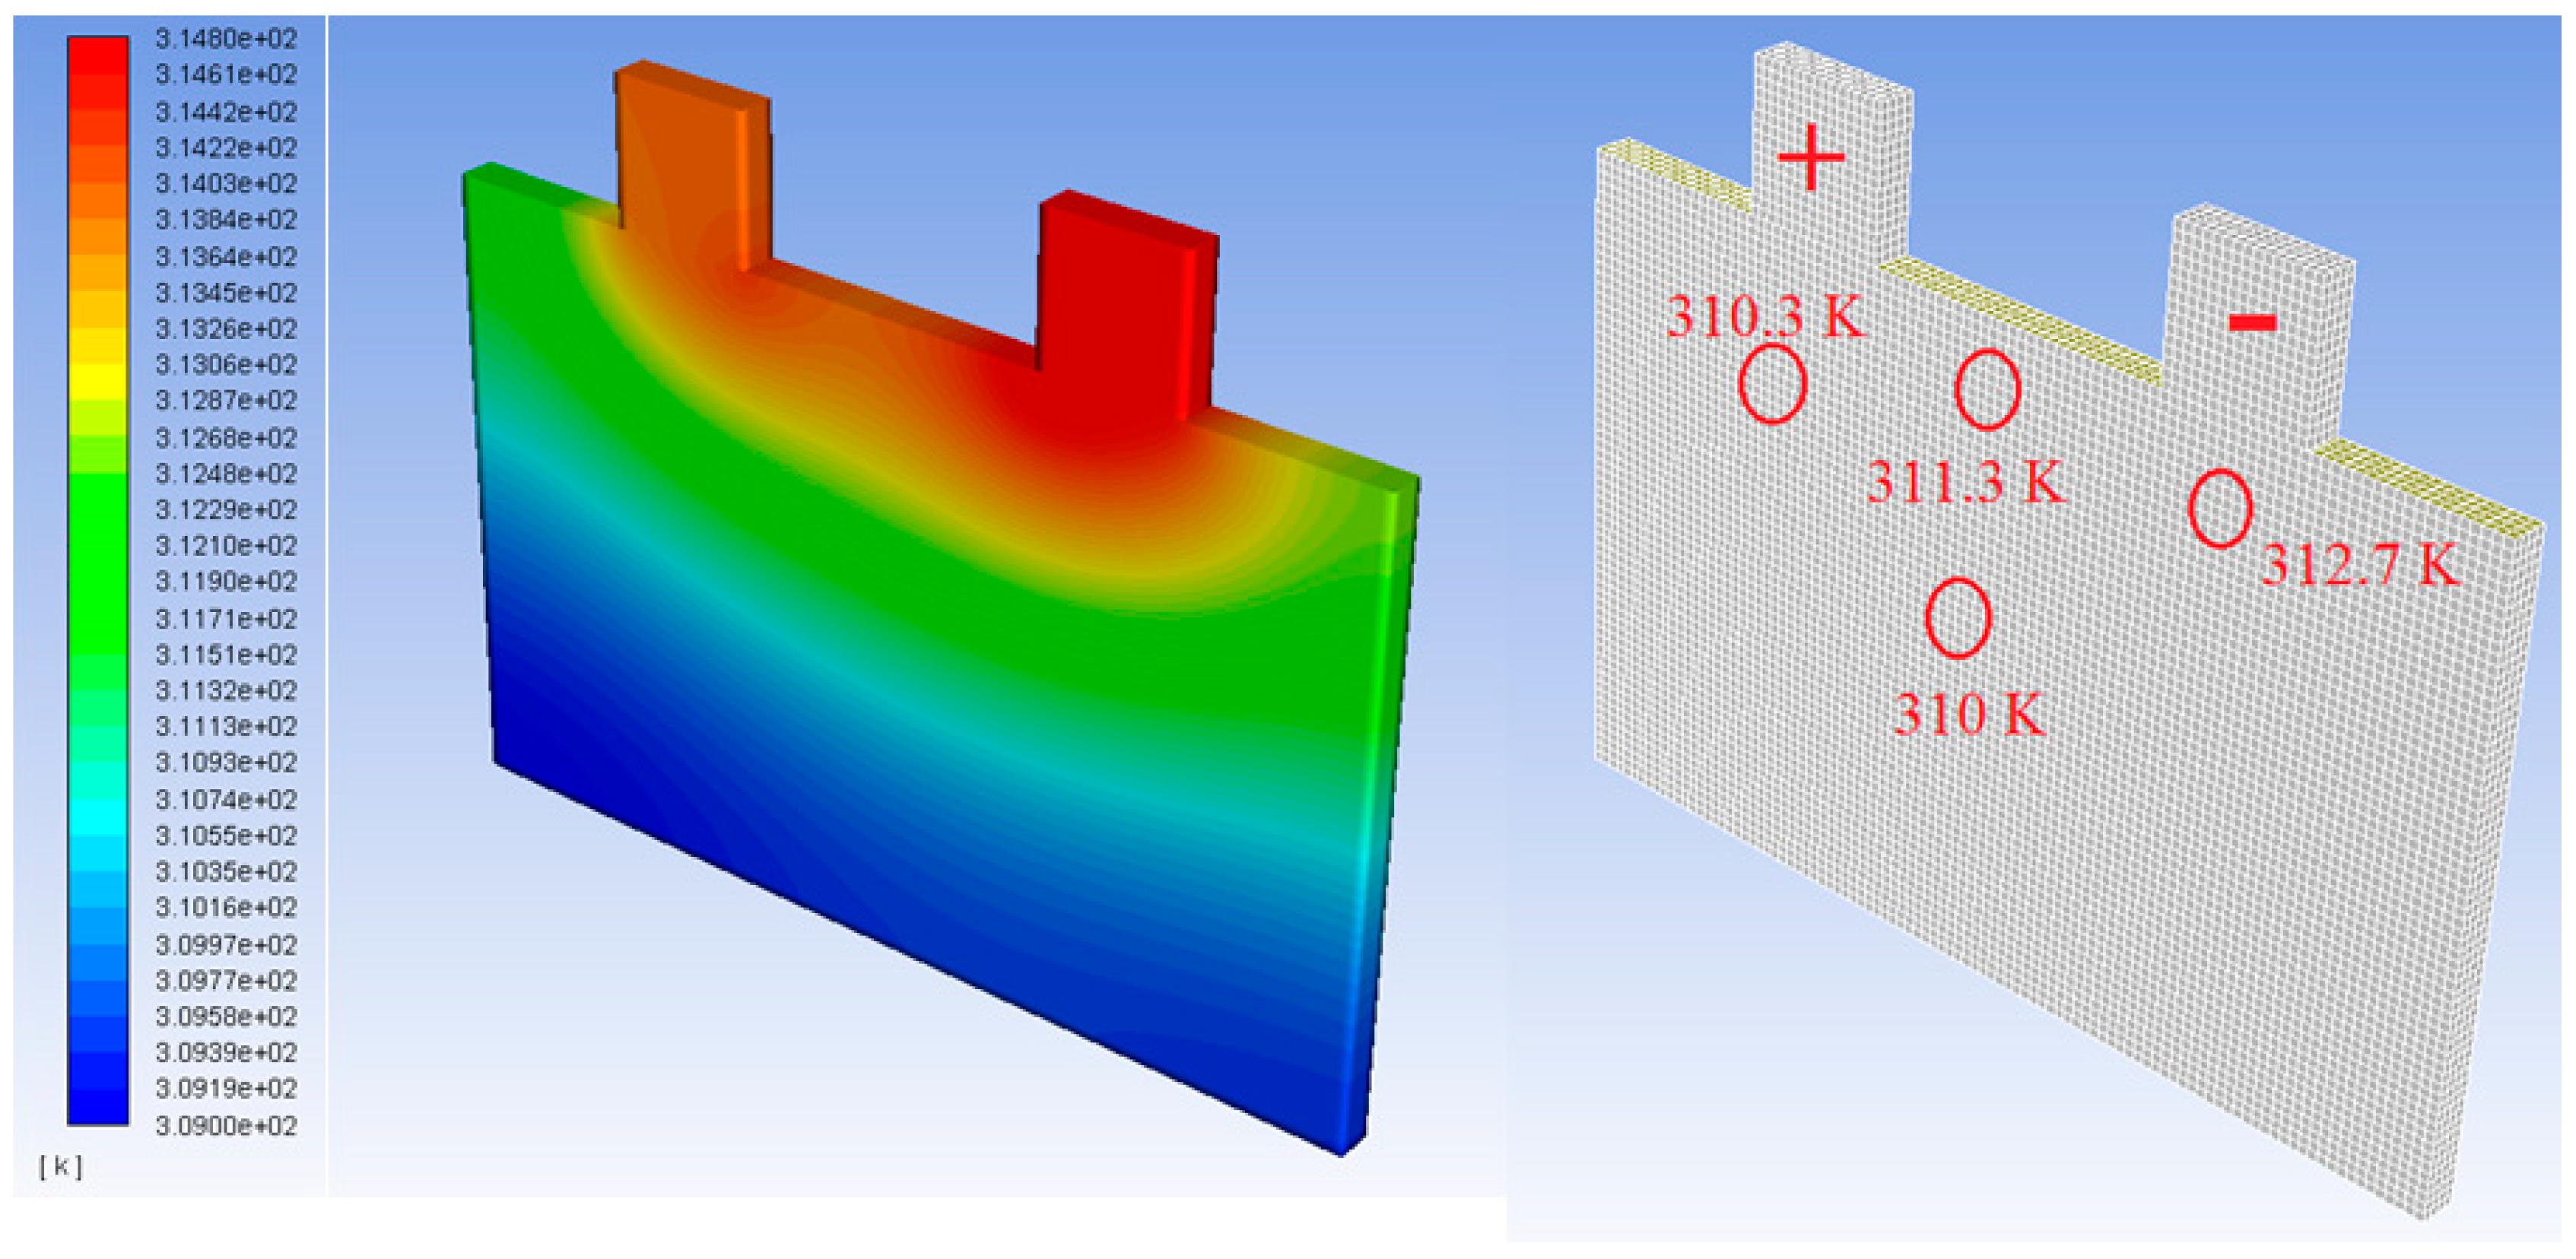
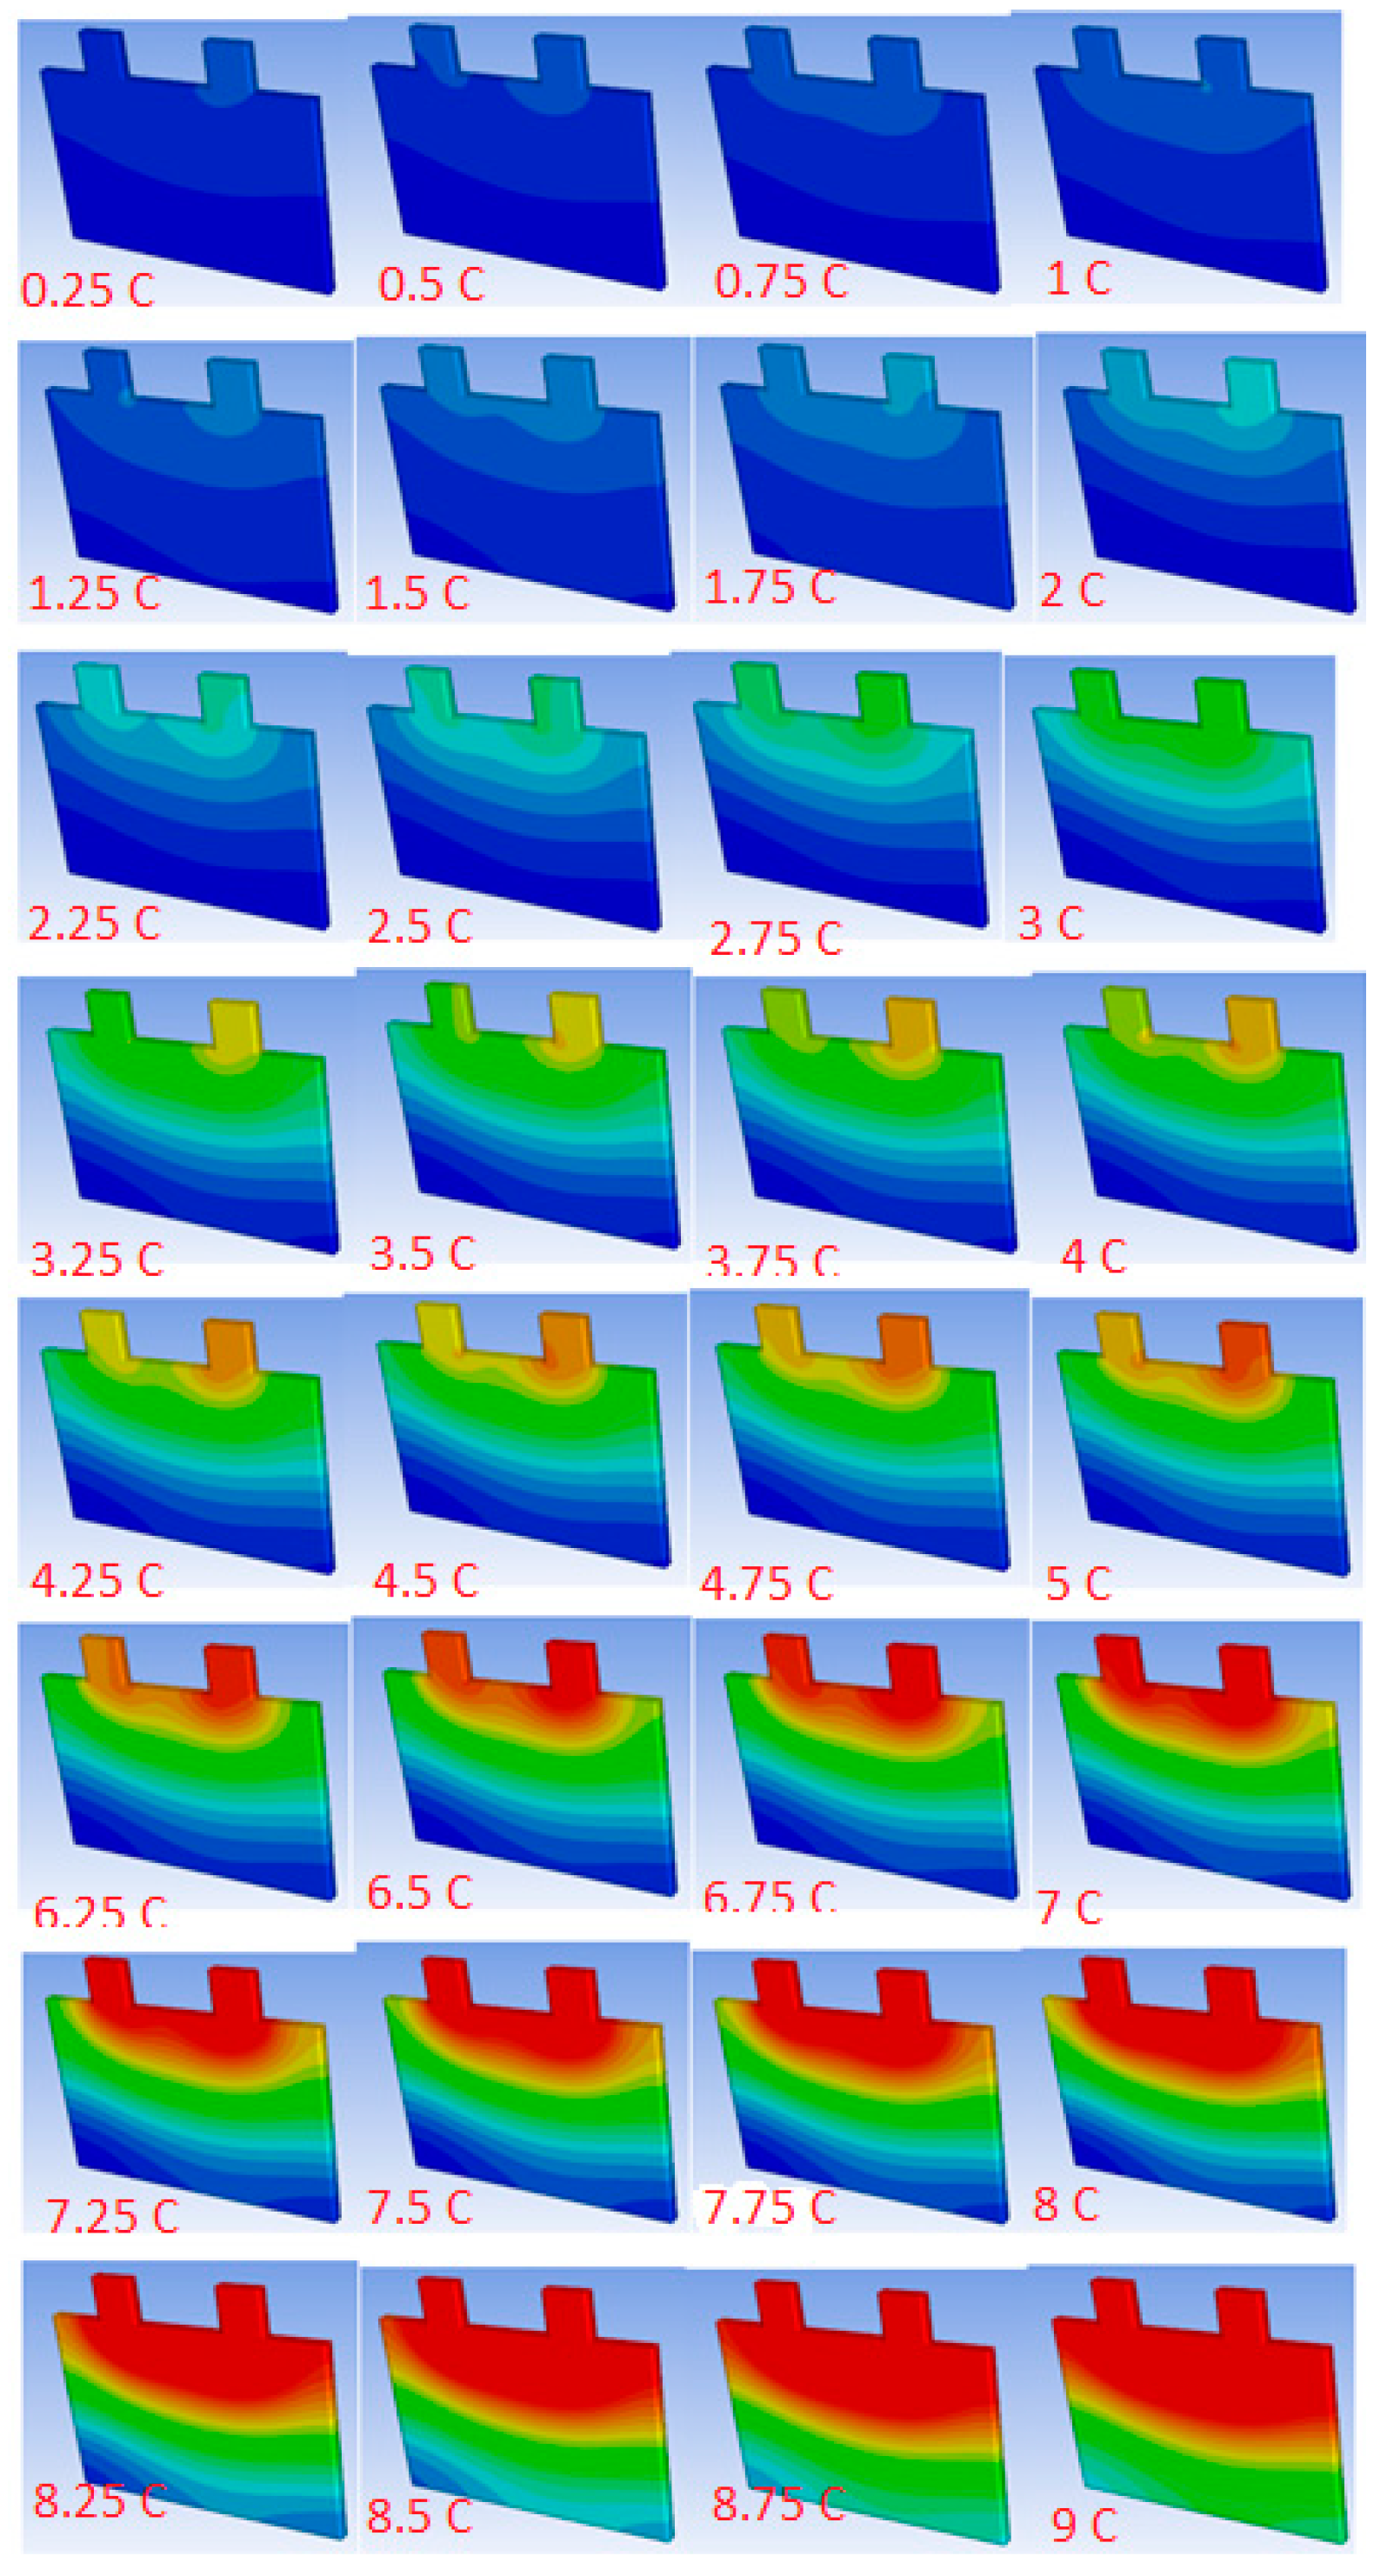
7. Simulation Results and Discussion

In this investigation, several quantities for the volumetric heat generation were considered. The values were measured by an isothermal battery calorimeter for various load profiles. The model is simulated in both time dependent and steady state environment to determine the temperature spatial distribution over the battery surface. In addition, the modelling is able to show the maximum value of surface temperature of the battery as a function of time for different environment temperature and discharge current rates.
The temperature distributions of the battery cell were determined as a function of time at different discharge rates. As could be seen in Figure 12 and Figure 13, the overall temperature distributions, which were achieved from the model and experiment, are in good agreement with each other.
The heat, which is dissipated from the battery, and the heat generated inside it are approximately equal during low current rates. Therefore, fast equilibrium could be reached. In another word, most of generated heat will be transferred to the surrounding through free or forced convection. The evolution of the uttermost temperature of the battery cell is confined at low current rates. The phenomenon demonstrates the minor rises in the surface temperature. Notwithstanding, the difference among the maximum temperatures, which were attained, from the modelling and experiment was lower than that between the corresponding minimum ones.
The simulation was accomplished at different discharge current rates ranging from 0.25 C to 9 C with 0.25 C interval. The modelling discharge profiles agree good with those, which were gained from experimental. The corresponding heat loss from the battery cell was shown in Figure 11. In accordance with the findings, the temperature increase sharply to a specific point. As anticipated, the position of the hottest area is seen near the negative tab of the battery cell throughout the discharge process. In addition, non-uniform temperature propagation was observed.
Temperature distribution of the battery cell at different discharge rates ranging from 0.25 C to 9 C is illustrated in Figure 14. As could be seen from the distributions of temperature over the volume of the battery cell, the temperature contours showed moderate slopes at low current rates. On the contrary, the temperature contours demonstrate sharper slopes at higher current rates. It demonstrates quicker temperature increase during the discharge of the battery cell, which is due to the higher heat generation inside the battery cell. At high current rates, achieving equilibrium occurs in a longer time. This phenomenon demonstrates that the modelling discharge curves agree well with those which were achieved from the experiments.
Although the current flows in the neighbourhood of the tabs of both the negative and positive electrodes are correspondingly great, the electrical conductivity of the active material of the negative electrode is much higher than that of the positive electrode. This phenomenon leads to lower temperatures in the neighbourhood of the current collecting tab of the positive electrode compared to the negative electrode [21,22,23].
Electrochemical reaction rate was increased due to higher temperature gradient. This phenomenon could be described by higher current rates in some parts of the cell owing to high temperature gradient. The minimum and maximum temperatures, which, were collected from the modelling and experiment, are in good agreement with each other over the entire scope of battery cell surface at the different discharge rates. Notwithstanding, some difference was seen among the discharge curves, which were achieved from the experiment and model in close proximity to the end period of discharge. The highest discrepancy was seen for high discharge rates.

8. Conclusions

The principal objective of this investigation was to develop a precise, computationally efficient and simplified Dual Potential Multi-Scale Multi-Dimensional (MSMD) Battery model. A procedure was used to simulate the thermal behaviour of a lithium-ion battery at different current rates and environmental temperature. The three-dimensional temperature distribution of the battery was anticipated as a function of the discharge time by using the model. By comparing the modelling discharge curves with the experimental outcomes at different environmental temperatures and discharge rates the modelling was validated. The parameters of equivalent circuit model were determined from multi-pulse charge and discharge data. An average specific heat capacity was considered for the battery cell in the time dependent and unsteady state simulation. To assist the suggested modelling method, calorimetric experiments were accomplished. By using the heat generation, which was measured by the isothermal calorimeter, the model was simulated to demonstrate the temperature distribution. A great temperature discrepancy was seen in battery surface at high current rates. This phenomenon could be described by high amount of heat generation due to higher temperature gradient. In addition, the value of surface temperature of the battery was determined by the model, was compared to the experimental data, and was in good agreement with the model data. Greater temperature gradients were seen at the battery cell surfaces owing to higher current rate. Subsequently, design of an appropriate thermal management system specifically during high current rates charging and discharging could play a fundamental role in preventing great temperature growth of the battery cell. The simulation methodology, which was demonstrated in this investigation, might contribute to the development of a battery cell thermal management system, which enables the temperature evolution of lithium-ion batteries as a subordinate of time to be more precisely anticipated. In addition, it can assist to anticipate the evolution of the thermal, electrical, and chemical processes.

Author Contributions

S.S.M. proposed the idea of the paper; S.S.M. wrote the paper; E.S. provided suggestions on the content and structure of the paper; S.K.K. and E.S. has been reviewing the draft manuscripts.

Funding

This research received no external funding.

Conflicts of Interest

The authors declare no conflict of interest.

References

  1. von Srbik, M.; Marinescu, M.; Martinez-botas, R.F.; Offer, G.J. A physically meaningful equivalent circuit network model of a lithium-ion battery accounting for local electrochemical and thermal behaviour, variable double layer capacitance and degradation. J. Power Sources 2016, 325, 171–184. [Google Scholar] [CrossRef] [Green Version]
  2. Tian, C.; Lin, F. Electrochemical Characteristics of Layered Transition Metal Oxide Cathode Materials for Lithium Ion Batteries: Surface, Bulk Behavior, and Thermal Properties. Acc. Chem. Res. 2018, 2, 89–96. [Google Scholar] [CrossRef]
  3. Ortiz, G.F.; Alcántara, R.; Lavela, P.; Tirado, J.L. Optimization of the Electrochemical Behavior of Vapor Grown Carbon Nanofibers for Lithium-Ion Batteries by Impregnation, and Thermal and Hydrothermal Treatments. J. Electrochem. Soc. 2005, 152, A1797–A1803. [Google Scholar] [CrossRef]
  4. Northrop, P.W.C.; Ramadesigan, V.; De, S.; Subramanian, V.R. Coordinate Transformation, Orthogonal Collocation, Model Reformulation and Simulation of Electrochemical-Thermal Behavior of Lithium-Ion Battery Stacks. J. Electrochem. Soc. 2011, 158, A1461–A1477. [Google Scholar] [CrossRef]
  5. Northrop, P.W.C.; Pathak, M.; Rife, D.; De, S.; Santhanagopalan, S.; Subramanian, V.R. Efficient Simulation and Model Reformulation of Two-Dimensional Electrochemical Thermal Behavior of Lithium-Ion Batteries. J. Electrochem. Soc. 2015, 162, A940–A951. [Google Scholar] [CrossRef] [Green Version]
  6. Wang, Z.; Siegel, J.; Garikipati, K. Intercalation Driven Porosity Effects in Coupled Continuum Models for the Electrical, Chemical, Thermal and Mechanical. J. Electrochem. Soc. 2017, 164, A2199–A2212. [Google Scholar] [CrossRef]
  7. Gu, H. Mathematical Analysis of a Zn/NiOOH Cell R. J. Electrochem. Soc. 1983, 130, A1459–A1464. [Google Scholar] [CrossRef]
  8. Smith, K.; Wang, C.Y. Solid-state diffusion limitations on pulse operation of a lithium ion cell for hybrid electric vehicles. J. Power Sources 2006, 161, 628–639. [Google Scholar] [CrossRef]
  9. Kim, U.S.; Shin, C.B.; Kim, C.S. Effect of electrode configuration on the thermal behavior of a lithium-polymer battery. J. Power Sources 2008, 180, 909–916. [Google Scholar] [CrossRef]
  10. Kim, G.-H.; Smith, K.; Lee, K.-J.; Santhanagopalan, S.; Pesaran, A. Multi-Domain Modeling of Lithium-Ion Batteries Encompassing Multi-Physics in Varied Length Scales. J. Electrochem. Soc. 2011, 158, A955–A969. [Google Scholar] [CrossRef]
  11. Kwon, K.H.; Shin, C.B.; Kang, T.H.; Kim, C.S. A two-dimensional modeling of a lithium-polymer battery. J. Power Sources 2006, 163, 151–157. [Google Scholar] [CrossRef]
  12. Yi, J.; Kim, U.S.; Shin, C.B.; Han, T.; Park, S. Modeling the temperature dependence of the discharge behavior of a lithium-ion battery in low environmental temperature. J. Power Sources 2013, 244, 143–148. [Google Scholar] [CrossRef]
  13. Tang, Y.; Wu, L.; Wei, W.; Wen, D.; Guo, Q.; Liang, W.; Xiao, L. Study of the thermal properties during the cyclic process of lithium ion power batteries using the electrochemical-thermal coupling model. Appl. Therm. Eng. 2018, 137, 11–22. [Google Scholar] [CrossRef]
  14. Panchal, S.; Mathew, M.; Fraser, R.; Fowler, M. Electrochemical thermal modeling and experimental measurements of 18650 cylindrical lithium-ion battery during discharge cycle for an EV. Appl. Therm. Eng. 2018, 135, 123–132. [Google Scholar] [CrossRef]
  15. Mastali, M.; Foreman, E.; Modjtahedi, A.; Samadani, E.; Amirfazli, A.; Farhad, S.; Fraser, R.A.; Fowler, M. Electrochemical-thermal modeling and experimental validation of commercial graphite/LiFePO4pouch lithium-ion batteries. Int. J. Therm. Sci. 2018, 129, 218–230. [Google Scholar] [CrossRef]
  16. Bahrami, M.; Consider, N.C.; Water, S. Natural Convection. Eng. Thermodyn. Heat Transf. 2011, 388, 1–7. [Google Scholar]
  17. ANSYS, Inc. ANSYS FLUENT Manual; ANSYS, Inc.: Cannonsburg, PA, USA, 2018. [Google Scholar]
  18. Hentunen, A.; Lehmuspelto, T.; Suomela, J. Time-domain parameter extraction method for thévenin-equivalent circuit battery models. IEEE Trans. Energy Convers. 2014, 29, 558–566. [Google Scholar] [CrossRef]
  19. Stroe, A.I.; Stroe, D.I.; Swierczynski, M.; Teodorescu, R.; Kær, S.K. Lithium-Ion battery dynamic model for wide range of operating conditions. In Proceedings of the 2017 International Conference on Optimization of Electrical and Electronic Equipment (OPTIM) & 2017 International Aegean Conference on Electrical Machines and Power Electronics (ACEMP), Brasov, Romania, 25–27 May 2017; pp. 660–666. [Google Scholar]
  20. Madani, S.; Schaltz, E.; Kær, S.K.; Madani, S.S.; Schaltz, E.; Kær, S.K. Heat Loss Measurement of Lithium Titanate Oxide Batteries under Fast Charging Conditions by Employing Isothermal Calorimeter. Batteries 2018, 4, 59. [Google Scholar] [CrossRef]
  21. Wu, B.; Li, Z.; Zhang, J. Thermal Design for the Pouch-Type Large-Format Lithium-Ion Batteries: I. Thermo-Electrical Modeling and Origins of Temperature Non-Uniformity. J. Electrochem. Soc. 2014, 162, A181–A191. [Google Scholar] [CrossRef]
  22. Guo, M.; White, R.E. A distributed thermal model for a Li-ion electrode plate pair. J. Power Sources 2013, 221, 334–344. [Google Scholar] [CrossRef]
  23. Yi, J.; Lee, J.; Shin, C.B.; Han, T.; Park, S. Modeling of the transient behaviors of a lithium-ion battery during dynamic cycling. J. Power Sources 2015, 277, 379–386. [Google Scholar] [CrossRef]
Figure 1. 13 Ah pouch type commercial lithium-ion battery cell. (a) The battery cell inside fixture. (b) The battery cell and fixture inside the Maccor chamber.
Energies 12 00679 g001
Figure 2. Different components of (a) positive current tab (b) negative current tabs.
Energies 12 00679 g002
Figure 3. Battery cell geometry, which was analysed in this investigation.
Energies 12 00679 g003
Figure 4. Geometrical structured meshing of lithium titanate oxide battery cell.
Energies 12 00679 g004
Figure 5. The lithium-ion battery cell cross-section.
Energies 12 00679 g005
Figure 6. Equivalent circuit model of the battery.
Energies 12 00679 g006
Figure 7. The voltage response of the battery cell to charging and discharging current pulses.
Energies 12 00679 g007
Figure 8. The voltage response of the battery cell for 4 C discharge at 30 °C.
Energies 12 00679 g008
Figure 9. Amount of (a) R1, (b) R2, (c) C1, (d) C2, (e) V0 and (f) OCV.
Energies 12 00679 g009aEnergies 12 00679 g009b
Figure 10. Experimental setup.
Energies 12 00679 g010
Figure 11. A heat generation analysis of lithium titanate oxide battery cell for 300 K.
Energies 12 00679 g011
Figure 12. Experimental temperature results and temperature simulation for 45 A discharge process.
Energies 12 00679 g012
Figure 13. Temperature distribution and experimental results at the end of 52 A discharge.
Energies 12 00679 g013
Figure 14. Temperature distribution of the battery cell at different discharge rates from 0.25 C to 9 C.
Energies 12 00679 g014
Table 1. Coefficients of fifth order Polynomial.
ParametersA1A2A3A4A5A6
R0-0.25C−3.5809 × 10−92.5521 × 10−7−6.7798 × 10−68.3191 × 10−5−0.000469570.0025463
R0-0.5−1.866 × 10−89.4976 × 10−7−1.7805 × 10−50.00015173−0.000612280.0027413
R0-1−9.7461 × 10−95.0726 × 10−7−9.8659 × 10−68.9925 × 10−5−0.000419960.0025851
R0-2−6.1113 × 10−83.5975 × 10−6−8.0772 × 10−50.00086392−0.00445140.01021
R0-4−9.1265 × 10−85.3384 × 10−6−0.000119080.0012635−0.00642780.013877
R1-0.25C−2.114 × 10−81.3532 × 10−6−3.3195 × 10−50.00039194−0.00226850.0064137
R1-0.5−3.2789 × 10−81.9467 × 10−6−4.4325 × 10−50.00048576−0.00261360.0068707
R1-1−3.9476 × 10−82.3809 × 10−6−5.4759 × 10−50.00060016−0.00317730.0078591
R1-2−6.1113 × 10−83.5975 × 10−6−8.0772 × 10−50.00086392−0.00445140.01021
R1-4−9.1265 × 10−85.3384 × 10−6−0.000119080.0012635−0.00642780.013877
R2-0.25C−2.6294 × 10−81.433 × 10−6−2.8897 × 10−50.00026512−0.00109170.0021711
R2-0.5−1.7408 × 10−81.0479 × 10−6−2.3627 × 10−50.00024636−0.00116910.002445
R2-1−2.1097 × 10−81.1844 × 10−6−2.509 × 10−50.00024926−0.00116480.002562
R2-2−4.1644 × 10−82.4069 × 10−6−5.2546 × 10−50.00053695−0.00255640.0049448
R2-4−4.1644 × 10−82.4069 × 10−6−5.2546 × 10−50.00053695−0.00255640.0049448
C1-0.25C−0.00924750.45755−7.804647.08334.95311.78
C1-0.5−0.00198110.067608−0.38574−12.919240.28158.33
C1-1−0.00598240.25455−3.40376.1343215.73184.13
C1-2−0.00546550.25365−3.918913.296219.94136.56
C1-4−0.00791240.40473−7.300144.494157.33113.13
C2-0.25C0.032132−1.714333.427−293.411165.2239.18
C2-0.5−0.0116110.35172−0.50313−72.798747.78550.81
C2-10.012608−0.7239415.828−172.341019.5111.45
C2-2−0.015710.6205−6.7757−20.924827.98−182.01
C2-4−0.0298291.5623−30.689258.86−513.181515
OCV-0.25C6.5341 × 10−8−5.1732 × 10−60.00022863−0.00321240.0282142.0797
OCV-0.5−1.963 × 10⁻⁸−8.8693 × 10−70.00014772−0.00249520.0250672.0873
OCV-1−8.6373 × 10−82.5889 × 10−67.9331 × 10⁻⁵−0.0018660.0223912.0925
OCV-2−4.6552 × 10−86.1797 × 10−70.00011227−0.00205810.0223572.0958
OCV-4−7.1791 × 10−82.0946 × 10−67.9307 × 10⁻⁵−0.00170740.0205332.101

