1. Introduction
The electricity distribution network (DN) is the infrastructure that is the basis of the services provided to citizens, and it is also the backbone of future smart cities. Therefore, increasing attention has been focused on the electric power quality (e.g., in terms of continuity of service and stability of electrical parameters). For this reason, the Italian Authority (ARERA, Italian Regulatory Authority for Energy, Networks and Environment [
1]) has established in Reference [
2] very ambitious benchmark values for the key performance indicators (KPI), normally used to evaluate the quality of electric service [
3] (i.e., the system average interruption duration index, SAIDI, and the system average interruption frequency index, SAIFI). In particular, for the low voltage (LV) users of the distribution system operator (DSO) of Terni (i.e., Terni Distribuzione Elettrica, TDE, which is a productivity unit of ASM Terni S.p.A.), the set targets are: For SAIDI, 28
minutes/user/year in high density areas and 68
minutes/user/year in rural areas, respectively (computed with respect to long interruptions, i.e., longer than 180 s), while for SAIFI, 2.62
number of outages/user/year in high density areas and 6.01
number of outages/user/year in rural areas, respectively (computed with respect both to long and short, i.e., longer than 1 s, interruptions). In 2017, the DSO reached the following values: For SAIDI, 28.963
minutes/user/year in high density areas and 60.844
minutes/user/year in rural areas, respectively; for SAIFI, 1.477
number of outages/user/year in high density areas and 3.976
number of outages/user/year in rural areas, respectively. Although the performance indices set by the authority and achieved by the DSOs are very challenging (i.e., the quality of the electric service is already very good), the feeling that the users have about an electric outage is amplified by the loss of some essential services offered to citizens (e.g., heating, water, mobility, telecommunications), due to their dependence on the continuity of electricity supply, especially when emergency situations occur.
Therefore, the DSOs are in charge of development plans for the improvement of network resilience against extreme natural events [
4], in order to reduce the global impact of electric service failures during these threats. For this reason, it is crucial to act on implanting timely and cost-efficient adaptation measures, in order to reduce the risk and to increase the capability of the system to react.
In literature, several studies assessing the resilience of medium voltage (MV) distribution networks against extreme weather events are available. The general purpose of these studies is to evaluate how the assets’ vulnerability can have technical, social, and economic impacts. Reference [
5] considers two threats, namely heat waves and floods, and proposes two possible countermeasures: Demand-side management and the protection of substations against floodings. References [
6,
7] report experiences about the approaches adopted by DSOs to evaluate resilience considering different threats. Reference [
8] defines a model and proposes metrics in order to measure resilience of a distribution grid, applying the model considering some recent disasters, such as the tsunamis in Chile and Japan, as well as hurricanes in United States. Reference [
9] presents a procedure to assess resilience of a distribution network against ice sleeves threats. Reference [
10] thoroughly reviewed existing studies on resilience assessment and methods for its improvement, considering a resilient load restoration.
Other studies, related to high voltage (HV) networks, are also available. In particular, Reference [
11] developed a model able to assess the resilience of power transmission systems during ice storms; Reference [
12] applied their assessment framework on a reduced version of the Great Britain’s power network; Reference [
13] assessed resilience with respect to typhoons. Reference [
14] presented an enhancement method to improve resilience of wind power penetrated power systems. Moreover, with respect to flooding threats on power systems, some works are also available. Reference [
15] focuses on the resilience of transmission and distribution systems in England against floodings. Reference [
16] assess resilience of critical infrastructure to flooding using a response curve approach, and it moreover outlines the interdependencies between public service and electric energy availability.
This paper presents a procedure able to assess the resilience of a distribution network considering flooding threat. The aim is to validate a workflow, through which a DSO can evaluate the resilience of its own infrastructure as is and it can easily identify the remedial actions that can be adopted to enhance network resilience. The proposed procedure has been applied on a real distribution network located in the center of Italy, owned and operated by TDE.
The paper is organized as follows:
Section 2 describes the methodology to evaluate resilience of a distribution network and describes how flooding events have been modelled;
Section 3 presents results obtained applying the model on a real distribution network as well as criteria to design network enforcement driven by resilience; in
Section 4, a discussion of the results is presented. Finally,
Section 5 concludes the paper.
2. The Proposed Procedure
This section presents the methodology used by the authors to assess the resilience of an MV distribution network and to identify remedial actions able to improve the performance of the system. The main elements and indexes needed to calculate resilience of each single asset of the distribution network are described. In this work, an asset may be a substation or a line (i.e., a basic building block of the model described in
Section 2.3).
2.1. Risk Index
The methodology approach has its starting point from the collaboration and information exchanges among the main Italian stakeholders, which assess the resilience of an electric network as requested by Italian Authority ARERA in Reference [
17] and already reported in References [
7,
9,
18]. These references, as well as the present work, aim at assessing resilience considering a risk index defined as follows:
In Equation (1), D is defined as the magnitude of the considered damage, for instance, the number of users disconnected or the total duration of disconnections. The return period of the event (TR) is an average period that occurs between two events caused by the same threat. TR is identified as the inverse of probability of service disruption (PD):
In this work, PD is the probability that an extreme meteorological event can occur and lead to a fault on an asset of the network (e.g., a line or a substation). With respect to flooding events, details about assessment of TR are provided in
Section 2.4.
In resilience analysis, an additional parameter must be introduced, the equivalent TRe, assigned at each substation and defined as the minimum TR of all assets that lead to a disconnection when they are lost. This parameter allows to evaluate the effect of a threat (i.e., the number of unsupplied customers) on the network independently of the type of the involved asset (substations or lines).
Since the main concern of the work is the distribution network, the extent of damage D is identified as the number of LV users disconnected (NUD). Therefore, the related risk index, IRI, is:
The resilience index (IRE) is the inverse of IRI, being so evaluated by the expression:
2.2. Resilience Indices
The purpose of the method is to define resilience indices that do not depend on the type of threat; indeed, the paper proposes a unique model able to provide results also having consistency in case the model is applied to different scenarios. For this reason, the following additional indices are introduced:
An index able to assess the ability of the network to back-feed users, IGCR:
with k = 1 if TR
e,i = ∞ and k = 0 if TR
e,i ≠ ∞; TR
e,i is the return period of the i-th node, NUC
i is the number of LV users connected to the node, whereas NUT is the number of LV users of the network; the sum in Equation (5) is performed considering all the nodes of the network. The TR
e,i is evaluated considering a generic threat occurring on a branch of the network. This index does not depend on the type of threat, since it is a feature of the network, representing its back-feeding capability.
the degree of network resilience (IGRR) with respect to the threat considered, defined as:
the index of users’ vulnerability (IGVU) from the network, calculated as:
where NUD
j is the number of LV users disconnected when the j-th asset of the network has been removed (i.e., a substation or a line); the sum is performed to all the considered scenarios, which are as many as the branches of the network.
Since Indices (2)–(7) do not depend on a specific threat, they allow to identify remedial actions able to improve the resilience of the network; moreover, the performance of different distribution networks against threats may be compared.
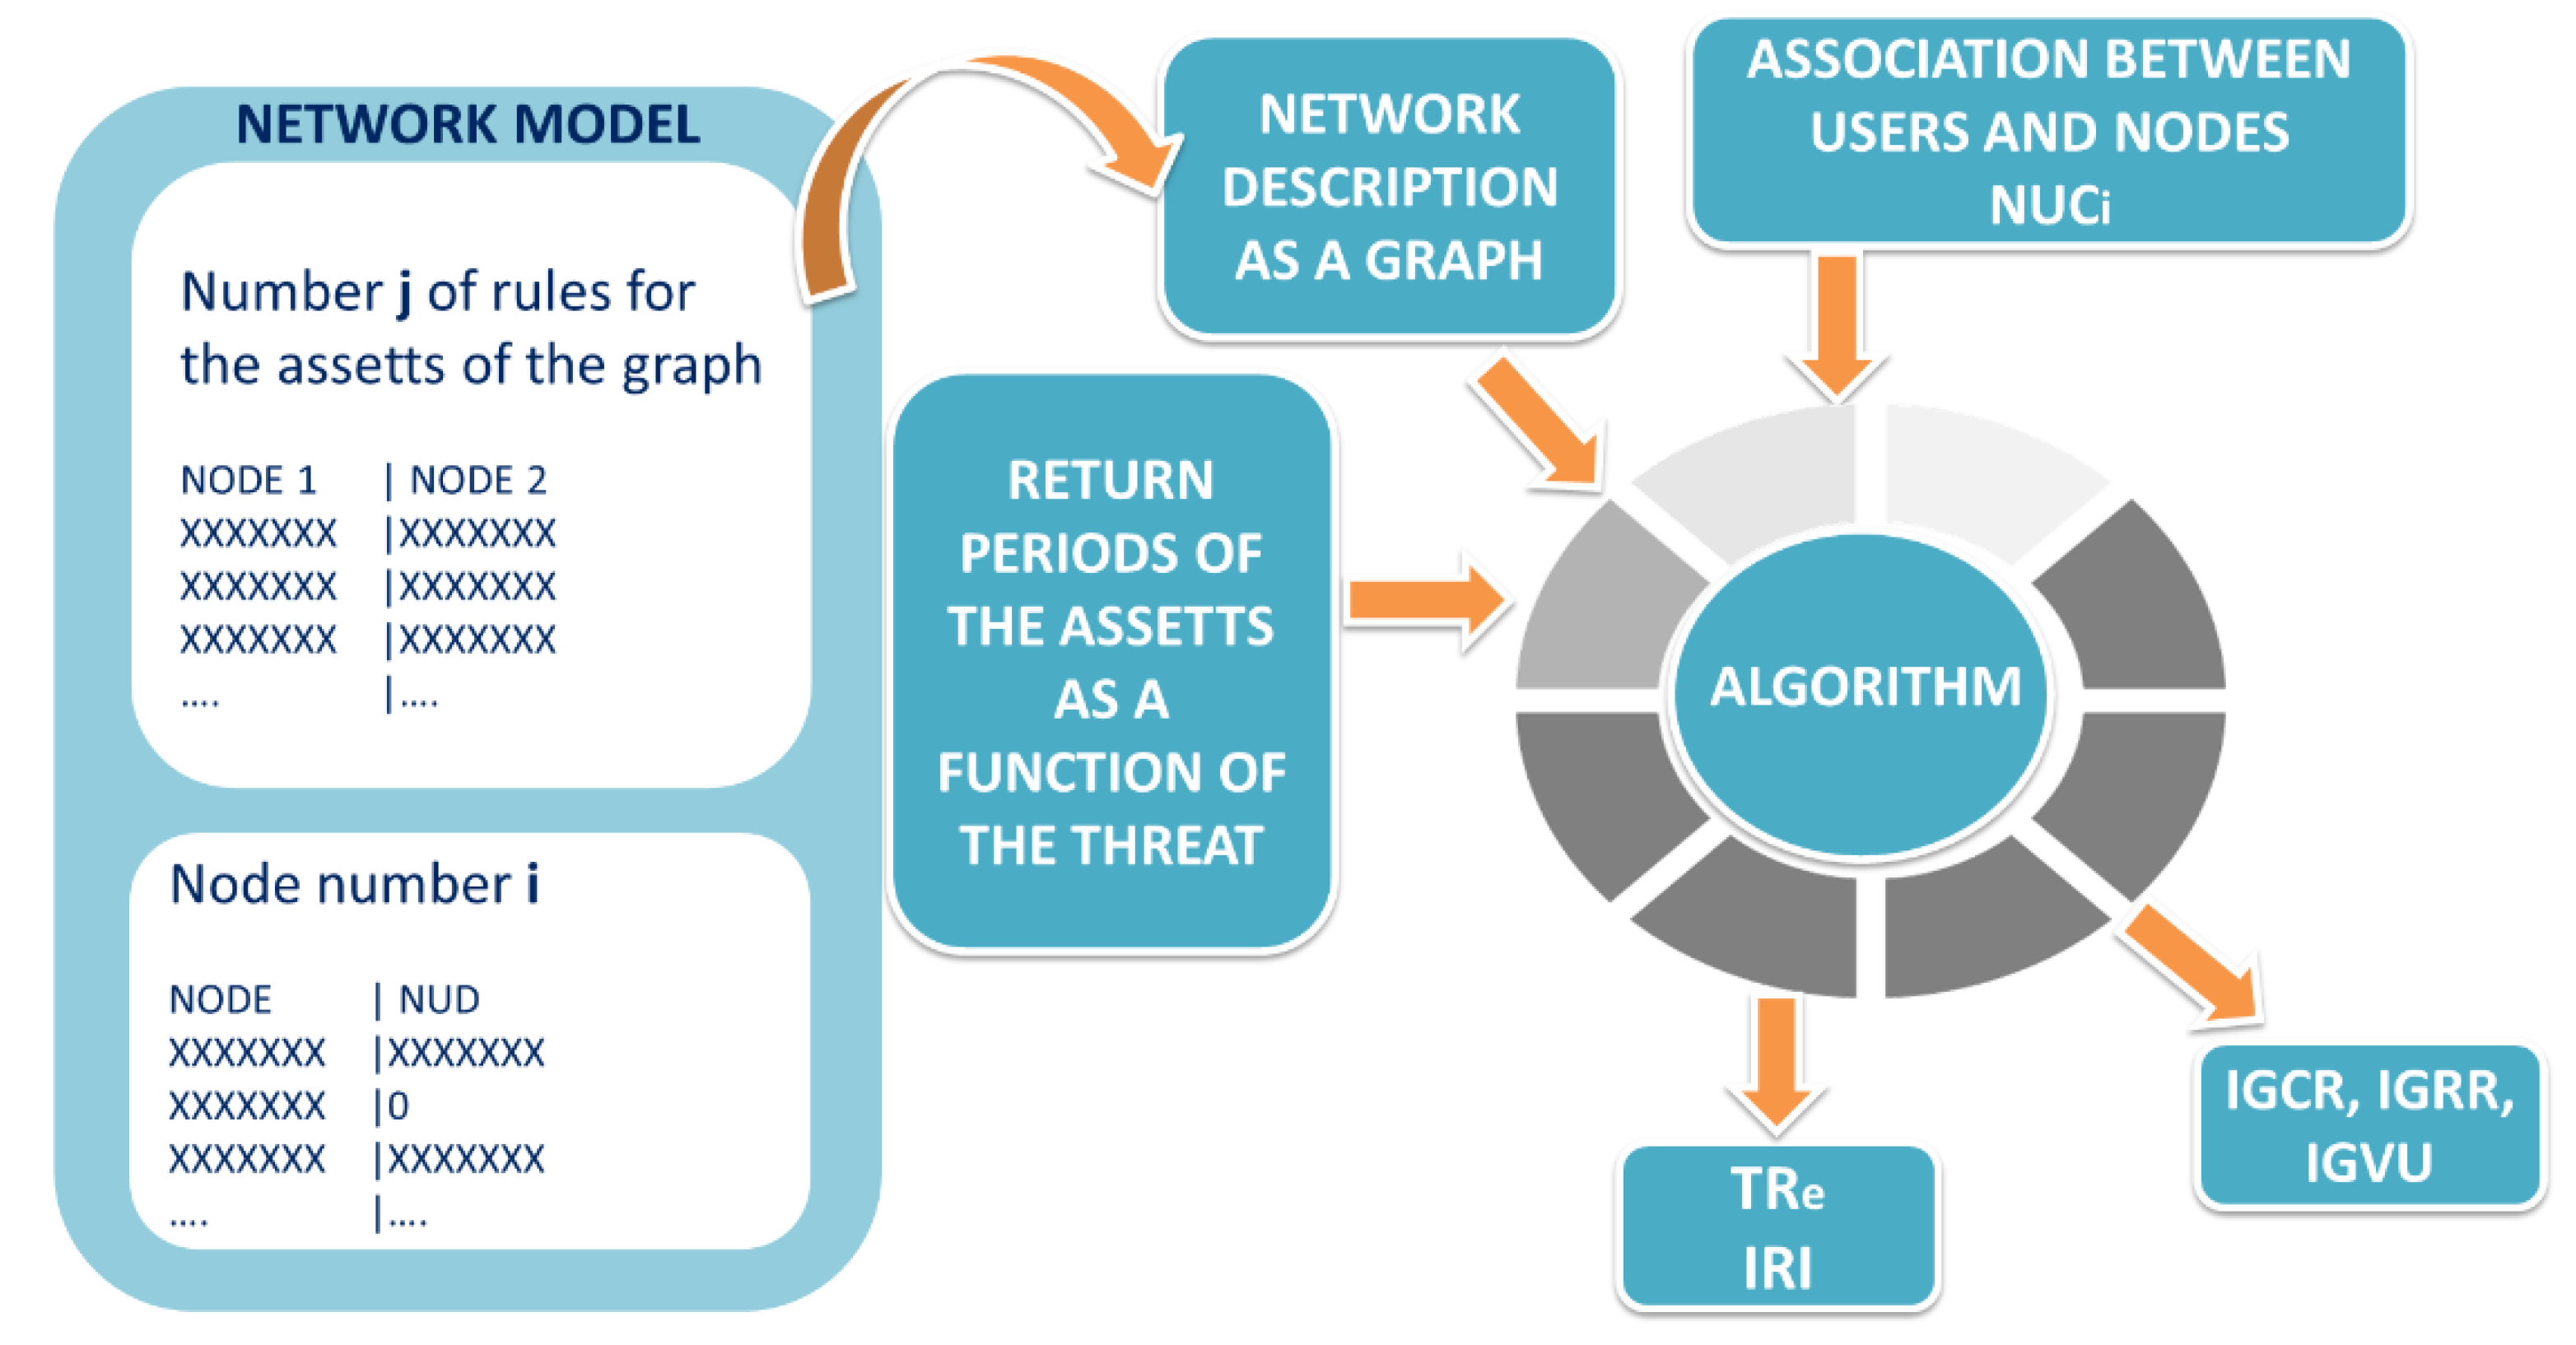
2.3. Simulation Model
In order to assess resilience, a homemade software has been developed by the authors in the Octave environment. Inputs of the procedure are: The topology of the distribution network (i.e., nodes and connections between nodes in the network), the typology of network components (i.e., line, primary substations, secondary substations (SSs), switches and disconnectors), and the number of users supplied by each substation. All data are provided by the SCADA (Supervisory Control and Data Acquisition) system, installed in the Terni DN and owned by TDE. Other relevant inputs are the TR of each asset, calculated considering both external conditions (i.e., probability of the threat) and asset features (i.e., the asset ability to resist the specific threat), according to the methodology described in
Section 2.4. The procedure provides in output all the relevant resilience indices of the DN, i.e., TR
e, IRI, IGCR, IGRR, and IGVU. A schematic representation of the whole simulation model is given in
Figure 1.
Index TRe is calculated considering all closed switches and all equipment able to perform back-feeding; all external interconnections at the HV and MV level are also considered available. Moreover, all HV/MV transformers supplying the DN, as well as all SSs, may be represented in the model.
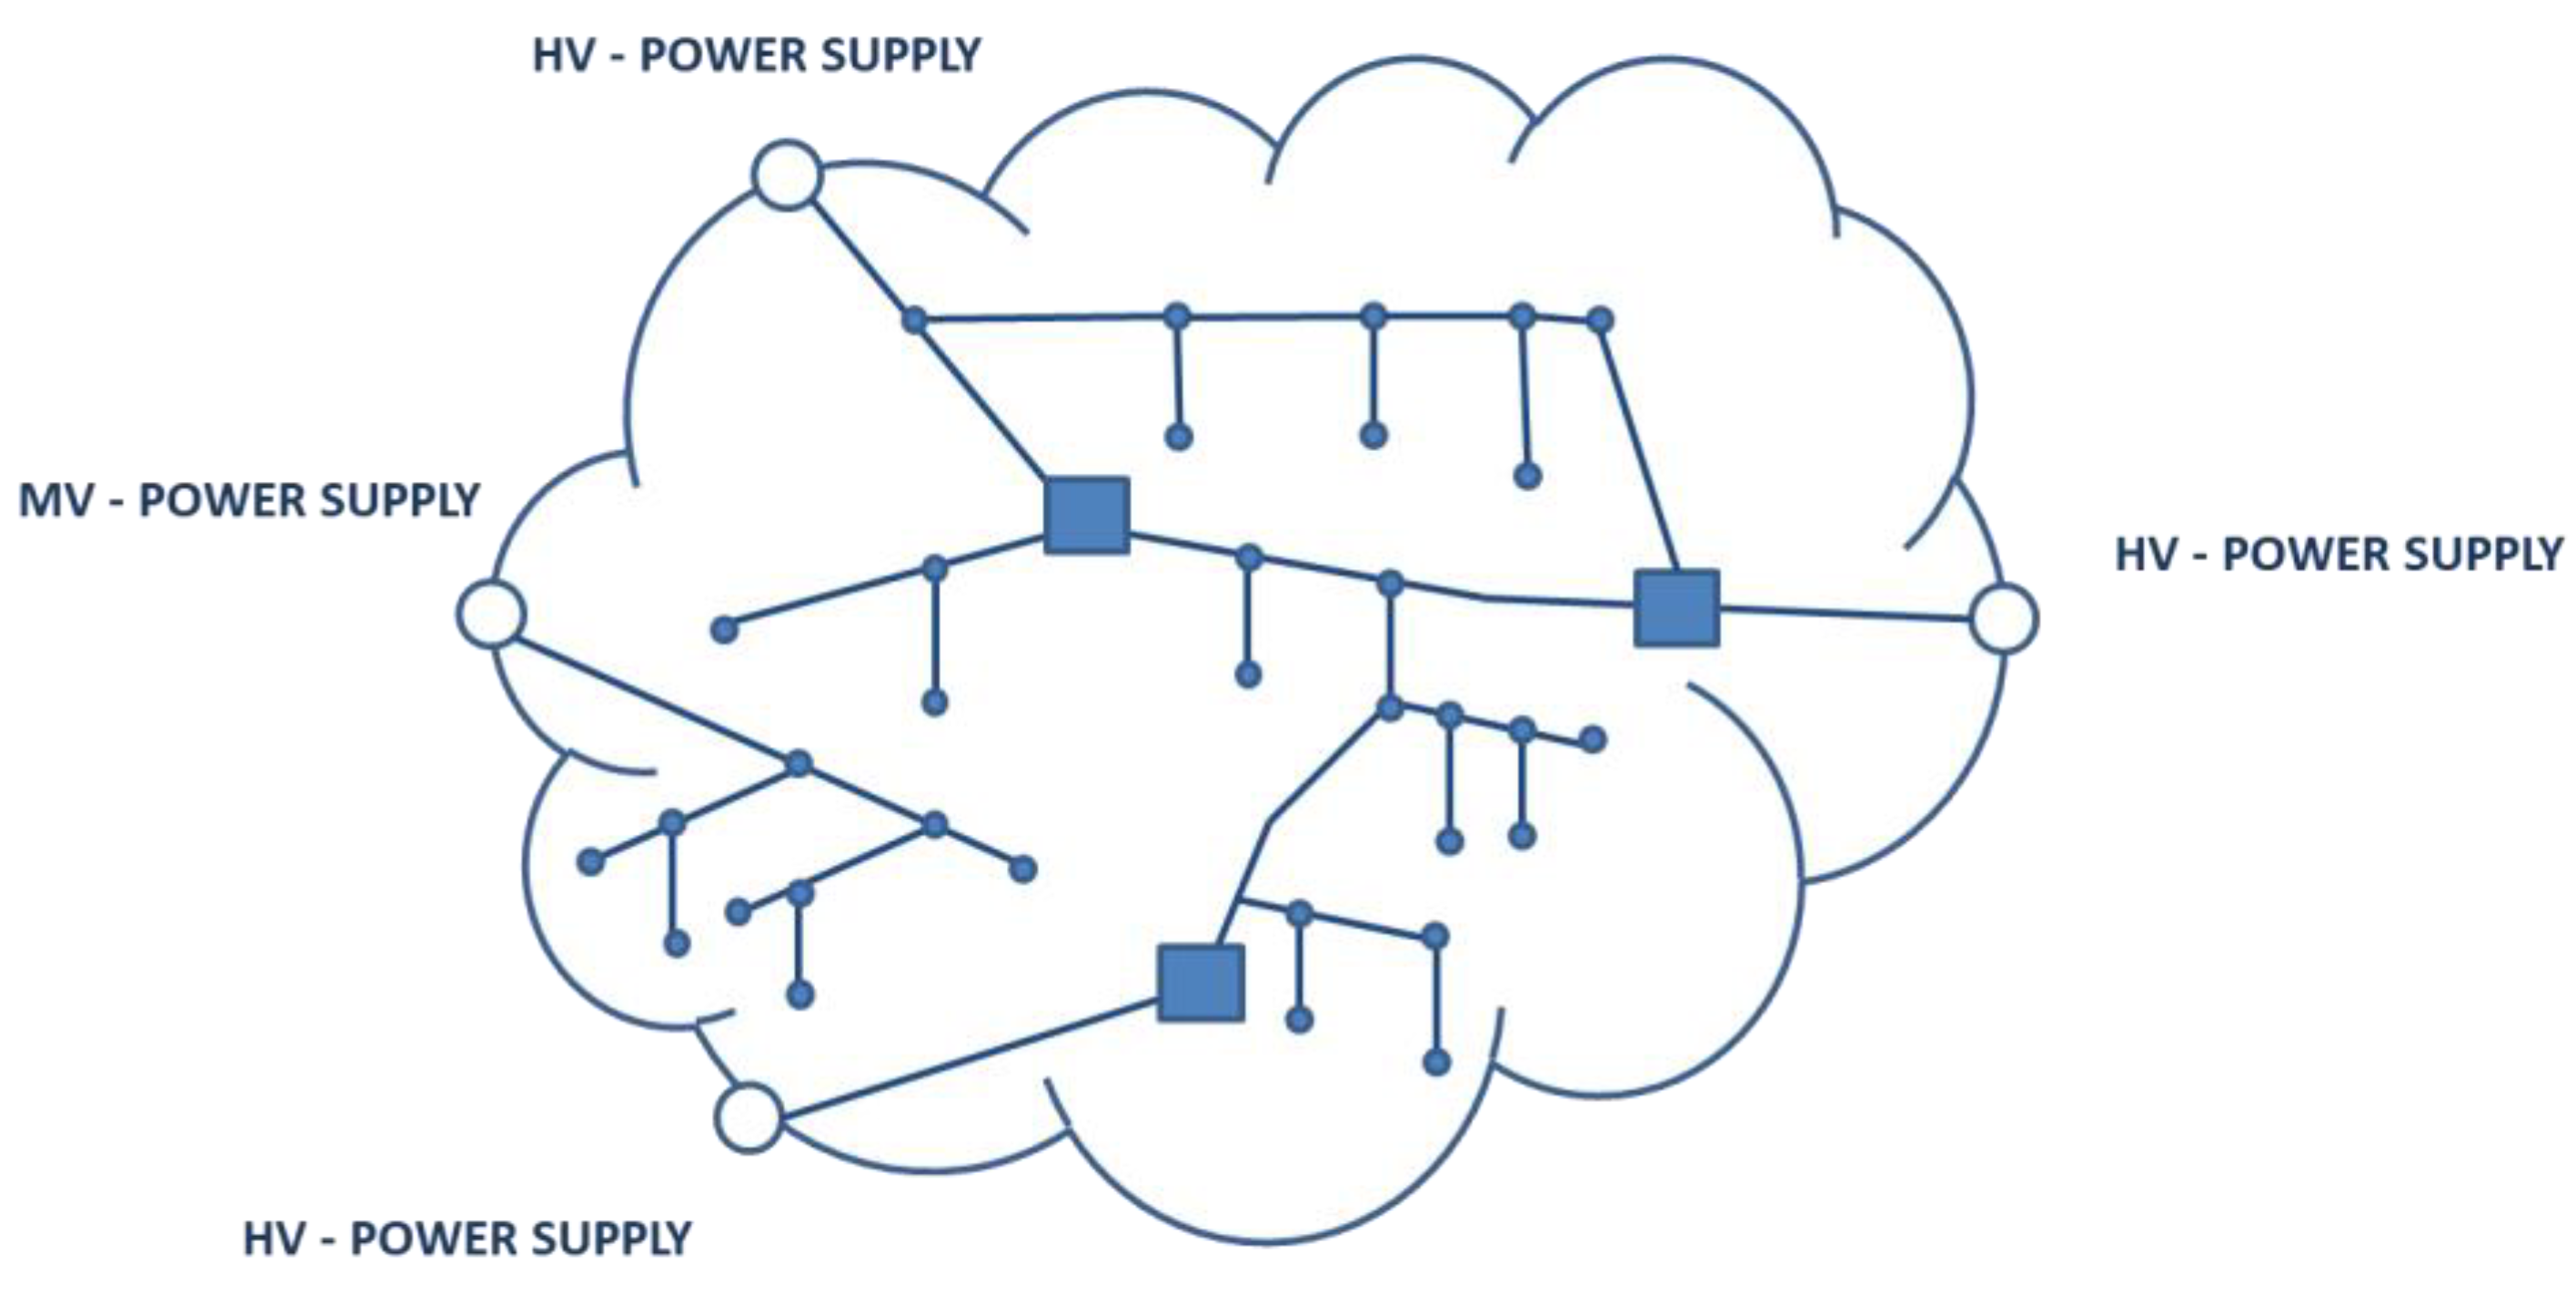
At first, the procedure produces the network graph (all switches and interconnectors are considered close): In the graph, nodes may be either substations or stiff connections, whereas branches are lines connecting two nodes. The procedure represents the network graph by means of a table: Each row of the table is a network connection between two nodes and is described by a from-node, a to-node, and the connection type (i.e., cable line, overhead line). The DN interconnections with power supply points at MV and HV levels have also been taken into account, since such interconnections may have a large impact on network resilience (
Figure 2). The aim is to develop an algorithm able to inspect the graph that has a single starting point. Moreover, the return periods of each single interconnected network have been taken into account by assigning an appropriate return period to the fictitious interconnection branches.
The exploration of the network graph has been carried out by means of the Dulmage–Mendelsohn decomposition algorithm [
19], which also allows identifying all isolated nodes in the network. Indeed, the aim of the simulation model is to identify all the substations (i.e., the number of the users associated with these ones) that will be unsupplied whenever an asset is lost because of a threat event. Then, IRI and all other indices are calculated according to TR
e.
The procedure considers all connection scenarios, each one obtained by eliminating an asset: In such a way, all faults that may occur in the DN are simulated. As a result of the procedure, the nodes and/or NUD that cannot be supplied in each scenario are provided.
It is worth pointing out that the proposed simulation model is independent of the type of threat, as well as some indices introduced in this paper in order to assess the resilience of the network.
2.4. Prediction of Substation Faults Caused by Flooding
The aim of this subsection is to present the methodology used to identify the return time of fault events caused by floods. According to the previous subsection, it has been assumed that flooding events can affect only the substations, namely, a node is eliminated from the graph at each iteration of the simulation model. The probability that a substation is disconnected because of a flooding event consists of two elements, namely, the return time of the weather event and the vulnerability of the substation, which is the fault probability of the asset when the event occurs.
Therefore, the probability of the flooding event has been firstly assessed. These data are easily available, since they are provided by the authorities that supervise the hydrogeological basins and evaluate the return time of the floods. With respect to this work, the applied methodology is provided by the authority responsible for the management of the hydrogeological basins that affects the action area (i.e., the Terni basin).
With respect to the return times of flooding events, the hydrogeological risk plan drawn up by the Province of Terni and Tiber River Basin Authority has been used [
20]. These data have been provided by the plan of hydrogeological assets [
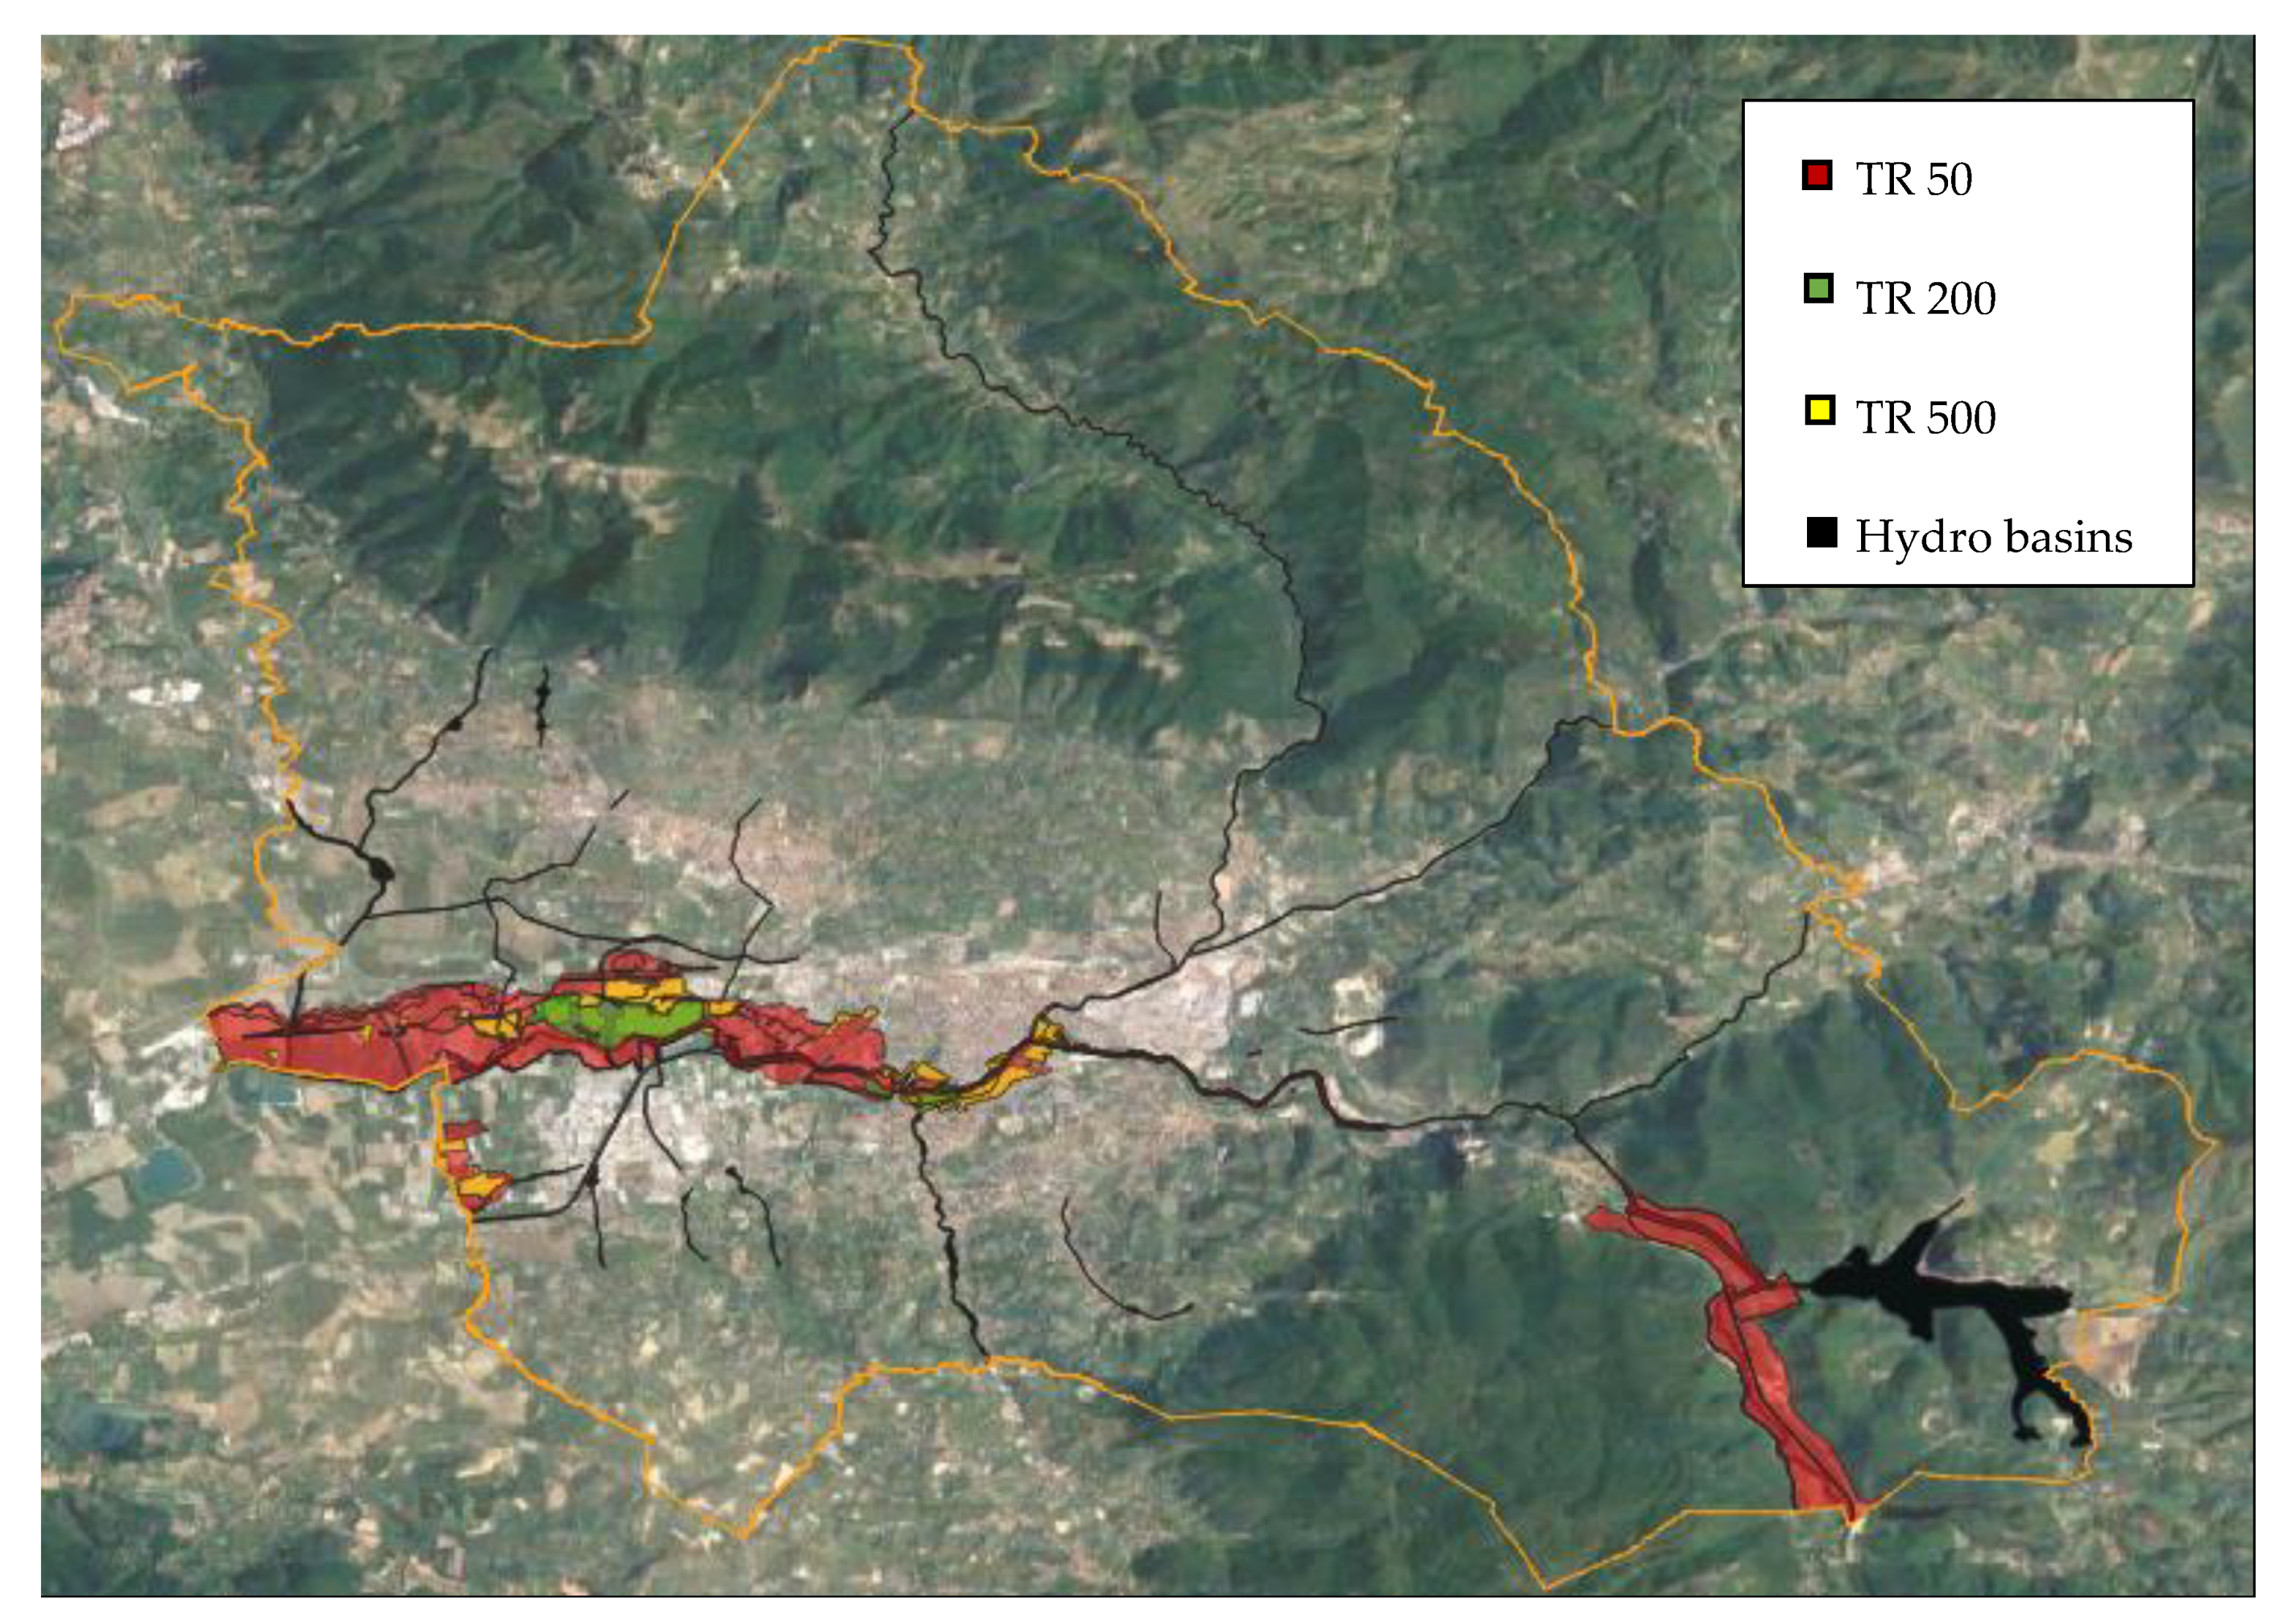
21]. Among the Terni municipality areas, the authority considered only the ones characterized by hydrogeological risk and grouped them into three different zones, each one with a specific return time, as in the following:
Zone A, with 50 years return time (high hydrogeological risk);
Zone B, with 200 years return time (medium hydrogeological risk);
Zone C, with 500 years return time (low hydrogeological risk).
As a last step, for each substation in the distribution network, the software assigns the following return times:
TR = 50 years for substations in Zone A;
TR = 200 years for substations in Zone B;
TR = 500 years for substations in Zone C;
TR = 999 years for substations not located in any of the above listed zones (i.e., no hydrogeological risk).
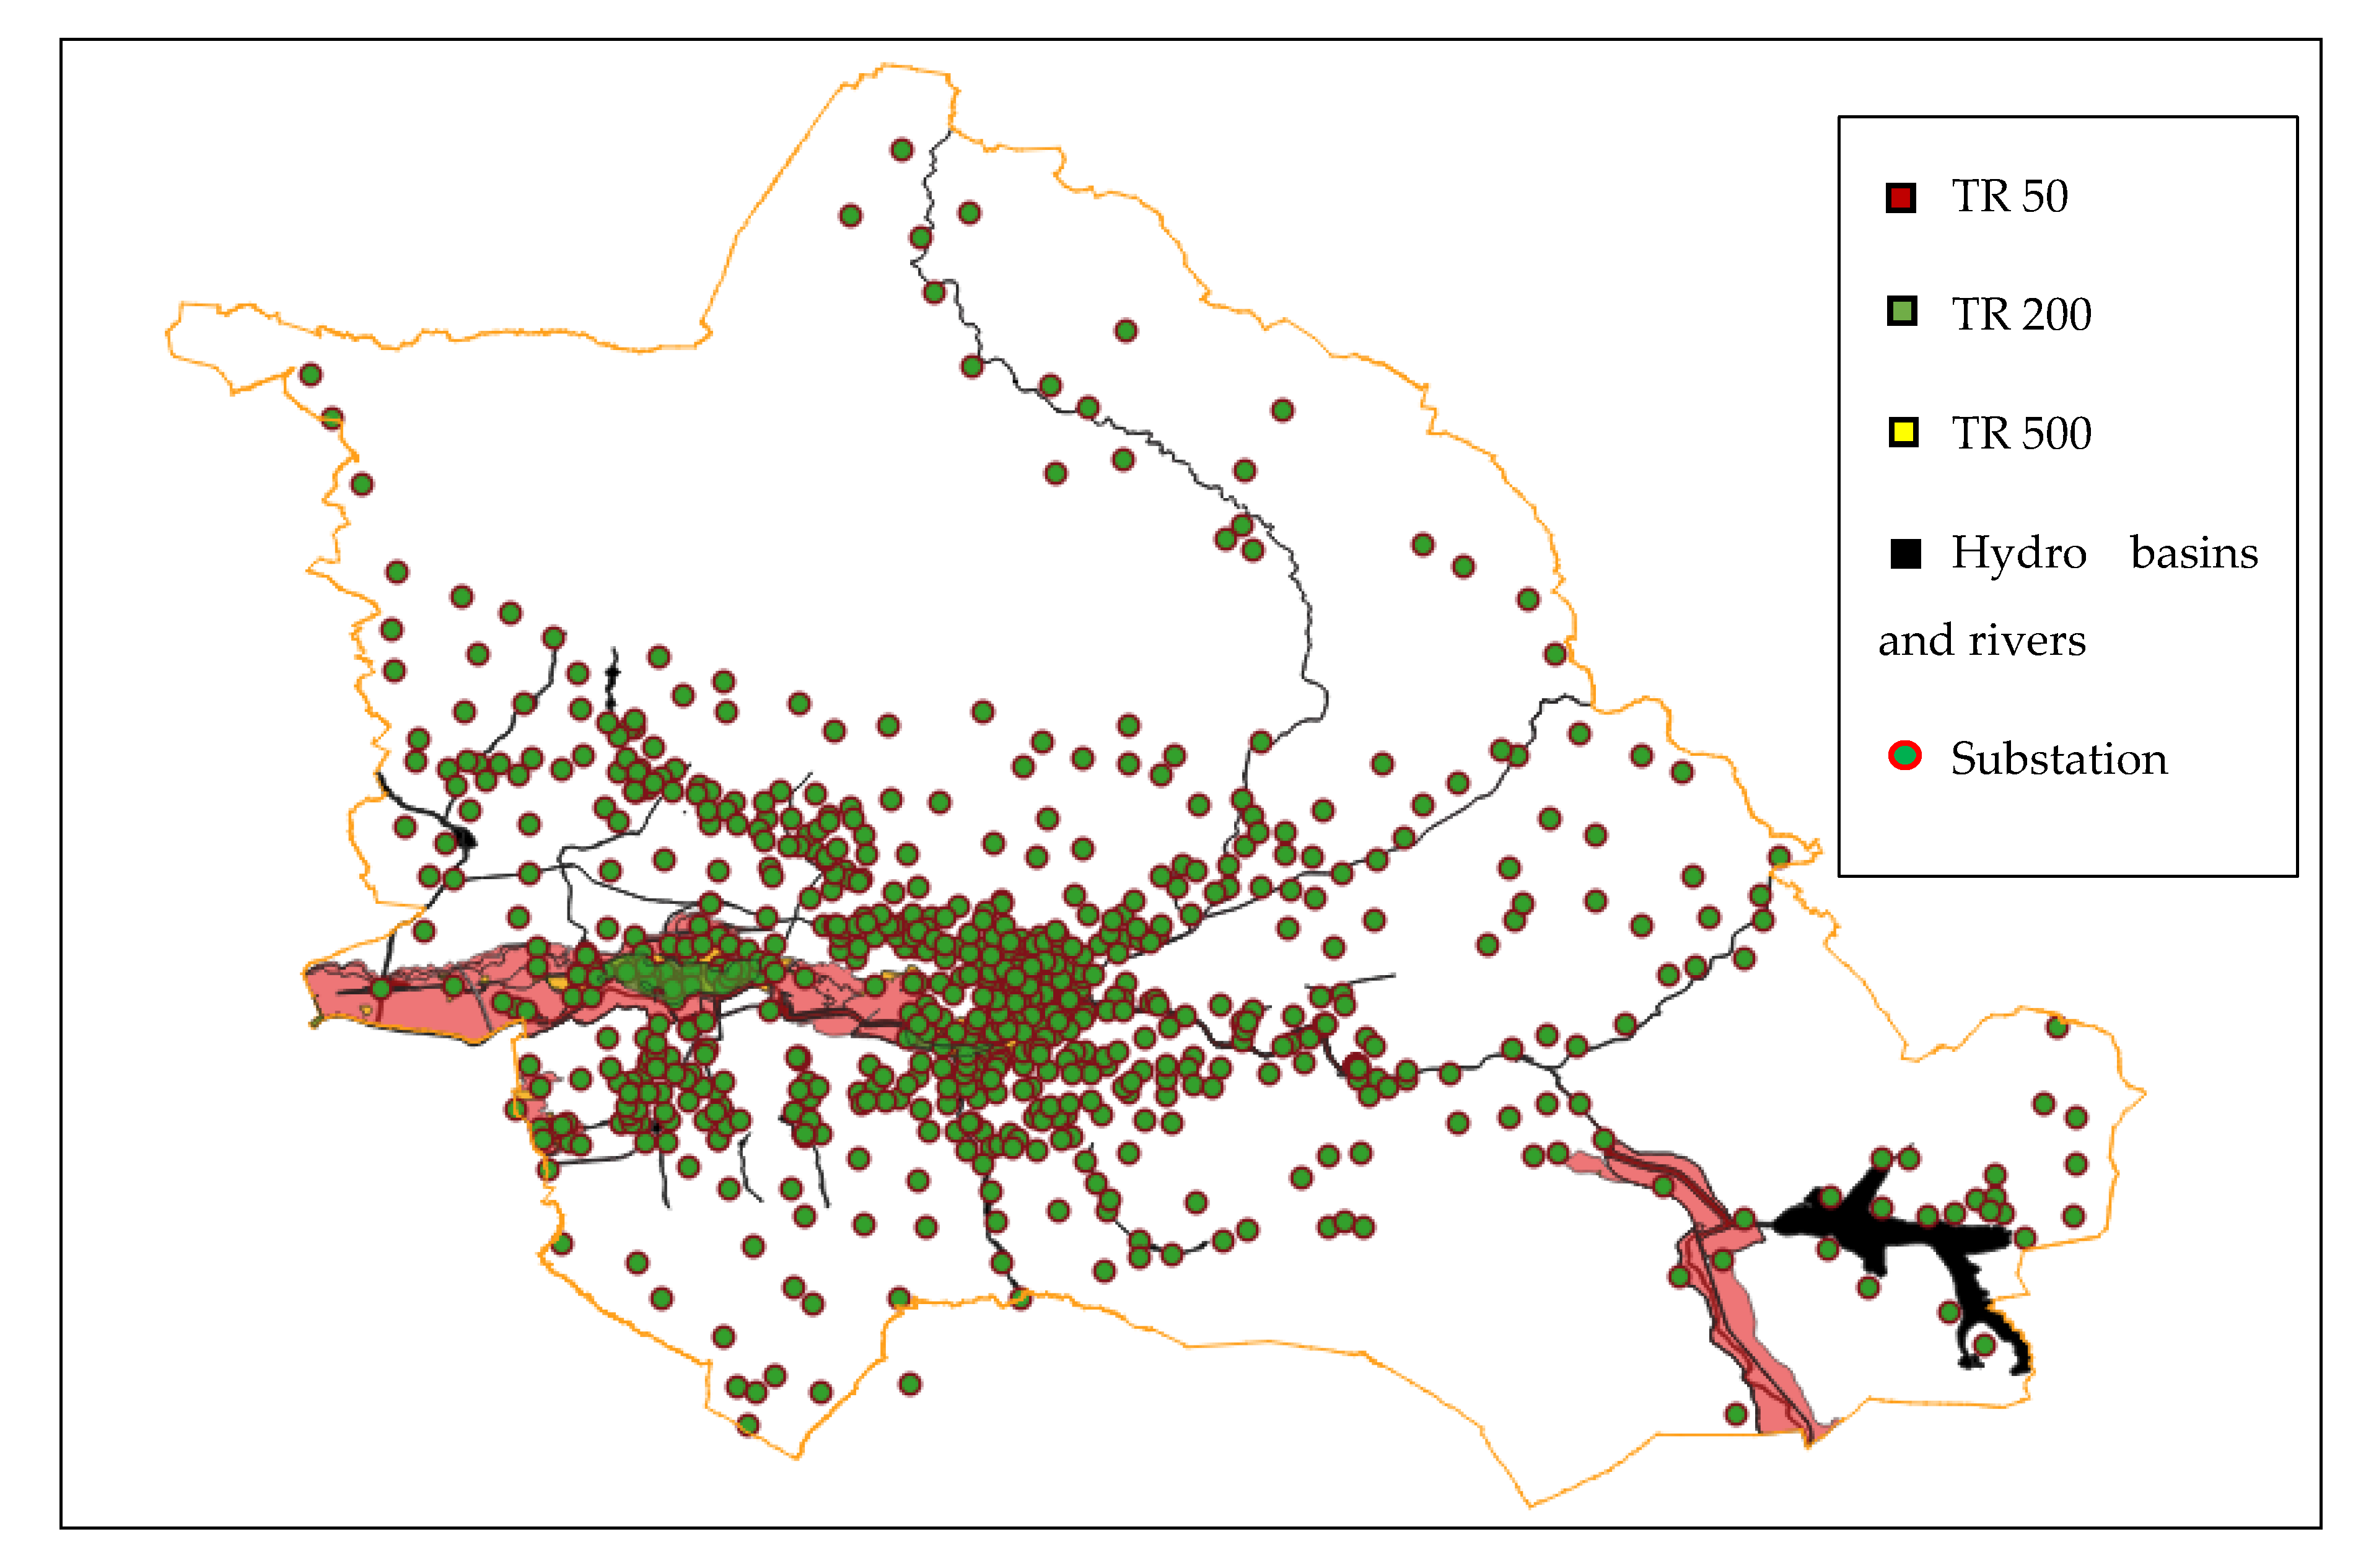
With respect to the action area, these zones are reported in
Figure 3.
As already carried out in previous work [
22], by means of the open-source QGIS application, a map with the coordinates of the substations has been overlapped to the map defining the areas with the same probability of a flooding event (
Figure 4). Therefore, a correlation between the floodable areas and the return times in case of such events has been defined.
In order to evaluate the probability that an extreme event actually affects a substation, a vulnerability coefficient has been taken into account. The coefficient can vary in the range between 0 and 1 and corresponds to the probability that a flooding event leads to a fault. For each substation, the vulnerability coefficient has been evaluated by means of an empirical approach, as presented in Reference [
23], because of the absence of proper historical data correlating weather events and substation faults. Coefficient values used in the simulation model are listed below:
For each underground substation, the coefficient has been considered equal to 1, assuming that a flooding event leads to a disconnection of that asset;
for each substation that could be affected partially by the floods, one of an uncertain degree has been considered. Substations that can be included in this group are those inside buildings, boxes, and prefabricated systems. The vulnerability coefficient has been evaluated equal to 0.75;
for the secondary substations raised off the ground (e.g., pole-mount transformers), the coefficient has been considered null, since a flooding event is not able to cause the disconnection of the asset.
3. Results
3.1. Action Area
The action area considered in this paper is the TDE’s MV/LV distribution network. Three primary substations and seven HV/MV transformers connect the DN to the Italian transmission system. The network also includes six MV/MV substations, since there are two different voltage levels, namely, 10 kV and 20 kV. LV customers are supplied by means of 588 secondary substations (127 MVA aggregate installed power), of which 96 are connected and remotely controlled by a SCADA system.
The overall length of MV lines is 637 km (of which 62.23% are overhead lines and 37.77% are underground cables); the LV distribution grid covers an area of 1456 km (23.25% overhead lines with nude conductors, 33.40% aerial cables, and 43.35% underground cables). About 65,000 LV users are supplied, with a total installed capacity of about 250 MW; the average daily energy distributed is about 890 MWh, and a notable amount of distributed generation is also connected to the grid. At the end of 2017, the energy mix was the following:
1217 PV arrays (31 MW) producing 36 GWh yearly;
7 Hydro plants (10 MW) producing 68 GWh yearly;
4 biomass/waste to energy plants (20 MW) producing 78 GWh yearly.
Considering the aim of the paper, it is worth presenting the main geographical characteristics of the area under study, represented by the municipality of Terni, which covers a 211 km2 surface, with an elevation ranging from 104 m to 1017 m above the sea level. Fifty-two point six percent of Terni territory is mountainous, whereas hills cover 31.6%, and the remaining 13.4% is lowland. The average maximum temperature is 21.1 °C, whereas the minimum is −10°C; lastly, the average amount of rainy days in one year is 86 (852 mm is the average rain level).
3.2. Simulation Results
Simulation results are presented in this subsection. Firstly, the assumptions made in order to carry out the analysis are listed below:
All external interconnections (at HV and MV levels) are fully available, since this depends on other stakeholder infrastructures (i.e., the national transmission system and the networks of other DSOs); however, if TR values of these infrastructures are known, the algorithm can easily take them into account;
vulnerability has been accounted for based on the experience of the network operators because of the absence of proper historical data that correlate weather events to substation faults;
the algorithm does not take into account current limits that a network reconfiguration could overcome;
the TR of the substations outside the flooding area has been assumed equal to 999, independently of the vulnerability;
all remedial actions considered in this study for the improvement of the resilience are at MV level; the LV grid is always assumed radial, both in topology and in operation.
Table 1 shows the results of the simulations: Each substation corresponds to a row, and its identifier is reported in column 2. In
Table 1, substations are sorted by NUD, which does not depend on the TR evaluation, since it is the actual number of users that could be disconnected from the grid in case of the node loss.
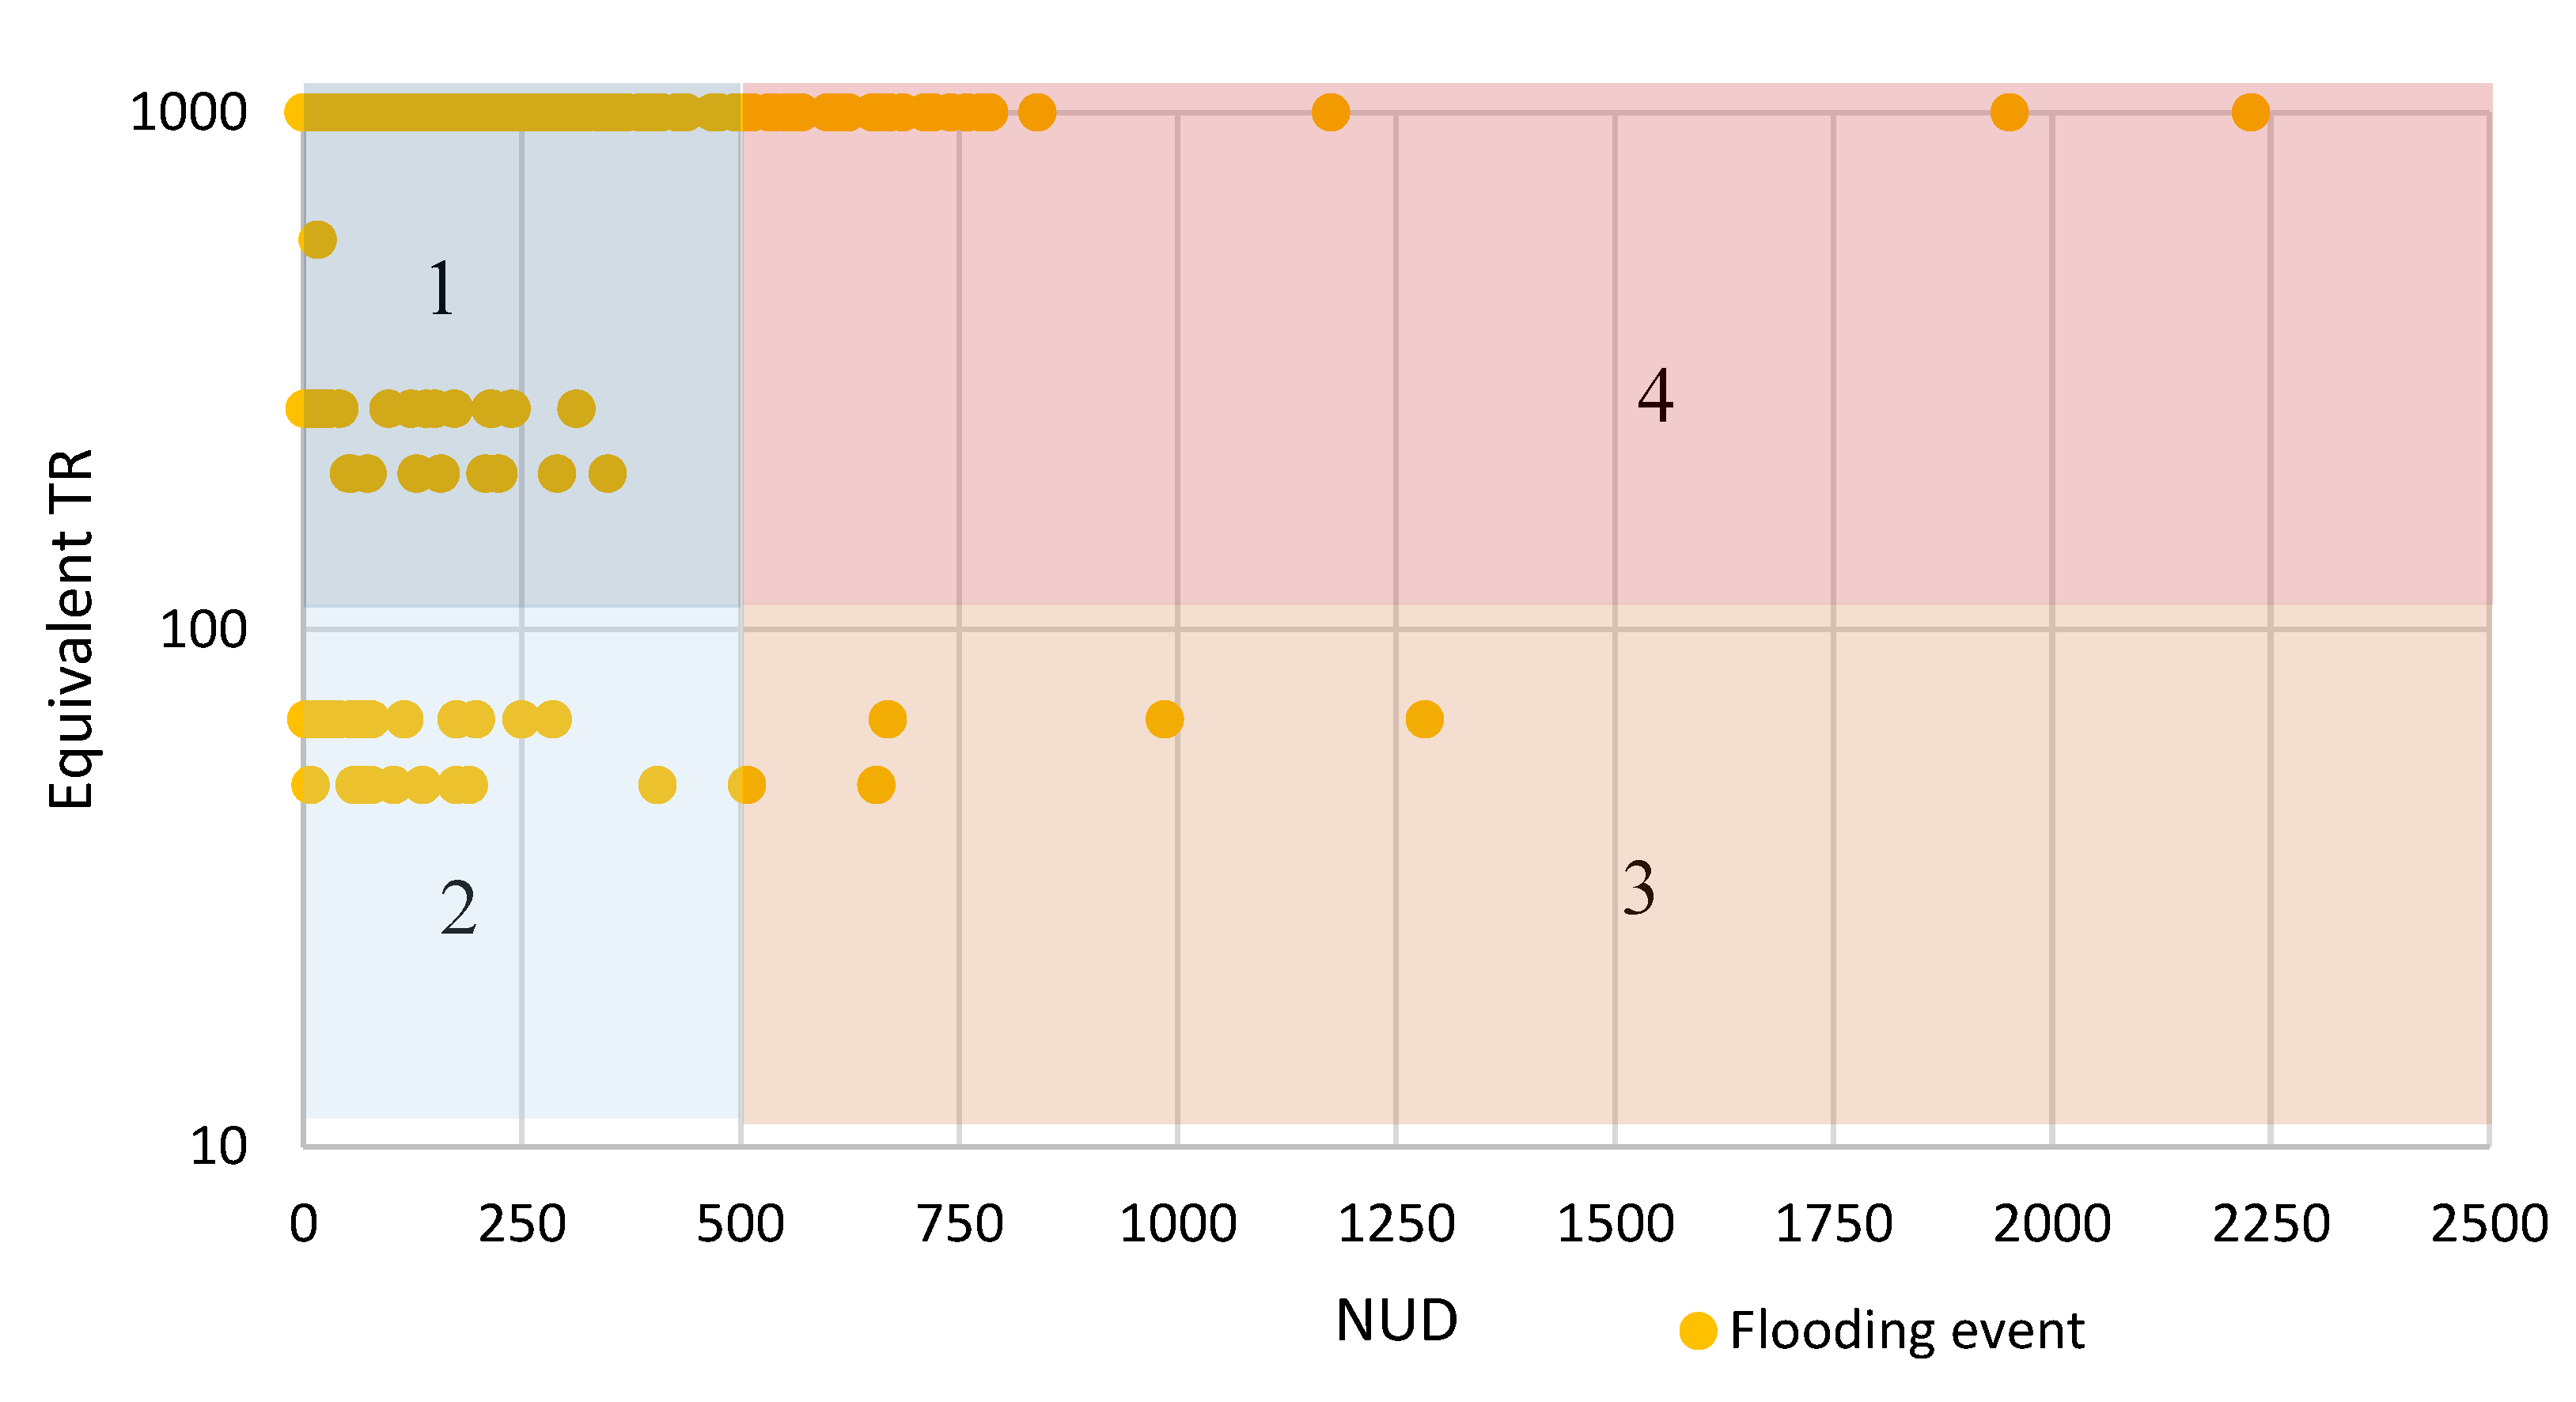
Figure 5 shows the equivalent return times calculated by the procedure for all the possible substation disconnections, with their corresponding NUD.
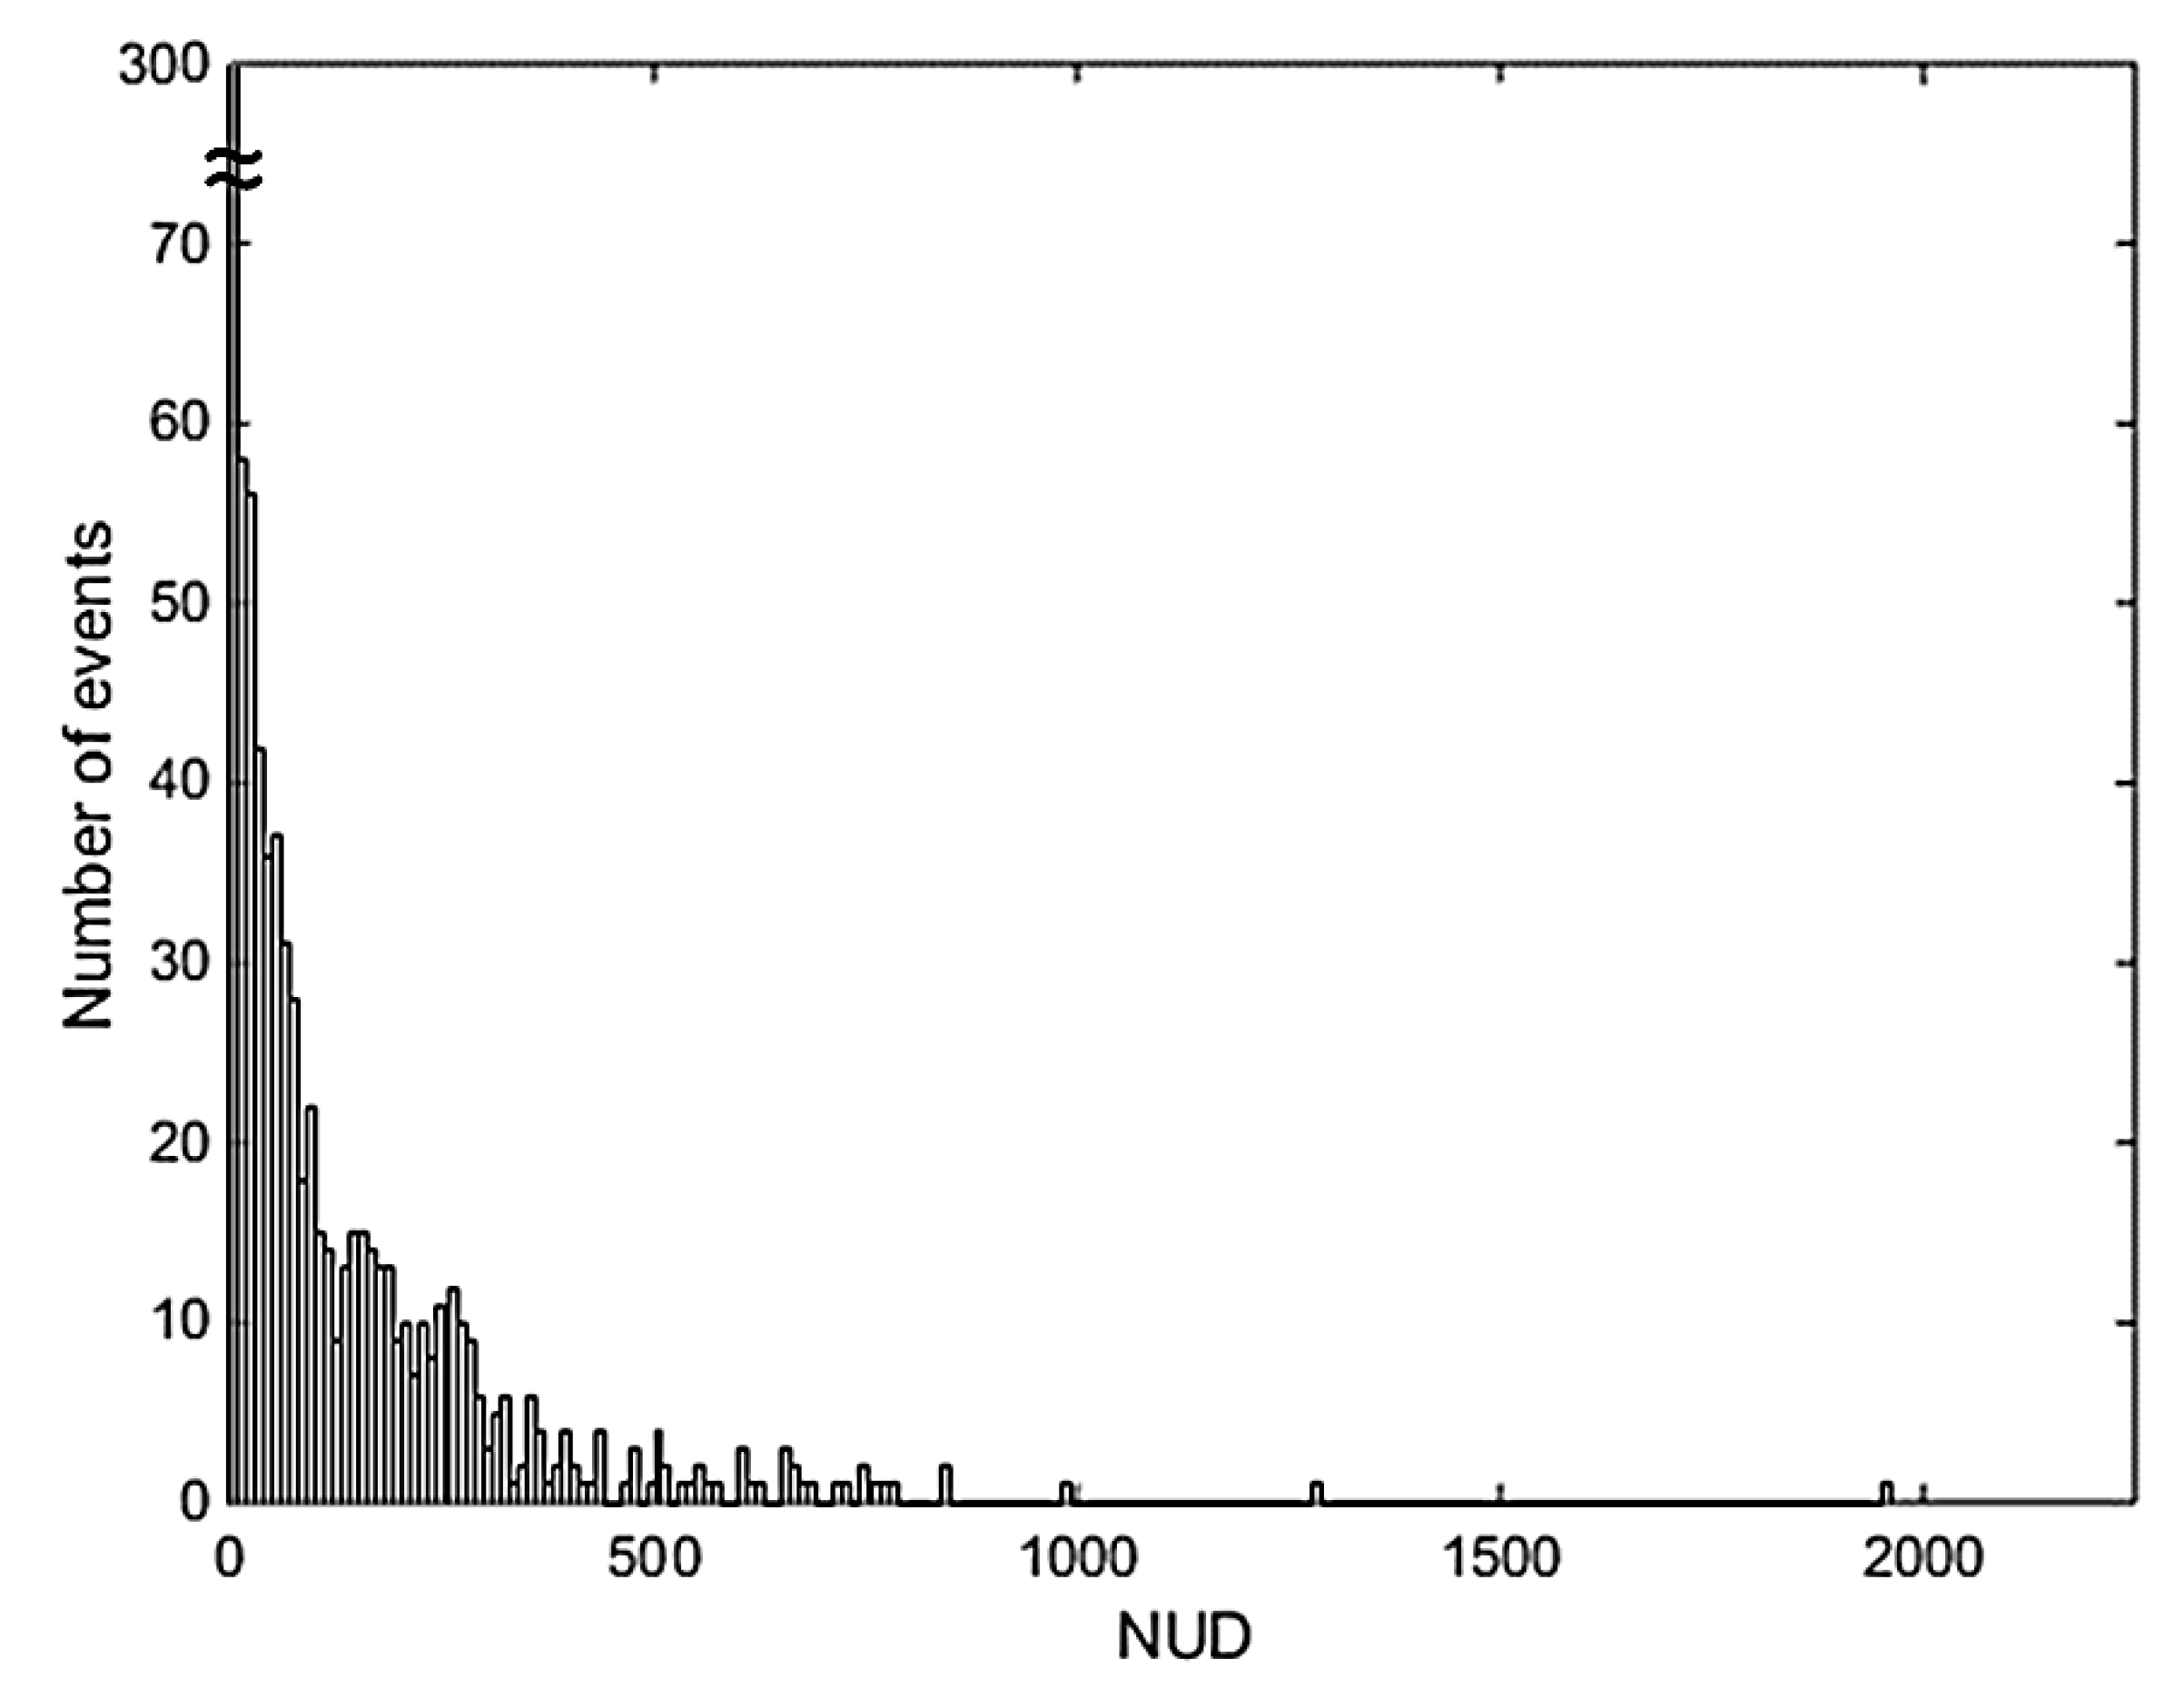
In order to define if events would have a low or high impact, a benchmark equal to 500 NUD has been used; it is the 95th percentile of the statistical distribution (number of events versus NUD), as shown in
Figure 6. Moreover, 500 NUD is about 4.5 times the average number of users connected at a substation in the distribution network (i.e., 110 users).
Therefore, four areas can be identified in the diagram:
At the top left (1), the area collects events having low impact but high return period (i.e., the flooding risk is not foreseen by the hydrogeological authority);
at the bottom left (2), the area corresponds to events that have both low TRe and low NUD;
at the bottom right (3), an area with high NUD and low TRe has been identified;
at the top right (4), the area refers to events that have not so high probability to occur but that would cause a high NUD.
In
Table 2, substations are sorted by IRI (considering only those having NUD greater than 500), evaluated in accordance with Equation (3). This table provides the priority of the interventions to increase the grid resilience with respect to floods: Substations with higher IRI have a higher priority of interventions. If two substations had the same IRI (which is a very rare case, however), the one with the highest NUD would have higher priority. It is worth pointing out that the case of substations with both same IRI and NUD may occur only to substations with very low IRI and NUD values, corresponding to very low priorities. Finally, column 1 of
Table 2 (the substation progressive number #), which refers to the NUD ranking shown in
Table 1, is reported in order to compare the two different sorting strategies.
Additional indices, evaluated in accordance with Equations (5), (6), and (7), are reported in
Table 3. They provide the comparison between ex-ante and ex-post status of network. The ex-post evaluation has been carried out considering all remedial actions on the basis of the priority established by the IRI values in
Table 2 and referring to all substations having a NUD greater than 500.
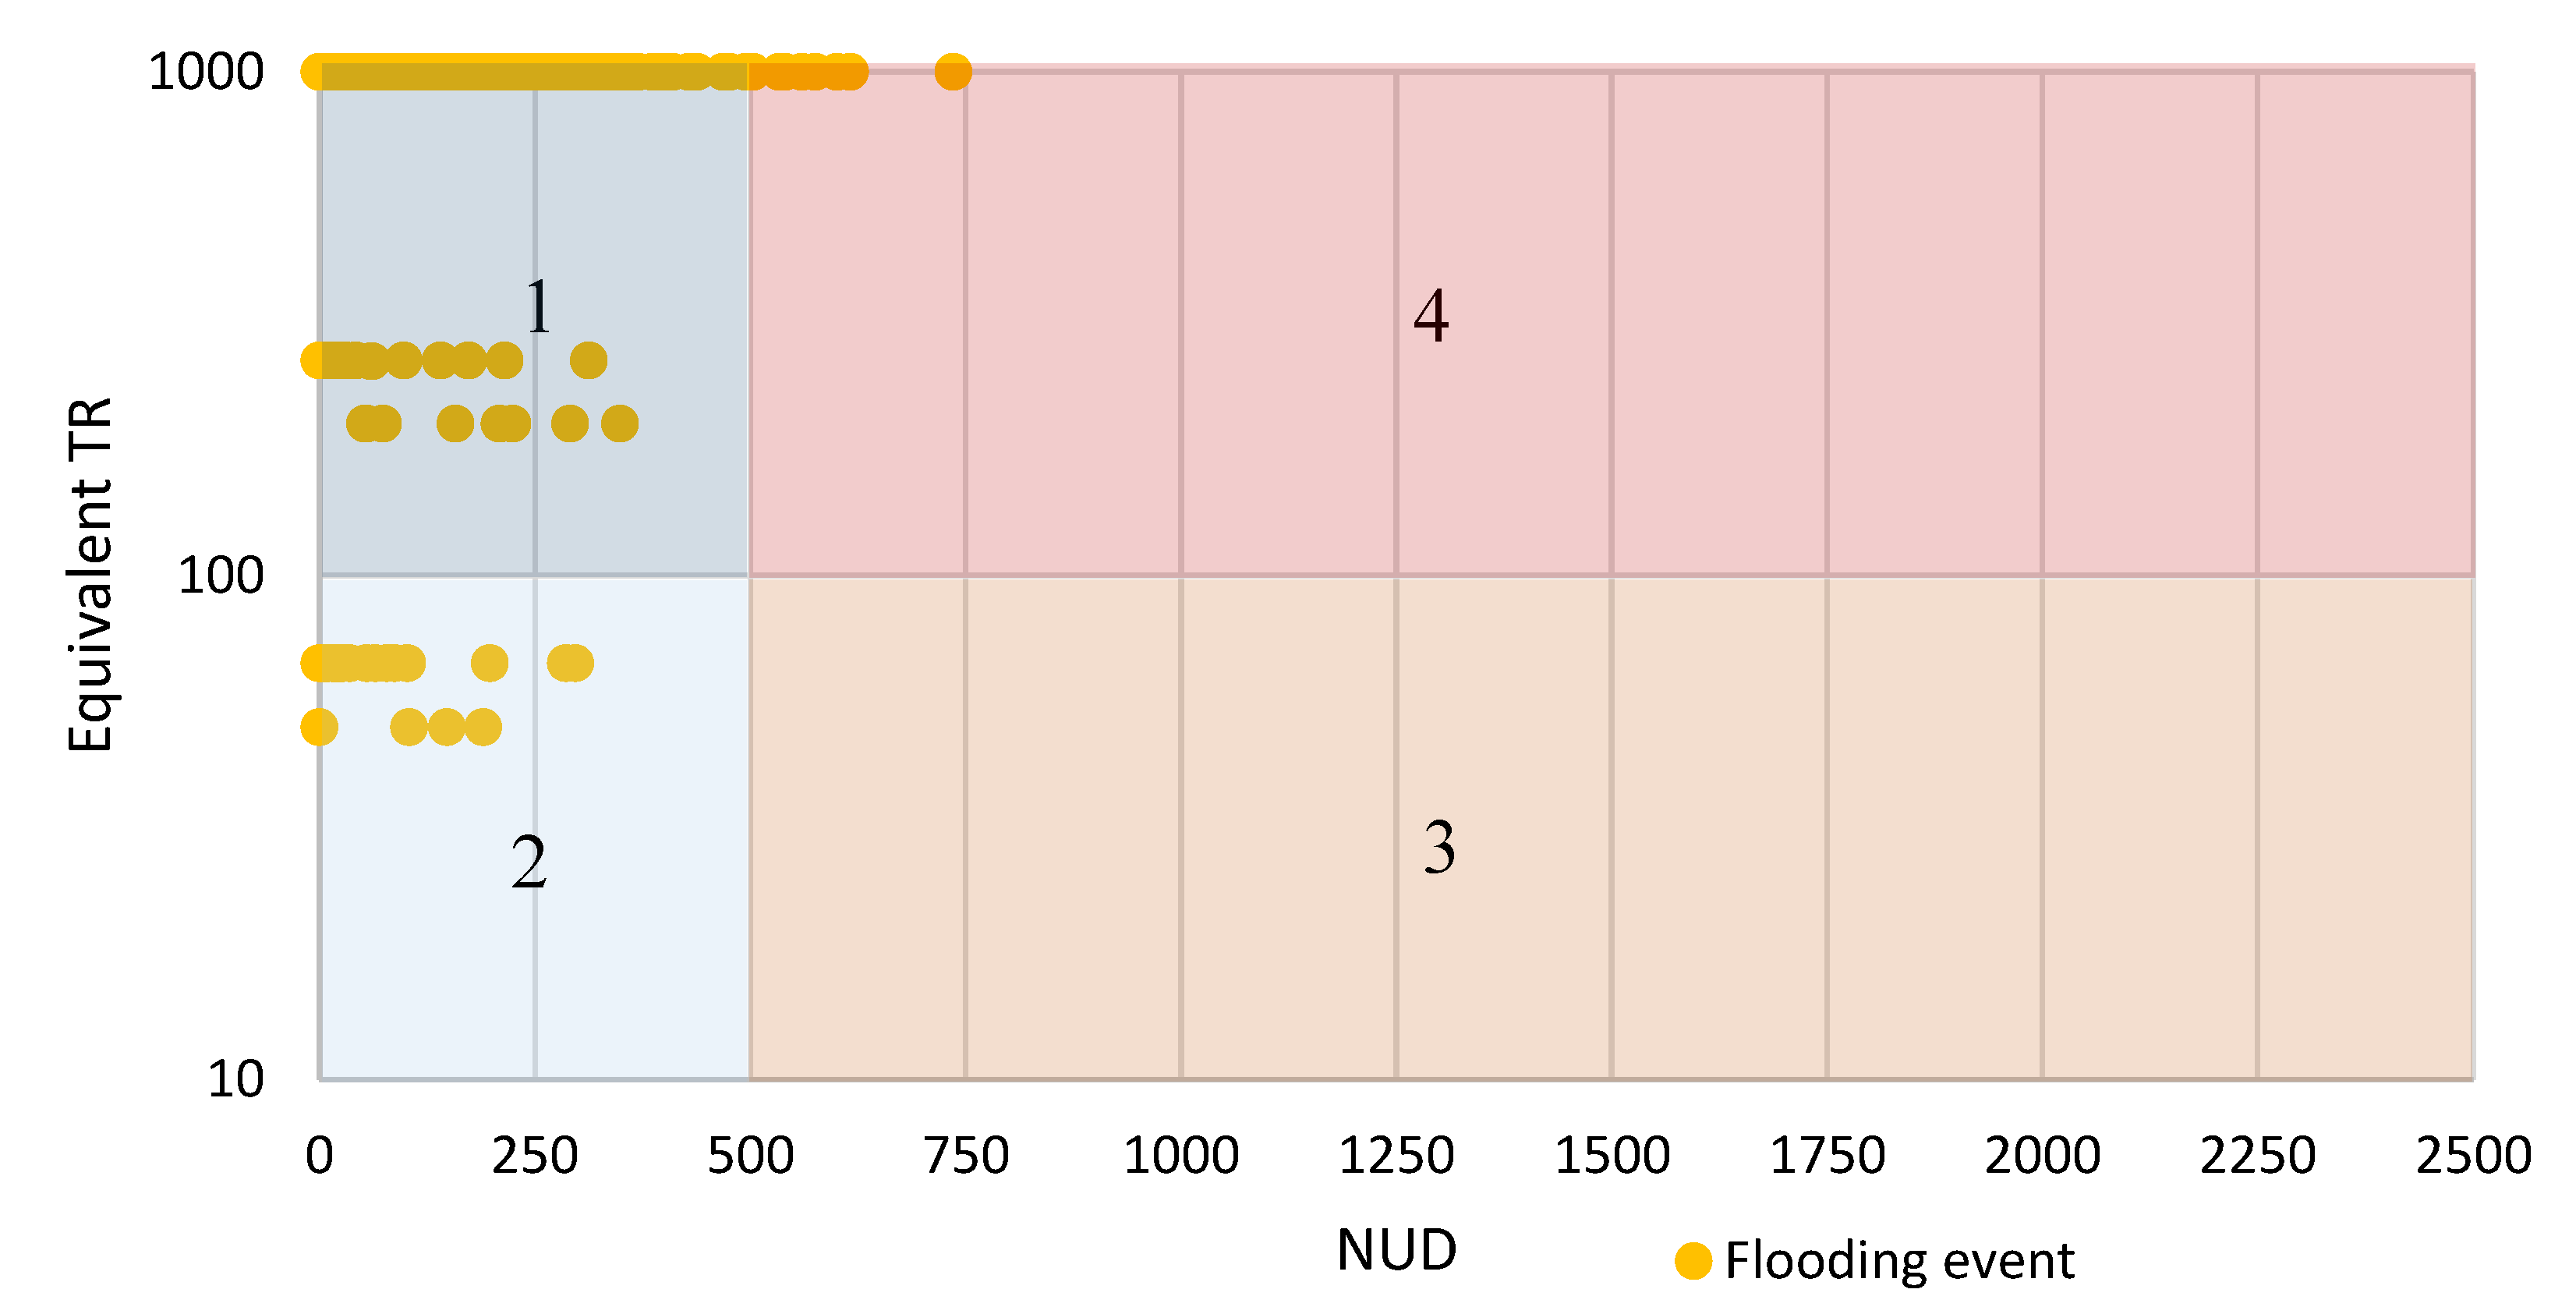
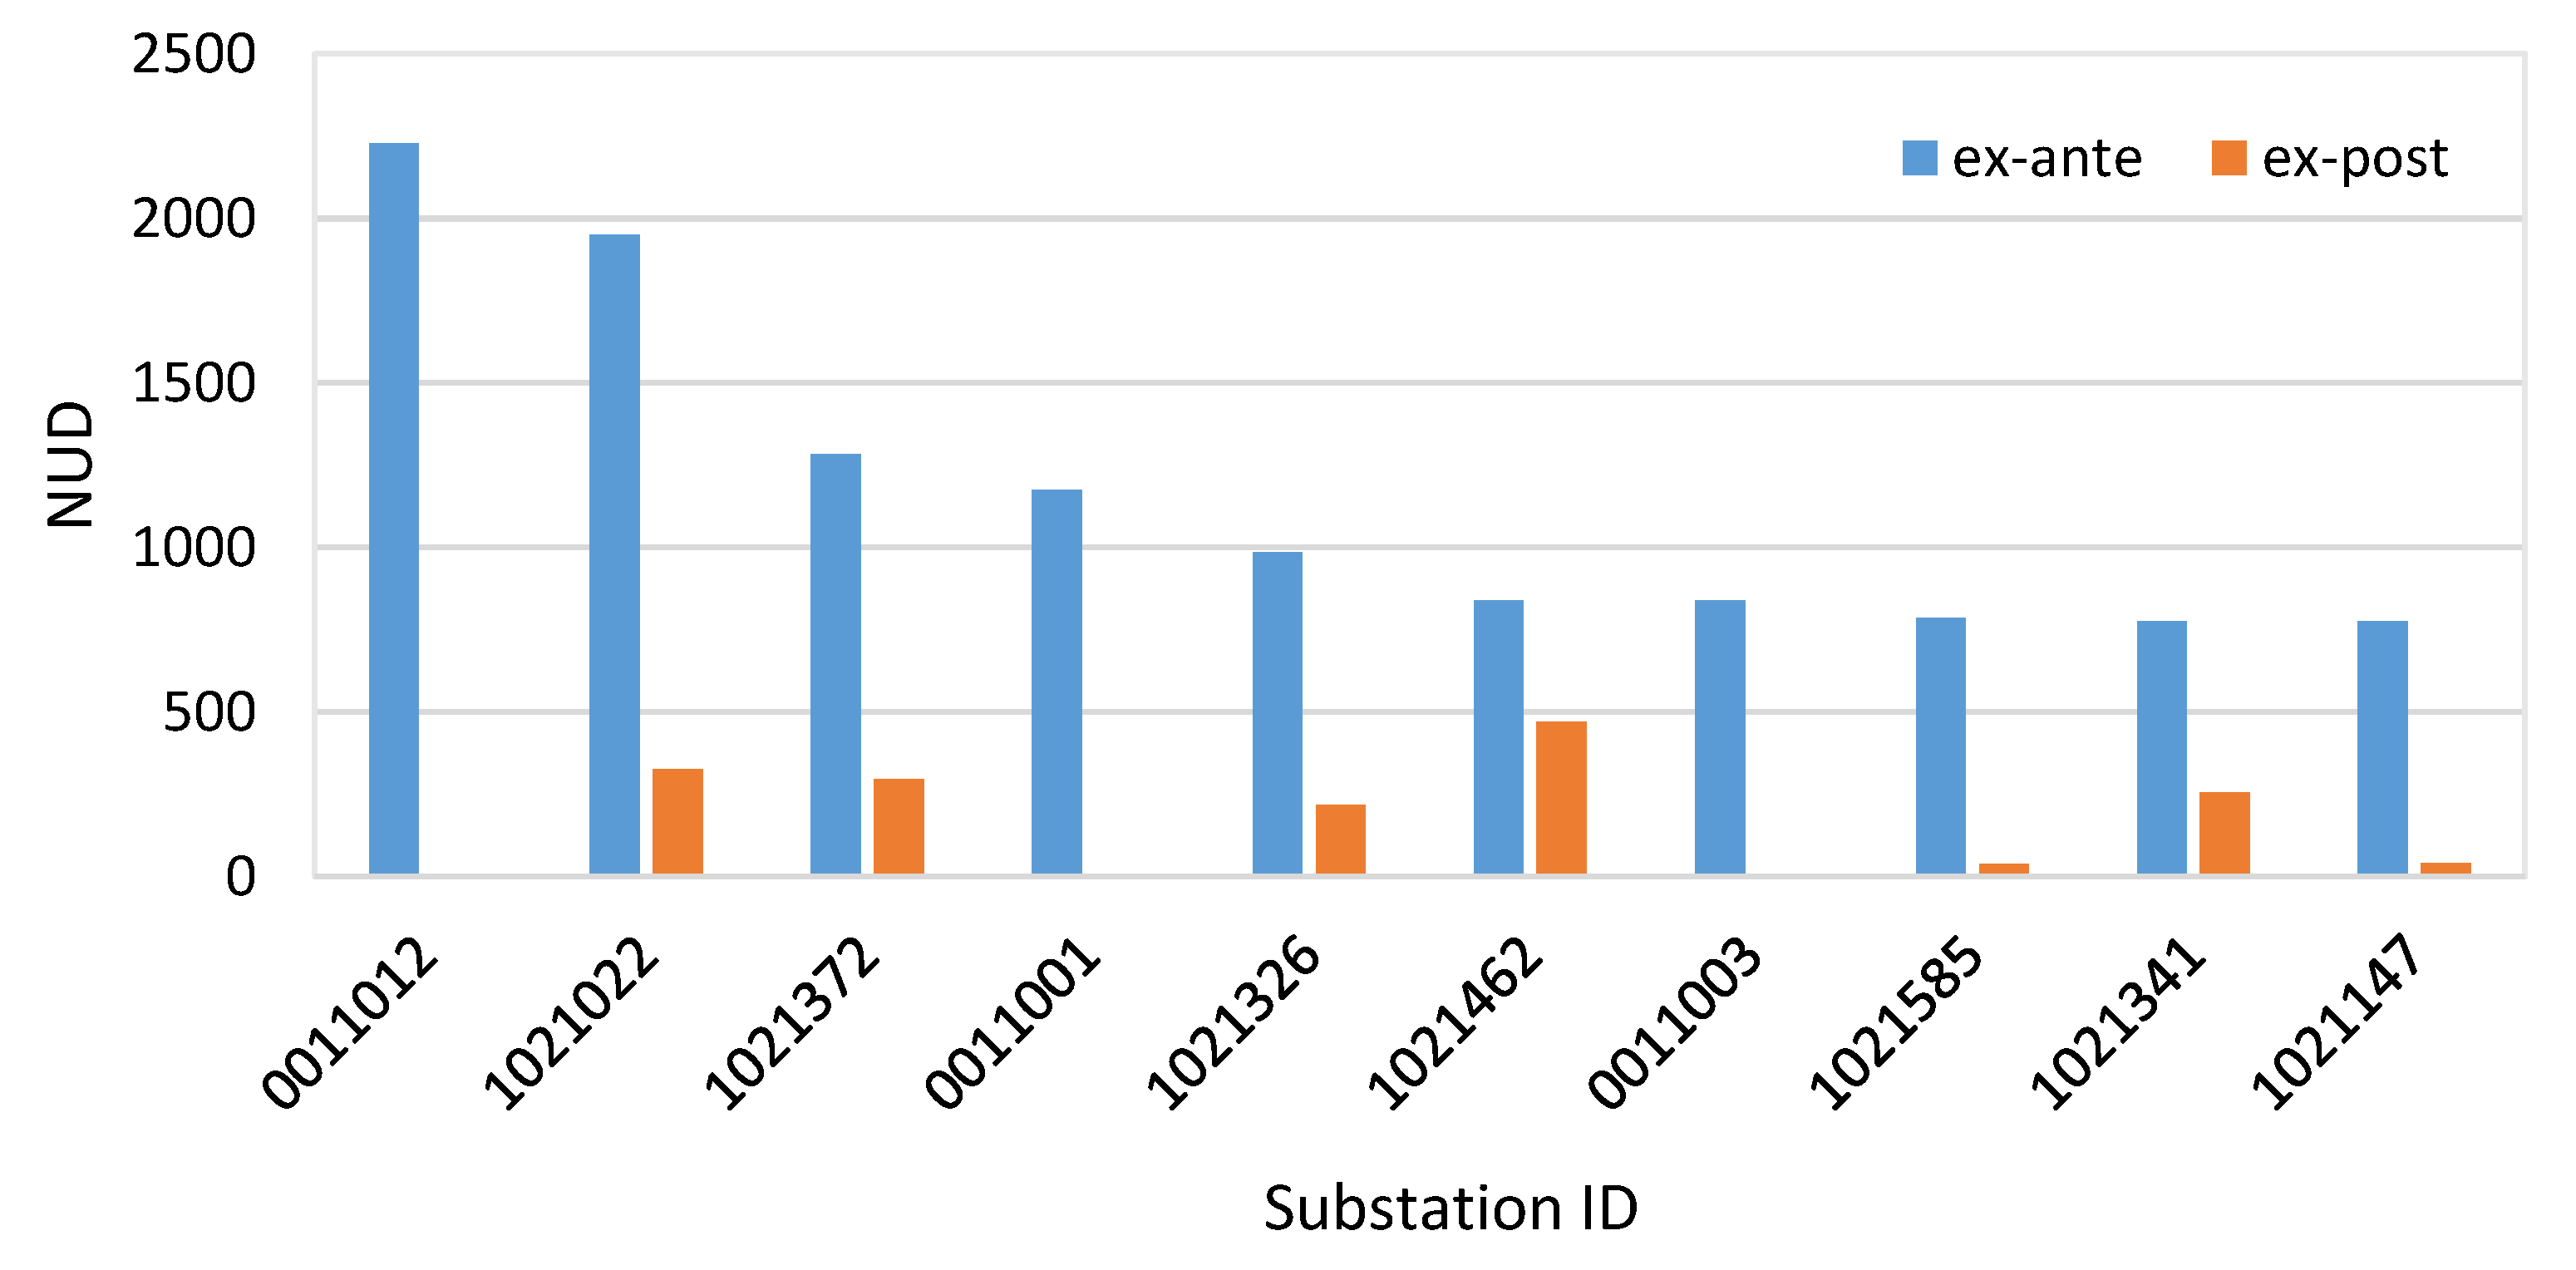
The results are reported in
Figure 7, which represents flooding events, using the same approach of
Figure 5. Finally,
Figure 8 shows the effects of remedial actions comparing ex-ante and ex-post impact in terms of NUD for the first ten substations listed in
Table 1.
4. Discussion
Table 1 shows that the algorithm identifies the weakest sections of the network, which are those for which a substation loss causes an impact higher than the number of users connected. This result does not depend on the type of threat.
Table 2 provides the ranking based on IRI: This could provide a different point of view in order to define the intervention priority on the grid that can improve resilience according to a specific threat.
With respect to
Figure 5, it is worth pointing out that if different threats affecting a substation were considered, each event bullet could change its vertical position, because of a TR
e variation with respect to a specific threat (i.e., a higher or lower vulnerability of the asset against the threat). On the other hand, the bullet cannot move horizontally, since its abscissa represents the effect on the grid in terms of NUD, whenever that asset is lost.
As shown in
Table 3, the IGRR ex-ante is very close to 1, and it shows that the network is already resilient with respect to flooding events. This fact is also supported by the high degree of meshing of the network: In case of a substation loss, a back-feeding of the other substations is normally allowed (more than 78% of the users can already be supplied in MV back-feeding, see IGCR in
Table 3), since the case of substations supplied in antenna is very limited.
According to the previous sections, the ex-ante assessment identifies intervention that can be applied in a development plan of the DSO. Then, the model is applied to simulate the effect of the flooding events on the distribution network in case of full achievement of the selected interventions (the applied remedial actions refer to all substations having a NUD greater than 500).
According to the reported values in
Table 3, the proposed interventions have no notable effects on the network in terms of its resilience with respect to flooding events (the IGRR rises from 0.9981 to 0.9984, i.e., the increase is only about 0.02%).
Considering the proposed intervention, the improvement of the degree of vulnerability of users is notable (the IGVU index decreases from 1.6254 to 1.2534, i.e., the reduction is more than 22%, see
Table 3).
With respect to the network back-feeding index, the remedial actions produce more evident benefits (the IGCR index, which does not depend on the type of threat, rises from 0.7830 to 0.8637, meaning the increase is about 10%, see
Table 3), confirming that the network’s meshing is increased anyway. With respect to ex-post analysis,
Figure 6 shows that the interventions are going to reduce the impact of flooding events, as well as going to improve the resilience of the network itself. In area 4 of the figure, the reader can still observe some substations which have a NUD more than 500: This is due to the fact that all hypothesized remedial actions at MV level cannot reduce the NUD under the number of LV users supplied by the substation, because the LV network is full radial.
Figure 8 clearly shows the effectiveness of the remedial actions proposed by the simulation model, outlining the notable reduction of NUD for the most critical assets reported in
Table 1.
5. Conclusions
In the last decade, the occurrence of extreme natural events caused tremendous effects and damages to essential infrastructures. Stakeholders are considering climate-related risk management of critical infrastructure as a dominant theme, because of the intensification of magnitude and frequency of disruptive weather events and natural disasters, which have caused notable damage to the infrastructures.
From this perspective, electrical networks can be considered more critical in comparison with all other infrastructures (e.g., heating, water, mobility, telecommunications), being the main pillar of these ones. Therefore, on one hand, making networks more resilient leads to a reduction of the global impact on essential and interdependent services due to natural exceptional events; on the other hand, the improvement of resilience requires new tools for planning and design of future distribution networks.
In this paper, the authors have proposed a tool able to evaluate the resilience of a distribution network against flooding threats. The starting point is the network graph, obtained by closing all the switches and all the equipment needed to perform back-feeding. Every possible scenario, representative of all flooding threats and obtained by eliminating one node at a time (i.e., a substation), is then analyzed by Dulmage–Mendelsohn decomposition [
19], carrying out the list of disconnected nodes. On the basis of this table, all relevant indices are computed. All possible remedial actions were identified and rated by their effectiveness. The improvement of index values due to the implementation of the identified remedial actions were also evaluated, quantifying the possible benefits. Finally, these countermeasures are consistent with those foreseen in the DSO development plan.
The generality of the proposed procedure and indices, as well as the robustness of the methodology implemented for the evaluation of the remedial actions, make this tool applicable for the assessment of resilience of distribution networks with respect to flooding and more threats.

 ,
, 


