Multi-Scenario Analysis of Energy Consumption and Carbon Emissions: The Case of Hebei Province in China


Abstract
1. Introduction
2. Methodology
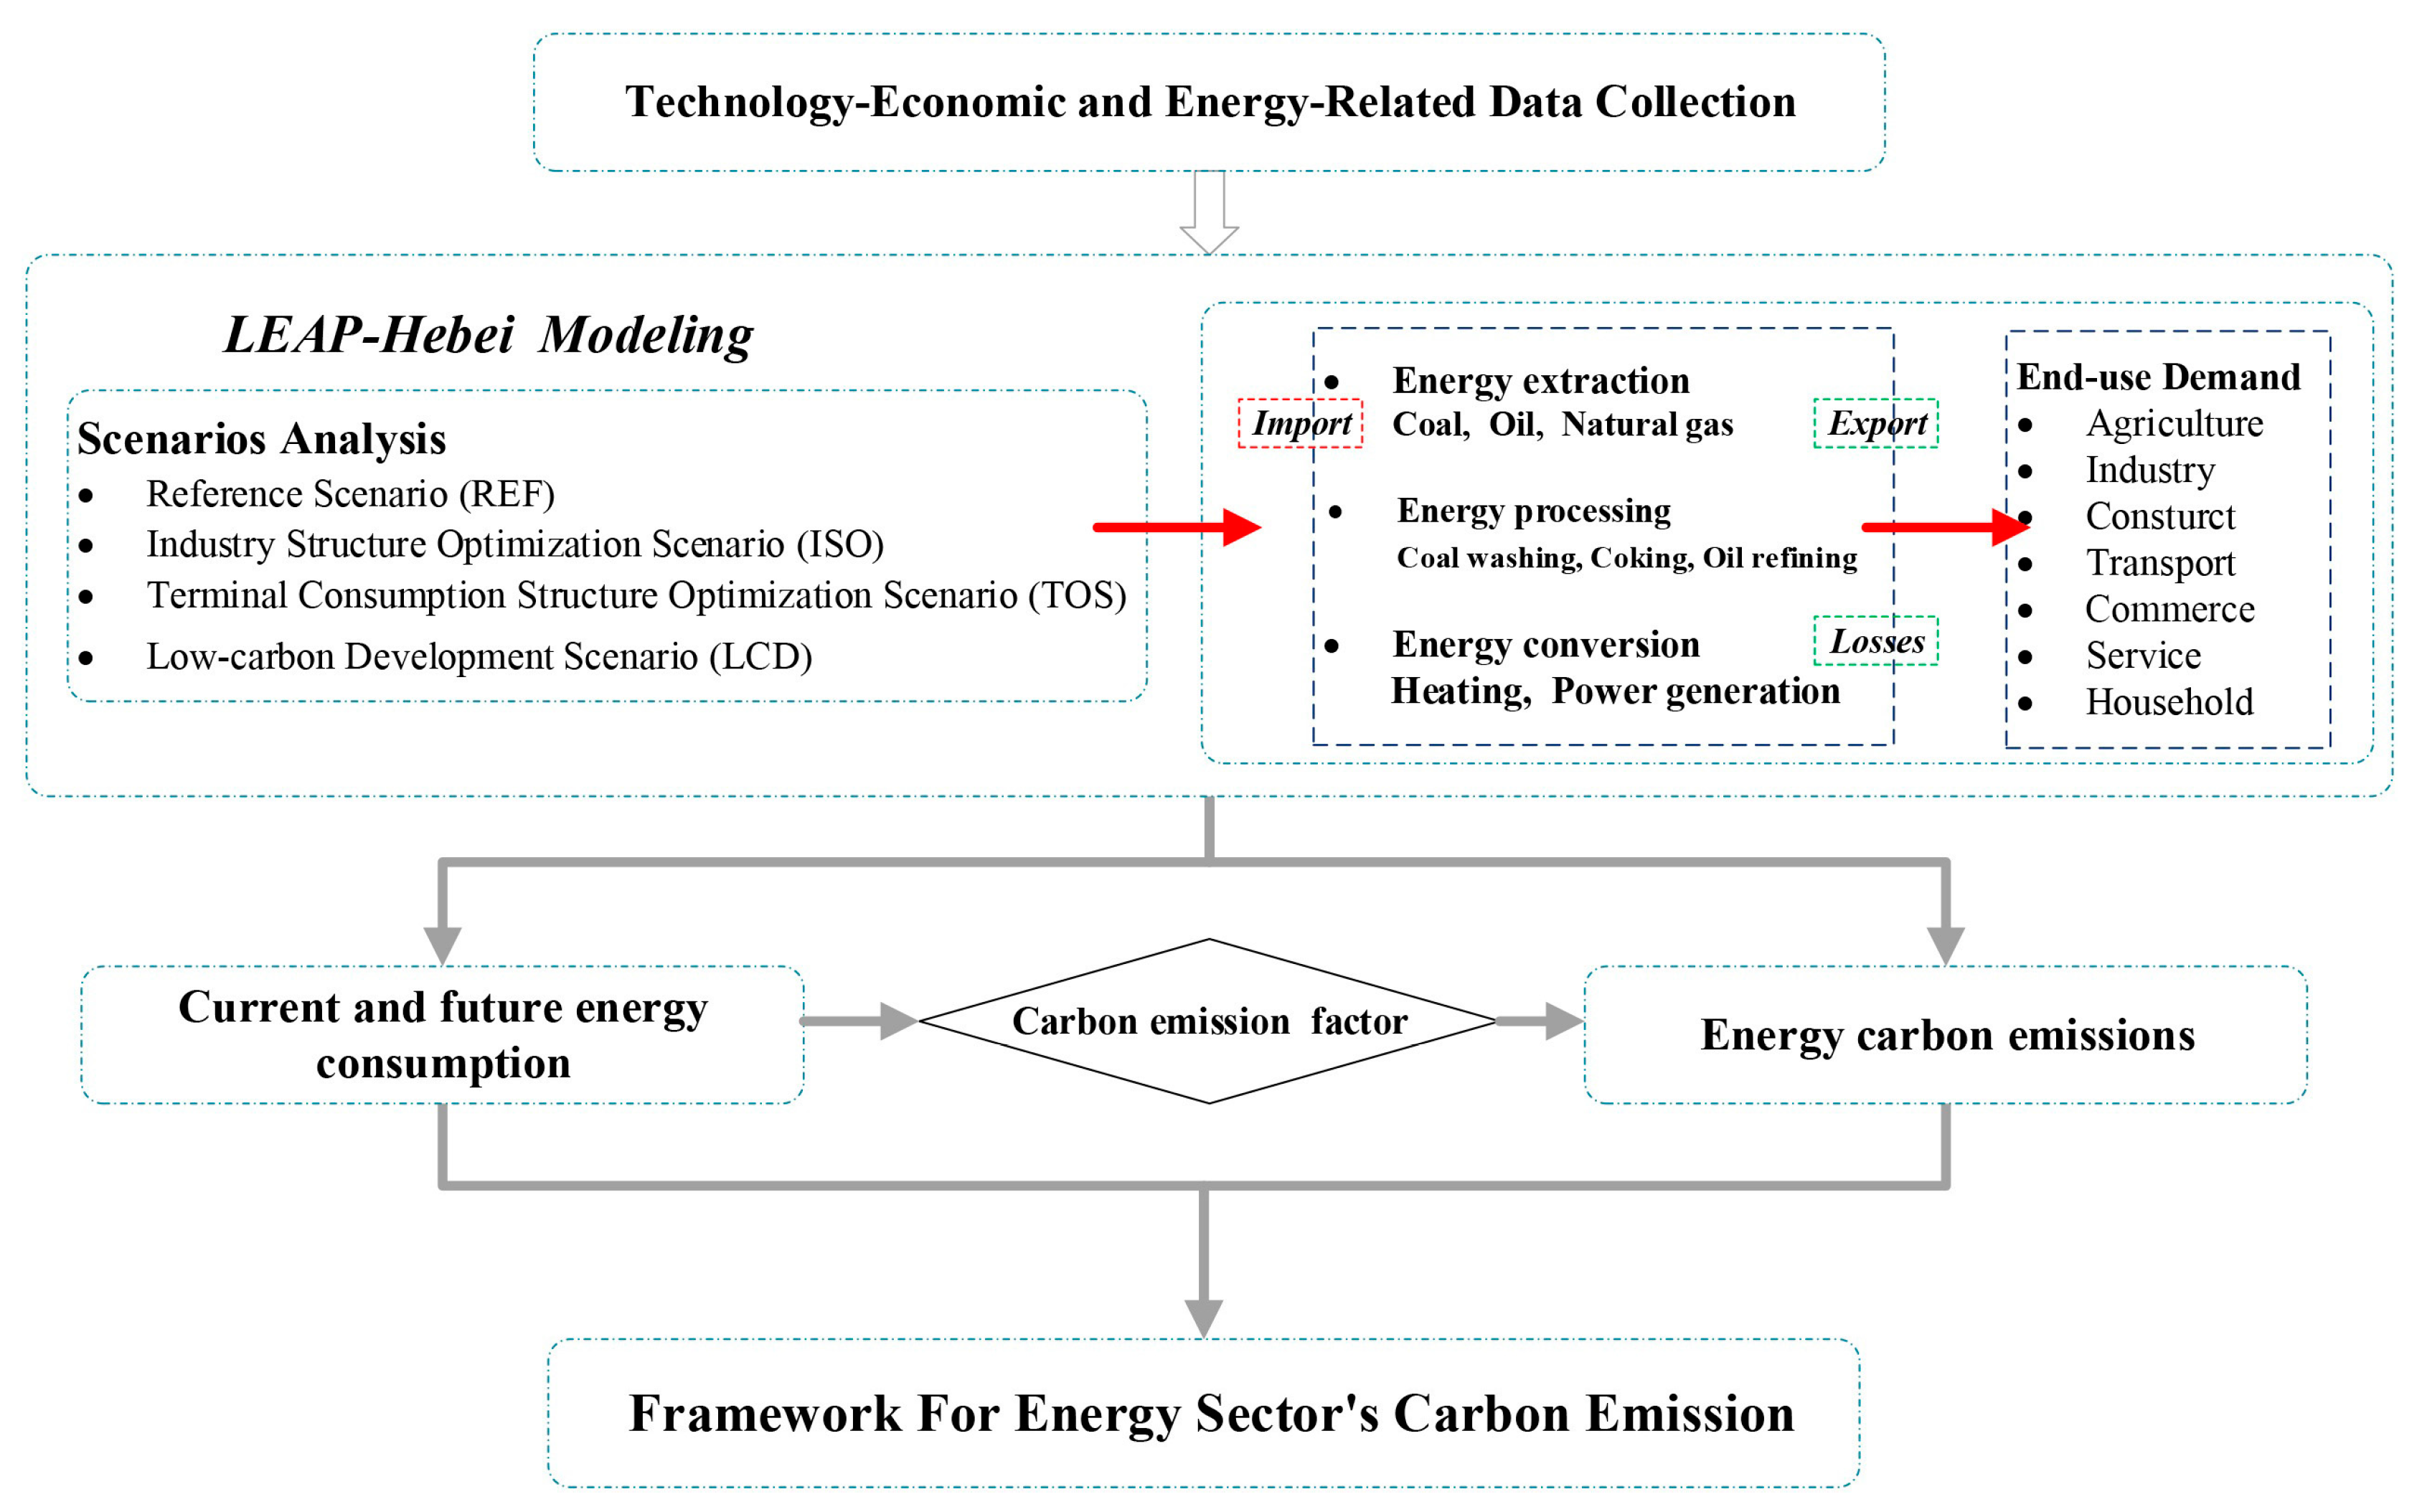
2.1. Framework of the Model
2.2. LEAP Model
2.3. Scenario Development and Assumptions
2.4. Sensitivity Analysis
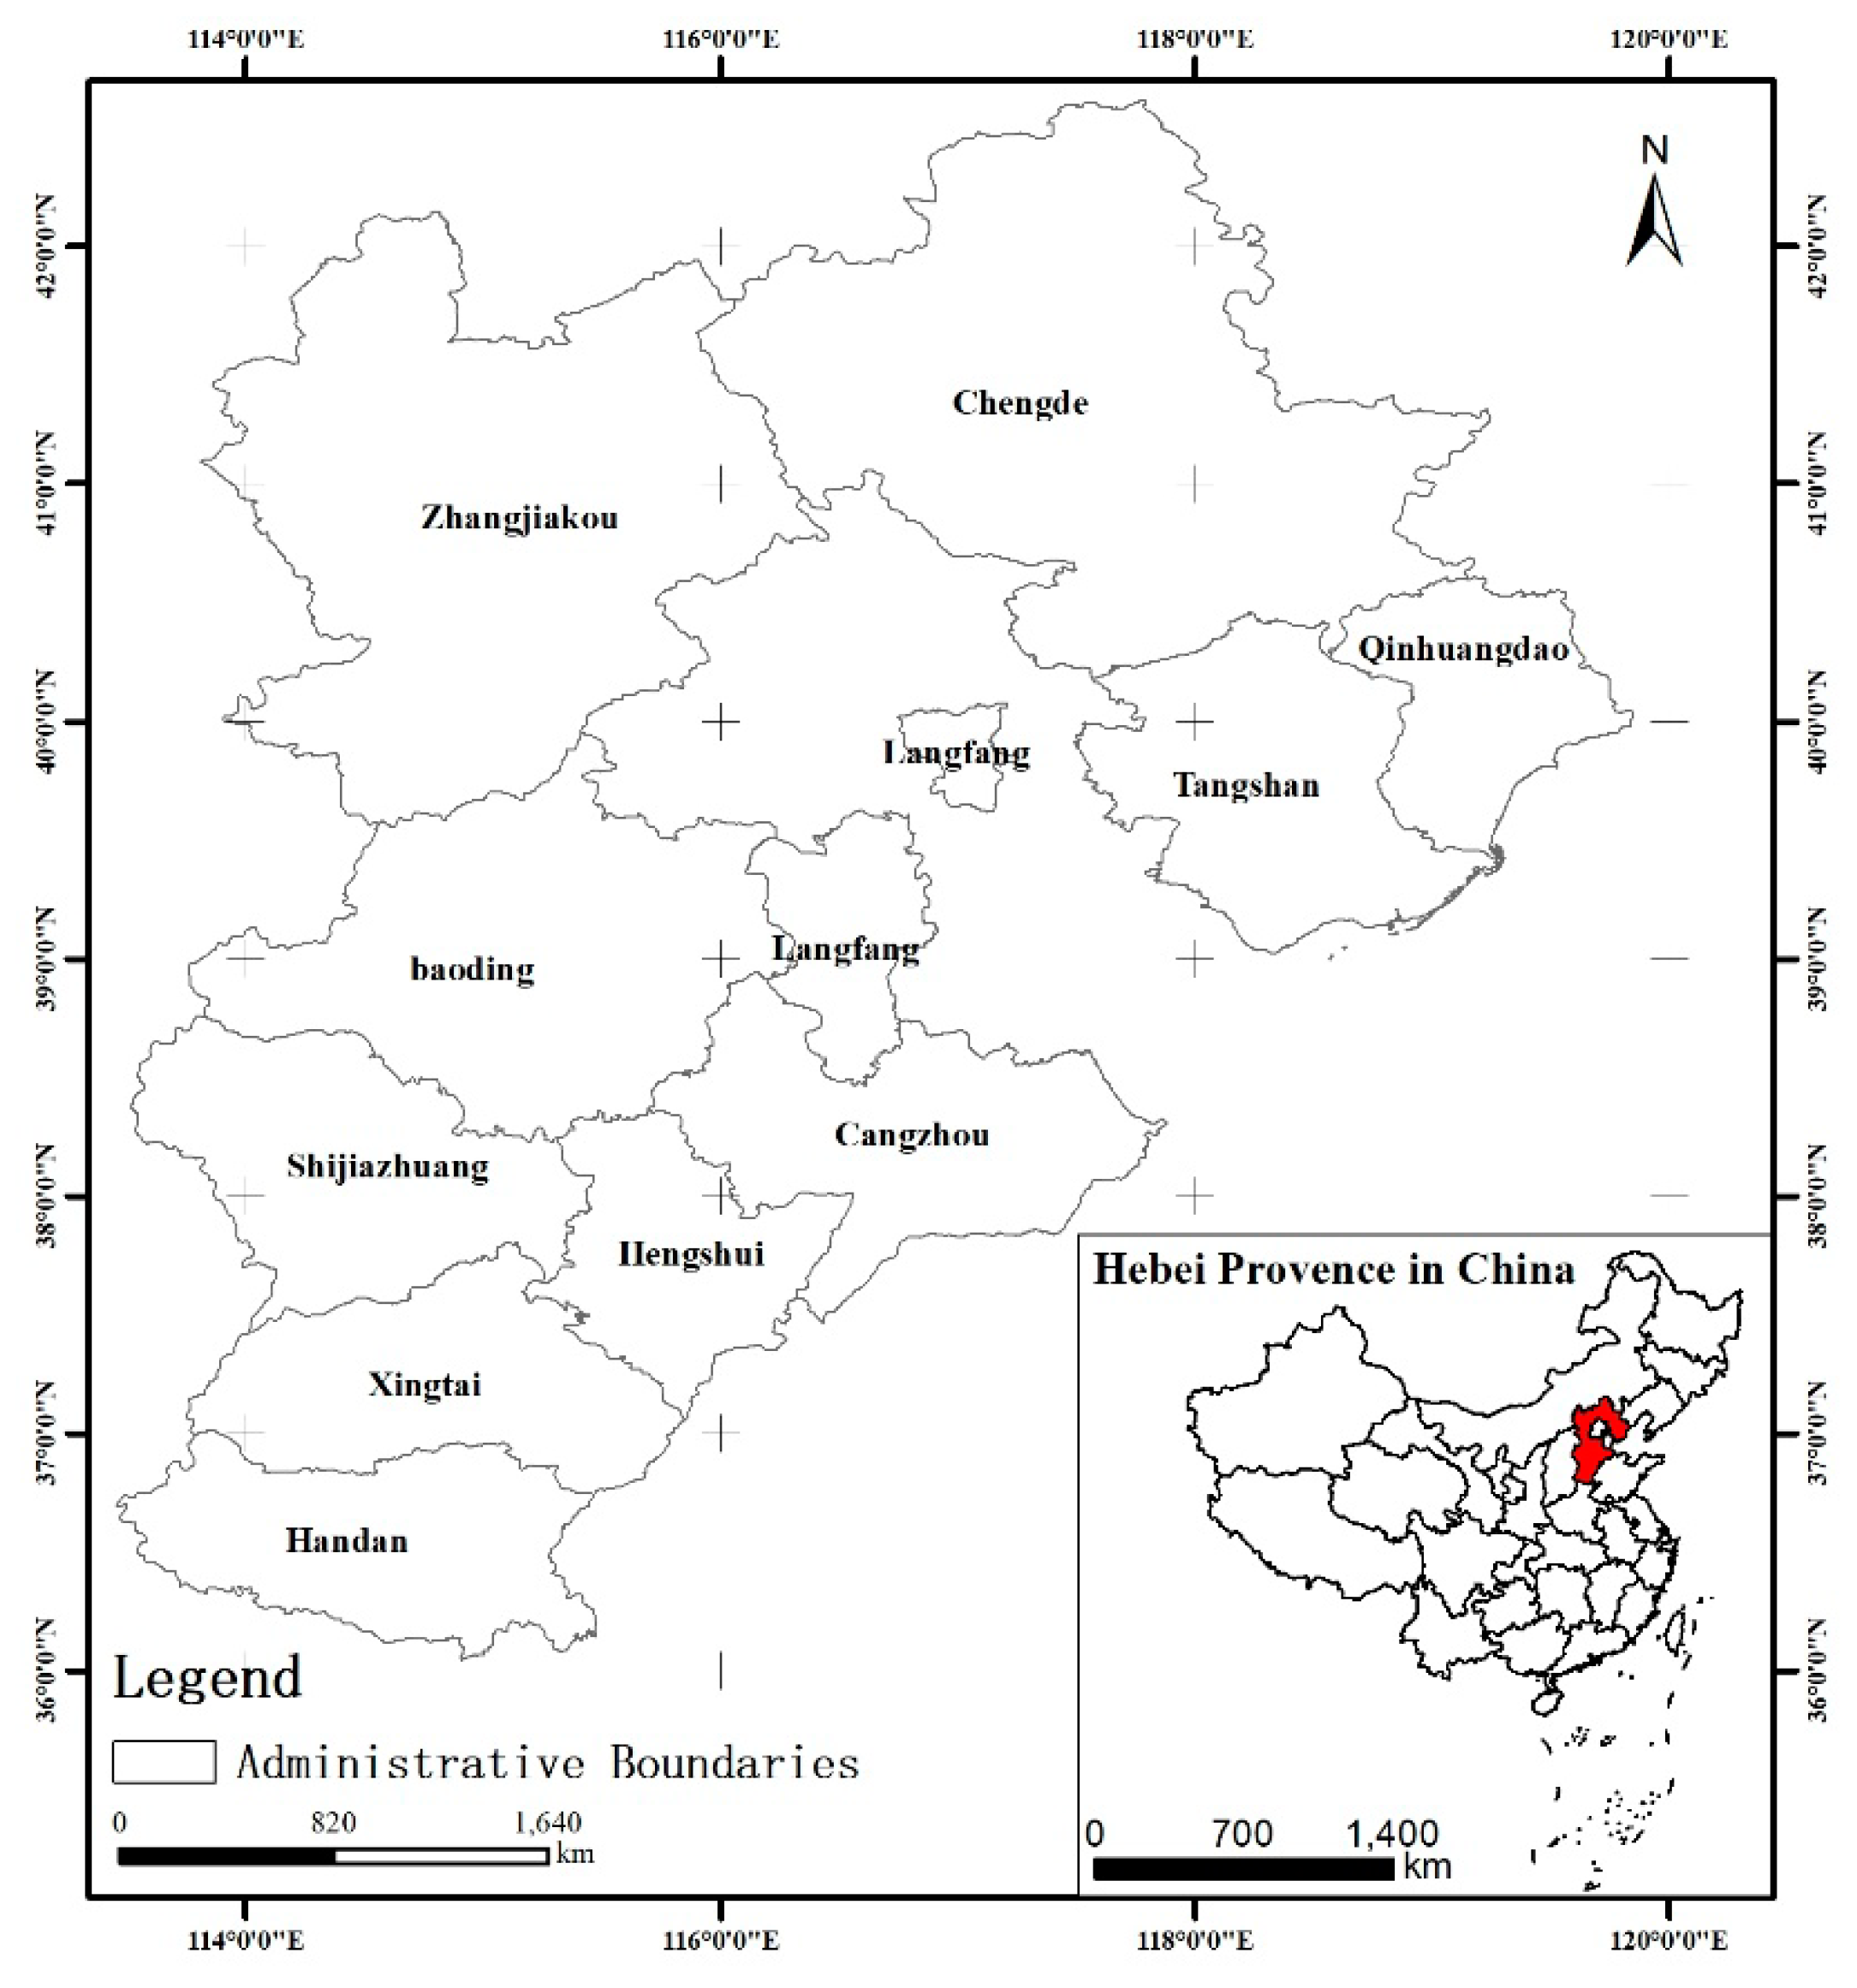
3. Data Acquisition
4. Results and Analysis
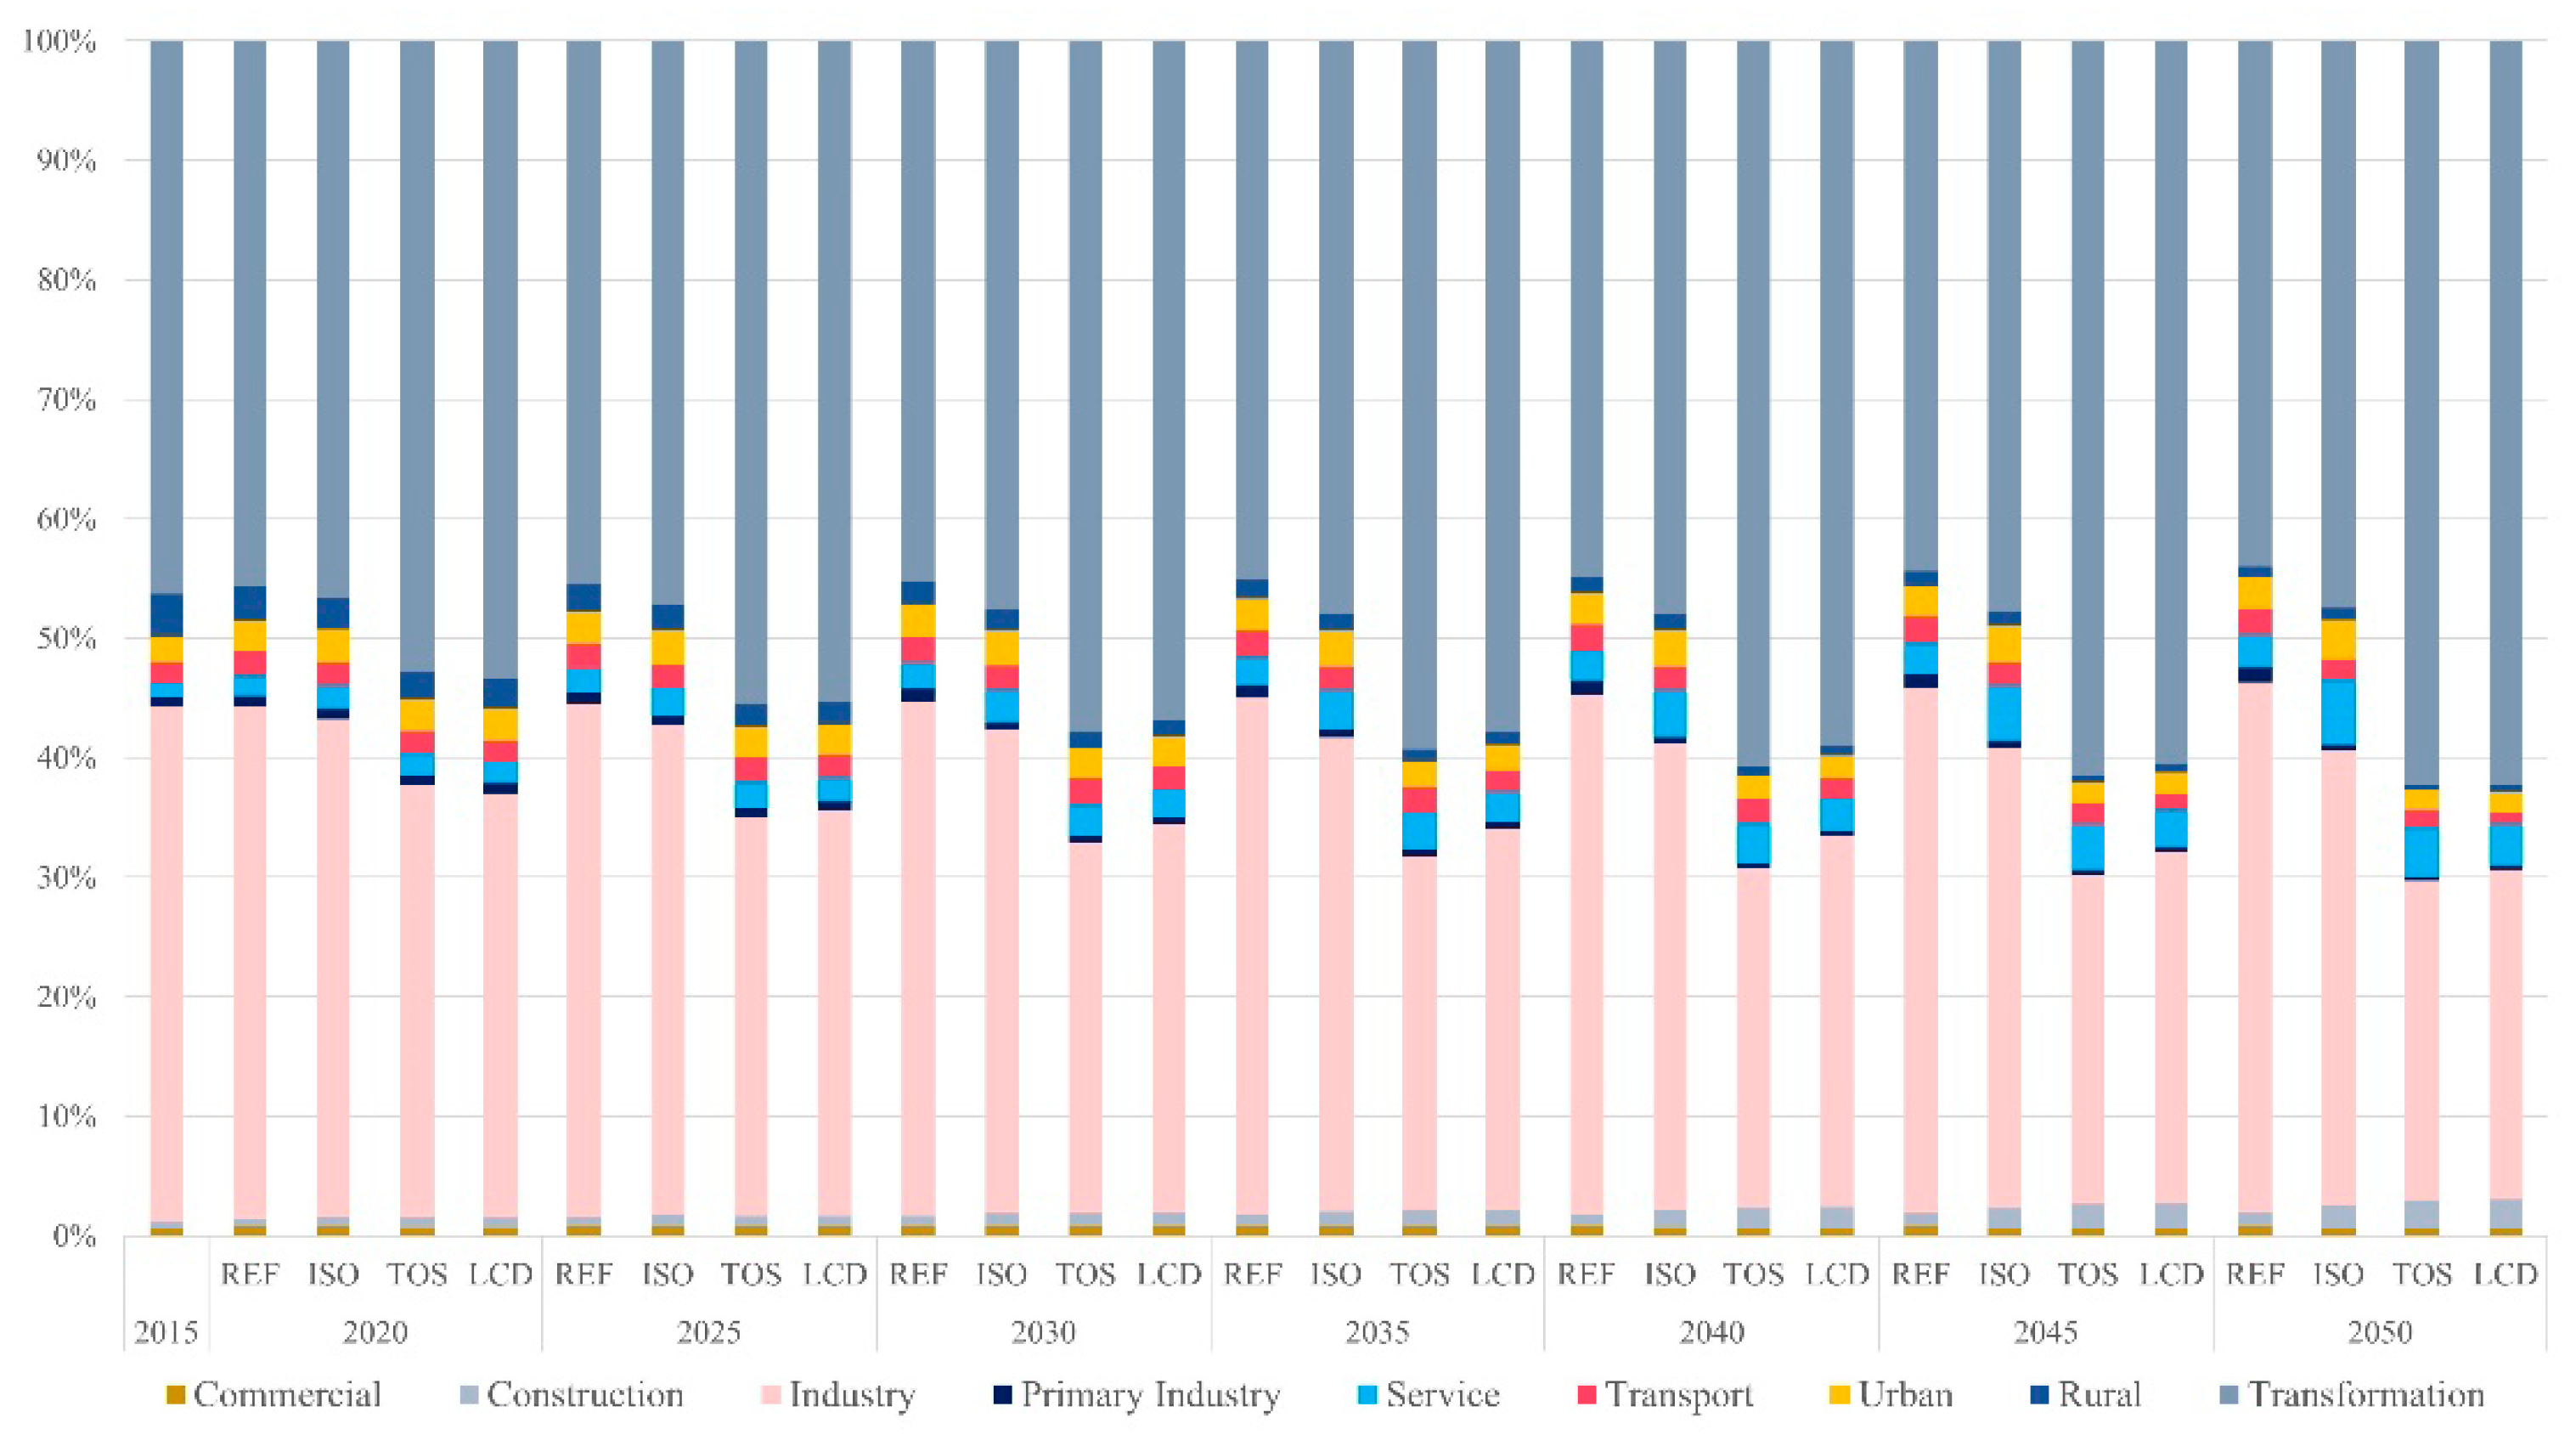
4.1. Energy Consumption
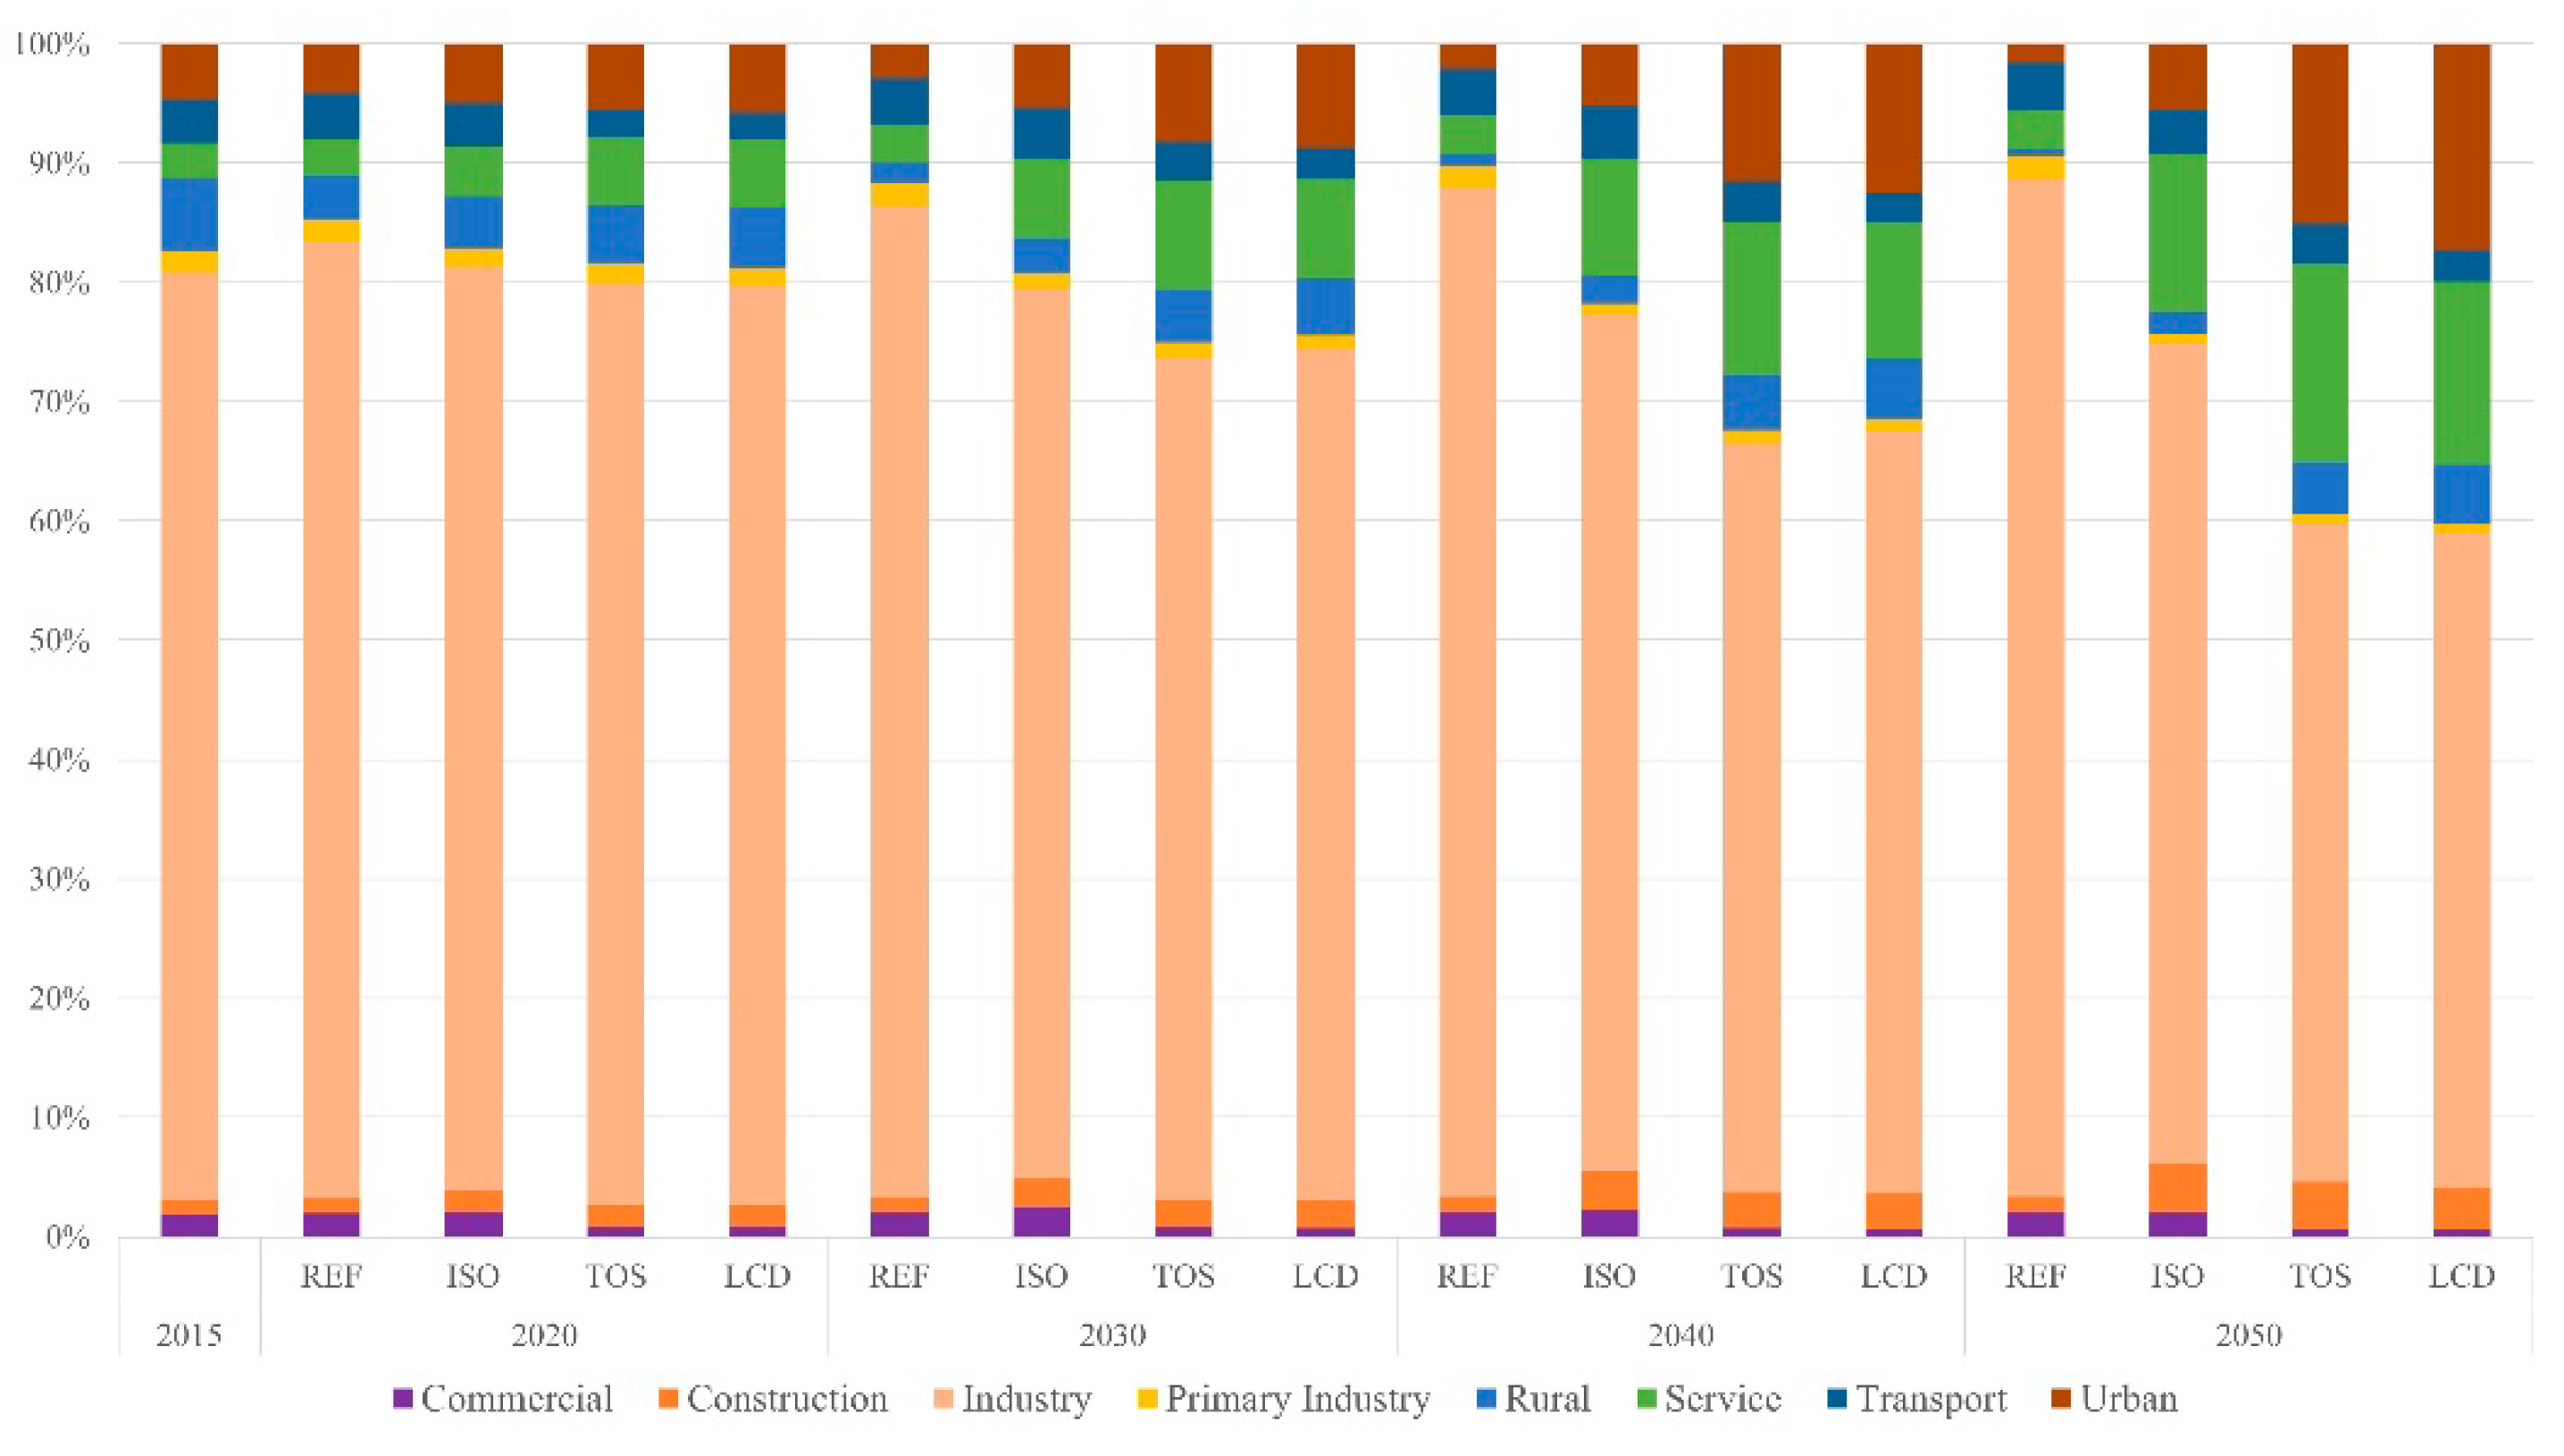
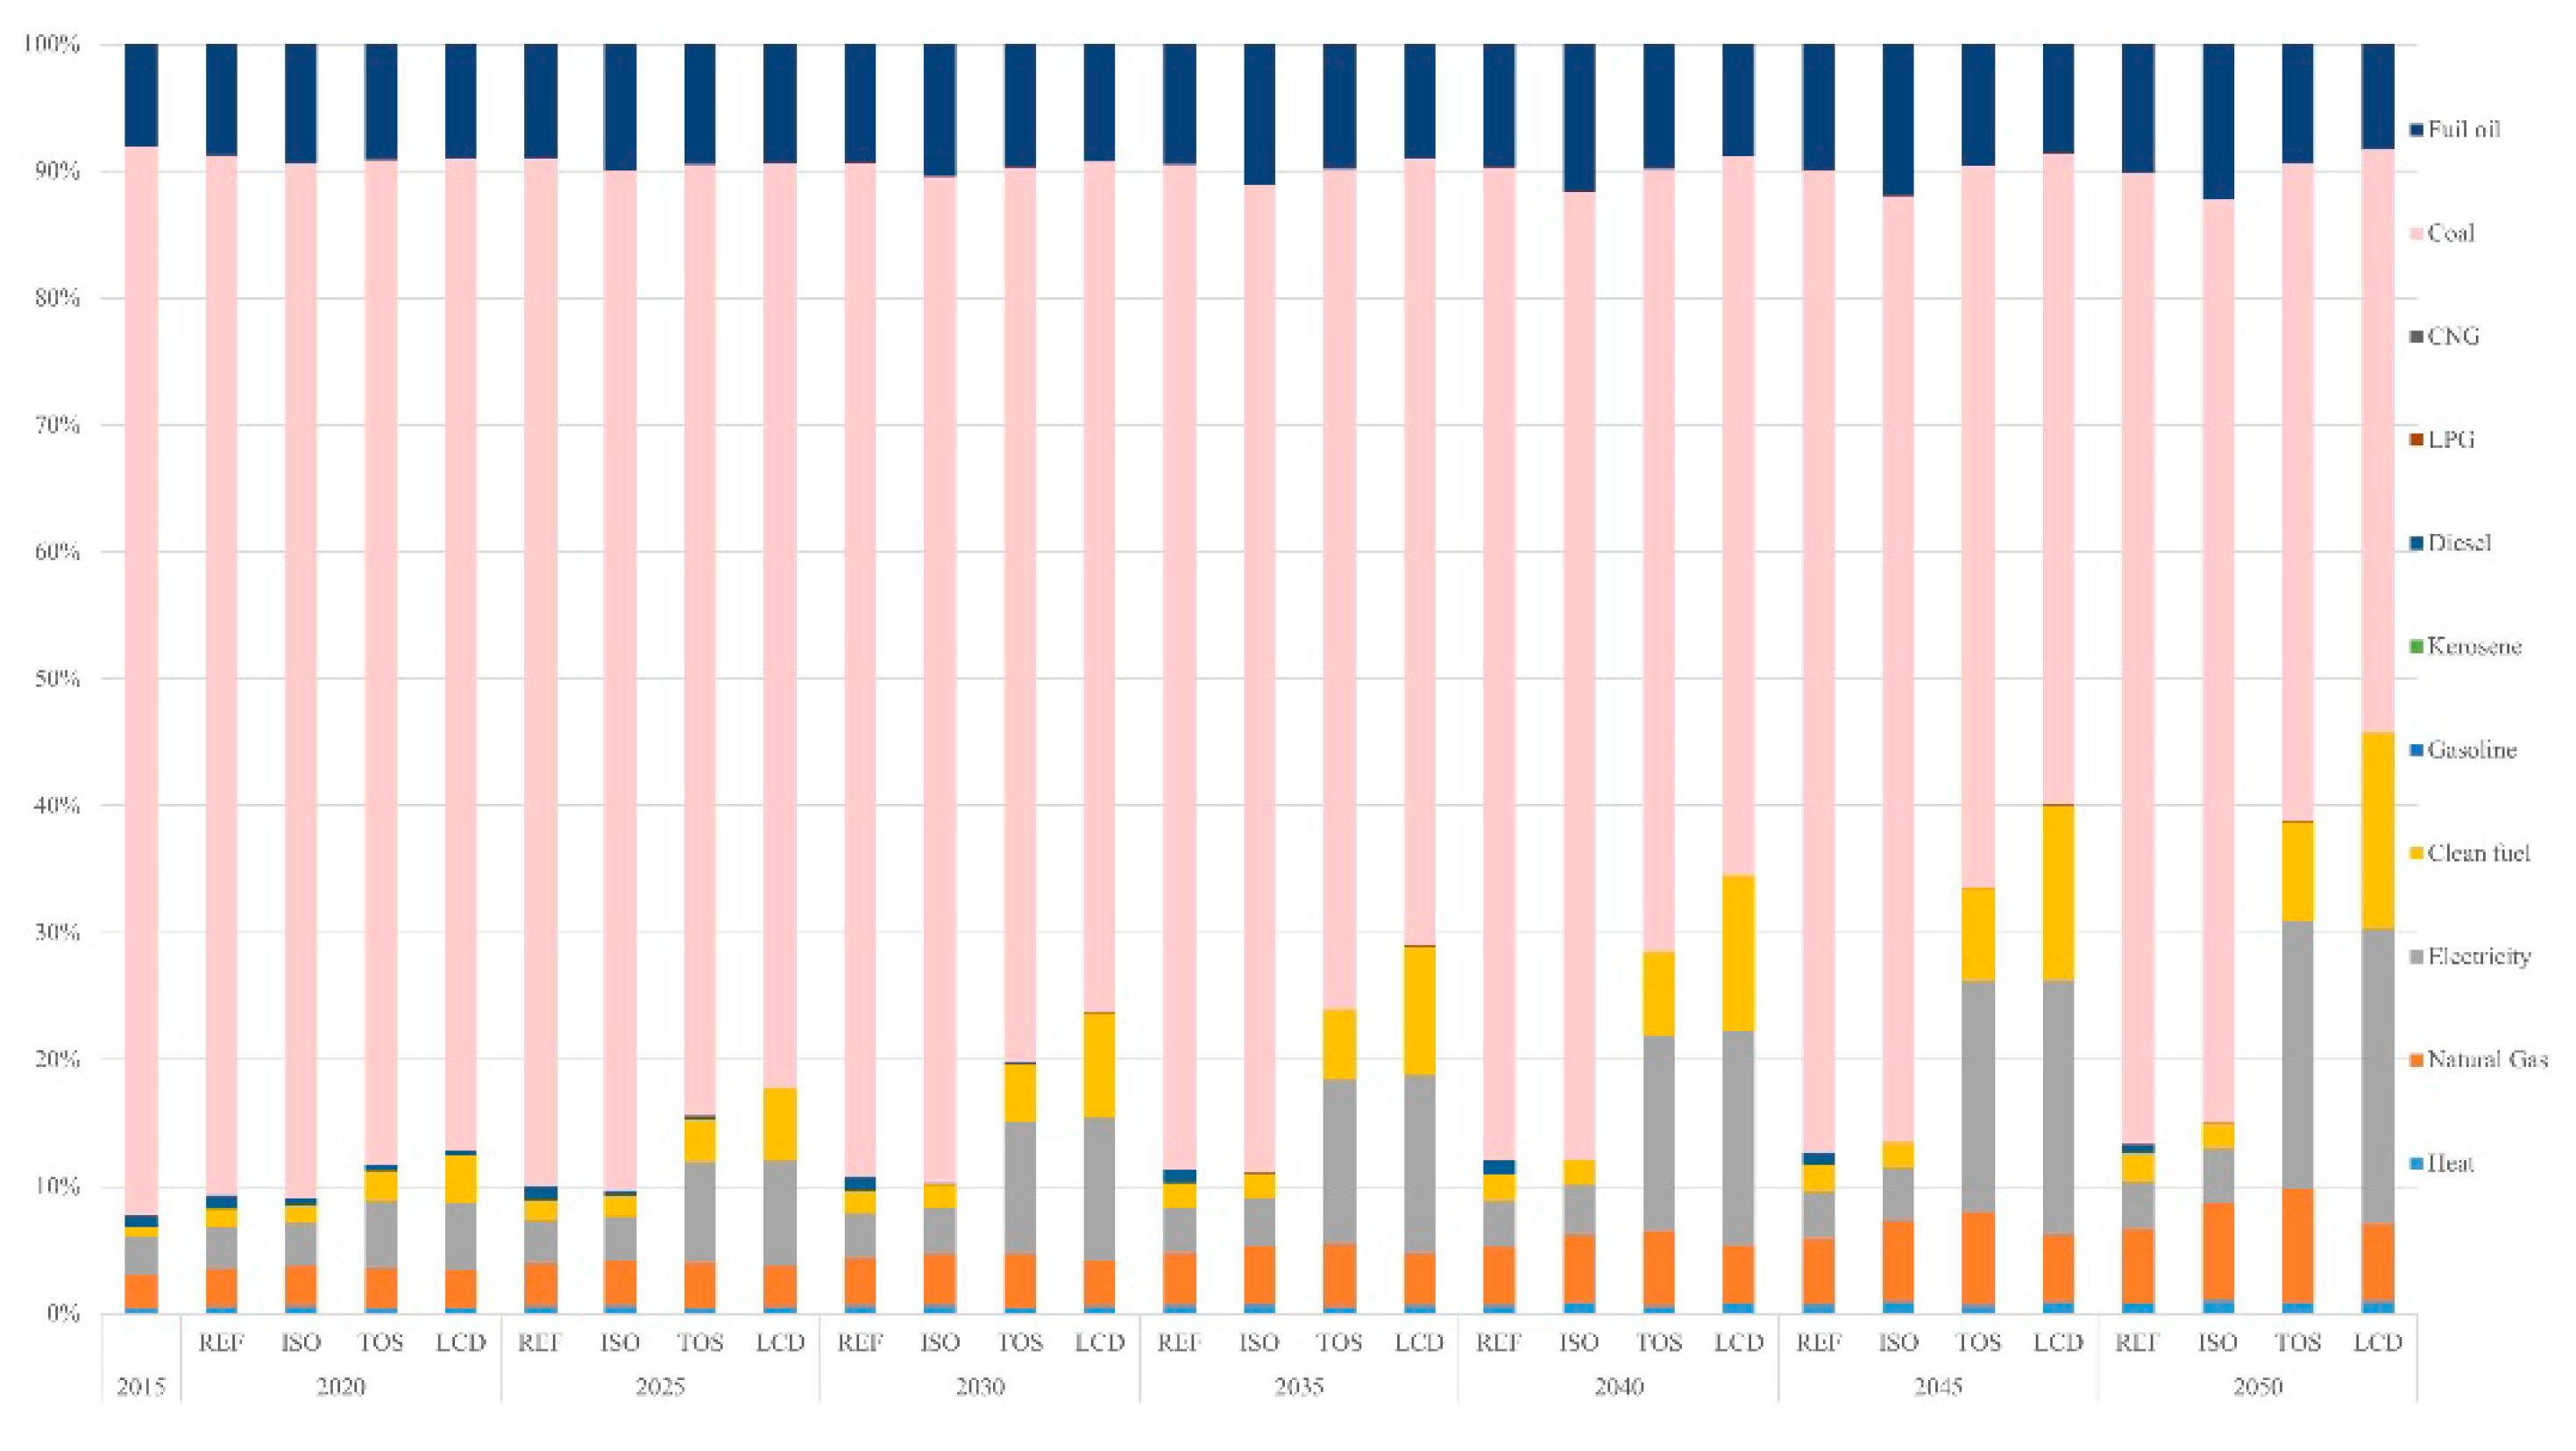
4.2. Final energy Usage by Fuel Type
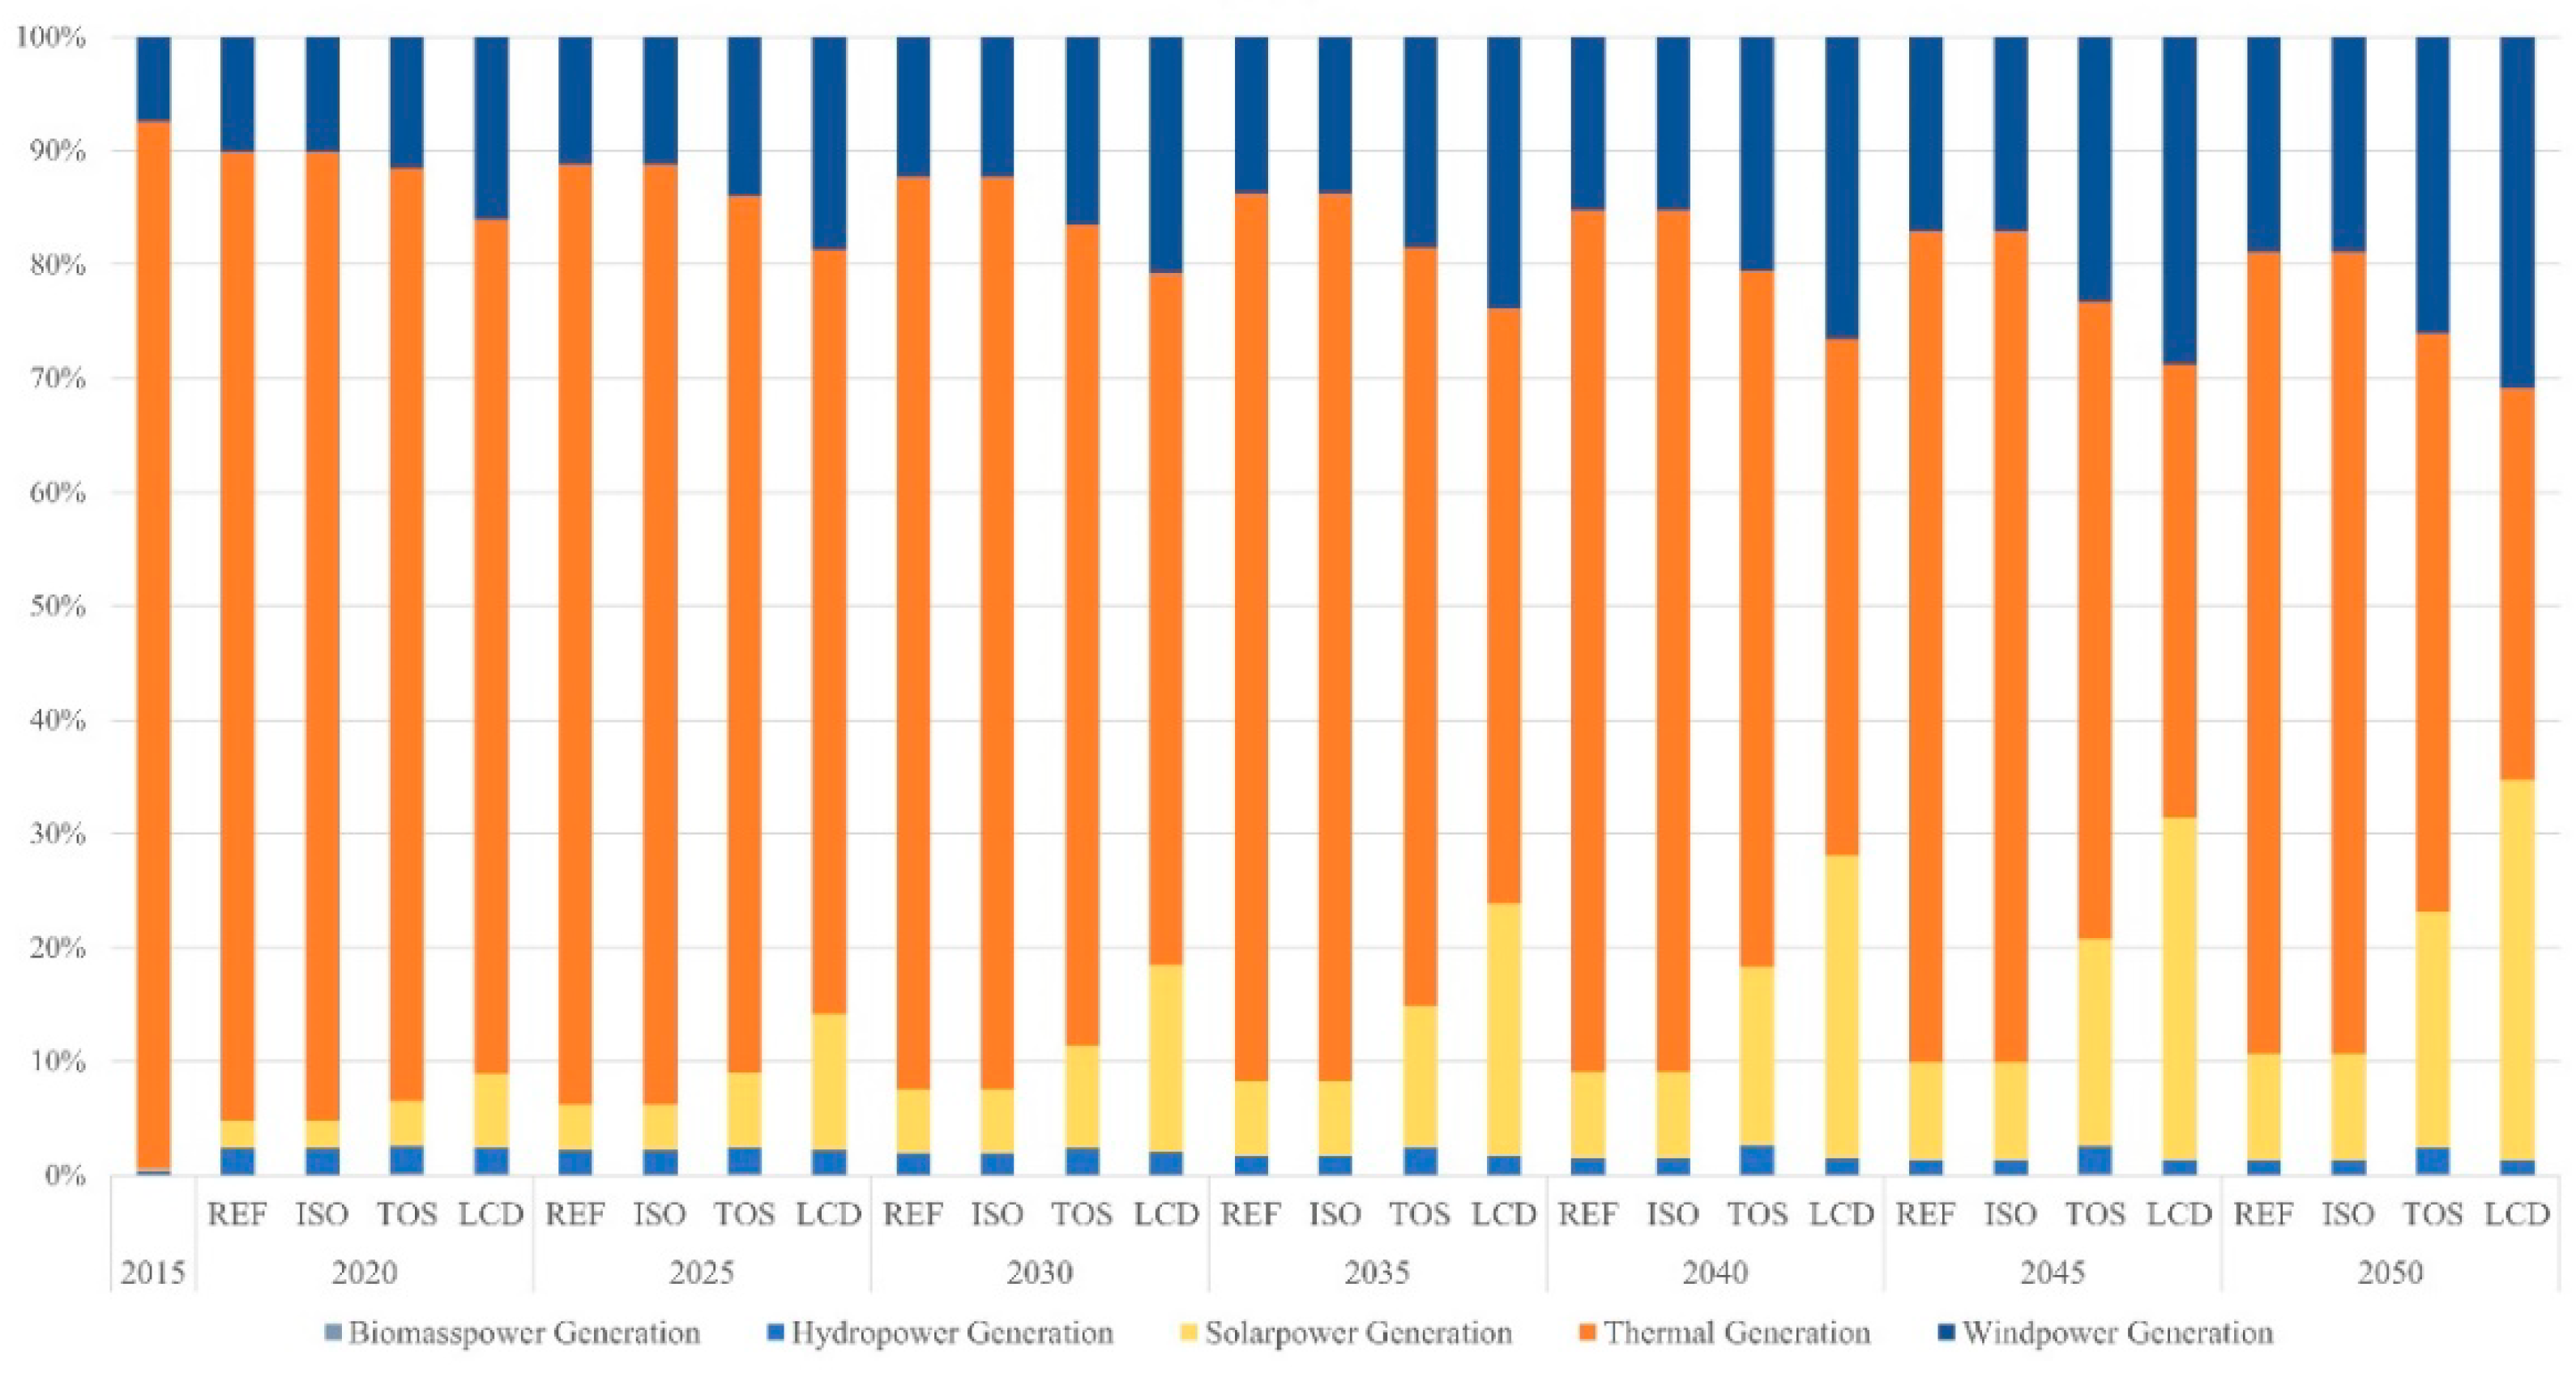
4.3. Electricity Production
4.4. CO2 Emission
5. Discussion
5.1. Uncertainty of the Scenario Analysis Results
5.2. The Pathways for Low-Carbon Development
6. Conclusions
- (1)
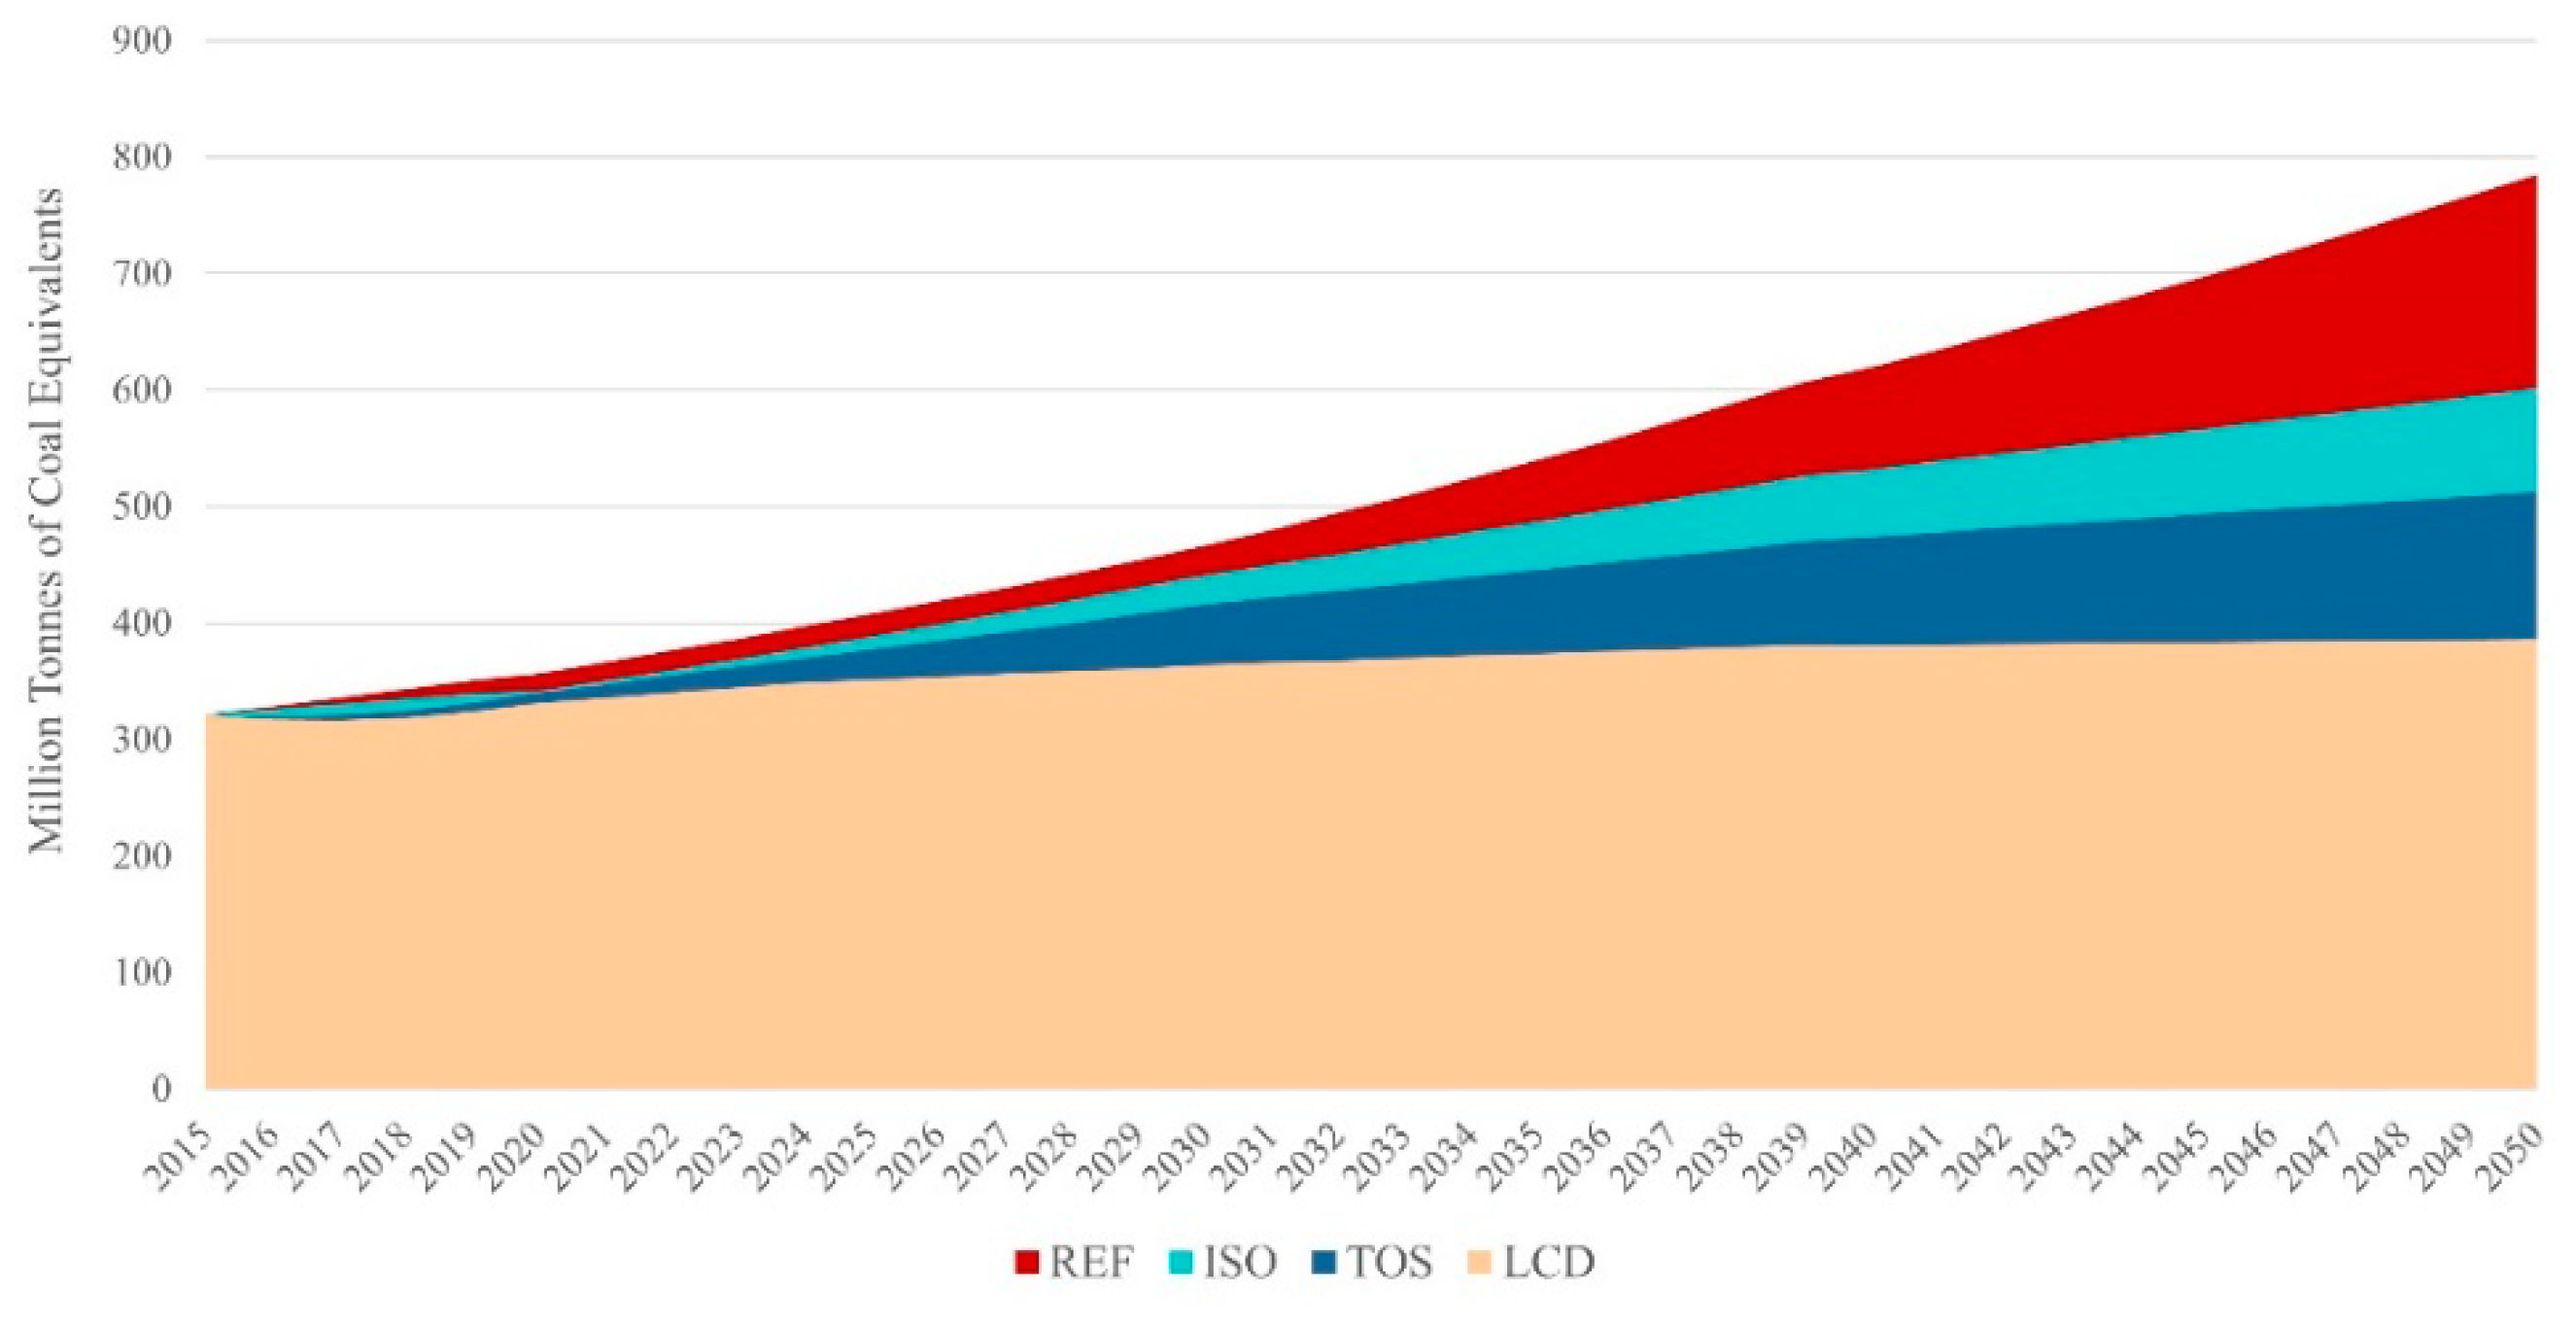
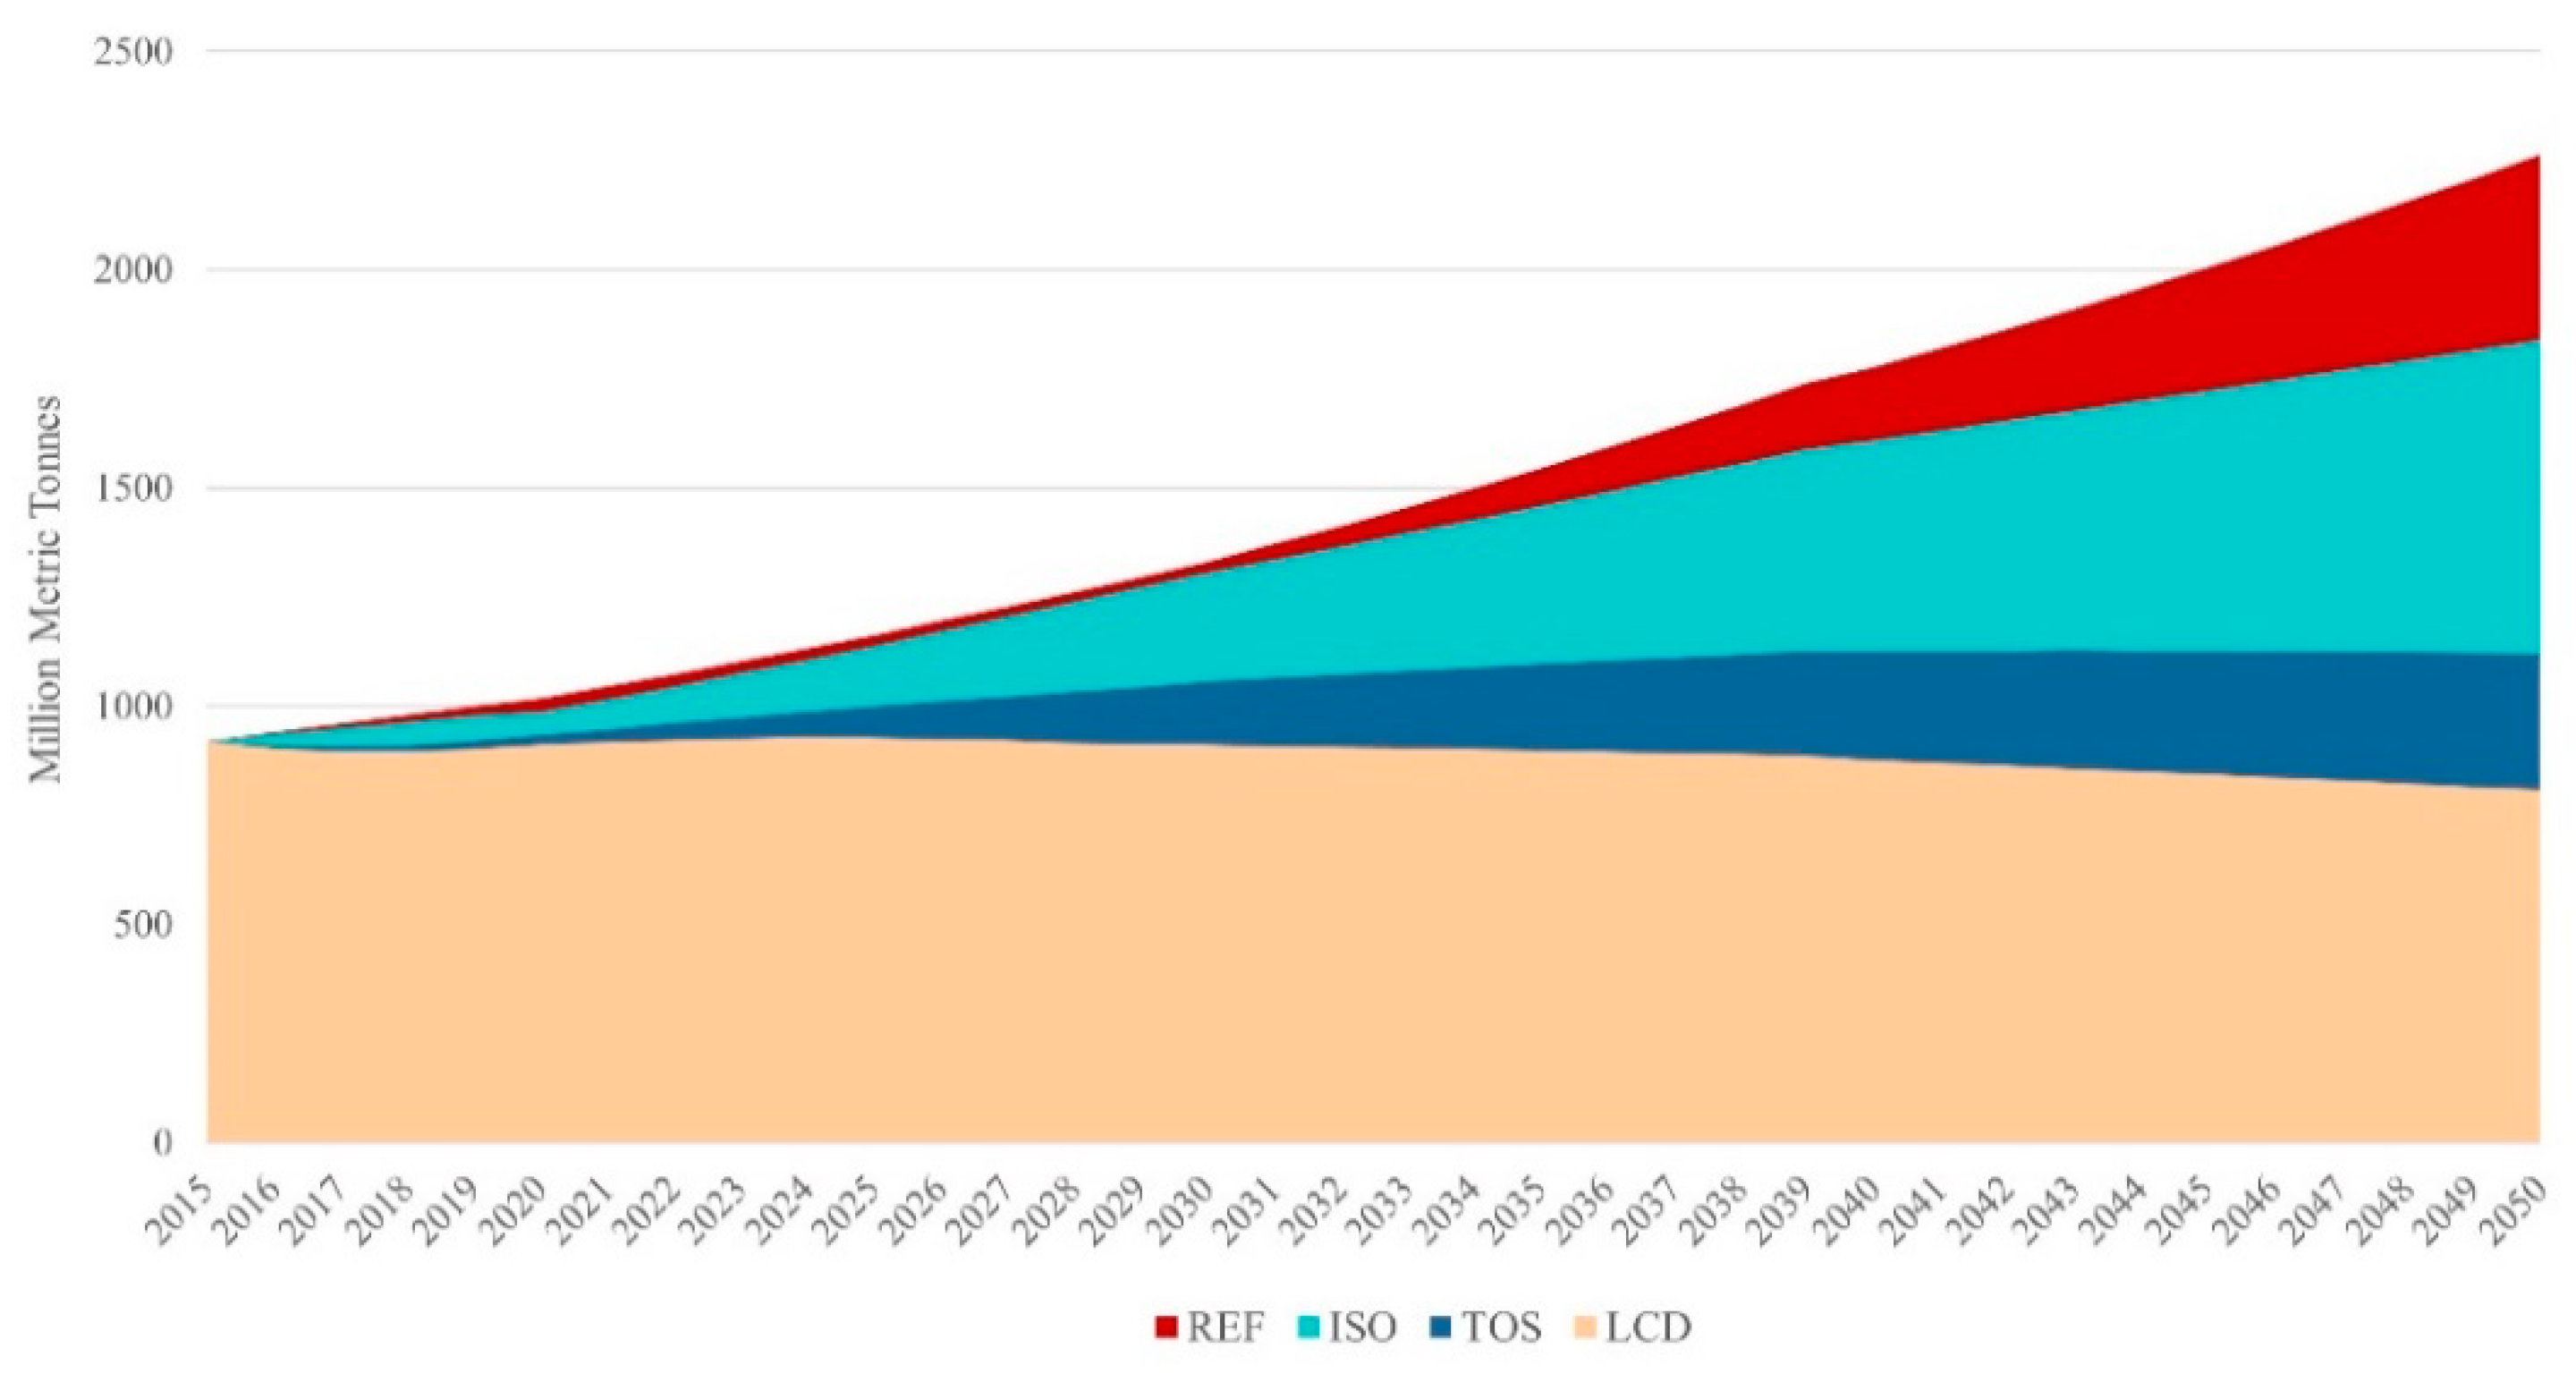
- The energy consumption will reach 784.88 Mtce with an average annual growth rate of 2.58% and a corresponding CO2 emission of 2262.81 Mt by 2050 in the REF. The proposed policy schemes (ISO, TOS and LCD) produce lower energy consumption (23.38%, 34.78% and 45.82%, respectively) and lower CO2 emissions (18.75%, 50.53%, and 64.26%, respectively) by 2050 compared with the REF.
- (2)
- Based on the constraints of fossil energy consumption, the reduction rate of energy consumption per unit GDP, the CO2 emission intensity, the demand for renewable energy development and the total CO2 emission, the LCD results are the closest to the required targets.
- (3)
- Assurance of the increase in the proportion of clean energy, support for curtailing energy-intensive industries, technology innovation in Hebei and guarantee of transferred electricity source to Hebei will have a noticeable effect to support the low-carbon transition of energy system in Hebei under the framework of the coordinated development of Jing-Jin-Ji area. However, the cost control should be paid more attention in the short and medium term.
Supplementary Materials
Author Contributions
Funding
Acknowledgments
Conflicts of Interest
References
- Demirbas, A. Potential applications of renewable energy sources, biomass combustion problems in boiler power systems and combustion related environmental issues. Prog. Energy Combust. Sci. 2005, 31, 171–192. [Google Scholar] [CrossRef]
- Sarkodie, S.A.; Strezov, V. Assessment of contribution of Australia’s energy production to CO2 emissions and environmental degradation using statistical dynamic approach. Sci. Total Environ. 2018, 639, 888–899. [Google Scholar] [CrossRef] [PubMed]
- Wang, S.; Li, Q.; Fang, C.; Zhou, C. The relationship between economic growth, energy consumption, and CO2 emissions: Empirical evidence from China. Sci. Total Environ. 2016, 542, 360–371. [Google Scholar] [CrossRef] [PubMed]
- Sarkodie, S.A.; Strezov, V. Effect of foreign direct investments, economic development and energy consumption on greenhouse gas emissions in developing countries. Sci. Total Environ. 2019, 646, 862–871. [Google Scholar] [CrossRef]
- Team, C.W.; Pachauri, R.K.; Meyer, L.A. Climate Change 2014: Synthesis Report. Contribution of Working Groups I, II and III to the Fifth Assessment Report of the Intergovernmental Panel on Climate Change. J. Romance Studies 2014, 4, 85–88. [Google Scholar]
- Mwoma, T.; Pillay, J. Psychosocial Support for Orphans and Vulnerable Children in Public Primary Schools: Challenges and Intervention Strategies. South Afr. J. Educ. 2015, 35, 404–408. [Google Scholar]
- Zhang, Y.J.; Zhao, L.; Zhang, H.; Tan, T.-D. The impact of economic growth, industrial structure and urbanization on carbon emission intensity in China. Nat. Hazards 2014, 73, 579–595. [Google Scholar] [CrossRef]
- Fan, J.L.; Yu, H.; Wei, Y.M. Residential energy-related carbon emissions in urban and rural China during 1996–2012: From the perspective of five end-use activities. Energy Build. 2015, 96, 201–209. [Google Scholar] [CrossRef]
- Meng, M.; Jing, K.; Mander, S. Scenario analysis of CO2 emissions from China’s electric power industry. J. Clean. Prod. 2016, 142, 3101–3108. [Google Scholar] [CrossRef]
- Ma, X.; Wang, C.; Dong, B.; Gu, G.; Chen, R.; Li, Y.; Zou, H.; Zhang, W.; Lia, Q. Carbon emissions from energy consumption in China: Its measurement and driving factors. Sci. Total Environ. 2019, 648, 1411–1420. [Google Scholar] [CrossRef]
- Liu, Y.; Hao, Y. The dynamic links between CO2 emissions, energy consumption and economic development in the countries along “the Belt and Road”. Sci. Total Environ. 2018, 645, 674–683. [Google Scholar] [CrossRef] [PubMed]
- Young, R.O.; Guttman, D.; Qi, Y.; Bachus, K.; Belis, D.; Cheng, H.; Lin, A.; Schreifels, J.; Eynde, S.; Wang, Y. Institutionalized governance processes: Comparing environmental problem solving in China and the United States. Glob. Environ. Chang. 2015, 31, 163–173. [Google Scholar] [CrossRef]
- Yang, J.; Yong, H.; Qizhi, M.; Suping, C.; Dongquan, H. City-level Green House Gas Emission Inventory From A Spatial Planning Perspective (in Chinese with English abstract). City Plan. Rev. 2013, 37, 50–56. [Google Scholar]
- Dai, H.; Masui, T.; Matsuoka, Y.; Fujimori, S. Assessment of China’s climate commitment and non-fossil energy plan towards 2020 using hybrid AIM/CGE model. Energy Policy 2011, 39, 2875–2887. [Google Scholar] [CrossRef]
- Li, Y.; Su, B. The impacts of carbon pricing on coastal megacities: A CGE analysis of Singapore. J. Clean. Prod. 2017, 165, 1239–1248. [Google Scholar] [CrossRef]
- Zhao, Y.; Li, H.; Xiao, Y.; Liu, Y.; Cao, Y.; Zhang, Z.; Wang, S.; Zhang, Y.; Ahmad, A. Scenario analysis of the carbon pricing policy in China’s power sector through 2050: Based on an improved CGE model. Ecol. Indic. 2018, 85, 352–366. [Google Scholar] [CrossRef]
- Van der Zwaana, B.; Kober, T.; Dalla Longa, F.; van der Laan, A.; Jan Kramer, G. An integrated assessment of pathways for low-carbon development in Africa. Energy Policy 2018, 117, 387–395. [Google Scholar] [CrossRef]
- Davis, M.; Ahiduzzaman, M.; Kumar, A. How will Canada’s greenhouse gas emissions change by 2050? A disaggregated analysis of past and future greenhouse gas emissions using bottom-up energy modelling and Sankey diagrams. App. Energy 2018, 220, 754–786. [Google Scholar] [CrossRef]
- Tao, Z.; Zhao, L.; Changxin, Z. Research on the prospects of low-carbon economic development in China based on LEAP model. Energy Procedia 2011, 5, 695–699. [Google Scholar] [CrossRef]
- Li, P. Energy storage is the core of renewable technologies. IEEE Nanotechnol. Mag. 2009, 2, 13–18. [Google Scholar] [CrossRef]
- Liu, M.; Wei, J.; Wang, G.; Wang, F. Water resources stress assessment and risk early warning–a case of Hebei Province China. Ecol. Indic. 2017, 73, 358–368. [Google Scholar] [CrossRef]
- Liu, Z. China’s Carbon Emissions Report 2016. Available online: https://www.belfercenter.org/publication/chinas-carbon-emissions-report-2016 (accessed on 10 September 2018).
- Chai, Q.M.; Xu, H.-Q. Modeling an emissions peak in China around 2030: Synergies or trade-offs between economy, energy and climate security. Adv. Clim. Chang. Res. 2014, 5, 169–180. [Google Scholar] [CrossRef]
- Wu, Y.; Zhao, Y. Beijing-Tianjin-Hebei Energy Consumption, Carbon Emissions and Economic Growth (in Chinese with English Abstract). Available online: http://jjgl.cbpt.cnki.net/WKB2/WebPublication/wkTextContent.aspx?colType=4&yt=2014&st=02 (accessed on 12 September 2018).
- Zhang, G.; Wang, S.; Liu, S.; Jia, S. Study on Co-ordination between Beijing-Tianjin-Hebei Based on Industry Matching and Transfer (in Chinese with English Abstract). Available online: http://jjgl.cbpt.cnki.net/WKB2/WebPublication/wkTextContent.aspx?colType=4&yt=2014&st=02 (accessed on 12 September 2018).
- Li, W.; An, C.; Lu, C. The assessment framework of provincial carbon emission driving factors: An empirical analysis of Hebei Province. Sci. Total Environ. 2018, 637–638, 91–103. [Google Scholar] [CrossRef] [PubMed]
- Sun, W.; Wang, C.; Zhang, C. Factor analysis and forecasting of CO2 emissions in Hebei, using extreme learning machine based on particle swarm optimization. J. Clean. Prod. 2017, 162, 1095–1101. [Google Scholar] [CrossRef]
- Ou, X.; Yuan, Z.; Peng, T.; Sun, Z.; Zhou, S. The Low-Carbon Transition toward Sustainability of Regional Coal-Dominated Energy Consumption Structure: A Case of Hebei Province in China. Sustainability. 2017, 9, 1184. [Google Scholar] [CrossRef]
- Heaps, C.G. Long-range Energy Alternatives Planning (LEAP) system [Software version: 2018.1.20], Stockholm Environment Institute. Available online: https://www.energycommunity.org (accessed on 30 February 2018).
- Bianco, V.; Righi, D.; Scarpa, F.; Tagliafico, L.A. Modeling energy consumption and efficiency measures in the Italian hotel sector. Energy and Build. 2017, 149, 329–338. [Google Scholar] [CrossRef]
- Emodi, N.V.; Emodi, C.C.; Murthy, G.P.; Emodi, A.S.A. Energy policy for low carbon development in Nigeria: A LEAP model application. Renew. Sustain. Energy Rev. 2017, 68, 247–261. [Google Scholar] [CrossRef]
- Yang, D.; Liu, B.; Ma, W.; Guo, Q.; Li, F.; Yang, D. Sectoral energy-carbon nexus and low-carbon policy alternatives: A case study of Ningbo, China. J. Clean. Prod. 2017, 156, 480–490. [Google Scholar] [CrossRef]
- Zhai, C.; Pang, R. Research on the Path of Hebei Industrial Structure Transformation and Upgrading From the Perspective of the Integration of Beijing, Tianjin and Hebei (in Chinese with English Abstract). J. Baoding Univ. 2017, 30, 49–57. [Google Scholar]
- Sun, N.; Yang, N.; Wang, J. An Empirical Study on Industrial Structure and Economic Growth in Hebei Province—Based on SSM Model and VAR Model. Statistics and Management (in Chinese with English abstract). Stat. Manag. 2017, 6, 43–48. [Google Scholar]
- IPCC. 2006 IPCC guidelines for National Greenhouse Gas Inventories. Available online: https://www.ipcc-nggip.iges.or.jp/public/2006gl/ (accessed on 20 July 2018).
- Wen, J.; Li, M.; Liu, Y. The Influence of the 2022 Zhangjiakou Olympic Winter Games on Hebei’s Economy and Society (in Chinese). Extensive Collect. Party Hist. 2016, 6, 45–46. [Google Scholar]
- Wei, L. Effect of “Two-child Policy” on Population Scale and Demographic Structure of Beijing-Tianjin-Hebei Region Based on Coordinated Development of Beijing-Tianjin-Hebei Region (in Chinese with English Abstract). Hum. Resour. Dev. China 2018, 35, 122–133. [Google Scholar]
- Tan, L. China to Create Xiongan New Area in Hebei (in Chinese). Available online: http://www.gov.cn/xinwen/2017-04/01/content_5182824.htm (accessed on 6 August 2018).
- Department of Housing and Urban-rural Development of Hebei. Urban System Planning of Hebei Province (2016-2030). Shijiazhuang, 2017. Available online: http://www.hebjs.gov.cn/zhengcewenjian/tingfawenjian/201703/t20170307_226738.html (accessed on 20 October 2018).
- National Statistics Bureau. China Energy Statistics Yearbook: Appendix IV. Available online: http://www.stats.gov.cn/tjsj/ndsj/ (accessed on 8 July 2018).
- National Development and Reform Commission. Guidelines for Provincial Greenhouse Gas Inventories in China. Available online: http://www.tanpaifang.com/tanpancha/2017/0807/60227.html (accessed on 23 June 2018).
- Institute of Tsinghua University at Hebei (ITUH). Coordinated Development of Beijing, Tianjin and Hebei: Economic Development, Energy Consumption and Pollution Emission in Hebei Province. Available online: http://www.tsinghua-hb.com/ (accessed on 18 January 2019). (In Chinese).
- Saidi, K.; Hammami, S. The impact of CO2 emissions and economic growth on energy consumption in 58 countries. Energy Reports 2015, 1, 62–70. [Google Scholar] [CrossRef]
- Yavuz, N. CO2 Emission, Energy Consumption, and Economic Growth for Turkey: Evidence from a Cointegration Test With a Structural Break. Energy Sources Part B Econ. Plan. Policy 2014, 9, 229–235. [Google Scholar] [CrossRef]


| Energy End-Use Sector | Structure Ratio [33,34] | ||||
|---|---|---|---|---|---|
| 2015 | 2020 | 2030 | 2040 | 2050 | |
| Primary Sector | 0.12 | 0.09 | 0.06 | 0.04 | 0.03 |
| Secondary Sector | 0.48 | 0.46 | 0.40 | 0.36 | 0.33 |
| Industrial Sector a | 0.88 | 0.82 | 0.77 | 0.70 | 0.65 |
| Construction Sector a | 0.12 | 0.18 | 0.23 | 0.30 | 0.35 |
| Tertiary Sector b | 0.40 | 0.45 | 0.54 | 0.60 | 0.65 |
| Transportation Sector c | 0.23 | 0.18 | 0.15 | 0.12 | 0.08 |
| Commercial Sector c | 0.24 | 0.21 | 0.18 | 0.12 | 0.09 |
| Service Sector c | 0.53 | 0.61 | 0.67 | 0.76 | 0.83 |
| Key Baseline Variables | 2015 | 2020 | 2030 | 2040 | 2050 |
|---|---|---|---|---|---|
| GDP a (billion USD) | 29806.11 | 6344.2 | 12715.25 | 22771.07 | 35362.78 |
| Population b (million) | 7424.92 | 8056.23 | 8577.8 | 9151.95 | 9716.13 |
| Urbanization c (%) | 51.33 | 65.00 | 73.00 | 78.00 | 83.00 |
| Item a | Qnet b (kJ/kg) | Carbon Content per Heat Value c(tc/TJ) | Carbon Oxidation Rate c (%) | Carbon Emission Factors tco2/tce |
|---|---|---|---|---|
| Raw coal | 20,908 | 26.37 | 0.94 | 2.66 |
| Cleaned coal | 26,344 | 25.41 | 0.94 | 2.56 |
| Other coal washing | 8,363 | 25.41 | 0.94 | 2.57 |
| Coal briquette | 26,608 | 33.56 | 0.94 | 5.13 |
| Coke | 28,435 | 29.42 | 0.93 | 2.94 |
| Coke oven gas | 16,726 | 13.58 | 0.98 | 1.33 |
| Blast furnace gas | 16,308 | 13.58 | 0.98 | 0.62 |
| Converter gas | 16,308 | 13.58 | 0.98 | 0.15 |
| Other gas | 5,227 | 12.2 | 0.98 | 0.06 |
| Other coking products | 28,435 | 29.5 | 0.93 | 2.20 |
| Crude oil | 41,816 | 20.08 | 0.98 | 2.11 |
| Gasoline | 43,070 | 18.9 | 0.98 | 1.99 |
| Kerosene | 43,070 | 19.6 | 0.98 | 2.06 |
| Diesel oil | 42,652 | 20.2 | 0.98 | 2.12 |
| Fuel oil | 41,816 | 21.1 | 0.98 | 2.22 |
| Liquefied Petroleum Gas | 50,179 | 17.2 | 0.98 | 1.81 |
| Refinery dry gas | 45,998 | 18.2 | 0.98 | 1.91 |
| Natural gas | 32,238 | 15.3 | 0.99 | 0.13 |
| Other petroleum products | 41,916 | 20.0 | 0.98 | 2.15 |
| Biomass energy | 16,726 | 20.5 | 0.98 | 1.31 |
| Key Parameters Testes in Scenario Setting | Sensitivity of Energy Consumption | |||
|---|---|---|---|---|
| 2020 | 2030 | 2040 | 2050 | |
| Population under REF | 0.0138 | 0.0086 | 0.0074 | 0.0057 |
| Industry structure under ISO | −0.1268 | −0.1066 | −0.0875 | −0.0622 |
| Proportion of renewable energy under TOS | −0.1102 | −0.1242 | −0.1038 | −0.0852 |
| Growth rate of energy efficiency under LCD | −0.1786 | −0.4348 | −0.3672 | −0.2932 |
© 2019 by the authors. Licensee MDPI, Basel, Switzerland. This article is an open access article distributed under the terms and conditions of the Creative Commons Attribution (CC BY) license (http://creativecommons.org/licenses/by/4.0/).
Share and Cite
Li, Z.; Fu, J.; Lin, G.; Jiang, D.; Liu, K.; Wang, Y. Multi-Scenario Analysis of Energy Consumption and Carbon Emissions: The Case of Hebei Province in China. Energies 2019, 12, 624. https://doi.org/10.3390/en12040624
Li Z, Fu J, Lin G, Jiang D, Liu K, Wang Y. Multi-Scenario Analysis of Energy Consumption and Carbon Emissions: The Case of Hebei Province in China. Energies. 2019; 12(4):624. https://doi.org/10.3390/en12040624
Chicago/Turabian StyleLi, Zeng, Jingying Fu, Gang Lin, Dong Jiang, Kun Liu, and Yaxin Wang. 2019. "Multi-Scenario Analysis of Energy Consumption and Carbon Emissions: The Case of Hebei Province in China" Energies 12, no. 4: 624. https://doi.org/10.3390/en12040624
APA StyleLi, Z., Fu, J., Lin, G., Jiang, D., Liu, K., & Wang, Y. (2019). Multi-Scenario Analysis of Energy Consumption and Carbon Emissions: The Case of Hebei Province in China. Energies, 12(4), 624. https://doi.org/10.3390/en12040624