Abstract
In view of the complexity of the energy system and its complex relationship with socio-economic factors, this study adopts the Long-range Energy Alternative Planning (LEAP) model, a technology-based, bottom-up approach, scenario-based analysis, to develop a systematic analysis of the current and future energy consumption, supply and associated Green House Gas (GHG) emissions from 2015 to 2050. The impact of various energy policies on the energy system in Hebei Province was analysed by considering four scenarios: a Reference Scenario (REF), Industrial Structure Optimization Scenario (ISO), Terminal Consumption Structure Optimization Scenario (TOS) and Low-carbon Development Scenario (LCD). By designing strategic policies from the perspective of industrial adjustment, aggressive energy structure policies and measures, such as the ISO and the TOS, and even more aggressive options, such as the LCD, where the percentage of cleaner alternative energy sources has been further increased, it has been indicated that energy consumption will have increased from 321.618 million tonnes of coal equivalent (Mtce) in 2015 to 784.88 Mtce in 2050 in the REF, with a corresponding increase in GHG emissions from 920.56 million metric tonnes (Mt) to 2262.81 Mt. In contrast, the more aggressive policies and strategies involved in the LCD, which combines the ISO with the policy-oriented TOS, can lower energy consumption by 50.82% and CO2 emissions by 64.26%. The results shed light on whether and how these scenarios can shape the energy-carbon emission reduction trajectories and develop the low-carbon pathways in Hebei Province.
1. Introduction
Energy is a significant material guarantee foundation for national economic development and social construction. With rapid economic growth, population expansion and urbanization, the global energy demand continues to grow. To meet the energy demand, energy production continues to expand, and more than 80% of the global energy supply comes from fossil energy sources [1,2]. However, in the process of human consumption of traditional fossil energy, many CO2-based greenhouse gases are emitted into the atmosphere, causing global warming, climate change and the depletion of natural resources [3,4]. The problem has seriously threatened the sustainable development of human society. The Intergovernmental Panel on Climate Change (IPCC) reports that more than 95% of global warming has been caused by human activities and that carbon dioxide is one of the most important anthropogenic greenhouse gases, accounting for more than 70% of the total anthropogenic greenhouse gas emissions and resulting in the most stringent emission reduction scenarios of the IPCC; the global surface temperature may increase further by 2.6 to 4.8 °C in the twenty-first century [5]. China is the world’s largest energy consumer, and its total energy consumption will reach 4.3 billion tonnes of coal equivalent (tce), with coal accounting for 64.0% in 2015 [6]. The total carbon emissions have increased rapidly, and China has become the largest carbon emission country since the 20th century. The per capita greenhouse gas emissions have exceeded the world level by 29% [7]. Further research shows that most of China’s CO2 emissions are related to energy consumption [8,9,10,11]. In particular, the national independent contribution document submitted to the United Nations has clarified a series of targets, such as China’s carbon dioxide emissions, which will peak around 2030 [12], which means that more efforts are needed to control the total amount of energy consumption and reduce carbon emissions.
Currently, there are two widely used methods to conduct research on the low-carbon transition of an energy system, namely, the top-down and bottom-up approaches. The top-down approach calculates greenhouse gas (GHG) emissions based on the appearance energy consumption. This approach has the virtue of strong operability, meanwhile the data is objective and publicly accessible. But the total carbon emission cannot be subdivided into the sectors and industries, and then the targeted measures cannot be provided in this way. The bottom-up approach, also known as the sectoral analysis, estimates the carbon emission with the sum of emissions in different sectors and industries calculated by the activity level values multiplying by the emission factors. In view of the policies tend to influence a specific industrial consumption, this approach has a significant advantage of policy intervention expression in different scenarios by quantitative analysis and evaluation of the contribution of emission reduction measures [13]. For the former, the computable general equilibrium (CGE) model is a popular tool for the analysis of the long-term energy consumption implications of carbon emissions [14]. Liu et al. develops three scenarios (baseline, positive and enhanced scenarios) to simulate primary energy consumption and CO2 emissions from 2010 to 2050 in China, by deeply analyzing economic and social driving forces and exploring the sectoral and technological potentials for carbon emission reduction. [15]. Zhao et al. evaluated the effects of a carbon pricing policy on the development of China’s power sector by introducing 13 CO2 emission scenarios between 2010 and 2050 using an improved CGE model, and the results showed that compared with carbon emission trading, a carbon tax plays a greater role in reducing CO2 emissions both in the short and long terms [16]. For the latter, the existing research focuses mostly on the study of energy consumption and demand and their environmental implications by sub-sector. For example, Pan et al. explored the implications of different effort-sharing principles on how China might need to transform its energy system and contribute toward the achievement of the 2 °C goal using an integrated assessment model (the Global Change Assessment Model (GCAM)) [17]. Davis et al. conducted a disaggregated analysis of past and future greenhouse gas emissions in Canada using bottom-up energy modelling and Sankey diagrams, and the research answered how Canada’s greenhouse gas emissions will change by 2050 [18]. Zhao et al. presented a scenario analysis to quantitatively investigate the level of low-carbon economic development in the future and analysed the development path of low-carbon in China using the Long-range Energy Alternative Planning (LEAP) system. The study concluded that adjusting the industrial structure, fully developing clean coal and coal technology, and improving the energy efficiency are jointly needed to achieve the goal of establishing a low-carbon economy in China [19]. In China, research into energy-related carbon emissions at the regional level is still relatively limited and needs to be improved. The objective of this paper is to present a multi-scenario analysis of energy consumption and carbon emissions at the regional level in China by comprehensively considering the effect of the economic society, industrial planning, energy strategy and power generation technology in the long term. Thus, the bottom-up approach was selected in this study to investigate how the policy action can alter the energy structure to affect the regional low-carbon transition, and it is expected to provide appropriate conclusions and countermeasures for decision-makers to break through the bottlenecks of low-carbon economy development at the regional level.
Hebei Province (E113°27′–119°50′, N36°05′–42°40′) has a significant strategic position in the integrated construction of the Beijing-Tianjin-Hebei (Jing-Jin-Ji) urban agglomeration, which is one of the national key construction projects in China [20]. It lies on the shores of the Bohai Sea (Figure 1) and is one of the major industrial bases of China [21]. As a major driver of China’s industrial and energy consumption, Hebei Province has experienced extensive economic growth and excessive energy consumption, mainly based on traditional fossil energy, which has triggered a series of ecological and environmental problems. According to China’s Carbon Emissions Report 2016, among the provinces in China with the highest carbon emissions, Hebei Province stands in a distant second place, contributing the most to raw coal-related carbon dioxide (CO2) emissions [22]. With the continuation of the global warming trends, the Chinese government has decided to actively develop a low-carbon economy to respond to climate change issues and announced the target of peak CO2 emissions around 2030 in a China-US Joint Announcement by enhancing the non-fossil fuel share of all energy by 2030 [23]. In early 2016, Jing-Jin-Ji area economic and social development plan during the period from 2016 to 2020 was released and it was the first inter-provincial plan in China based on the “Jing-Jin-Ji Cooperation and Development Plan” released by the central government of China in 2015. Jing-Jin-Ji energy consumption and carbon emissions in 12 years show a growing trend; Carbon emission intensity decreased; High emission of Beijing-Tianjin-Hebei is mainly caused by the energy structure with coal consumption and mainly to the high energy consuming industries dominated the industrial structure [24,25]. As one of the members of the Jing-Jin-Ji urban agglomeration, Hebei Province must rise to the challenge of the industrial transition and the optimization of the energy structure to meet the carbon emission reduction for the regional coordinated development. At this stage, studies focused on Hebei mainly include the influence factors on carbon dioxide emissions and the transmission mechanism between the energy structure and carbon emissions. Li et al. studied the assessment framework of Hebei’s carbon emission driving factors by combining system dynamics modelling with an empirical analysis approach [26]. Sun et al. conducted a comprehensive bivariate correlation analysis by considering 22 influence factors to explore the factors influencing CO2 emissions and forecasted CO2 emissions in Hebei Province using particle swarm optimization [27]. Unlike the model referenced above, Ou et al. aimed to support the strategy decision on the coordinated development of Jing-Jin-Ji by investigating the regional low-carbon transition pathway based on a bottom-up modelling analysis in Hebei Province by 2030; the study provided two scenarios based on settings of the economic growth rate, industrial structure, industry/sector energy consumption intensity, energy supply structure, and CO2 emission factor to forecast the end-use energy demand, primary energy supply and resulting CO2 emissions in the medium term [28]. However, the two scenarios designed by Ou et al. did not consider the influence of recent development plans (such as the “Two-child Policy”, the development of the Xiongan New Area, the hosting of the Olympic Winter Games and so on) and the technological innovation in the generation sector. Thus, it is necessary to establish a bottom-up and medium- and long-term energy carbon emission model to study energy conservation and carbon emission reduction measures such as the Hebei industrial structure adjustment, energy structure optimization, development of new energy, and coal cleanliness for the regional coordinated development.
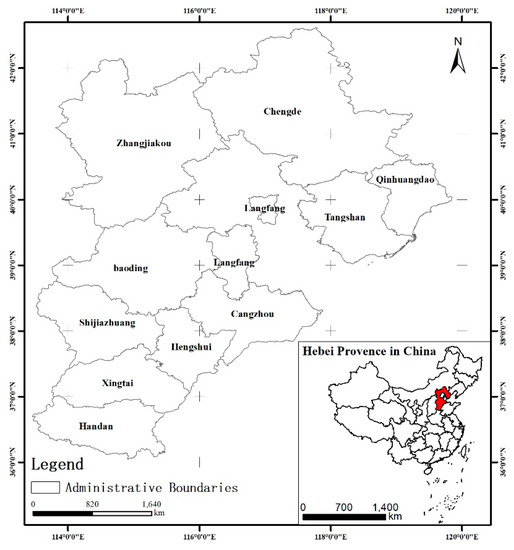
Figure 1.
Location of Hebei Province.
2. Methodology
2.1. Framework of the Model
In view of the complexity of the energy system and its complex relationship with socio-economic factors, this study adopts the LEAP model (hereafter referred to as the LEAP-Hebei model), a technology-based, bottom-up approach, to develop a systematic analysis of the current and future energy consumption and its associated carbon emission in Hebei Province. The model framework used to assess the carbon emissions of the energy sector are shown in Figure 2.
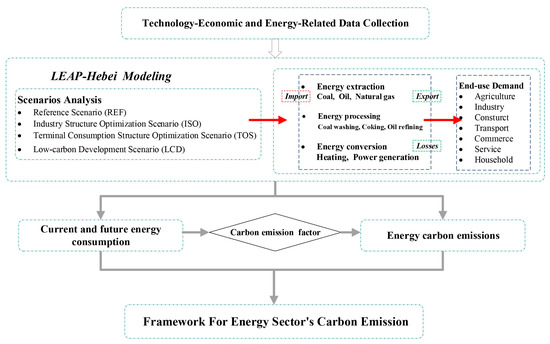
Figure 2.
Model framework used to assess the carbon emissions of the energy sector. In the LEAP-Hebe, four scenarios: a Reference Scenario (REF), Industrial Structure Optimization Scenario (ISO), Terminal Consumption Structure Optimization Scenario (TOS) and Low-carbon Development Scenario (LCD) were established; the boundary of the model included the energy extraction energy processing, energy conversion and end-use demand, and the energy-using sectors were generalized as agriculture, industry, construct, transport, commerce, service and household. The model was drove by the macroeconomic factors and the government policy guidance.
2.2. LEAP Model
The LEAP model was designed by the Stockholm Environment Institute for the comprehensive analysis of the energy-economy-environment based on energy plan scenarios [29]. It is a bottom-up model and is used to estimate the current and future energy consumption and to calculate the carbon emission by linking the environmental emission factors based on the setting scenarios and the driving factors in different periods. The data structure of the model is flexible and rich in technical and end-user details, so it has been widely used in previous studies. Vincenzo et al. built an energy model for the hotel sector using the LEAP platform in Italy to estimate the maximum potential for energy savings and emissions reductions of the Italian hotel sector in two scenarios [30]. Nnaemeka et al. explored Nigeria’s future energy demand, supply and associated GHG emissions from 2010 to 2040 based on the scenario using the LEAP model [31]. Yang et al. also applied a LEAP-Ningbo model to estimate six sector-based energy consumption levels and the resulting GHG emissions in Ningbo, which is a pilot low-carbon city in China [32]. However, the overarching inability to predict public and political severely limits the modeler’s ability to develop predictive scenarios in LEAP model [29]. Meanwhile, given the limitations, the model cannot achieve the specific system costs, generating capacities and global warming potentials with a certain accuracy.
This paper focuses on the current and future energy sector-related consumption and CO2 emissions by first imposing policies on economic growth, industrial structure, energy utilization on the demand side and innovative technology for the Hebei Province energy system in a bottom-up approach using the LEAP model. Combined with the actual energy situation in Hebei Province, this study divides the energy terminal demand side into seven sectors: agricultural, industrial, construction, transportation, commerce, service and household sector. The energy consumption for every activity was calculated in the LEAP model using the following equation:
where stands for the energy consumption for the activity, stands for the activity level and is the energy intensity.
The carbon emission for every activity was estimated using the following equation:
where stands for the carbon emission for the activity, and stands for the localized carbon emission factors.
2.3. Scenario Development and Assumptions
This study established four scenarios: REF, ISO, TOS and LCD based on the activity level of each sector, the energy intensity and the energy structure using a bottom-up approach.
As the basic scenario, the REF assumes the current situation of energy consumption to meet normal economic and social development in Hebei Province. The development of industry economy in Hebei maintains a development trend of seeking progress in stability, while energy-intensive industries also maintain that same trend. In this scenario, the new industrial, energy and low-carbon-oriented policies are not introduced to lower the energy intensity and CO2 emissions. It is assumed to follow the traditional development paradigm for implementing appropriate industrial transformation and upgrading but without considering additional measures. Thus, the objective of this scenario is to assess the environmental impacts of energy consumption without any new regulatory measures, it should be considered as the most realistic one in this study.
The ISO designs strategic policies from the perspective of industrial structure adjustment. In this scenario, the adjustments in the Hebei industrial structure are meant to lower the energy intensity and CO2 emissions. According to the 13th five-year plan, Hebei Province will promote industrial structure optimization and decrease the proportion of the primary and secondary industry output gradually and increase the proportion of the tertiary industry, which will account for 45% in 2020. Table 1 shows the designed proportion of the industry structure in the ISO in the model.

Table 1.
The designed proportion of the industry structure in the ISO in the model.
To further achieve the goal of "energy saving and carbon emission reduction", this paper introduces a key policy to expedite the adjustment of the energy terminal consumption structure designed as the TOS and develops low-carbon technology as the LCD in the model. In the TOS, Hebei Province will increase the percentage of cleaner alternative energy sources according to its energy planning, especially in the power sector, and will continue to develop wind and solar technology for electricity generation. This scenario focuses on strengthening the advantages of exploiting and utilizing renewable energy resources based on the ISO. The main goal of the LCD is to explore the impact of the improvement of the energy efficiency in different sectors by introducing energy technology (Integrated Gasification Combined Cycle (IGCC) and Carbon Capture and Storage (CCS), etc.) and advanced equipment to reduce carbon emissions. In the power sector of the LCD, the ultra-supercritical has become dominant in thermal power units to increase generating efficiency, and CCS has also been extensively applied in the thermal power field to lower carbon emissions. In addition, this scenario also considers the reduction of the energy loss in energy transmission and distribution, and the control of the energy intensity in the household sector. Compared with the TOS, the LCD highlights the application of technological innovations capable of reducing carbon emissions. The major parameters used in the sub-sectors of the TOS and LCD in the LEAP-Hebei model are given in Tables S1 and S2. The related power production structures of REF, ISO, TOS and LCD used in the LEAP-Hebei model can be found in Table S3.
2.4. Sensitivity Analysis
The single factor sensitivity analysis was used to evaluate the impact on the result (i.e., energy consumption in this study) caused by key parameters in the scenarios setting. The formula is as follows:
where, is the sensitivity coefficient of the result to the influencing factor , is the change rate of the uncertainty factor, is the corresponding change rate of result when the change of happens. A positive value of represents the result with the uncertainty factor changes in the same direction, while a negative value denotes the opposite direction; The larger absolute value of the value means the result is the more sensitive to the uncertainty factor.
3. Data Acquisition
In this study, the four types of data that were collected for the modelling processes are as follows: socio-economic data, baseline data of 2015, scenario planning data and reference parameters. The socio-economic data that were used for the driving factors, e.g., population, urbanization, GDP and industrial structure, were mainly from the Hebei statistical yearbook 2016, Hebei’s 13th five-year plan and the urban system planning in Hebei Province. Table 2 lists the key baseline variables in the LEAP-Hebei model, such as the population, GDP, and urbanization. The baseline data of 2015 refer to the energy supply, and the transformation and demand in the seven sectors, which were collected from the Hebei Economic Yearbook 2016 and the China Energy Statistics Yearbook 2016. The scenario planning data were collected from local plans and previous literature, and the local plans include Hebei’s 13th five-year energy development plan, China Energy and Carbon Report 2050 and the programme for the coordinated development of Jing-Jin-Ji. The reference parameters, such as the emission factors in the model (Table 3), were calculated using the following equation [35].
where stands for the localized carbon emission factors, stands for qnet, stands for the carbon oxidation rate of energy , and stands for the molecular weight ratio of CO2 and C.
Table 2.
The key baseline variables in the LEAP-Hebei model.
Table 3.
The carbon emission factors calculated for the LEAP-Hebei model.
4. Results and Analysis
4.1. Energy Consumption
Based on the assumption about the socio-economic development in Hebei Province and the various parameters presented in Table 1 and Table 2 and Tables S1–S3, the values of the total energy consumption for the LEAP-Hebei model for the REF, ISO, TOS, and LCD from 2015 to 2050 are shown in Figure 3. In general, the energy consumption rose steadily before 2050 in each scenario, whereas the growth rate was different. The total energy consumption maintained a high-speed growth trend in the REF, ISO and TOS, and even though the LCD also showed an upward trend, the growth rate was slow. The energy consumption increased from 321.61 Mtce in 2015 to 784.88 Mtce in 2050 in the REF, with an average annual growth rate of 2.58%, the highest among the four scenarios. Due to the industrial structure optimization measures, the total energy consumption will be reduced to 601.3 Mtce in 2050 in the ISO, a decrease of 183.55 Mtce compared with the REF, with an average annual growth rate of 1.81%. Due to the implementation of coal cleaning, the development of renewable energy sources, the reduction of the proportion of traditional energy sources, and the improvement of the energy efficiency based on the ISO, the total energy consumption will be reduced to 512.42 Mtce in 2050 in the TOS, a decrease of 88.95 Mtce compared with the ISO, with an average annual growth rate of 1.34%. The LCD, which has a higher level of energy efficiency and of application of renewable energy, had a reduced total energy consumption of 385.92 Mtce, a decrease of 126.5 Mtce compared with the TOS, with an average annual growth rate of 0.52%.
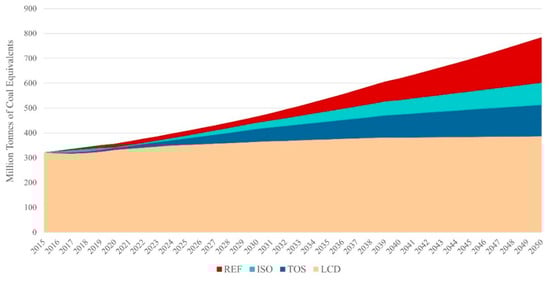
Figure 3.
The energy consumption in each scenario in 2015–2050.
Regarding the sectoral structure of energy consumption, with the adjustment of the industrial structure, the optimization of the energy structure, the improvement of the energy efficiency, the technological progress and other measures in Hebei Province, the energy consumption growth rates of the various sectors vary, thus causing different changes in the trend of the proportion of the sectoral energy consumption. The proportion of energy consumption of each sector in the REF is basically consistent with that of the baseline year.
As shown in Figure 4, the majority of terminal energy consumption came from the industrial sector, accounting for 77.78%; the household sector accounted for 10.70%, the transportation sector 3.67%, the agricultural sector 1.79%, the commerce sector 1.91%, the construction sector 1.18% and the service sector 2.96%. The industrial sector will always have a dominant position in energy consumption. With the optimization of the industrial structure, adjustments in the energy structure, the development of renewable energy sources, the reduction of the proportion of traditional energy sources, the improvement of energy efficiency and introduction of energy policies, the trend changes in the terminal energy consumption structure are obvious. The proportion of energy consumption in the industrial sector will continue to decline, while the proportion of the household and service sector will gradually rise in the ISO, TOS and LCD. In the LCD, the proportion of energy consumption in the industrial sector continued to decline, and it accounted for 52.412%, which was 19.81% lower than the TOS. The proportion of energy consumption in the household and service industries continued to rise; the household sector accounted for 17.95%, an increase of 7.92%, and the service industry accounted for 16.47%, an increase of 13.51% compared with the base year. The proportion of the energy consumption of the construction and commerce sector increased slowly, while that of the agricultural sector declined slightly; that of the transportation industry first rose and then slowly declined.
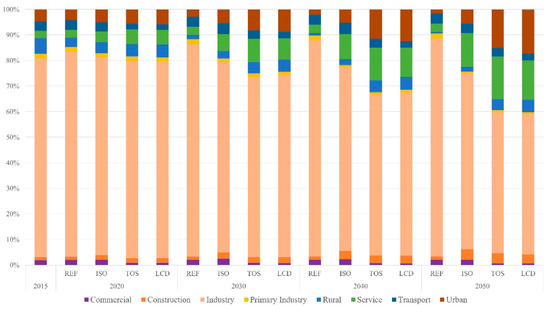
Figure 4.
The proportion of the energy consumption in each sector.
4.2. Final energy Usage by Fuel Type
The structural changes in the final energy usage are shown in Figure 5 in the four scenarios in 2020, 2030, 2040 and 2050. The structure of the REF energy usage is basically the same as that of 2015, with coal, fuel oil, natural gas and electricity accounting for 86.67%, 8.13%, 2.99% and 2.60%, respectively. Coal will still dominate the energy consumption system by 2050 under the REF. Under the change of energy policy, the proportion of different fuel types would vary greatly in the four scenarios. In contrast, by 2050, coal decreased to 72.10%, coke decreased to 19.82%, natural gas rose to 4.42% and electricity rose to 7.48% in the ISO; coal decreased to 51.81%, natural gas rose to 9.92% and electricity rose to 15.57% in the TOS; and coal decreased to 36.23%, natural gas rose to 8.92% and electricity rose to 19.82% in the TOS. Obviously, the proportion of coal consumption is continuously decreasing, while the proportion of electricity and natural gas is continuously increasing under the various policy changes. In addition, the range of increase in LPG, CNG, wind energy, solar energy, water energy and biomass energy is different, whereas diesel and gasoline are significantly reduced. This is mainly due to the implementation of clean energy, the promotion of new energy usage in the transportation sector, and the expansion of the proportion of renewable energy in power generation. Under the TOS and LCD, the energy use structure will gradually become environmentally friendly, and clean energy will grow rapidly, which provides positive policy recommendations for Hebei’s low-carbon development and emission reduction.
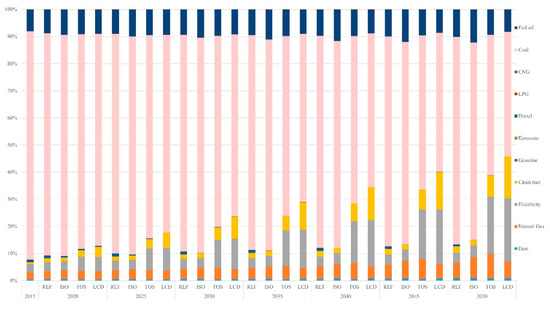
Figure 5.
The proportion of final energy use by fuel type.
4.3. Electricity Production
With the development of the social economy, the demand for electricity continues to rise. In the REF and ISO, the proportion of various types of power generation is still dominated by thermal power generation, and the thermal generation accounts for over 70%. In the TOS and LCD, the proportion of renewable energy generation is continuously increased to 50.78% and the proportion of thermal power generation is reduced to 34.34% by 2050, while the proportion of renewable energy power generation will increase to 49.22% and 65.66% by then. The advanced IGCC and CCS technologies will be introduced into thermal power generation to improve the efficiency of power generation and reduce carbon emissions. The specific proportion of electricity generation is shown in Figure 6 in the four scenarios from 2015 to 2050. The proportion of thermal power generation has been decreasing, and that of renewable energy has been increasing. Taking the LCD as an example, the proportion of thermal power generation has decreased to 34.34%, while renewable energy generation includes wind power (30.92%), solar energy (33.42%), hydropower (1.25%) and biomass energy (0.07%). The proportion of renewable energy generation increased by approximately 57.60% compared with the base year. This is accomplished by combining the geographical advantages of Hebei in the use of wind and solar energy technology to increase the power generation of clean energy and reduce CO2 emissions by 2050.
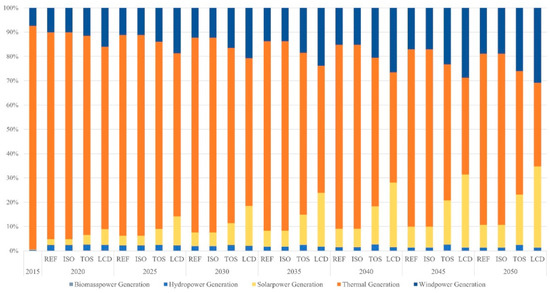
Figure 6.
Proportion of the electricity generation mix by 2050 in the four scenarios.
4.4. CO2 Emission
The CO2 emission trends associated with energy consumption in Hebei Province in the various scenarios from 2015 to 2050 are shown in Figure 7. The total carbon emissions of the REF and ISO continued to increase, and there was no peak inflection point. Under the TOS and LCD, peaks occurred in 2040 and 2025, respectively, and the peak carbon emissions of the TOS and LCD were 1126.78 Mt and 928.82 Mt, respectively. The growth rate is ranked from high to low: REF > ISO > TOS > LCD. The REF is the fastest, while the LCD scenario is the slowest. The CO2 emissions will increase from 920.56 Mt in 2015 to 2262.81 Mt in 2050, with an annual growth rate of 2.61%. CO2 emissions will decrease to 808.56 Mt in 2050 with a significantly lower annual rate of increase of -0.38% under the LCD; emissions will increase to 1838.45 Mt and 1119.29 Mt CO2 in 2050 with a significant growth rate of 1.99% and 0.56% in the ISO and TOS, respectively. Among them, the CO2 emission of the LCD was reduced to 1454.25 Mt compared with the REF, which also indicates that CO2 emission increases are directly related to fossil energy consumption. It was indicated that the increase in fossil energy consumption will lead to an increase in CO2 emissions, while CO2 emissions gradually decrease through the expansion of coal cleansing and renewable energy applications in the LCD compared with the other scenarios. On the supply side, increasing the use of renewable energy will reduce CO2 emissions. The introduction and deployment of clean energy technologies needs to be focused on both the demand and supply end to achieve low-carbon development in Hebei Province.
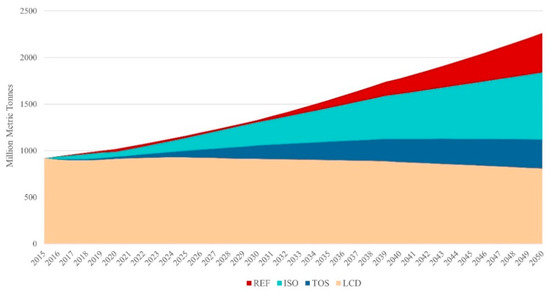
Figure 7.
The trend of CO2 emission in 2015-2050 in the four scenarios.
The consumption of fossil energy would be reduced as the electricity consumption of various sectors increases in the future, thus increasing the proportion of CO2 emissions from the transformation sector. As shown in Figure 8, the transformation sector has become the greatest contributor to CO2 emissions in the four scenarios. From the view of the terminal energy consumption sector, the industrial sector is one of the main targets of Hebei Province’s emission reduction, and CO2 emissions of the industrial sector accounting for 43.10% in 2015. With the continuous development of the tertiary industry and the continuous improvement of people’s living standards, the proportion of CO2 emissions of the service and urban sector increased rapidly after adopting a series of measures with an average annual rate of 8.89% and 3.29% in the ISO, respectively. The industrial sector achieved a decline in carbon emissions, which decreased from 23.61 to 23.28%; the service and urban sector increased faster, while CO2 emissions of the transportation sector, the commercial sector and rural sector increased first and then decreased. The growth rate of the primary and construction sector was slow.
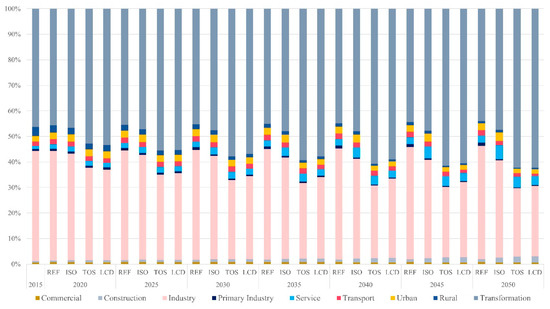
Figure 8.
The proportion of CO2 emissions in each sector.
5. Discussion
5.1. Uncertainty of the Scenario Analysis Results
A series of parameters according to the 13th five-year plan was applied in this study. The LEAP model is adopted to predict the energy consumption, and the CO2 emission factor was referenced from the IPCC and other studies. In addition to not including all the influence factors, the parameter selection is too simple and idealized, and some uncertainty in setting the future parameter values of the selected driving factors exist; for example, the industrial structure, the energy import and export, the energy intensity of each sector, the Gross Domestic Product (GDP) growth rate and the popularity rate of energy technology. Table 4 shows the sensitivity analysis of energy consumption resulting from key parameters changes. It is obvious that the sensitivity of energy consumption varies notably with various influencing factors. It’s also pointed out that energy consumption is most sensitive to the growth rate of energy efficiency under the LCD, and the consumption changes with other influencing factors in the opposite direction except the population under the REF.
Table 4.
The sensitivity analysis of energy consumption.
The calculation of CO2 emission factors is based on the material conservation calculation method of the IPCC and Hebei’s provincial carbon emission parameters; errors are inevitable. Due to the limited data, the type of power generation statistics is not detailed, and the development of nuclear power is not considered. The parameter of energy intensity may cause uncertainty in the calculation of the results because it is not subdivided into the detailed terminal technology of each sector. The results were validated by the latest energy data available (2016) and other studies. The predicted terminal energy consumption of the study is 256.28 Mtce, and the real consumption reported in the China Energy Statistics Yearbook 2017 is 255.56 Mtce, with an error of only 0.28%. The prediction of thermal power generation is 2915.82 Mtce, and the real value is 2915.76 Mtce, with an error of only 0.04%. This little difference might be introduced by the data integration of inter-sector. Ou et al., with a similar scenario to the Institute of Tsinghua University at Hebei (ITUH) [42], predicted that primary energy consumption would increase from 336 Mtce in 2015 to 471 Mtce in 2030 in the conventional scenario, and the result would be 431 Mtce in 2030 in the coordinated scenario [28]. In our research, the primary energy consumption would increase from 321.62 Mtce in 2015 to 465.87 Mtce in 2030 in the REF which is 5.13 Mtce lower than the Ou study in the conventional scenario in 2030. The reason of this deviation on the estimated values might be caused by the differences of the key baseline variables between the two scenarios. But anyway, the prediction results are basically the same in the conventional development, and the model has a fairly good predict ability of energy system. Thus, it is hoped that the exploratory path of low-carbon development, assumed in LCD in this study, can support the coordinated targets of economic growth and CO2 emission control, and environmental governance, and benefit the sustainable development of Hebei province.
5.2. The Pathways for Low-Carbon Development
The LEAP-Hebei model implies significant potential for the reduction of energy consumption-related carbon emissions in the policy scenarios of the ISO, TOS and LCD compared with the REF. Therefore, more policies were effectively performed to reduce CO2 emissions and specific measures can be optimized through discussion to promote sustainable development in Hebei Province.
Although the household sector accounts for a relatively small amount in 2015 (5.69%), energy conservation and emission reduction are still worth considering as the demand for energy increases with the future economic development and the improvement of people’s living standards. Electricity and heating supply account for 63.28% of the energy structure of the household sector. High-efficiency and energy-saving appliances should be popularized for household use, such as the promotion of energy-saving refrigerators, washing machines, air conditioners, kitchen lamps and lanterns [32]. Many countries have gradually implemented replacing incandescent bulbs with Light-Emitting Diode (LED) and Compact Fluorescent Lamp (CFL) bulbs [31]. Heating should adopt a more efficient central heating system. In terms of fuel use, coal should be replaced by gas and electricity, especially in the rural sector. Central heating should be implemented instead of traditional scattered coal heating in rural areas. The use of clean energy should be promoted more actively, and the use of solar water heaters should be promoted to reduce coal consumption and CO2 emission.
For the primary industry (agriculture, forestry, animal husbandry and fishery), reducing the use of coal and diesel and increasing the proportion of clean energy (biomass) are further improvements. For the commercial/service sector, more electricity and natural gas supply should be provided as the final energy consumption instead of fossil fuels such as coal, gasoline and diesel oil.
For the construction sector, energy consumption and CO2 emissions have maintained a steady growth. More applications are for raw materials, such as bitumen. Reducing the use of gasoline, diesel and fuel oil and increasing the proportion of clean energy usage helps to reduce greenhouse gas emissions. For the industrial sector, reducing the proportion of secondary industries, optimizing the terminal energy structure, and improving energy efficiency are crucial to decreasing industrial CO2 emissions. Implementing coal cleaning and reducing the share of coke and fuel oil is effective for industrial energy conservation and emission reduction. The innovation of energy application technologies can be promoted, energy efficiency can be improved, and backward production technologies can be eliminated with the implementation of strict emission reduction targets for enterprises that have high energy consumption and high pollution. In the process of industrial upgrading, low-carbon and circular economy development policies can be highlighted, key areas should be developed, relevant stimulus measures should be formulated, and financial incentives and fund subsidies should be provided to help solve the short-term difficulties in industrial transformation and technological transformation [31].
For the transportation sector, the proportion of new energy vehicles should continue to expand, and high-carbon fuels like gasoline and diesel will gradually be replaced by new energy sources such as compressed natural gas and electricity, which will be provided by more renewable energy sources in the supply of electric vehicles. Although there are still great difficulties in the economy and technology, clean fuel-driven new energy vehicles are imperative and will promote the development of a low-carbon path. For the transformation sector, since coal and crude oil are the main energy resources of the conversion department, reducing the proportion of coal in coking, oil refining, heating and thermal power generation is crucial to energy conservation and emission reduction. In the electricity sector, it is necessary to reduce the losses of power transmission and distribution, increasing the substitution of natural gas for coal in thermal power generation and building a more advanced gas power plant (Combined Cycle Gas Turbine, CCGT).
For coal-fired power plants, more advanced IGCC technologies should be introduced to improve energy efficiency, and CCS should be introduced to reduce CO2 emissions. The highest level of utilization of renewable energy was accounted for in the LCD compared to the other three scenarios, and the CO2 emissions in the power generation sector will be 125.72 Mtce lower than in the REF. This result indicated that the measure of renewable energy utilization is significantly effective in reducing emissions. It should fully combine the regional advantages, vigorously develop wind and solar energy technology, steadily develop hydropower and biomass energy, increase the proportion of renewable energy generation, and reduce the proportion of thermal power generation to reduce carbon emission in Hebei Province.
Hebei, as a crucial part of the integration of Jing-Jin-Ji, are facing the dual tasks of industrial upgrading and low carbon emissions. The relevant control and emission reduction targets set by the state need to be fulfilled to change the current serious haze pollution situation in the area of Jing-Jin-Ji. Some previous research have confirmed that low-carbon development is possible by improving energy efficiency and optimizing the terminal energy structure [43,44]. A bottom-up approach is applied to explore the pathway for the complete energy system in Hebei Province; however, significant concern still exists to understand the term “low-carbon development” in the Hebei context. The energy consumption of the ISO, TOS and LCD will be 183.51 Mtce, 272.45 Mtce and 398.96 Mtce lower than that of the REF. In addition, the CO2 emissions of various energy fuels vary, the intensity of carbon emissions of coal and oil are relatively higher, and that of clean fuels is lower. The sector evaluation and prediction of the proposed LEAP-Hebei model show that the processing transformation sector and the industrial sector are the main contributors to energy consumption and CO2 emissions, which are closely related to the industrial structure and high carbon fuel consumption structure in Hebei. Under the ISO, TOS and LCD, CO2 emissions will drop 18.76%, 50.71% and 64.28% compared with the REF by 2050. It is obvious that the LCD is more beneficial to Hebei’s low-carbon development trajectory based on the energy consumption and carbon emission results of the various scenarios. However, "low-carbon" is the future development that must be pursued, not the one that must be targeted, whereas we must try our best to implement low-carbon development. The path for low-carbon development of Hebei until 2050 is not static but dynamic. Therefore, it needs to be corrected in different stages and periods. This study provides some possible development paths by the developed scenarios for the energy system in Hebei and studied the influence of future energy policies and strategies on the path to low-carbon transformation.
6. Conclusions
Taking Hebei province as an example, this paper establishes a LEAP-Hebei model based on relevant policies and the current situation, simulating medium-term and long-term energy demand and carbon emissions in Hebei from 2015 to 2050 using a bottom-up method, taking into consideration the key factors that will affect energy policies in the future, such as GDP, population and urbanization. The following primary conclusions were reached:
- (1)
- The energy consumption will reach 784.88 Mtce with an average annual growth rate of 2.58% and a corresponding CO2 emission of 2262.81 Mt by 2050 in the REF. The proposed policy schemes (ISO, TOS and LCD) produce lower energy consumption (23.38%, 34.78% and 45.82%, respectively) and lower CO2 emissions (18.75%, 50.53%, and 64.26%, respectively) by 2050 compared with the REF.
- (2)
- Based on the constraints of fossil energy consumption, the reduction rate of energy consumption per unit GDP, the CO2 emission intensity, the demand for renewable energy development and the total CO2 emission, the LCD results are the closest to the required targets.
- (3)
- Assurance of the increase in the proportion of clean energy, support for curtailing energy-intensive industries, technology innovation in Hebei and guarantee of transferred electricity source to Hebei will have a noticeable effect to support the low-carbon transition of energy system in Hebei under the framework of the coordinated development of Jing-Jin-Ji area. However, the cost control should be paid more attention in the short and medium term.
This study provides a valuable reference in further revolutionary change in the energy system. However, the problem is complex, and further analysis, especially from the resources and environment, is warranted.
Supplementary Materials
The following are available online at http://www.mdpi.com/1996-1073/12/4/624/s1. Table S1: The major parameters used in sub-sector for TOS in the LEAP-Hebei model; Table S2: The major parameters used in sub-sector for LCD in the LEAP-Hebei model; Table S3: The related power production structure of REF, ISO, TOS and LCD used in the LEAP-Hebei model.
Author Contributions
G.L. and D.J. contributed to all aspects of this work; Z.L. and J.F. conducted data analysis, and wrote the main manuscript text; K.L. and Y.W. gave some useful comments and suggestions to this work. All authors reviewed the manuscript.
Funding
This work was supported and funded by Strategic Priority Research Program of the Chinese Academy of Sciences (Grant number: XDA19040305) and Key Program of International Cooperation Bureau of the Chinese Academy of Sciences (Grant number: 131A11KYSB20170014).
Acknowledgments
We greatly thank AJE (American Journal Experts) for the editing assistance to the paper.
Conflicts of Interest
The authors declare no conflict of interest.
References
- Demirbas, A. Potential applications of renewable energy sources, biomass combustion problems in boiler power systems and combustion related environmental issues. Prog. Energy Combust. Sci. 2005, 31, 171–192. [Google Scholar] [CrossRef]
- Sarkodie, S.A.; Strezov, V. Assessment of contribution of Australia’s energy production to CO2 emissions and environmental degradation using statistical dynamic approach. Sci. Total Environ. 2018, 639, 888–899. [Google Scholar] [CrossRef] [PubMed]
- Wang, S.; Li, Q.; Fang, C.; Zhou, C. The relationship between economic growth, energy consumption, and CO2 emissions: Empirical evidence from China. Sci. Total Environ. 2016, 542, 360–371. [Google Scholar] [CrossRef] [PubMed]
- Sarkodie, S.A.; Strezov, V. Effect of foreign direct investments, economic development and energy consumption on greenhouse gas emissions in developing countries. Sci. Total Environ. 2019, 646, 862–871. [Google Scholar] [CrossRef]
- Team, C.W.; Pachauri, R.K.; Meyer, L.A. Climate Change 2014: Synthesis Report. Contribution of Working Groups I, II and III to the Fifth Assessment Report of the Intergovernmental Panel on Climate Change. J. Romance Studies 2014, 4, 85–88. [Google Scholar]
- Mwoma, T.; Pillay, J. Psychosocial Support for Orphans and Vulnerable Children in Public Primary Schools: Challenges and Intervention Strategies. South Afr. J. Educ. 2015, 35, 404–408. [Google Scholar]
- Zhang, Y.J.; Zhao, L.; Zhang, H.; Tan, T.-D. The impact of economic growth, industrial structure and urbanization on carbon emission intensity in China. Nat. Hazards 2014, 73, 579–595. [Google Scholar] [CrossRef]
- Fan, J.L.; Yu, H.; Wei, Y.M. Residential energy-related carbon emissions in urban and rural China during 1996–2012: From the perspective of five end-use activities. Energy Build. 2015, 96, 201–209. [Google Scholar] [CrossRef]
- Meng, M.; Jing, K.; Mander, S. Scenario analysis of CO2 emissions from China’s electric power industry. J. Clean. Prod. 2016, 142, 3101–3108. [Google Scholar] [CrossRef]
- Ma, X.; Wang, C.; Dong, B.; Gu, G.; Chen, R.; Li, Y.; Zou, H.; Zhang, W.; Lia, Q. Carbon emissions from energy consumption in China: Its measurement and driving factors. Sci. Total Environ. 2019, 648, 1411–1420. [Google Scholar] [CrossRef]
- Liu, Y.; Hao, Y. The dynamic links between CO2 emissions, energy consumption and economic development in the countries along “the Belt and Road”. Sci. Total Environ. 2018, 645, 674–683. [Google Scholar] [CrossRef] [PubMed]
- Young, R.O.; Guttman, D.; Qi, Y.; Bachus, K.; Belis, D.; Cheng, H.; Lin, A.; Schreifels, J.; Eynde, S.; Wang, Y. Institutionalized governance processes: Comparing environmental problem solving in China and the United States. Glob. Environ. Chang. 2015, 31, 163–173. [Google Scholar] [CrossRef]
- Yang, J.; Yong, H.; Qizhi, M.; Suping, C.; Dongquan, H. City-level Green House Gas Emission Inventory From A Spatial Planning Perspective (in Chinese with English abstract). City Plan. Rev. 2013, 37, 50–56. [Google Scholar]
- Dai, H.; Masui, T.; Matsuoka, Y.; Fujimori, S. Assessment of China’s climate commitment and non-fossil energy plan towards 2020 using hybrid AIM/CGE model. Energy Policy 2011, 39, 2875–2887. [Google Scholar] [CrossRef]
- Li, Y.; Su, B. The impacts of carbon pricing on coastal megacities: A CGE analysis of Singapore. J. Clean. Prod. 2017, 165, 1239–1248. [Google Scholar] [CrossRef]
- Zhao, Y.; Li, H.; Xiao, Y.; Liu, Y.; Cao, Y.; Zhang, Z.; Wang, S.; Zhang, Y.; Ahmad, A. Scenario analysis of the carbon pricing policy in China’s power sector through 2050: Based on an improved CGE model. Ecol. Indic. 2018, 85, 352–366. [Google Scholar] [CrossRef]
- Van der Zwaana, B.; Kober, T.; Dalla Longa, F.; van der Laan, A.; Jan Kramer, G. An integrated assessment of pathways for low-carbon development in Africa. Energy Policy 2018, 117, 387–395. [Google Scholar] [CrossRef]
- Davis, M.; Ahiduzzaman, M.; Kumar, A. How will Canada’s greenhouse gas emissions change by 2050? A disaggregated analysis of past and future greenhouse gas emissions using bottom-up energy modelling and Sankey diagrams. App. Energy 2018, 220, 754–786. [Google Scholar] [CrossRef]
- Tao, Z.; Zhao, L.; Changxin, Z. Research on the prospects of low-carbon economic development in China based on LEAP model. Energy Procedia 2011, 5, 695–699. [Google Scholar] [CrossRef]
- Li, P. Energy storage is the core of renewable technologies. IEEE Nanotechnol. Mag. 2009, 2, 13–18. [Google Scholar] [CrossRef]
- Liu, M.; Wei, J.; Wang, G.; Wang, F. Water resources stress assessment and risk early warning–a case of Hebei Province China. Ecol. Indic. 2017, 73, 358–368. [Google Scholar] [CrossRef]
- Liu, Z. China’s Carbon Emissions Report 2016. Available online: https://www.belfercenter.org/publication/chinas-carbon-emissions-report-2016 (accessed on 10 September 2018).
- Chai, Q.M.; Xu, H.-Q. Modeling an emissions peak in China around 2030: Synergies or trade-offs between economy, energy and climate security. Adv. Clim. Chang. Res. 2014, 5, 169–180. [Google Scholar] [CrossRef]
- Wu, Y.; Zhao, Y. Beijing-Tianjin-Hebei Energy Consumption, Carbon Emissions and Economic Growth (in Chinese with English Abstract). Available online: http://jjgl.cbpt.cnki.net/WKB2/WebPublication/wkTextContent.aspx?colType=4&yt=2014&st=02 (accessed on 12 September 2018).
- Zhang, G.; Wang, S.; Liu, S.; Jia, S. Study on Co-ordination between Beijing-Tianjin-Hebei Based on Industry Matching and Transfer (in Chinese with English Abstract). Available online: http://jjgl.cbpt.cnki.net/WKB2/WebPublication/wkTextContent.aspx?colType=4&yt=2014&st=02 (accessed on 12 September 2018).
- Li, W.; An, C.; Lu, C. The assessment framework of provincial carbon emission driving factors: An empirical analysis of Hebei Province. Sci. Total Environ. 2018, 637–638, 91–103. [Google Scholar] [CrossRef] [PubMed]
- Sun, W.; Wang, C.; Zhang, C. Factor analysis and forecasting of CO2 emissions in Hebei, using extreme learning machine based on particle swarm optimization. J. Clean. Prod. 2017, 162, 1095–1101. [Google Scholar] [CrossRef]
- Ou, X.; Yuan, Z.; Peng, T.; Sun, Z.; Zhou, S. The Low-Carbon Transition toward Sustainability of Regional Coal-Dominated Energy Consumption Structure: A Case of Hebei Province in China. Sustainability. 2017, 9, 1184. [Google Scholar] [CrossRef]
- Heaps, C.G. Long-range Energy Alternatives Planning (LEAP) system [Software version: 2018.1.20], Stockholm Environment Institute. Available online: https://www.energycommunity.org (accessed on 30 February 2018).
- Bianco, V.; Righi, D.; Scarpa, F.; Tagliafico, L.A. Modeling energy consumption and efficiency measures in the Italian hotel sector. Energy and Build. 2017, 149, 329–338. [Google Scholar] [CrossRef]
- Emodi, N.V.; Emodi, C.C.; Murthy, G.P.; Emodi, A.S.A. Energy policy for low carbon development in Nigeria: A LEAP model application. Renew. Sustain. Energy Rev. 2017, 68, 247–261. [Google Scholar] [CrossRef]
- Yang, D.; Liu, B.; Ma, W.; Guo, Q.; Li, F.; Yang, D. Sectoral energy-carbon nexus and low-carbon policy alternatives: A case study of Ningbo, China. J. Clean. Prod. 2017, 156, 480–490. [Google Scholar] [CrossRef]
- Zhai, C.; Pang, R. Research on the Path of Hebei Industrial Structure Transformation and Upgrading From the Perspective of the Integration of Beijing, Tianjin and Hebei (in Chinese with English Abstract). J. Baoding Univ. 2017, 30, 49–57. [Google Scholar]
- Sun, N.; Yang, N.; Wang, J. An Empirical Study on Industrial Structure and Economic Growth in Hebei Province—Based on SSM Model and VAR Model. Statistics and Management (in Chinese with English abstract). Stat. Manag. 2017, 6, 43–48. [Google Scholar]
- IPCC. 2006 IPCC guidelines for National Greenhouse Gas Inventories. Available online: https://www.ipcc-nggip.iges.or.jp/public/2006gl/ (accessed on 20 July 2018).
- Wen, J.; Li, M.; Liu, Y. The Influence of the 2022 Zhangjiakou Olympic Winter Games on Hebei’s Economy and Society (in Chinese). Extensive Collect. Party Hist. 2016, 6, 45–46. [Google Scholar]
- Wei, L. Effect of “Two-child Policy” on Population Scale and Demographic Structure of Beijing-Tianjin-Hebei Region Based on Coordinated Development of Beijing-Tianjin-Hebei Region (in Chinese with English Abstract). Hum. Resour. Dev. China 2018, 35, 122–133. [Google Scholar]
- Tan, L. China to Create Xiongan New Area in Hebei (in Chinese). Available online: http://www.gov.cn/xinwen/2017-04/01/content_5182824.htm (accessed on 6 August 2018).
- Department of Housing and Urban-rural Development of Hebei. Urban System Planning of Hebei Province (2016-2030). Shijiazhuang, 2017. Available online: http://www.hebjs.gov.cn/zhengcewenjian/tingfawenjian/201703/t20170307_226738.html (accessed on 20 October 2018).
- National Statistics Bureau. China Energy Statistics Yearbook: Appendix IV. Available online: http://www.stats.gov.cn/tjsj/ndsj/ (accessed on 8 July 2018).
- National Development and Reform Commission. Guidelines for Provincial Greenhouse Gas Inventories in China. Available online: http://www.tanpaifang.com/tanpancha/2017/0807/60227.html (accessed on 23 June 2018).
- Institute of Tsinghua University at Hebei (ITUH). Coordinated Development of Beijing, Tianjin and Hebei: Economic Development, Energy Consumption and Pollution Emission in Hebei Province. Available online: http://www.tsinghua-hb.com/ (accessed on 18 January 2019). (In Chinese).
- Saidi, K.; Hammami, S. The impact of CO2 emissions and economic growth on energy consumption in 58 countries. Energy Reports 2015, 1, 62–70. [Google Scholar] [CrossRef]
- Yavuz, N. CO2 Emission, Energy Consumption, and Economic Growth for Turkey: Evidence from a Cointegration Test With a Structural Break. Energy Sources Part B Econ. Plan. Policy 2014, 9, 229–235. [Google Scholar] [CrossRef]
© 2019 by the authors. Licensee MDPI, Basel, Switzerland. This article is an open access article distributed under the terms and conditions of the Creative Commons Attribution (CC BY) license (http://creativecommons.org/licenses/by/4.0/).