Low-Cost Monitoring of Synchrophasors Using Frequency Modulation


Abstract
1. Introduction
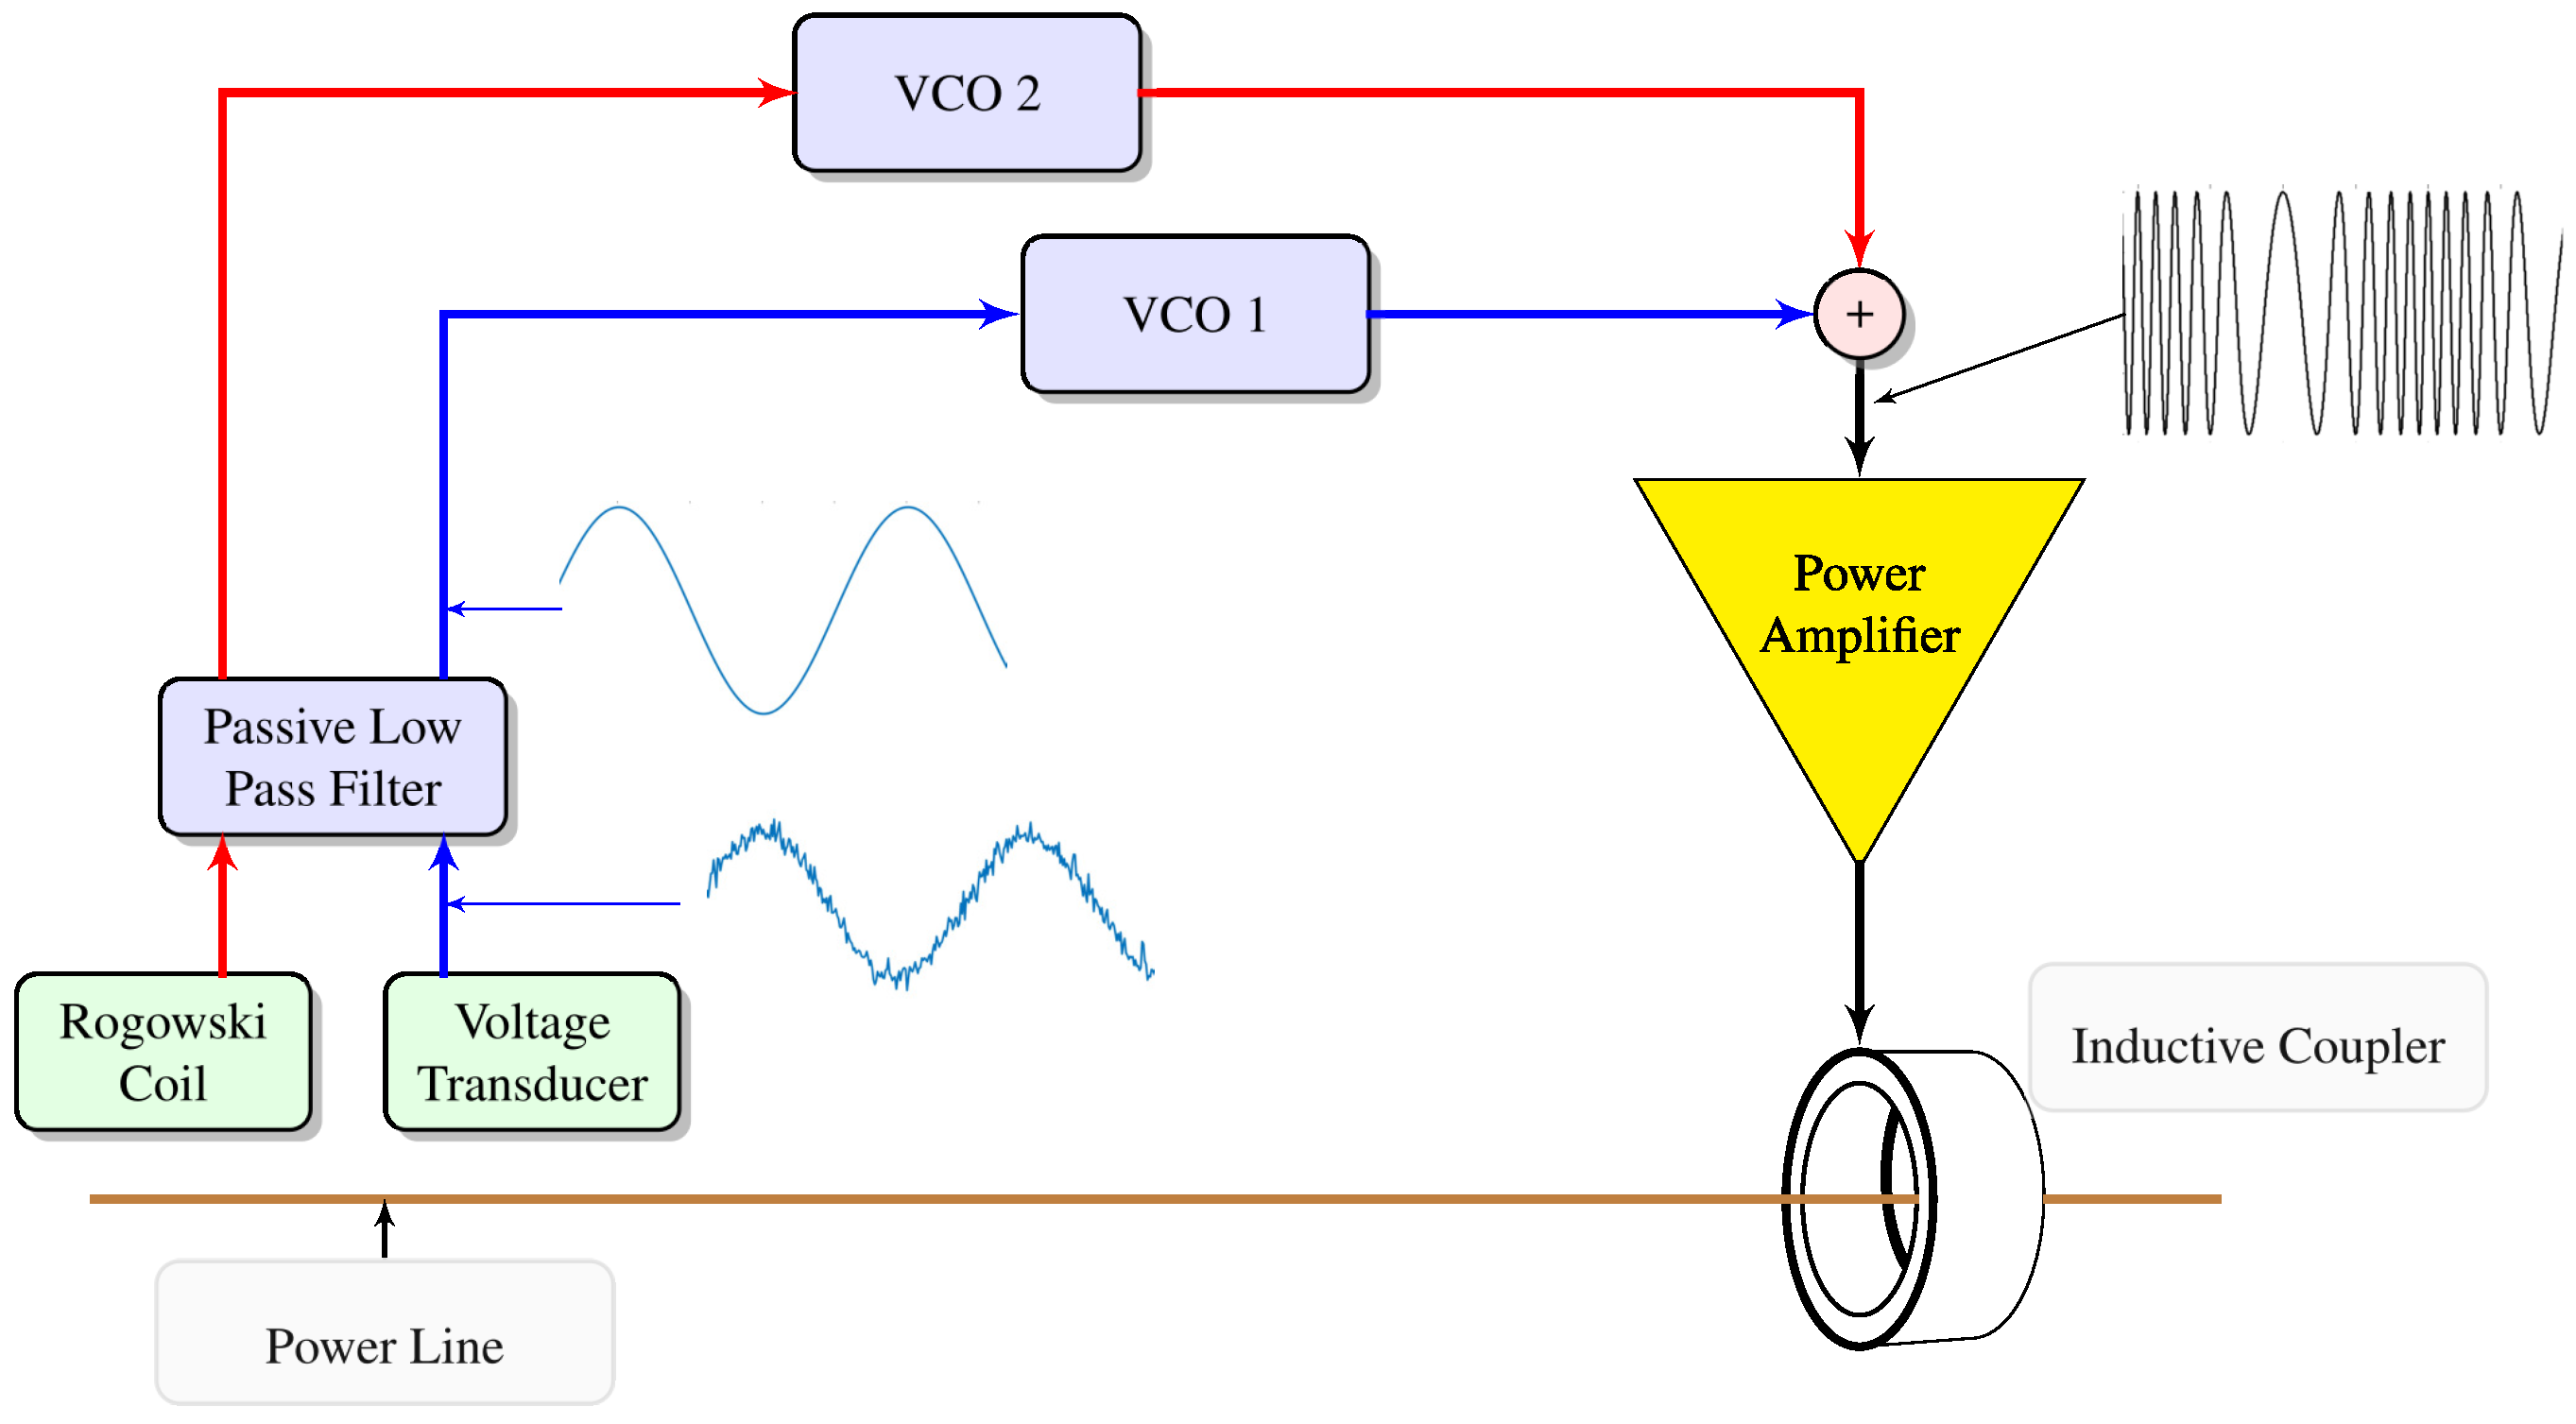
2. Overview of the Proposed Method
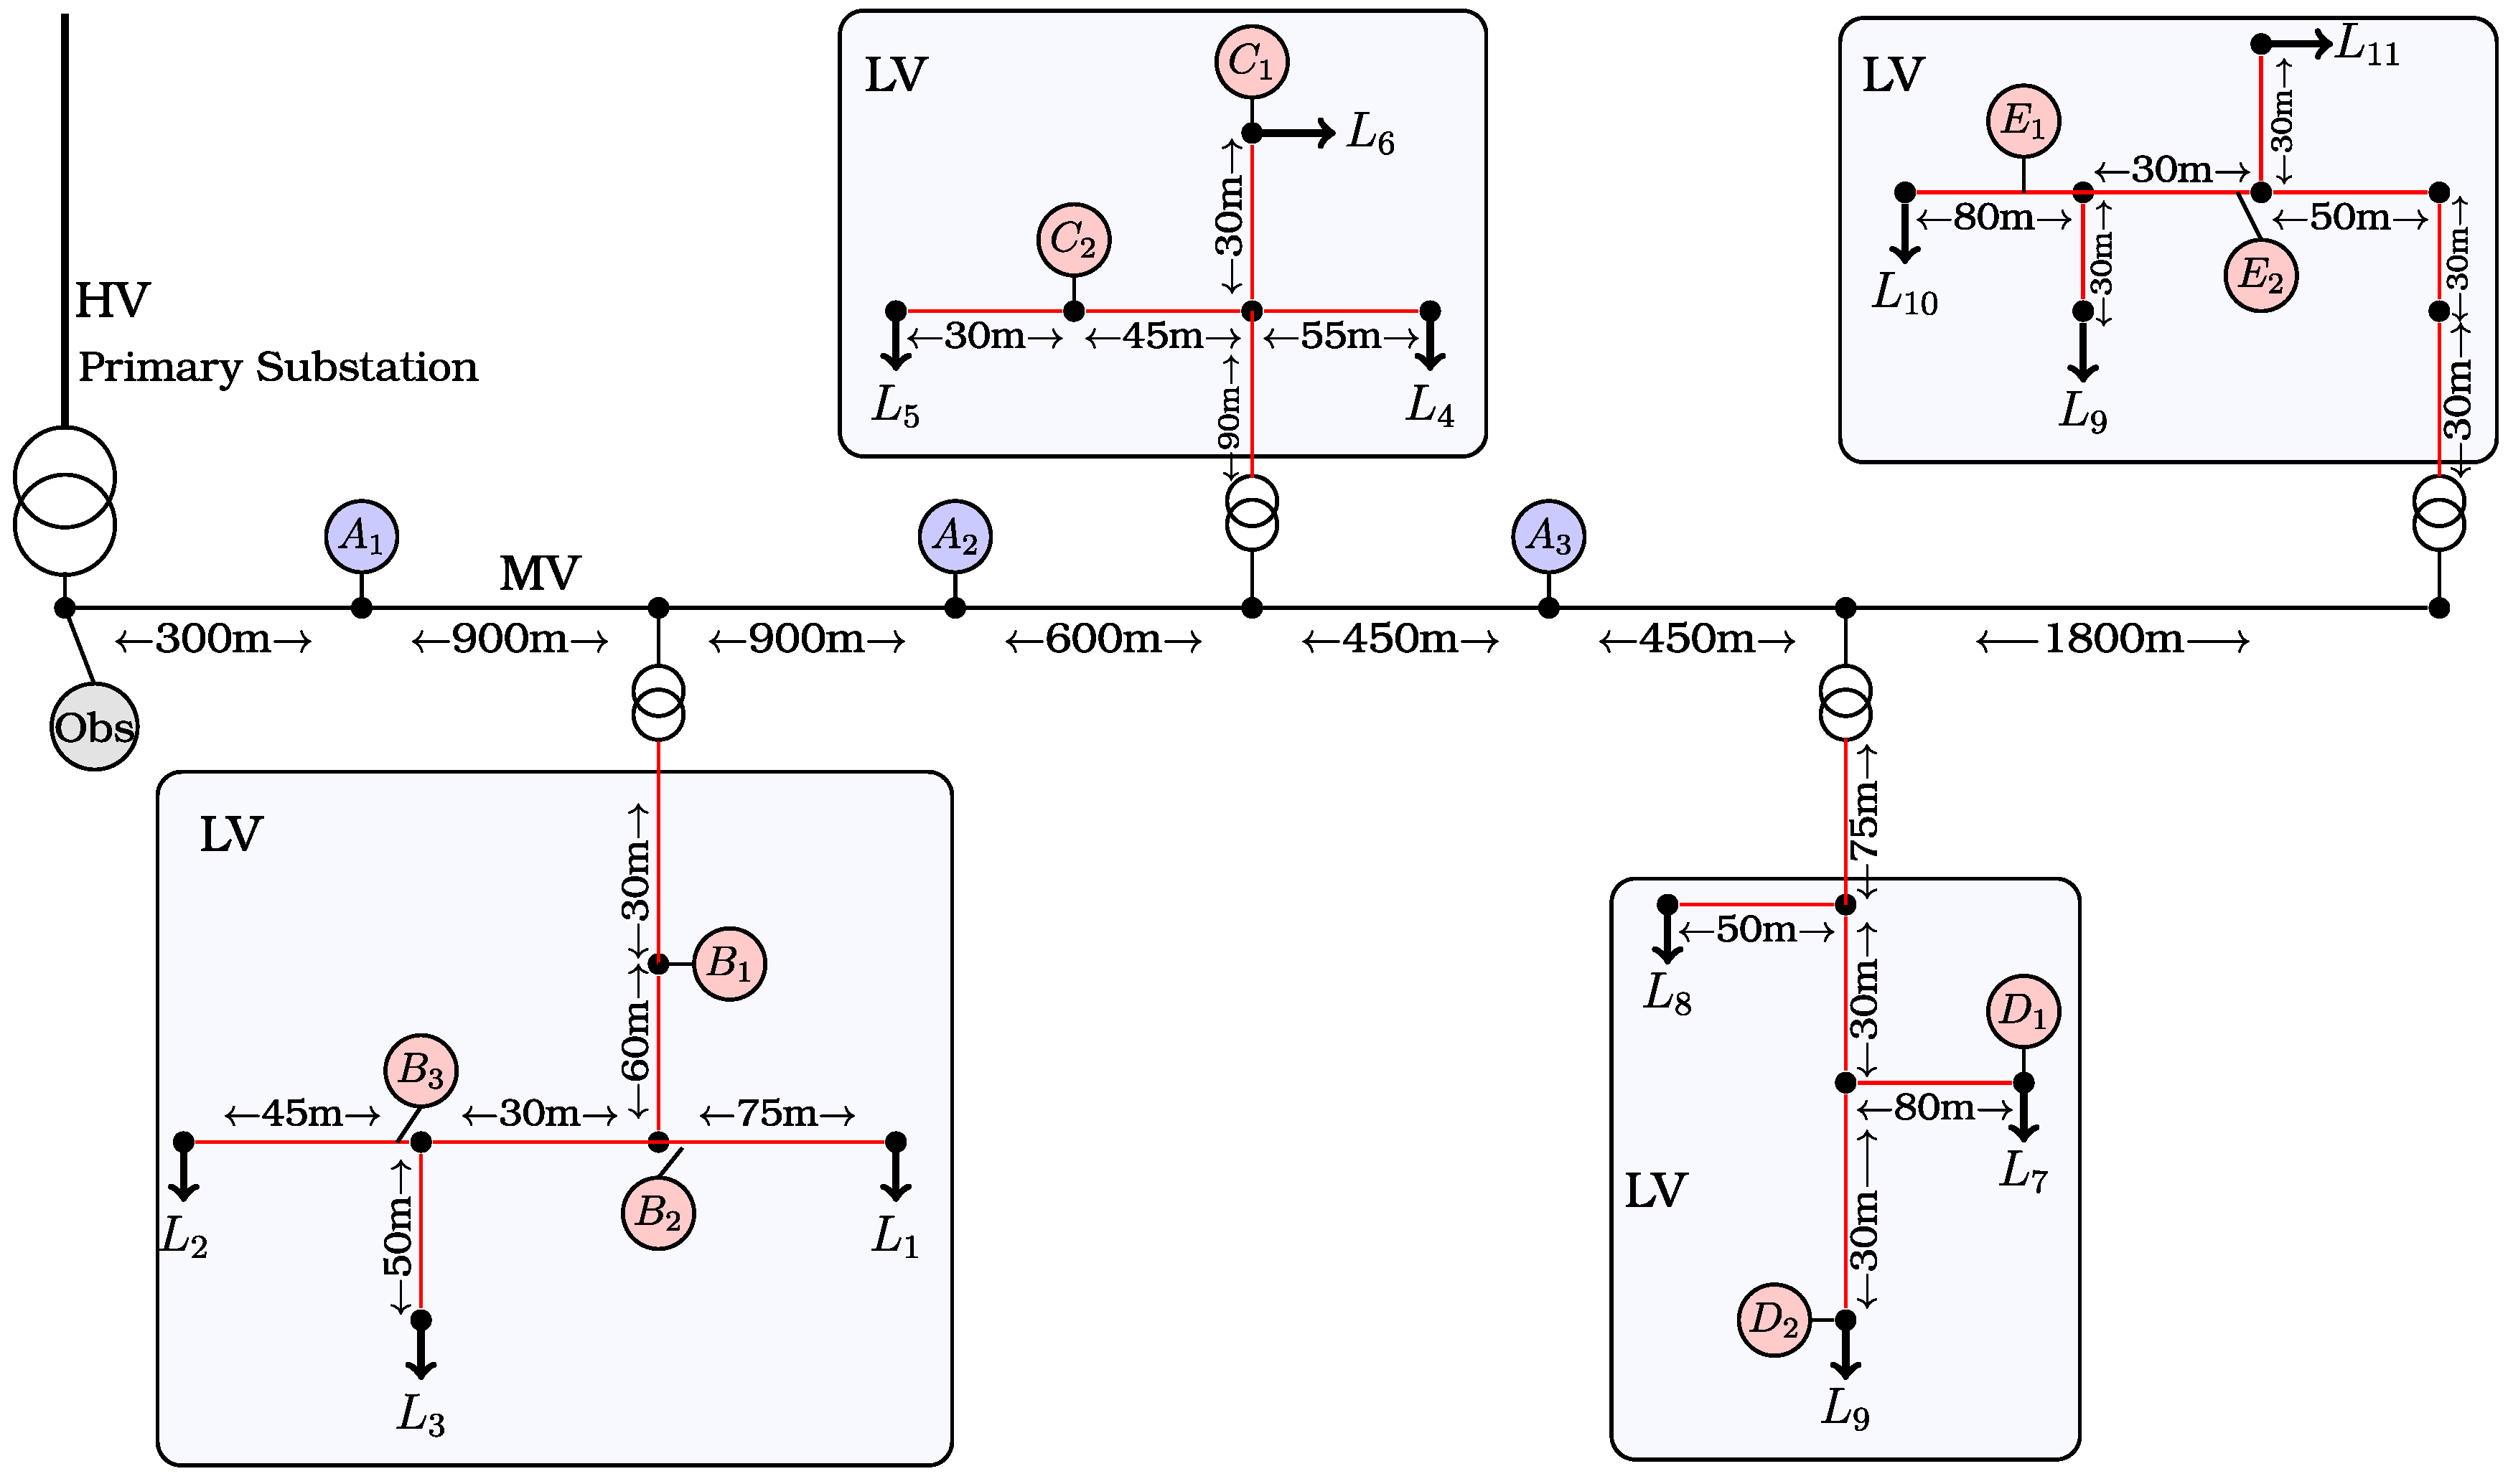
3. Development of Simulation Scheme to Test Performance on a Typical MV/LV Feeder
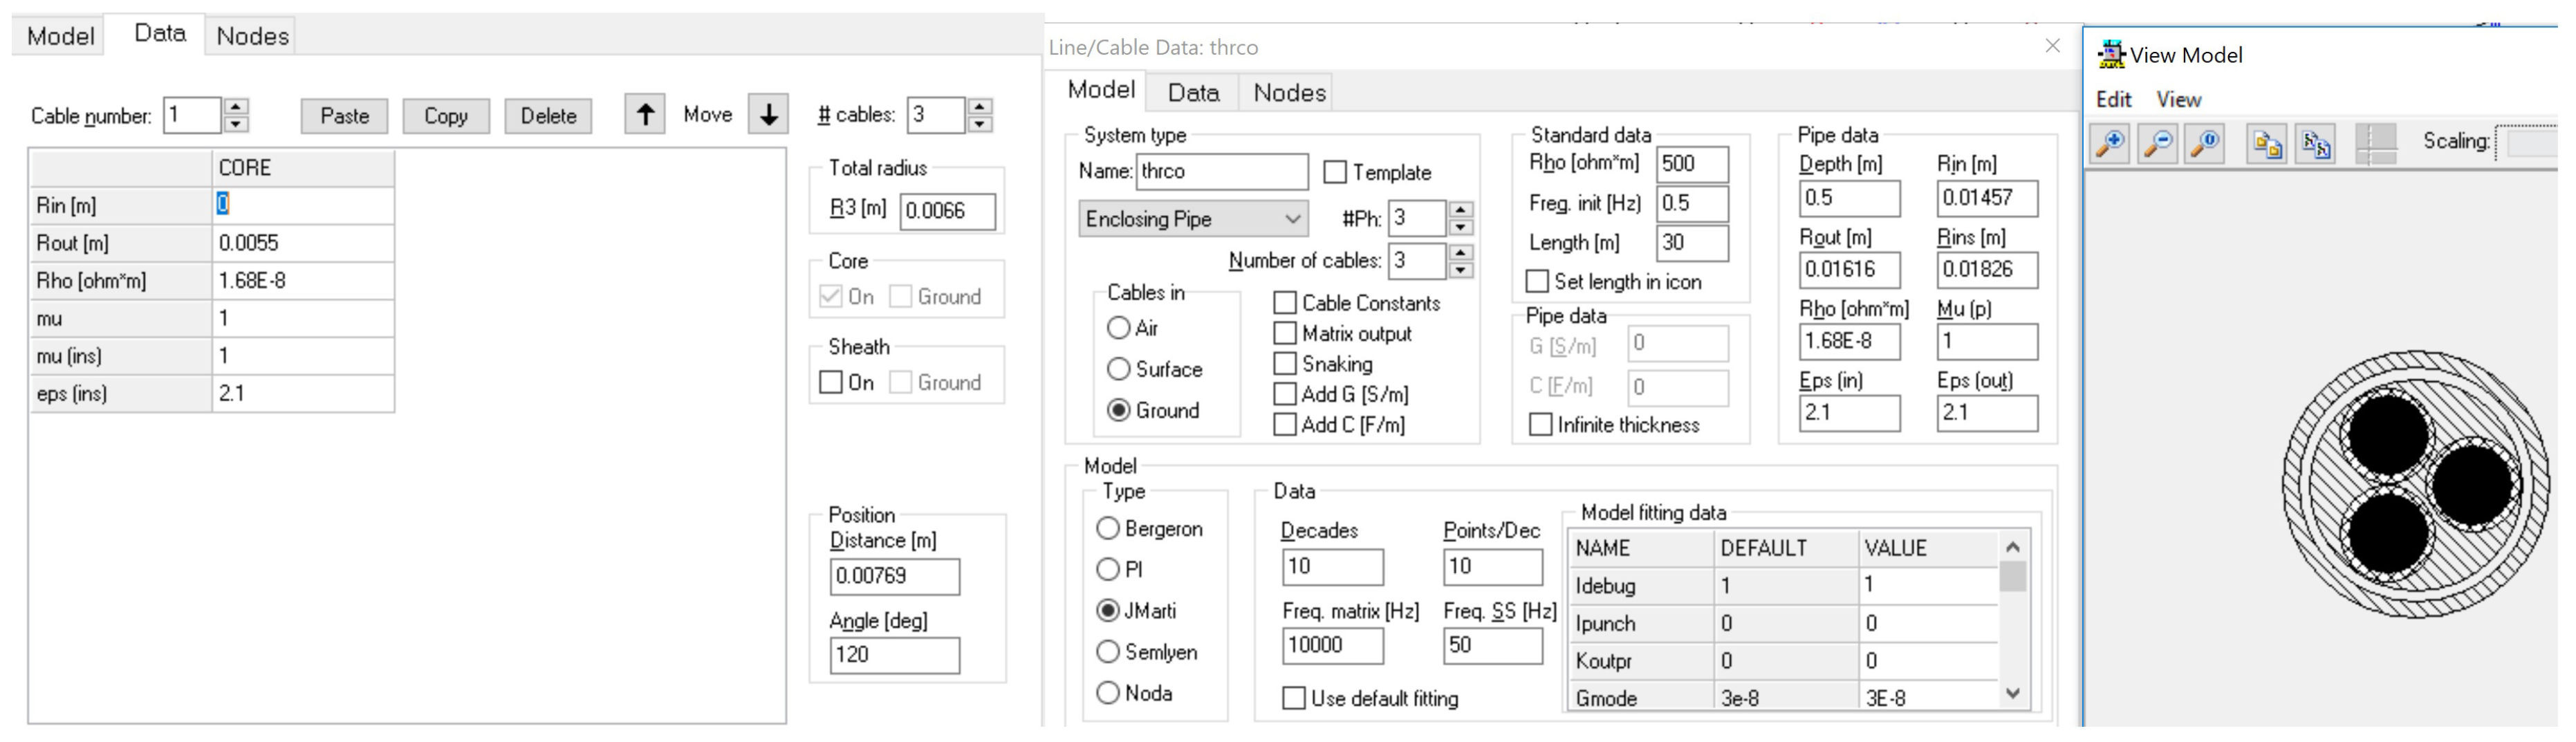
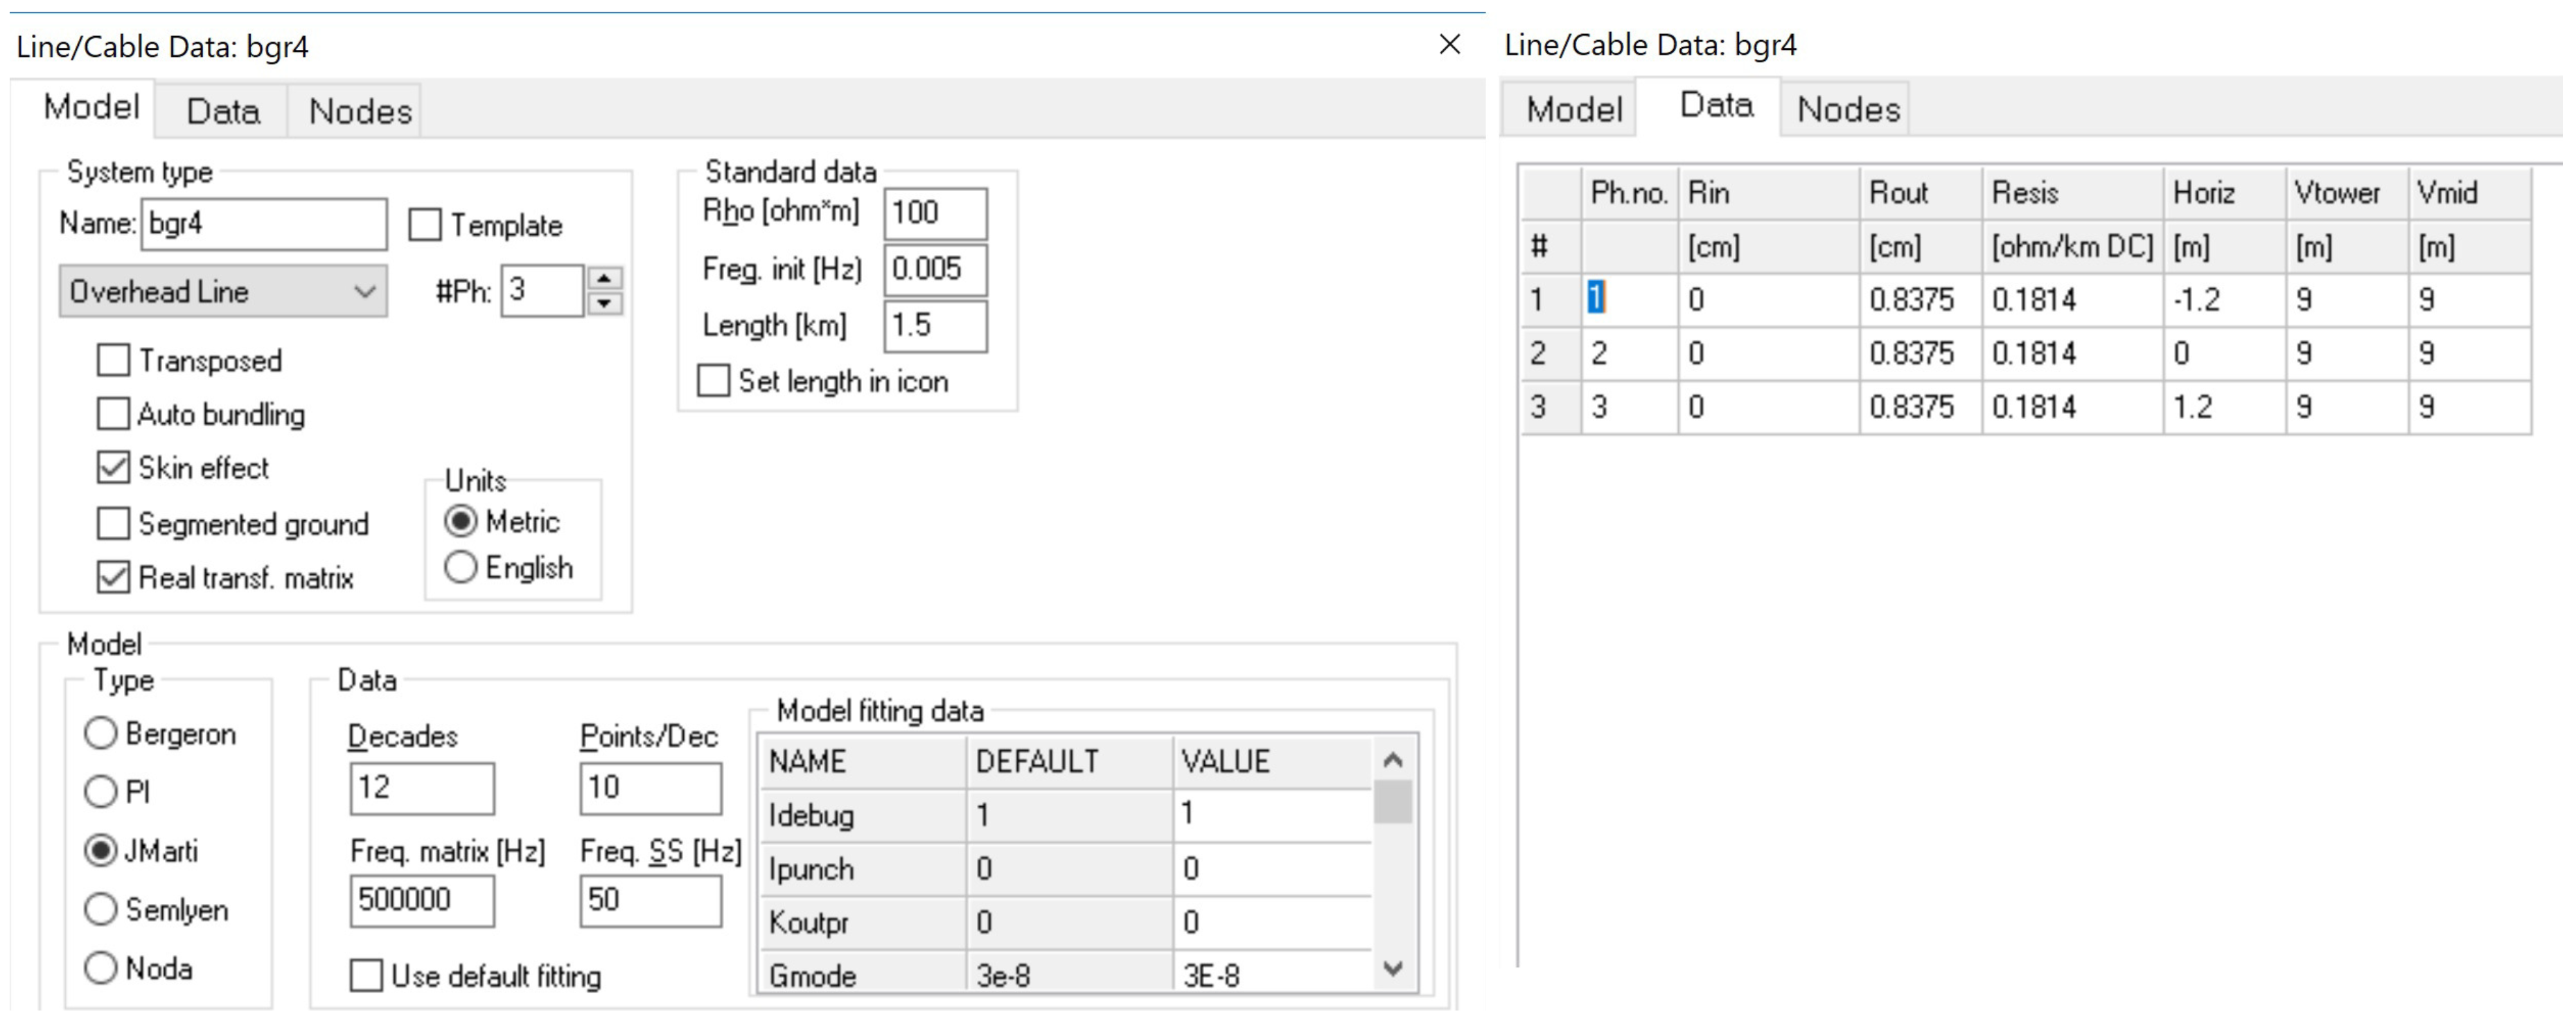
3.1. EMTP-ATP Models
3.2. Implementation of the Receiver in Matlab
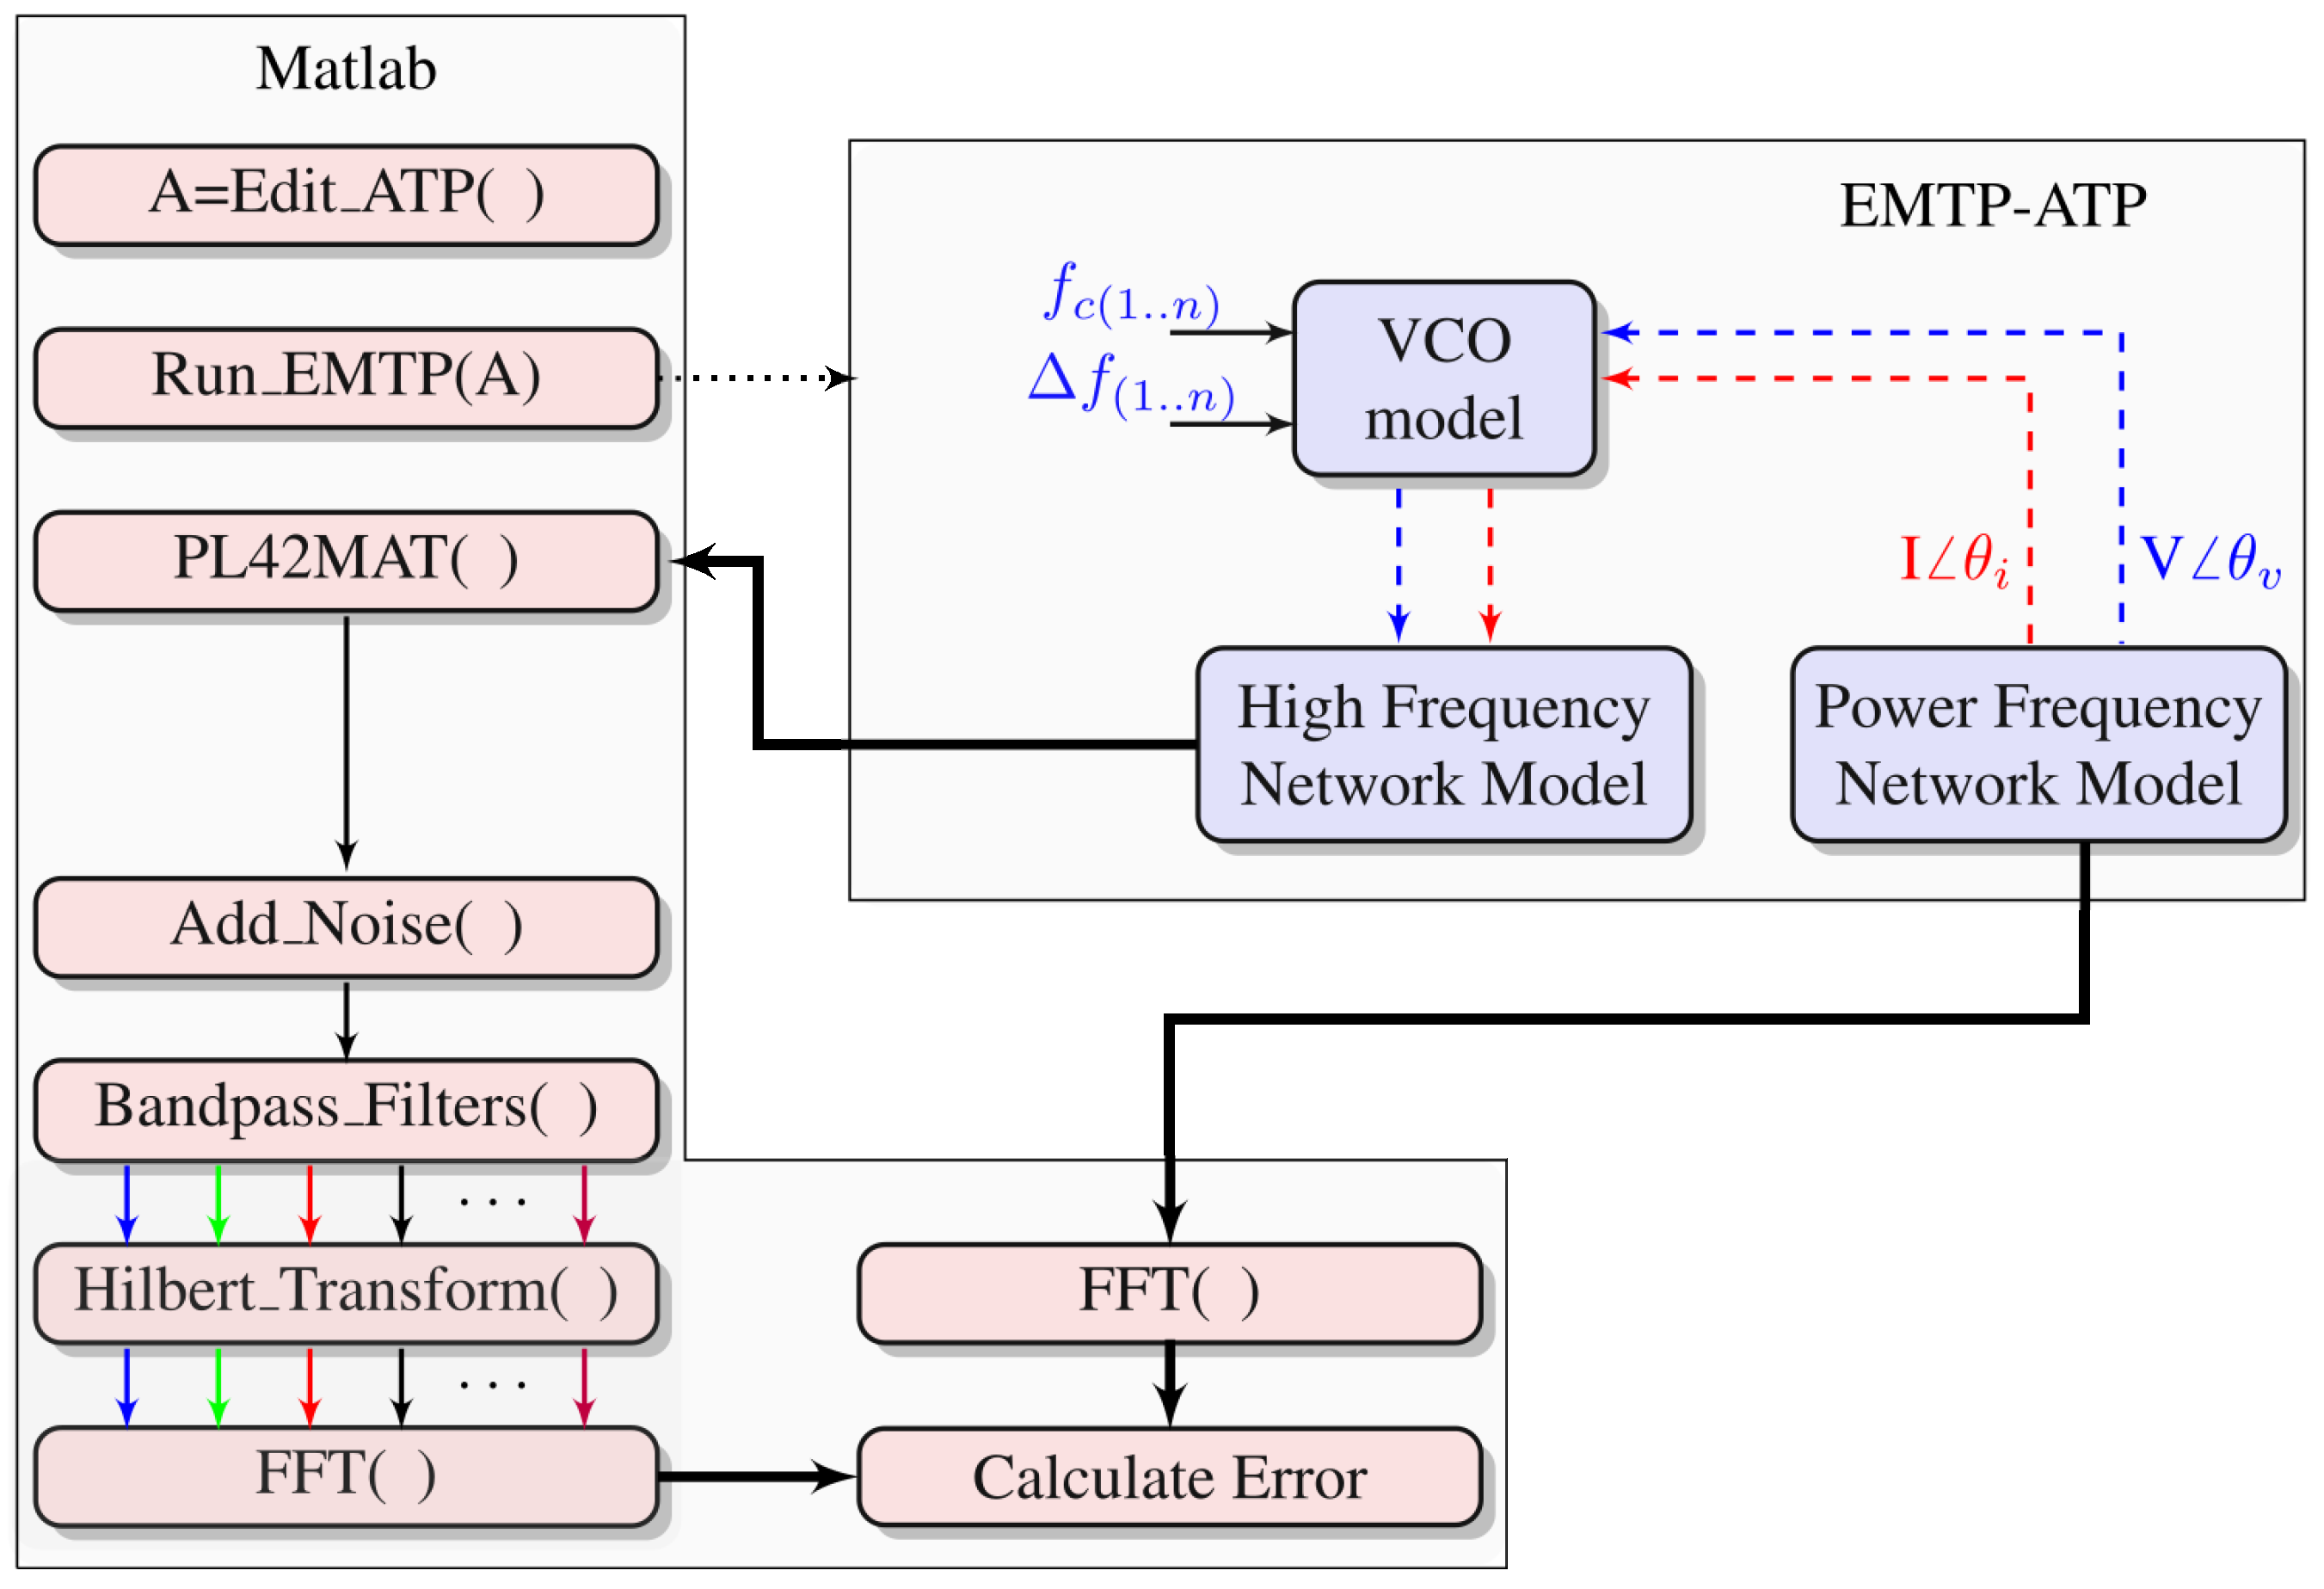
- Edit_ATP(): To automate and expedite the process of re-configuring the network between successive runs (i.e., to change the load conditions, Transmitter bandwidths, etc.), the ATP file, which contains a description of the circuit according to the EMTP rule book, is automatically re-written from within Matlab. In the code below, the edit function accepts two vectors; and f. is the vector of scaling factors (one for each VCO transmitter in the EMTP network). f is the vector of centre frequencies for each VCO transmitter. A DOS command run within Matlab is used to copy a fresh version of the .atp file for each run of the simulation. This is followed by the edit function, which contains code to edit the atp file by printing the and f values at the appropriate position.

- Run_EMTP(): The EMTP-ATP is run using dos command from within Matlab.

- PL42MAT(): The EMTP-ATP simulation results are by default in PL4 format. PL42MAT() converts the PL4 data format to the .MAT data format for subsequent processing in the Matlab environment.

- Add_Noise(): This is an optional function which adds a specified amount of AWGN noise to the received signal, enabling Monte Carlo type studies.
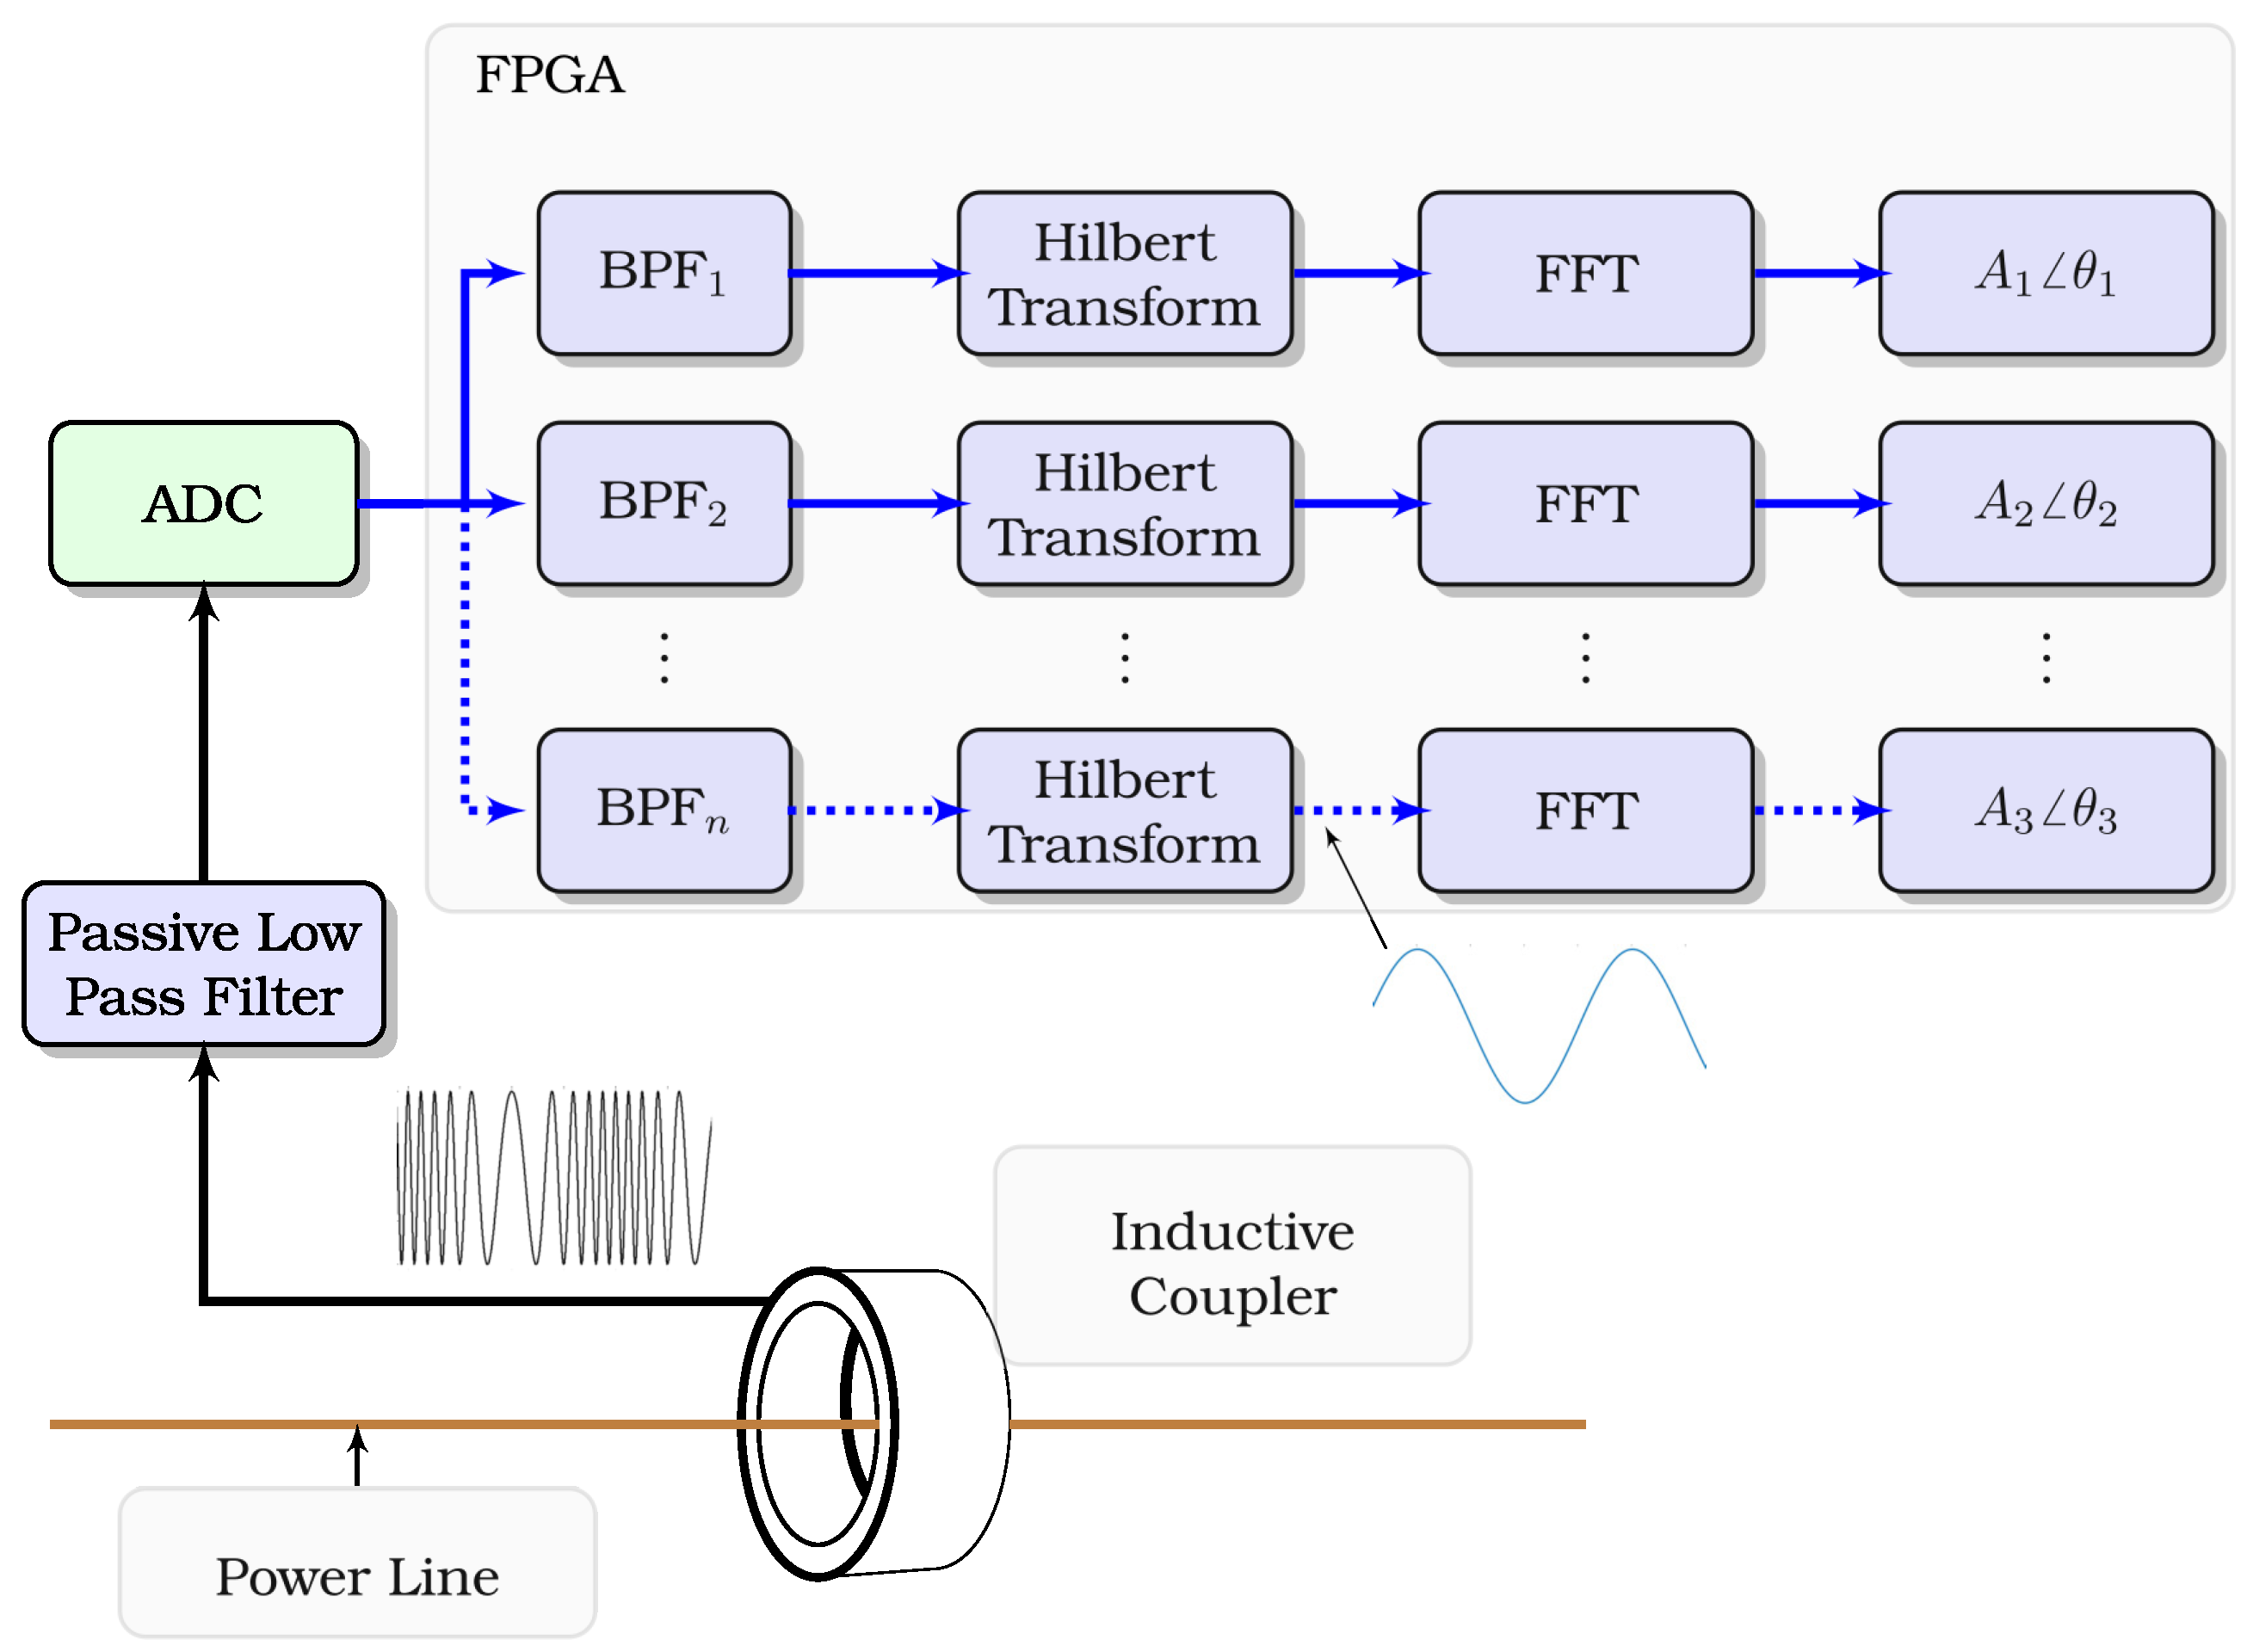
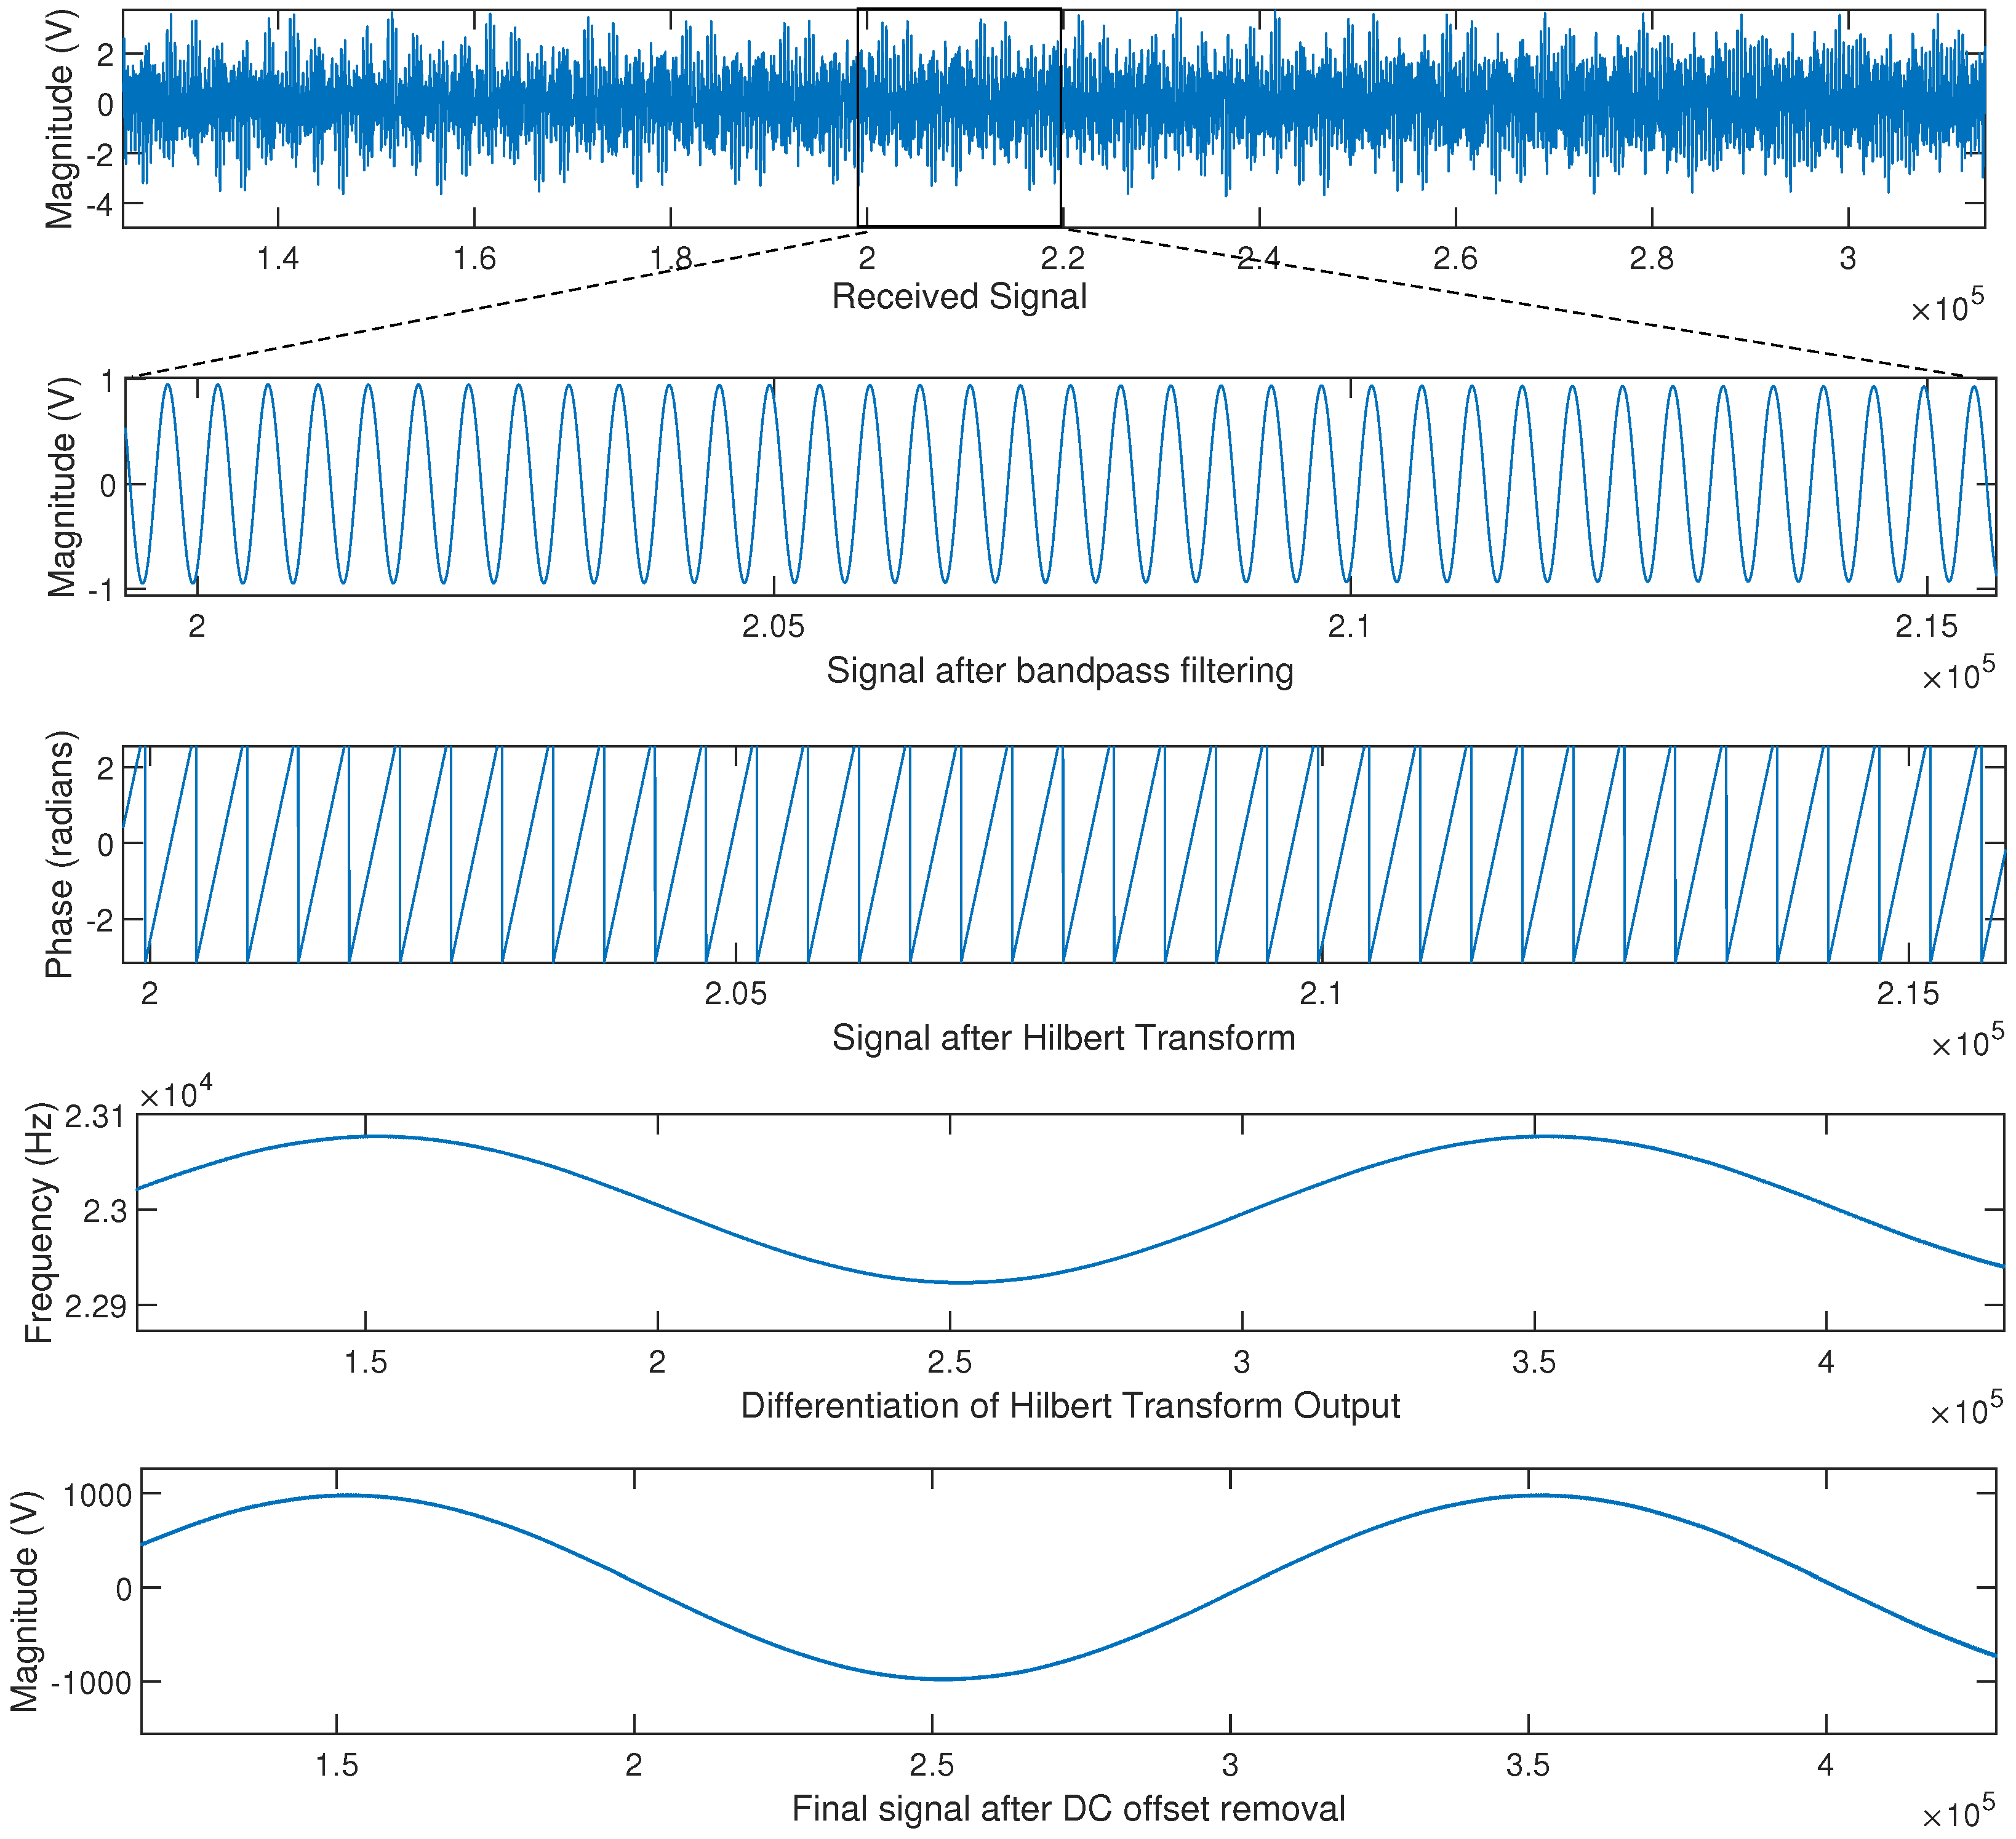
- Bandpass_Filters(): A bank of configurable bandpass filters were used to split the incoming signal by frequency to isolate the signal sent by each of the n transmitters.

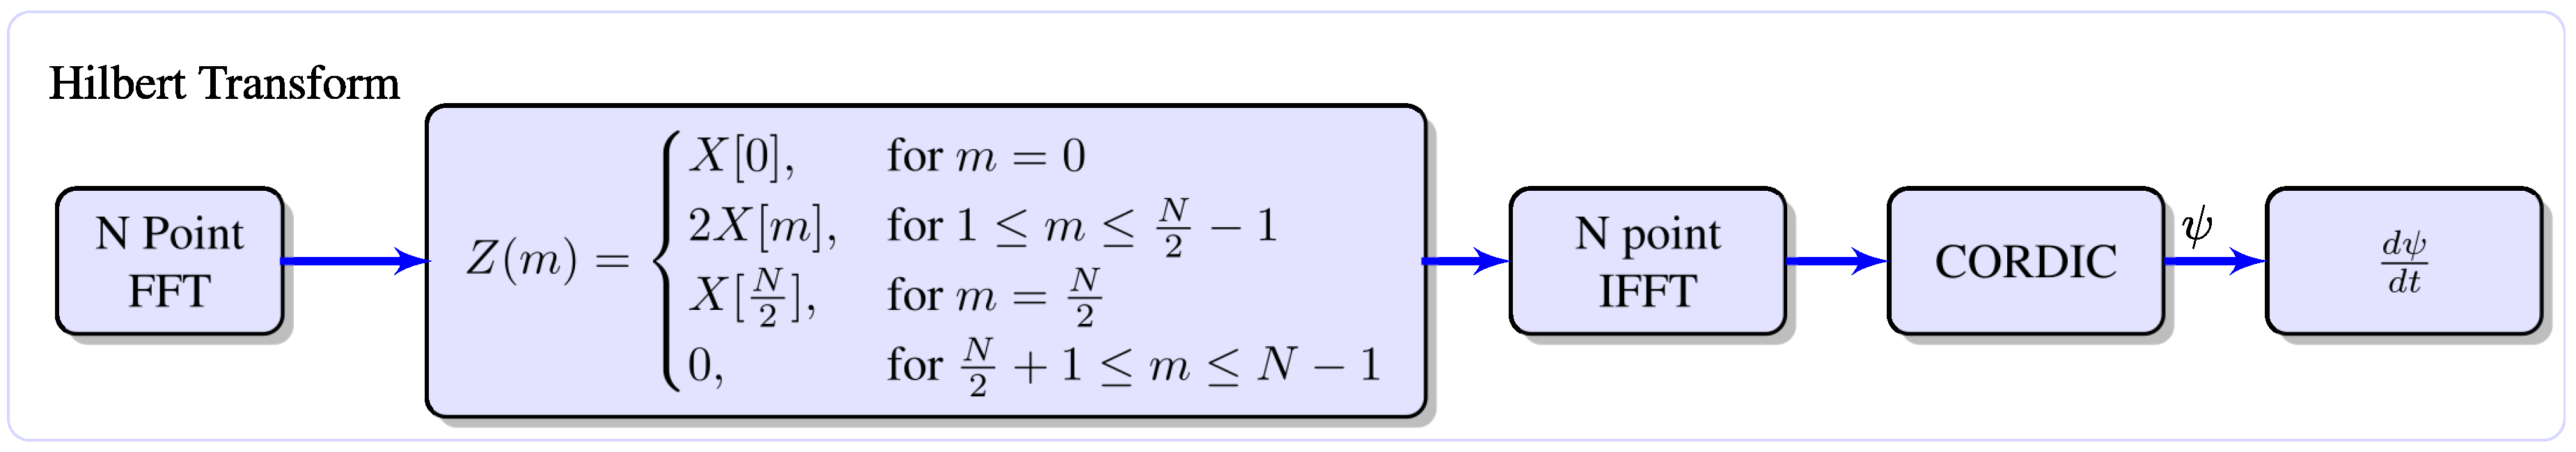
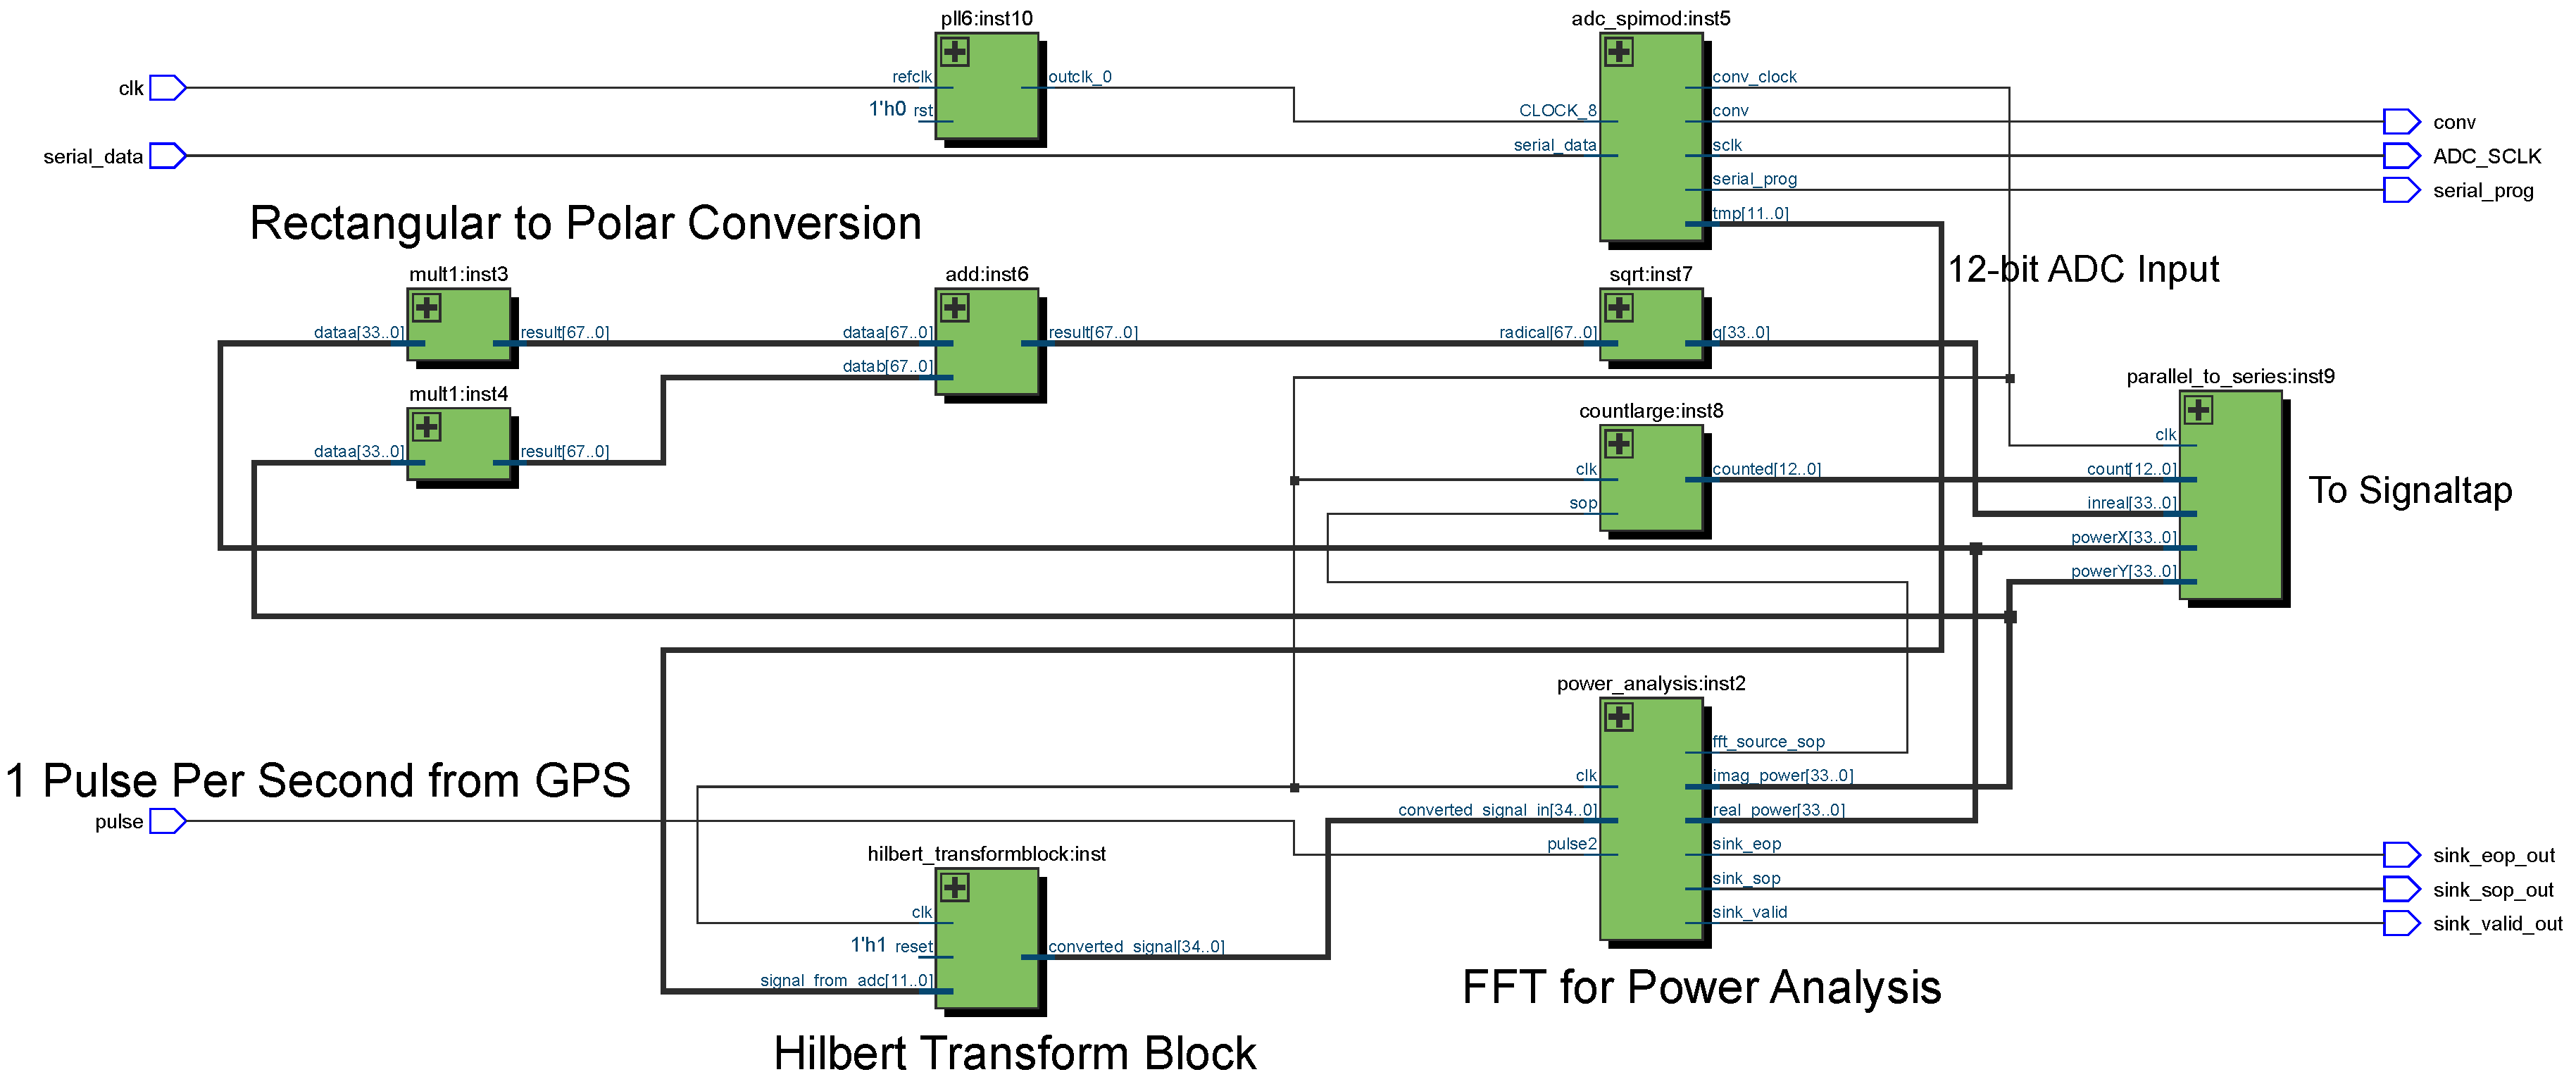
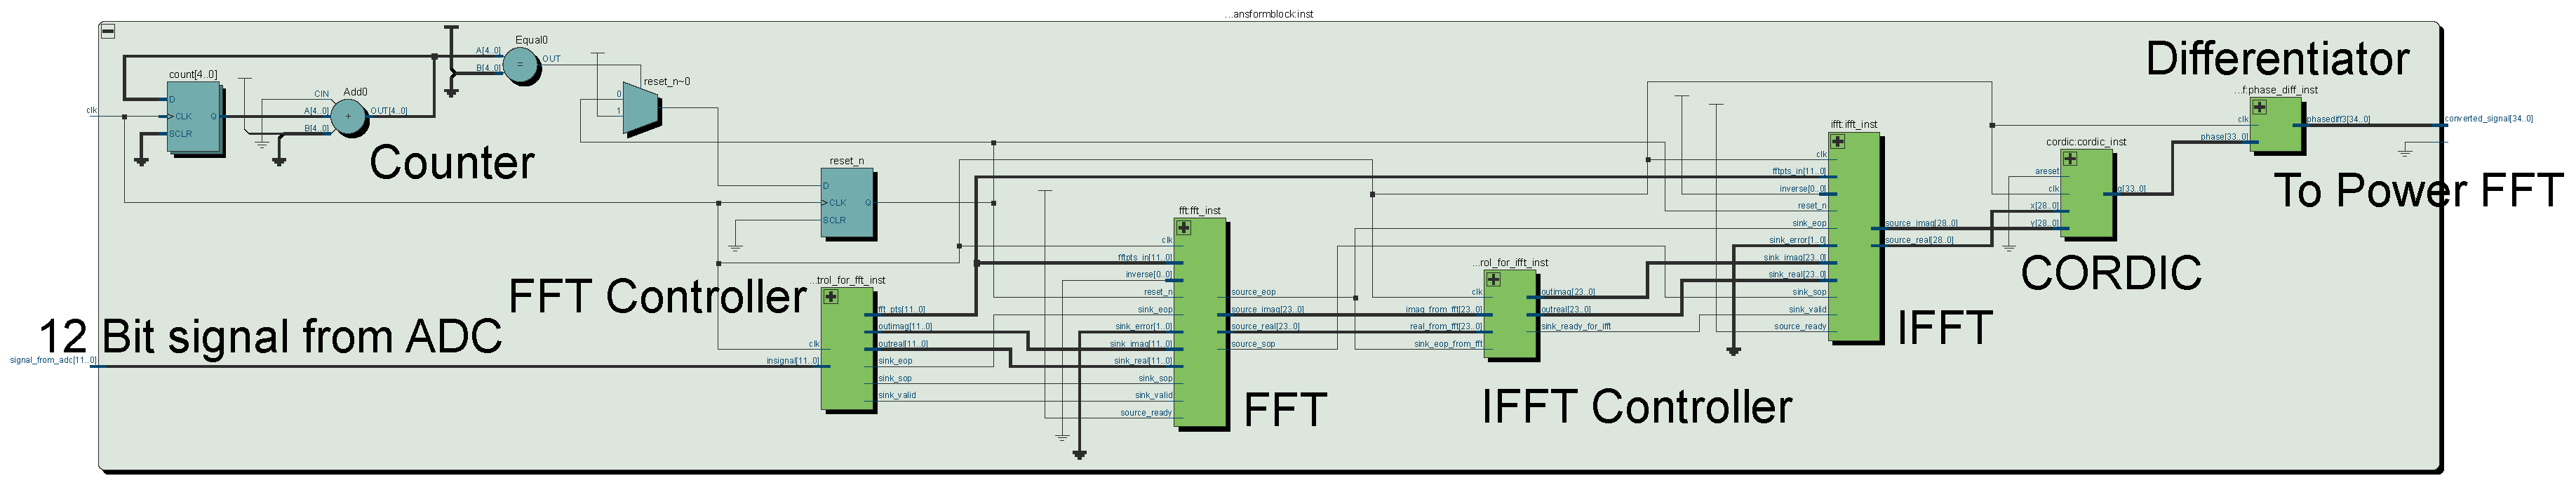
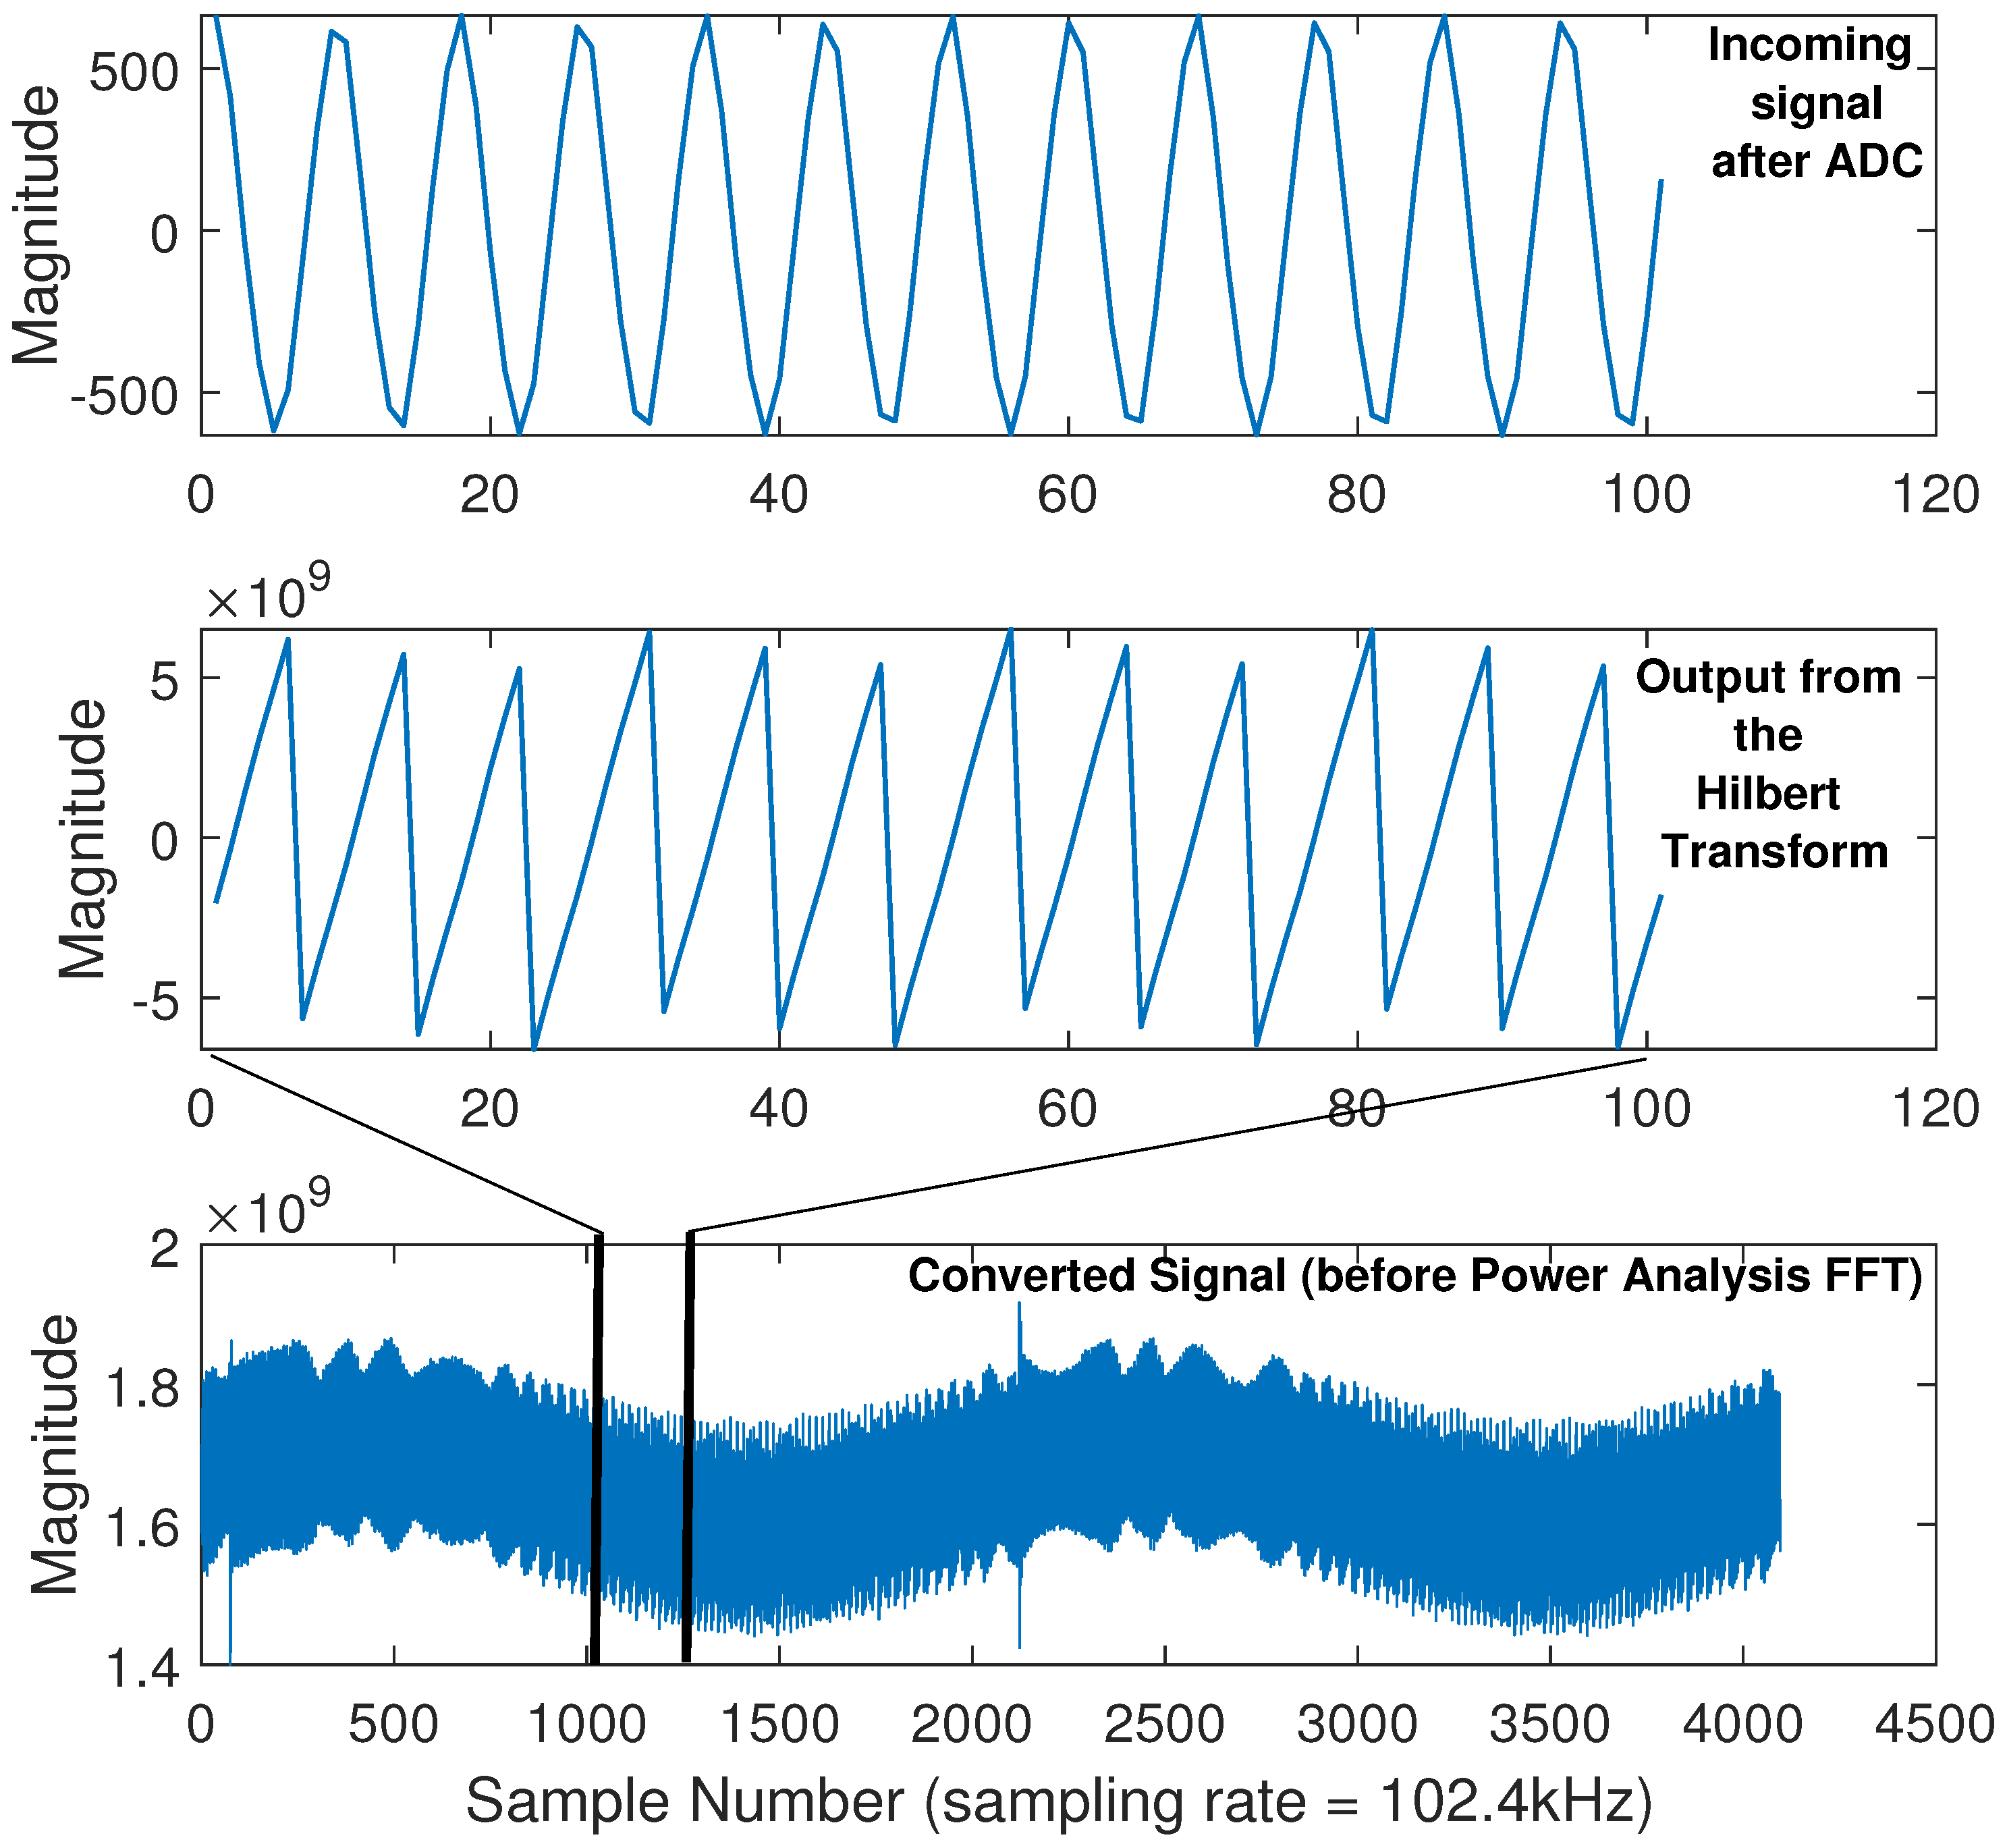
- Hilbert_Transform(): Matlab’s native Hilbert Transform function is performed on each of the n incoming signals following separation by frequency. The subsequent waveform is a replica of the original power frequency signal centred around . Subtracting brings the signal back down to a centre frequency of DC.

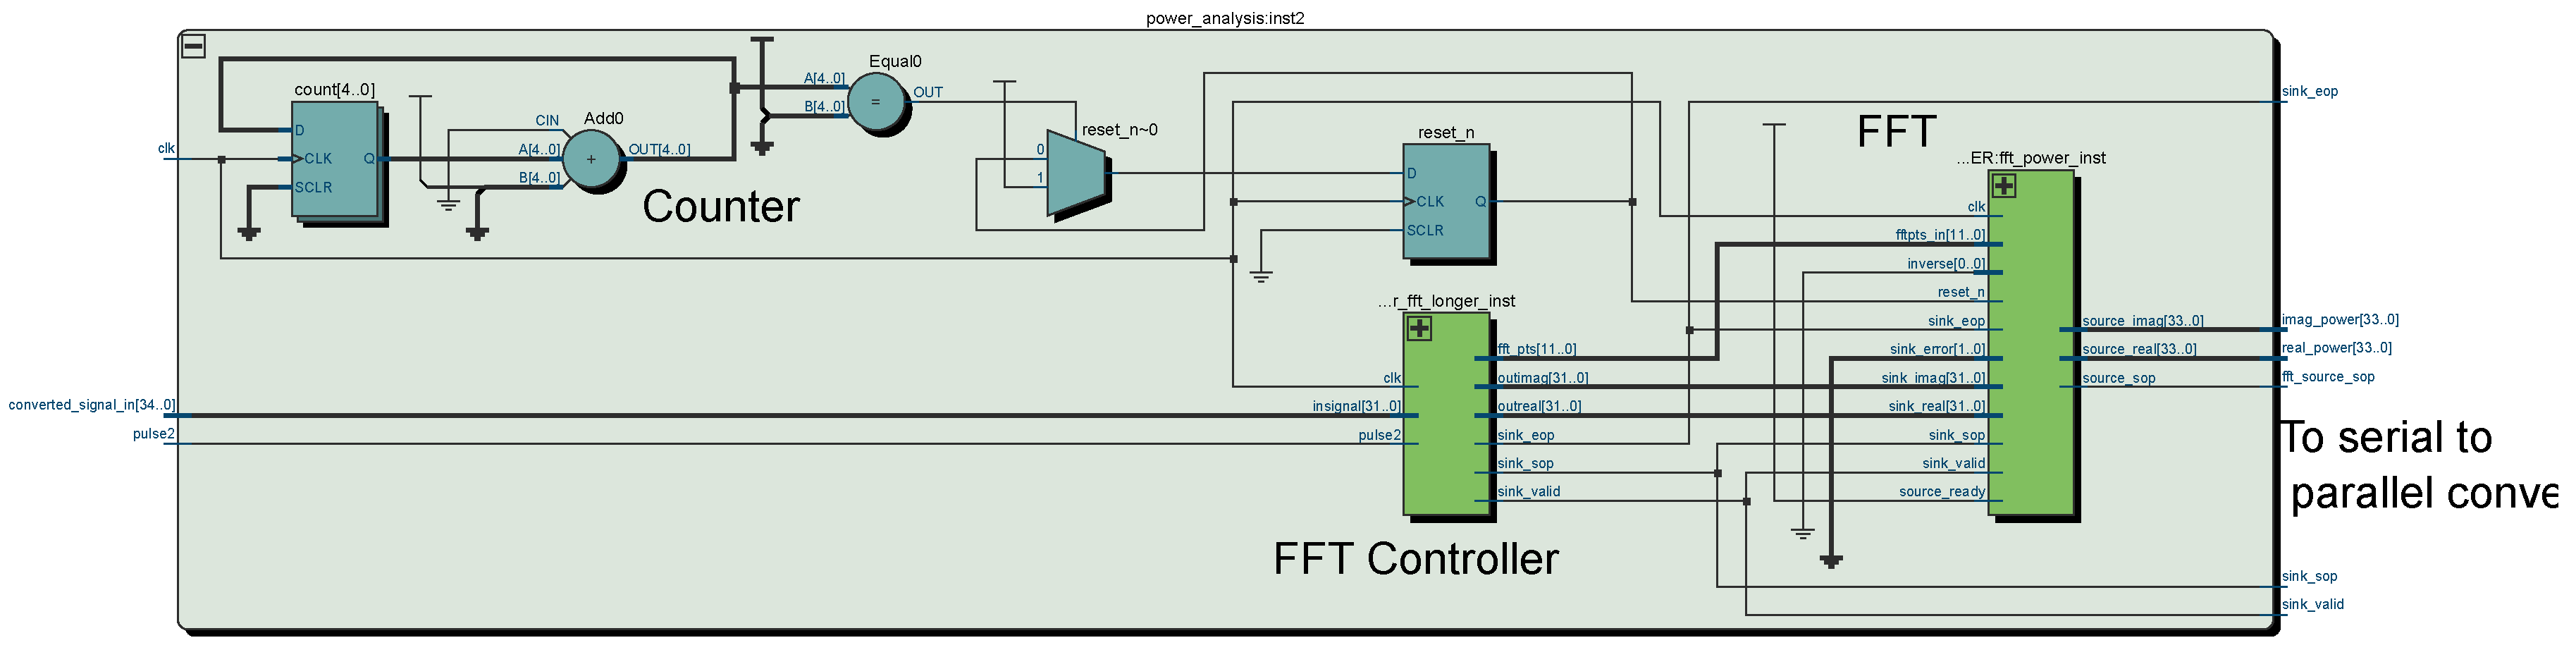
- FFT(): Following the Hilbert Transform, each of the n signals should resemble the original power frequency signal at the transmitter. A final FFT is performed on each of the n incoming signals to conveniently calculate the amplitude and phase of the power frequency and, optionally, the harmonics.
- Calculate_Error(): An error function is used to compare the receive values with the actual values.

4. Simulation Results
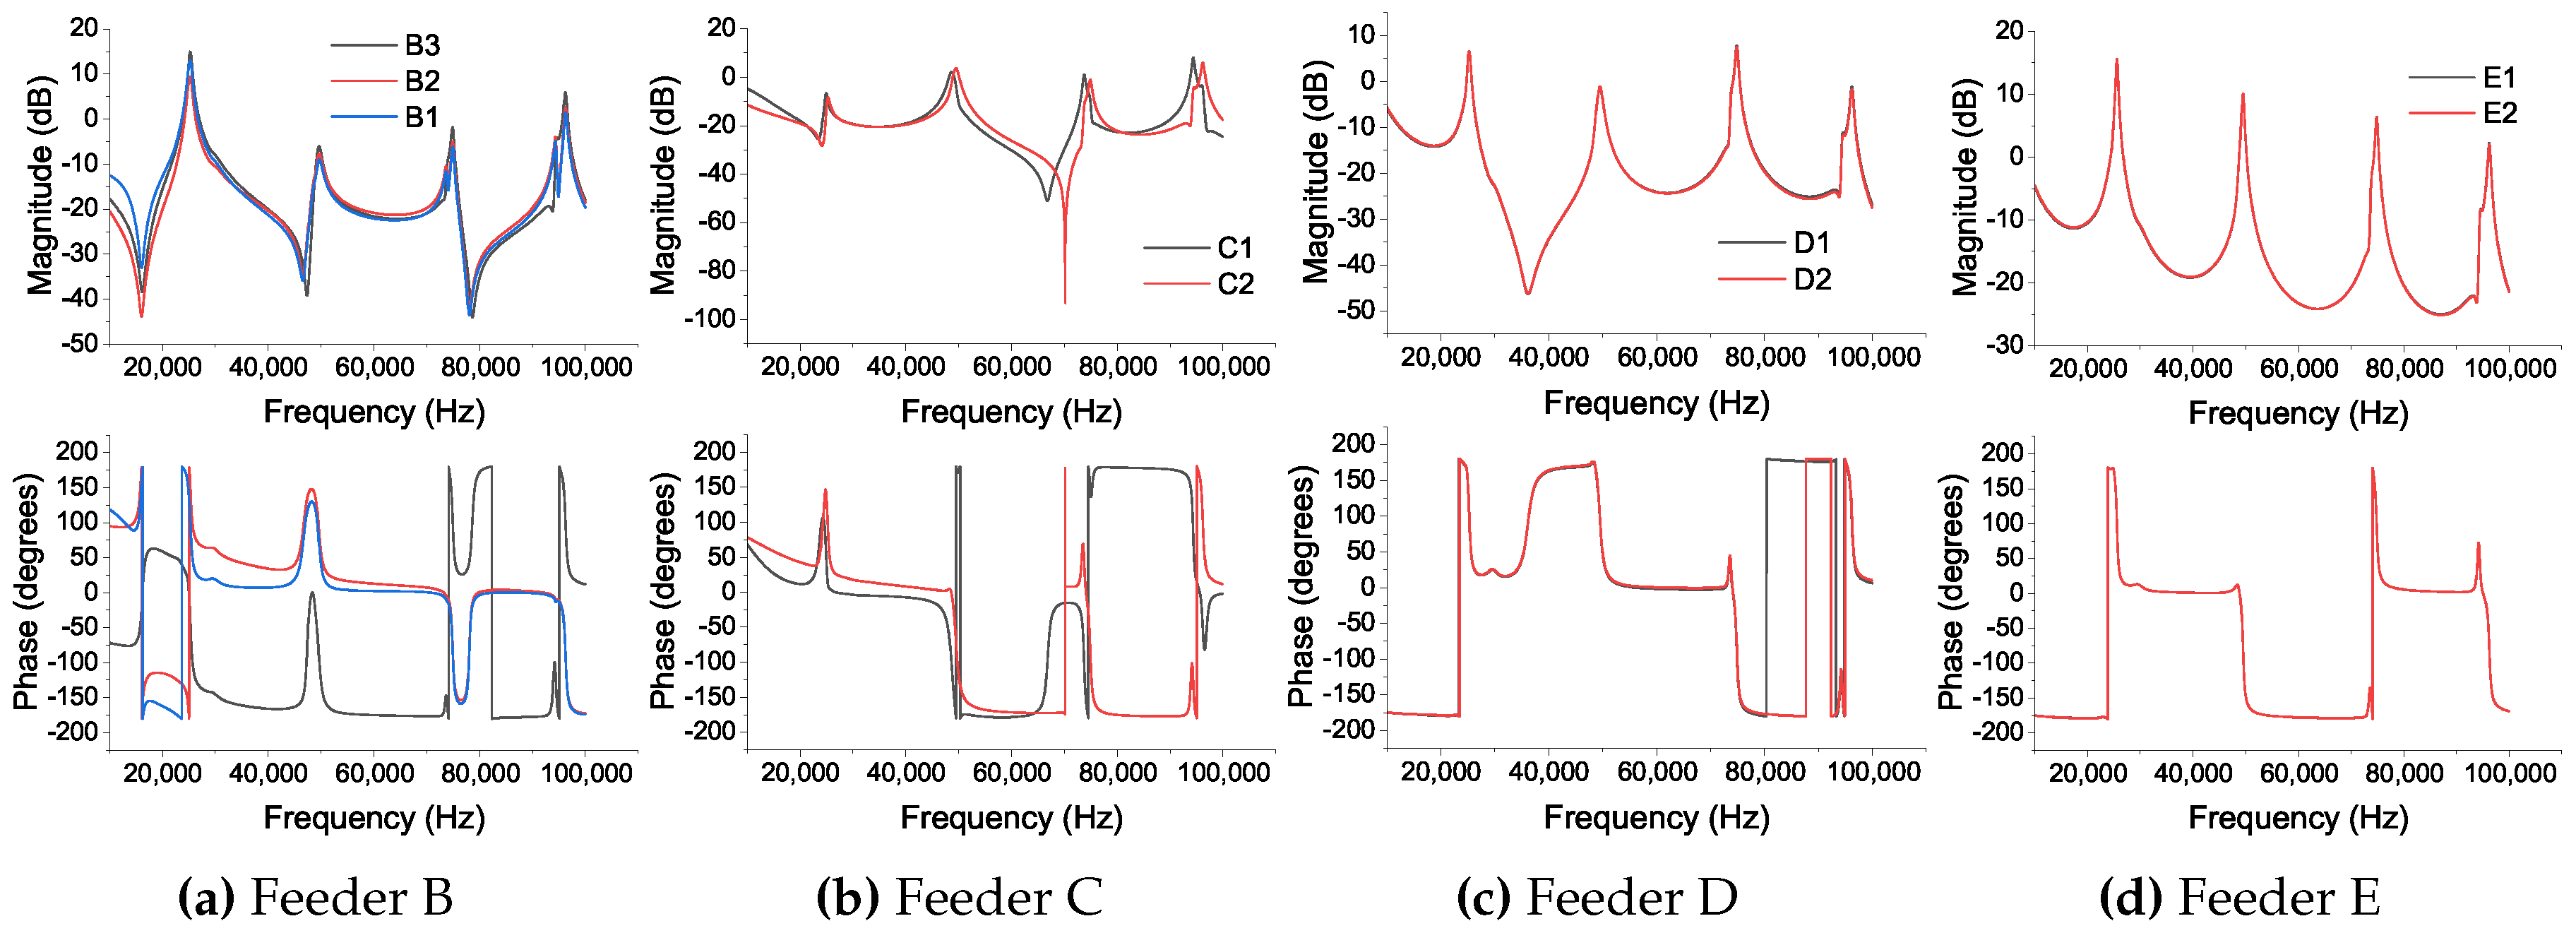
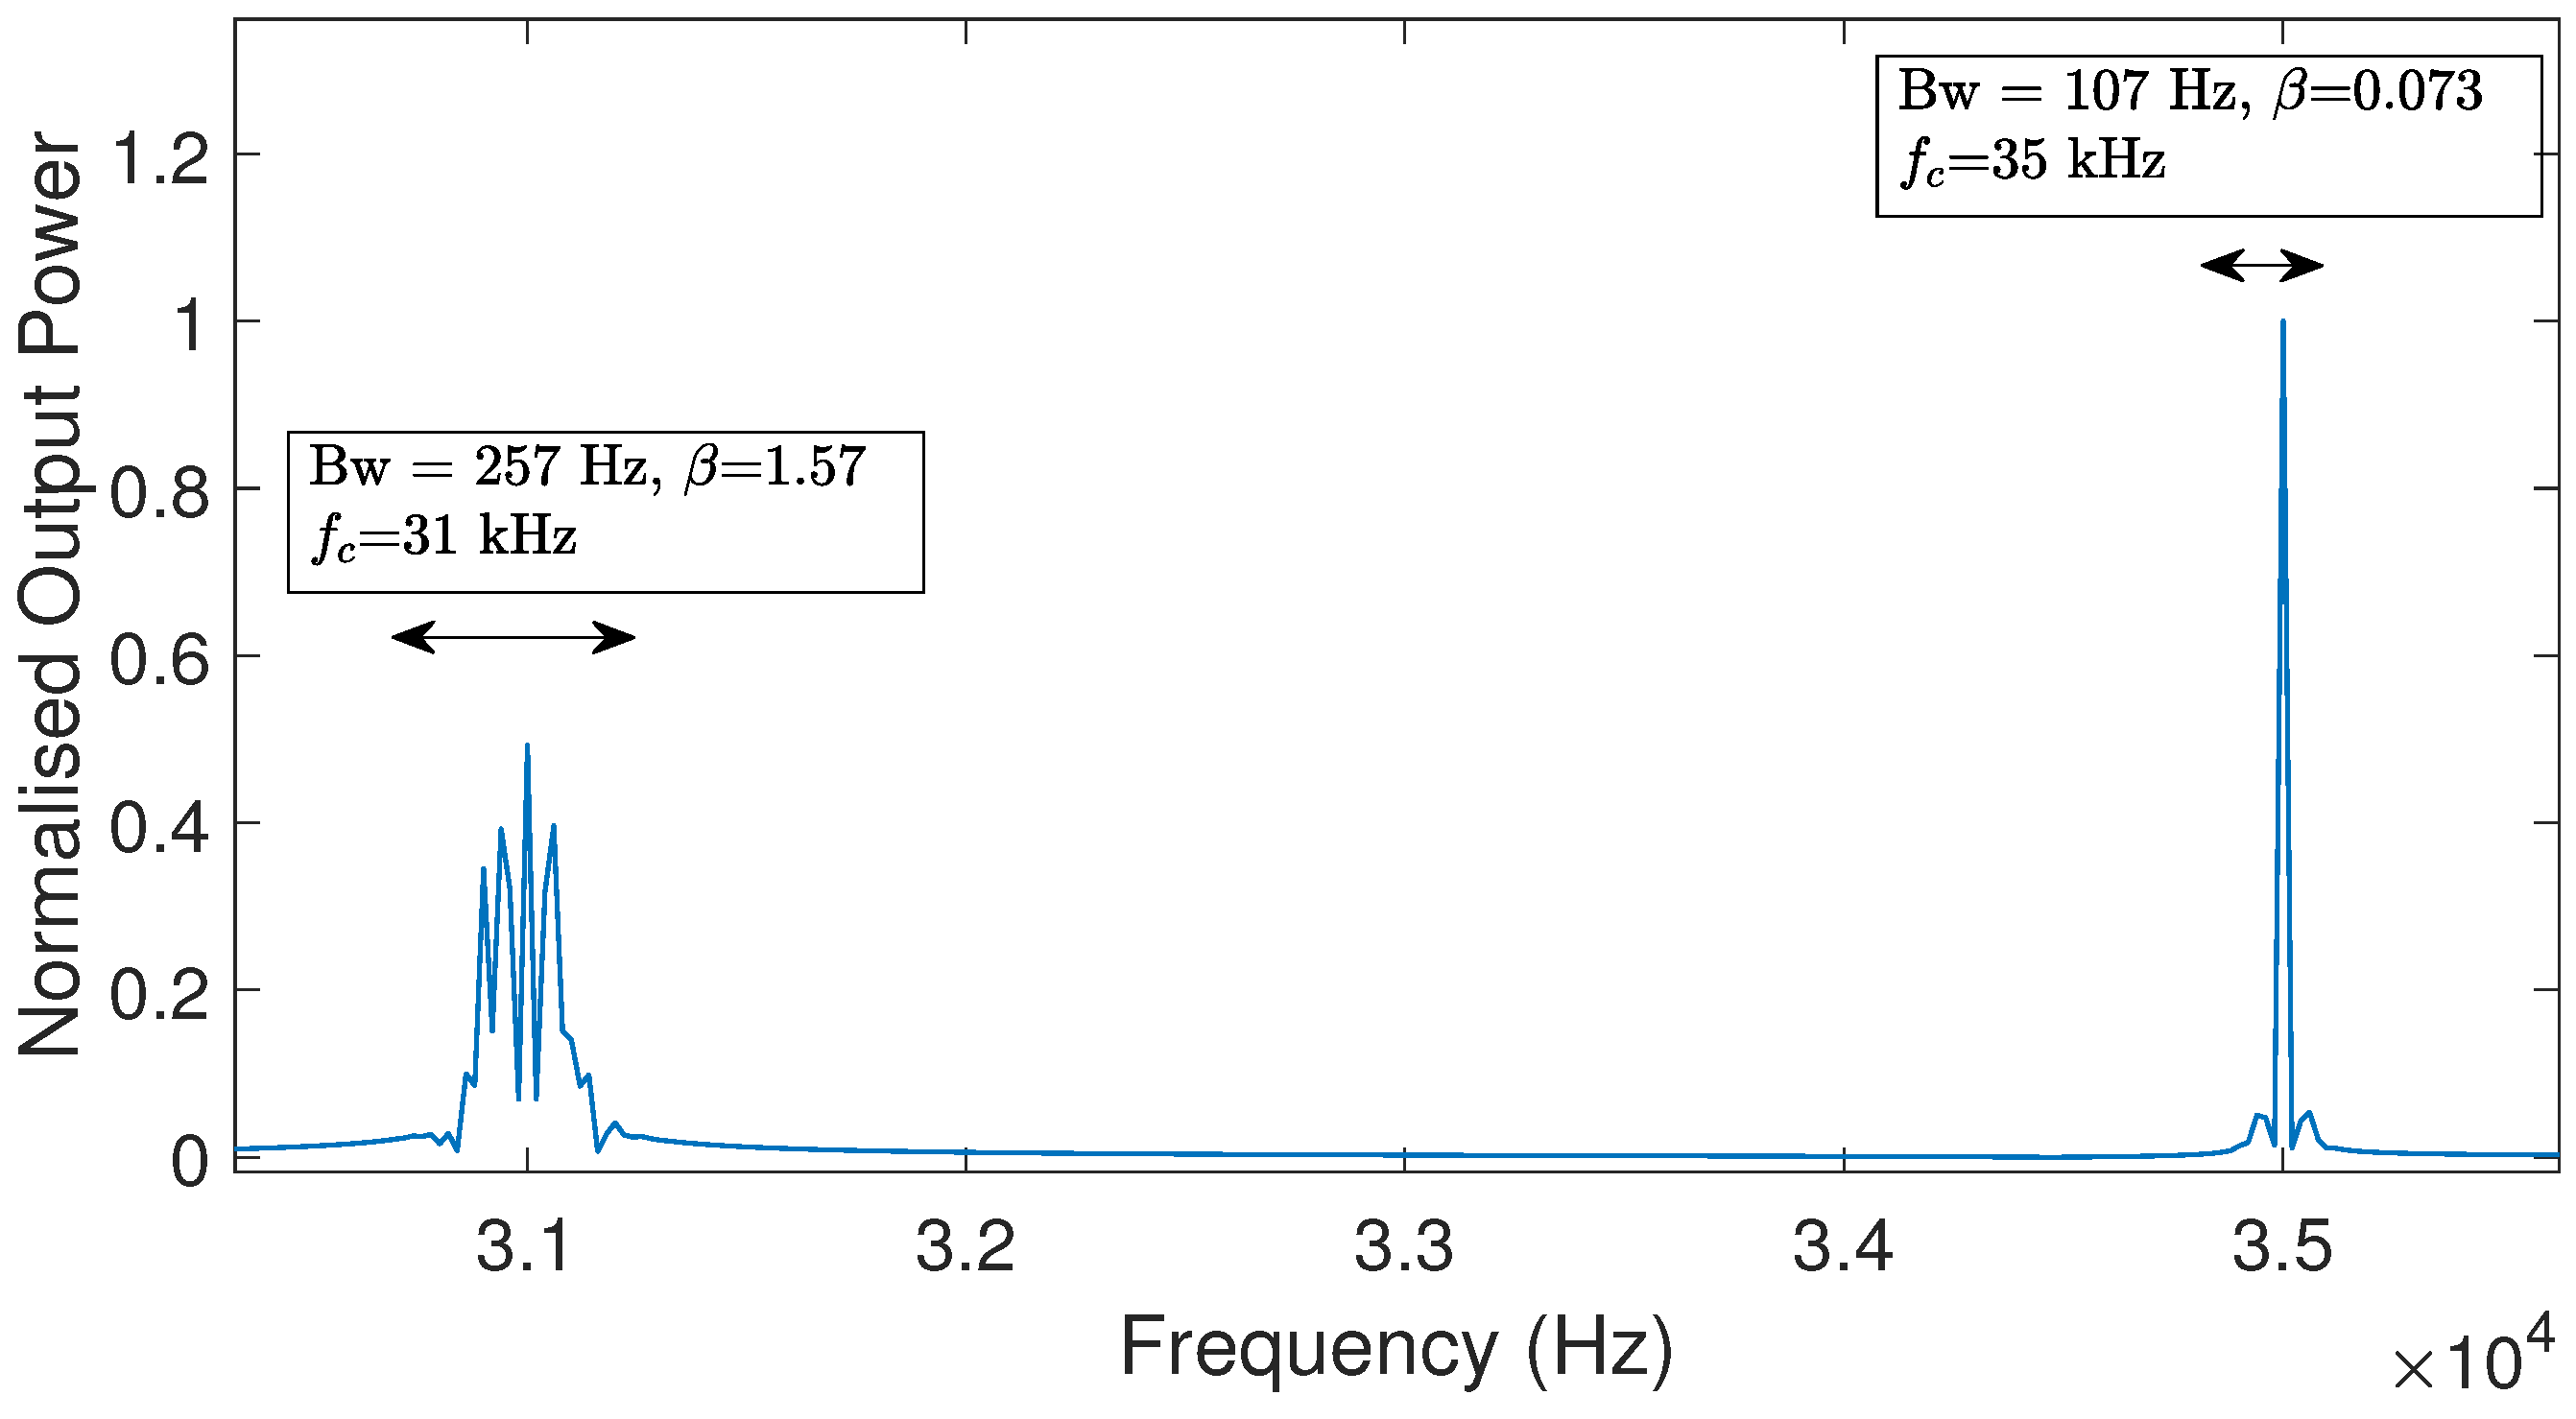
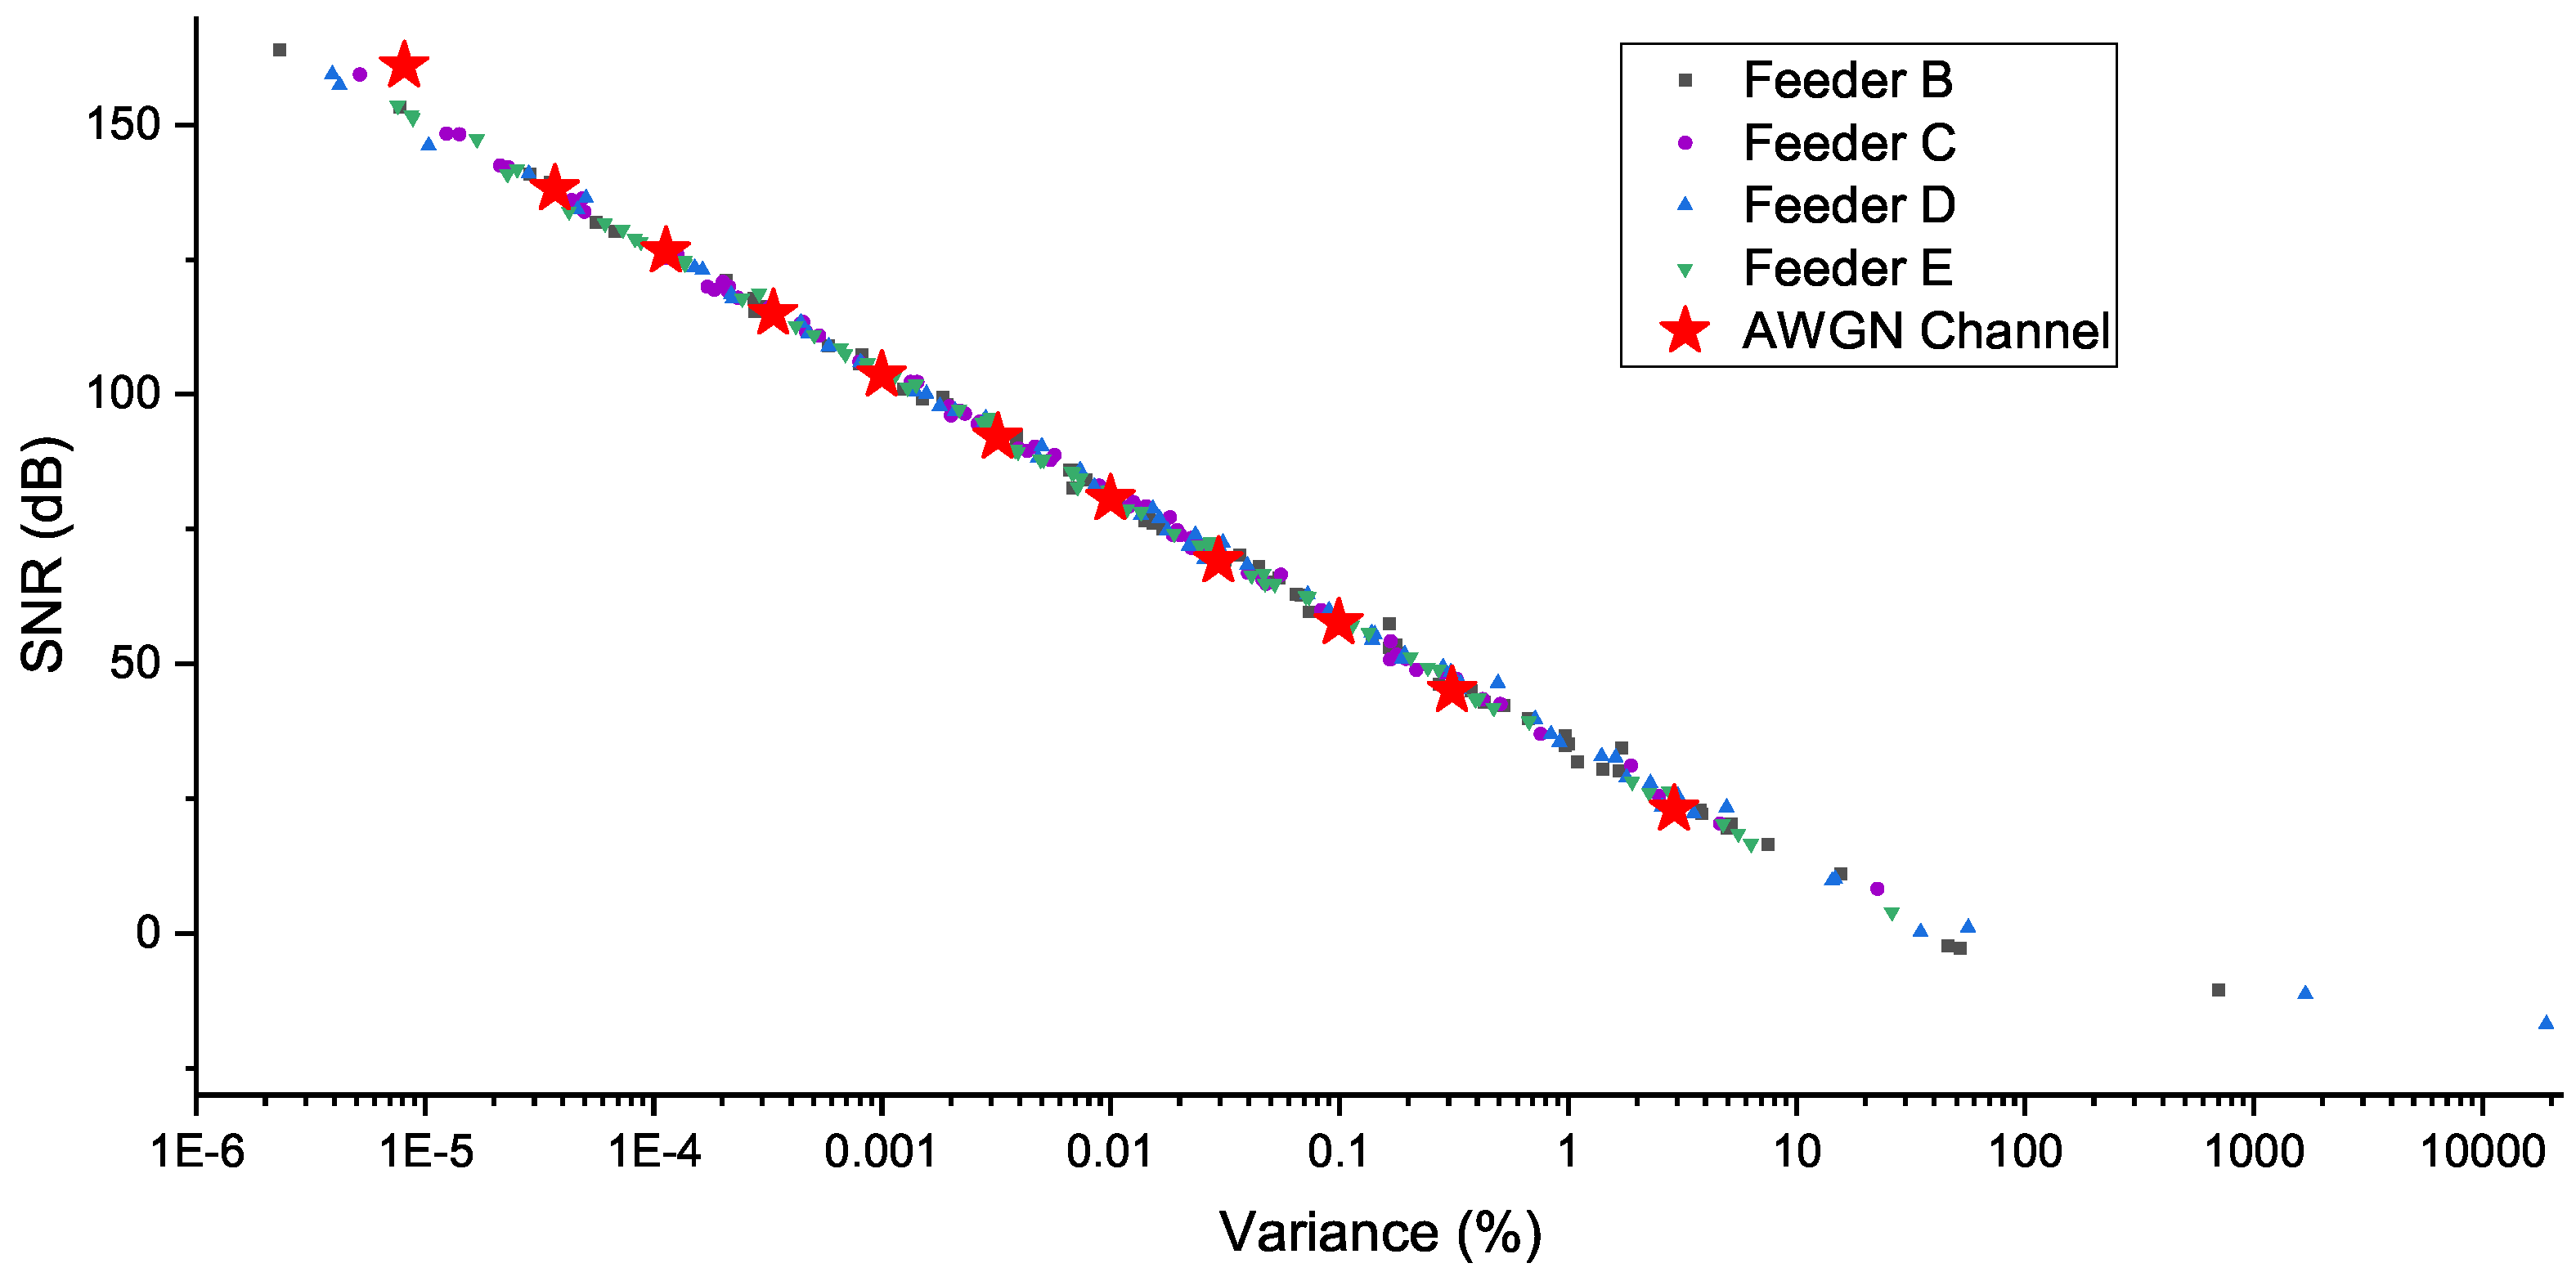
4.1. Channel Properties
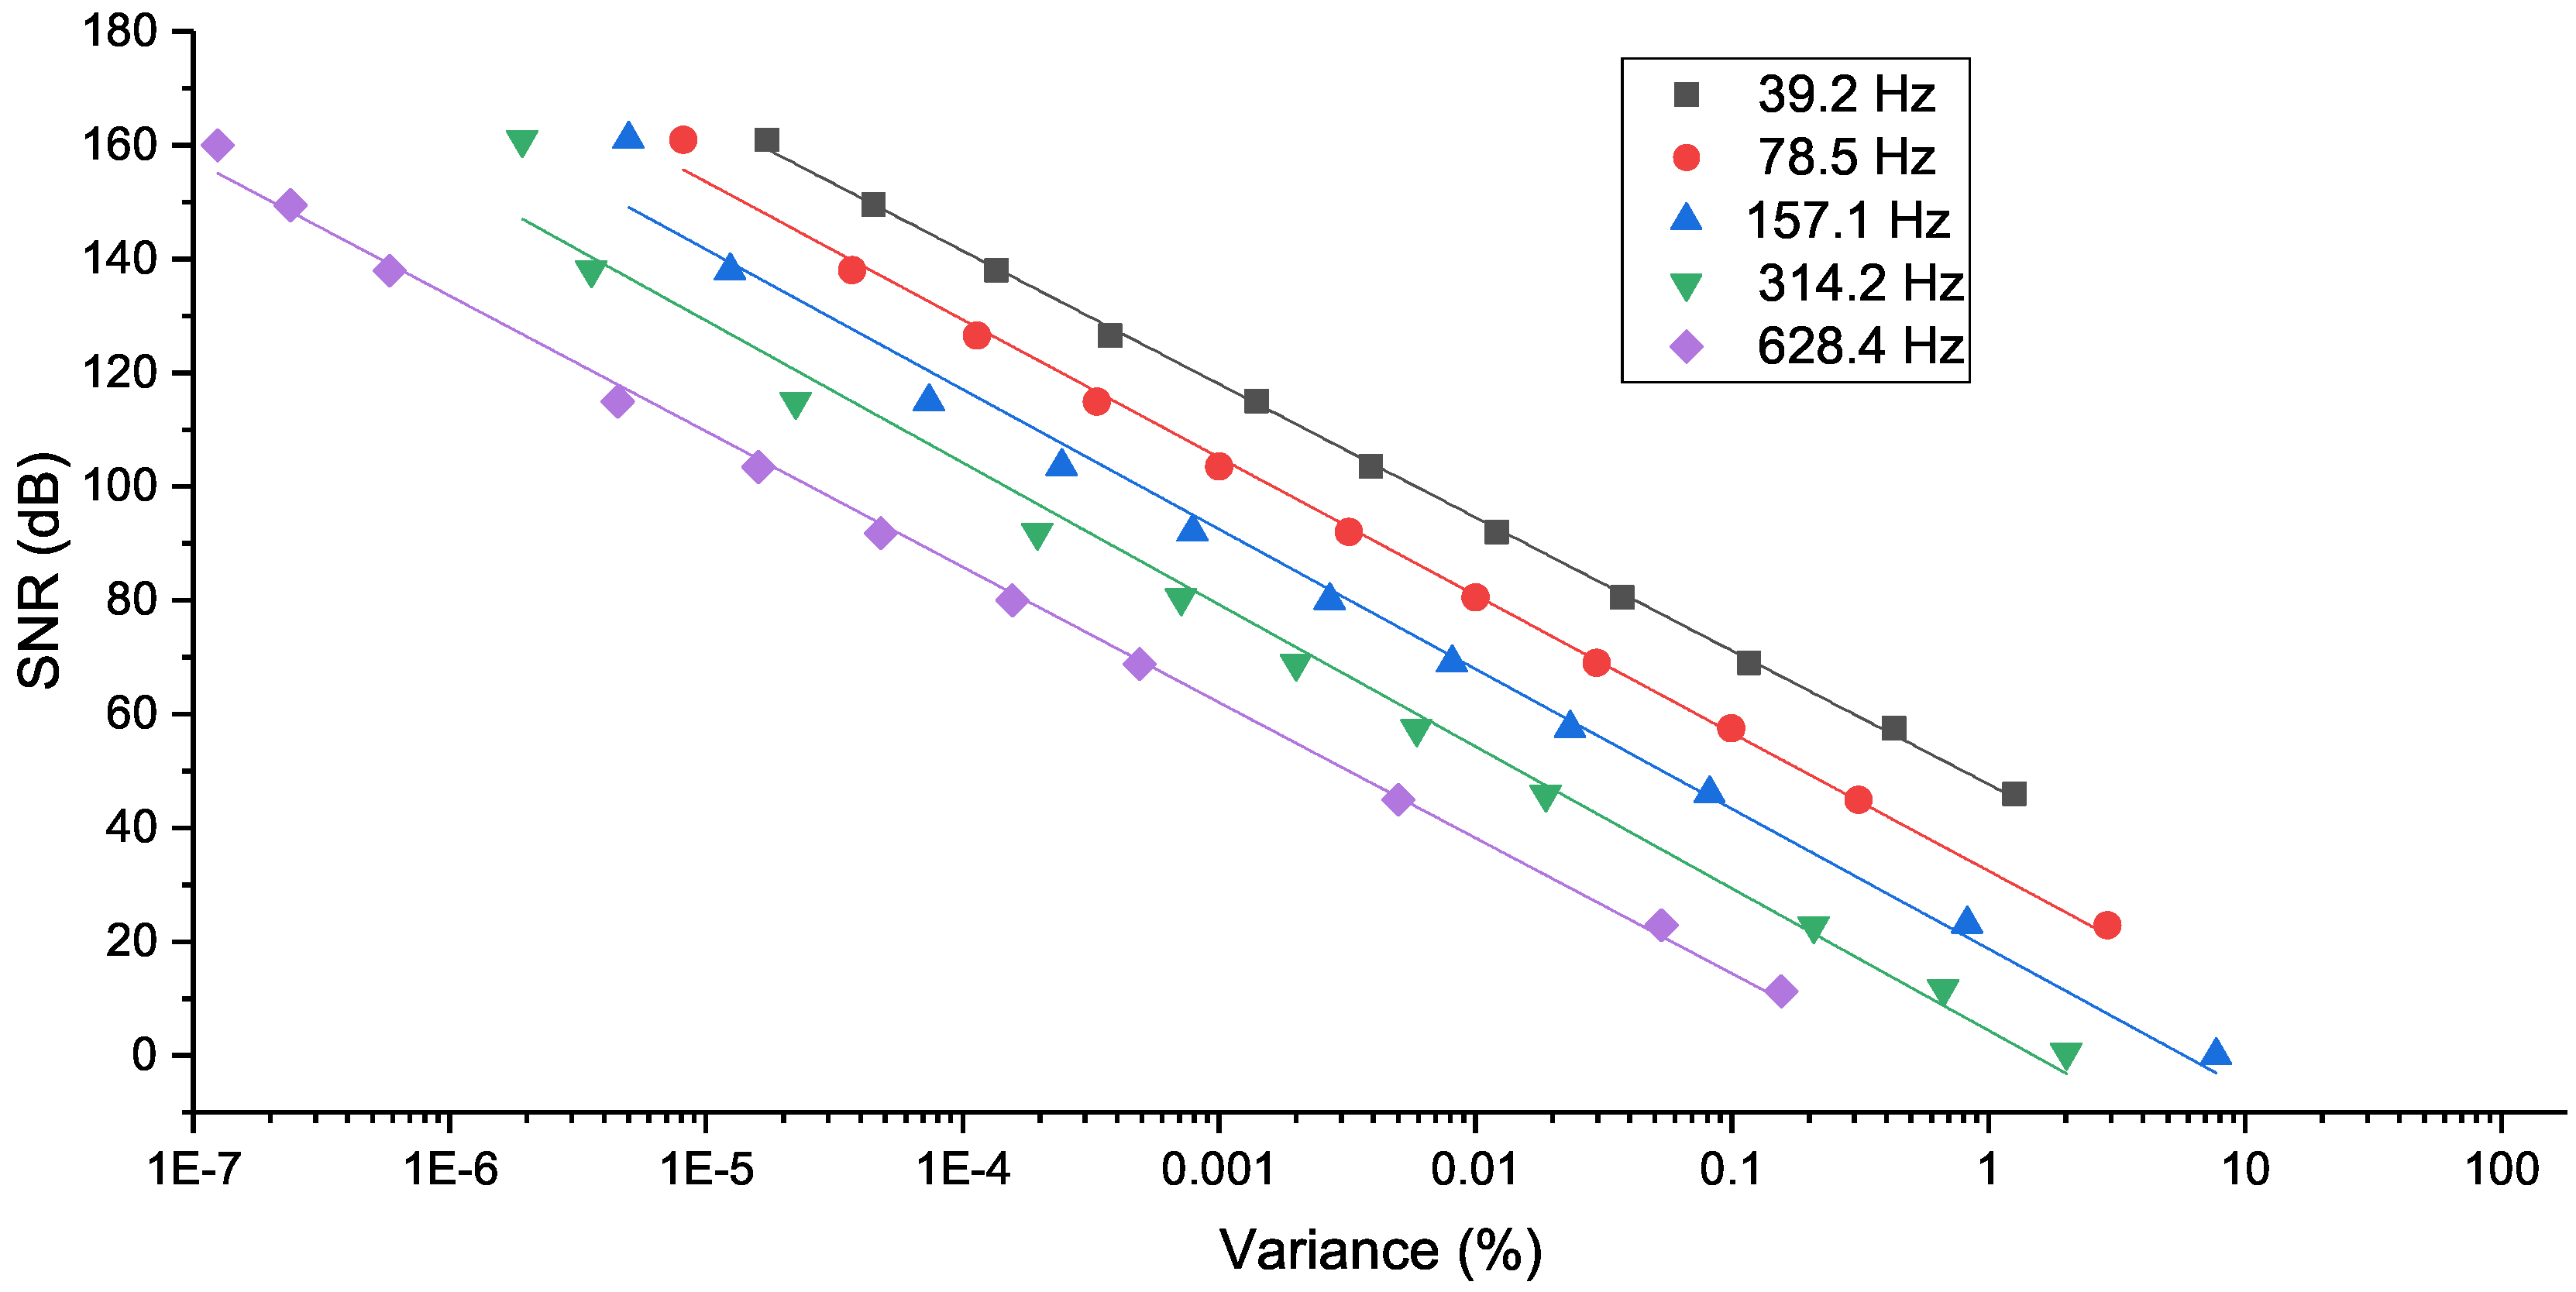
4.2. Performance over AWGN Channel
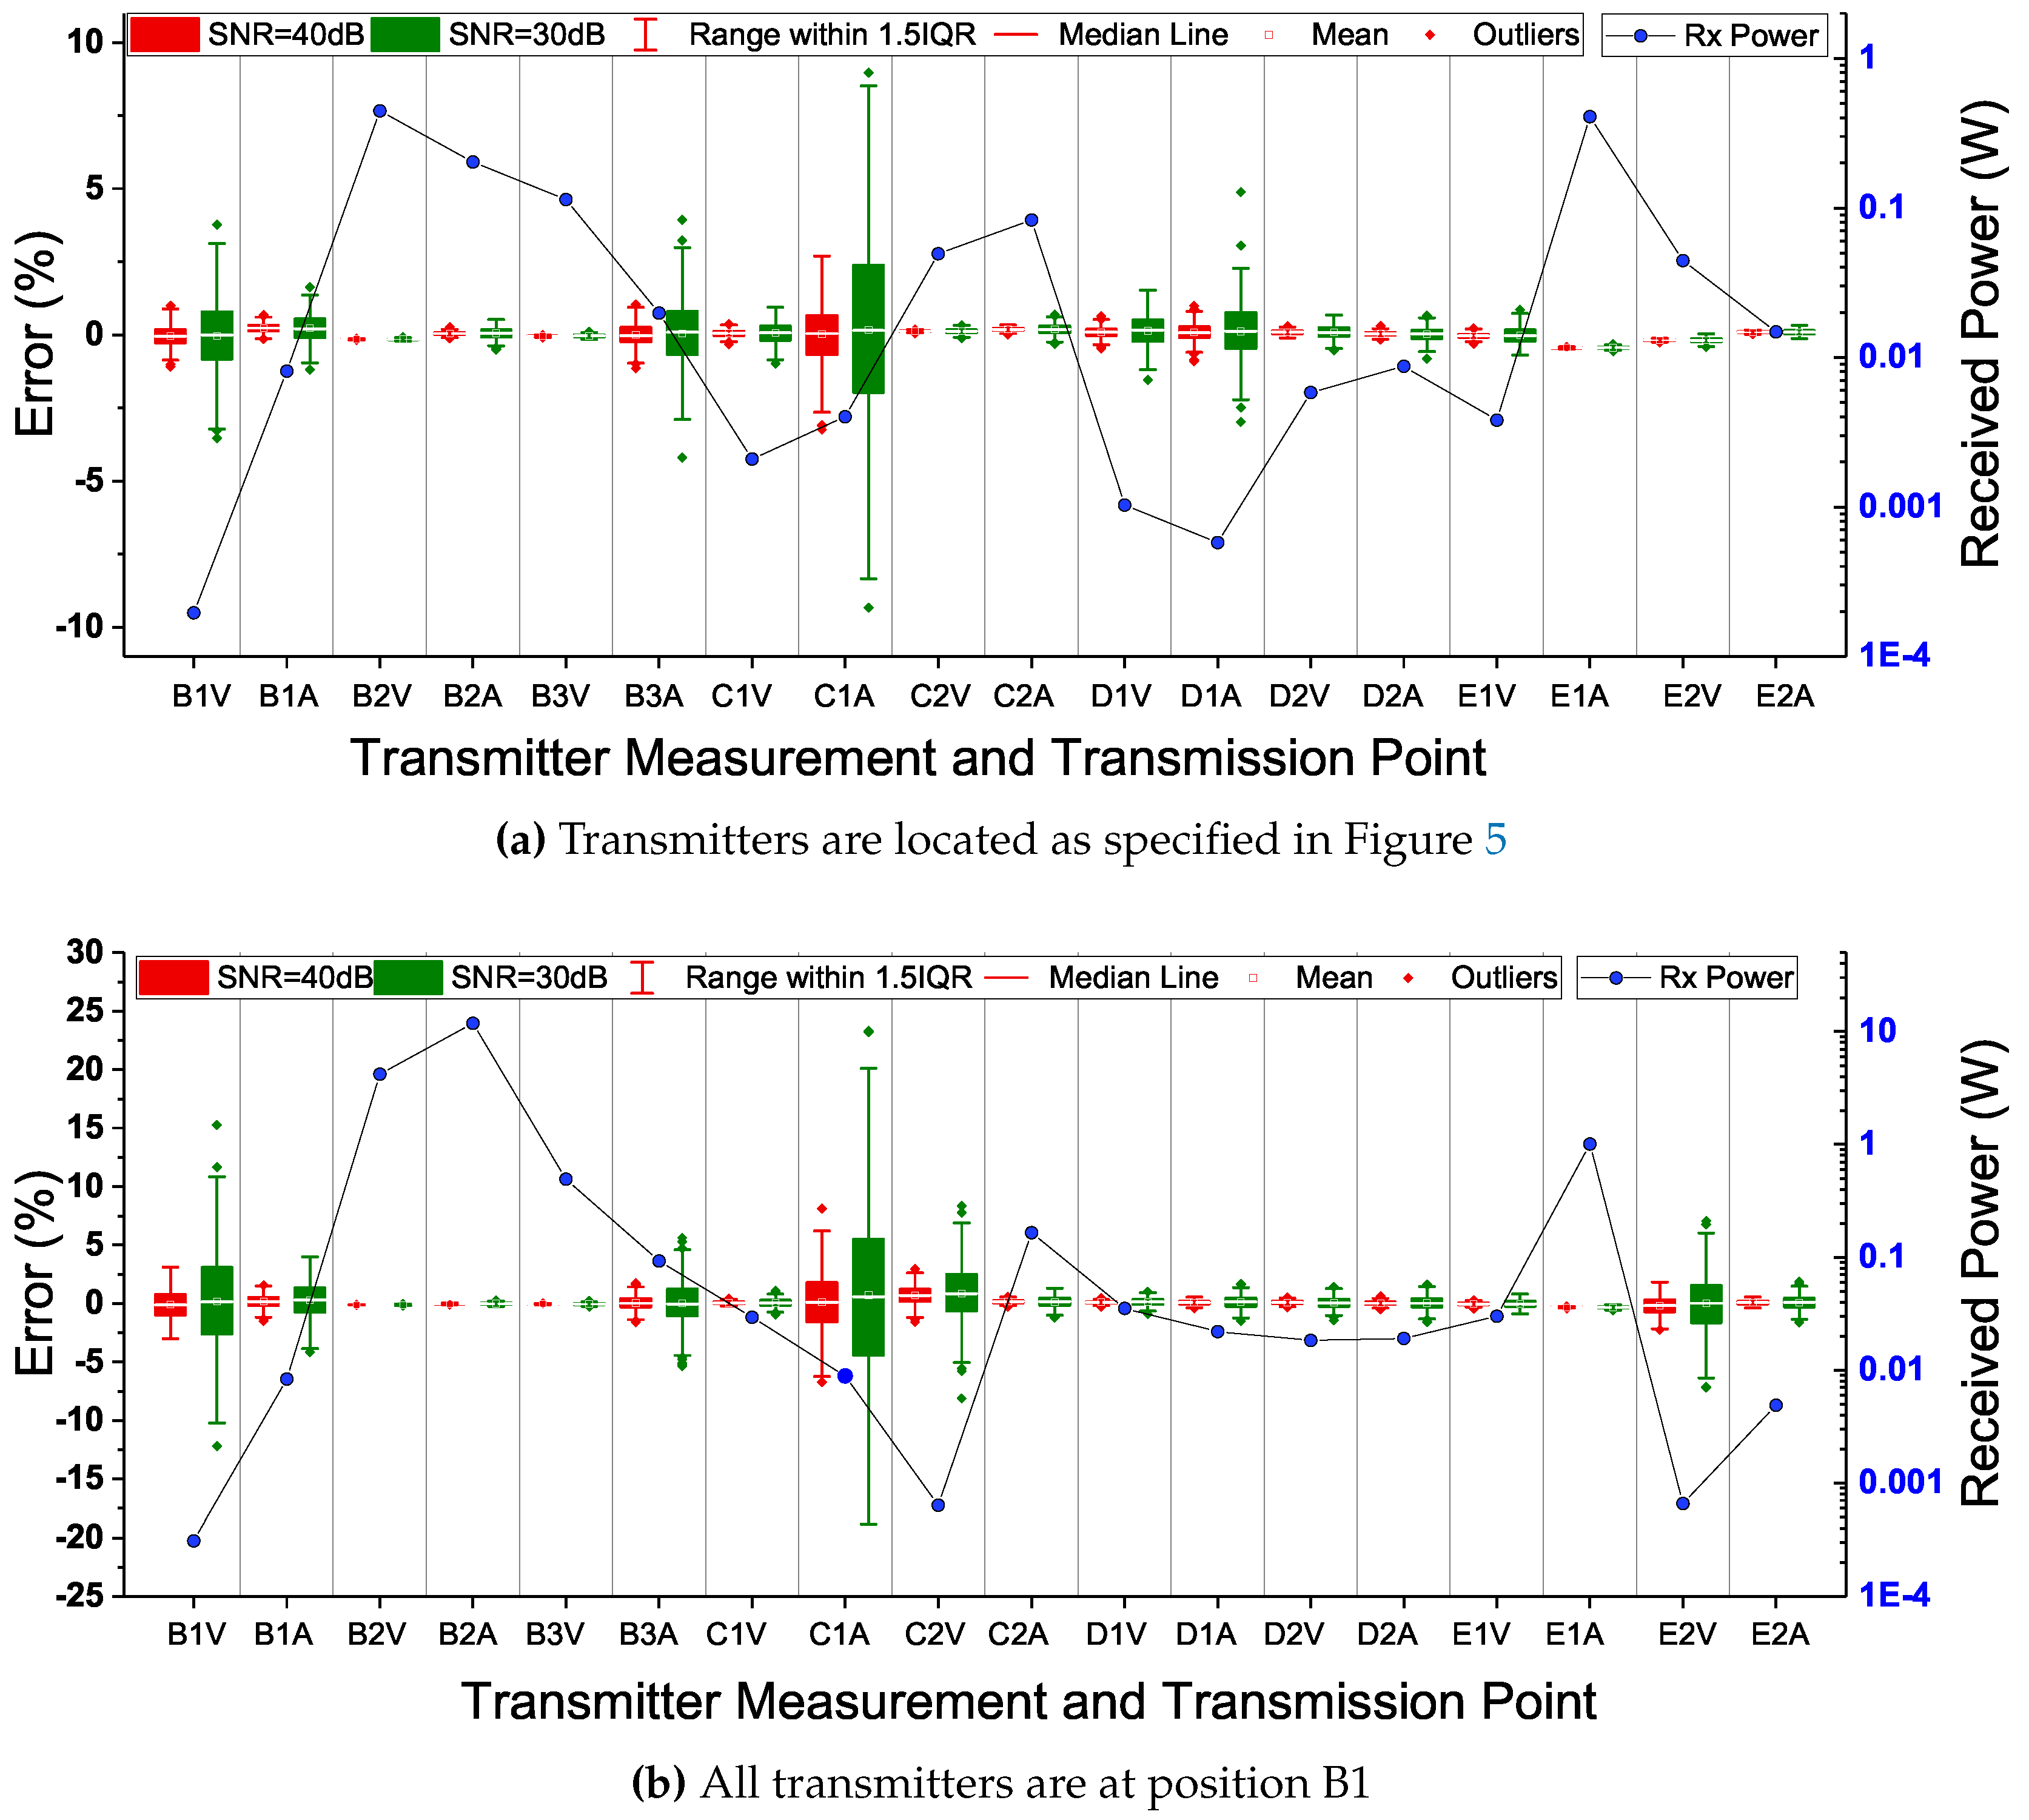
4.3. Performance on the EMTP/ATP Network
4.3.1. System Design
4.3.2. General Performance
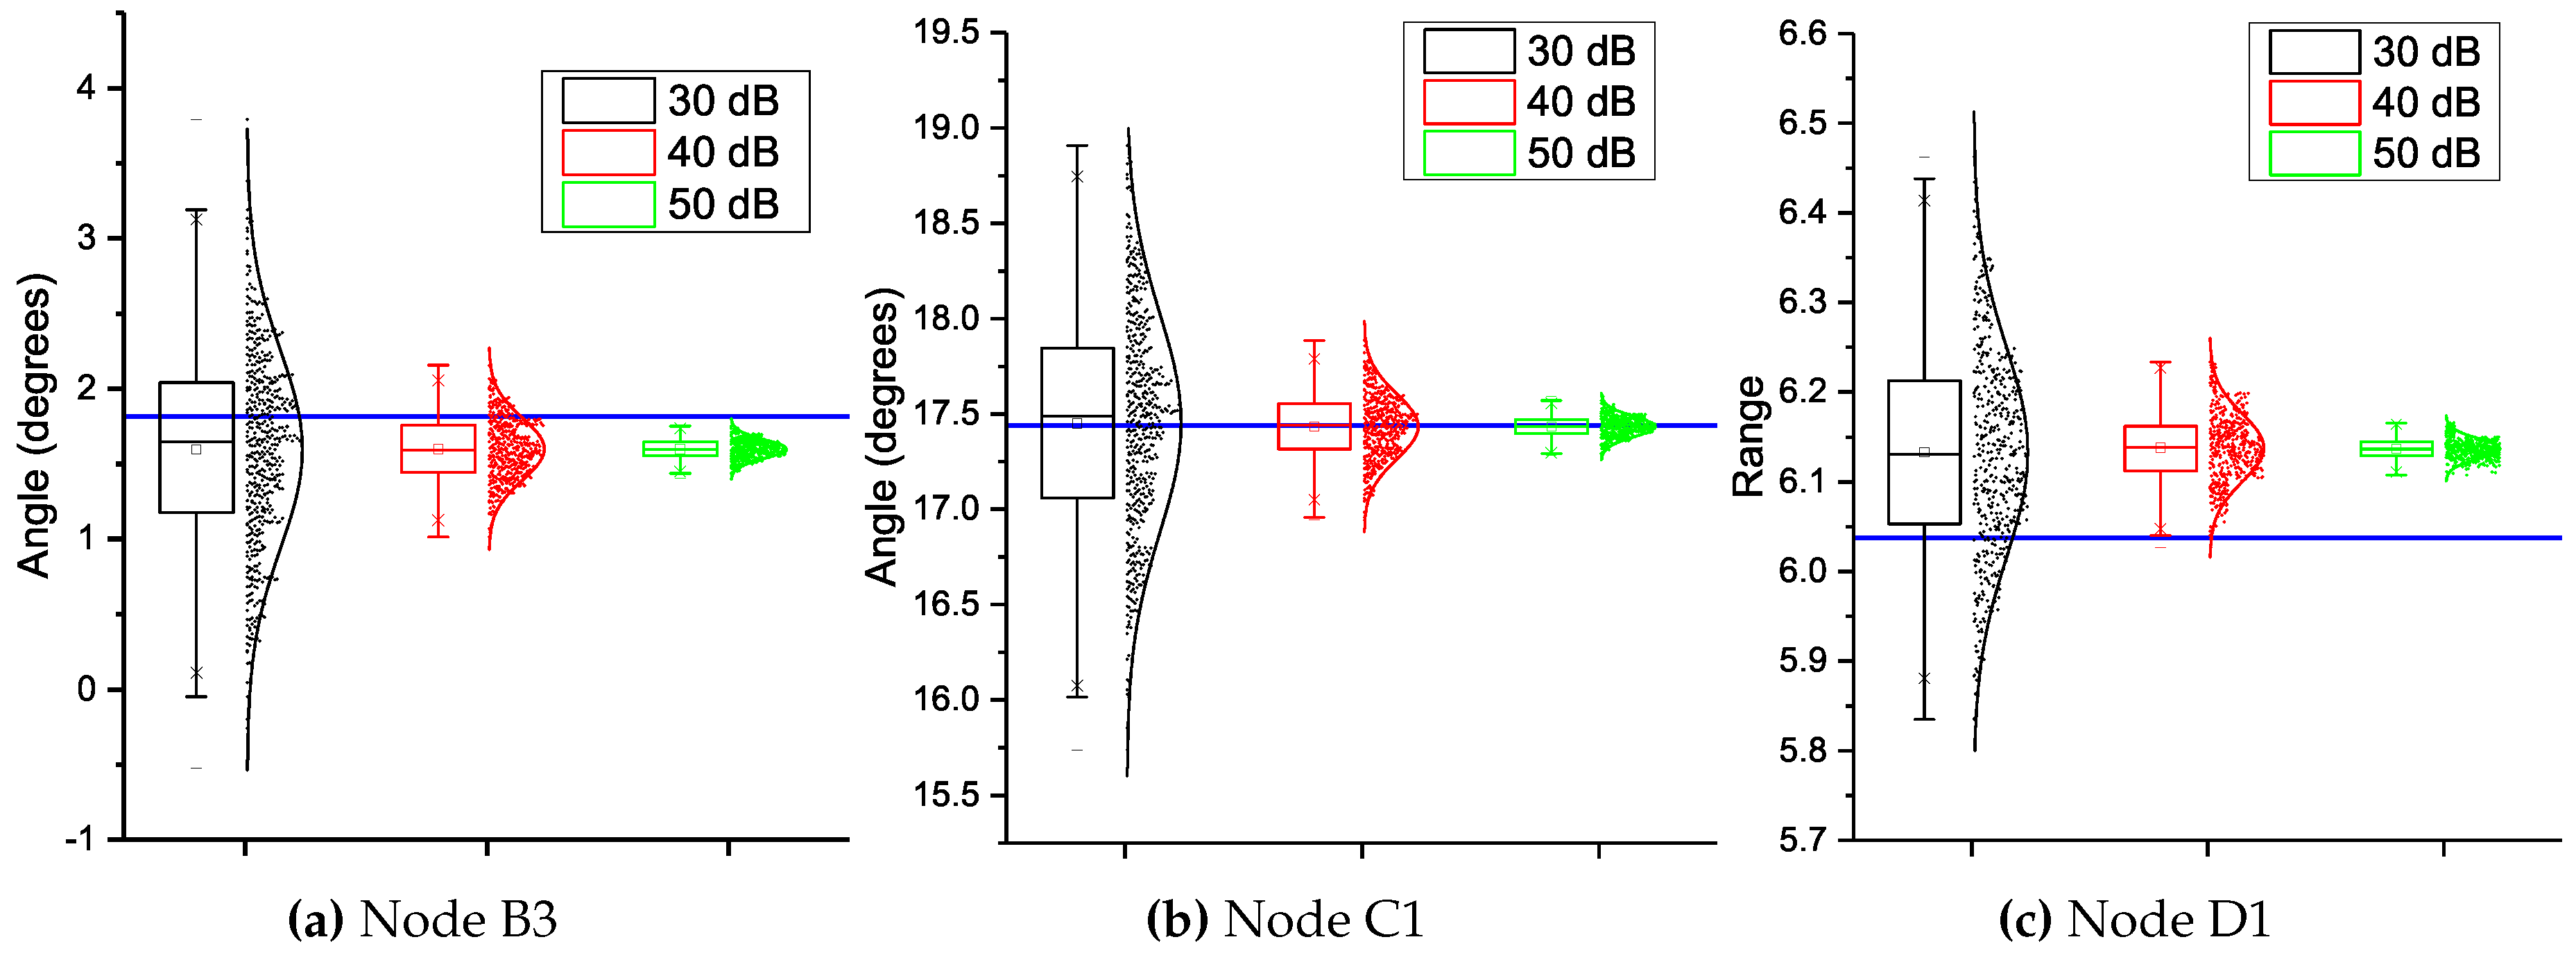
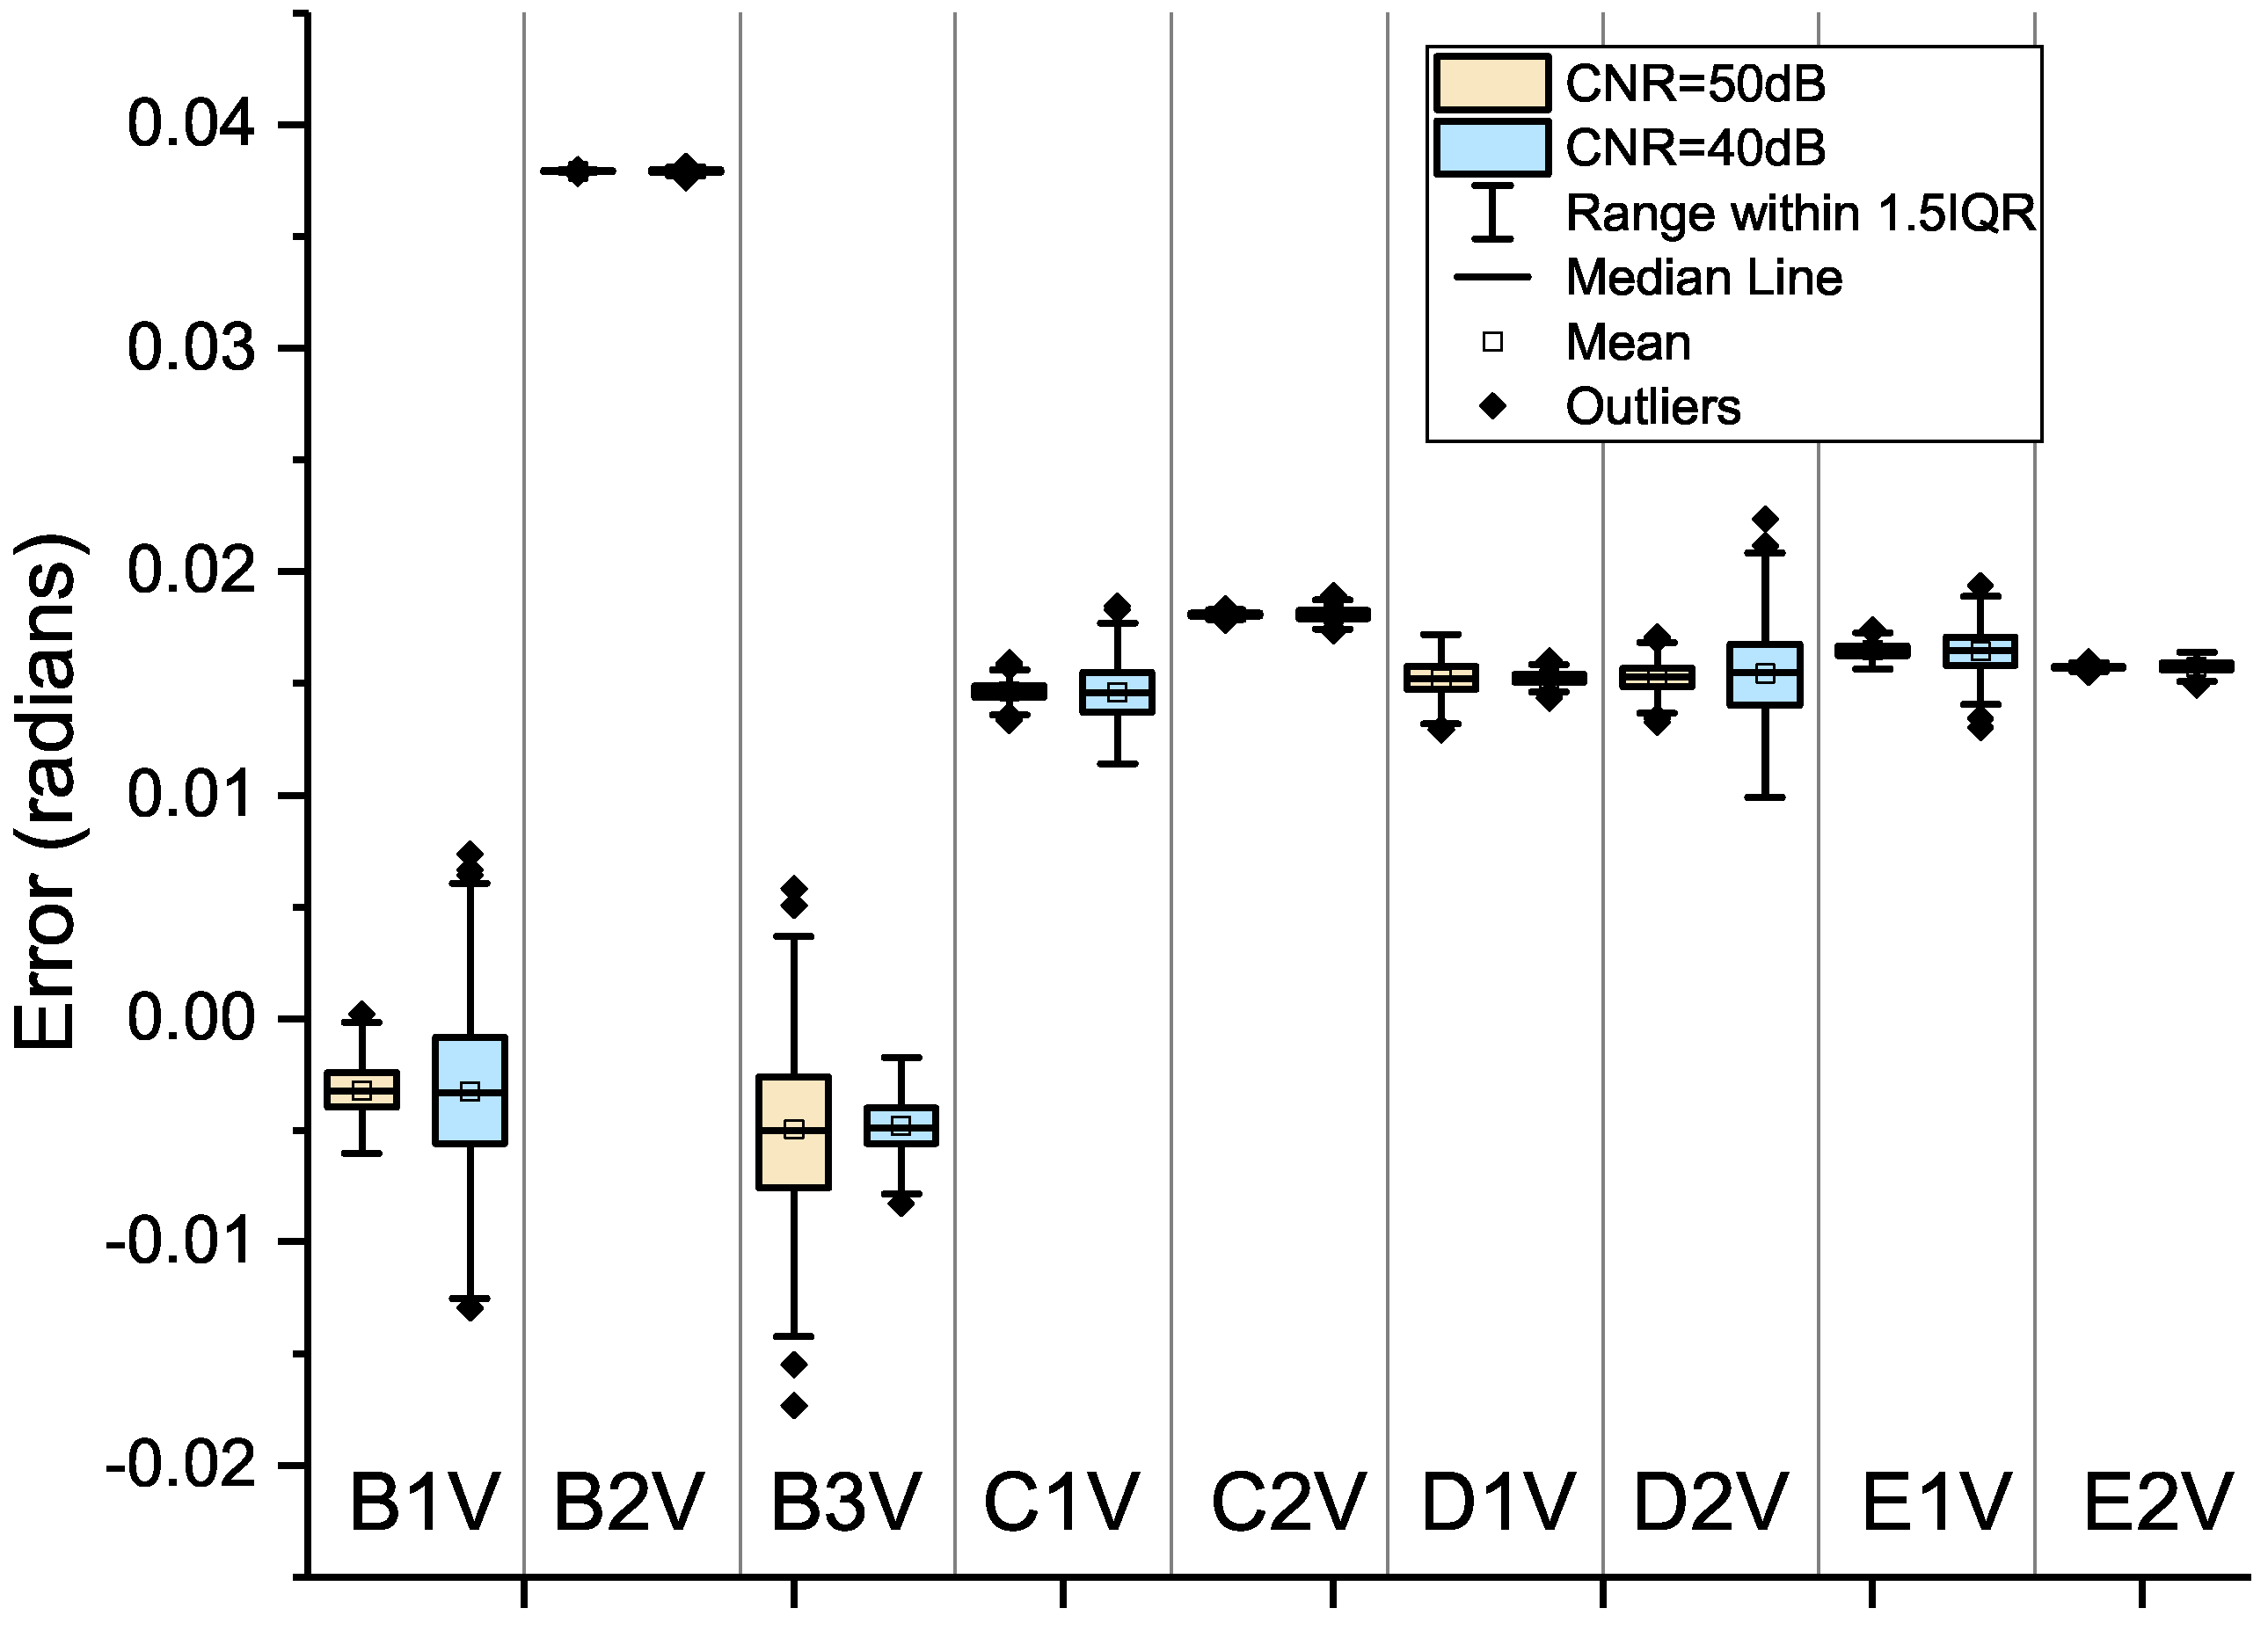
4.3.3. Phase Measurements
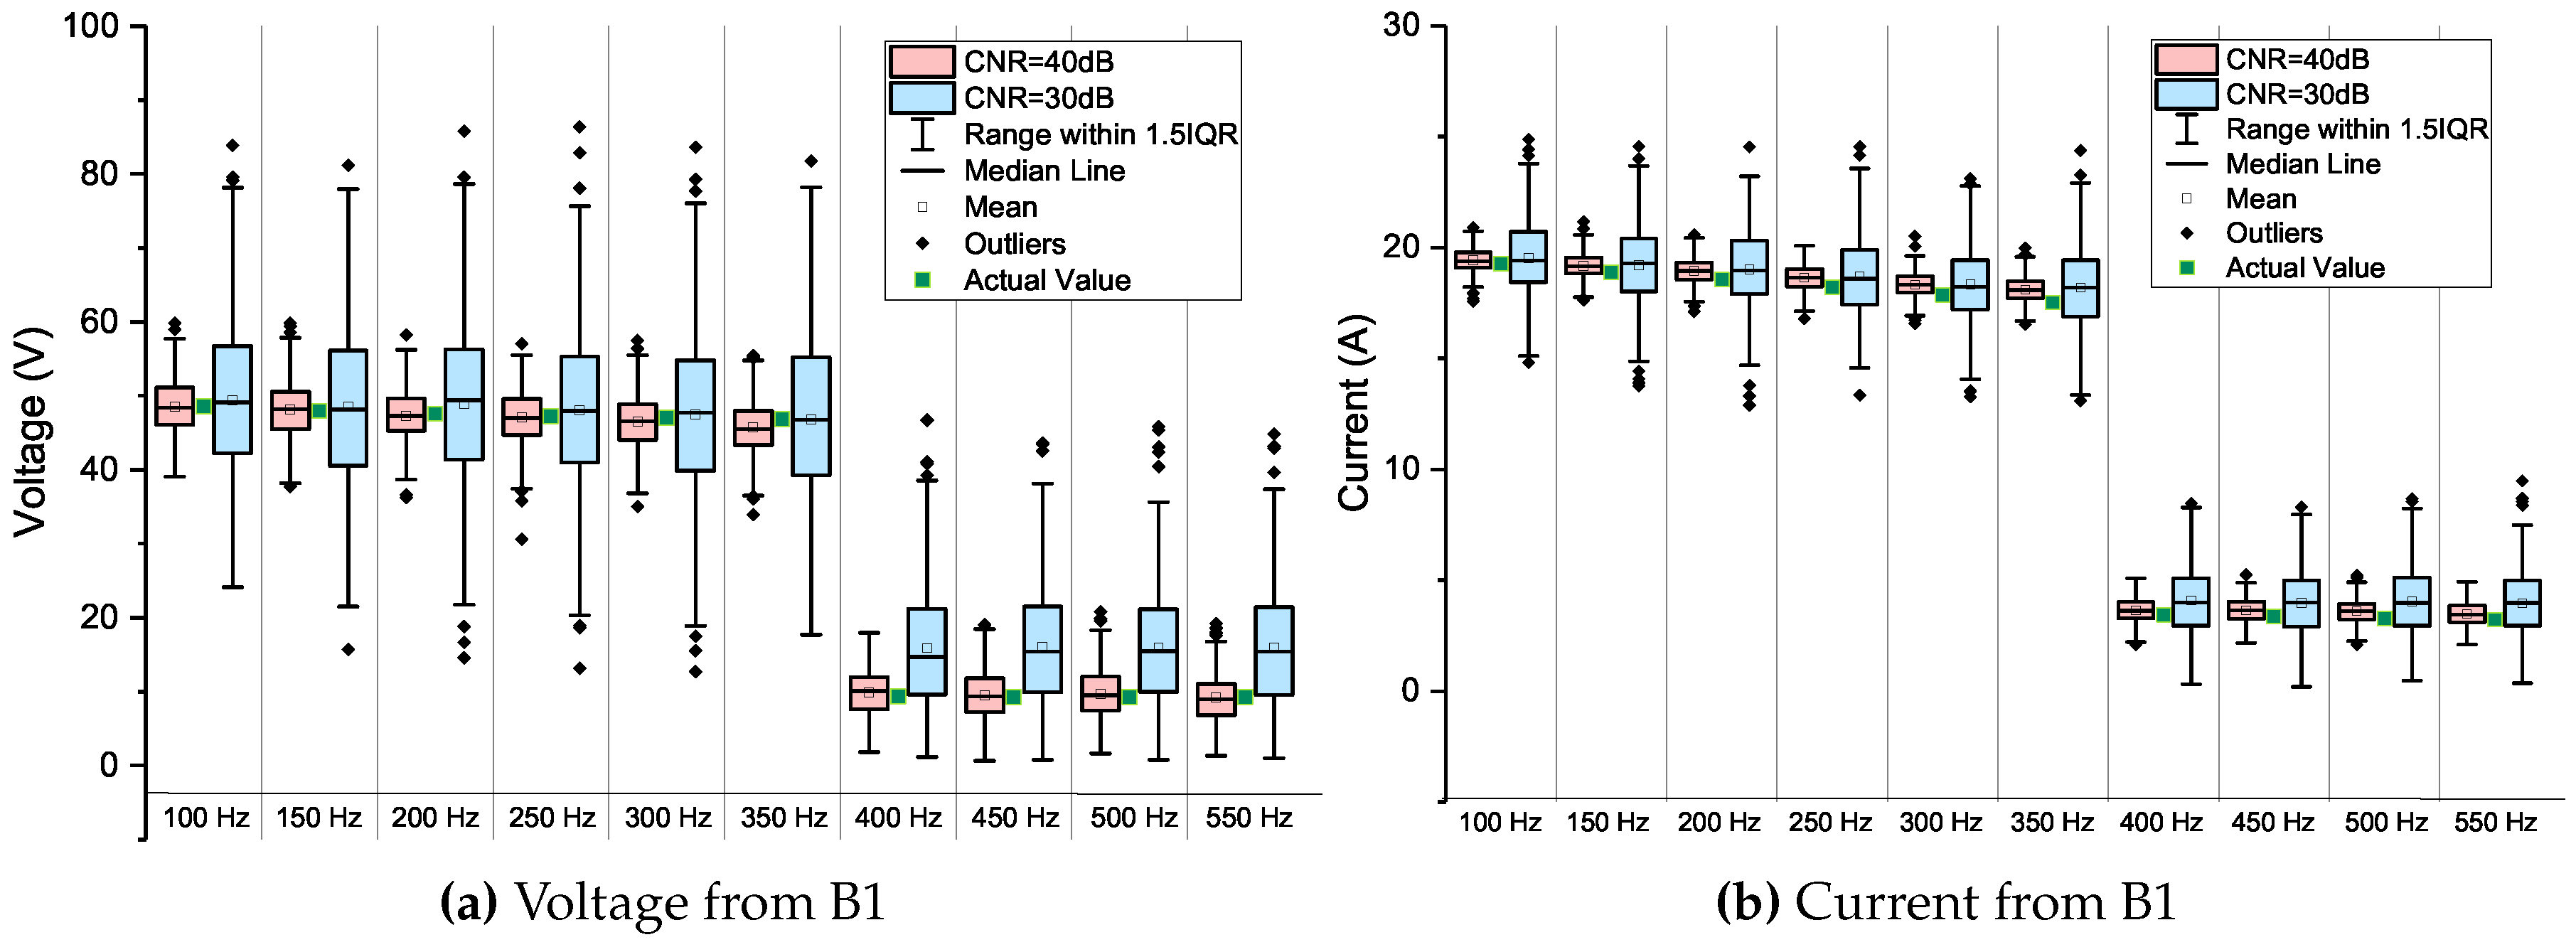
4.3.4. Harmonic Measurements
4.3.5. Synchrophasor Retrieval
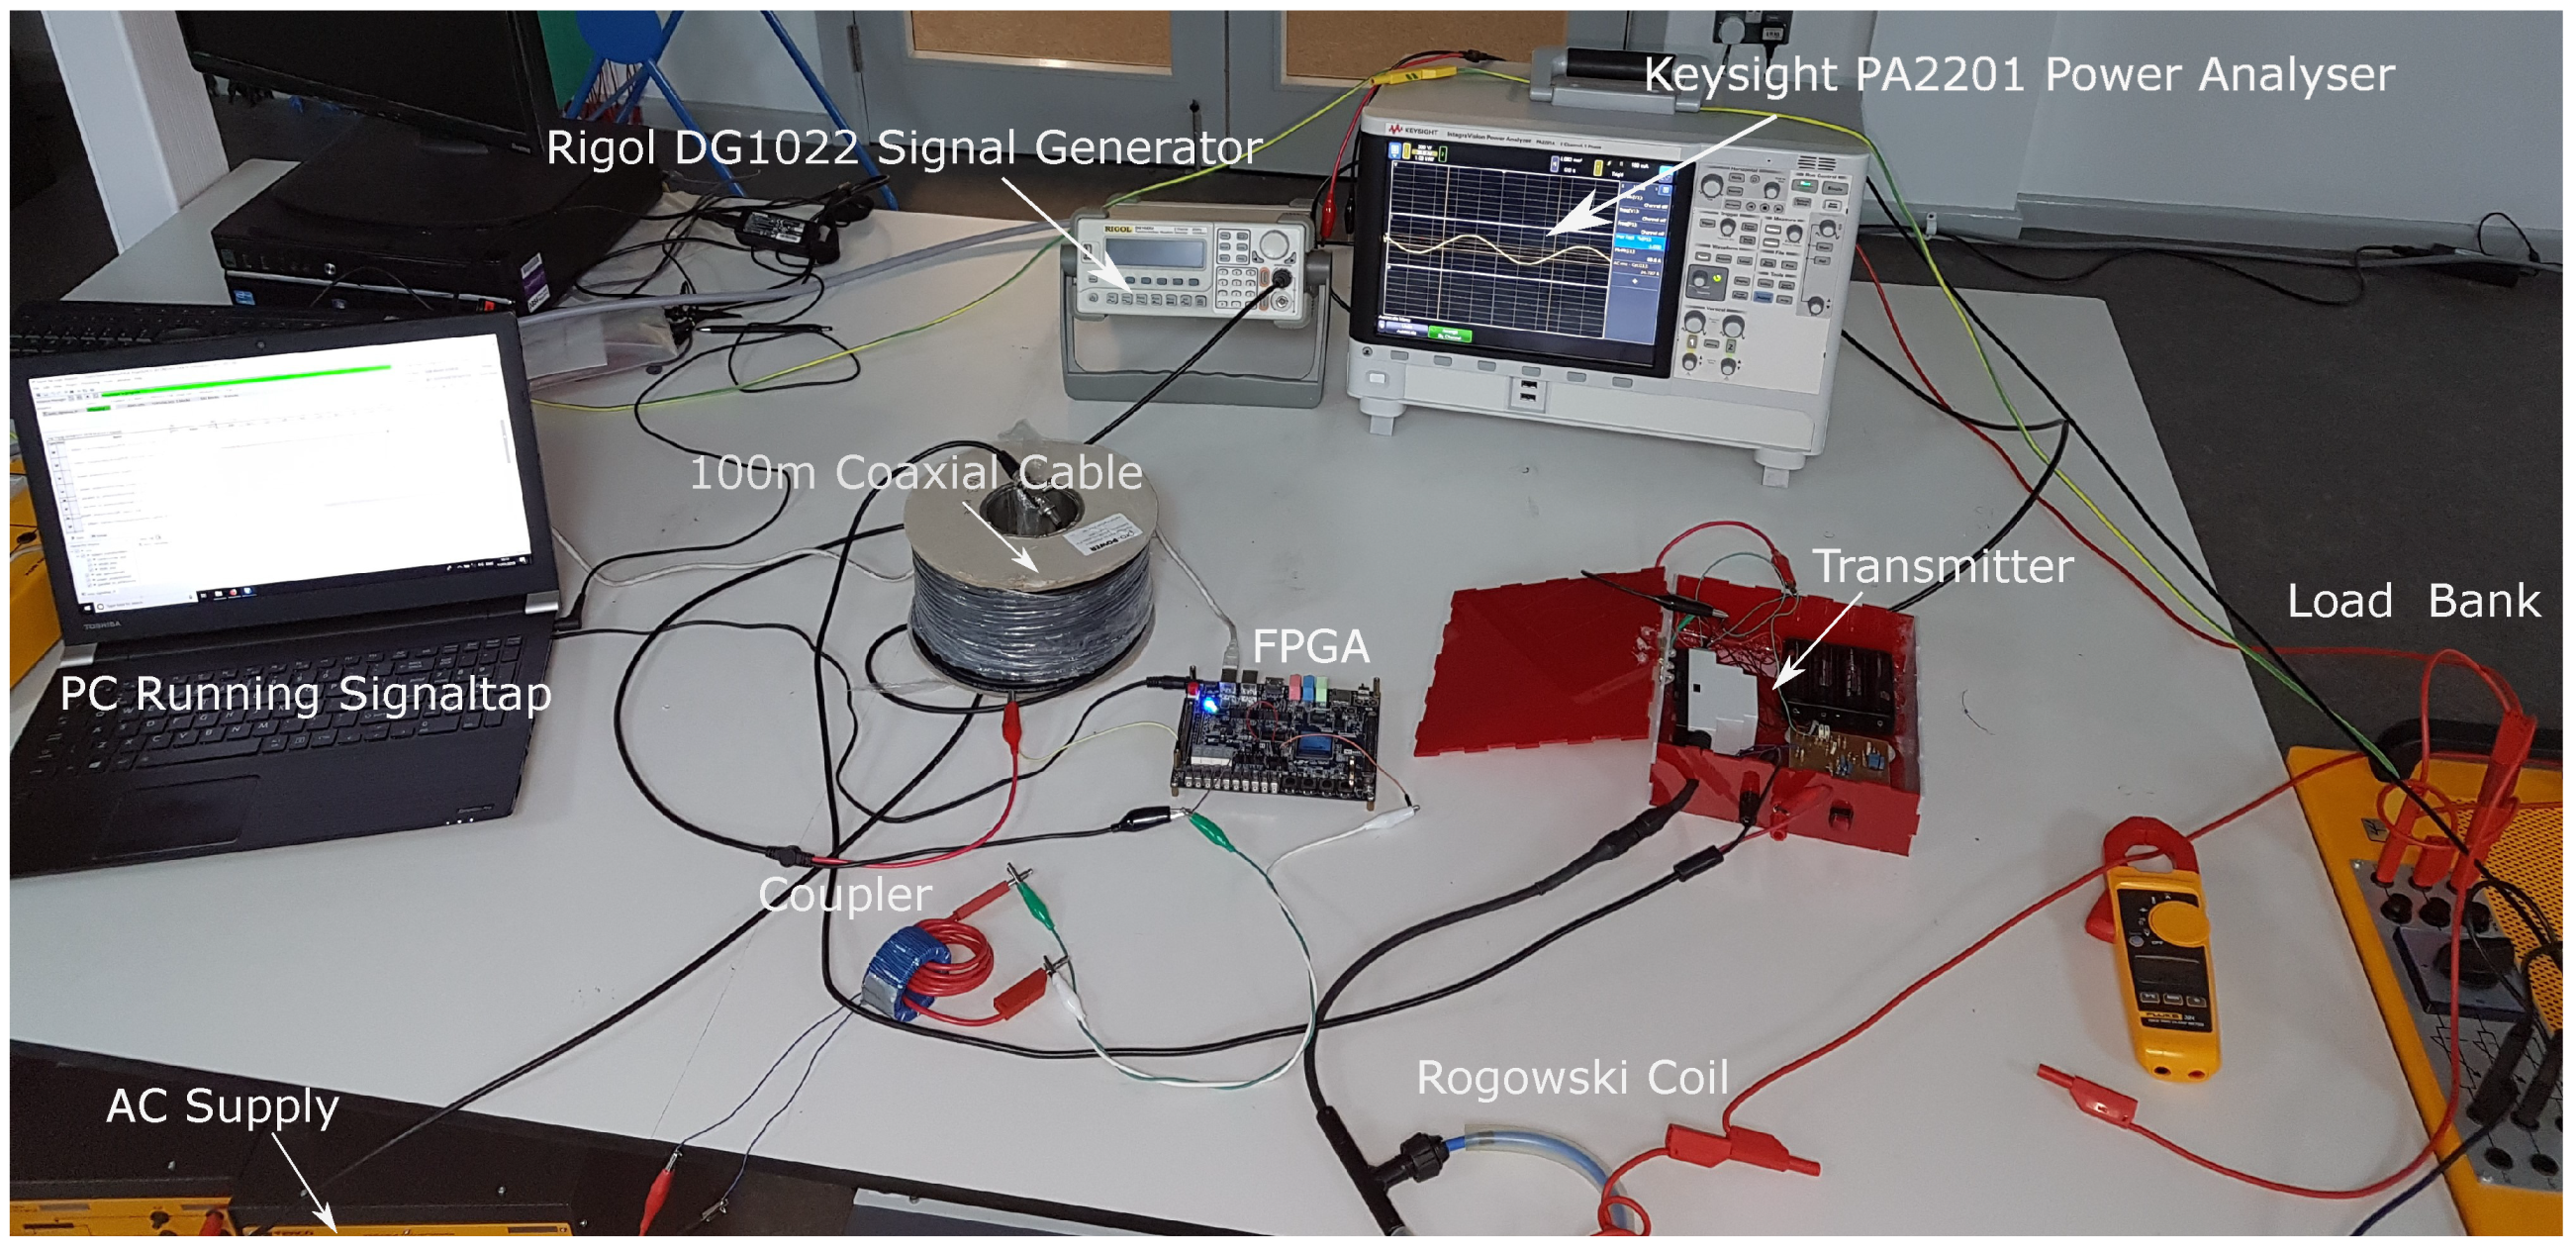
5. Prototype Build
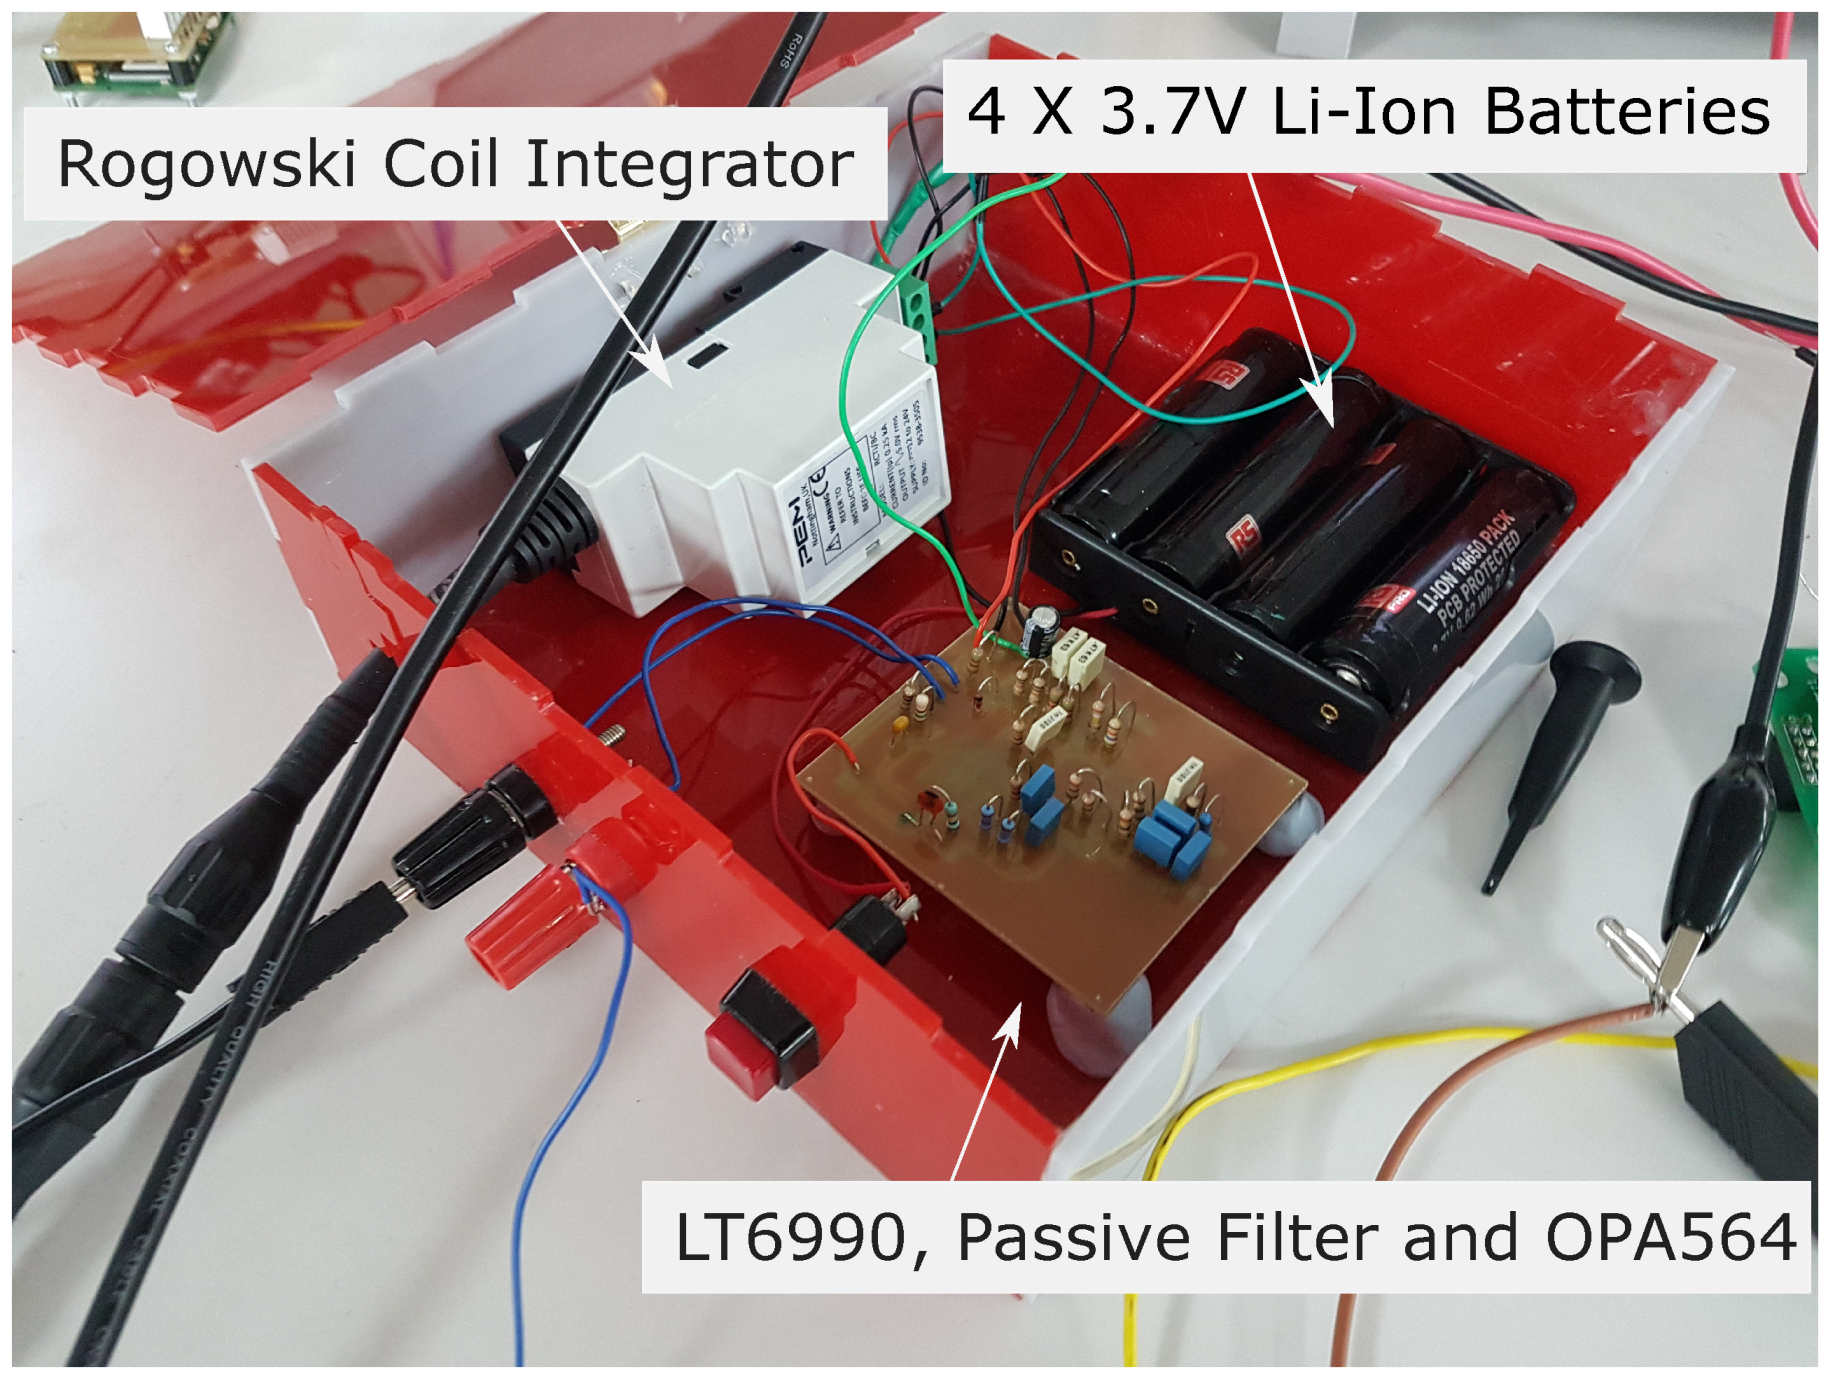
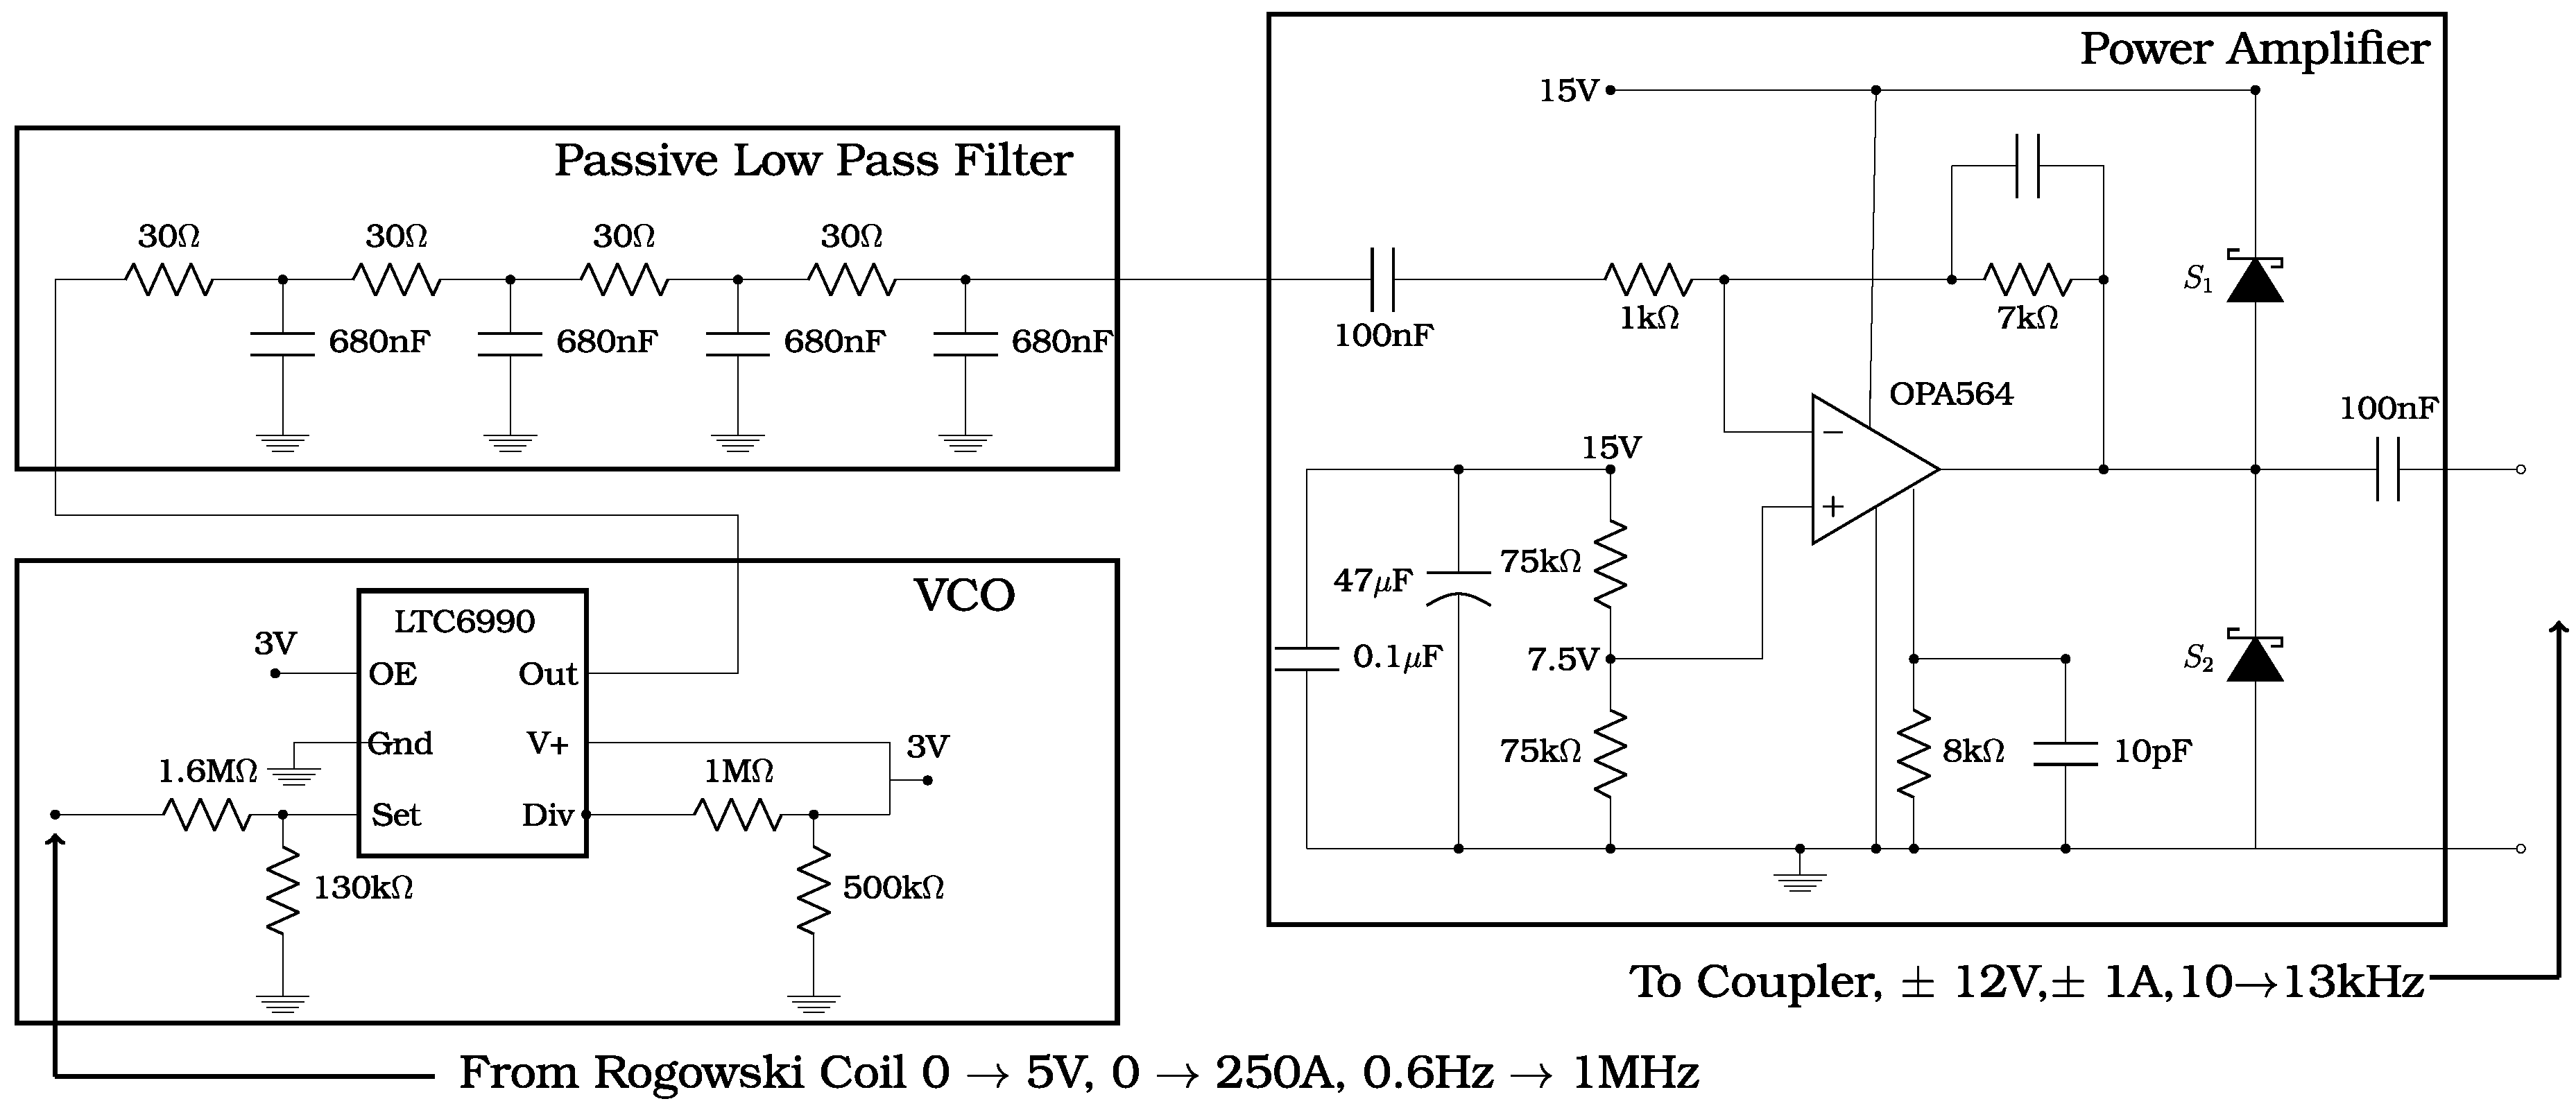
5.1. Build of VCO Transmitter
5.2. Build of FPGA-Based Receiver
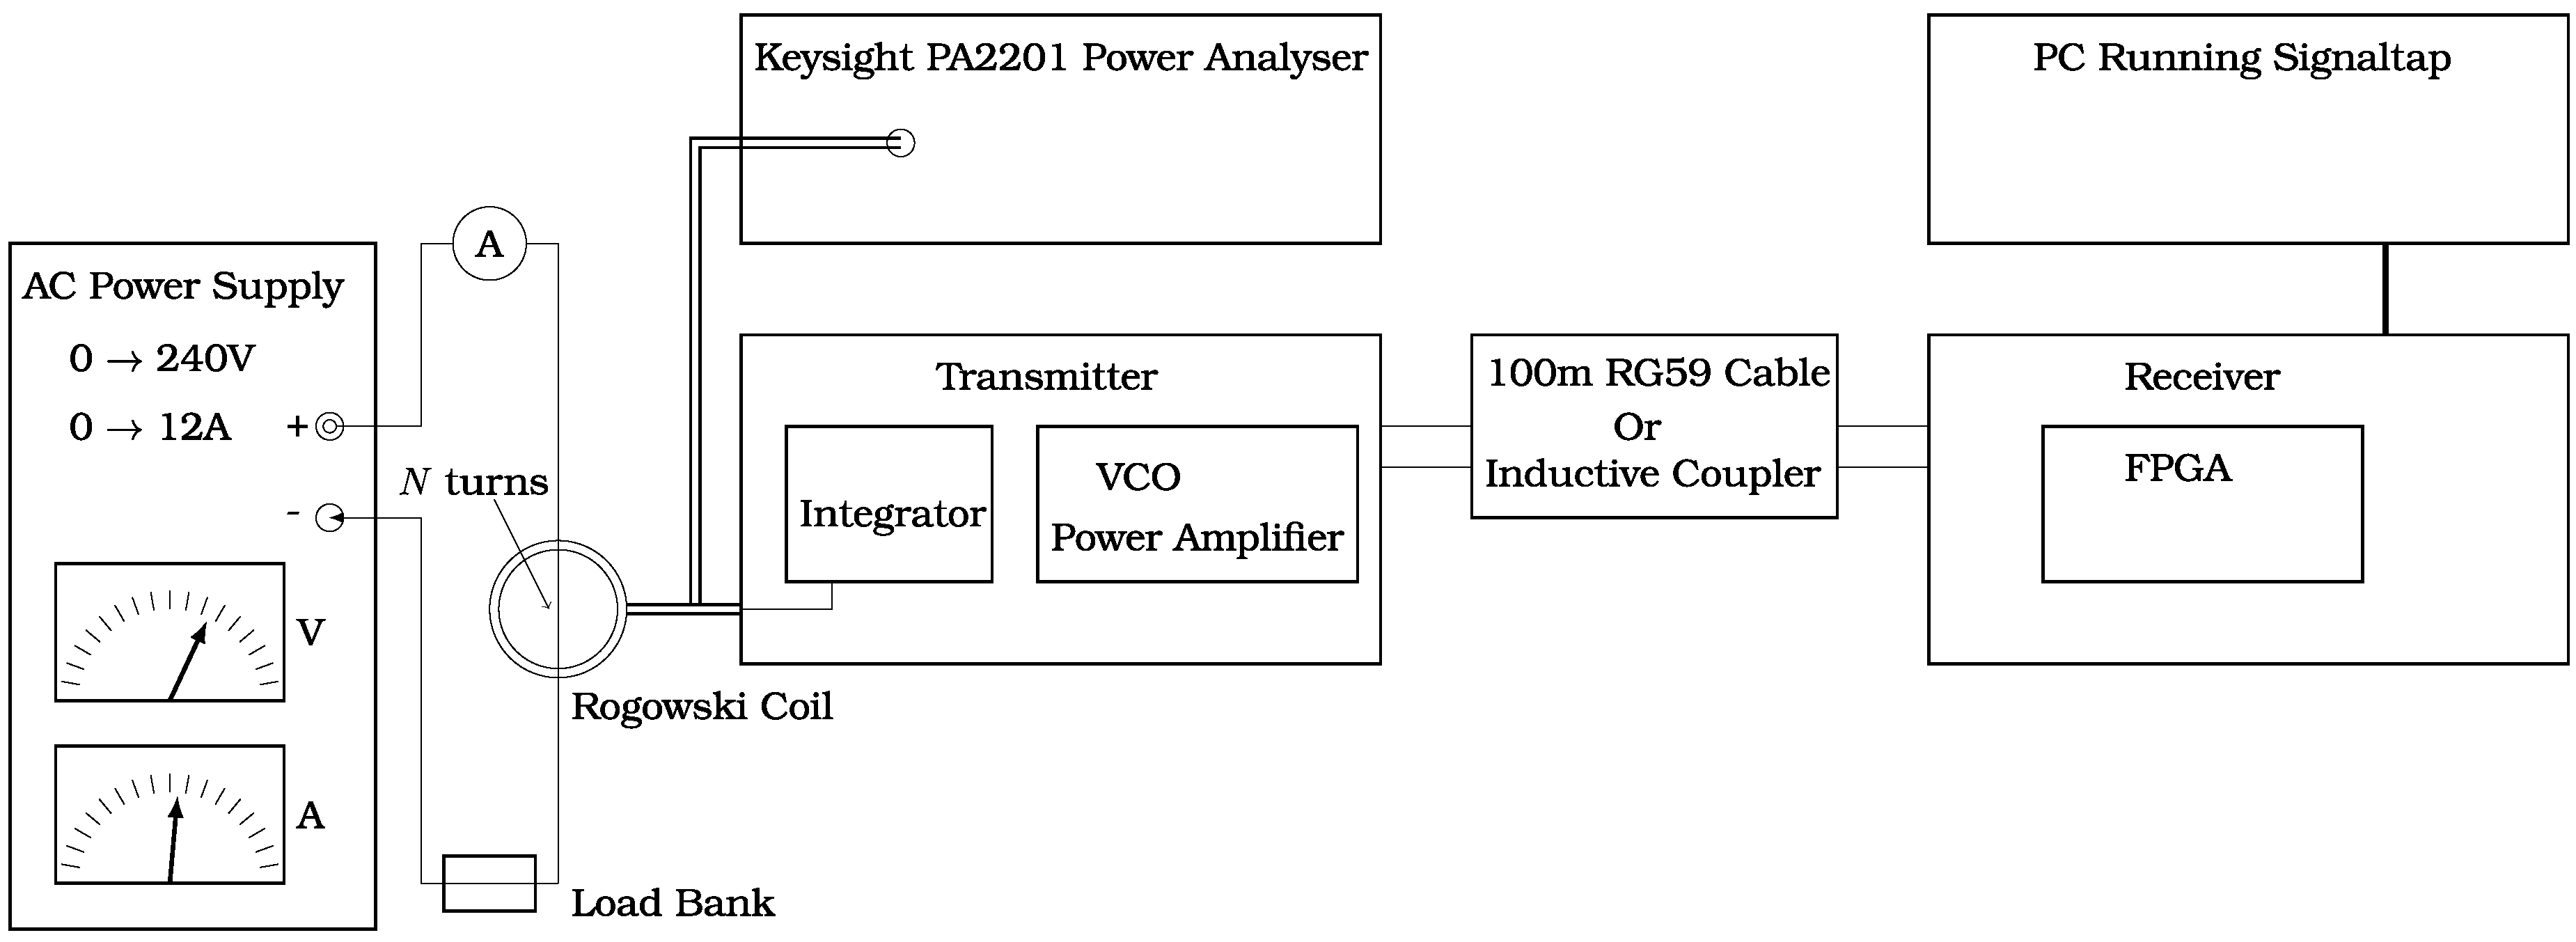
6. Experimental Results
7. Practical Considerations and Future Work
8. Conclusions
Author Contributions
Funding
Conflicts of Interest
Appendix A. Details of the Cable and Line Models Used in the Simulations


Appendix B. EMTP VCO Model

References
- Ree, J.D.L.; Centeno, V.; Thorp, J.S.; Phadke, A.G. Synchronized Phasor Measurement Applications in Power Systems. IEEE Trans. Smart Grid 2010, 1, 20–27. [Google Scholar] [CrossRef]
- Tate, J.E.; Overbye, T.J. Line Outage Detection Using Phasor Angle Measurements. IEEE Trans. Power Syst. 2008, 23, 1644–1652. [Google Scholar] [CrossRef]
- Phadke, A.G. Synchronized phasor measurements in power systems. IEEE Comput. Appl. Power 1993, 6, 10–15. [Google Scholar] [CrossRef]
- Jenkins, N.; Long, C.; Wu, J. An Overview of the Smart Grid in Great Britain. Engineering 2015, 1, 413–421. [Google Scholar] [CrossRef]
- Low Voltage Current Sensor Technology Evaluation. Available online: https://www.westernpower.co.uk/projects/lv-sensors (accessed on 14 February 2019).
- Yang, B.; Katsaros, K.V.; Chai, W.K.; Pavlou, G. Cost-Efficient Low Latency Communication Infrastructure for Synchrophasor Applications in Smart Grids. IEEE Syst. J. 2018, 12, 948–958. [Google Scholar] [CrossRef]
- Aminifar, F.; Fotuhi-Firuzabad, M.; Safdarian, A.; Davoudi, A.; Shahidehpour, M. Synchrophasor Measurement Technology in Power Systems: Panorama and State-of-the-Art. IEEE Access 2014, 2, 1607–1628. [Google Scholar] [CrossRef]
- IEC/IEEE 60255-118-1:2018: IEEE/IEC International Standard—Measuring Relays and Protection Equipment—Part 118-1: Synchrophasor for Power Systems—Measurements. Available online: https://webstore.iec.ch/publication/28722 (accessed on 14 February 2019).
- Factors Affecting PMU Installation Costs, Technical Report. Available online: https://www.smartgrid.gov/files/PMU-cost-study-final-10162014_1.pdf. (accessed on 14 February 2019).
- Overholt, P.; Ortiz, D.; Silverstein, A. Synchrophasor Technology and the DOE: Exciting Opportunities Lie Ahead in Development and Deployment. IEEE Power Energy Mag. 2015, 13, 14–17. [Google Scholar] [CrossRef]
- Gharavi, H.; Hu, B. Scalable Synchrophasors Communication Network Design and Implementation for Real-Time Distributed Generation Grid. IEEE Trans. Smart Grid 2015, 6, 2539–2550. [Google Scholar] [CrossRef]
- Liu, Y.; Zhan, L.; Zhang, Y.; Markham, P.N.; Zhou, D.; Guo, J.; Lei, Y.; Kou, G.; Yao, W.; Chai, J.; et al. Wide-Area-Measurement System Development at the Distribution Level: An FNET/GridEye Example. IEEE Trans. Power Deliv. 2016, 31, 721–731. [Google Scholar] [CrossRef]
- DEDUCE: Determining Electricity Distribution Usage with Consumer Electronics. Available online: https://www.westernpower.co.uk/projects/deduce (accessed on 14 February 2019).
- Tan, G.; Robson, S.; Haddad, A. The Retrieval of Synchrophasors using Chirps. In Proceedings of the 2018 53rd International Universities Power Engineering Conference (UPEC), Glasgow, UK, 4–7 September 2018; pp. 1–6. [Google Scholar] [CrossRef]
- Distribution Network Visibility. Available online: http://innovation.ukpowernetworks.co.uk/innovation/en/Projects/tier-1-projects/distribution-network-visibility/ (accessed on 14 February 2019).
- Zhao, C.; Gu, C.; Li, F.; Dale, M. Understanding LV network voltage distribution- UK smart grid demonstration experience. In Proceedings of the 2015 IEEE Power Energy Society Innovative Smart Grid Technologies Conference (ISGT), Washington DC, USA, 18–20 February 2015; pp. 1–5. [Google Scholar] [CrossRef]
- Lu, S.; Repo, S.; Giustina, D.D.; Figuerola, F.A.; Löf, A.; Pikkarainen, M. Real-Time Low Voltage Network Monitoring—ICT Architecture and Field Test Experience. IEEE Trans. Smart Grid 2015, 6, 2002–2012. [Google Scholar] [CrossRef]
- IEEE Standard for Low-Frequency (Less Than 500 kHz) Narrowband Power Line Communications for Smart Grid Applications. Available online: https://ieeexplore.ieee.org/servlet/opac?punumber=6679208 (accessed on 14 February 2019).
- Berganza, I.; Sendin, A.; Arriola, J. PRIME: Powerline intelligent metering evolution. SmartGrids for Distribution, 2008. IET-CIRED. In Proceedings of the CIRED Seminar, Frankfurt, Germany, 23–24 June 2008; pp. 1–3. [Google Scholar]
- Robson, S.; Haddad, A.; Griffiths, H. Implementation of the Prime and G3-PLC Physical Layers in the EMTP-ATP. In Proceedings of the 2018 53rd International Universities Power Engineering Conference (UPEC), Glasgow, UK, 4–7 September 2018; pp. 1–6. [Google Scholar] [CrossRef]
- Robson, S.; Haddad, A.; Griffiths, H. A New Methodology for Network Scale Simulation of Emerging Power Line Communication Standards. IEEE Trans. Power Deliv. 2018, 33, 1025–1034. [Google Scholar] [CrossRef]
- Robson, A.; Haddad, S.; Griffiths, H. Simulation of Power Line Communication using ATP-EMTP and MATLAB. In Proceedings of the IEEE PES Conference on Innovative Smart Grid Technologies Europe, Gothenburg, Sweden, 11–13 October 2010; pp. 1–8. [Google Scholar] [CrossRef]
- Robson, S.; Griffiths, H.; Haddad, A. Narrowband Power Line Communications: Channel characteristics and modulation. In Proceedings of the 45th International Universities Power Engineering Conference UPEC 2010, Cardiff, UK, 31 August–3 September 2010; pp. 1–6. [Google Scholar]
- Artale, G.; Cataliotti, A.; Cosentino, V.; Cara, D.D.; Fiorelli, R.; Guaiana, S.; Tinè, G. A New Low Cost Coupling System for Power Line Communication on Medium Voltage Smart Grids. IEEE Trans. Smart Grid 2018, 9, 3321–3329. [Google Scholar] [CrossRef]
- Marti, J. Accurate Modelling of Frequency-Dependent Transmission Lines in Electromagnetic Transient Simulations. IEEE Trans. Power Apparatus Syst. 1982, PAS-101, 147–157. [Google Scholar] [CrossRef]
- Artale, G.; Cataliotti, A.; Cosentino, V.; Di Cara, D.; Fiorelli, R.; Russotto, P.; Tine, G. Medium Voltage Smart Grid: Experimental Analysis of Secondary Substation Narrow Band Power Line Communication. IEEE Trans. Instrum. Meas. 2013, 62, 2391–2398. [Google Scholar] [CrossRef]
- Xiaoxian, Y.; Tao, Z.; Baohui, Z.; Xu, N.H.; Guojun, W.; Jiandong, D. Investigation of Transmission Properties on 10-kV Medium Voltage Power Lines; Part I: General Properties. IEEE Trans. Power Deliv. 2007, 22, 1446–1454. [Google Scholar] [CrossRef]
- Harid, N.; Bogias, A.C.; Griffiths, H.; Robson, S.; Haddad, A. A Wireless System for Monitoring Leakage Current in Electrical Substation Equipment. IEEE Access 2016, 4, 2965–2975. [Google Scholar] [CrossRef]
- Robson, S.; Haddad, A.; Griffiths, H. Fault Location on Branched Networks Using a Multiended Approach. IEEE Trans. Power Deliv. 2014, 29, 1955–1963. [Google Scholar] [CrossRef]
- Robson, S.; Haddad, A.; Griffiths, H. Traveling Wave Fault Location Using Layer Peeling. Energies 2018, 12. [Google Scholar] [CrossRef]


| Magnitude | FM Properties | Phase | |||||||
|---|---|---|---|---|---|---|---|---|---|
| Node | Received | Actual | Error (%) | ∠ Node | Received | Actual | Error (%) | ||
| VB1 | 984.12 V | 984.77 V | −0.07 | 15 kHz | 1.547 | ∠B1 | 3.55 | 2.81 | −20.7 |
| IB1 | 393.38 A | 392.47 A | 0.23 | 19 kHz | 0.616 | ||||
| VB2 | 984.12 V | 984.77 V | −0.07 | 23 kHz | 1.547 | ∠B2 | 2.52 | 3.64 | −30.77 |
| IB2 | 196.22 | 196.09 | 0.07 | 27 kHz | 0.308 | ||||
| VB3 | 982.59 V | 982.95 V | −0.15 | 31 kHz | 1.544 | ∠B3 | 1.68 | 1.82 | 8.33 |
| IB3 | 98.22 | 98.22 | 0.003 | 35 kHz | 0.154 | ||||
| VC1 | 966.49 V | 966.04 V | 0.05 | 39 kHz | 1.517 | ∠C1 | 18.54 | 17.44 | −5.93 |
| IC1 | 92.91 A | 92.16 A | 0.81 | 43 kHz | 0.145 | ||||
| VC2 | 966.71 V | 965.38 V | 0.14 | 47 kHz | 1.516 | ∠C2 | 6.19 | 6.04 | −2.42 |
| IC2 | 320.29 | 319.63 | 0.138 | 51 kHz | 0.502 | ||||
| VD1 | 938.56 V | 936.47 V | 0.22 | 55 kHz | 1.471 | ∠D1 | 17.26 | 17.44 | 1.04 |
| ID1 | 892.54 | 893.40 | −0.098 | 59 kHz | 1.403 | ||||
| VD2 | 939.91 V | 939.77 V | 0.015 | 63 kHz | 1.471 | ∠D2 | 17.61 | 17.44 | −0.96 |
| ID2 | 897.19 | 896.55 | 0.07 | 67 kHz | 1.408 | ||||
| VE1 | 929.81 V | 930.38 V | −0.06 | 71 kHz | 1.461 | ∠E1 | 26.35 | 17.61 | 33.18 |
| IE1 | 879.31 | 882.60 | −0.37 | 75 kHz | 1.386 | ||||
| VE2 | 939.91 V | 939.77 V | −0.06 | 79 kHz | 1.476 | ∠E2 | 17.65 | 17.68 | 0.17 |
| IE2 | 1769.22 | 1768.32 | 0.05 | 83 kHz | 2.778 | ||||
| Board | Cyclone V GX Starter Kit |
| FPGA Family | Cyclone V |
| Device | 5CGXFC5C6F27C7 |
| Logic Utilization (in ALMs) | 20,669/29,080 (71%) |
| Total Registers | 35,899 |
| Total Pins | 12/364 (3%) |
| Total block memory bits | 2,333,840/4,567,040 (51%) |
| Total DSP Blocks | 92/150 ( 61% ) |
| PLLs | 1/12 (8%) |
| Power Analysis Block Usage | 4782 ALMs |
| Hilbert Transform Block Usage | 12,747 ALMs |
© 2019 by the authors. Licensee MDPI, Basel, Switzerland. This article is an open access article distributed under the terms and conditions of the Creative Commons Attribution (CC BY) license (http://creativecommons.org/licenses/by/4.0/).
Share and Cite
Robson, S.; Tan, G.; Haddad, A. Low-Cost Monitoring of Synchrophasors Using Frequency Modulation. Energies 2019, 12, 611. https://doi.org/10.3390/en12040611
Robson S, Tan G, Haddad A. Low-Cost Monitoring of Synchrophasors Using Frequency Modulation. Energies. 2019; 12(4):611. https://doi.org/10.3390/en12040611
Chicago/Turabian StyleRobson, Stephen, Gan Tan, and Abderrahmane Haddad. 2019. "Low-Cost Monitoring of Synchrophasors Using Frequency Modulation" Energies 12, no. 4: 611. https://doi.org/10.3390/en12040611
APA StyleRobson, S., Tan, G., & Haddad, A. (2019). Low-Cost Monitoring of Synchrophasors Using Frequency Modulation. Energies, 12(4), 611. https://doi.org/10.3390/en12040611