5.1. Emission Abatement
The CO
2 capture ratio, the CO
2 avoided from the flue gas, and the equivalent CO
2 avoided evaluate the effect that the implementation of a capture technology has on the CO
2 emissions of a plant. These KPIs calculated for the investigated technologies and the reference technology are given in
Table 14.
The CCR of all technologies range between 90% and 95%, and the CO2 avoided from the flue gas range between 90 and 93%. For the MEA, CAP, and MAL technologies, the CO2 avoided from flue gas is by definition equal to the CCR, since there is no change in internal fuel combustion generating CO2 within the kiln or the capture process when these technologies are installed. For the oxyfuel technology the value is approximately the same as the CCR—the specific fuel consumption changes in the oxyfuel technology compared to the standard reference kiln, but the change is very small. For the calcium looping technology, the CO2 avoided from the flue gas is lower than the CCR, because the capture of CO2 generated by fuel combustion within the calciner is not counted as CO2 avoided.
The equivalent CO2 avoided of all technologies range between 64% and 90%. With this KPI all direct emissions at the plant, as well as indirect emissions related to power consumption or generation are taken into account. This value is lower than the CO2 avoided for all technologies due to the contribution of direct emissions from steam generation and indirect emissions associated to power import.
All the investigated technologies have equivalent CO2 avoided in the range 73–90%, which is higher than the reference technology MEA with 64%. The CaL technologies end up with the highest equivalent CO2 avoided. These technologies have no additional direct emissions as most of the CO2 from the additional coal combustion is captured, and negative or low added indirect CO2 emissions thanks to the internal power production.
5.2. Energy Performance
The energy inputs of the reference cement plant without and with CO
2 capture are in the form of coal, natural gas, and power. For some CO
2 capture technologies power is also generated on-site. A summary of the energy inputs is given in
Table 15.
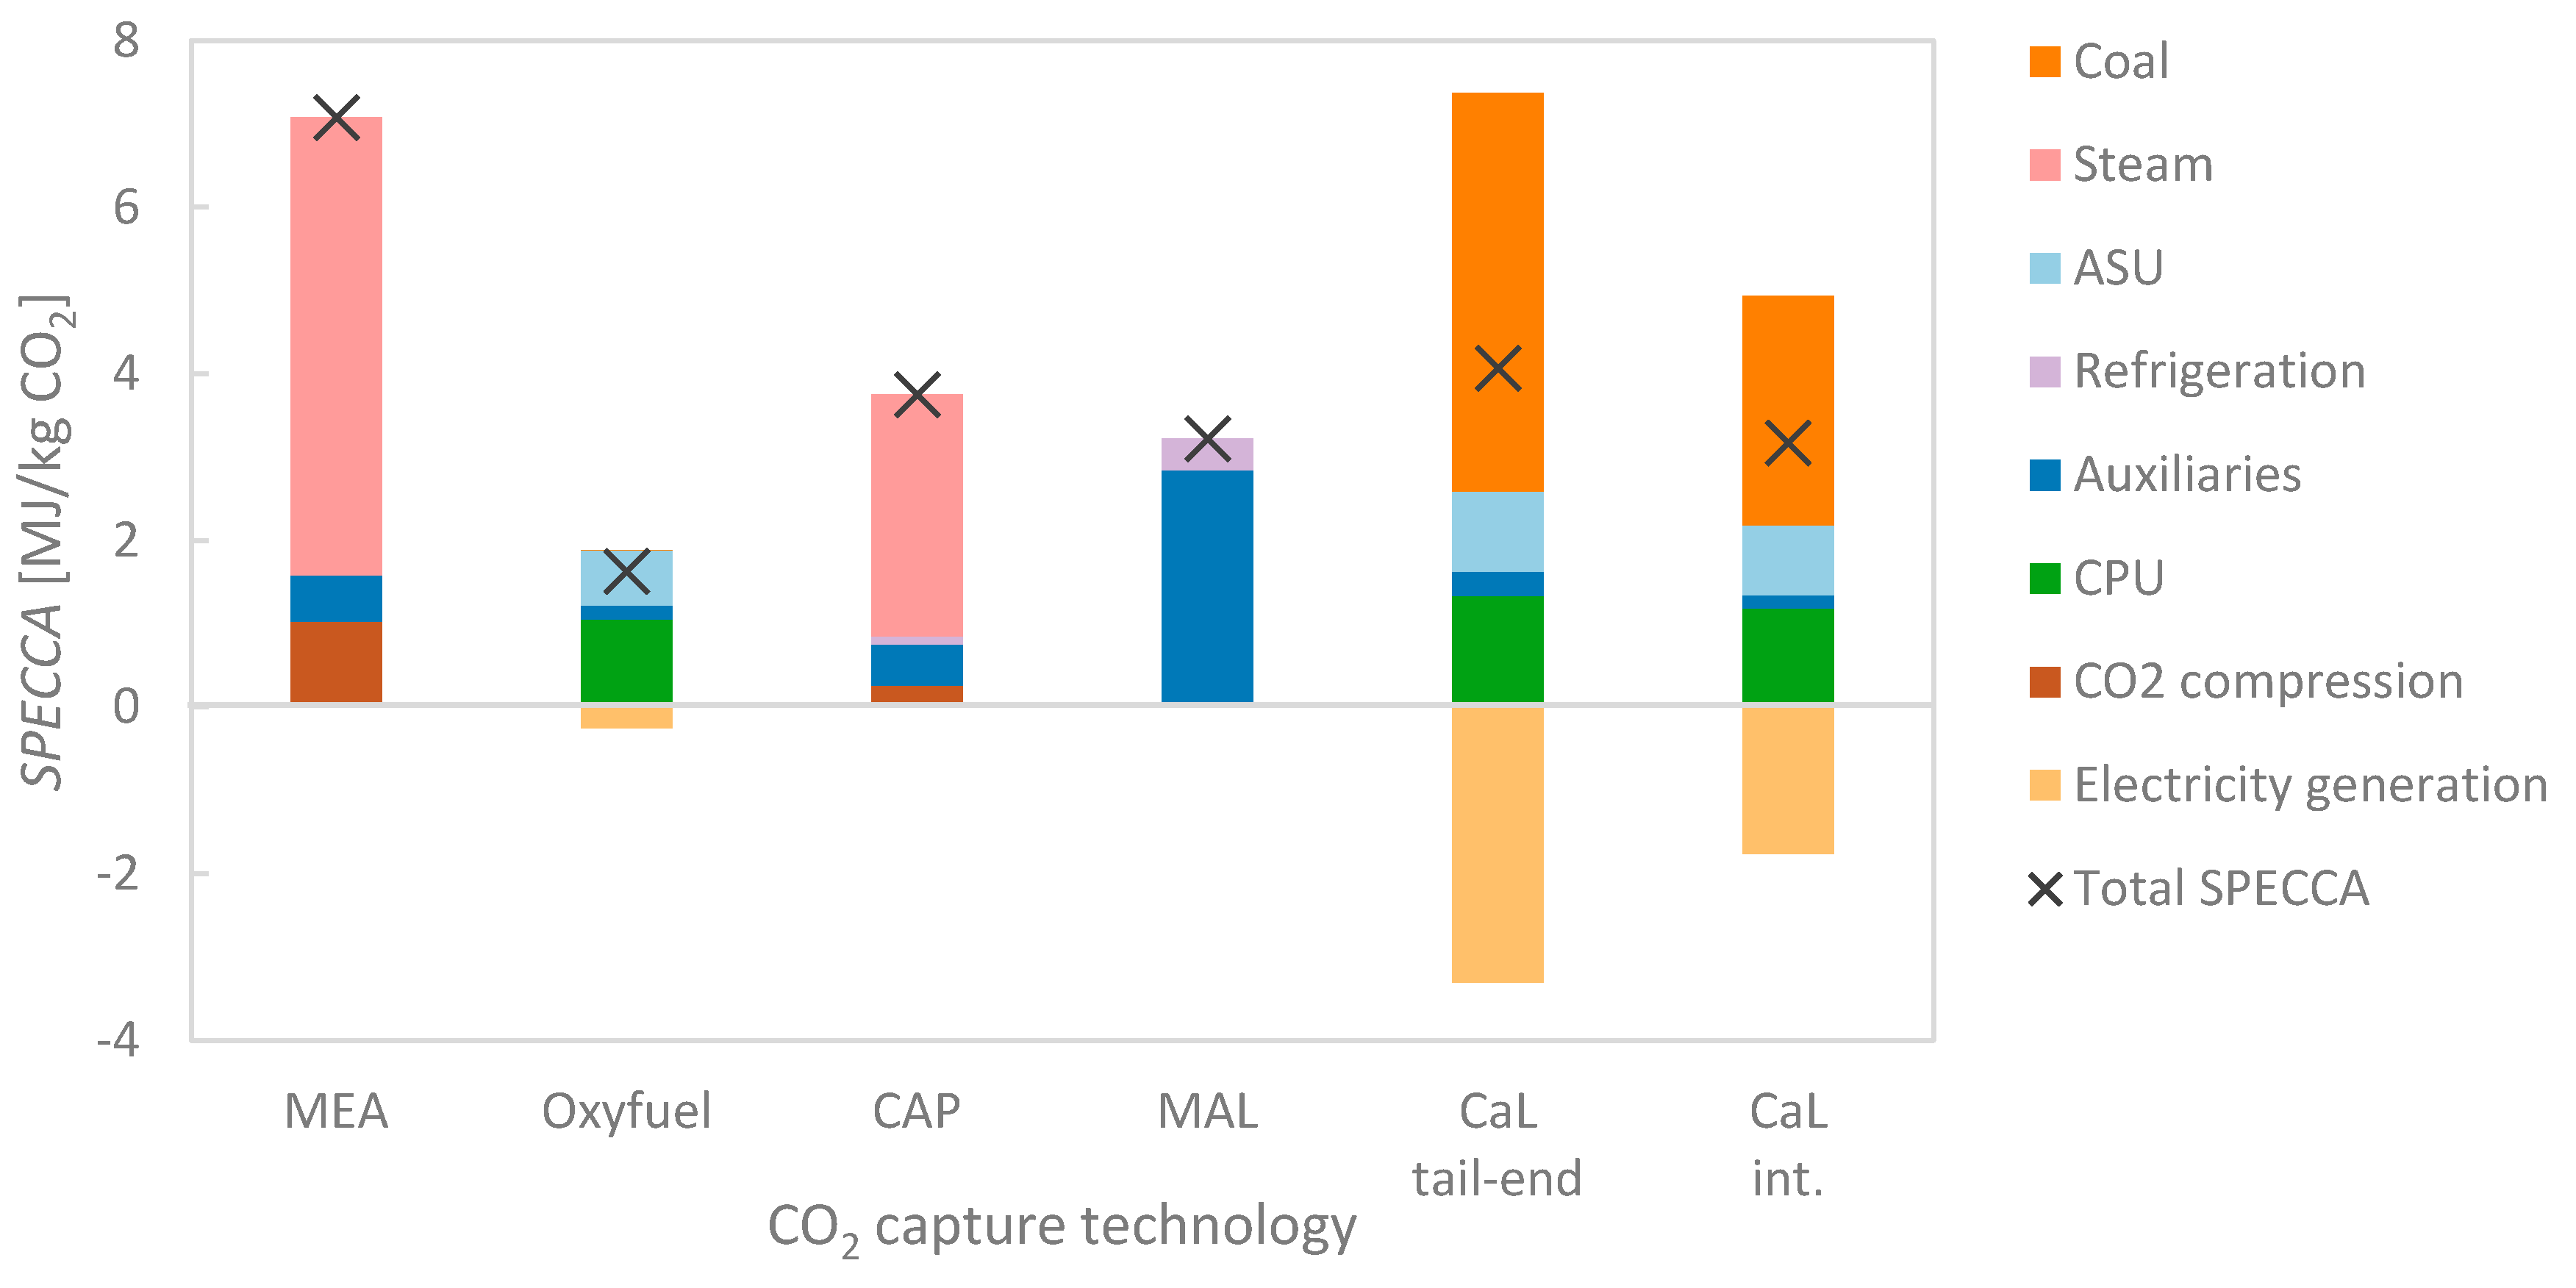
The specific primary energy consumption for CO
2 avoided of the technologies are presented in
Figure 15 and
Table 16. All the investigated technologies have clearly lower SPECCA values than the reference technology. The oxyfuel technology has a SPECCA of 1.63 MJ/kg CO
2, which is the lowest value among the SPECCA values of the investigated technologies. The chilled ammonia and membrane-assisted liquefaction technologies have SPECCA values of 3.75 and 3.22 MJ/kg CO
2 respectively, while the calcium looping tail-end and integrated technologies have SPECCA values of 4.07 and 3.17 MJ/kg CO
2.
The most important contributions to the SPECCA differ among the technologies. For the MEA technology the primary energy consumption related to the steam required in the process is responsible for the largest part of the added equivalent primary energy consumption and reduction in equivalent CO2 avoided. For the oxyfuel technology, the added equivalent primary energy consumption and reduction in equivalent CO2 avoided are almost entirely due to the increased electric power consumption. The CPU is the largest power consumer, followed by the ASU and the fans. Electric power generation from waste heat reduces the net power consumption by almost one fifth. For the chilled ammonia process, the steam consumption makes up the largest part of the primary energy consumption and reduction in equivalent CO2 avoided. The steam consumption makes up around three-quarters of these values, while the electric power consumption is responsible for the rest. For the membrane-assisted CO2 liquefaction process, electric power consumption is responsible for all added equivalent primary energy consumption and reduction in equivalent CO2 avoided, where around four-fifths are due to fan, pump and compressor work in the process, and the rest is mainly due to the refrigeration system. For both calcium looping processes, coal consumption, electric power consumption and electric power generation are important for the final SPECCA value. The considerable electric power generation is especially important for the tail-end technology as it contributes to a reduction in both added equivalent specific primary energy consumption and equivalent specific CO2 avoided. This essentially means that the electricity generated covers a part of the cement plant’s demand as well as the demand of the CO2 capture process, resulting in lower electric power consumption per unit of clinker produced.
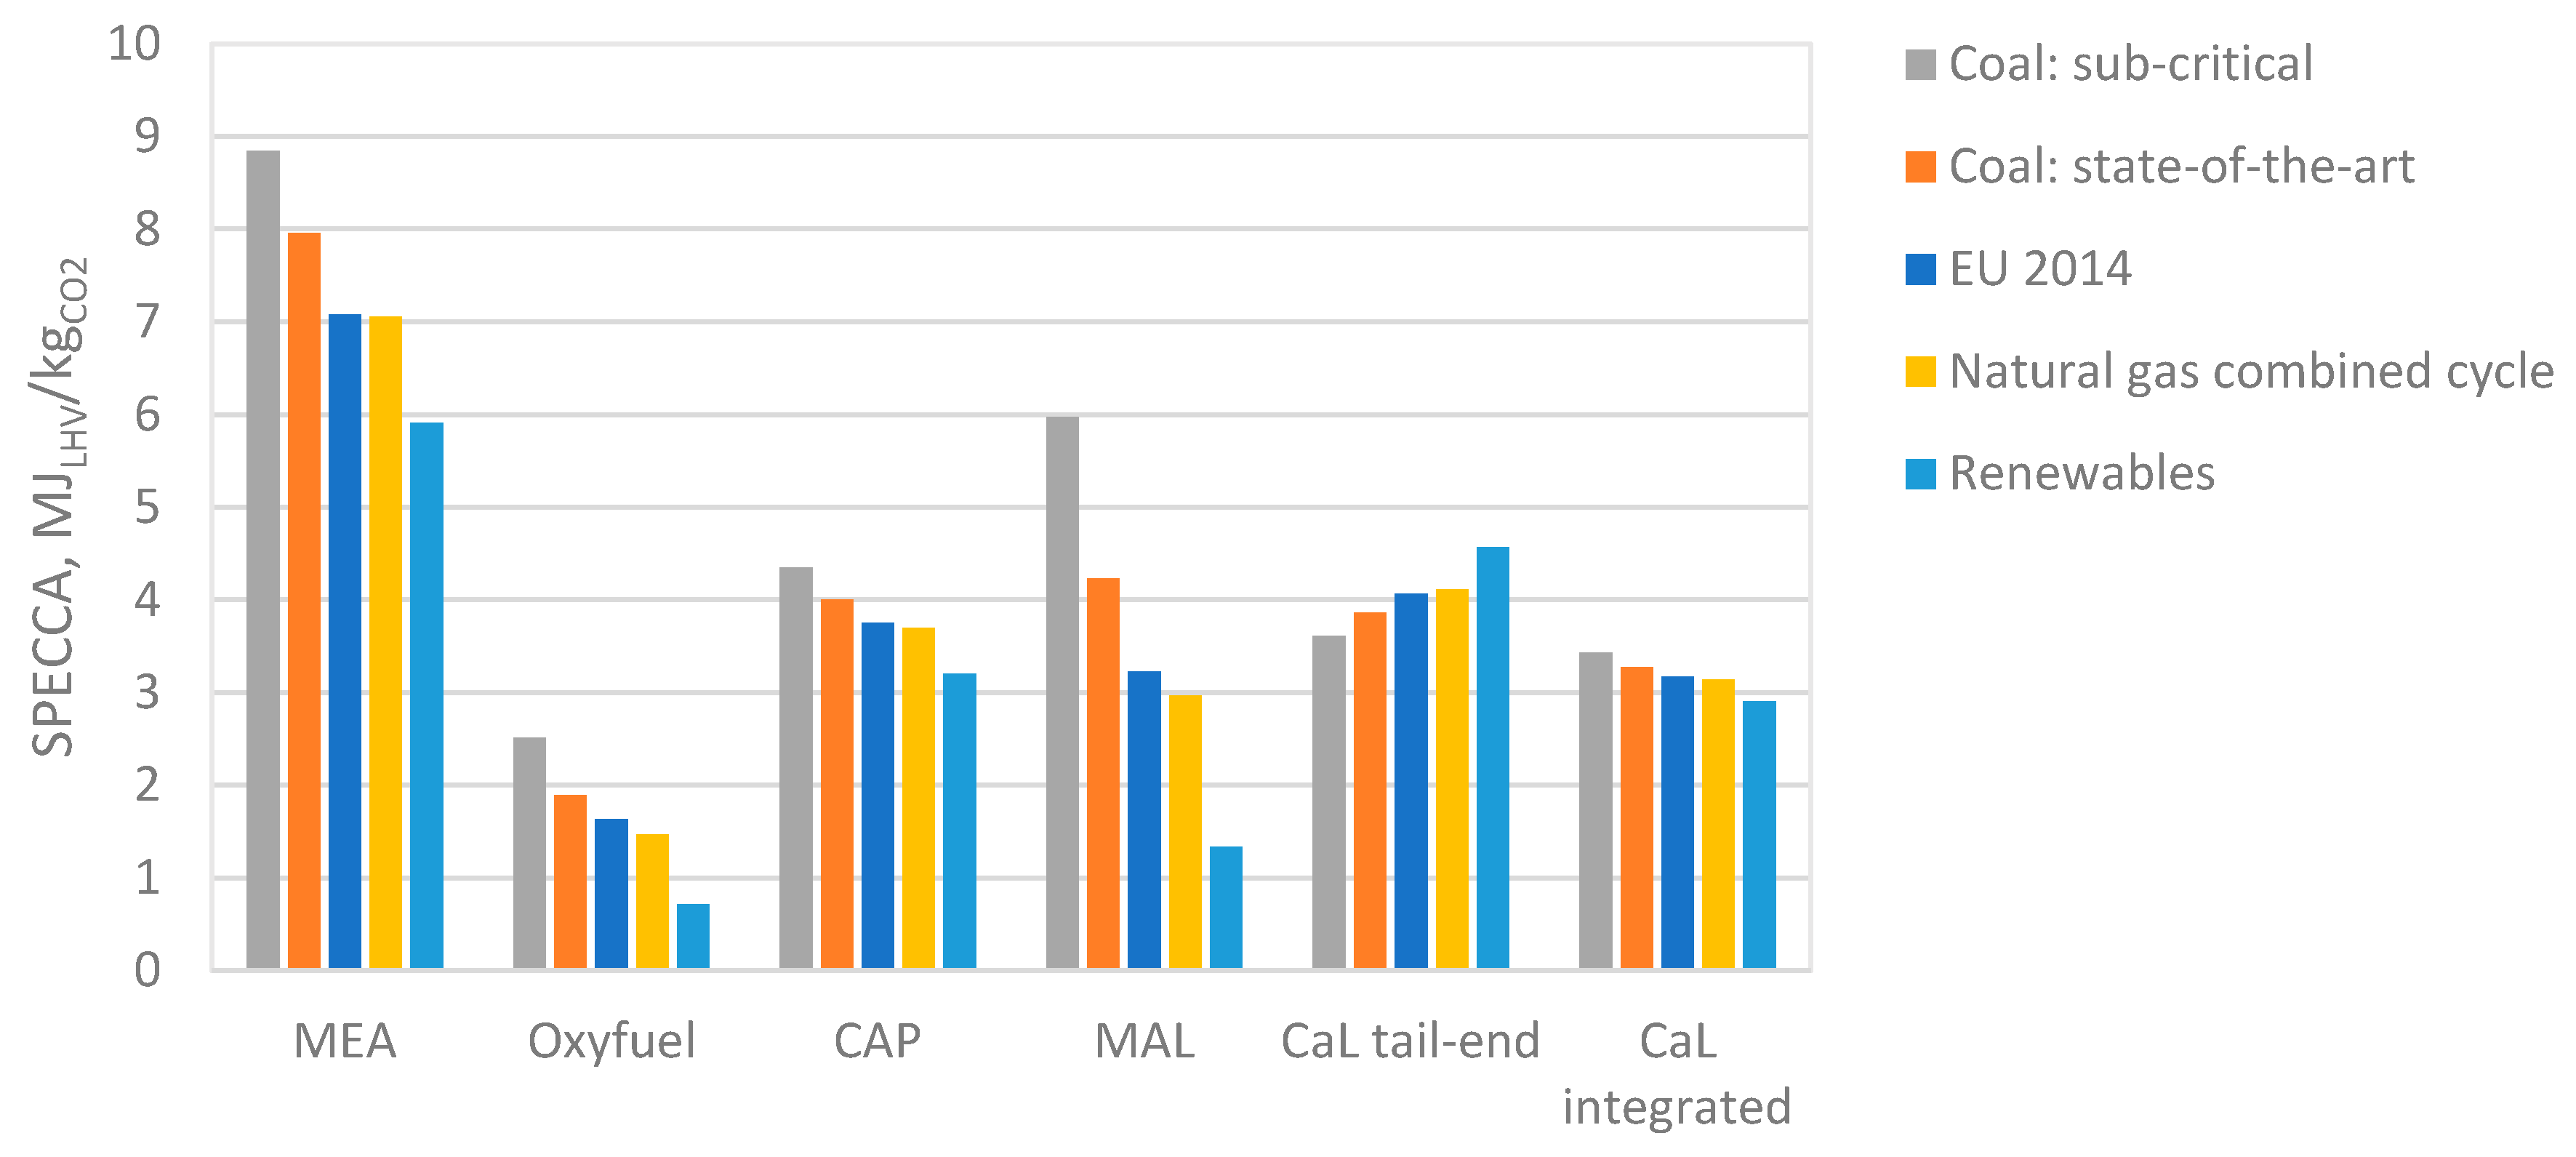
The characteristics of the power generation system in terms of electricity generation efficiency, , and the specific CO2 emissions of the electricity generation, , have an impact on the SPECCA. The generation efficiency and specific CO2 emissions are directly linked to the power generation technology that is assumed to provide the electricity required by the processes.
To investigate the impact of the values of
and
, SPECCA values are calculated with several different options for power generation. The average electricity mix in EU-28 in 2014 is used as basis in the calculations. The alternative cases are summarized in
Table 4, and the results are shown in
Figure 16. For the calcium looping tail-end technology, the SPECCA increases with increasing electricity generation efficiency and decreasing specific CO
2 emissions, while the opposite is observed for all the other CO
2 capture technologies. This is because the CaL tail-end technology generates enough electricity to cover both its own demand and a part of the electricity demand of the cement plant, effectively substituting some of the electricity that was bought from the grid in the reference cement plant. With increasing generation efficiency of the power system and a decrease in the associated specific CO
2 emissions, the reduction in indirect added equivalent specific primary energy consumption becomes smaller, as well as the indirect avoided equivalent specific CO
2 emissions.
For oxyfuel and MAL technologies, where the main added energy input is in the form of electric power, the SPECCA value is highly dependent on the characteristics of the power generation system. In the case of electricity being solely generated from renewables, the SPECCA is reduced by more than half compared to the EU 2014. On the other hand, the SPECCA of the MAL technology is almost doubled in the worst case of electricity generation from sub-critical pulverized coal plants. The SPECCA values of the MEA and CAP technologies are also significantly affected by the different power generation cases.
As mentioned, the generation of steam is responsible for the largest part of the added primary energy consumption and equivalent CO
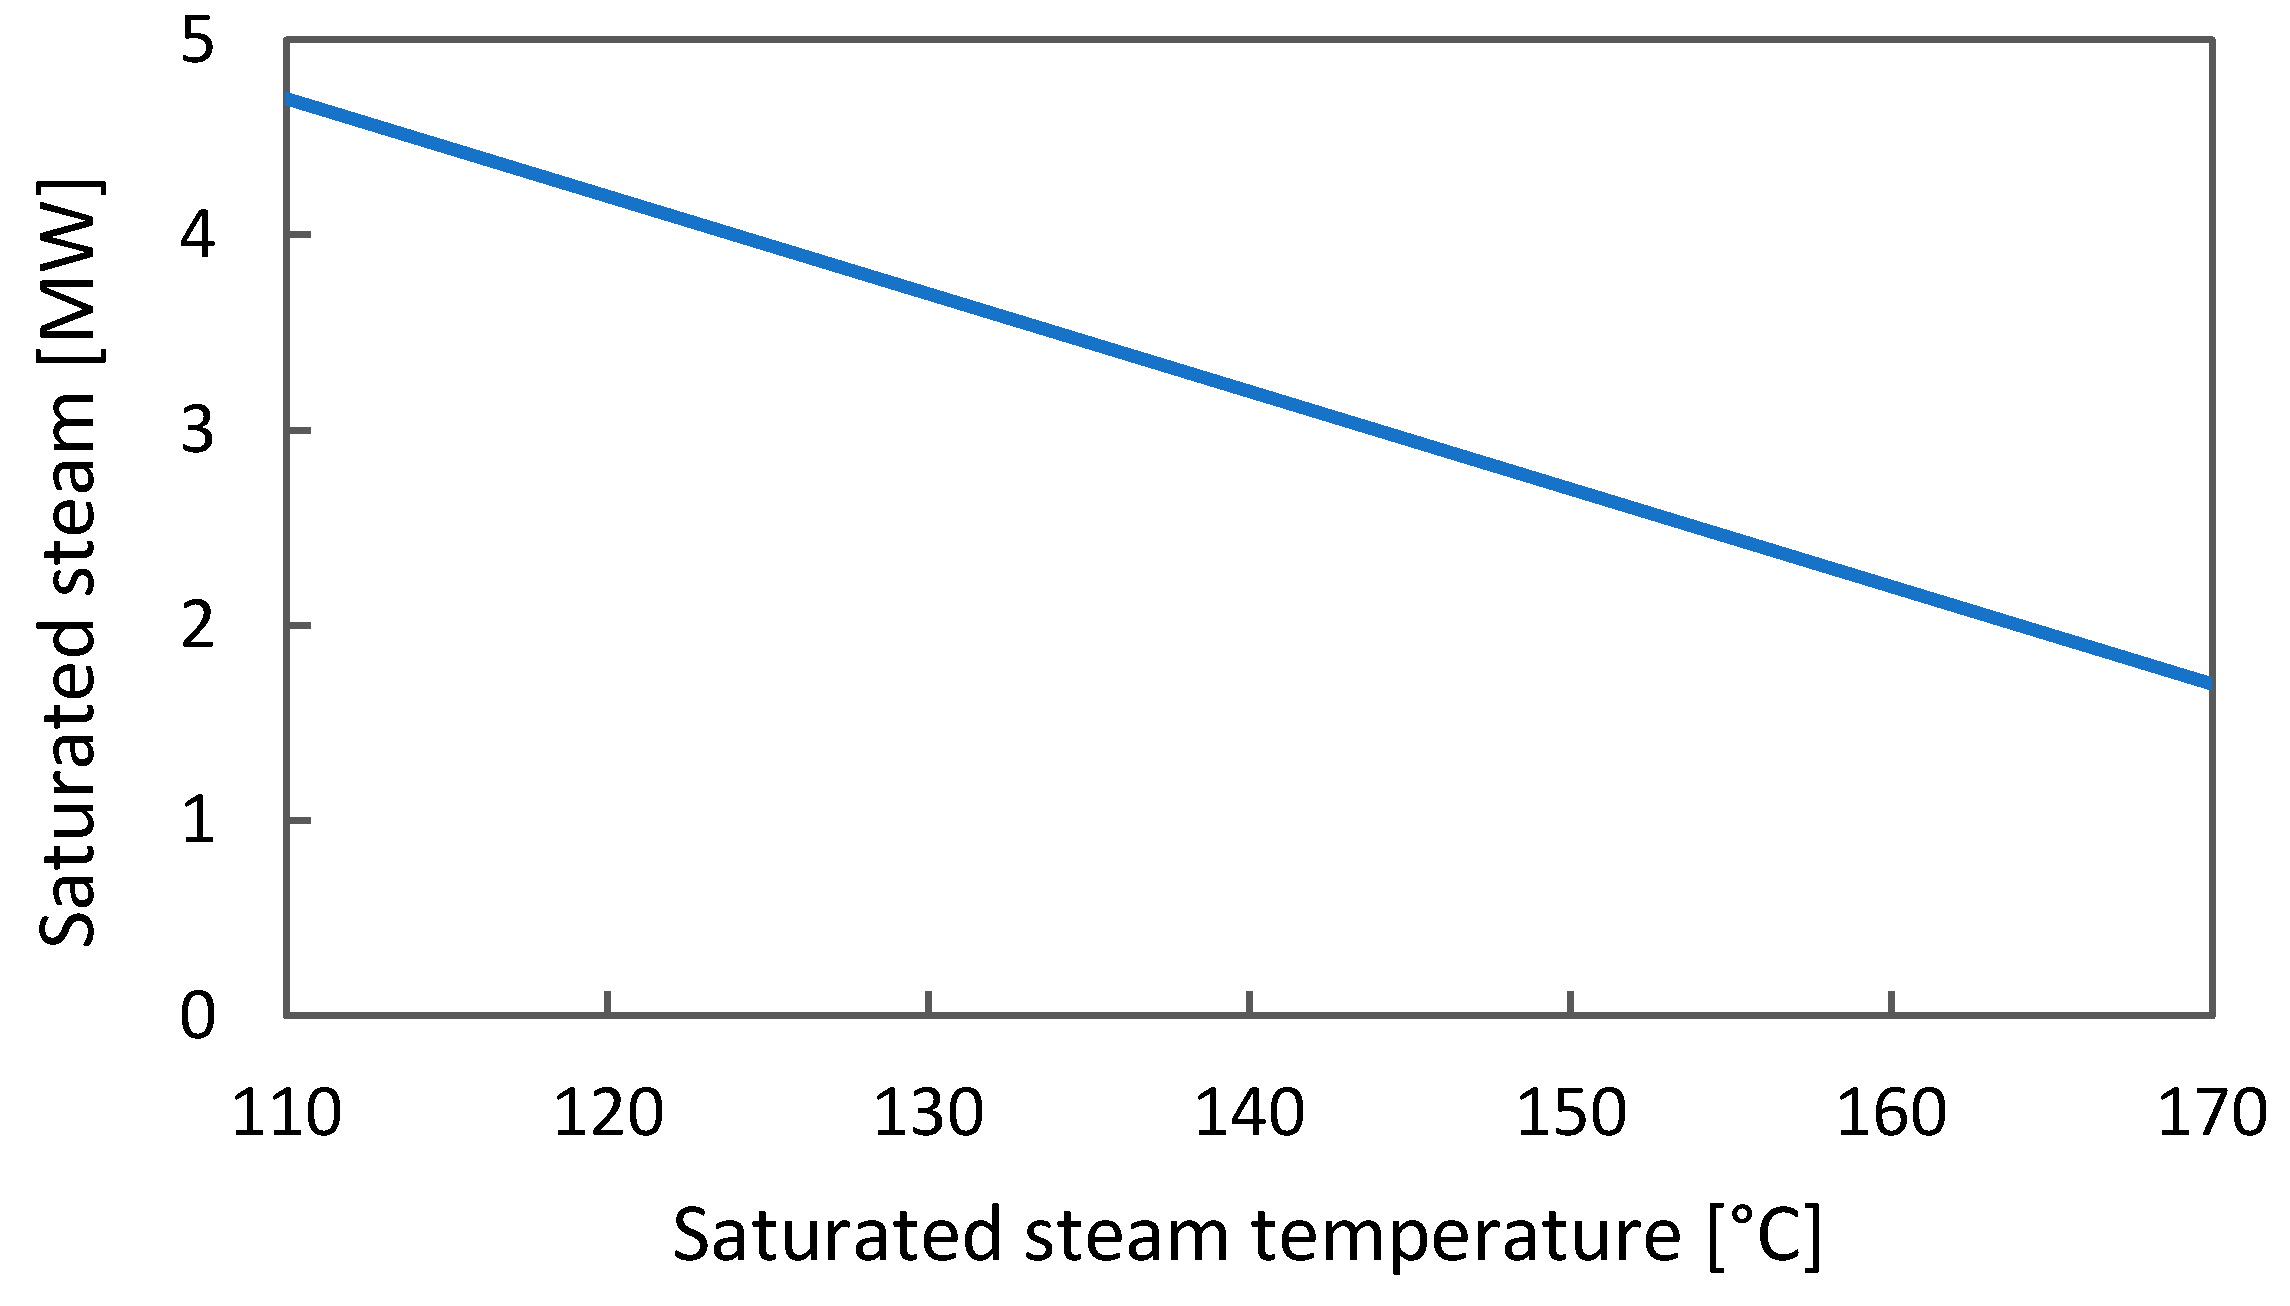
2 emissions for the absorption-based technologies, MEA and CAP. The SPECCA is therefore largely dependent on amount of waste heat available at the plant, and the selected strategy for steam supply. One alternative to steam generation in NG fired boilers is steam import from a coal fired combined heat and power (CHP) plant. The associated primary energy consumption can be assumed to be 0.34-0.68 MW
th/MW
th and the associated CO
2 emissions 116-231 kg/MWh
th for steam temperatures in the range 100-160 °C, considering a conversion efficiency for coal to power without steam extraction of 39.1% and a conversion efficiency for steam to power of 13.3-26.6% for steam in this temperature range [
24]. The energy consumption and CO
2 emissions of the CHP plant are partly assigned to the generated steam and partly to the generated electric power. The SPECCA is reduced with 47% for MEA and 35% for CAP in this case, but it should be mentioned that few cement plants are located close to a power plant.
It is assumed in this study that cooling water is supplied by a cooling tower, that requires power for fans and water pumping, and delivers cooling water at 18 °C. If the cooling could be performed with water from the sea or a river, less power consumption would be required by the cooling system itself, and the cooling water could in many cases be delivered at lower temperature levels. This would benefit all the technologies slightly.
5.3. Retrofitability
The overall retrofitability assessment of the technologies is shown in
Table 17, and more detailed reasoning is given in the following subsections. In general, it can be noted that the post-combustion technologies are easier to retrofit, while the integrated technologies are more challenging.
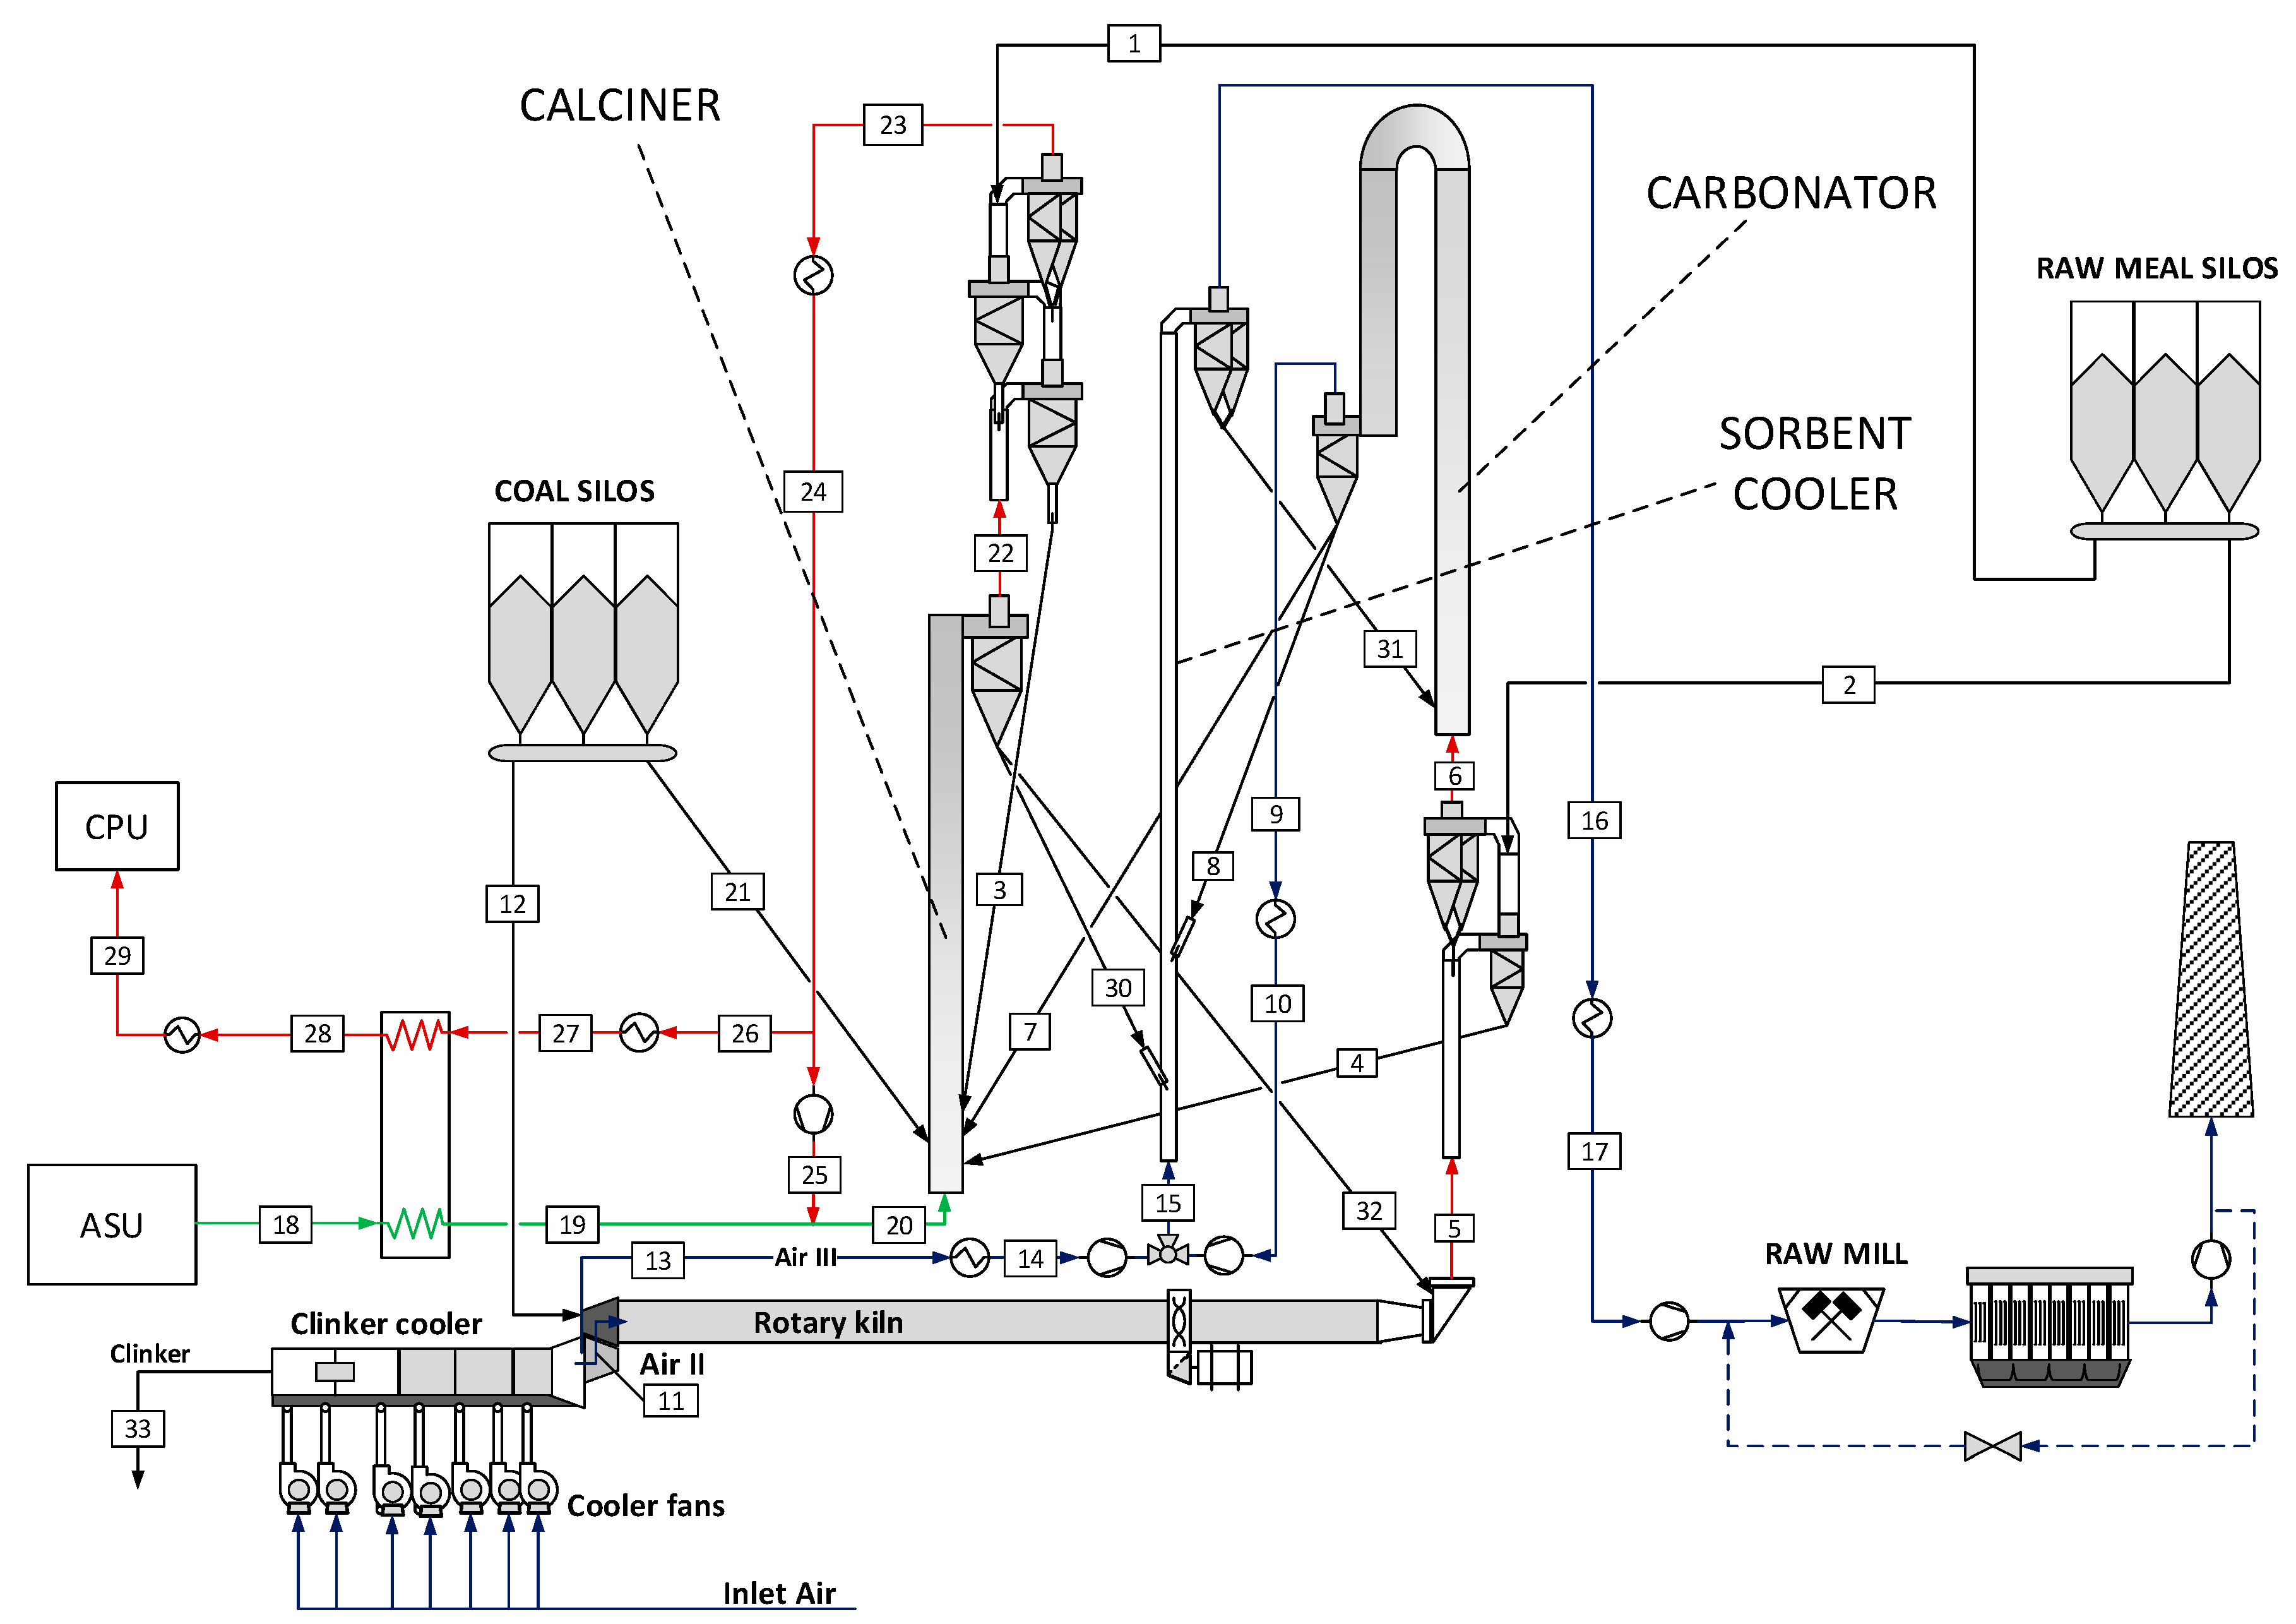
5.3.1. Impact on the Cement Production Process
The application of post-combustion technologies does not affect the actual clinker burning process or the clinker quality, as they can be installed as independent units that flue gas is sent to before the stack. During the construction phase, only a short stop of the clinker production would be required for the rerouting of the flue gas. This rerouting can be performed during the yearly maintenance period when the plant is shut down and does therefore not need to affect the operability of the plant. The tail-end CaL process is slightly integrated with the cement kiln since sorbent purge is ground and used as raw meal in the kiln. However, this does not include any risk for the plant operability or the clinker quality. Therefore, all post-combustion technologies are marked green.
The oxyfuel and the integrated CaL processes require significant modification of the production process. As a result, potential operational problems due to the capture technology can directly affect the operability of the plant. There is also an increased risk related to the quality of the produced clinker [
53]. In theory changes of the gas atmosphere, of gas temperatures, and other process conditions can be managed so that optimum clinker production still can be achieved, but this remains to be proven. A long production stop is required during the construction phase for both these technologies.
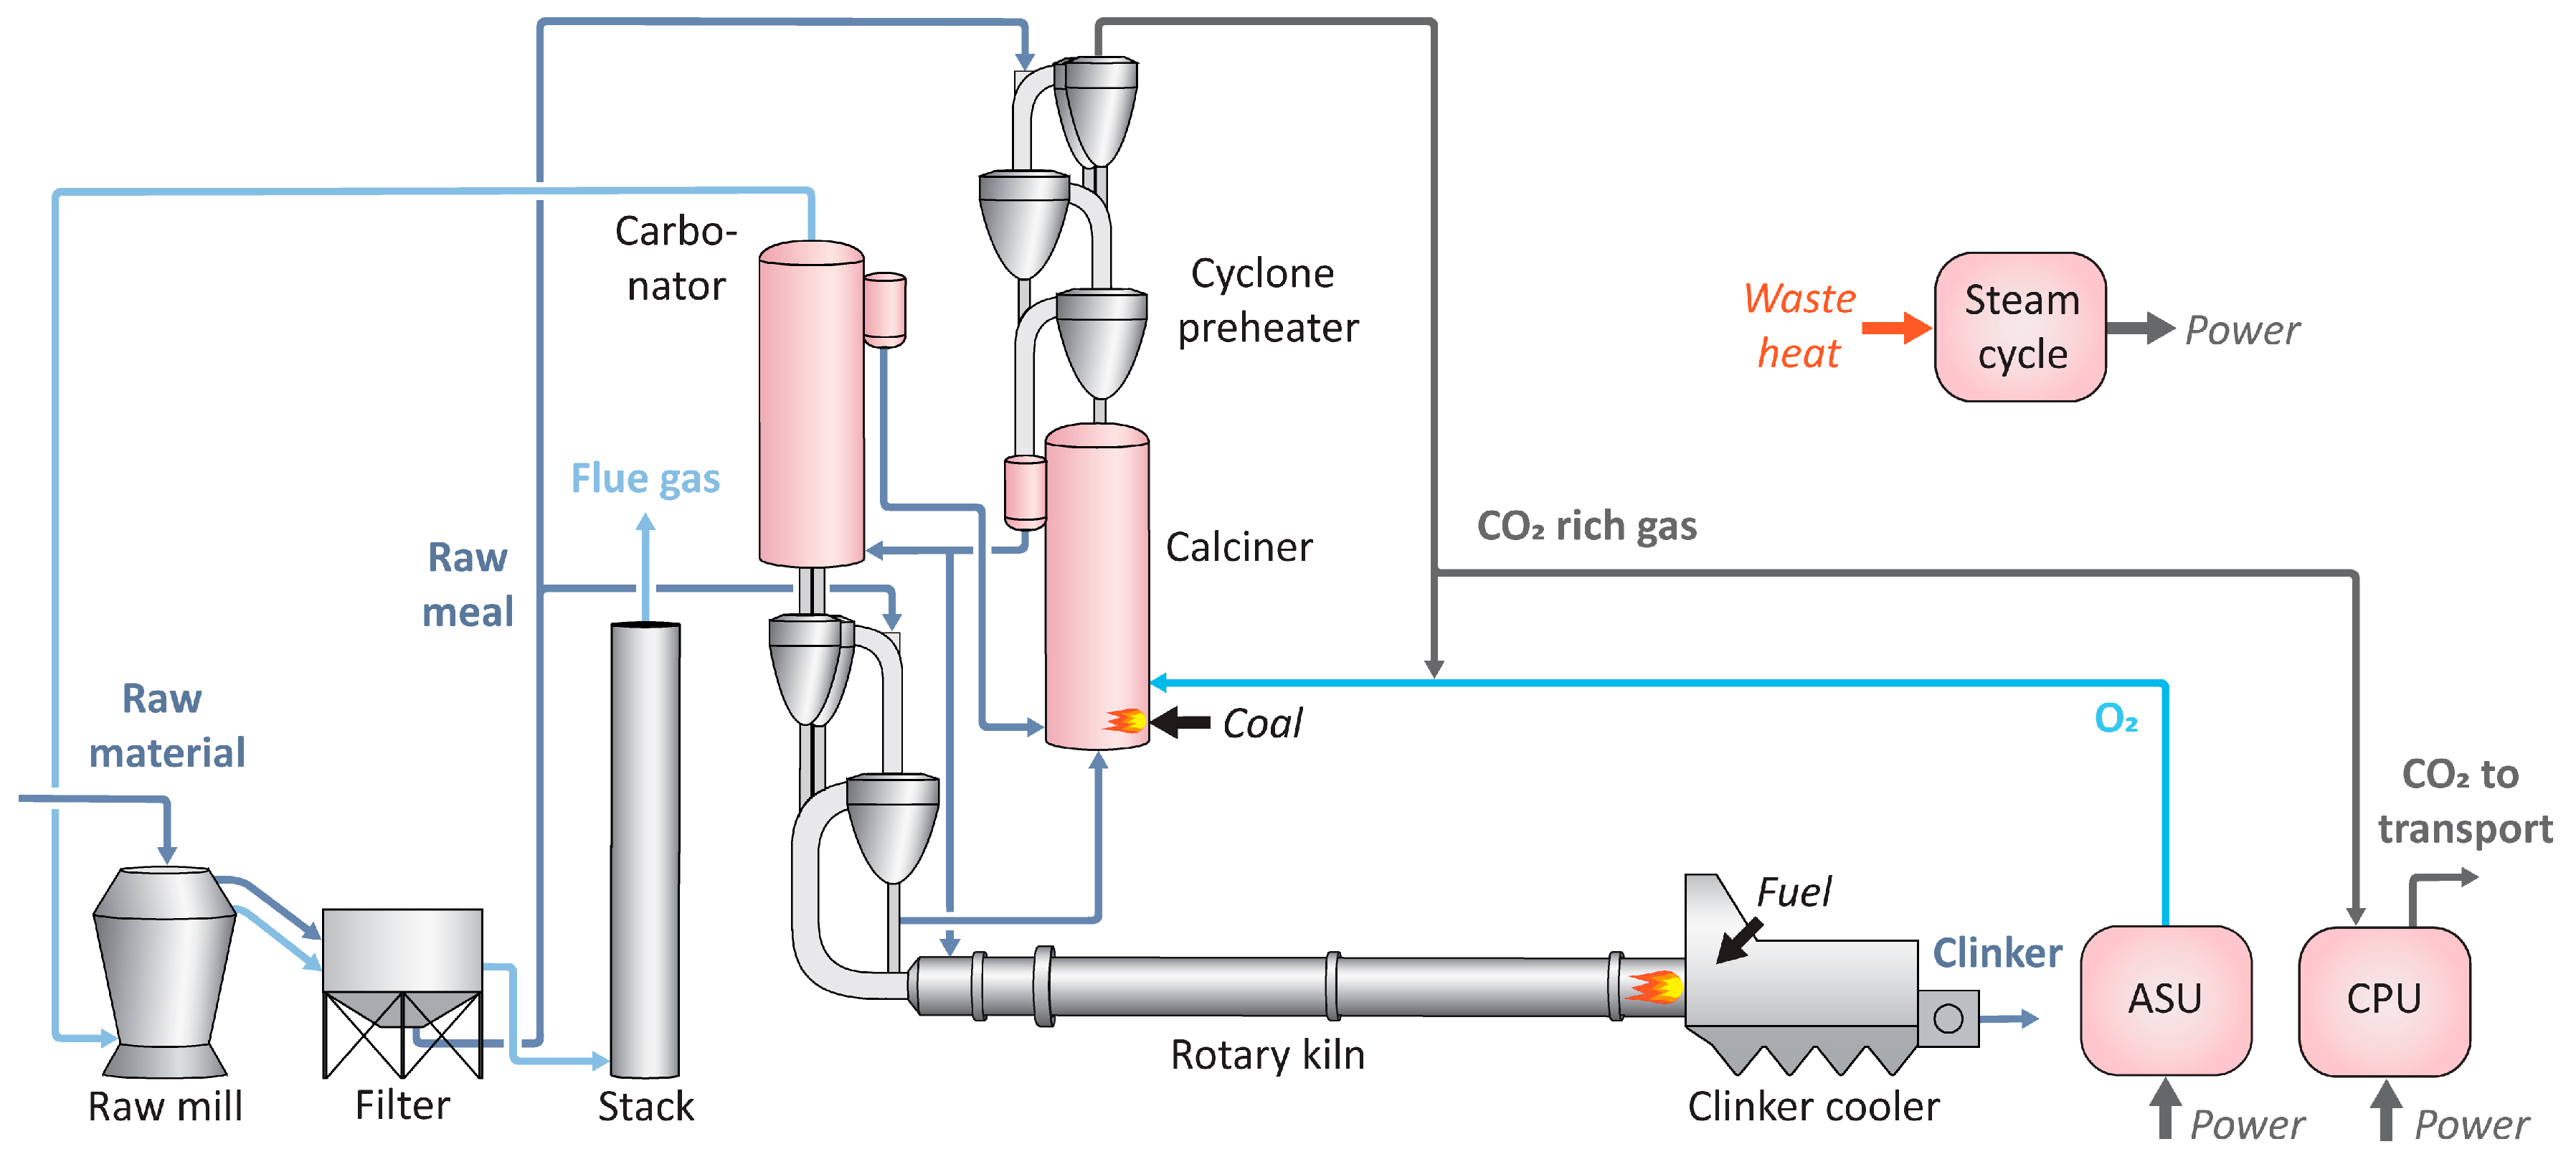
In the oxyfuel process, the clinker cooler, rotary kiln, calciner, and preheater are modified, whereas for the integrated CaL technology only the calciner and preheater are changed, while the cooler and the kiln are unchanged. The oxyfuel process is therefore marked orange and the integrated CaL process is marked yellow.
5.3.2. Equipment and Footprint
Every capture process will need installation of some additional equipment which requires available space, and therefore at least some attention is required regarding this aspect for all technologies. The most important difference between the technologies is whether the equipment must be installed close to the kiln line or if it can be installed further away.
For all the post-combustion technologies the required equipment can be installed anywhere at the plant, and there is also some flexibility for splitting up the systems and installing different units at different locations at the plant, so these technologies are marked yellow. The oxyfuel and the integrated CaL processes are integrated with the kiln system itself, and these technologies require space close to the kiln line. These technologies are therefore marked as orange.
5.3.3. Utilities and Services
The need for utilities and services of the technologies is summarized in
Table 18. The two solvent based processes MEA and CAP require considerable amounts of steam and also some power, in addition to the solvents MEA and ammonia. Each of these points should be possible to handle in most cases, but still require some attention. These technologies are therefore marked yellow.
For the oxyfuel and MAL processes, only additional electric power is required, but in both cases the magnitude of the power demand is considerable. These technologies are marked yellow, because some attention is needed on the local power grid capacity.
For the CaL processes, additional coal is required. Additional electric power is also needed, but on the other hand power is also generated from the waste heat. Depending on the integration level, the net power consumption at the plant can be positive or negative. If there is power export from the plant, infrastructure would be required for this. If the power generation is balanced with the power consumption, there would not be any need for import of power, which is an advantage. For the tail-end configuration 15–20% of the calcium must be fed to the plant as limestone. Some attention is needed for the plant retrofit, with respect to coal import, import/export of power, and raw meal quality. The two CaL processes are therefore marked yellow.
5.3.4. Introduction of New Chemicals/Subsystems
The operation of the MAL requires the installation of a refrigeration system, which implies that refrigerants will be present at the plant, and small amounts of NaOH for SOx removal. This should be relatively easy to handle, and therefore this technology is marked in green.
All capture technologies which require the production and use of oxygen, a chemical that can increase the risk for fires and explosions at the plant, could require a more complex permitting process and would require that new procedures and routines are established. However, the use of oxygen is normal in many industries, so although attention is needed it can still be handled. Therefore, the oxyfuel and the CaL process are marked yellow.
The MEA process and the CAP require aqueous solutions of amines or ammonia as solvent. Amines and their degradation products, as well as ammonia, are poisonous and dangerous for the environment. The use of these chemicals requires a permitting process, whose complexity depends on national/local regulations. Furthermore, new procedures and routines must be established to ensure safe operation at the plant. Ammonia is already commonly used at cement plants for NOx removal systems, but in very low quantities compared to what is required for the CAP. As for oxygen, significant experience is available from other industries, so MEA and CAP are marked yellow.
5.3.5. Available Operational Experiences
The MEA process is the most mature capture technology and a lot of information is already available. Other types of amines have been tested for flue gas treatment from an operational plant, and it can be expected that a retrofit should be possible without major problems. The most advanced testing done so far with amines on cement flue gas so far are the pilot trials with Aker Solutions mobile test unit, which is a fully integrated prototype of the system, for six months in an operational kiln at Norcem in Brevik, Norway. The testing at Norcem showed good stability of the solvent towards cement flue gas, and no technical show-stopper was identified. A capture ratio of 90% was obtained, and 370 tonnes of CO
2 were captured over 2700 h [
54]. Furthermore, there is a lot of operational experience with amine absorption from the demonstration for coal power plants in commercial scale at Boundary Dam. Consequently, this technology is marked green.
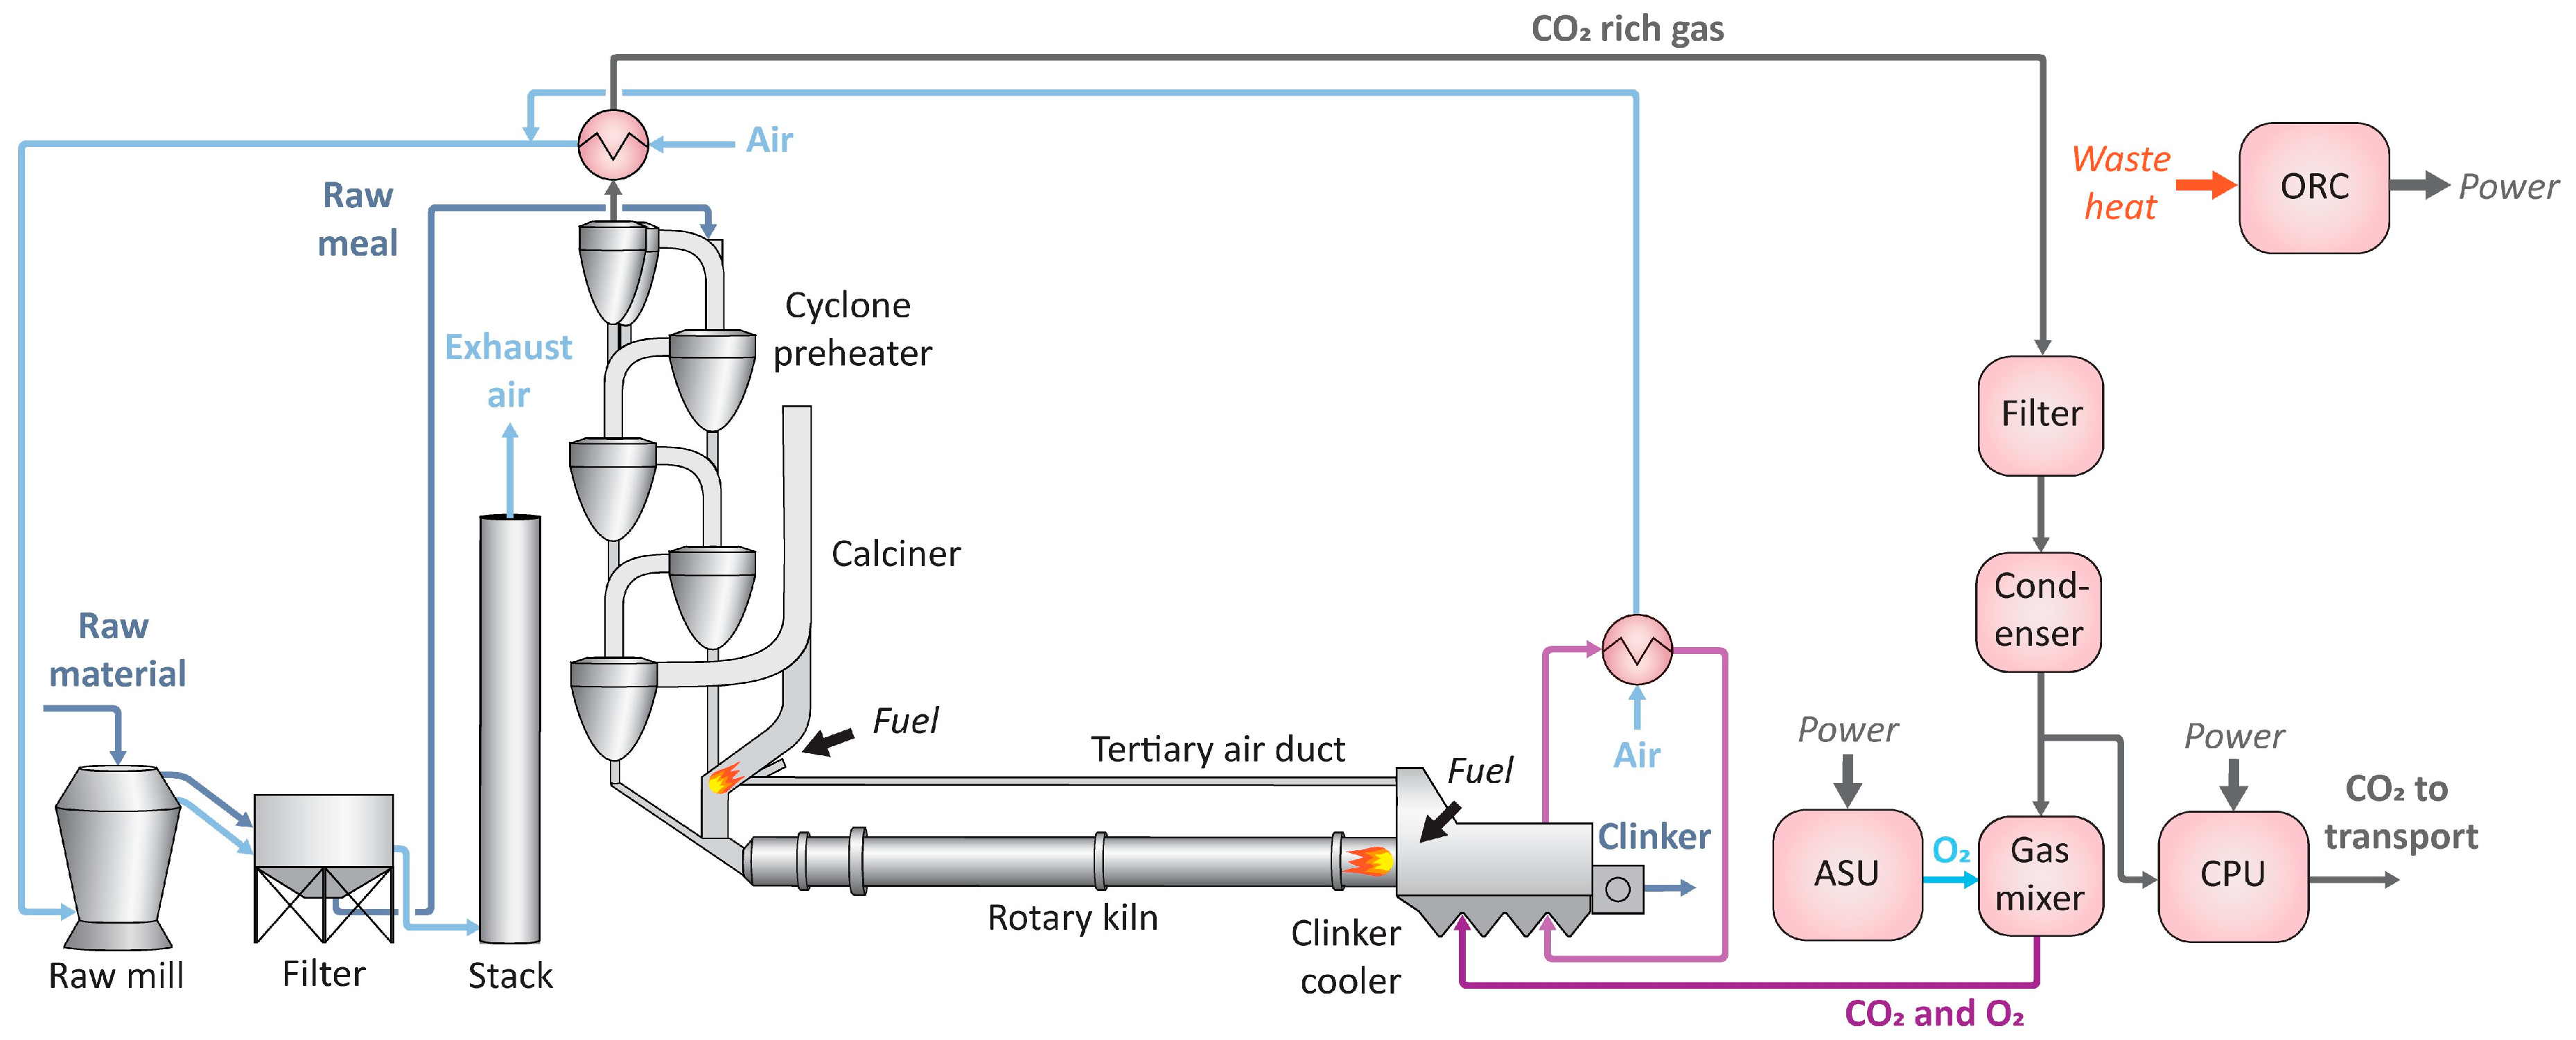
For the oxyfuel process, burner, calciner, and clinker cooler pilot trials have been conducted in industrial relevant environment as a part of the CEMCAP project. A 500 kW oxyfuel cement kiln burner prototype has been successfully demonstrated at the University of Stuttgart [
19,
55]. Oxyfuel calcination has been demonstrated in a 50 kW reactor, also at the University of Stuttgart [
56]. A clinker cooler pilot has been successfully operated with clinker directly from a real industrial kiln line at HeidelbergCement’s plant site in Hannover [
57]. However, the full system has not been operated as a whole yet, and experience from the power sector is not directly transferrable to the cement sector, so the technology is marked orange.
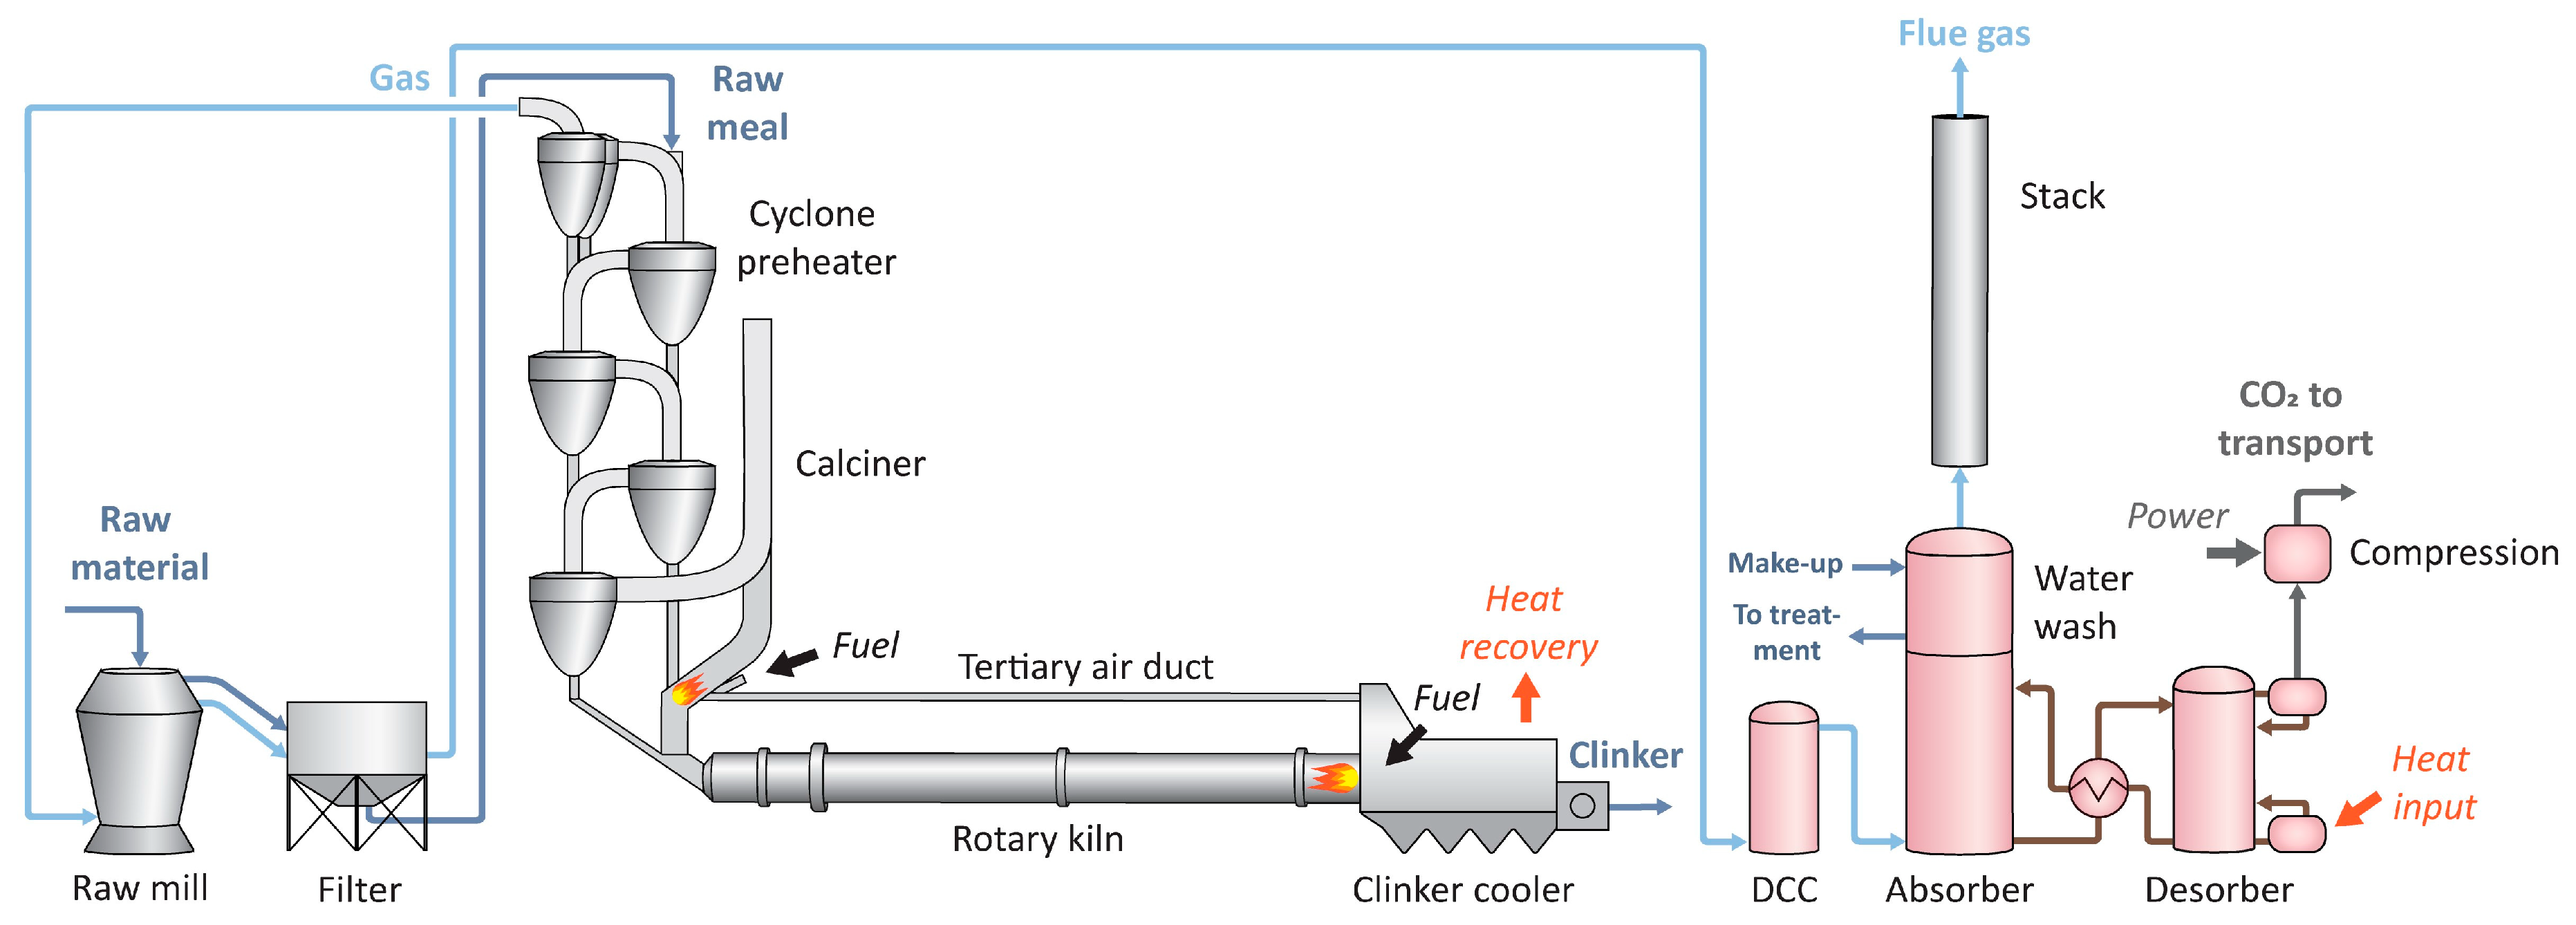
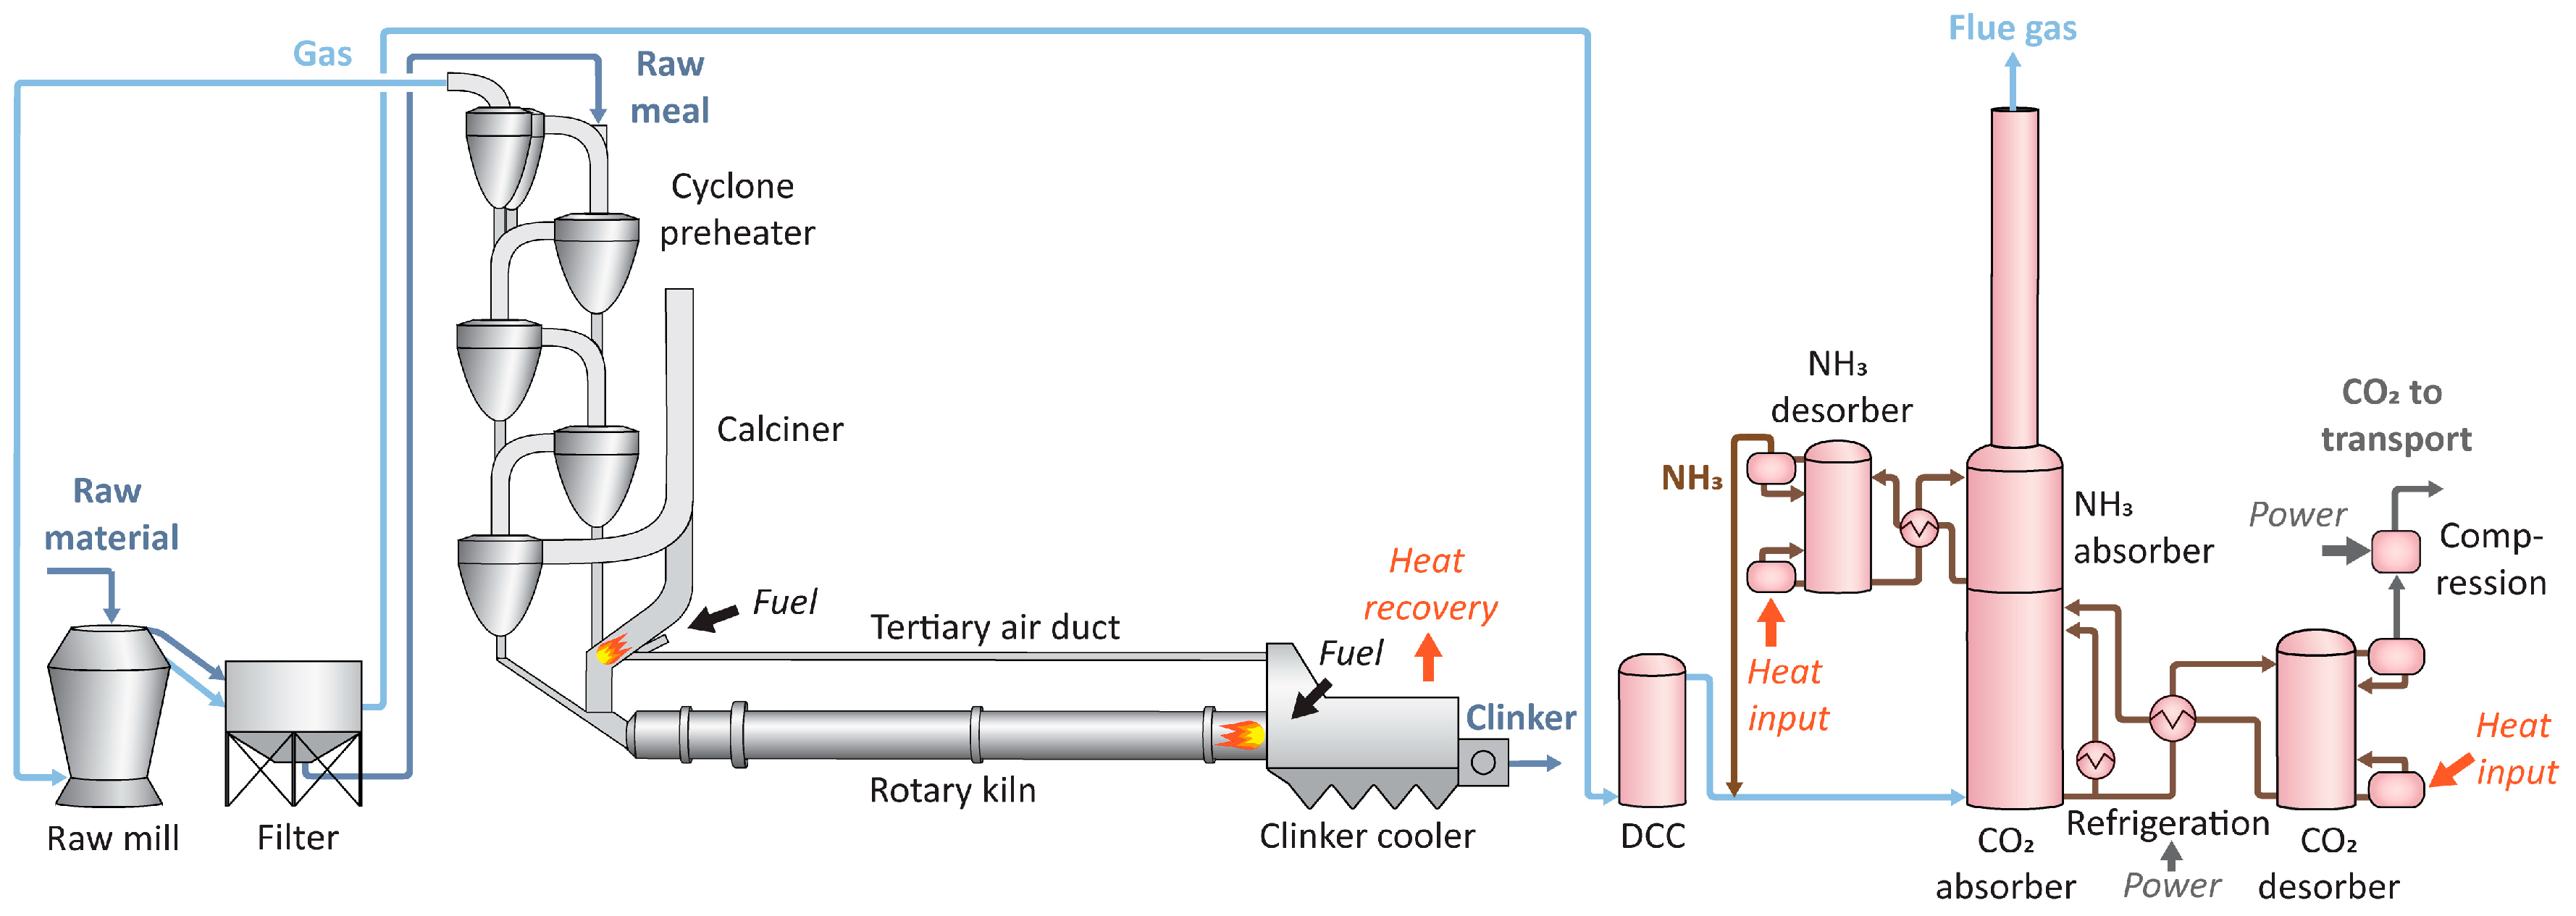
The chilled ammonia process has been demonstrated for flue gas concentrations ranging from typical natural gas-fired power plants to typical coal-fired power plants in several pilots including the 58 MW
th AEP Mountaineer pilot [
58] and the 40 MW
th TCM pilot [
59]. In CEMCAP, the chilled ammonia absorber, direct contact cooler (DCC), and water wash units were tested for the cement application, since these are the units that are affected by a change in the flue gas conditions. All three units were tested in GE’s 1 tonne CO
2 per day pilot facility in Vaxjö, verifying that the process can be applied in the cement industry [
44]. Due to the experience from the pilot plants in the power sector, no major risks are foreseen for the operation of all units together or for the scale-up of the system. Based on this, the technology is marked yellow.
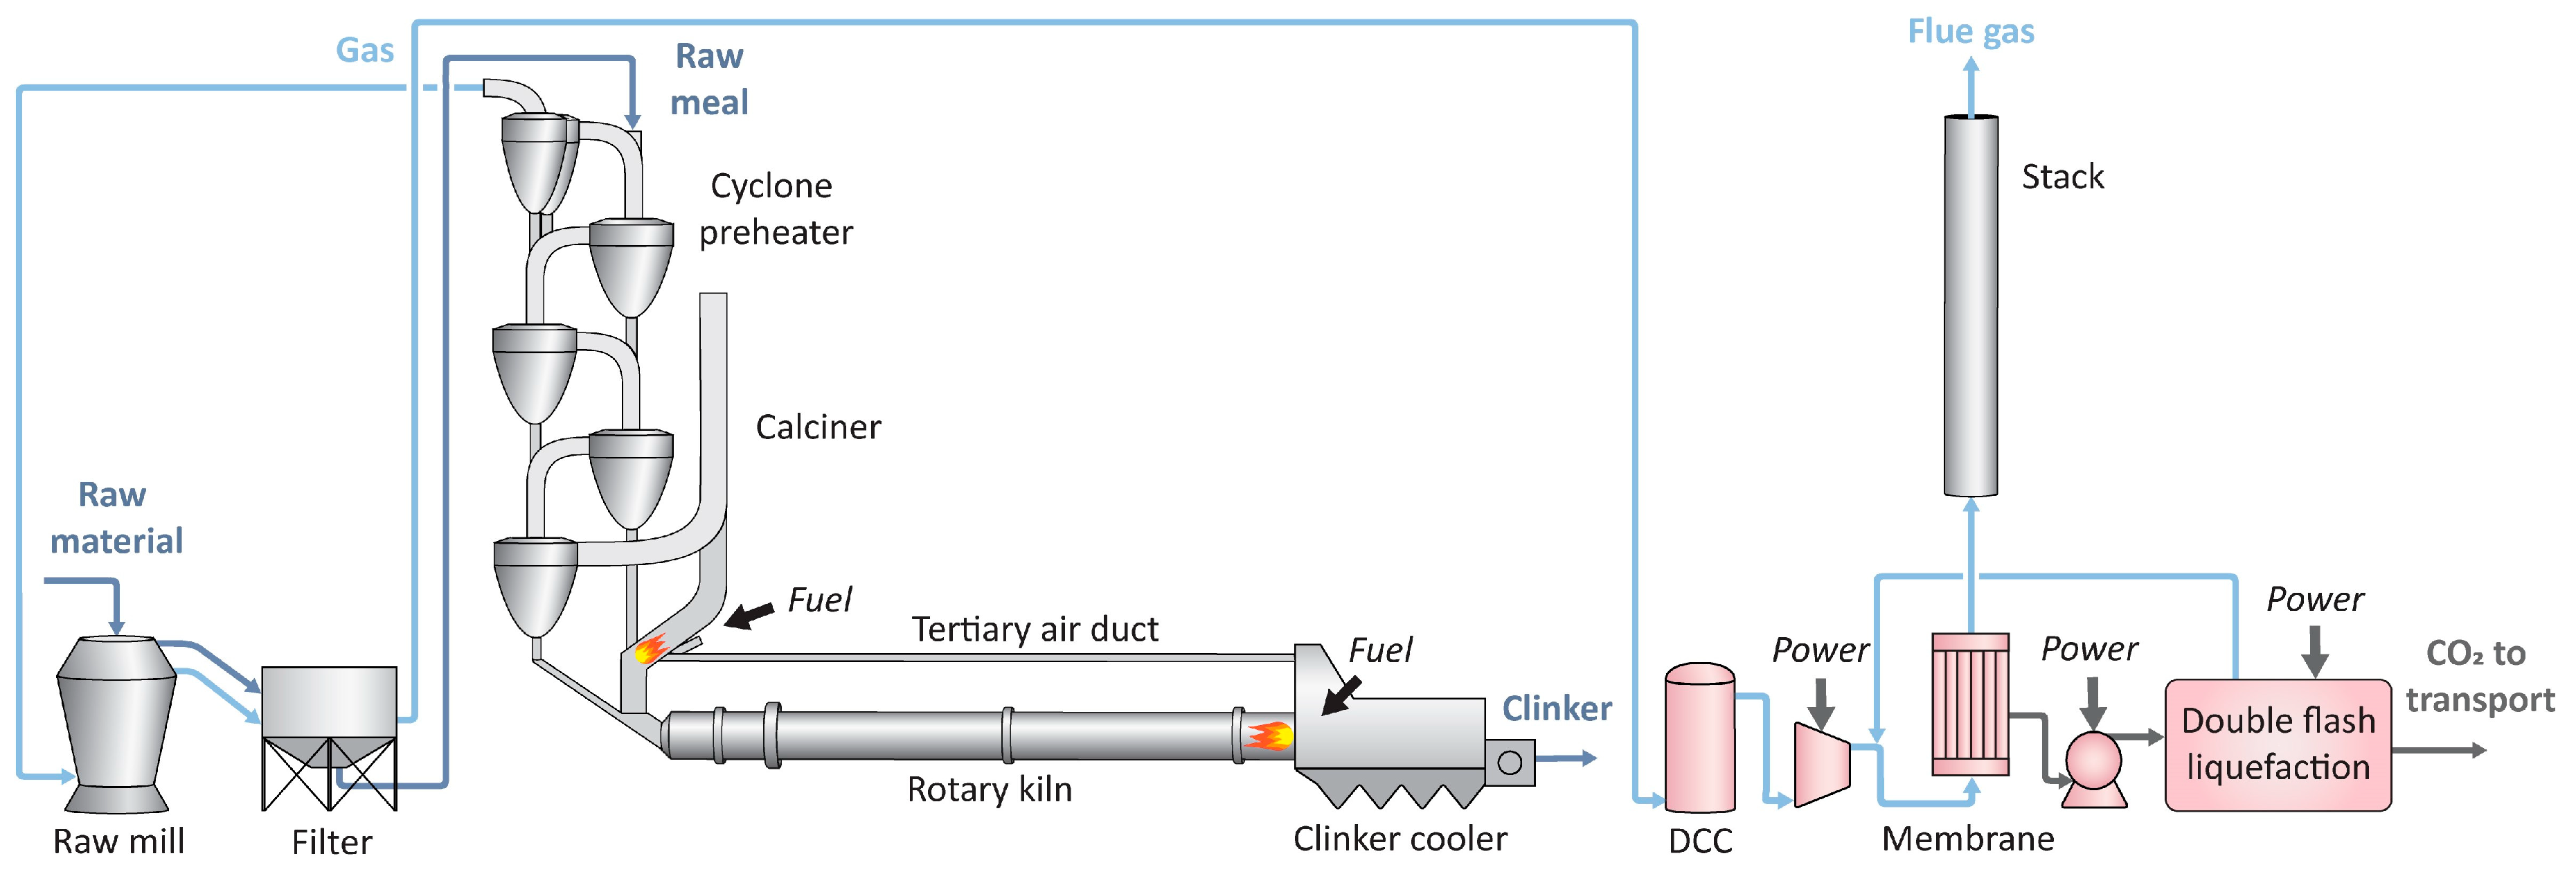
For the membrane-assisted CO
2 liquefaction process, the liquefaction system and membranes have been tested separately. The liquefaction part of the process has been tested as a part of CEMCAP in a pilot facility at SINTEF Energy Research with liquefaction capacity of 10 tonne CO
2 per day, and a separation performance consistent with expectations based on vapour-liquid equilibrium data was demonstrated [
21]. One type of membranes as tested in the lab for cement specific flue gas in the CEMCAP project, but more advanced testing has been carried out for fixed-site-carrier membranes at the Norcem plant in Brevik with flue gas from an operational kiln [
60]. The full process with membranes and the liquefaction system integrated has not been operated, so therefore the technology is marked orange.
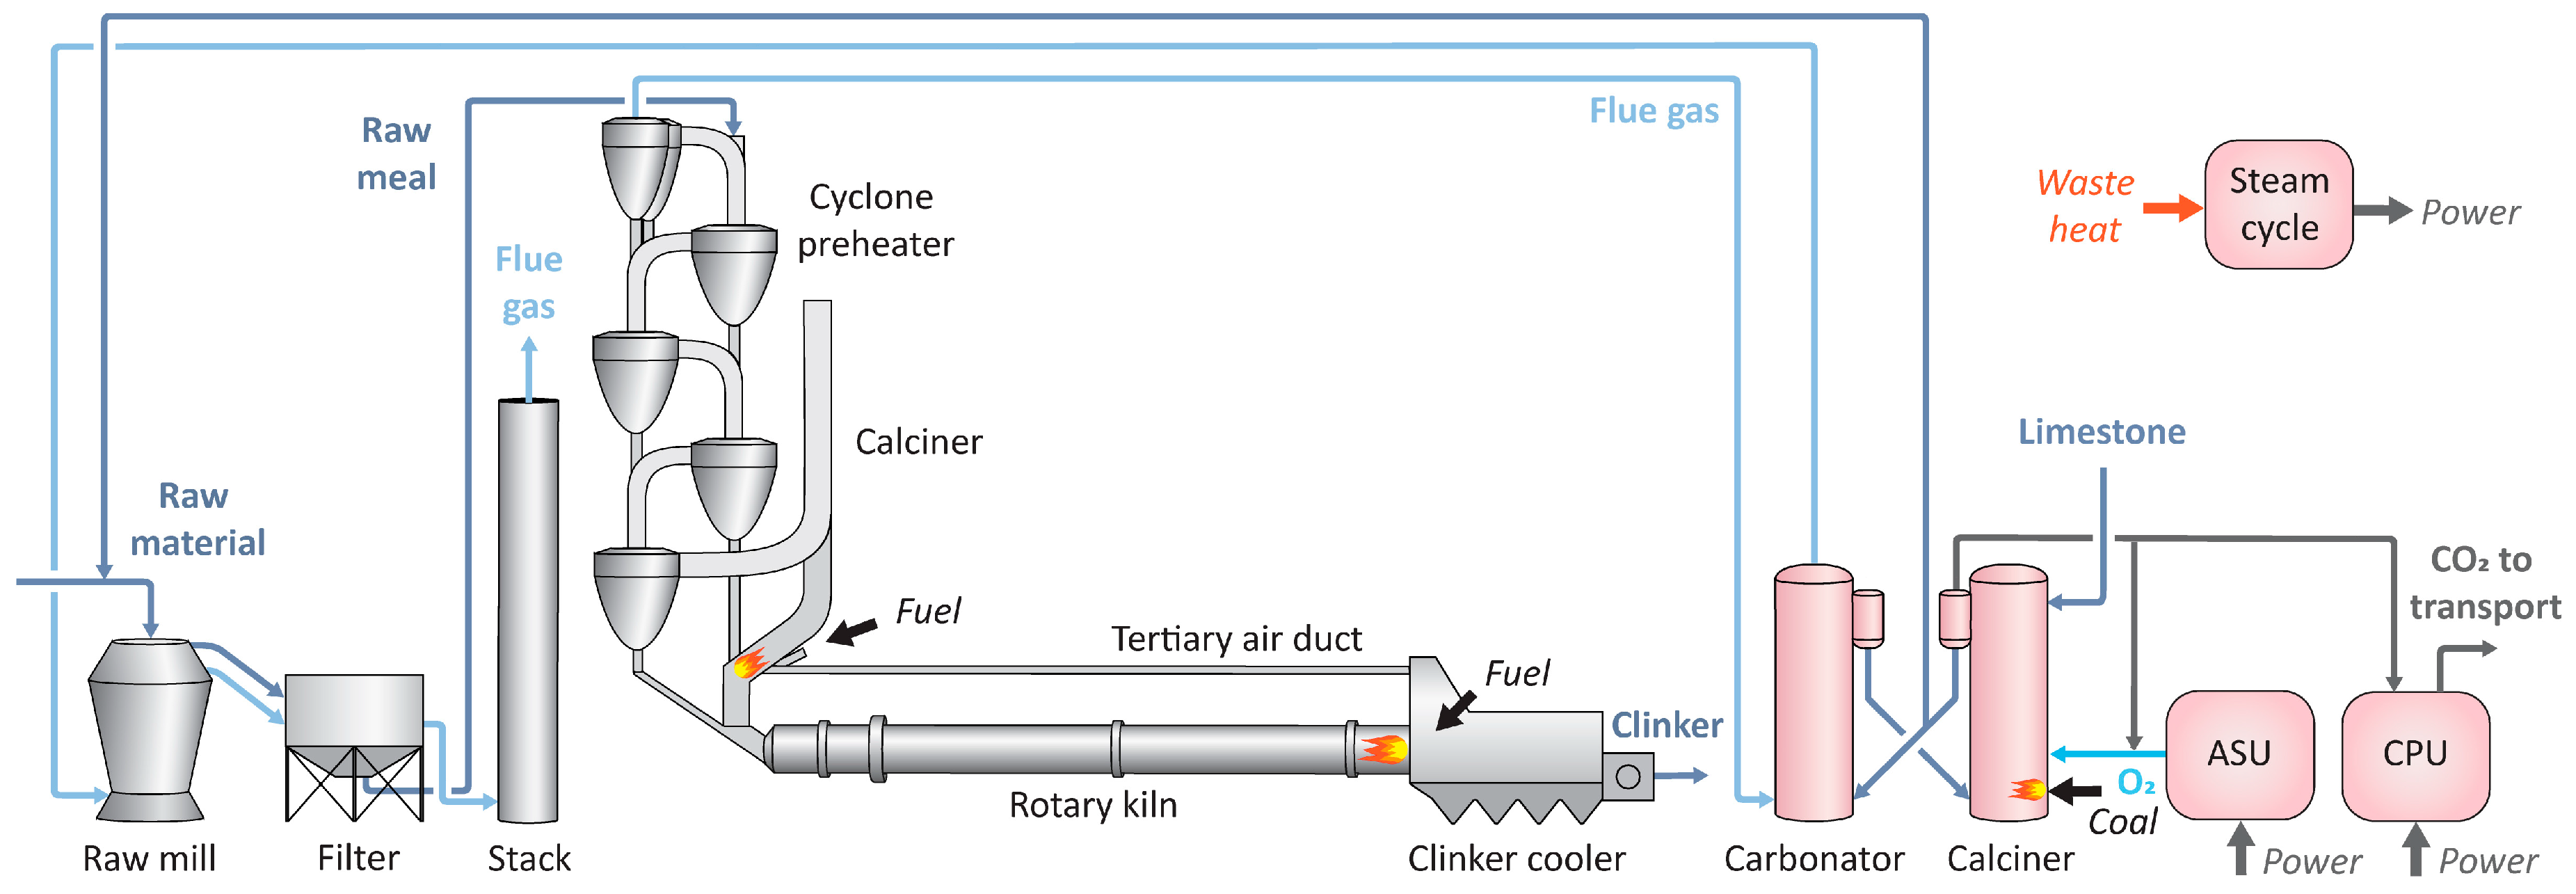
The tail-end calcium looping technology has been demonstrated for coal at the “la Pereda” power plant in a 1.7 MW
th pilot [
61]. Within CEMCAP the technology has been tested for cement flue gas in a 30 kW pilot at CSIC, and a 200 kW pilot at the University of Stuttgart [
26]. The testing has shown that fundamental parameters, such as the carbonation rate constant, are consistent with those in systems already tested for coal power plants at a large scale. This technology is therefore marked yellow.
For the calcium looping integrated technology, calcium looping experiments with entrained flow reactors have been carried out in the 30 kW pilot at CSIC. It has been shown on a laboratory scale that calcined materials with free CaO are able to adsorb CO2 in an entrained flow environment. There is not yet any operational experience with the full system, so this technology is marked orange.

 ,
, 


