Article

Direct Printing of a Multi-Layer Sensor on Pet Substrate for CO2 Detection

1
DIEEI University of Catania, v.le A. Doria 6, 95127 Catania, Italy
2
DII University of Catania, v.le A. Doria 6, 95127 Catania, Italy
*
Author to whom correspondence should be addressed.
Energies 2019, 12(3), 557; https://doi.org/10.3390/en12030557
Submission received: 20 December 2018 / Revised: 1 February 2019 / Accepted: 2 February 2019 / Published: 12 February 2019
(This article belongs to the Special Issue Robotics, Micronanosensor and Smart Devices for Control)

Abstract

:
The use of inexpensive gas sensors is a real need for many applications requiring the use of disposable sensors. This work deals with the realization and characterization of a low cost CO2 sensor realized by rapid prototyping techniques. In particular, the sensor consists of a set of InterDigiTed electrodes, over which a double sensing layer made of PEDOT/PSS (CLEVIOS™ PHCV4, by H.C.Starck) and a solution of pristine graphene powder has been deposited. A silver nano-particle solution is used for inkjet printing the electrodes onto the PET (PolyEthylene Terephthalate) substrate, through a commercial inkjet printer. The sensing strategy is based on the variation of the electrical conductance of graphene due to gas molecules adsorption. The device responsivity observed in two different operating conditions (50 °C and 60 °C), is 4.0 µΩ/Ω/ppm and 4.7 µΩ/Ω/ppm. The corresponding values of the resolution are 400 ppm and 420 ppm. Main advantages of the developed sensor consist in the cost-effective fabrication techniques and the device flexibility, which are strategic for applications requiring disposable and shapeable devices to be installed into irregular surfaces.

1. Introduction

Technologies for gas sensors are rapidly developing due to the increasing demand for devices with characteristics compliant to a wide set of applications involving the gas monitoring challenge [1,2,3,4]. In particular, carbon dioxide (CO2) measurement is a real need for several application contexts including environmental and agriculture monitoring. The monitoring of CO2 levels is strategic for air quality assessment in indoor environments, such as schools, offices and public buildings, especially to control ventilation conditions. Indoor environments, after few minutes of a regular population, show high level of carbon dioxide, especially if these areas are subject to restricted ventilation.
The main subject addressed by this paper concerns the realization of a low cost CO2 sensor by rapid prototyping techniques and the use of conductive inks, polymers and graphene. The latter are interesting for their functional properties as well as for their sensing properties.
One of the most promising conductive polymers is PEDOT-PSS, poly(3,4-ethylenedioxythiophene)-poly(styrenesulfonate), which is mechanically flexible, transparent and soluble in water [5,6]. PEDOT/PSS can be used as host and guest material in hybrid systems to improve the mechanical strength and electrical conductivity. In particular, coupling carbon-based materials (e.g., carbon nanotubes and graphene) with PEDOT/PSS can result in interesting conductive composites, through surface modification and stabilizing techniques [7]. Graphene is an excellent carbon-based nanomaterial with interesting electrical and optical properties, high transparency, good conductivity and stability, which are sustained by the two-dimensional extended honeycomb network of sp2 hybridized carbon atoms [8,9,10].
Examples of graphene-based CO2 gas sensors are available in the literature [11,12,13], such as room temperature graphene sheet device, reduced graphene oxide based sensors and hydrogen plasma treated devices [13].
The following notes draw advantages and main features of techniques for the rapid prototyping of electronic devices including sensors. In particular, printed electronics is becoming very interesting due to its intrinsic low cost and the wide availability of different kinds of substrates and materials [14]. Among printing techniques, screen printing is a very low cost mask based technology which produces waste of materials, while inkjet is a direct printing contactless technique characterized by a high resolution, in the order of the tens of micrometers [15,16]. Examples of materials compatible with inkjet printing technology are polymers, such as PEDOT-PSS and PANI (Polyaniline), and conductive silver inks.
Microstructures [17], glucose sensors on carbon [18], RFID device [19,20,21] and paper based humidity sensors [22] are just few examples of devices realized by high cost inkjet printing systems. The use of polymers on conductive electrodes is a common approach for the development of inkjet printed sensors [23].
The use of low cost inkjet printing equipment has been recently introduced as a valuable solution to develop simple devices, exploiting metal inks and a restricted variety of polymers, especially for proof-of-concept tasks [24,25,26,27,28]. Mixed solutions, exploiting screen printing and inkjet technologies, are also available in the literature [29,30,31].
Concerning printed CO2 gas sensors, an example of a screen printed device is presented in [32], while a first attempt to develop a CO2 sensor based on a polymeric (graphene-based) sensitive layer deposited on inkjet printed electrodes is given in [33].
In this paper the realization and the characterization of a CO2 gas sensor developed by rapid prototyping techniques is presented. The device is based on a combined sensing structure which uses two different polymers PEDOT/PSS and graphene [33]. The main advantage of the proposed solution is the reliable resistive readout strategy, based on the unique sensing feature of the graphene layer and the resistive background given by the PEDOT/PSS.
The adopted low cost printing technologies, as well as the easy inks preparation process, increase the interest in the investigated solution especially for application contexts requiring disposable devices. Moreover, the use of a flexible substrate is valuable to tackle with applications requiring the use of shapeable sensors.
The main novelty introduced by this work is represented by the low operating temperature of the labscale prototype developed by using a cheap inkjet printing technology, as respect to other solutions already available in the literature [12].

2. The Developed Sensor and the Experimental Set-Up

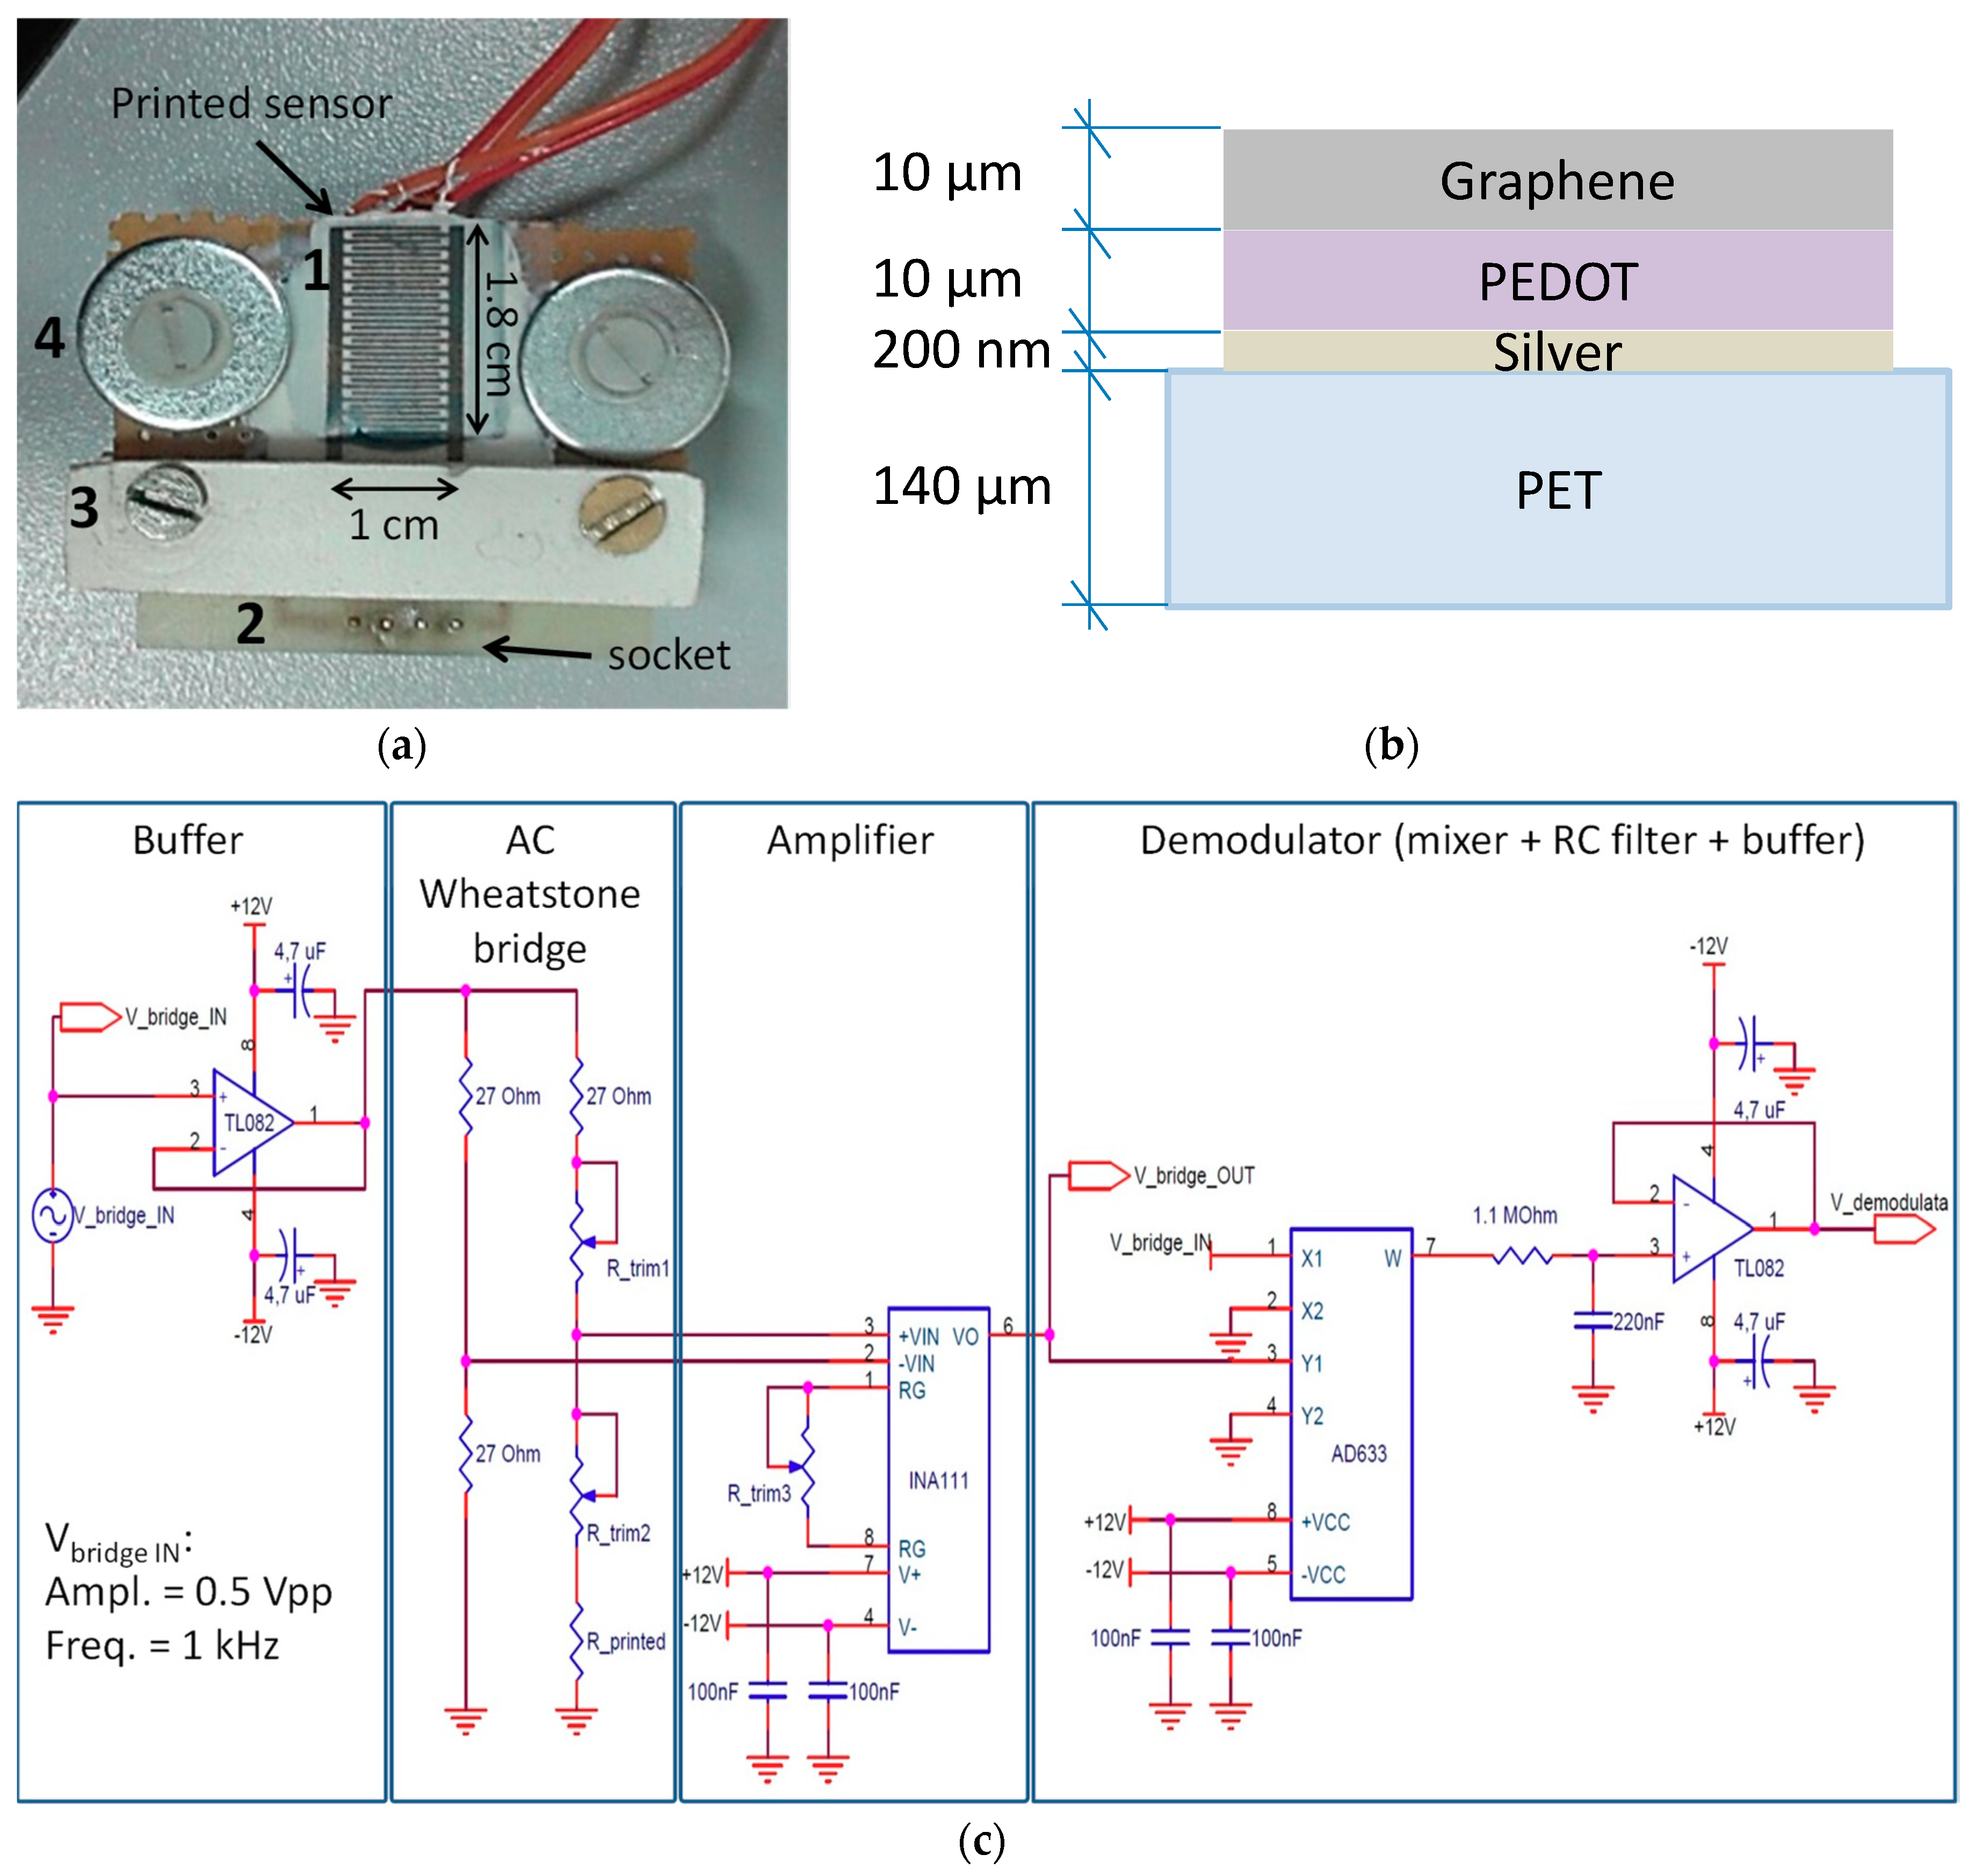
2.1. Description of the Device Structure and Material Properties

A real view of the inkjet printed gas sensor is shown in Figure 1a. As schematized in Figure 1b, the device uses a flexible PolyEthyleneTerephthalate (PET) substrate for low temperature operation, Novele™ IJ-220 Printed Electronics Substrate, with a thickness of 140 μm. InterDigiTed (IDT) electrodes have been printed onto the substrate by using a cheap EPSON WF2010 piezo inkjet printer with a drop resolution of 3pl and a metal ink adopted for the realization of conductive patterns. The adopted ink is the silver nanoparticle solution Metalon® JS-015 by NovaCentrix (Austin, TX, USA), which is compatible with room temperature printing processes offered by low cost inkjet printers and the selected substrate [23,24]. To this aim, a compatible cartridge is fill with the silver ink. For a correct operation of the printer and in order to avoid occlusion problems, the piezo print head is preventively cleaned by a series of cleaning cycles using the Metalon Acqueous Vehicle cleaning liquid after every printing session.
A morphologic analysis of the Metalon® JS-015 inkjet printed electrodes, performed by electron microscopy (SEM), has demonstrated the film uniformity, as reported in [24].
The sensing surface deposited over the IDT electrodes consists of two layers, realized by following a different deposition approach as compared the one proposed in [33]. The first layer is made by a commercial PEDOT/PSS, CLEVIOS™ PHCV4 by H.C.Starck, prepared as the dilution of the starting solution with distilled water (1:1, v/v). The PEDOT layer has been deposited by a calibrated spreader to reach a thickness of 10 µm. A heating process bringing the sensor to 80 °C for 50 min has been applied to produce a conductive dark blue film of PEDOT.
The main reason to use a layer of PEDOT under the sensing layer of graphene is two-fold:
  • to realize a uniform layer over the IDT electrodes guaranteeing continuity of the resistive contact between IDT fingers.
  • to realize a layer with a resistance value higher than a pure layer of conductive material (such as the silver ink used to realize IJP IDT electrodes). This allows for making dominant the effect of the resistance variation of the graphene layer, super-imposed to the PEDOT layer, as a consequence of a variation of the concentration of CO2 molecules adsorbed into the sensing layer.
A second layer of the pristine graphene powder, N002-PDR by Angstron Materials, with a concentration of 0.1 mg/mL, mixed with the Triton-X100 nonionic surfactant (0.4 wt %), has been deposited over the PEDOT/PSS by a calibrated spreader to reach a thickness of 10 µm. A sonication process has been applied to the graphene solution to obtain a fine dispersion. Successively, the device has been annealed at 80 °C for 50 min.
The graphene layer is the one conveying the gas sensing features to the device. The readout strategy mainly exploits the variation of the graphene conductivity as a function of the absorbed amount of gas molecules. In particular, the conductance of the graphene layer increases when the concentration of the CO2 gas increases [12]. The graphene layer acts also as a shield for the PEDOT layer against the effect of exogenous quantities, such as humidity.
The sensor is conditioned by a traditional bridge configuration driven by a sinusoidal signal with an amplitude of 0.5 V and a frequency of 1.0 kHz, followed by gain and demodulation blocks. The schematization of the conditioning electronics is shown in Figure 1c.
The heater, required for the correct operation of the sensor, has been realized through two 10 Ω ceramic power resistors connected in series with a total power of 11 W.

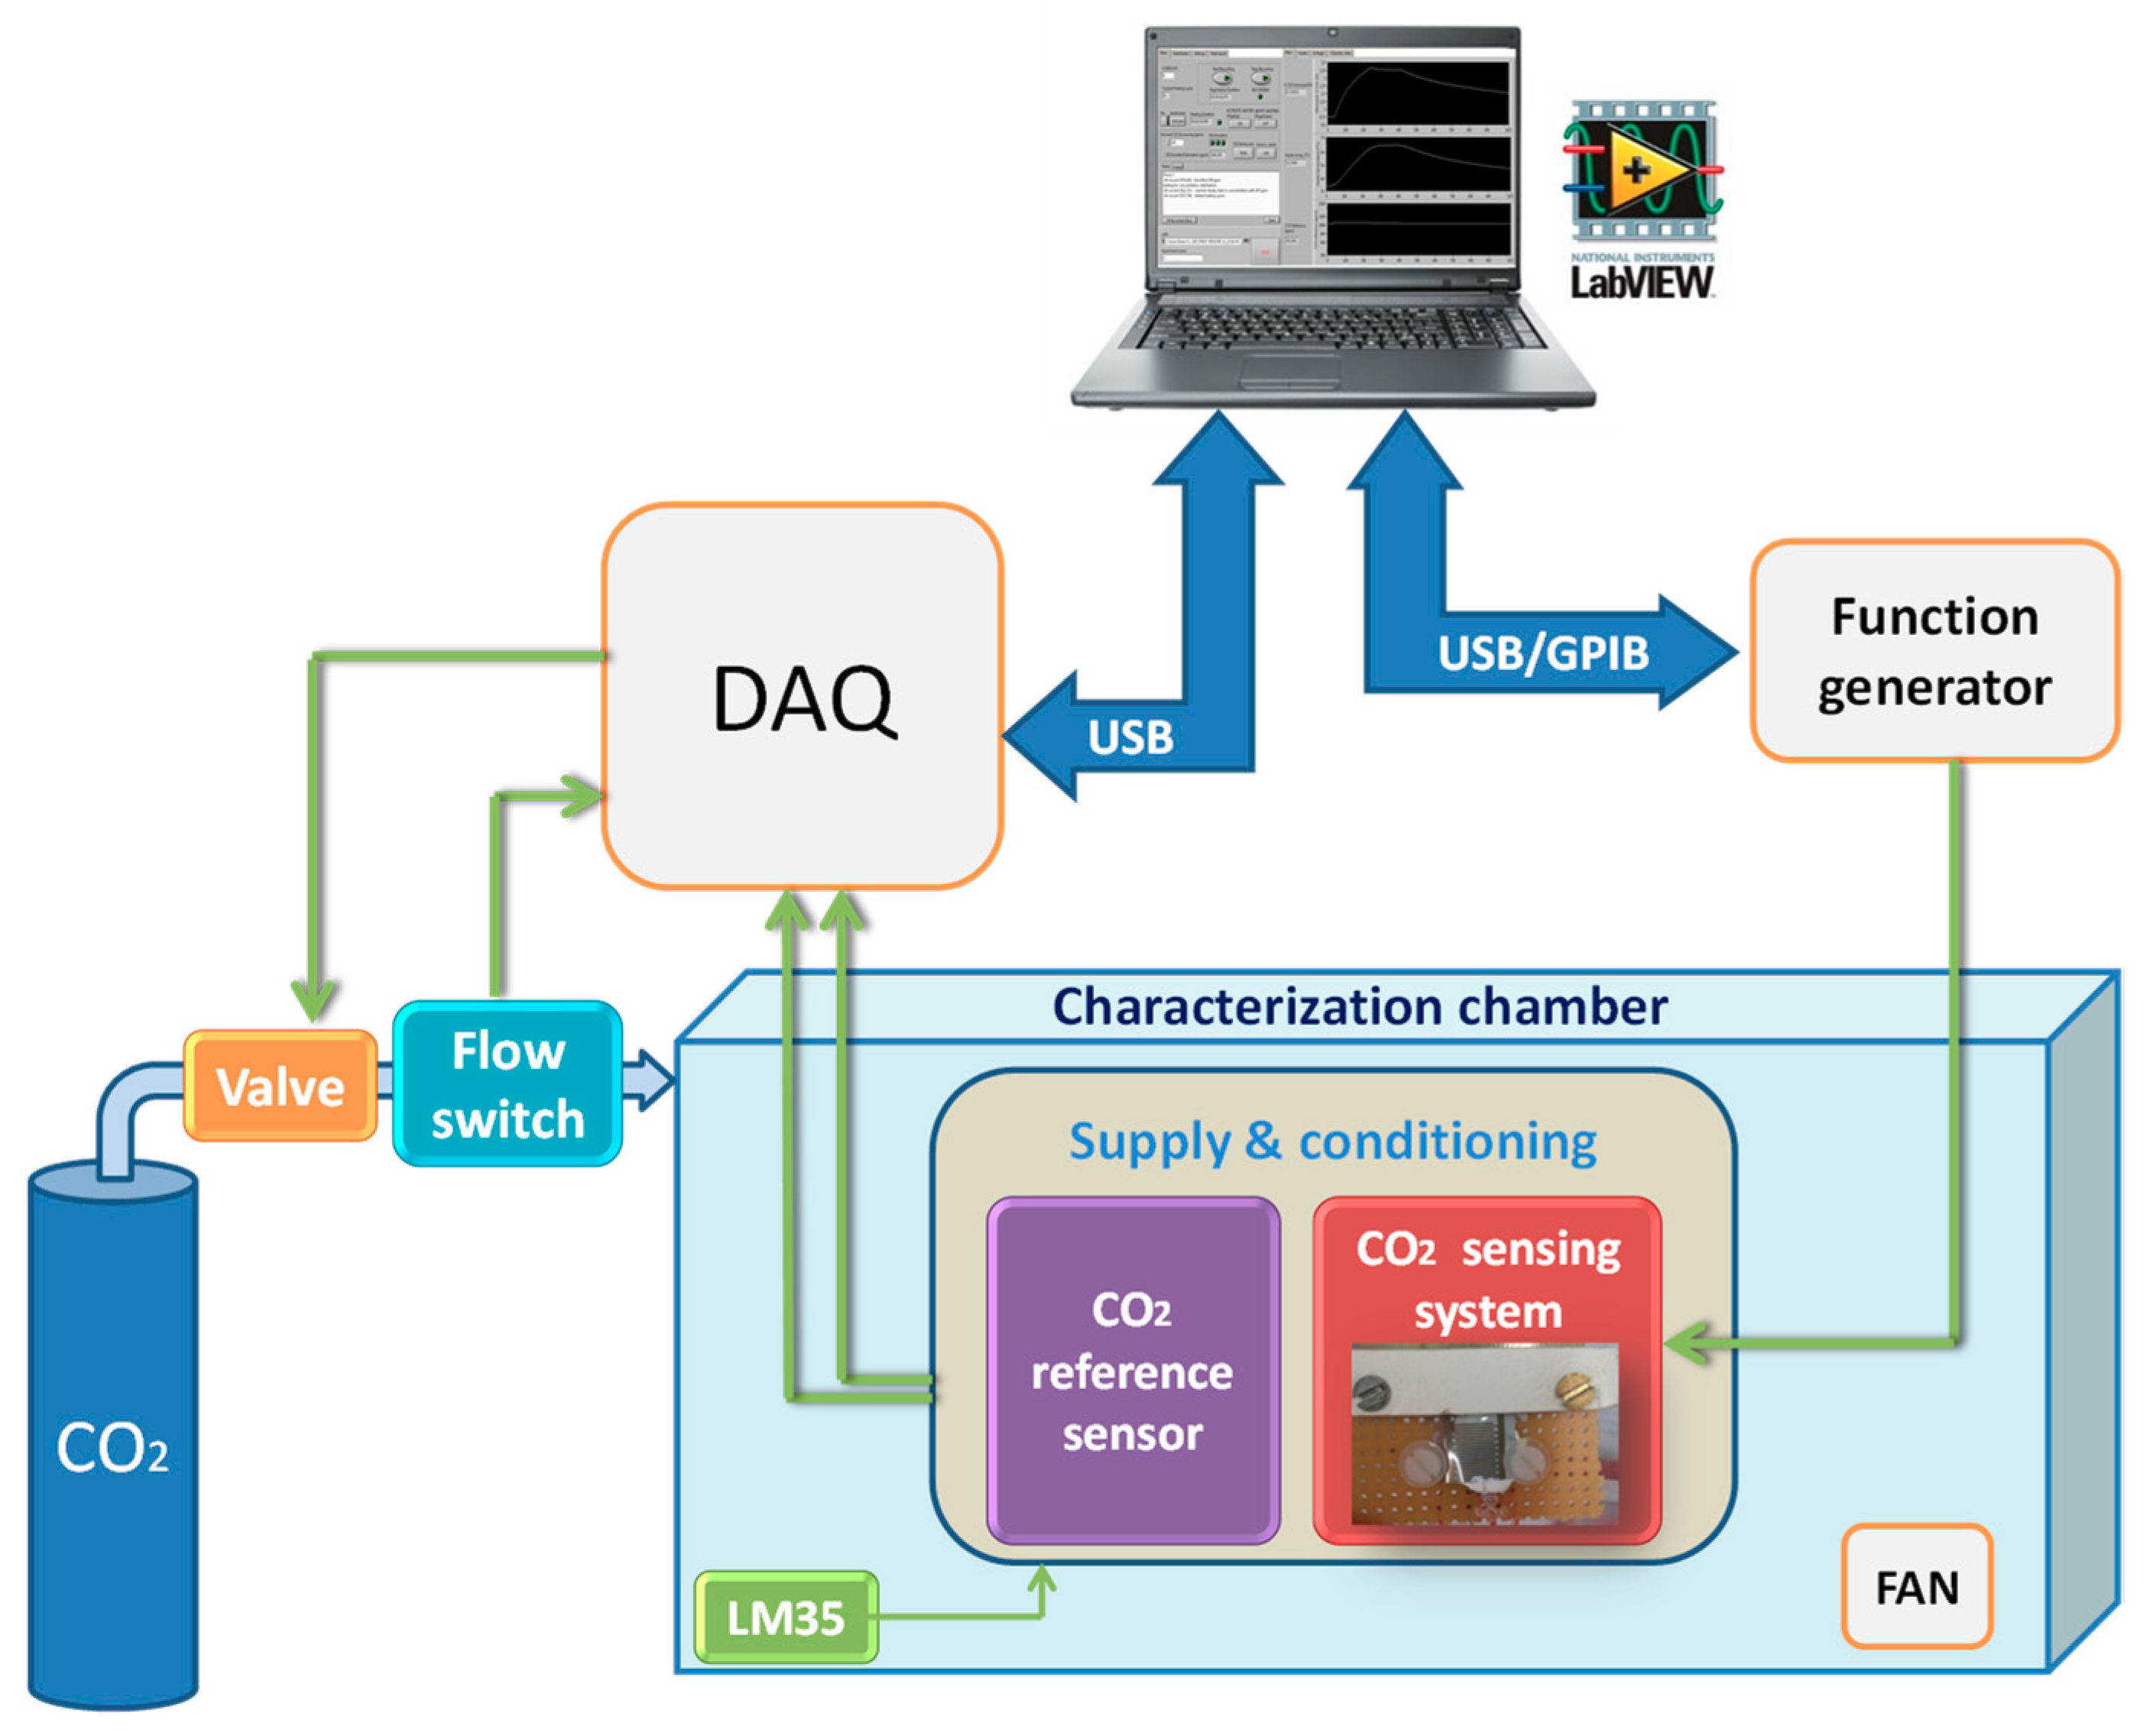
2.2. Experimental Set up and Procedure

A heater has been positioned under the sensor substrate to implement the heating process required for the sensor operation and characterization. The substrate temperature is monitored by a Pt100 RTD sensor. The heating process, which is managed by a PID controller and a dedicated LabVIEW tool, allows for increasing the sensor substrate temperature up to 65 °C, which is compliant to the adopted PET substrate.
The experimental set-up developed for the sake of the device characterization is shown in Figure 2. The system consists of an insulated chamber with a controlled gas injection system. The chamber is made of PolyMethylMethAcrylate (PMMA) and has a size of 60 cm × 50 cm × 30 cm with a total volume of 0.09 m3. The CO2 injection system is equipped with the flowmeter PFM710 by SMC to monitor the CO2 flux, 3 electrically controlled brass valves by Aquili. The CDM4161A sensor has been used to independently measure CO2 concentration during the experiments. The latter is a low-power sensor (300 mW), with an operating range of (400–4200) ppm.
A data management environment has been implemented in LabVIEW, to properly convey signals with a 40 kHz sampling rate and to perform the required signal processing.
During experiments the following gas injection strategy has been adopted: the first action is to reach a steady state regime in the gas injection system; successively CO2 gas is conveyed inside the chamber; when the desired gas concentration has been reached, the new regime is maintained by properly set the input/output valves.
The measurement protocol adopted to operate the printed gas sensor is shown in Figure 3a. The first step consists in conveying clean air inside the chamber up to reach typical environmental CO2 concentrations (around 400 ppm). Afterwards ten heating cycles are performed (the duration of each heating cycle is 150 s), followed by injection of the desired CO2 quantity inside the chamber and successive other 10 heating cycles. For each cycle the sensor is heat up to the desired working temperature. After heating the device, a time interval is waited for reaching a steady state regime. Successively, a new CO2 quantity is injected into the chamber. The procedure ends up when the full scale value of the gas concentration is reached.

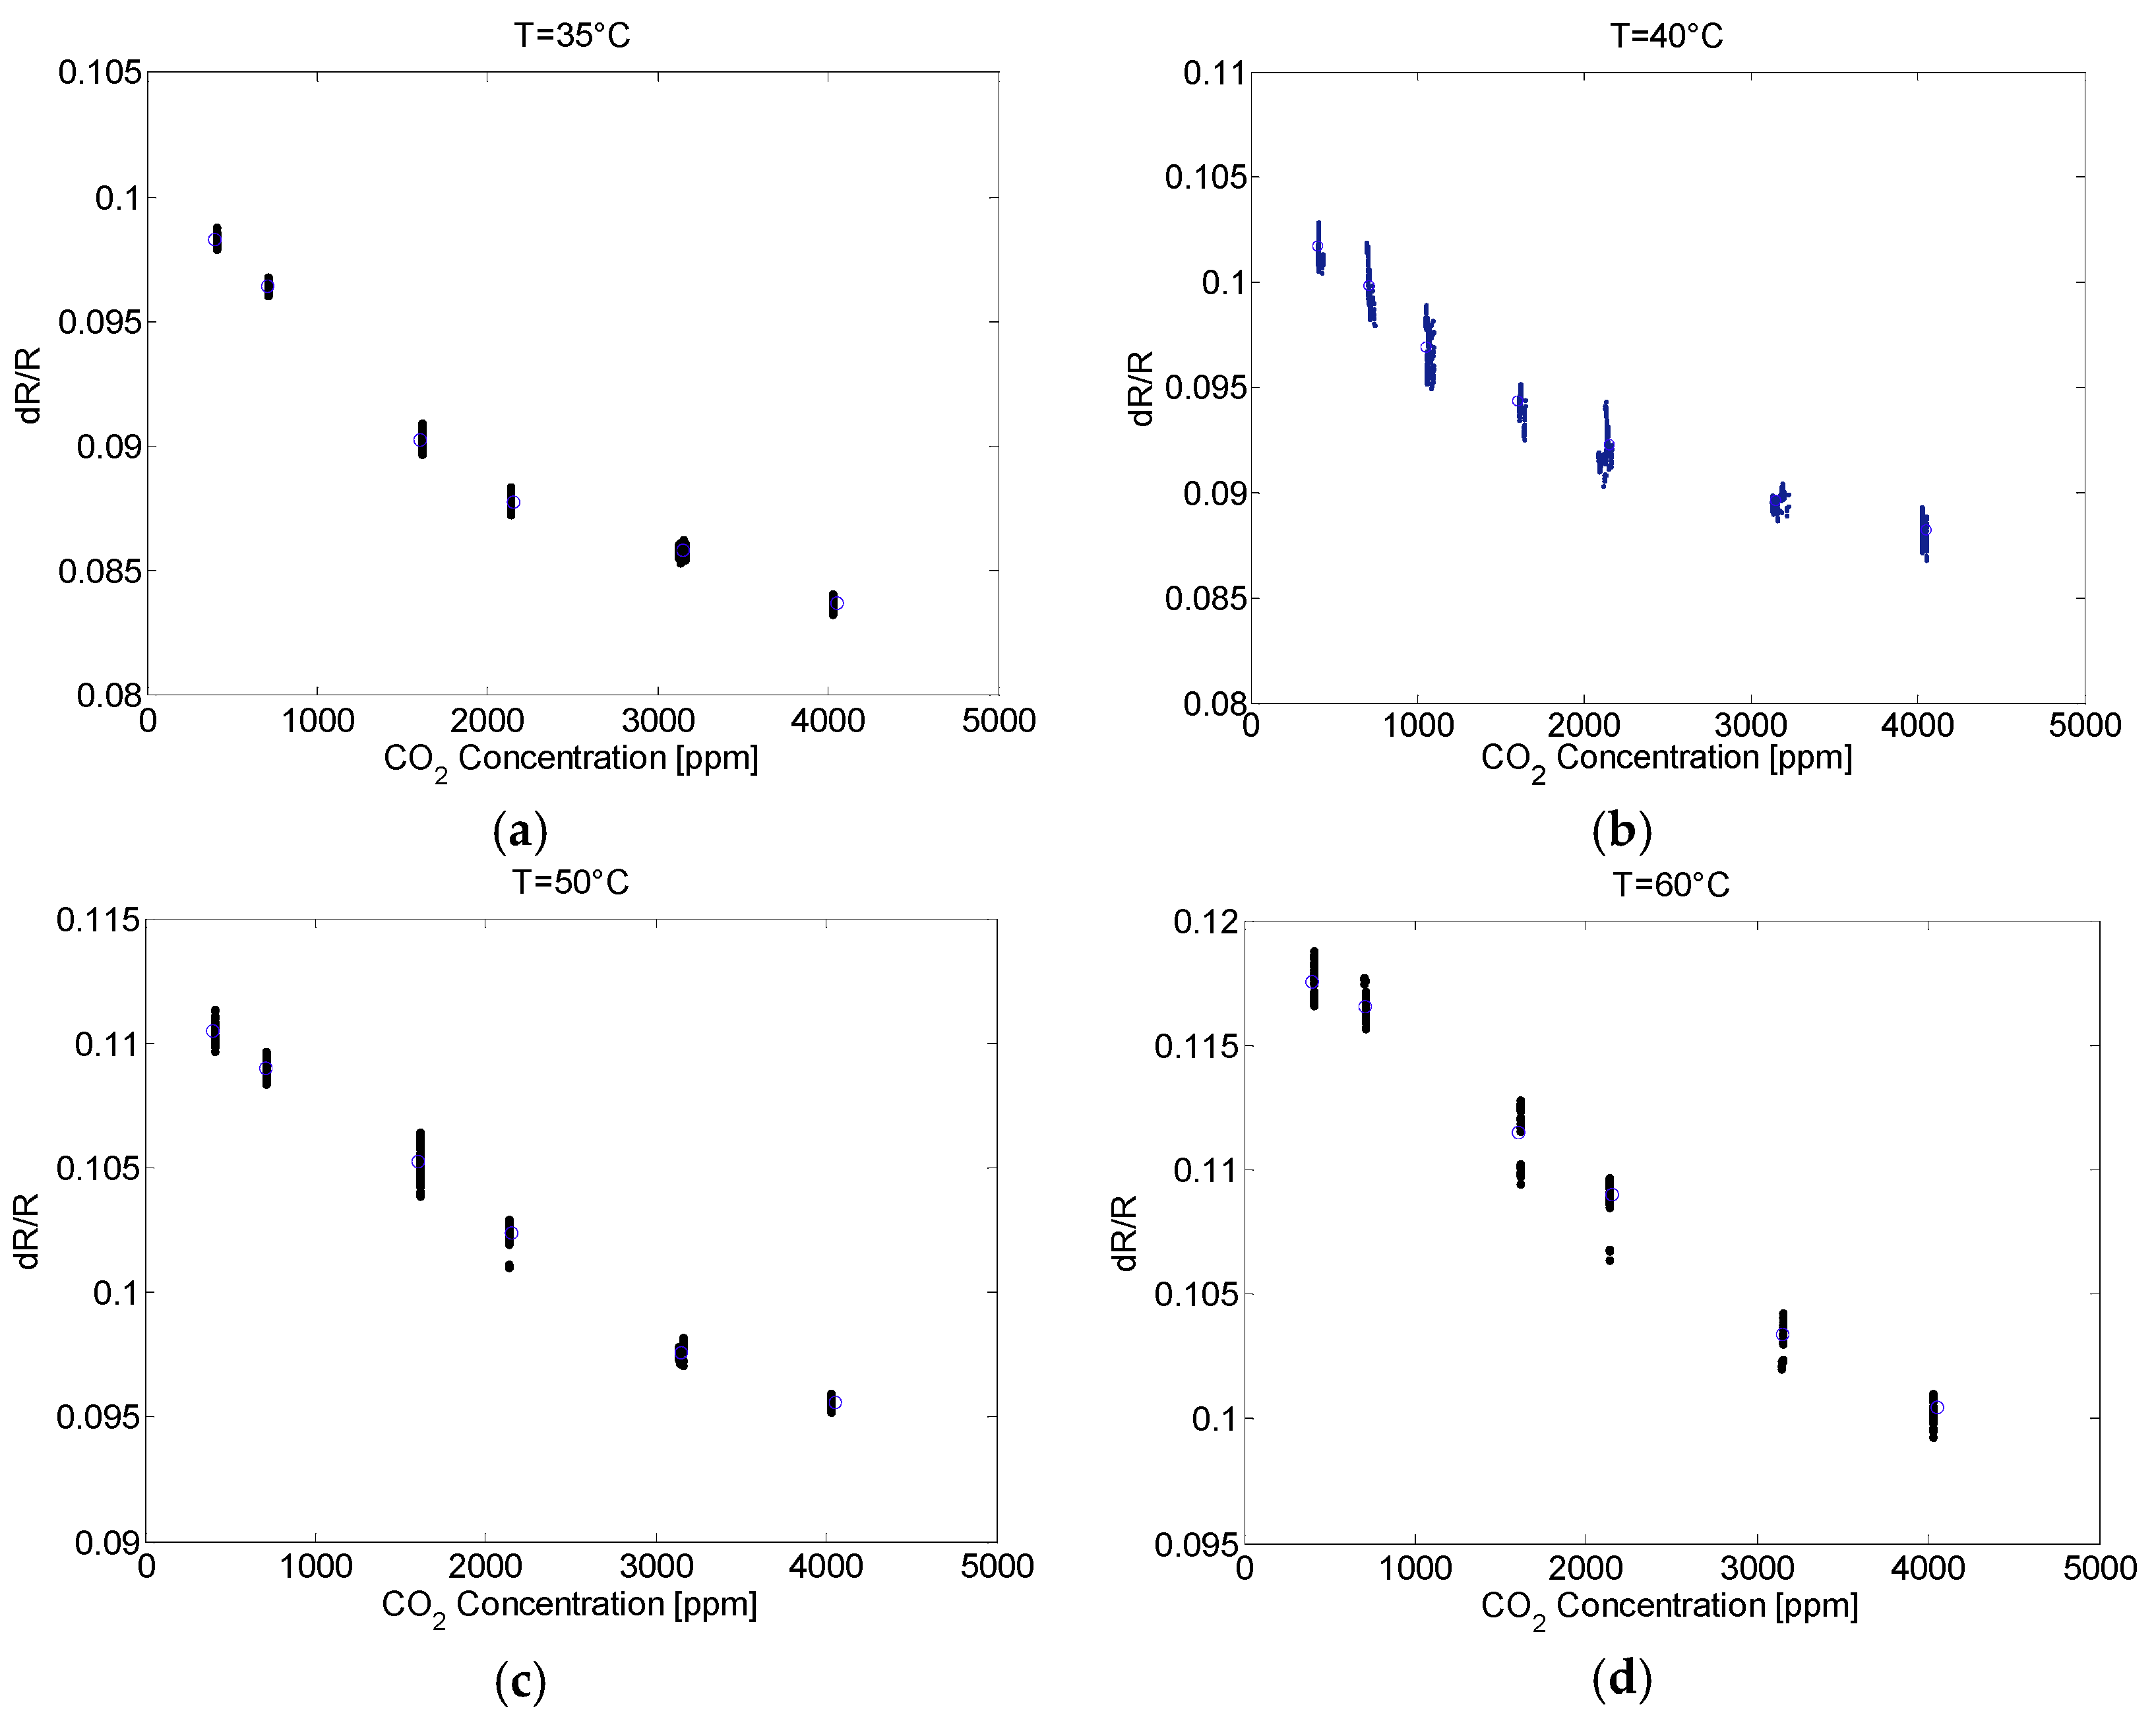
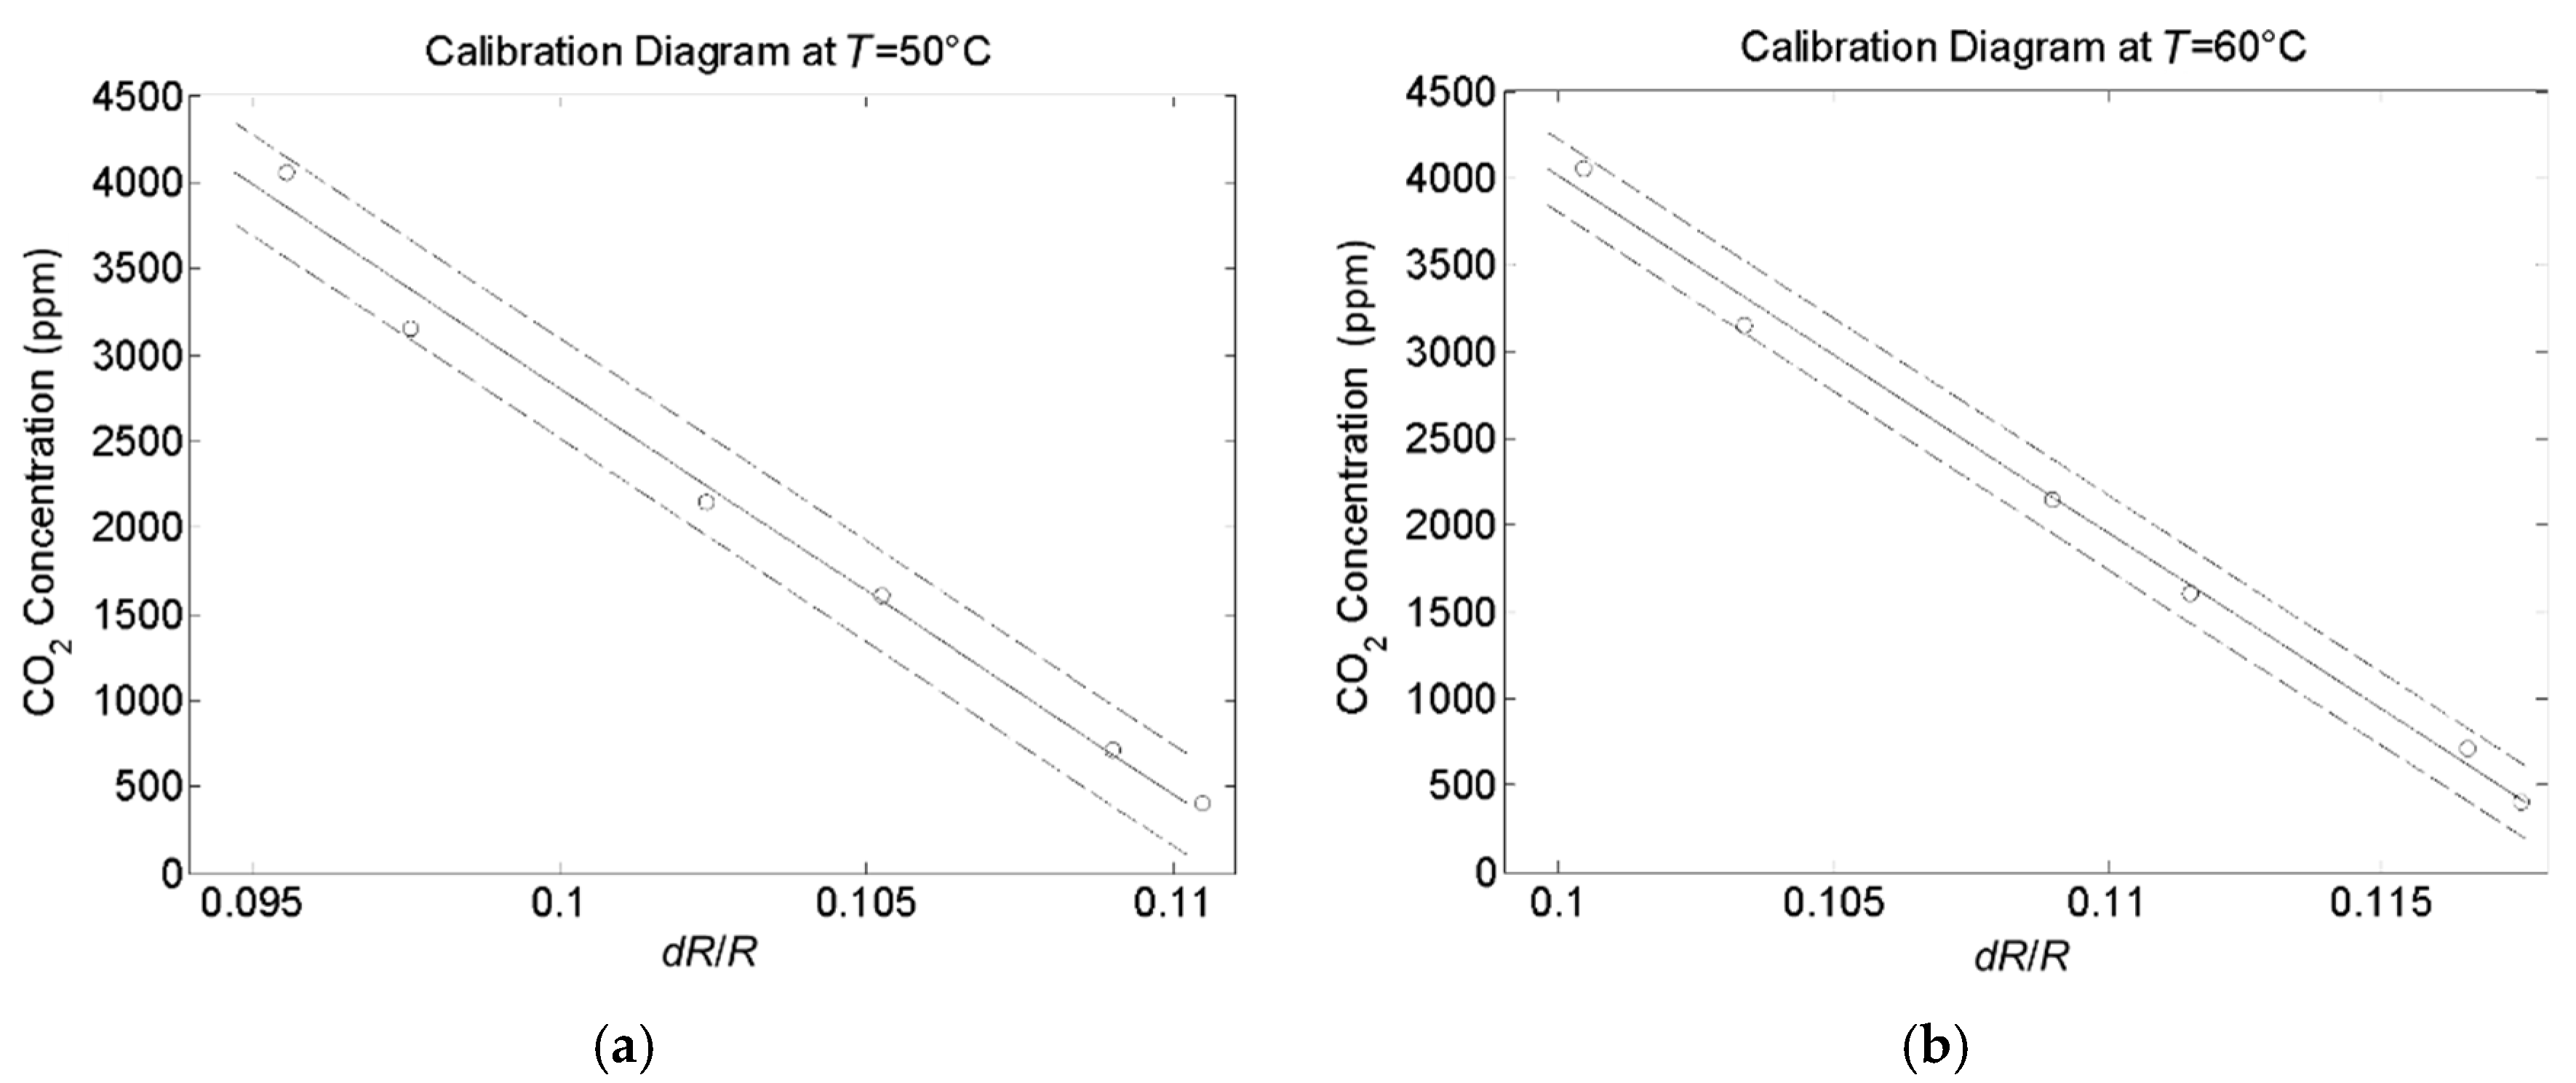
3. Experimental Results

In order to test the sensor behavior against the CO2 concentration and for increasing values of the temperature a characterization survey has been performed. As respect to results presented in [33] a wide range of CO2 concentration has been investigated. In particular, the sensor response for gas concentration up to 4050 ppm was observed, for a working temperature range of (35–65 °C). It must be considered that the investigated range of temperature is compatible with both the flexible substrate and the printed technology adopted to realize the device.
Figure 3b shows the sensor output for different values of the gas concentration. These results have been obtained by converting the output voltage provided by the conditioning electronics, shown in Figure 1c, into the relative variation of the sensor resistance. In order to properly highlight the sensor response as a function of the gas concentration, the relative variation (dR) of the sensor resistance, R, with respect to its value in clear air at 20 °C, R0, has been used:
d R R 0 = R R 0 R 0
For each concentration (see labels in Figure 3b) the response to a number of thermal cycles is reported. As it can be observed, the value of the sensor output changes with the concentration (e.g., see the maximum values of the sensor response). The sensor behavior for different heating temperatures and CO2 concentration is shown in Figure 3c. Obtained results demonstrate the possibility to use this sensor to detect CO2 concentration, once the operating temperature has been fixed.
Examples of the gas sensor response for different values of the operating temperature, T, and for increasing values of the CO2 concentration, C, are given in Figure 4. As it can be observed, the trend in the sensor response is more convenient in the upper range of the investigated temperatures, especially concerning the sensor linearity.
Figure 5 shows the sensor response in case of two operating temperatures (50 °C, 60 °C). The uncertainty band has been estimated in the 2σ level.
Models adopted to interpolate experimental data are:
C = −2.3 × 10⁵dR/R + 2.6 × 10⁴ (T = 50 °C)
C = −2.0 × 10⁵dR/R + 2.4 × 10⁴ (T = 60 °C)
The sensor responsivity, S, is defined as the ratio between the relative variation of the sensor resistance, dR/R0, and the gas concentration C:
S = d R R 0 C ( Ω Ω ppm )
The resolution, σC, has been estimated as the ratio between the standard deviation of output resistance values, σR, observed in case of clean air, and the device responsivity:
σ C = σ R S   ( ppm )
Quantity (5) must be considered as the theoretical limit of the sensor, which could be also affected by the experimental environment. The responsivity and the resolution estimated for the two operating temperatures are given in Table 1.
Repeatability tests performed with the device demonstrate a kind of reversibility. By exposing the device to clean air, the output resistivity tends to be restored to its nominal one. Anyway, it has been observed that the device is not fully reversible after a number of cycles during which the sensor is exposed to CO2 concentration. As stated in the conclusion, this is in line with the sensor target to be a disposable low cost device for Early Warning applications.
Several tests have been also carried out to test the reproducibility of the proposed technology. All the devices tested (ten) have shown behaviors similar to the trends described by model (1) and (2), with different offset and slight difference in the responsivity values. The reproducibility is limited by the technology adopted to deposit the sensing layer onto the inkjet printed electrodes. Also this behavior is in line with the aim of this work, mainly oriented to the proof-of-concept of the sensing methodology. As outlined in the conclusions, future efforts will be dedicated to fully investigate above aspects.

4. Conclusions

In this paper the possibility to realize a CO2 sensor by a rapid prototyping approach, adopting low cost technology and materials, has been demonstrated. The device shows a responsivity of 4.0 µΩ/Ω/ppm and 4.7 µΩ/Ω/ppm, in case the operating temperatures are 50 °C and 60 °C, respectively. For the sake of comparison with solutions reported in the state of the art, it can be affirmed that the device responsivity is comparable with other graphene-based CO2 sensors as reported in [34]. The observed responsivity and resolution make the device in line with the target to be a disposable low cost device for Early Warning applications.
The experimental results obtained demonstrate the functionality of the proposed sensing strategy and encourage the development of CO2 sensors by low cost inkjet printing technology.
The sensor cross-sensitivity to other species (interferences) has not been already assessed, especially considering that this work aims at investigating the development of flexible and low cost CO2 sensors to be used in Early Warning systems. In particular, specific environments have been considered as the application scenario, where the candidate gas species are assumed to be known and the exclusive presence of CO2 is supposed (no other gases are supposed to be inflated or generated into the environment under monitoring).
Another activity to be performed is to assess the advantage of using a two layer structure (PEDOT and graphene), also in terms of shielding the resistive layer of PEDOT for the effect of exogenous quantities, such as the humidity. Concerning the effects of the temperature on the sensor output, future works will be dedicated to implement temperature compensation techniques. One possibility to cope with such influences could be the use of a dummy sensor into the Wheatstone bridge adopted to implement the signal conditioning of the sensor. Another solution could rely on a temperature compensation model estimated by heating the device in clean air.
As last, future releases of the device will be designed by including a planar heater to be printed on the opposite side of the PET substrate, as respect to the one hosting the sensing layers.

Author Contributions

Methodology: B.A., G.D.P., A.P., V.M.; Investigations: B.A., S.B., C.G.; Data Curation: S.B., S.G., V.M.; Software: C.L.; Validation: S.G.

Funding

This research has been partially funded by the University of Catania within the project “Piano della ricerca Dipartimentale 2016–2018”.

Conflicts of Interest

The authors declare no conflict of interest.

References

  1. Yunusa, Z.; Hamidon, M.N.; Kaiser, A.; Awang, Z. Gas Sensors: A Review. Sens. Transducers 2014, 168, 61–75. [Google Scholar]
  2. Pearton, S.J.; Ren, F. Gallium nitride-based gas, chemical and biomedical sensors. IEEE Instrum. Meas. Mag. 2012, 15, 16–21. [Google Scholar] [CrossRef]
  3. Krutzler, C.; Unger, A.; Marhold, H.; Fricke, T.; Conrad, T.; Schütze, A. Influence of MOS gas-sensor production tolerances on pattern recognition techniques in electronic noses. IEEE Trans. Instrum. Meas. 2012, 61, 276–283. [Google Scholar] [CrossRef]
  4. Saponara, S.; Petri, E.; Fanucci, L.; Terreni, P. Sensor modeling, low-complexity fusion algorithms, and mixed-signal IC prototyping for gas measures in low-emission vehicles. IEEE Trans. Instrum. Meas. 2011, 60, 372–384. [Google Scholar] [CrossRef]
  5. Jonas, F.; Heywang, G. Technical applications for conductive polymers. Electrochim. Acta 1994, 39, 1345–1347. [Google Scholar] [CrossRef]
  6. Groenendaal, L.B.; Jonas, F.; Freitag, D.; Pielartzik, H.; Reynolds, J.R. Poly (34-ethylenedioxythiophene) and Its Derivatives: Past Present and Future. Adv. Mater. 2000, 12, 481–494. [Google Scholar] [CrossRef]
  7. Kim, G.H.; Hwang, D.H.; Woo, S.L. Thermoelectric properties of nanocomposite thin films prepared with poly(3,4-ethylenedioxythiophene) poly(styrenesulfonate) and grapheme. Phys. Chem. Chem. Phys. 2012, 14, 3530–3536. [Google Scholar] [CrossRef]
  8. Hill, E.W.; Vijayaragahvan, A.; Novoselov, K. Graphene Sensors. IEEE Sens. J. 2011, 11, 3161–3170. [Google Scholar] [CrossRef]
  9. Fowler, J.D.; Allen, M.J.; Tung, V.C.; Yang, Y.; Kaner, R.B.; Weiller, B.H. Practical chemical sensors from chemically derived graphene. ACS Nano 2009, 3, 301–306. [Google Scholar] [CrossRef]
  10. Dua, V.; Surwade, S.P.; Ammu, S.; Agnihotra, S.R.; Jain, S.; Roberts, K.E.; Park, S.; Ruoff, R.S.; Manohar, S.K. All-organic vapor sensor using inkjet-printed reduced graphene oxide. Angew. Chem. Int. Ed. 2010, 49, 2154–2157. [Google Scholar] [CrossRef]
  11. Novikov, S.; Satrapinski, A.; Lebedeva, N.; Iisakka, I. Sensitivity optimization of epitaxial graphene-based gas sensors. IEEE Trans. Instrum. Meas. 2013, 62, 1859–1864. [Google Scholar] [CrossRef]
  12. Yoon, H.J.; Jun, D.H.; Yang, J.H.; Zhou, Z.; Yang, S.S.; Cheng, M.M.-C. Carbon dioxide gas sensor using a graphene sheet. Sens. Actuators B Chem. 2011, 157, 310–313. [Google Scholar] [CrossRef]
  13. Hafiz, S.M.; Ritikos, R.; Whitcher, T.J.; Razib, N.M.; Bien, D.C.S.; Chanlek, N.; Nakajima, H.; Saisopa, T.; Songsiriritthigul, P.; Huang, N.M.; et al. A practical carbon dioxide gas sensor using room-temperature hydrogen plasma reduced graphene oxide. Sens. Actuators B Chem. 2014, 193, 692–700. [Google Scholar] [CrossRef]
  14. Mäntysalo, M.; Pekkanen, V.; Kaija, K.; Niittynen, J.; Koskinen, S.; Halonen, E.; Mansikkamäki, P.; Hämeenoja, O. Capability of Inkjet Technology in Electronics Manufacturing. In Proceedings of the Electronic Components and Technology Conference, San Diego, CA, USA, 26–29 May 2009. [Google Scholar]
  15. Dimatix Material Printer DMP-2850. Available online: www.fujifilmusa.com/shared/bin/dimatix_materials_printer_dmp-2850.pdf (accessed on 10 February 2019).
  16. Functional Polymer/Printed Electronics. Available online: www.microdrop.de/functional-polymer-printed-electronics.html (accessed on 10 February 2019).
  17. Al-Chami, H.; Cretu, E. Inkjet printing of microsensors. In Proceedings of the IEEE 15th International Mixed-Signals, Sensors, and Systems Test Workshop, Scottsdale, AZ, USA, 10–12 June 2009. [Google Scholar]
  18. Wang, T.; Cook, C.; Derby, B. Fabrication of a Glucose Biosensor by Piezoelectric Inkjet Printing. In Proceedings of the Third International Conference on Sensor Technologies and Applications, Athens, Greece, 18–23 June 2009. [Google Scholar]
  19. Shao, B.; Chen, Q.; Amin, Y.; Hllstedt, J.; Liu, R.; Tenhunen, H.; Zheng, L. Process-dependence of inkjet printed folded dipole antenna for 2.45 GHz RFID tags. In Proceedings of the 3rd European Conference on Antennas and Propagation, Berlin, Germany, 23–27 March 2009. [Google Scholar]
  20. Zheng, L.; Rodriguez, S.; Shao, B. Design and implementation of a fully reconfigurable chipless RFID tag using Inkjet printing technology. In Proceedings of the IEEE International Symposium on Circuits and Systems, Seattle, WA, USA, 18–21 May 2008. [Google Scholar]
  21. Amin, Y.; Prokkola, S.; Botao, S.; Hallstedt, J.; Tenhunen, H.; Zheng, L. Inkjet printed paper based quadrate bowtie antennas for UHF RFID tags. In Proceedings of the 11th International Conference on Advanced Communication Technology, Phoenix Park, Korea, 15–18 February 2009. [Google Scholar]
  22. Andersson, H.; Manuilskiy, A.; Unander, T.; Lidenmark, C.; Forsberg, S.; Nilsson, H.-E. Inkjet printed silver nanoparticle humidity sensorwith memory effect on paper. IEEE Sens. J. 2012, 12–16, 1901–1905. [Google Scholar] [CrossRef]
  23. Andò, B.; Baglio, S. Inkjet-Printed Sensors: A Useful Approach for Low Cost, Rapid Prototyping. IEEE Instrum. Meas. Mag. 2011, 14, 36–40. [Google Scholar] [CrossRef]
  24. Andò, B.; Baglio, S. All-Inkjet Printed Strain Sensors. IEEE Sens. J. 2013, 13, 4874–4879. [Google Scholar] [CrossRef]
  25. Andò, B.; Baglio, S.; Baù, M.; Bulsara, A.R.; Ferrari, V.; Ferrari, M.; L’Episcopo, G. A Nonlinear Energy Harvester by Direct Printing Technology. Procedia Eng. 2012, 47, 933–936. [Google Scholar] [CrossRef] [Green Version]
  26. Andò, B.; Baglio, S.; Bulsara, A.R.; Marletta, V.; Ferrari, V.; Ferrari, M. A Low-Cost Snap-Through Buckling Inkjet Printed Device for Vibrational Energy Harvesting. IEEE Sens. J. 2015, 15, 3209–3220. [Google Scholar] [CrossRef]
  27. Andò, B.; Baglio, S.; Lombardo, C.O.; Marletta, V.; Pistorio, A. A Low-Cost Accelerometer Developed by Inkjet Printing Technology. IEEE Trans. Instrum. Meas. 2016, 65, 1242–1248. [Google Scholar] [CrossRef]
  28. Andò, B.; Baglio, S.; Bulsara, A.R.; Emery, T.; Marletta, V.; Pistorio, A. Low-Cost Inkjet Printing Technology for the Rapid Prototyping of Transducers. Sensors 2017, 17, 748. [Google Scholar] [CrossRef]
  29. Srichan, C.; Saikrajang, T.; Lomas, T.; Jomphoak, A.; Maturos, T.; Phokaratkul, D.; Kerdcharoen, T.; Tuantranont, A. Inkjet printing PEDOT:PSS using desktop inkjet printer. In Proceedings of the 6th International Conference on Electrical Engineering/Electronics, Computer, Telecommunications and Information Technology, Pattaya, Thailand, 6–9 May 2009. [Google Scholar]
  30. Liu, Y.; Cui, T.; Varahramyan, K. All-polymer capacitor fabricated with inkjet printing technique. Solid State Electron. 2003, 47, 1543–1548. [Google Scholar] [CrossRef]
  31. Fuller, S.B.; Wilhelm, E.J.; Jacobson, J.M. Ink-jet Printed Nanoparticle Microelectromechanical Systems. J. Microelectromech. Syst. 2002, 11, 54–60. [Google Scholar] [CrossRef]
  32. Waghuley, S.A.; Yenorkar, S.M.; Yawale, S.S.; Yawale, S.P. SnO2/PPy Screen-Printed Multilayer CO2 Gas Sensor. Sens. Transducers J. 2007, 79, 1180–1185. [Google Scholar]
  33. Andò, B.; Baglio, S.; di Pasquale, G.; Pollicino, A.; D’Agata, S.; Gugliuzzo, C.; Lombardo, C.; Re, G. An Inkjet Printed CO2 Gas Sensor. Procedia Eng. 2015, 120, 628–631. [Google Scholar] [CrossRef]
  34. Smith, A.D.; Elgammal, K.; Fan, X.; Lemme, M.C.; Delin, A.; Råsander, M.; Bergqvist, L.; Schröder, S.; Fischer, A.C.; Niklaus, F.; et al. Graphene-based CO2 sensing and its cross-sensitivity with humidity. RSC Adv. 2017, 7, 22329–22339. [Google Scholar] [CrossRef]
Figure 1. (a) The real view of the sensor. The sensor dimensions are: 1.8 cm by 1 cm, with a thickness of about 140 µm. The IDT fingers (1) have a width of 200 µm, a length of 6 mm, a thickness of 200 nm and a track spacing of 350 µm. A customized socket was used to convey signals to the conditioning electronics (2) and blocked by screws (3). Washers and screws (4) have been also used to fix the sensor to the experimental setup; (b) the sensor structure (not in scale) and (c) the electronics adopted for conditioning the CO2 printed sensor.
Energies 12 00557 g001
Figure 2. The tool used to assess performances of the sensor developed. The system is composed by an insulated chamber, a reference CO2 sensor and a gas injection system. Sensors data and flow control are managed by a dedicated LabVIEW instrument.
Energies 12 00557 g002
Figure 3. (a) The flow diagram of the measurement protocol implemented for the lab scale prototype of the Inkjet Printed CO2 sensor; (b) Response of the gas sensor during the heating cycles for different values of the CO2 concentration; (c) The sensor behavior as a function of the heating temperatures and the CO2 concentration.
Energies 12 00557 g003
Figure 4. Printed sensor response in terms of relative variation of the output resistance for increasing values of the CO2 concentration, for different values of the operating temperature: (a) 35 °C, (b) 40 °C, (c) 50 °C and (d) 60 °C. Vertical dots state for the dispersion of repeated observations of the sensor response; the circles are the mean values of repeated observations.
Energies 12 00557 g004
Figure 5. The calibration diagrams for two operating temperatures: (a) 50 °C and (b) 60 °C. The uncertainty bands are represented by the dotted lines.
Energies 12 00557 g005
Table 1. Responsivity and resolution of the CO2 sensor estimated for the two operating temperatures of 50 °C and 60 °C.
T (°C)Responsivity (Ω/Ω/ppm)Resolution (ppm)
504.01 × 10–6400
604.75 × 10–6420

