Abstract
With the pervasiveness of electric vehicles and an increased demand for fast charging, stationary high-power fast-charging is becoming more widespread, especially for the purpose of serving pure electric buses (PEBs) with large-capacity onboard batteries. This has resulted in a huge distribution capacity demand. However, the distribution capacity is limited, and in some urban areas the cost of expanding the electric network capacity is very high. In this paper, three battery energy storage system (BESS) integration methods—the AC bus, each charging pile, or DC bus—are considered for the suppression of the distribution capacity demand according to the proposed charging topologies of a PEB fast-charging station. On the basis of linear programming theory, an evaluation model was established that consider the influencing factors of the configuration: basic electricity fee, electricity cost, cost of the energy storage system, costs of transformer and converter equipment, and electric energy loss. Then, a case simulation is presented using realistic operation data, and an economic comparison of the three configurations is provided. An analysis of the impacts of each influence factor in the case study is discussed to verify the case results. The numerical results indicate that the appropriate BESS configuration can significantly reduce the distribution demand and stationary cost synchronously.
1. Introduction
The energy and environmental crises have become increasingly serious with the advancement of human society: an escalating energy demand, the exhaustive nature of fossil fuels, and CO2 emissions are among the major threats [1]. There is a universal consensus that in order to achieve the goals of sustainable development and a low-carbon economy in the transportation field, transport electrification, exemplified by electric vehicles (EVs), must be implemented worldwide [2]. Replacing fossil fuel vehicles with EVs can also provide health benefits to people by reducing air pollution [3].
With the rapid development of battery technology, a recharge running range of greater than 100 km on a battery charged for less than 10 min in the fast charging mode is easily achievable [4]. Additionally, high-power direct current (DC) fast charging has become available and popular. Compared with normal alternating current (AC) charging and battery-swapping charging, DC fast charging has a shorter recharging duration and lower investment for different types of spare battery packs or vehicles [5,6]. The pure electric bus (PEB) has characteristics that are distinct from those of private EVs: namely, the PEB has a larger onboard battery, operates in strict accordance with a route schedule, and is charged at the driver’s will at a fixed station with limited intervals. All of these factors lead to a greater distribution capacity demand and more severe charging load fluctuations [7]. Moreover, the investment needed to expand the distribution capacity is huge, particularly in big cities; for example, expansion of the power grid capacity in Beijing is estimated to cost 1500 USD/kVA. With the city distribution network operating under heavy load, the plan to implement public transport electrification may face considerable challenges [8].
To promote the collaborative development between EVs and the distribution network, some research has focused on the optimization of charging EV to best use the existing power sources or reduce the charging electricity cost. A model of the impacts of EV charging station load on the distribution network was established in [9], and it used several influence factors: voltage stability, reliability, power loss, and economic loss by voltage deviation. The results of a detailed simulation with the IEEE 33 bus test system illustrated the influence of EV charging station load on the distribution network. The research was on the distribution network level, the suppression of distribution capacity demand of fast-charging station was not mentioned. The authors of [10] proposed a charging schedule planning method that was based on an actual electric bus system, and they effectively reduced the electricity cost with three-level time-of-use (TOU) tariffs. The charging power was 50 kW for a single route of ten electric buses, but the influence of the distribution capacity was not considered. In another study, a daytime charging strategy with a charging price for private EVs was proposed, and the charging cost was practically reduced by achieving maximum utilization of photovoltaic power combined with distribution capacity constraints [11]. The authors in [12] presented a coordinated charging strategy for electric taxis in a temporal and spatial domain, and a Particle Swarm Optimization (PSO) algorithm was used to balance the charging load dispatch among different stations, as well as the charging times for the electric taxis. These studies have concentrated on private EVs or electric taxis with distribution capacity constraints, and their aim has been to improve charging costs. On the other hand, the distribution capacity demand of a PEB fast charging station, as well as the charging power which is as high as several hundred kilowatts, will continue to grow with the increasing number of PEBs and the accumulation of many necessary charging loads. Thus, more effective and direct strategies need to be developed to handle this issue.
Distributed energy resources (DERs) have been developed quickly and can be used effectively to meet the charging power demand in distribution networks and reduce EV owners’ basic electricity costs [13]. The charging load of a PEB fast charging station mostly occurs in the daytime and can be as high as several hundred kilowatts; this is different from the private EV, whose load primarily occurs at night and is only several kilowatts [14]. Photovoltaic power generation needs more space to generate more power, and wind power generation has anti-peak power and an allocation characteristic; therefore, neither of them is suitable for stations in cities. A gas turbine based combined cooling, heating and power system is economic and highly efficient, but it requires a reliable and sufficient gas supply [15]. The battery energy storage system (BESS) is widely used for peak power shaving in many scenarios; for example, it has been used as a buffer to reduce charging load fluctuations and to shave peak power [16]. For a fast charging station, the ability to suppress peak charging power primarily depends on the capacity of the BESS [17], and the economics of the BESS application determine the deployment scale. Besides that, charging topologies affect the configuration strategy. The authors in [18] proposed a DC bus concept for plug-in EVs and established a charging topology was established with a bipolar DC bus. The later was based on a central neutral-point clamped converter and provided a flexible connection to loads and electrical storage systems (ESSs) with higher voltage and power.
The authors of [19]—a study on fast charging stations for plug-in hybrid EVs—applied electrical storage systems to reduce the station’s operational costs and alleviate the negative impacts of its operation on the power grid. A BESS configuration model that was based on a general charging topology was proposed in [20], and it considered the investment costs and benefits of a BESS. As a result, the peak charging load of the PEB fast charging station significantly decreased. The authors in [21] established a business model of a private EV charging station with a stationary Li-ion battery pack. The model, which considered the battery lifetime, power charges, and electricity tariffs, was used to alleviate the high costs of power charges and grid investment, but the detailed configuration method and results were not given. An integer nonlinear programming model that incorporated the investment cost, lifespan, and time-of-use electricity price was proposed to estimate the value of an energy storage system (ESS) for the electric bus fast charging station, and the effectiveness of two kinds of Li-ion battery was compared [22]. However, only one kind of BESS configuration was researched, and energy loss was not included in the model. The authors in [23] explored the technical and economic suitability of coupling a ground ESS to a DC fast charge unit for mitigating the demand charges and lessening the impact on the local electricity network. However, neither the numerical value of the ESS configuration nor the influence factors were taken into account.
The published studies on the ESSs of charging stations have been mostly concerned with the aspects of optimized control strategies or economic estimation. To develop a BESS configuration of a high power PEB fast charging station, the following points needs to be established:
- Charging topology: the possible configuration allocations and the size of a single BESS must be determined.
- Integration points of the BESS: the charge-discharge power and energy loss are dependent on this factor.
- Related influence factors: the model will be more accurate if more aspects are considered.
This work focuses on BESS configuration methods for a newly high power PEB fast-charging station in Beijing, and aims to establish an economical method of BESS configuration to suppress the distribution capacity demand. The present and improved charging topologies of the station were presented based on actual applications. Considering the charging topologies and load characteristics analyzed, three practical BESS configuration strategies are proposed, i.e., integrating the BESS with the AC bus, each charging pile, and the DC bus. In order to compare the investment costs and benefits of the three methods with time-of-use tariffs, a novel multi-objective cost model was established according to Linear Programming theory. Compare with the existing literature, the model includes the cost factors such as basic electricity fees, electricity cost, cost of the energy storage system, costs of the transformer and converter equipment, and electric energy loss. The electric energy loss of the transformers, converters, and battery by power flow was newly modeled, and the accumulated charge-discharge number was adopted in the model to evaluate the battery lifetime. A case simulation was carried out according to a realistic operation load and practical parameters. The most economical BESS capacity was determined, and the case study result was analyzed and verified through simulations for each influence factor.
The case results show that integrating the BESS with the DC bus is the most economical method at the given charging load. Relative to the station cost without a BESS, the BESS/DC strategy yields a reduction of 160.92 USD per day during the lifetime of the battery (8 years), and the peak charging power is reduced by 67.03%. Although the cost of transformers and converters is higher, integrating the BESS with the AC bus is the most effective method to suppress peak charging power. This research can be applied widely to evaluate the economics for the high-power PEB fast charging stations to suppress distribution capacity demand using a BESS. Furthermore, the study may be used to facilitate the application of PEBs in areas with limited distribution network resources and thus alleviate environmental problems.
The rest of this paper is organized as follows: charging topologies and BESS configuration strategies are presented in Section 2. In Section 3, novel models of BESS configuration and a solution method are developed in detail. The case simulation and analysis of each influence factor are detailed in Section 4. Then, Section 5 presents the discussion. Finally, conclusions are put forth in Section 6.
2. Scenarios of BESS Configuration
2.1. Charging Topologies
As the important infrastructure for transportation electrification, the charging station plays a key role in the application of EVs. In the public transportation field, due to the plan that more than 10,000 PEBs will be deployed in Beijing in three years, PEB fast-charging stations are quickly emerging. The service mode of the stations is determined by the PEB fleet operation characteristics. Due to the convenience of fleet operation and charging, the PEBs in the fleet are usually divided to different lines and charged at a designated station, the launch or the terminal PEB fast charging station. The scale of the charging station and the distribution capacity depend on the number of PEBs to be served. Due to the great onboard battery capacity (119.2 kWh) and limited charging interval (usually less than 15 min), the piles’ rated charging power the new fast charging station is as high as 450 kW/750 V.
According to the charging power conversion procedure, the PEB fast charging systems in Beijing can be classified as two types: an applied type with an individual AC/DC conversion charging circuit (original type) and an under construction type with centralized AC/DC conversion with a DC bus (improved type). As shown in Figure 1a, the voltage of power is reduced from 10 kV to 380 V by the transformer, followed by conversion to DC 750 V by the AC/DC charging module for PEBs. In order to decrease the loss during voltage conversion, the improved type (shown in Figure 1b) adopts a DC bus that combines AC/DC conversion modules to meet the DC charging demand. A comparison of these two types of charging topologies reveals that the standby energy cost and equipment investment of the original type may be higher than the improved type, although the system’s operational control is simple.
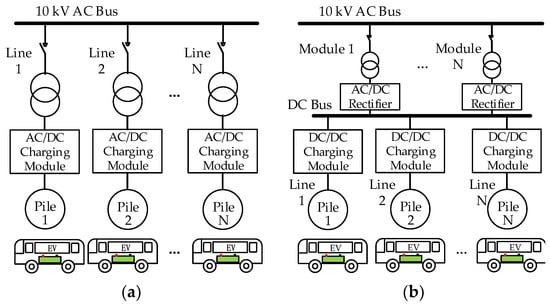
Figure 1.
Topologies of two types of fast charging systems. (a) Charging system with AC bus (original type); (b) Charging system with DC bus (improved type).
2.2. Charging Load Charateristics
The studied PEB fast charging station described in this paper serves five bus lines and has eight configured charging piles. The PEBs randomly stop at the charging piles to charge when returning to the station. According to the running distance, onboard lithium battery capacity, and launch schedule, the charging duration is 5–12 min, and the rated charging power is 450 kW/750 V. Depending on the various working conditions and charging number, the realistic charging power is dynamic.
Due to random and high-power charging characteristics, the stationary peak charging power is extremely high, and the charging load fluctuations are substantial. The load curve produced by the eight charging piles is shown in Figure 2. The maximum peak charging power is 1595.0 kW, but the average charging power is only 321.7 kW. The charging load rate is 20.17%, and the daily charging electricity (from 06:00 to 22:00) is approximately 5146.8 kWh. According to the average charging power and charging load rate, the configured stationary distribution capacity is too large and uneconomical. In this context, the distribution network capacity should be significantly expanded to satisfy the large increase in charging demand duo to the fast-growing number of deployed PEBs. Thus, the expanded investment cost of the unit distribution capacity is nearly 1500 USD/kW in Beijing, and it may be very difficult to raise billionaire-level funds. Furthermore, it may seriously affect the development plan for low-carbon emission PEBs.
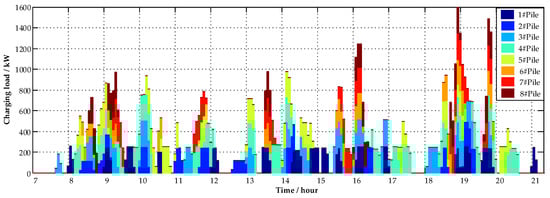
Figure 2.
Realistic charging loads of each pile in one PEB fast charging station.
2.3. BESS Configuration Strategies
According to the existing and proposed charging topologies of PEB fast charging stations, there are three possible integration points: the AC bus, charging pile, and DC bus. The three BESS configurations are shown in Figure 3. Configuring the BESS at the AC bus side (Scenario 1) is the simplest method for an existing charging topology. Also, the charging load of the AC bus may be smoother than that of a single pile, due to the complementarity of the charging power of all piles in terms of time. Another configuration method is to integrate the BESS with each pile (Scenario 2) to regulate a single pile’s charging load. The advantage of this configuration is that the capacity of a single BESS may be small, and the electricity cost of AC/DC conversion can be saved, compared with the AC bus mode. For the proposed charging topology, the BESS connects to the DC bus (Scenario 3) and can directly provide or absorb DC power, so the efficiency of power conversion may be higher. These three BESS configurations each have different advantages. Their detailed performances for energy efficiency, equipment investment, electricity cost and battery capacity need to be further analyzed and compared using models and data.
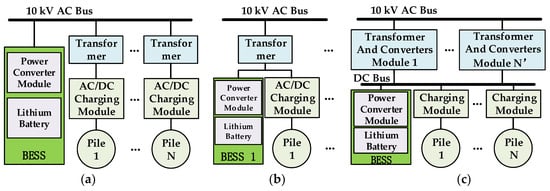
Figure 3.
Three strategies of BESS configuration. (a) Scenario 1: Integrate the BESS with the AC bus; (b) Scenario 2: Integrate the BESS with each charging pile; (c) Scenario 3: Integrate the BESS with the DC bus.
3. BESS Configuration Model
The BESS configuration model contains related influence factors, objective functions and constraint conditions. We list the symbols used to describe the model in Table 1.

Table 1.
List of some symbols used in the description of the BESS configuration.
3.1. Models of Influence Factors
According to the BESS configuration strategies, we classified the economic influence factors of BESS allocation as follows: basic electricity cost of the station, charging electricity cost, investment of transformer and converters, energy conversion loss, and BESS cost. Then, the costs of all the factors in the mathematical model were defined and calculated to determine the daily cost during the BESS lifetime on the basis of those single objectives. The advantages and disadvantages of each factor of the three BESS configurations were then established. The objective functions of the influence factors are shown below.
- (1)
- Basic electricity cost:where is the cost of basic electricity, which is composed of the basic electricity price and peak charging power of the PEB fast-charging station.
- (2)
- Charging electricity cost:where is the electricity consumption at time , and is the electricity cost of the charging station. is the time-of-use electricity tariff at time .
- (3)
- Investment of transformer and converters:where and are the translated daily investment of transformers and converters, respectively, of the charging topology during the entire lifetime [24].
- (4)
- Energy conversion loss:where , and are the electric energy losses during the charging process of the three BESS configuration scenarios. , , and are the efficiency of the transformer, AC/DC conversion, BESS charging, and discharging, respectively.
- (5)
- Full lifetime cost of BESS. For the BESS, the energy capacity and charge-discharge power are the two key parameters affecting the cost [25]. The cycle lifetime of battery was introduce to the BESS cost model in [22], the new formulation of BESS full lifetime cost is as follows:where is the full lifetime cost of the BESS, and and are the translated daily BESS battery costs and connected converter costs for the estimated lifetime in accordance with the initial investment. and are the number of the BESSs charging and discharging per day, respectively. Those variables are also used to calculate the cycle lifetime of the BESS. is the calendar lifetime of the BESS. is the total power of the BESS in different scenarios at time . Comparing the calendar lifetime and cycle lifetime, the minor value should be used in the cost calculation.
3.2. Objective Functions
When choosing construction strategies for a charging topology and battery energy storage system, an evaluation model containing the more influence factors is the better. Since the preference of operators may be different, the performance of the influence factors should be carefully defined. We introduced weight coefficients to the multi-objective functions to control for the effectiveness of each influence factor and transform multiple objectives into a single one. The overall objective function is shown below:
3.3. Model Constraints
As a constituent of a PEB fast-charging station, the operation of the BESS should be subject to the charging demand of PEBs and the charge-discharge limits of the lithium battery [26]. If using the BESS to reduce the distribution capacity demand, the total charging power will be satisfied by the distribution network and BESS output power. Besides that, the battery of the BESS must be charging and discharging under the safety state of charge (SOC) threshold value and charging rate.
- (1)
- Total power balance:where is the power from the grid at time ; , , and are the BESS power of configuration scenario 1, 2, and 3, respectively, at time ; charging power is indicated by +; discharging power is indicated by −; is the charging power of charging pile at ; and is the period of [ − 1,].
- (2)
- BESS energy balance: In order to achieve a sustainable operation of the BESS, the charging energy should match the discharging energy at the end of each operation cycle:
- (3)
- Safety SOC range of BESS: During the BESS operational procedure, the SOC of the BESS should be constrained to a suitable range, called the depth of discharge (DOD), to keep the BESS working well. This also decides the total discharging and charging energy of the BESS [27]. For example, the SOC range of the BESS is 20–90%, which means that the DOD is 70%. The formulation of SOC is as follows:where is the state of energy of the battery at , is the discharge efficiency, and is the charge efficiency.
- (4)
- Charge-discharge rate of BESS: The charge-discharge rate of the BESS is the ratio of the charge-discharge current and the capacity of the BESS, and it determines the BESS’s maximum charging and discharging power. In this paper, the charge-discharge rate is the ratio of power and BESS energy, which is limited to a set value to maintain the lifetime and safety of the batteries:
- (5)
- Node power direction: As the BESS is integrated according to a charging topology, the node power with BESS discharging power will change. In order to prevent reverse power flow, the total power demand of the nodes should not be less than the discharging power of the BESS of the nodes:
3.4. Optimization Algorithum and Steps
In this study, multiple objects were formulated to generate a single object optimization issue. The multi-level constraint conditions were also linearized and simplified. So, Linear Programming was suitable to solve this problem. The algorithm process, as a part of optimization process, is shown in Figure 4.
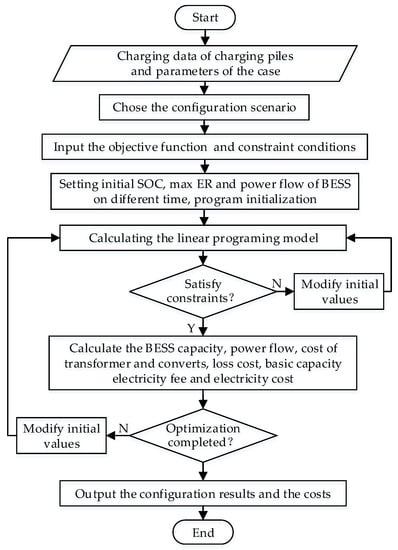
Figure 4.
BESS configuration algorithm process of a PEB fast charging station.
According to the process, the power of the BESS is the key part of the optimization. The detailed calculation steps are as follows:
- Step 1:
- Set the simulation cycle time to 24 h; set the sampling period, , on the basis of optimized time interval, which can decide the number of samples, ; take the energy of the BESS at each sample time as the variable, .
- Step 2:
- Calculate the power of the BESS of each sample spot on the basis of the sample cycle as ; the positive value means charge, and a negative value means discharge.
- Step 3:
- According to the maximum DOD, calculate the energy and power of the BESS, as shown in Equations (23) and (24):
4. Cases and Analysis
4.1. Case Settings
According to the realistic charging station scenarios and topologies presented previously, the detailed parameters of the BESS configuration are shown in Table 2. Although the equipment size and type are different in each of the three proposed configuration scenarios, there is little difference in the cost. As general configuration research, this paper sets the same weight coefficient for the five influence factors, so the weight coefficient is 0.2. In other studies with different priorities for different aspects, the weight coefficients can be modified so that preferences are represented. The simulation interval for one day is one minute. And the battery type of BESS is lithium ferrous phosphate (LFP). The TOU tariffs are shown in Table 3.
Table 2.
Parameter settings for the case.
Table 3.
Time-of-use (TOU) electricity price.
4.2. Optimization Configuration
According to the case parameters and optimization steps, the comprehensive BESS configuration was carried out. The detailed results of the three scenarios are shown in Table 4. The Scenario 3, where the BESS connects to the DC bus, is the best configuration strategy. It has the smallest unit electricity cost, 0.1667 USD/kWh·day; the capacity of the BESS is 797.96 kWh; the total cost of the charging system is 857.73 USD/day; the peak charging power is reduced to 525.9 kW. In Scenario 1, the unit cost and total cost are 0.1748 USD/kWh·day and 899.48 USD/day, and the peak charging power is decreased to 492.9 kW. In Scenario 2, the unit cost and total cost are similar to those in Scenario 3, 0.1668 USD/kWh·day and 858.05 USD/day, and the peak charging power is reduced to 520.0 kW. Compared with the original cost of 1018.65 USD/day, Scenario 1, Scenario 2 and Scenario 3 can respectively decrease the cost by 119.26 USD/day, 160.60 USD/day, and 160.92 USD/day. Considering the engineering application feasibility of this case, Scenario 3 is the most attainable and economical strategy. The load regulation performances of the three BESS configuration scenarios are shown in Figure 5.
Table 4.
Results of three BESS configuration scenarios.
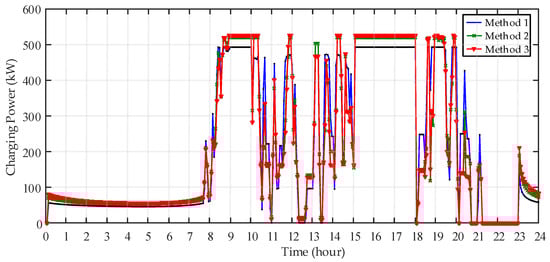
Figure 5.
Load regulation performances of the three BESS configuration Scenarios.
4.3. Case Analysis
According to the case optimization result, Scenario 3 is the best BESS configuration strategy. In order to verify this conclusion, we separately analyzed all the influence factors of the objective function. The influence factor trends are helpful for estimation and analysis of the results. On the basis of the case parameters and the function constraint conditions, the performance of each influence factor can be determined.
4.3.1. Basic Electricity Analysis
The basic electricity cost is determined by the peak charging power and basic electricity cost. A short duration and high charging power lead to huge load fluctuations and a low load rate. Peak charging power suppression is a key method to delay the distribution network expansion:
On the basis of analyzing the charging power and electricity, this study sets the capacity of the BESS between 0 and 4000 kWh to research the influence on the charging power. As shown in Figure 6, the three BESS configuration methods can significantly reduce the peak charging power within a BESS capacity range of 0–800 kWh, although Scenario 2 is less efficient than the other two scenarios. Scenario 2 is the strategy whereby the BESS is divided equally and integrated with each charging pile; the charging loads of the piles cannot be well reduced due to the size of the piles’ BESS and absence of load interactions between piles. Besides that, the results of peak charging power suppression become negligible with greater BESS capacity. This means that there is an economic inflection point of BESS capacity in peak charging power suppression with BESS.
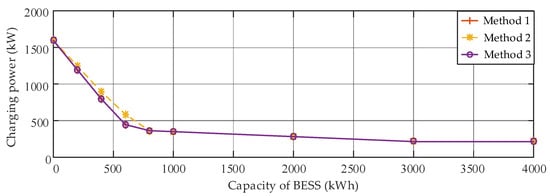
Figure 6.
Performance of peak charging power reduction in three scenarios with BESS configuration.
To consider the cost of the BESS, the configurations in the three scenarios can be carried out with the previous constraint conditions were applied to the objective function in Equation (1). The results are shown in Table 5. Scenarios 1 and 3 are more economical than Scenario 2 from the aspect of the basic electricity reduction with the BESS. Compared with the original data, the benefit of basic electricity reduction with the BESS is up to 97.02 USC/day.
Table 5.
Basic electricity and BESS cost optimization of different BESS configuration scenarios.
4.3.2. Charging Electricity Analysis
The charging electricity cost is a main aspect that influences the charging station operation, especially with the time-of-use (TOU) electricity price. The configuration of the BESS can shift the charging load from the peak period to the flat or village period of the TOU tariff. We set the charging electricity cost as the objective function to research the effectiveness in the three scenarios with the BESS:
The BESS capacity range is 0–9000 kWh and the interval is 200 kWh in the range from 0 to 1000 kWh. The optimization results are shown in Figure 7. The reduction of electricity cost by the BESS is highly effective in a BESS capacity range of 0–1000 kWh, and the effectiveness is dampened with increasing BESS capacity. Besides that, the lowest electricity cost is when the charging load completely is shifted by the BESS from the peak and flat period to the village period of the TOU tariff.
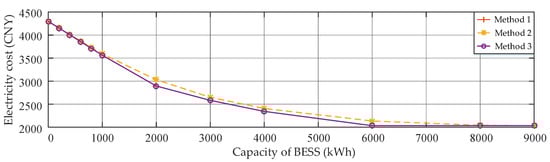
Figure 7.
Effectiveness of charging electricity cost reduction of three scenarios with BESS.
Although the electricity cost will be lower with a larger BESS capacity, the investment of the BESS cannot be neglected. Taking the BESS cost into account, the difference in electricity cost reduction among the three scenarios can be found with Equation (28), and the results are shown in Table 6. The parameter values of Scenario 2 are the same as the original values, because the TOU tariff benefit resulting from each pile’s BESS shifting the charging load is less than the BESS cost. The optimization result indicates that Scenario 2 should not use a BESS to decrease the electricity cost. The results of Scenarios 1 and 3 are the same: the capacity of the BESS is over 1000 kWh and the benefit is 11.88 USD/day.
Table 6.
Electricity and BESS cost optimization of different BESS configuration scenarios.
4.3.3. Transformer and Converter Cost Analysis
The transformers in the three charging scenarios are used to transform the high voltage of the distribution network to the required values of the charging system, and the transformer capacity is decided by the peak charging power of the station. The converters of the charging topology contain two parts: the charging converters and BESS converters. The capacity of the converter is related to the maximum flowing power, the BESS configuration will increase the total capacity of the converters. In the three BESS configuration scenarios, the cost of the transformers and converters only includes the investment of the transformers and all the converter equipment of the charging system:
As in the previous setting, the BESS capacity range is 0–9000 kWh, and the interval is 200 kWh in the range from 0 to 2000 kWh. The optimization results are shown in Figure 8. The transformer and converter cost of the Original type is 67.62 USD/day according to the case parameters and realistic charging load data. The BESS of Scenario 1 is integrated with a 10 kV bus; the charging power of each pile cannot be changed. Then, the capacity and cost of the transformers and converters of each charging line are the same as those of the Original type. Comparing Scenarios 2 and 3, the BESS capacity of Scenario 3 is smaller than that of Scenario 1 when the objective values are the same. The reason is that the BESS of each charging pile only supports the coupled pile load, and there is no reverse flow between BESSs and charging piles. Furthermore, the BESS and converter costs are larger than in Scenario 3 for reducing the same peak charging power. So, Scenario 3 is better than Scenario 1 in terms of the cost reduction of transformers and converters.
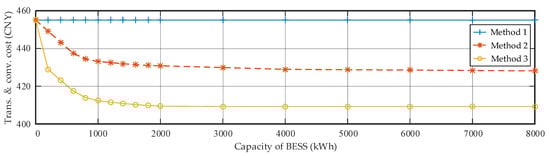
Figure 8.
Results of transformer and converter cost reduction of three scenarios with BESS configuration.
4.3.4. Electricity Loss Cost Analysis
In charging stations, electricity loss is caused by the current flowing through the transformers, converters, batteries, and the cables. This paper focuses on the influence of equipment loss on the BESS configuration and neglects the thermal loss of cables. Then, the electricity loss is determined by the efficiency of the equipment for the charging topologies and BESS. Thus, as with the TOU tariff, the electricity loss cost is also related to the electricity price for the same electricity loss value:
Focusing on the factor of the electricity loss cost, we researched the cost characteristics of the three scenarios with different shaving ratios of peak charging power. The results are shown in Figure 9, where the loss costs of the three scenarios are all increased with a higher shaving ratio of peak charging power. The loss costs of Scenarios 2 and 3 are the same for the same ratio, and Scenario 1′s cost is higher than the cost in the other two scenarios. The electric energy of the charging station is supplied by the distribution network and flows through the charging topology to the PEBs. The energy loss is inevitable, and the quantities are almost the same with the assumption that transformers and converters have similar efficiencies in two charging topologies. The BESS of the three scenarios can shift the electric energy from high-price periods to the lower-price periods, but it cannot reduce the total electricity quantity of the charging demand. Moreover, the BESSs’ charging and discharging cause new losses. A priority is that the charging load shifted by the BESS can make a difference in cost the electricity loss with the TOU electricity tariff.
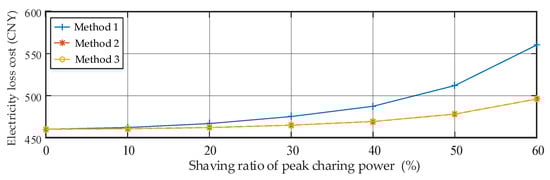
Figure 9.
Electricity loss cost of three scenarios with different shaving ratios of peak charging power.
4.4. Conclusion of Case Analysis
From the analyses of the single influence factors, the advantages and disadvantages of the three BESS configuration scenarios were determined and are shown in Table 7. Scenario 3 has advantages for all the four influence factors with the same BESS capacity, thus verifying the case simulation results in Chapter 4.2, although a comprehensive economic optimization configuration that consider all the influence factors may have a different outcome. Notably, the basic electricity cost and electricity cost are the two main aspects that influence the overall economy of the BESS configuration.
Table 7.
Advantages and disadvantages of three BESS configuration scenarios.
Remark: The BESS cycle lifetime was taking into account on the BESS cost in this paper. The author in [28] proposed a fast charging technique for high power lithium iron phosphate batteries, 4500 cycles were completed and resulted in 83% of the cell’s initial capacity remaining. The influence of different charging current rates and cut-off voltages on the aging mechanism of batteries are revealed by cycle life tests [29]. The established quantitative model describes the relationship between capacity degradation rate and charging stress at different aging states. And then, the cycle number of battery by the accumulated depth of discharge (DOD) was introduced to evaluate the lifespan of Lithium Ferrous Phosphate battery.
5. Discussion
The increasing deployment of PEBs with large-capacity on-board batteries alleviates the environmental problems in big cities. At the same time, it places great pressure on the distribution network due to the huge distribution capacity demand. DERs may be a component to reduce the expensive cost of distribution capacity expansion. Compared with electricity generation by photovoltaic panels, wind turbines and natural gas turbines, the BESS can be deployed without strict limitations on space and resources. One of the presented charging topologies has been applied in the PEB fast charging station, and the other is an improvement that is under construction. According to that, three BESS configuration scenarios were proposed and an economic model considering the related influence factors was established. The key findings of this work are summarized as follows:
- (1)
- The BESS is an available component to suppress the distribution capacity demand of the high-power PEB fast charging station from an economic perspective. The investment of the BESS can be recouped, and it leads to considerable benefits, such as a decrease in the basic electricity fee and the income gained from the TOU tariffs.
- (2)
- The economic model considers the basic electricity, charging electricity, charging equipment, electricity loss, and BESS investment to cover the main factors of a BESS configuration in a PEB fast charging station. However, the results are related to the charging topology and the amount of charging electricity. The economic effects may significantly differ depending on the applied scenario. The model can be used to choose the charging topology and BESS integration point.
- (3)
- The costs of basic electricity and charging electricity are the two main factors that can lead to cost savings. The electricity loss in different topologies is a main part of the total cost, but it has a few differences among the various topologies. Also, the investment of the BESS and charging equipment is obviously different among the scenarios. According to the case in this paper, the charging topology and BESS integration point are the two key aspects that influence the overall economics.
6. Conclusions
This paper focuses on the issue of peak charging power suppression by BESS configuration and proposes three configuration scenarios that are based on realistic charging topologies. On the basis of linear programming theory, a configuration model was established, and if considers the following economic influence factors: basic electricity cost, electricity cost, transformer and converter cost, electric energy cost, and BESS cost. A case simulation was carried out with the realistic operation data of a PEB fast charging station. Then, numerical analyses of the effect of each influence factor on the overall configuration economic were performed. The results show that the basic electricity cost and charging electricity cost are the two main aspects of the stationary operation cost for a PEB fast charging station. The analyses verified the optimization configuration result; the most economical and practical BESS configuration scenario is integrating the BESS with the DC bus of the charging topology. For choosing the charging topology and BESS integration point and determining the capacity, the proposed model can well estimate alternative strategies. This study may be a useful reference for the charging infrastructure deployment in an area with limited distribution capacity, and promote the widespread application of PEBs to assist the public transportation electrification.
Author Contributions
Y.Y. proposed the battery energy storage system configuration strategy and model, and wrote the paper; H.W. performed the BESS configuration simulations; Y.Y., W.Z., M.H. and Y.B. analyzed the results; and J.J. organized the structure of the paper.
Funding
This work was supported by the National Key R&D Program of China (2016YFB0900500).
Conflicts of Interest
The authors declare no conflict of interest.
References
- Deb, S.; Tammi, K.; Kalita, K.; Mahanta, P. Review of recent trends in charging infrastructure planning for electric vehicles. Wiley Interdiscip. Rev.: Energy Environ. 2018, 7, e306. [Google Scholar] [CrossRef]
- Hu, X.; Johannesson, L.; Murgovski, N.; Egardt, B. Longevity-conscious dimensioning and power management of the hybrid energy storage system in a fuel cell hybrid electric bus. Appl. Energy 2015, 137, 913–924. [Google Scholar] [CrossRef]
- Chung, W.; Zhou, G.; Yeung, I.M.H. A study of energy efficiency of transport sector in China from 2003 to 2009. Appl. Energy 2013, 112, 1066–1077. [Google Scholar] [CrossRef]
- Bao, Y.; Luo, Y.; Zhang, W.; Huang, M.; Wang, L.; Jiang, J. A Bi-Level Optimization Approach to Charging Load Regulation of Electric Vehicle Fast Charging Stations Based on a Battery Energy Storage System. Energies 2018, 11, 229. [Google Scholar] [CrossRef]
- Serradilla, J.; Wardle, J.; Blythe, P.; Gibbon, J. An evidence-based approach for investment in rapid-charging infrastructure. Energy Policy 2017, 106, 514–524. [Google Scholar] [CrossRef]
- Xylia, M.; Leduc, S.; Patrizio, P.; Kraxner, F.; Silveira, S. Locating charging infrastructure for electric buses in Stockholm. Transp. Res. Part C Emerg. Technol. 2017, 78, 183–200. [Google Scholar] [CrossRef]
- Bryden, T.S.; Hilton, G.; Cruden, A.; Holton, T. Electric vehicle fast charging station usage and power requirements. Energy 2018, 152, 322–332. [Google Scholar] [CrossRef]
- Grackova, L.; Oleinikova, I. Impact of Electric Vehicle Charging on the Urban Distribution Network. In Proceedings of the 57th International Scientific Conference on Power and Electrical Engineering of Riga Technical University (RTUCON), Riga, Latvia, 13–14 October 2016. [Google Scholar]
- Deb, S.; Tammi, K.; Kalita, K.; Mahanta, P. Impact of Electric Vehicle Charging Station Load on Distribution Network. Energies 2018, 11, 178. [Google Scholar] [CrossRef]
- Leou, R.; Hung, J. Optimal Charging Schedule Planning and Economic Analysis for Electric Bus Charging Stations. Energies 2017, 10, 483. [Google Scholar] [CrossRef]
- Zhang, W.; Ge, W.; Huang, M.; Jiang, J. Optimal Day-Time Charging Strategies for Electric Vehicles considering Photovoltaic Power System and Distribution Grid Constraints. Math Probl. Eng. 2015, 2015, 1–9. [Google Scholar] [CrossRef]
- Yang, Y.; Zhang, W.; Niu, L.; Jiang, J. Coordinated charging strategy for electric taxis in temporal and spatial scale. Energies 2015, 8, 1256–1272. [Google Scholar] [CrossRef]
- Liao, J.T.; Lin, C.I.; Chien, C.Y.; Yang, H.T. The distributed energy resources operation for EV charging stations and SHEMS in microgrids. In Proceedings of the 2014 International Conference on Intelligent Green Building and Smart Grid (IGBSG), Taipei, Taiwan, 23–25 April 2014; pp. 1–6. [Google Scholar]
- Zhang, W.; Zhang, D.; Mu, B.; Wang, L.; Bao, Y.; Jiang, J.; Morais, H. Decentralized Electric Vehicle Charging Strategies for Reduced Load Variation and Guaranteed Charge Completion in Regional Distribution Grids. Energies 2017, 10, 147. [Google Scholar] [CrossRef]
- Yan, B.; Xue, S.; Li, Y.; Duan, J.; Zeng, M. Gas-fired combined cooling, heating and power (CCHP) in Beijing: A techno-economic analysis. Renew. Sust. Energy Rev. 2016, 63, 118–131. [Google Scholar] [CrossRef]
- Makohin, D.; Jordan, F.V.; Zeni, V.S.; Lemos, K.H.M.; Pica, C.; Gianesini, M.A. Use of Lithium Iron Phosphate Energy Storage System for EV Charging Station Demand Side Management. In Proceedings of the 8th IEEE International Symposium on Power Electronics for Distributed Generation Systems, Florianópolis, Brazil, 17–20 April 2017; pp. 1–6. [Google Scholar]
- Deng, J.; Shi, J.; Liu, Y.; Tang, Y. Application of a hybrid energy storage system in the fast charging station of electric vehicles. IET Gener. Transm. Distrib. 2016, 10, 1092–1097. [Google Scholar] [CrossRef]
- Rivera, S.; Wu, B.; Kouro, S.; Yaramasu, V.; Wang, J. Electric Vehicle Charging Station Using a Neutral Point Clamped Converter With Bipolar DC Bus. IEEE Trans. Ind. Electron. 2015, 62, 1999–2009. [Google Scholar] [CrossRef]
- Negarestani, S.; Fotuhi-Firuzabad, M.; Rastegar, M.; Rajabi-Ghahnavieh, A. Optimal Sizing of Storage System in a Fast Charging Station for Plug-in Hybrid Electric Vehicles. IEEE Trans. Transp. Electrif. 2016, 2, 443–453. [Google Scholar] [CrossRef]
- Yan, Y.; Jiang, J.; Zhang, W.; Huang, M.; Chen, Q.; Wang, H. Research on Power Demand Suppression Based on Charging Optimization and BESS Configuration for Fast-Charging Stations in Beijing. Appl. Sci. 2018, 8, 1212. [Google Scholar] [CrossRef]
- Martinsen, T. A business model for an EV charging station with battery energy storage. In Proceedings of the CIRED Workshop 2016, Helsinki, Finland, 14–15 June 2016; pp. 1–4. [Google Scholar]
- Ding, H.; Hu, Z.; Song, Y. Value of the energy storage system in an electric bus fast charging station. Appl. Energy 2015, 157, 630–639. [Google Scholar] [CrossRef]
- McPhail, D. Evaluation of ground energy storage assisted electric vehicle DC fast charger for demand charge reduction and providing demand response. Renew. Energy 2014, 67, 103–108. [Google Scholar] [CrossRef]
- Madina, C.; Zamora, I.; Zabala, E. Methodology for assessing electric vehicle charging infrastructure business models. Energy Policy 2016, 89, 284–293. [Google Scholar] [CrossRef]
- Nguyen, C.L.; Chun, T.W.; Lee, H.H. Determination of the optimal battery capacity based on a life time cost function in wind farm. In Proceedings of the 2013 IEEE Energy Conversion Congress and Exposition, Denver, CO, USA, 15–19 September 2013; pp. 51–58. [Google Scholar]
- Rivera, S.; Wu, B. Electric Vehicle Charging Station with an Energy Storage Stage for Split-DC Bus Voltage Balancing. IEEE Trans. Power Electr. 2017, 32, 2376–2386. [Google Scholar] [CrossRef]
- Kim, K.; Yoon, T.; Byeon, G.; Jung, H. Power demand and power quality analysis of EV charging station using BESS in MicroGrid. In Proceedings of the 2012 IEEE Vehicle Power and Propulsion Conference, Seoul, Korea, 9–12 October 2012; pp. 996–1001. [Google Scholar]
- Anseán, D.; González, M.; Viera, J.C.; García, V.M.; Blanco, C.; Valledor, M. Fast charging technique for high power lithium iron phosphate batteries: A cycle life analysis. J. Power Sources 2013, 239, 9–15. [Google Scholar] [CrossRef]
- Gao, Y.; Jiang, J.; Zhang, C.; Zhang, W.; Ma, Z.; Jiang, Y. Lithium-ion battery aging mechanisms and life model under different charging stresses. J. Power Sources 2017, 356, 103–114. [Google Scholar] [CrossRef]
© 2019 by the authors. Licensee MDPI, Basel, Switzerland. This article is an open access article distributed under the terms and conditions of the Creative Commons Attribution (CC BY) license (http://creativecommons.org/licenses/by/4.0/).