Article

Insights from Past Trends in Exergy Efficiency and Carbon Intensity of Electricity: Portugal, 1900–2014

1
MARETEC—Marine, Environment and Technology Center, LARSyS, Instituto Superior Técnico, Universidade de Lisboa, 1049-001 Lisboa, Portugal
2
Department of Economic History, Lund University, Box 7083, S-220 07 Lund, Sweden
3
Department of Engineering, University of Cambridge, Cambridge CB2 1PZ, UK
*
Author to whom correspondence should be addressed.
Energies 2019, 12(3), 534; https://doi.org/10.3390/en12030534
Submission received: 13 December 2018 / Revised: 31 January 2019 / Accepted: 1 February 2019 / Published: 8 February 2019
(This article belongs to the Section B: Energy and Environment)

Abstract

:
We use the societal exergy analysis to identify periods and factors controlling efficiency dilution and carbon deepening of electricity in Portugal from 1900 to 2014. Besides estimating the carbon intensity of electricity production, we propose a new indicator, the carbon intensity of electricity use, which quantifies CO2/kWh of electricity derived useful exergy. Results show final to useful efficiency dilution until World War I (50% to 30%) due to a decrease in share of the high-efficiency transport sector and from mid-1940s to 1960 and mid-1990s onwards (58% to 47% and 47% to 40%) due to an increase in share of the low efficiency commercial and residential sector. Decarbonization from 1900 to mid-1960s, with carbon intensities of electricity production and use dropping respectively from 12.8 to 0.2 and from 33.6 to 0.4 kg CO2/kWh due to an increase in thermoelectricity efficiencies and an increase in share of hydro. Then, a period of carbon deepening until 1990 with carbon intensities tripling due to a shift in shares from hydro to thermoelectricity and more recently a period of decarbonization with carbon intensities decreasing to 0.35 and 0.9 kg CO2/kWh, due to the increase in renewable electricity despite a dilution in final to useful efficiency.

1. Introduction

The transition to electricity has had a huge impact on society because electricity enables a far more efficient lighting, information and communication technology and a more productive organization of manufacturing [1]. This increase in efficiency is illustrated by the optimal reorganization of industrial facilities that occurred as a consequence of the introduction of electricity, with small groups of machines powered by electric motors replacing the inefficient system of centralized steam engines associated with pulleys and belts [2]. Devine [2] describes this process. At first, steam engines and water wheels were simply replaced by electric motors, but the mechanical power distribution remained the same. Then, production machinery started to be arranged in group drives with each group of machines driven by a relatively short line shaft. Finally, organization evolved to unit drives where motors were located on the machines being driven. These changes increased manufacturing production efficiency due to the increased flexibility in locating and operating independently each group or machine. According to Rosenberg [3] in the US, steam power prevailed at the turn of the century (begin of the 20th century) with steam engines providing 80% of total capacity for driving machinery, but by 1920 electricity had replaced steam as the major source of motive power and by 1929, just 45 years after their first use in a factory, electric motors provided 78% of total drive. The introduction of electricity also had positive effects on the lives of women and society in general that resulted from time savings associated with electricity powered domestic devices such as the refrigerator and the washing machines.
Due to its social and economic importance and ease of use, electricity has become a significant proportion of the present final energy consumption of OECD (Organisation for Economic Co-operation and Development) countries (22%) [4], second only to oil. Over the next few decades, it is expected that the importance of electricity will increase even more because it is a crucial energy carrier to fuel a sustainable 4th industrial revolution based on electrical and autonomous vehicles, communication, robotization, data gathering and artificial intelligence [5,6]. Additionally, it is essential that many of the end-uses that are currently being provided by fossil fuels, such as mobility, will in the future be provided by renewable electricity [5,7]. Otherwise, the decarbonization of society imposed by the need to decrease the human impact on the climate system will be difficult to achieve.
The efficiencies and carbon intensities of electricity production and use are of crucial importance in determining the environmental, social and economic benefits of the imminent energy transition. In order to estimate and locate the opportunities to increase exergy efficiency and decrease carbon intensity, a thorough societal exergy analysis of the whole energy conversion chain, from the primary to final and then to the useful stage, is necessary. To properly estimate primary to final exergy efficiency, one needs to consider the efficiency of electricity generation and distribution, which depends on the energy mix and technical efficiency of the different power stations. Additionally, one needs to take into account the diversity of methodological options in accounting for the primary stage in electricity produced directly from renewable sources (hydro, wind, geothermal, solar, etc.) [8] including the Resource Content method (RCM), the Physical Content method (PCM) and the Partial Substitution Method (PSM). For further details on these methods see Section 2.2. To estimate final to useful exergy efficiency, one needs to allocate final electricity to end-uses and know the respective efficiencies.
A few studies have analyzed the historical trend of exergy efficiency of electricity. Most of these studies find that despite the increase in efficiencies due to technological innovation, the overall exergy efficiency of producing or using electricity has decreased or remained constant due to the increase in in the shares of end-uses that have lower efficiencies. This is the dilution effect. Ayres et al. [9] reconstructed the history of electric power uses in the US, over the period 1900 to 1998, including lighting, electrolysis, high temperature heat, low temperature heat, motor drive and electronics. They found that overall primary to useful efficiency (PSM method) remained almost constant, during the past century, despite the dramatic technological improvements due to a shift to less efficient applications. Brockway et al. [10] improved this study for the US and made estimates for the UK over the period 1960 to 2010. They provided a more granular mapping of electricity use within each main economic sector, with a higher level of detail in the residential sector. Their results show that US primary to useful electricity efficiency (RCM method) decreased from 11% to 8% due to a shift towards less efficient uses, while UK’s electricity aggregate efficiency rose from 9% to 15% due to an increase in consumption efficiency of the three main energy uses: mechanical drive, heat and electricity. The dilution effect was also identified in the primary to final electricity efficiency (with the RCM method) in Japan for the 20th century [11]. In this case, the transition to new technologies has contributed to a roughly stagnated overall exergy efficiency since the 1950s, despite the increasing efficiency of individual technologies due to: (1) a resource-supply constraint that moved supply from hydro to fossil fuels and (2) the use of renewable production technologies such as wind and solar with low efficiencies (ibid).
Other studies have focused on the analysis of the carbon intensity of electricity. The increase of 98% in electricity generation worldwide, between 1990 and 2014, was associated with an increase of 87% of CO2 emissions, from 6.28 Gt CO2 to 11.76 Gt CO2 [12]. Goh et al. refer that this increase in emissions is mainly a consequence of the lack of significant improvement in the aggregate carbon intensity of electricity production (ACIEP), that changed from 0.54 kg CO2/kWh in 1990 to 0.51 kg CO2/kWh in 2014. In their study, they decomposed the variation of ACIEP for several spatial scales (global, EU, USA, India, etc.) and factors for the last two decades (1990–2014), in periods of 5 years. ACIEP for EU has decreased in all periods for different reasons. For example, in EU during 1995–2000 the decrease in ACIEP was mainly due to a switch from coal to natural gas for electricity production while in 2005–2010 the decrease was mainly due to an increase of production from renewable and nuclear energy.
ACIEP captures the effect of higher efficiencies of producing electricity from fossil-fuels and the switch in the primary energy mix used to produce electricity. However, this indicator does not capture the evolution in the carbon intensity of electricity consumption in society. A decrease in ACIEP combined with a decrease in aggregate final to useful exergy efficiency (due to the dilution effect) might lead to higher kg CO2/kWh of useful exergy. Here, we propose a new indicator, the aggregate carbon intensity of useful electricity (ACIEU) to capture the carbon intensity of useful exergy derived from electricity.
In this paper, we make use of the extensive national literature and electricity statistics [13] to estimate the long-run exergy efficiency and carbon intensity (ACIEP and ACIEU) of electricity over the period 1900–2014 for Portugal using the societal exergy accounting methodology. The use of societal exergy accounting is crucial to obtain the useful exergy needed to estimate not only aggregated primary to useful and final to useful efficiencies but also the decarbonisation indicator, ACIEU. Some studies have used societal exergy accounting to estimate final to useful exergy efficiency for Portugal [14,15]. However, a pitfall of these works is that they assume for Portugal a structure of electricity end-uses like the United States’ and do not consider that overall electricity efficiency depends also on the mix of natural resources used to produce electricity. Here, we: (1) use much more detailed data to allocate electricity to its different end-uses, (2) test the impact of several primary exergy accounting methods on electricity exergy efficiency and (3) investigate the interplay between decarbonization and efficiency by estimating the long-run ACIEP and ACIEU. We analyze results to identify periods of efficiency dilution and carbon deepening and discuss the underlying factors. We synthesize these insights and use them to discuss public policies that could contribute to maximize the benefits of the forthcoming energy transition.
Portugal is chosen as a case-study because of data availability [14,15,16] and the dramatic energy, social and economic transitions experienced during this period. In 1900, around 90% of final exergy was provided by food, feed and combustible renewables while around 50% of useful exergy was muscle work [14]. In 2010, electricity comprises more than 20% of the final exergy while mechanical work (stationary and transport) make up more than 50% of useful exergy. Additionally, Portugal is a good case-study because of the fast transition to renewable electricity that occurred from 2000 onwards. The starting date is 1900 because the first references on electricity production are around 1890 while information to estimate consumption proxies, such as electric motors sales and number of consumers of electricity, is only available from the last years of the first decade of the 20th century (ca 1908–1909) [17]. Moreover, electricity was not widespread in the country in 1890 and structural changes in the main sectors consuming electricity occurred only after 1910.

Historical Context

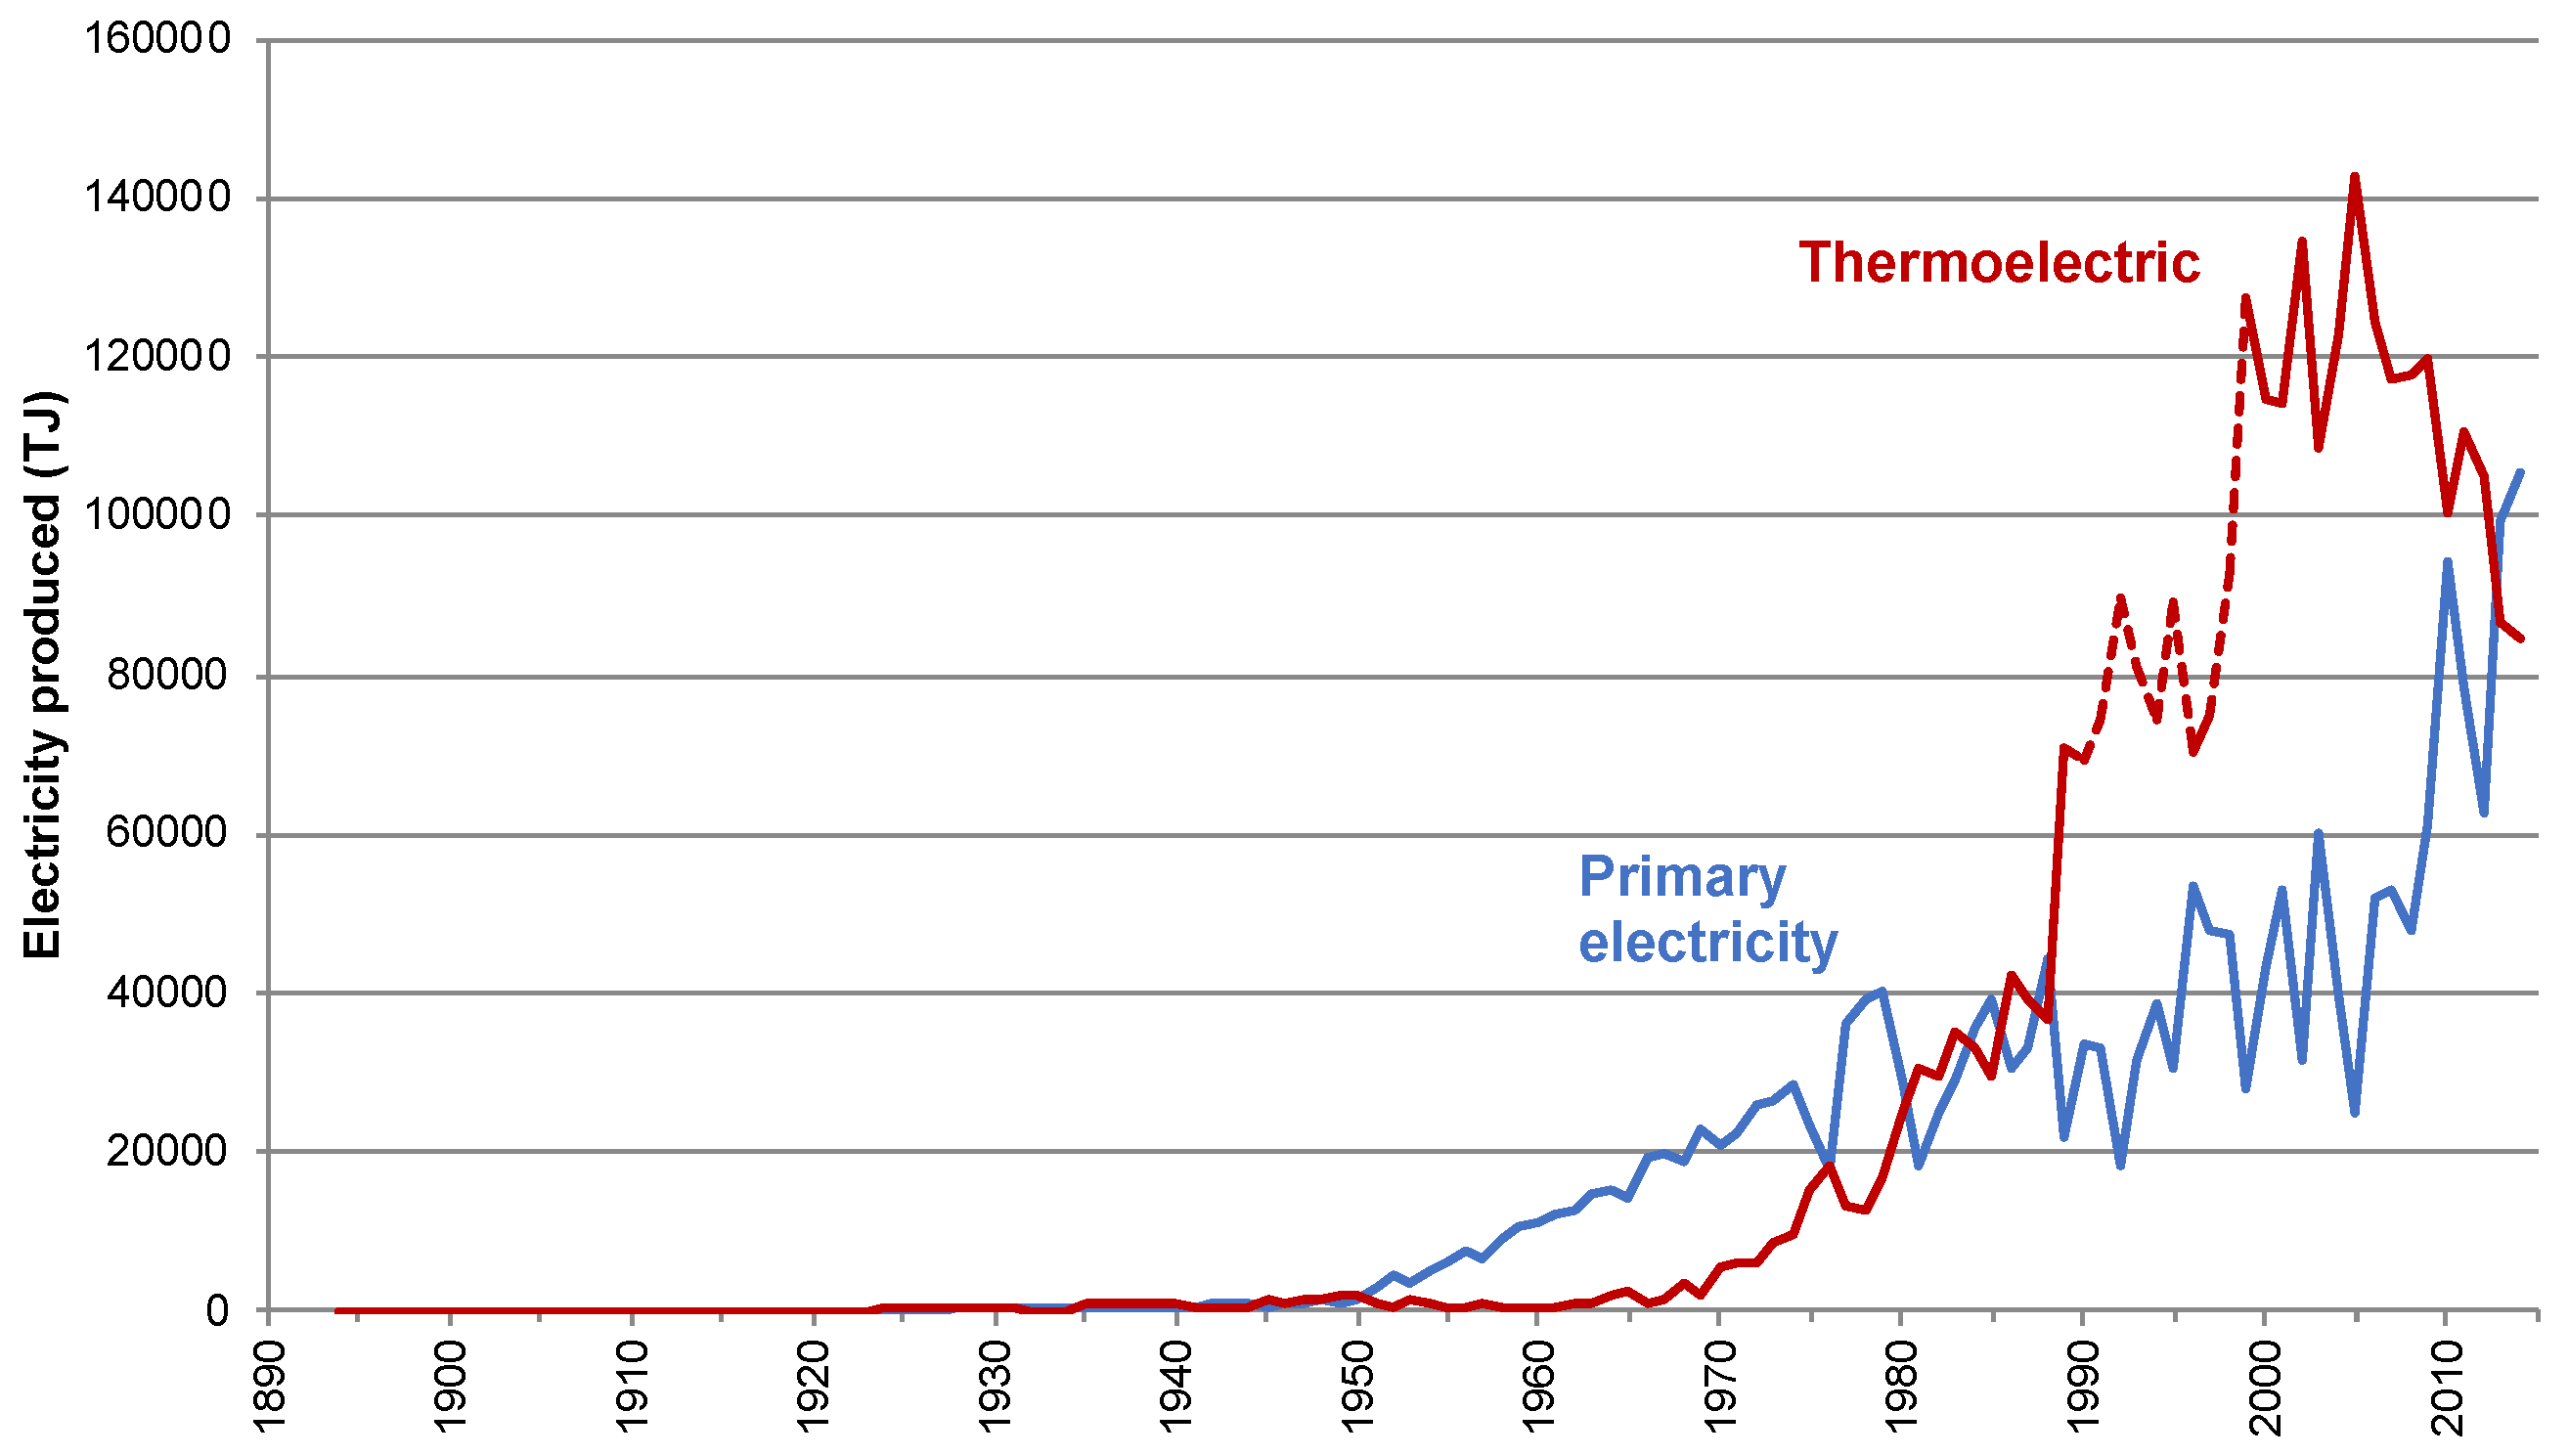
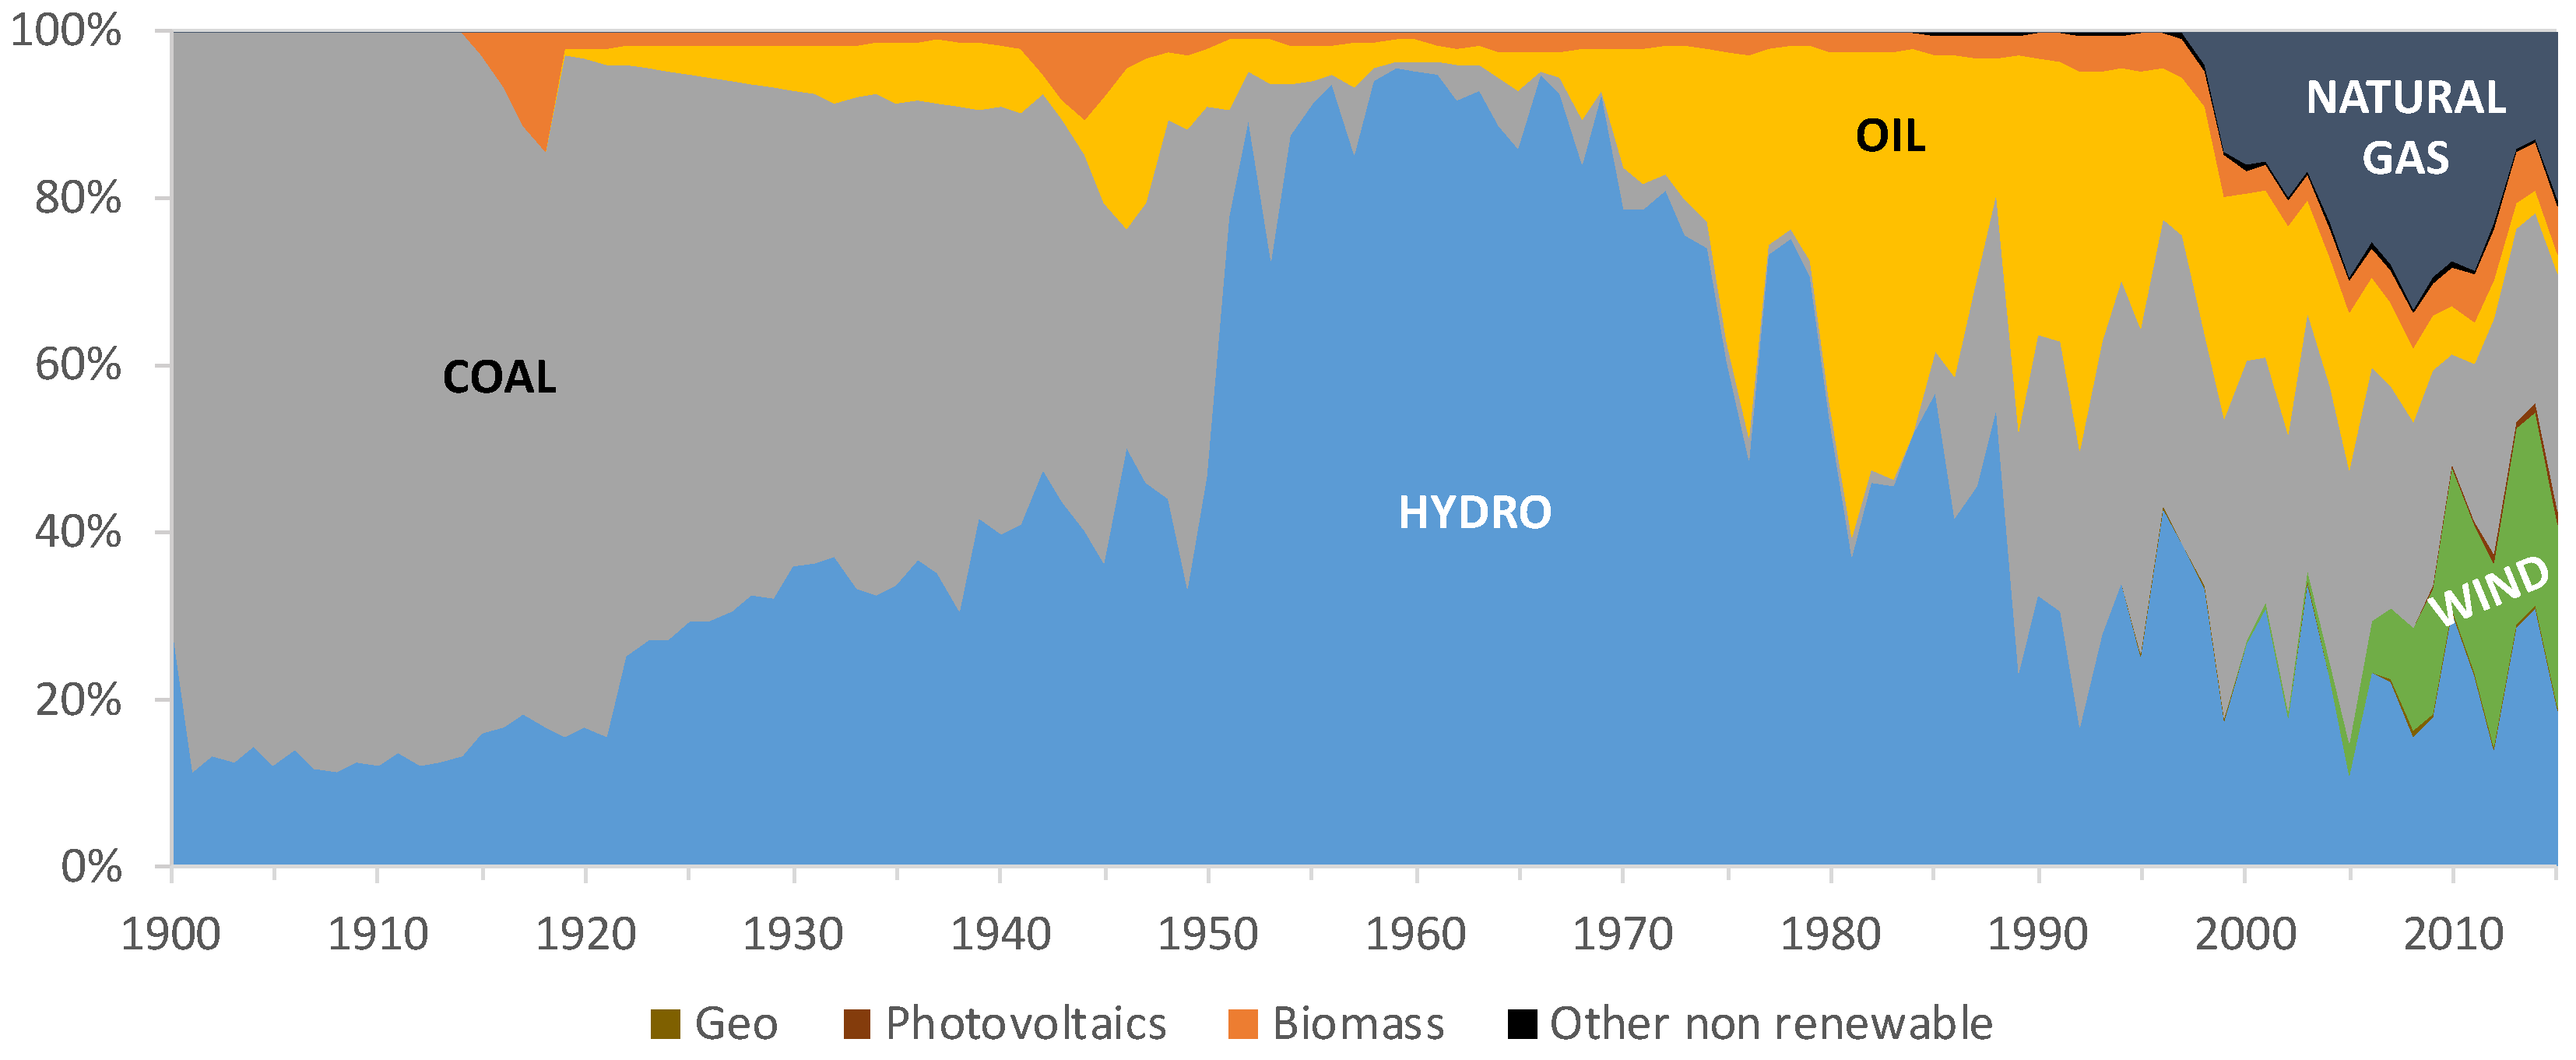
In Portugal, coal-based electricity, produced mainly in the Tejo and Santos power plants in Lisbon was dominant until the 1940s (Figure 1 and Figure 2) and was relatively expensive which limited consumption to lighting and mechanical drive uses [18]. Hydro power gains relevance since the 1950s with the start of production in several large dams, especially Castelo de Bode (1951), Cabril (1954) and later, in 1964, Alto Rabagão dam [19,20]. In the 1950s and 1960s, Portugal has for the first-time access to significant amounts of inexpensive electricity.
By the beginning of the 1970s, three power plants—Carregado (1968), Tunes (1973) and Setúbal (1979)—using oil derivatives (fuel oil and diesel) started production, hence the increase in oil consumption in that period [21]. The problem of oil dependence would be only addressed from mid 1980s with the installation of new large coal-power plants in Sines (1985) and Pego (1993). Depending on the hydraulicity of the year, thermo-power was responsible for about 56% to 83% of production in the 1990s. From the late 1990s until today, the Portuguese electricity production system has been changing due to environmental considerations, starting with the introduction of natural gas (1997) and continuing in the early 2000s with considerable investments in renewable electricity (especially wind-power, reaching in 2014, a rainy year, a production whose magnitude was around ¾ of hydro’s production [22]).
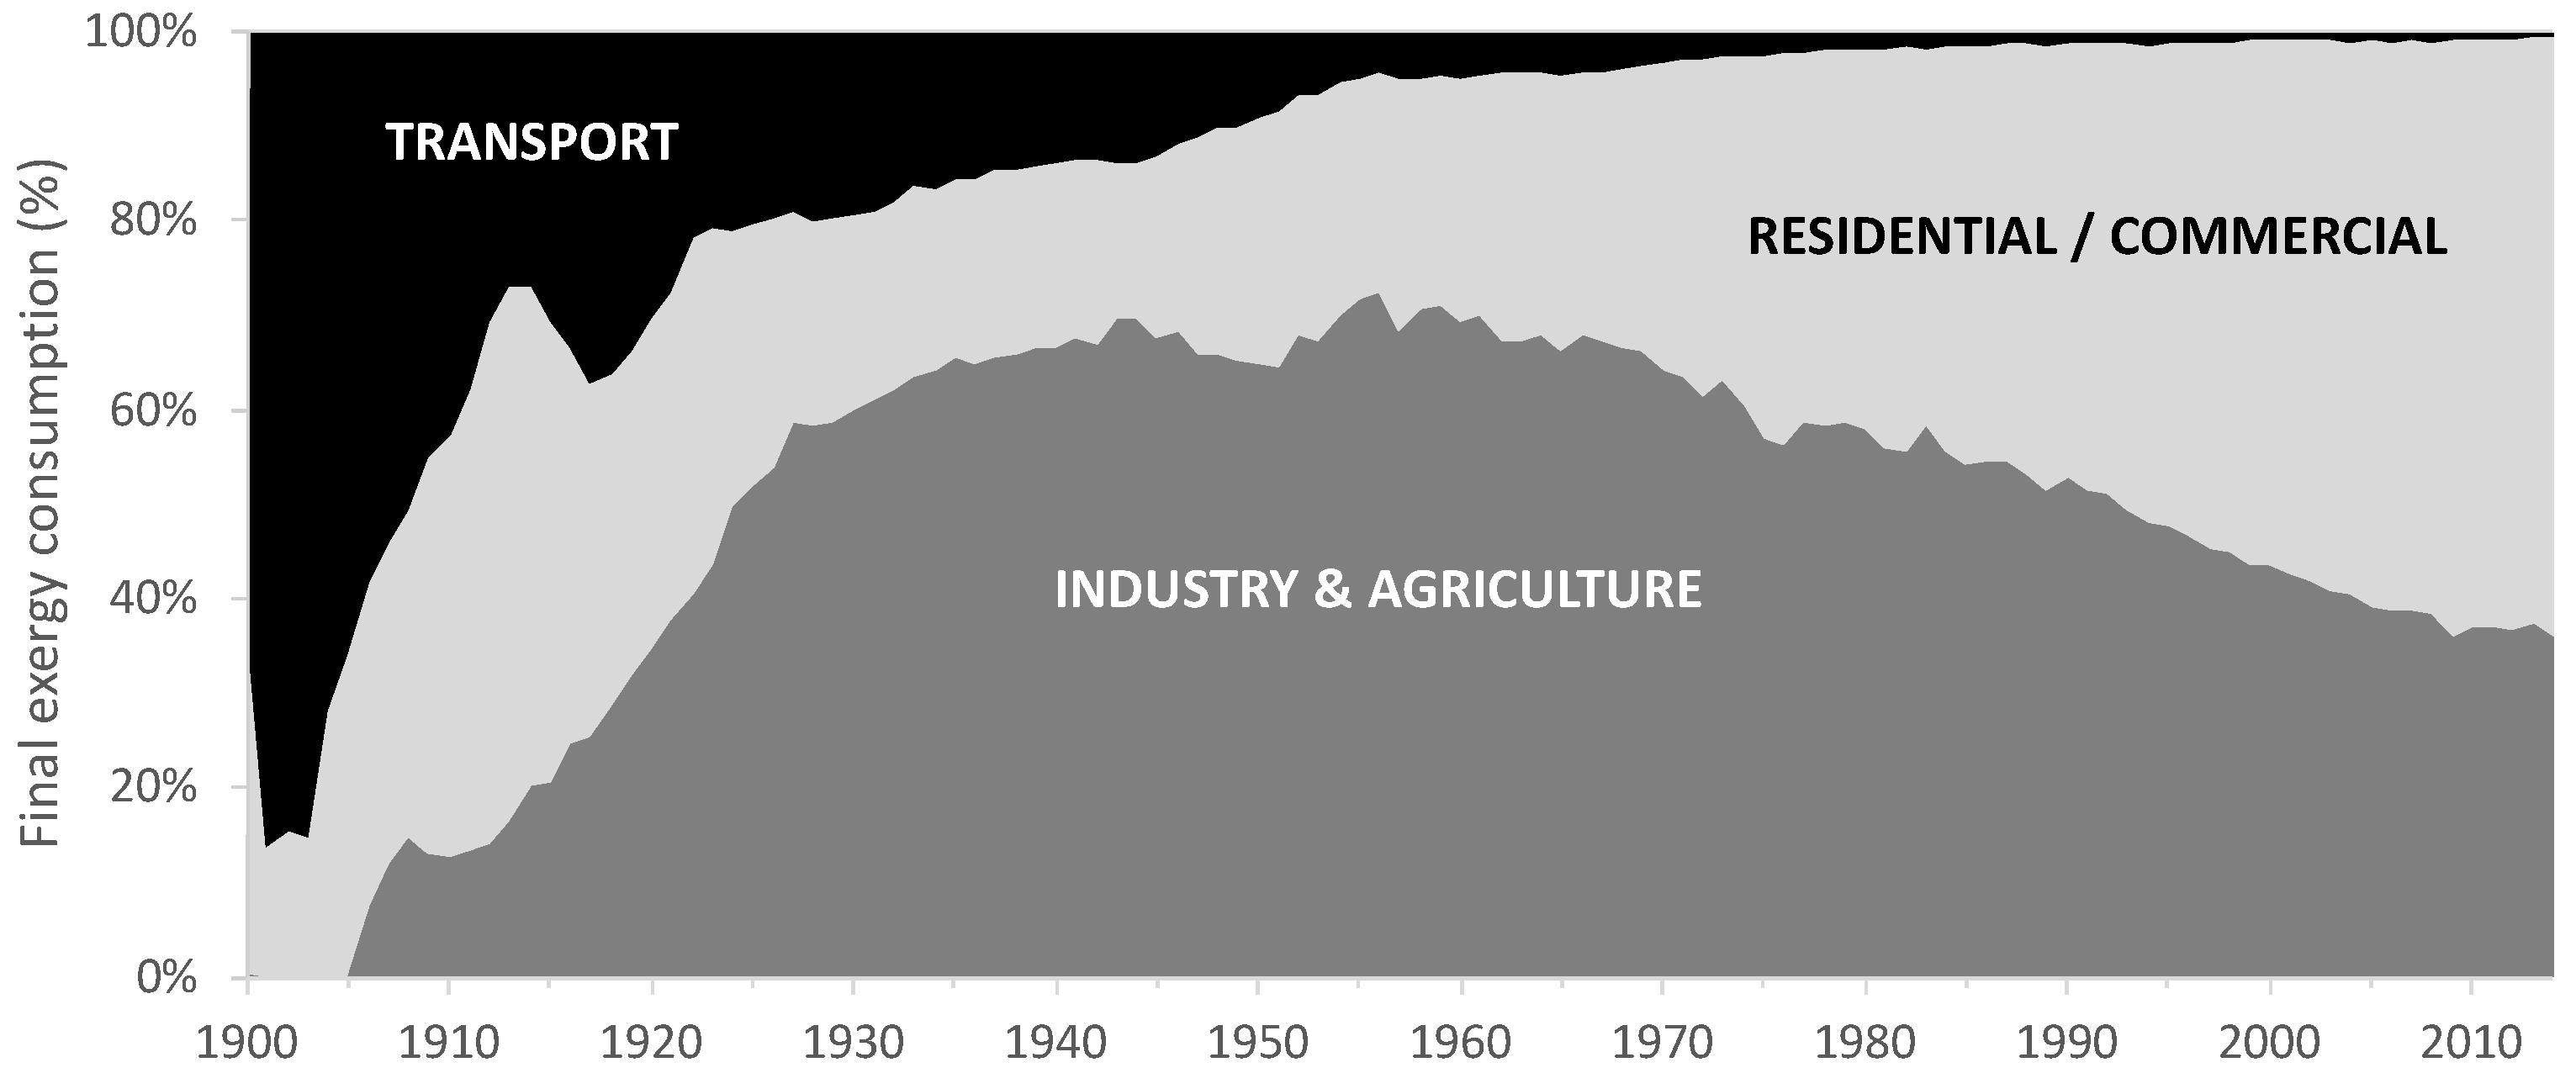
Figure 3 shows data on final electricity use for each sector (Industrial and Agricultural uses, Residential/Commercial and Transport). Before 1890, electricity was used in Portugal only for communication (telegraphs and telephones), medical applications and lighting (lighthouses and private space illumination, e.g., theatres and factories) [23]. Afterwards, electricity was mostly used by electric trams in Lisbon and Oporto. From 1900 onwards, industrial uses increase quickly their share in consumption (see Figure 3). An evidence of this, are the annual reports of the main utility in Lisbon, that show an increase in electricity sold to electric motors from 9% in July 1906 to 26% in September 1908. However, total absolute consumption was still small in the first decades of the 20th century, growing afterwards exponentially, hence the abrupt change in shares from 1905 to 1910. Industry and agriculture become the most important user in the country during the 1920s reaching 65% of total consumption by 1950 [23,25]. Industry was the motor of the economy, with a constant increase at annual rates of 8–9% in value added, one of the highest in Europe, surpassing agriculture in both value (1963) and employment (1969) [16].
Electricity consumption was concentrated in the regions of Lisbon and Porto due to the incipient industrialization and urbanization of the country. Even in 1950, only about 30% of the Portuguese population (but 70% of urban consumers) was connected to the electricity grid (own calculations based on [13,26]).
By the late 1960s, despite the strong growth in manufacturing, residential/commercial consumption managed to maintain and even increase its share in total electricity use from 26% in 1950 to 33% in 1970 (see Figure 3). This increase was mostly a result of the popularization of uses of electricity such as water heating and cooking in many urban areas due to price schemes that incentivized this type of consumption. For example, in Porto, the city in the country with the lowest average electricity prices and highest annual consumption per capita at the household level (3000 kWh per wired household) in 1960, 50% of the consumers had an electric stove and 35% an electrical heater (and only 28% the more standard electric iron) [27].
Around the 1980s, Portugal witnesses a new impressive expansion of electricity levels of consumption per capita at a rate of 9%/year, especially residential and commercial, which accompany the economic transition from industry towards services [25], as can be seen in Figure 3. By the late 1980s, Portugal reaches the levels of income and electrification of a developed society. In 1987, around 97% of households had electricity and used big electric appliances such as refrigerators (approximately 86%) and washing machines (~44%) [25]. Besides an increase in ownership of large appliances, the 1990s also saw an explosion in the consumption of the service sector and a significant increase in the climatization of buildings, especially in air-conditioning.
A prolonged economic crisis during the 2000s explains the slower growth of electricity consumption in last decade. During this period, the growth of per capita consumption was only 1%/year. In terms of structure, the share of the service and residential sectors continued to increase in relation to industrial and transportation. Within the residential/commercial sector, the major shift in consumption has been the increase in air-conditioning and electronic devices such as computers and mobile phones [28].

2. Data and Methodology

2.1. Methodology

A 4-step accounting process (right column in Table 1) is used to calculate useful exergy from final electricity, since most of the available data on a national scale is at the final stage, while a 2-step methodology (left column in Table 1) is used to estimate primary exergy from final electricity. The 4-step methodology is the one used by Serrenho et al. [14,29], Ayres et al. [30] and other authors. An abbreviated description of the methodology is provided below. For a more detailed discussion on the methodology, see Sousa et al. [8].
To convert energy into exergy (teps A-2 and B-1) conversion factors are applied by energy carrier, e.g., coal, oil, combustible renewables, etc (Table 2). Factors are estimated based on combustion enthalpy and, this, varies depending on the combustible’s composition and conditions (e.g., if coal is dry or not). For all combustibles the Low Heating Value is considered, except for coal gases and natural gas, for which the High Heating Value is considered, as done by IEA—that provides the final energy data. To simplify this issue, many studies such as Chen et al. [31], Ertesvåg et al. [32], Wall et al. [33] and Serrenho [34] consider an average value (Table 2).
When computing primary exergy (column A in Table 1), it is simpler to first calculate values for the primary energy (step A-1) and, then, convert energy into exergy (step A-2). When estimating useful exergy (column B in Table 1), the conversion into exergy is the first step, the following steps are all performed using exergy.

2.2. Methods Used to Estimate Primary Exergy

Primary exergy associated with primary electricity (step A-1) was calculated by using the three different methods: Resource Content method (RCM), Physical Content method (PCM) and Partial Substitution Method (PSM). All these methods have been used in exergetic analysis. For a list of the studies that have used each method see Sousa et al. [8].
The RCM estimates primary energy as the physical energy of the resources. For this, the technologies’ efficiencies used to produce electricity from renewable sources, are taken into account, e.g., the kinetic energy of the wind that pushes the blades of wind turbines or the potential energy of water in a dam [8]. In Henriques [23], the efficiencies considered were of: 75% until 1960 and, from then on, 85% for hydro power, 40% for wind power, and 15% for geothermal and photovoltaic. Several studies on primary energy and exergy follow this method (a summary of those may be found in Sousa et al. [8]).
The PCM considers that primary energy is the first form of energy that can be commercialized or, in other words, for all renewables except geothermal, the gross electricity production is the primary energy considered [8]. In the case of geothermal, heat is the primary energy. In this work, we considered that geothermal electricity production occurs with an energy efficiency of 10%. This method is used by the International Energy Agency (IEA).
Finally, the PSM is a method that quantifies primary energy as the quantity of coal necessary in a conventional thermoelectric power plant to produce the same electricity produced by the renewable resources, so, the equivalent coal, (thus ignoring the structure of the energy sector) [8]. In this work we convert to primary energy using the aggregate thermoelectric energy production efficiency, which means that, we do not consider the equivalent coal, but rather the equivalent mix of fuels used for thermoelectric production in each year. This method is used by US Energy Information Administration (EIA) and BP (British Petroleum) [8].

2.3. Allocation of Final Electricity

The allocation of electricity consumption by end-uses (step B-2) is not trivial because electricity can and is typically used for several end-uses (this is an intrinsic characteristic of the higher quality of electricity as an energy carrier). Final electricity is disaggregated (step B-2) into six end-uses/categories: mechanical drive (MD), heat, cooling, light, other electrical uses, and electrolytic uses.
Mechanical drive uses are all the final uses that involve mechanical work except for work from humans and animals, including e.g., the work done by stationary motors, such as electrical motors in a factory or a dish washing machine, and by mobile motors such as in vehicles, trains and airplanes. Heat uses include all end-uses using heat, whether it is a process or an appliance, e.g., furnaces in industry or ovens in a kitchen (categories by temperatures are further discussed in Section 2.4.2). Light includes all lighting end-uses. Other electrical uses categories include appliances such as computers, TV and printers. Cooling includes all uses whose aim is to lower or maintain low temperatures (i.e., refrigerators and air-conditioning). Cooling was introduced as a new end-use category in societal exergy accounting, in Portugal, between 1960 and 2009, by Palma et al. [15]. Electrolytic uses are the industrial processes where electricity is used for electrolysis.

2.3.1. Residential and Commercial Sector

The shares of each type of electric end-use for the residential and commercial sector were obtained from household energy consumption surveys from 1977 onwards (INE/DGEG [28,35]; DGE [36]). For the previous period we have constructed our shares based on the per capita electricity consumption of wired families [19], rates of ownership of relevant appliances (such as Iron, Radio, TV, washing machine and refrigerators) and estimates of its unit consumption [37,38] and relevant works on the history of household electricity consumption in Portugal [20,29]. Note that, the electricity usage of the service sector has been growing throughout the last decades, from 35% (in 1960) to 58% (in 2014) of the total of the residential and commercial sector. However, no specific survey on the service sector electricity usage was conducted and it is not possible to trace back the share of services before 1960 due to lack of data. Therefore, we assume the same trends as for the household sector which probably underestimates the proportion of lighting consumption which is typical higher for services than for households.
Table 3 describes some of the data gathered to estimate end use shares of electricity in the period 1900 to 1970. Until the early 1940 wired consumers used electricity almost exclusively for lighting and only a small percentage owed a radio or an electric iron. Consumption per wired household increased significantly from 1940s (157 kWh/year) to 1960s (426 kWh/year) mostly due to an increase in cooking and water heating appliances in cities with low electricity prices [16,25]. From 1960s to 1970s refrigerators or TVs became also more popular, while washing machines were still rare.
To estimate end use shares of a typical household, we multiplied the unit consumption of the appliances shown in Table 3 by its rate of ownership and then we divided this value by the electricity consumption per household. We illustrate this with the following example. In 1950, the annual electricity consumption of an iron was 83 kWh, but only 40% of the “wired consumers” had irons. Thus, the mean electricity consumption of all “wired consumers” is 33 kWh. The end-use share of iron, 11%, is the ratio between 33 kWh and the electricity consumption per wired consumer (310 kWh). TV and radio electricity consumption were allocated to the other electrical uses’ category, the electric iron to heat, washing machines to mechanical drive (20%) and heating (80%) and fridges to cooling. Then, we assumed a plausible lighting consumption per capita. The remaining electricity consumption was attributed to heating (cooking, water heating and space heating). Given the history of household consumption in Portugal we have assumed that space heating represented a mere 5% of the heat consumption in 1950 and that the share increased to 25% in 1977. Available data that was used directly to compute consumption shares from 1977 to 2010 is shown in Table 4.
To match data and the end-use categories defined (heat, MD, light, cooling and other electrical uses) some assumptions had to be made (Table 5).
Electricity used for lighting and water/space heating could be directly allocated to light and heat categories, respectively. From 1977 onwards, the electrical appliances consumption was allocated to electronics, heat and mechanical drive. Electronics include radios, TVs and computers and similar electronic gadgets. There was data available, to estimate the share for “electronics” consumption in 2010 (20%) and in 1989 (~8%). We considered that the share of electronics increased linearly between these years. The evolution of the share of electronics (radios, TVs and currently computers and similar electronic gadgets) is on the supplementary data file. The rest was allocated to heat (60%) and to mechanical drive uses (40%).
The “kitchen” category includes the big household appliances, i.e., refrigerators, washing machines and dishwashers, as well as other appliances, such as the electric stove/oven and the microwave. Electricity consumed by kitchen appliances was allocated to heat and MD uses. These shares were defined in three steps. First, available data on the appliances’ consumption from DGE (Direcção-Geral da Energia) [36], EDP (Energias de Portugal) [39] and the website Loja da Luz [40] was used. Then, refrigerator and kitchen extractor hood consumptions were allocated to MD uses while the electric stove/hob and microwave consumptions were allocated to heat. Finally, consumption attributed to machines (washing machine and dishwasher) were allocated 20% to MD and 80% to heat.
After allocating all the kitchen uses, a share from MD was allocated to the cooling uses based on national data from air-conditioning uses (cooling and heating) which are based on the ICESD survey (Domestic Sector Consumption survey) [28]. The results of our model are shown in Figure 4:

2.3.2. Industry

The use of electricity for heating purposes began in 1924 with the manufacturing of calcium carbide in electric furnaces [41] The beginnings of the electrochemical industry date from 1938 with the first installation of the electrolysis of salt in the country [42]. In 1945, a national law established mechanisms and incentives to create heavy industries such as the electrochemical (cyanimide, ammonium sulfate), copper metallurgy and steel works that would consume the surplus hydro-power from the newly constructed dams at very low marginal prices [16]. The share of electrochemistry and electrometallurgy in industry—which includes heat and electrolysis uses—increases after 1950 to reach a maximum of 38% in 1959 [13], with some industries using electric furnaces to produce cyanamide, pig and silicon iron.
The electrochemical industry became relevant in Portugal, in the 1950s and 1960s, for the production of fertilizers, such as ammonium sulfate by electrolytic processes [16]. The production of fertilizers by electrolytic processes was quickly outdated by the less expensive petrochemical processes in the early 1960s. In the late 1980s there were only two large electrochemical companies in Portugal specialized in alkalis, chlorine, caustic soda and other similar products [43]. Since the mid-1980s the production of crude steel in electric arc furnaces is the most important application of electric heat for industrial uses.
Early data on consumption of electricity in electric furnaces was taken from the only existing company in the country [41]. From 1927 until 1984, data on electricity used for heating purposes and electrolysis is discriminated from the remaining industrial uses under the statistics of DGSE with the generalized heading “electrochemistry and electrometallurgy”. It was possible to separate industrial uses of heat from electrolysis by using complementary statistics on electrolytic processes ([44], 1943–1970; [13], 1927–1984). From 1984 to 1994 we used electricity consumption data about electrometallurgical uses of non-ferrous metals (heat) and electrochemical uses [45]. This series does not account properly for the consumption of electricity for heat purposes in the steel sector. Using the statistics from IEA we were able to separate the electricity consumed in EAF (Electric Arc Furnace) processes from open hearth and blast furnaces. Until the year 2000, about 90% of the electricity consumed in the iron and steel industry was for EAF. With the closure of the blast furnace in Portugal in 2001, EAF become the only process used to produce crude steel in Portugal.
Industrial cooling uses were negligible before the 1970s, but gained importance in recent decades with the change in the food consumption patterns of the Portuguese population. A recent study from 2016 [46] indicates that refrigeration represents 4% of industrial consumption, food industries such as meat, dairy and vegetables being responsible for more than 80% of this consumption. We have modelled cooling uses in industry by using the evolution of electricity consumption in the food industry as a proxy, and considering that 10% of electricity in this industry was spent in cooling in 1960, 20% in 1980, 30% in 1990 and 40% in 2010s. These assumptions result in a share of cooling of 1% in 1960 and 4% in 2006–2010, which is consistent with the data for 2016 considering that consumption patterns of refrigeration did not change much in the last 10 years [46].
Industrial electricity that is not used for electrolytic, heat and cooling uses is used for a mixture of mechanical drive uses, lighting and other non-discriminated uses. Data is too scarce to make a refined disaggregation between lighting and mechanical drive. Until the turn of the 20th century lighting was the only end-use of electric current in factories [17], but utilities rarely reported this type of consumption as industrial. By the first decade of the 1900s electric motors started to be introduced in factories and they quickly became the most important application for industrial uses. For example, in Lisbon, the introduction of a reduced tariff for motors in 1904 in order to increase consumption led to a fast increase in electricity consumption for mechanical drive of 220% in just 2 years [17]. During 1943–1950, electricity for mechanical drive represented more than 90% of the uses of electricity in the various industrial sectors surveyed by the Industrial Statistics (excluding all important industries that used electricity for heat or electrochemical purposes) [44]. In the 2000s, of the electricity consumed for mechanical drive and lighting combined, about 13% was for lighting and 87% was for mechanical drive [47]. This proportion, that was used throughout the period, is consistent with the values obtained for the US by Ayres et al. [9]. The authors attribute about 8–10% of industrial consumption to lighting, while our study attributes 10 to 12%. The allocation of end-uses in industry is shown in Figure 5.

2.3.3. Transport

Regarding transport, all final electricity consumption was allocated to mechanical drive end-uses. Electricity consumed in this sector is used in rail transport such as trams, railways and subways, and more recently in hybrid and electric road vehicles.

2.4. Efficiencies

2.4.1. Primary to Final Energy Efficiencies

Efficiencies needed to estimate primary energy (step A-1) associated with thermoelectricity are estimated using data collected and published by Henriques [18,48], Direcção-Geral de Energia e Geologia (DGEG), in the national energy balances [24] and electricity produced by each resource [22] (see Figure 6).
Cogeneration appeared on the national energy balances in 1990. The energy efficiency of this process can be computed according to different methodologies [49]. Here, we opted for the exergy method to estimate the fuel allocated to electricity production. This method considers that in cogeneration, the percentage of fuel allocated to electricity is equal to the percentage of electricity in the exergy of final products, i.e., electricity and heat [49].

2.4.2. Final to Useful Exergy Efficiencies

Exergy efficiencies are applied (step B-3 in Table 1) according to the end-use. Based on Ford et al. [50], Serrenho et al. [14] summarized exergy efficiencies (Table 6) where the first row is applicable to mechanical drive uses, while second and third rows to heating and cooling uses, respectively. The fourth row is applicable to end-uses whose output cannot or is not typically measured in energy units [8].
For MD uses (“Work” in the table), exergy and energy efficiencies are the same because electricity and mechanical work can be fully converted into work. For heat uses, exergy efficiency is calculated applying the Carnot efficiency (ηCarnot) because the exergy of heat is the maximum potential work that could be done by a Carnot power cycle (ideal process), e.g., the exergy efficiency of Q1 is given by Q 1 ( 1 T 0 T 1 ) .
Heat exergy efficiencies depend on the environment and service temperature (temperature of the system). So, three subcategories were established considering the service temperature: High Temperature Heat (HTH), for temperatures above 500 °C (industrial uses); Medium Temperature Heat (MTH) for temperatures between 500 °C and 120 °C, and Low Temperature Heat (LTH) for uses below 120 °C [34,51]. The lower the service temperature, the most sensitive is the exergy efficiency to the service temperature, consequently LTH uses are further disaggregated into three sub-subcategories: LTH 1, for uses between 120 °C and 90 °C; LTH2, for uses between 90 °C and 50 °C; and, LTH3, for uses bellow 50 °C [14,52]. For LTH3, the environmental temperature is the average temperature of winter months and, for all other heating uses, the environmental temperature is the average temperature in Lisbon [53,54]. Heat exergy efficiency for Industry is an average of HTH and MTH efficiencies because these are the main uses when considering all industries. As for Residential/Commercial sector, LTH2 exergy efficiency was considered for water heating and cooking uses, as well as for small appliances whose end-use is heat. LTH3 exergy efficiencies were applied to the electricity used for space heating/AC.
For electronics, lighting and electrolytic uses, exergy efficiencies are calculated as the ratio of the real efficiency to the ideal efficiency. This is the method used in Fouquet [55] and Ayres et al. [9]. For example, the lighting efficiency is calculated in lumens per Watt with two values being broadly used as the ideal: 400 lm/W or 638 lm/W. We opted for 638 ln/W because it considers the wavelength to which the human eye is most sensible, 555 nm) [56].
Electrolysis’ process in industry includes electricity that is used to perform chemical reactions. The efficiencies used for electrolytic uses as well as for electronics were taken from Ayres et al. [9], for electrolytic processes and communication uses, respectively.
Most energy efficiencies were taken from Serrenho et al. [14] that collected them from studies that focused on the US and UK (United Kingdom, [57] and Unites States, [9]). This assumption should not be too problematic because machinery is usually imported and exported worldwide and, thus, has similar efficiencies in several countries. Final-to-useful exergy efficiencies used for each sector/end-use are presented in Figure 7, Figure 8 and Figure 9.
Cooling exergy efficiencies were estimated for refrigerators, considering the average real COP of 2.7 [58], while the ideal COP was calculated considering that one third of the load was consumed by the freezer, −18 °C, and two thirds by the cooler box, 5 °C, following Palma [15] and Reistad [59]; the environmental temperature was considered to be the average temperature of the year. For air-conditioners the real COP considered for both cooling and heating was 3.4 [60], the ideal COP was estimated considering (1) the average maximum temperature of the hottest month as the environmental temperature [61] and 25 °C as the service temperature for cooling uses and (2) the average annual minimum temperature as the environmental temperature [62] and 20 °C as the service temperature for heating uses.
In relation to air cooling in Residential/Commercial sector, 2010 national survey on energy consumption [28] shows that ~70% of cooling was done by fans. However, no additional information was found to estimate the share of fans in previous years. Besides that, Heun et al. [63] have recently made a study in which they calculate the exergy efficiency of fans for the period 1971–2013, for Ghana. Even though Ghana has a different climate, this was the first study estimating exergy efficiencies for fans. According to the authors, exergy efficiencies of electrical fans range from 10.2%, in 1971, to 12.6% in 2013, which are like the exergy efficiencies considered by Palma [15] for cooling by AC—and used in the new allocation—for all cooling uses in both Industry and Residential/Commercial services sectors.
At the useful stage, all totals are summed (step B-4).

2.5. Greenhouse Gas (GHG) Emissions Calculations

To estimate CO2eq emissions, we used IPCC (Intergovernmental Panel on Climate Change) emission factors [64] that consider only direct emissions. The IPCC factors do not consider life cycle emissions of electricity production technologies. Thus, CO2eq emissions associated with renewable sources were zero.
The ACIEP is estimated as the ratio between CO2eq emissions associated with all fossil fuels burned to produce electricity and the total electricity produced while the ACIEU is estimated as the ratio between ACIEP and aggregate final to useful exergy efficiency. The ACIEP is CO2eq emissions per unit of electricity produced while ACIEU is CO2eq emissions per unit of useful exergy.

3. Results and Discussion

3.1. Sectoral and Aggregate Final-to-Useful Exergy Efficiencies

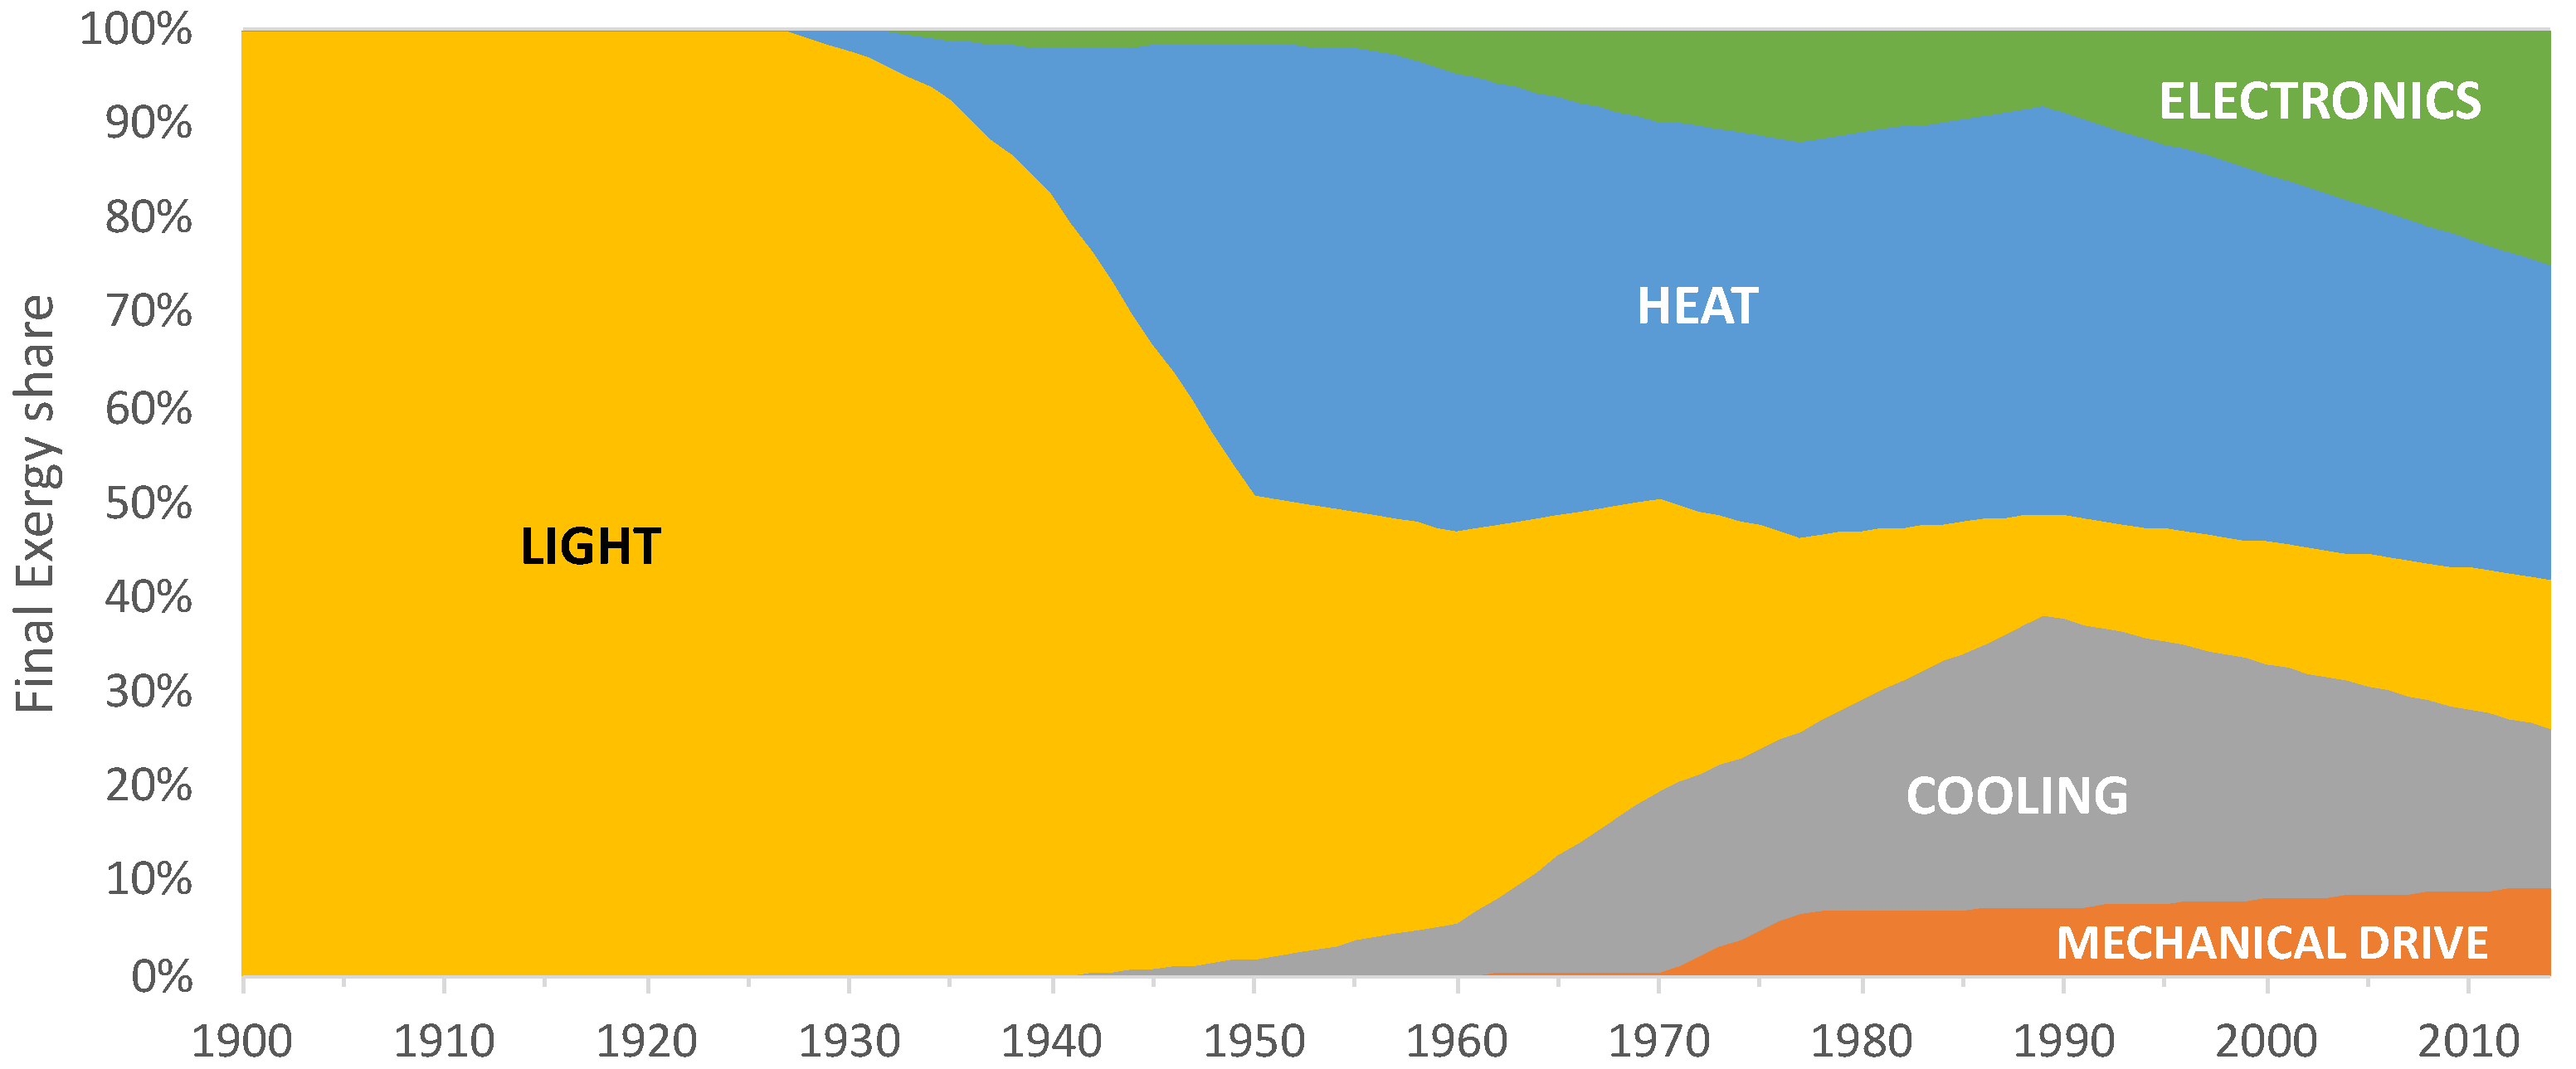
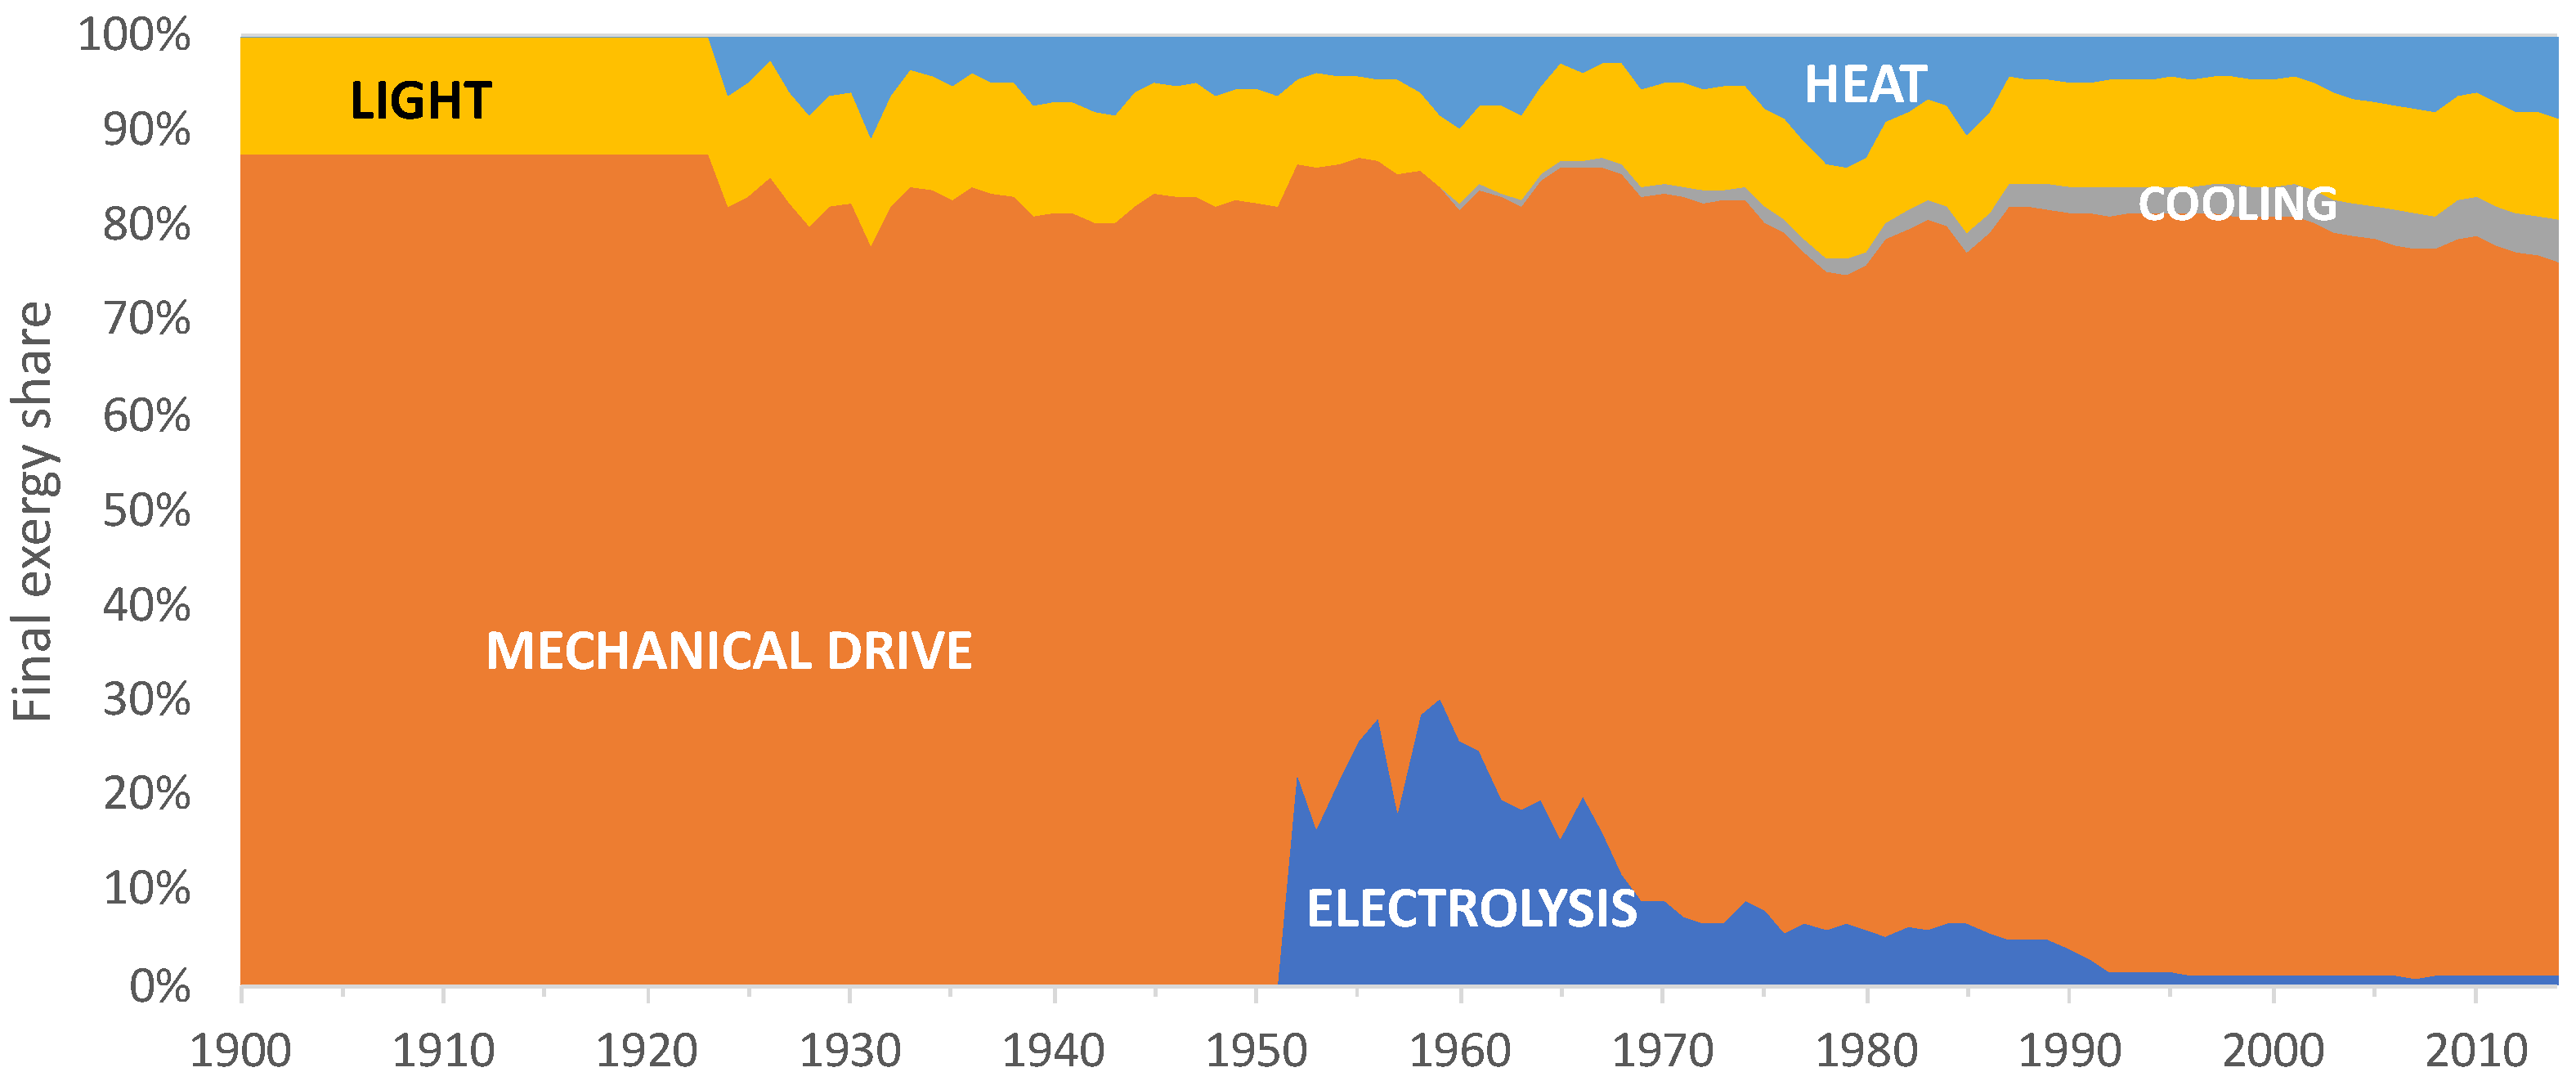
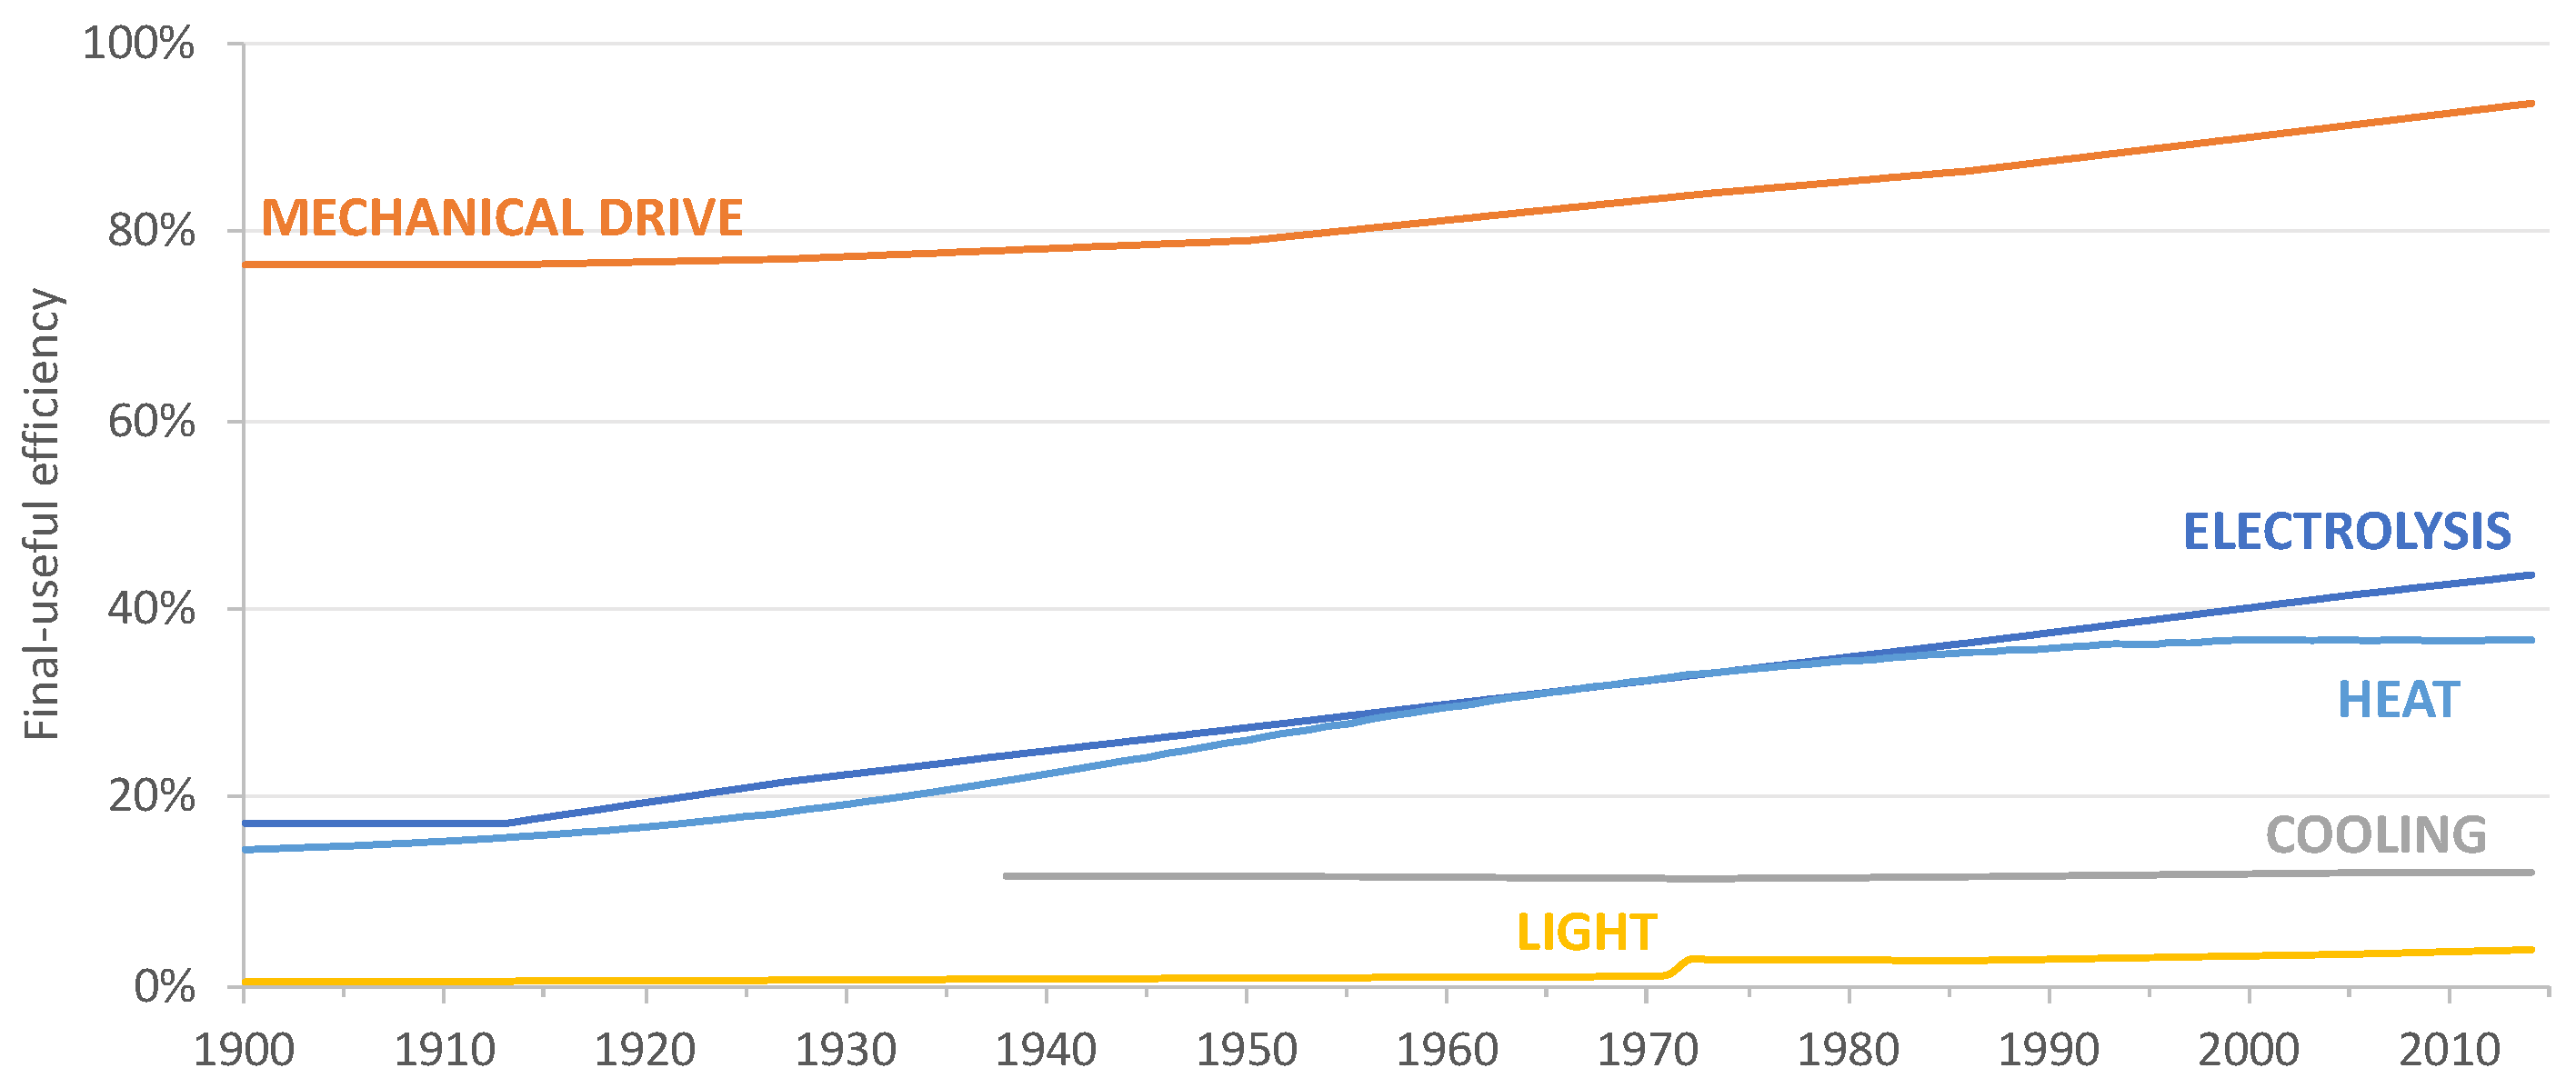
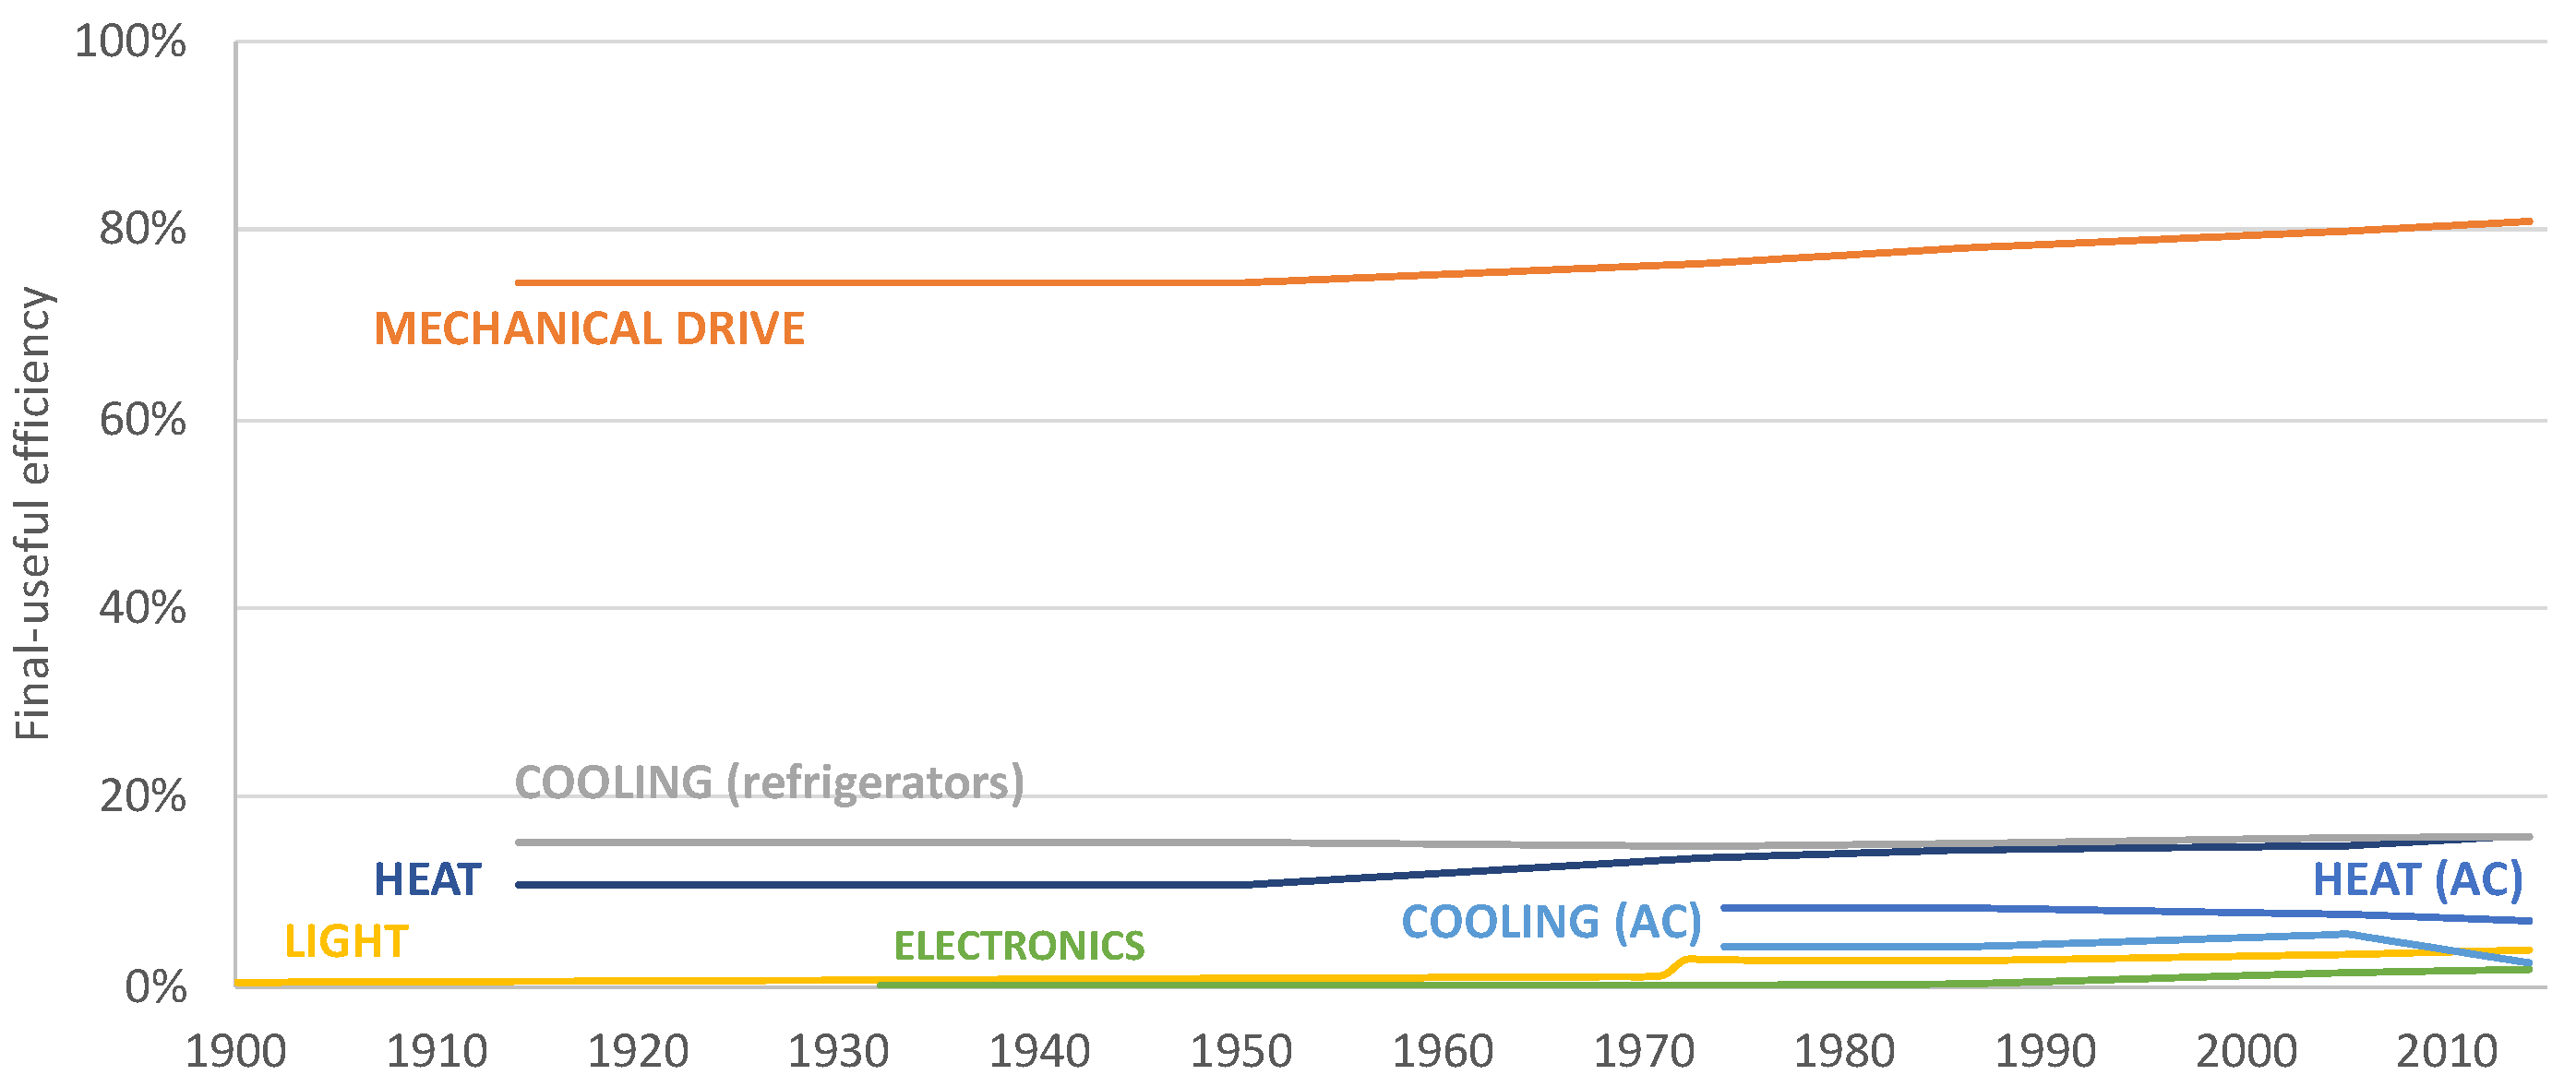
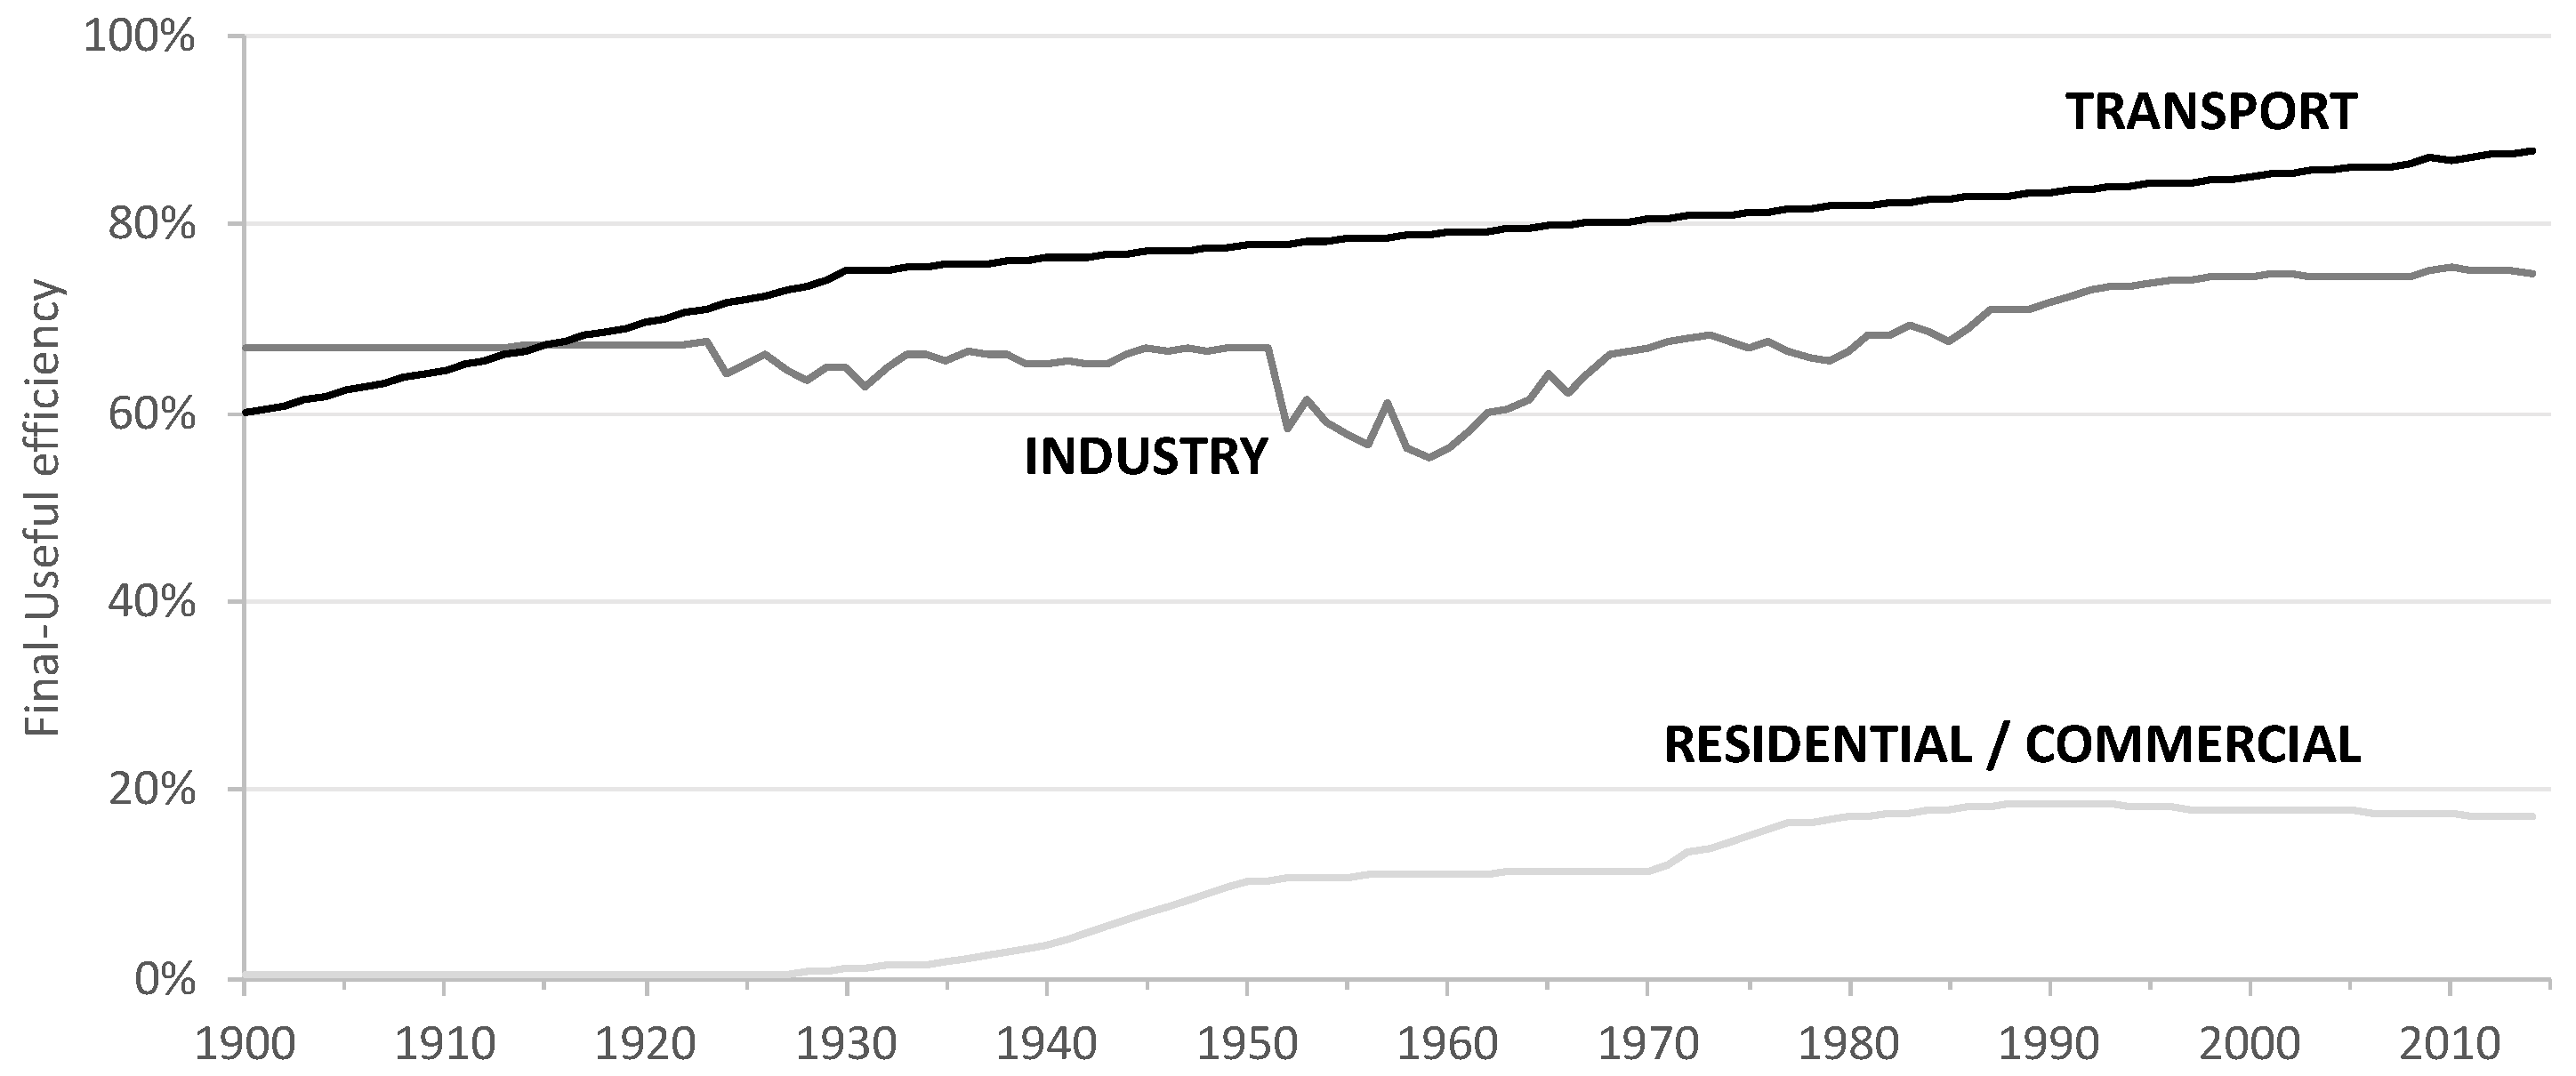
Figure 10 shows the sectoral efficiencies. The exergy efficiency of transport is the highest of the three considered sectors, growing from 60% in 1900 to almost 90% in 2014. The only exception was the period prior to 1920, when the end-uses in industry were dominated by mechanical drive, making industry the most efficient sector. Industrial exergy electricity efficiency exhibits a long-run U shaped trend which is mostly explained by changes in the structure of end-uses. Around 1950s, there is a decline in industry’s efficiency due to a shift from mechanical drive uses to the less efficient (~30%) electrolytic processes. In the 1960s, due to the decline in electrolytic uses and their replacement by mechanical drive uses, industrial final to useful efficiency increases again. The sectoral efficiency of the residential/commercial sector is clearly the lowest of the three sectors: it increased until the 1950s due to a shift in shares from lighting to heating uses, stabilizing (or even slightly decreasing) from the 1990s onwards, despite continuous improvement in individual technologies due to the increasing importance of other electric uses which have low exergy efficiencies.
The aggregate final-to-useful exergy efficiency for electricity in Portugal is shown in Figure 11 (grey line). The evolution of this efficiency is explained by the drastically different sectoral efficiencies (Figure 10) and a significant structural change in electricity consumption (Figure 3). The decrease in aggregate final to useful exergy efficiency until World War I (from 50% to 30%) is a result of a transition from transport towards the residential/commercial sector. On the other hand, the increase in efficiency (from 30% to 58%) in the subsequent 30 years is a result from the increasing importance of industry. Lastly, the long-run decline of exergy efficiencies from World War 2 onwards (from 58% towards 40%) is a result of an increase in the importance of the residential/service sector. This declining trend is more pronounced from the 1990s onwards because the exergy efficiency of the residential/commercial sector stagnated.
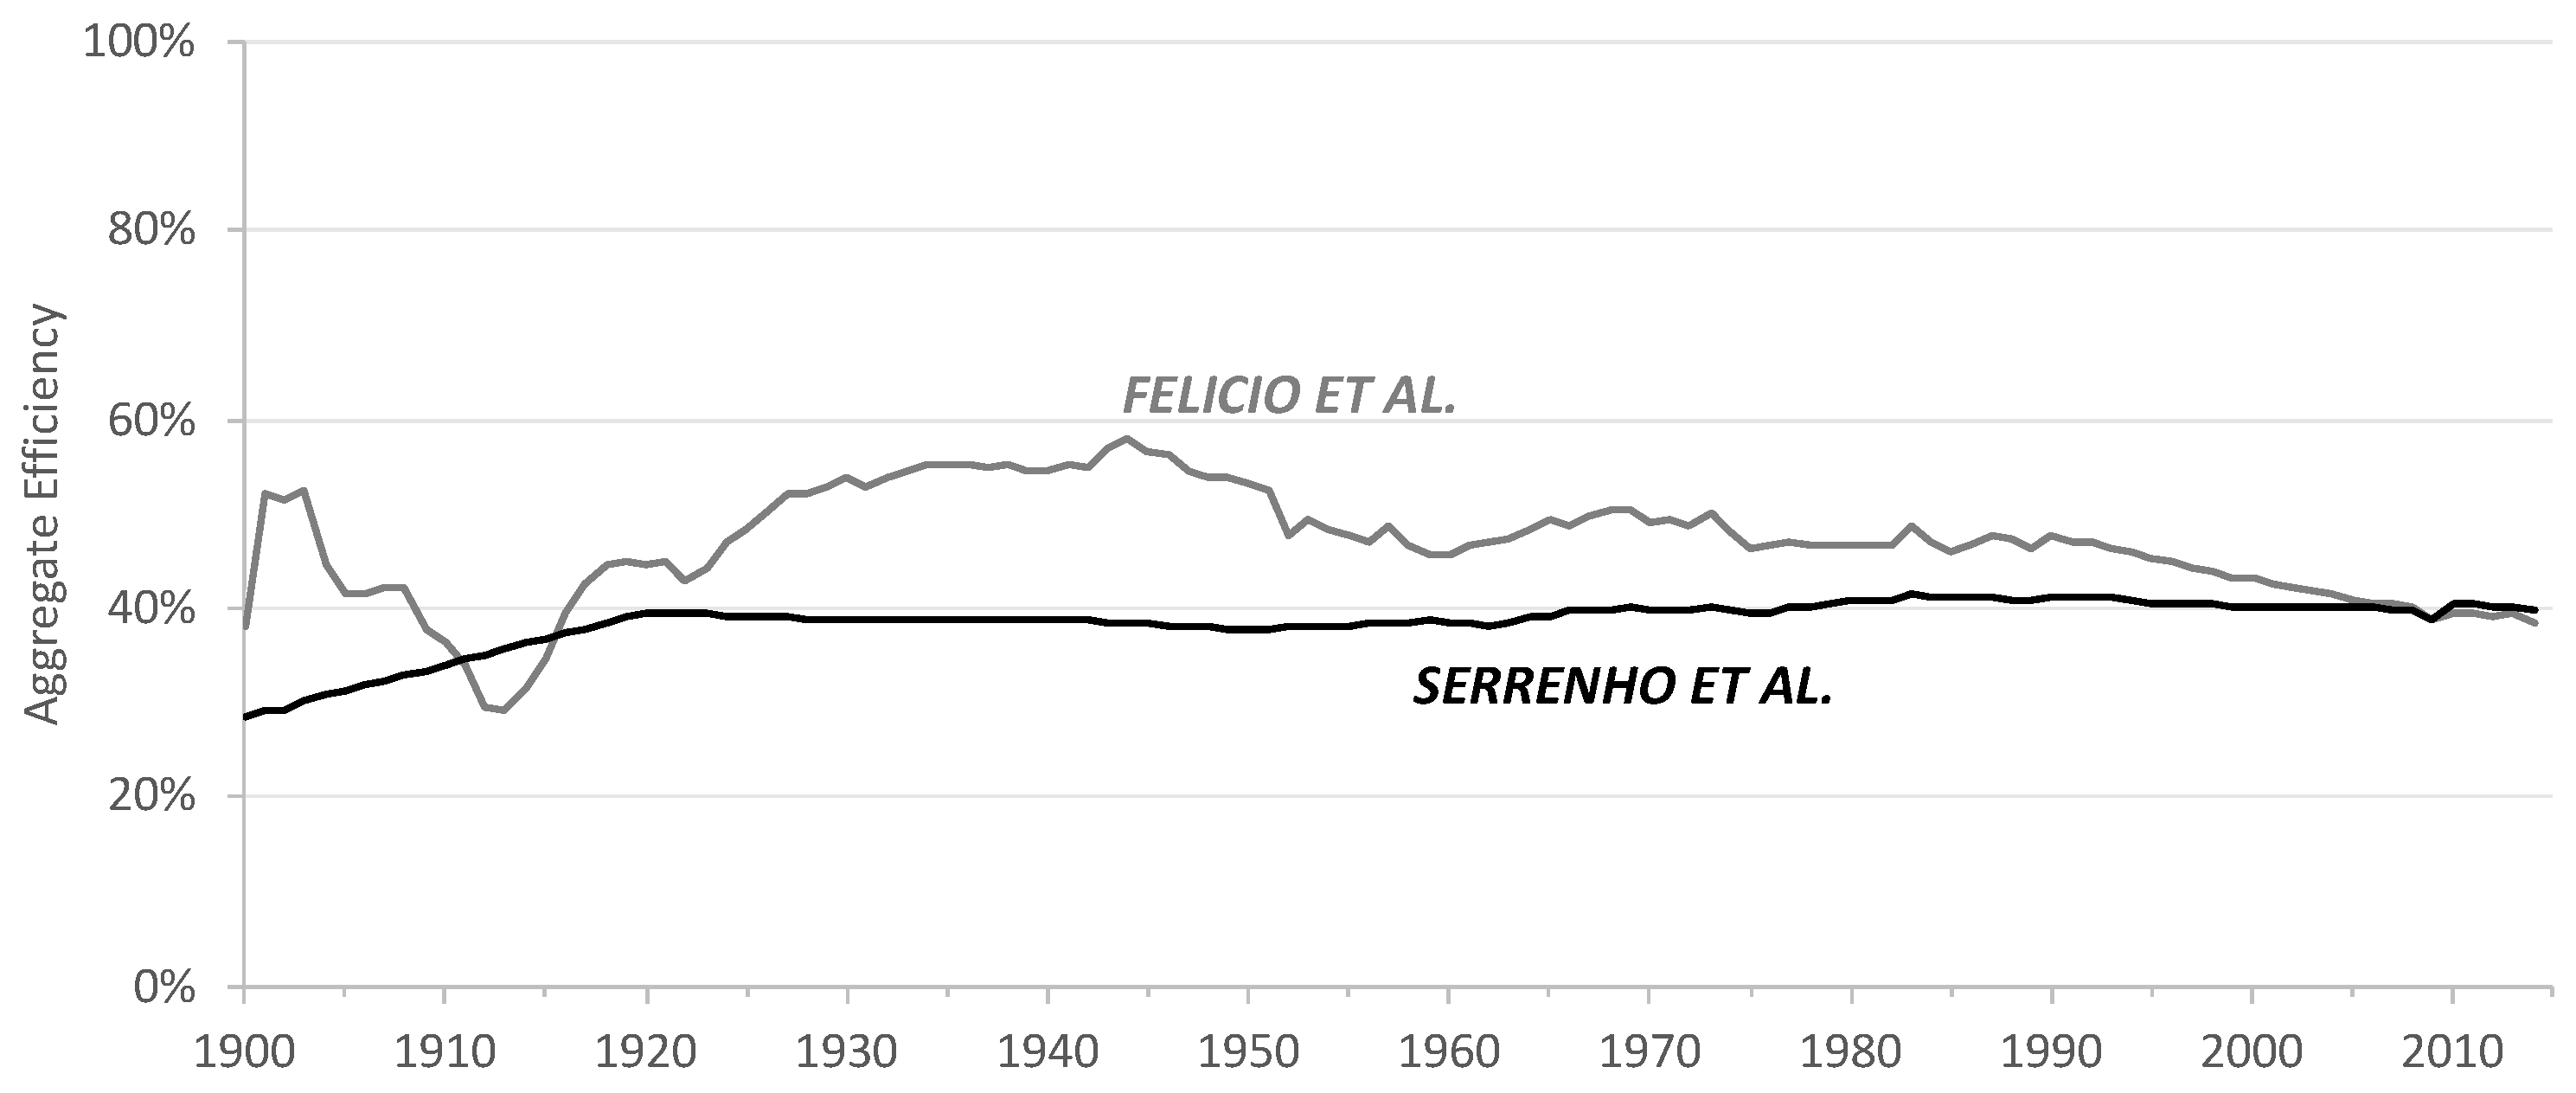
This new series on aggregate exergy efficiency of electricity is compared with Serrenho’s results (Figure 10), who based his model on US data for efficiencies and shares such as lighting and electrical appliances. While the aggregate efficiency estimated by Serrenho et al. [14,34] increases until the 1920s and then remains almost constant, around 40%, the new series shows a stronger variation throughout the whole timespan, especially on the first half of the 20th century, having a clear tendency to decrease since the 1990s which shows the importance of using country specific data.

3.2. Aggregate Primary-to-Final and Primary-to-Useful Exergy Efficiencies
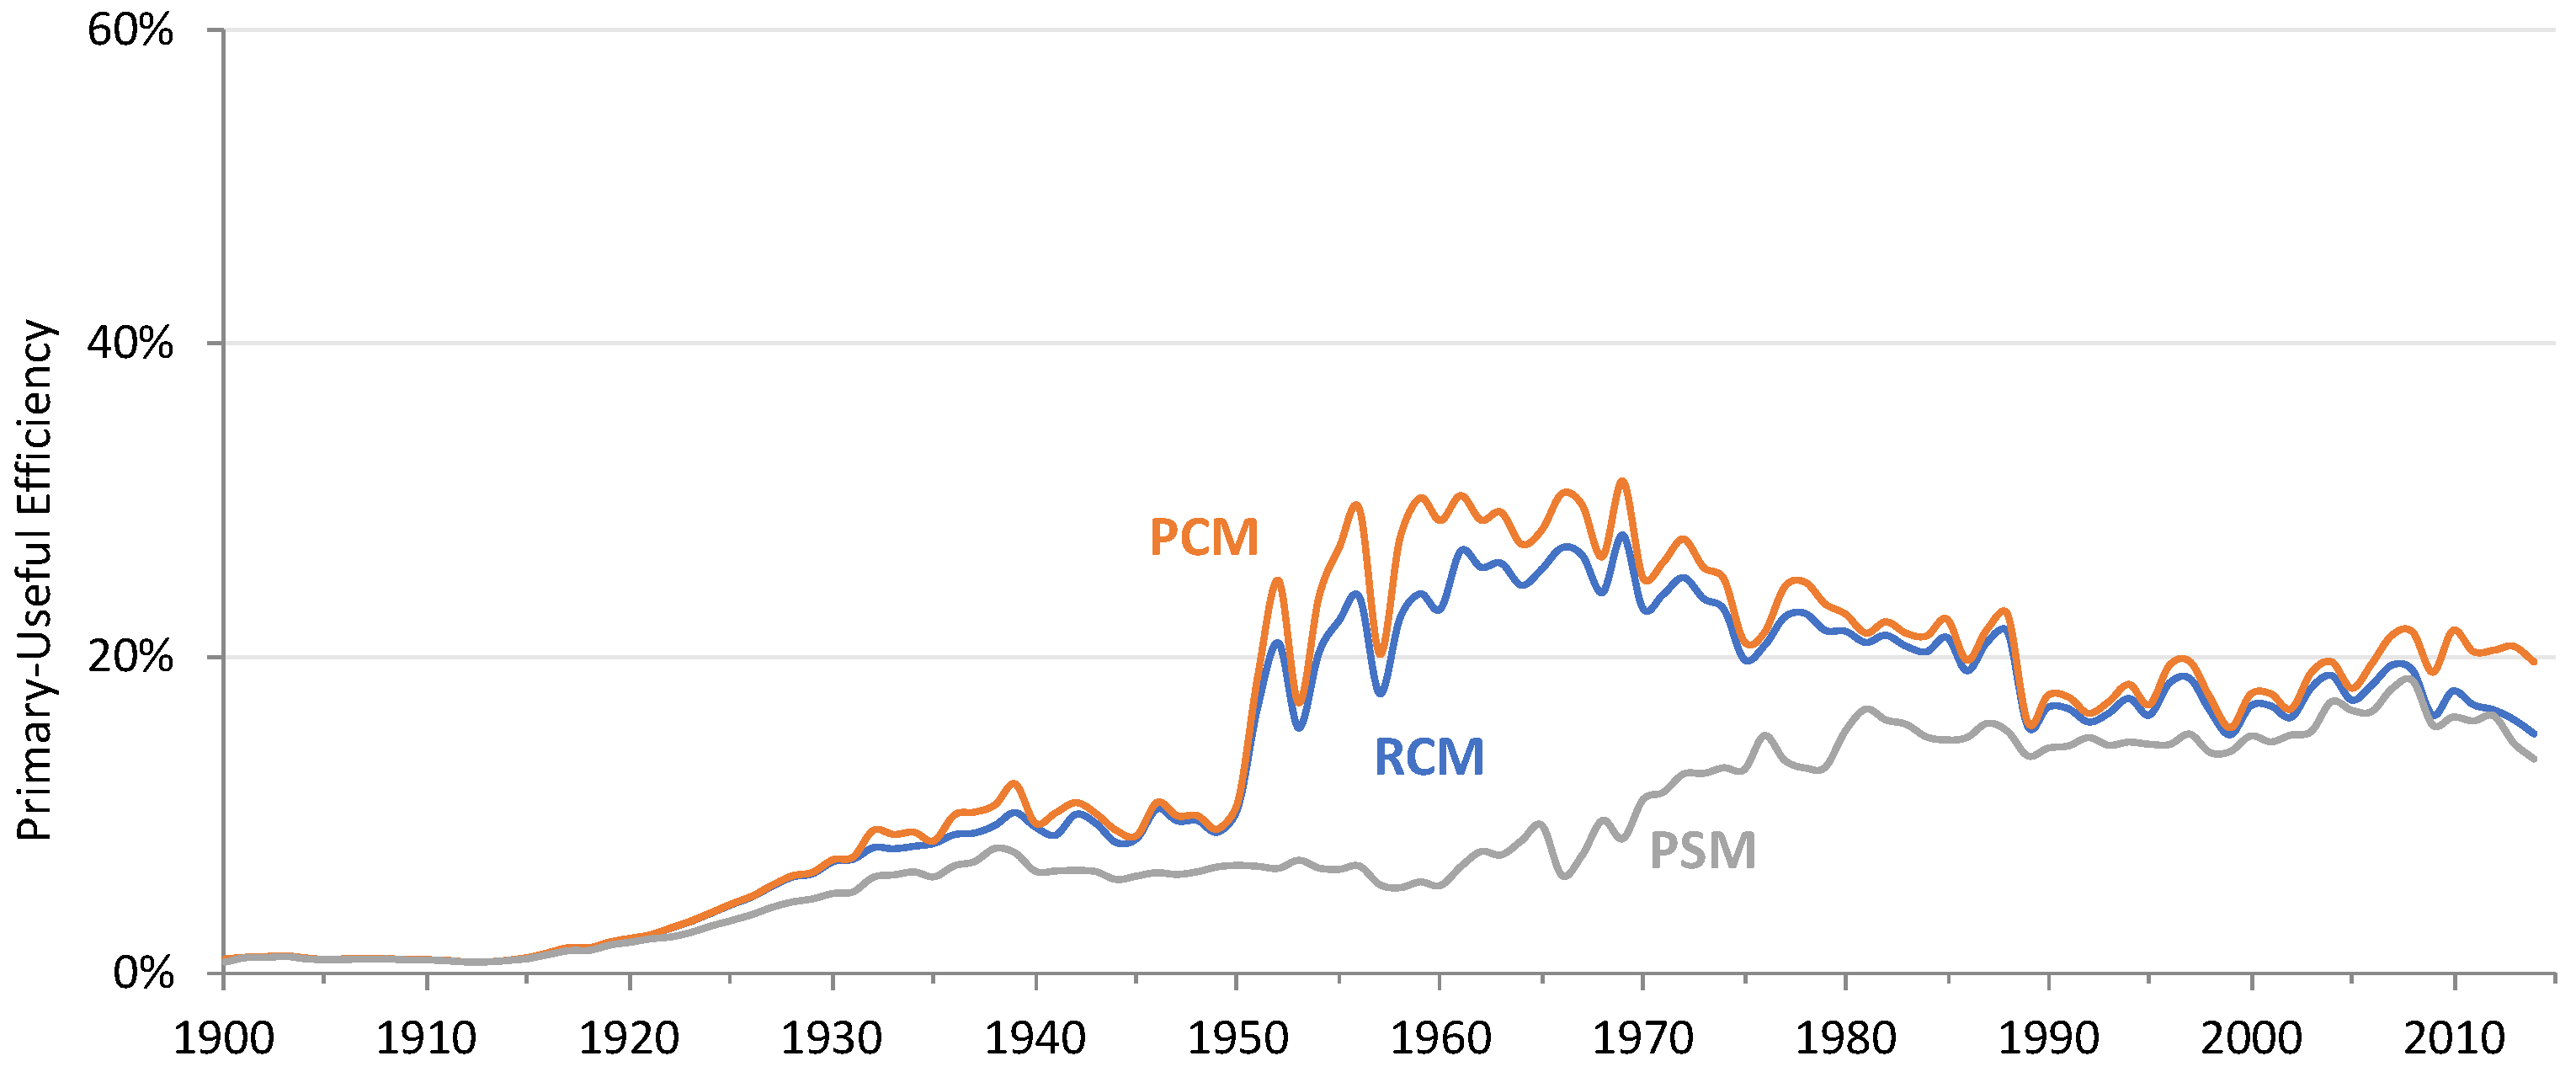
Figure 12 and Figure 13 show the aggregate primary to final and primary to useful exergy efficiencies, respectively, using the three methods to estimate primary exergy.
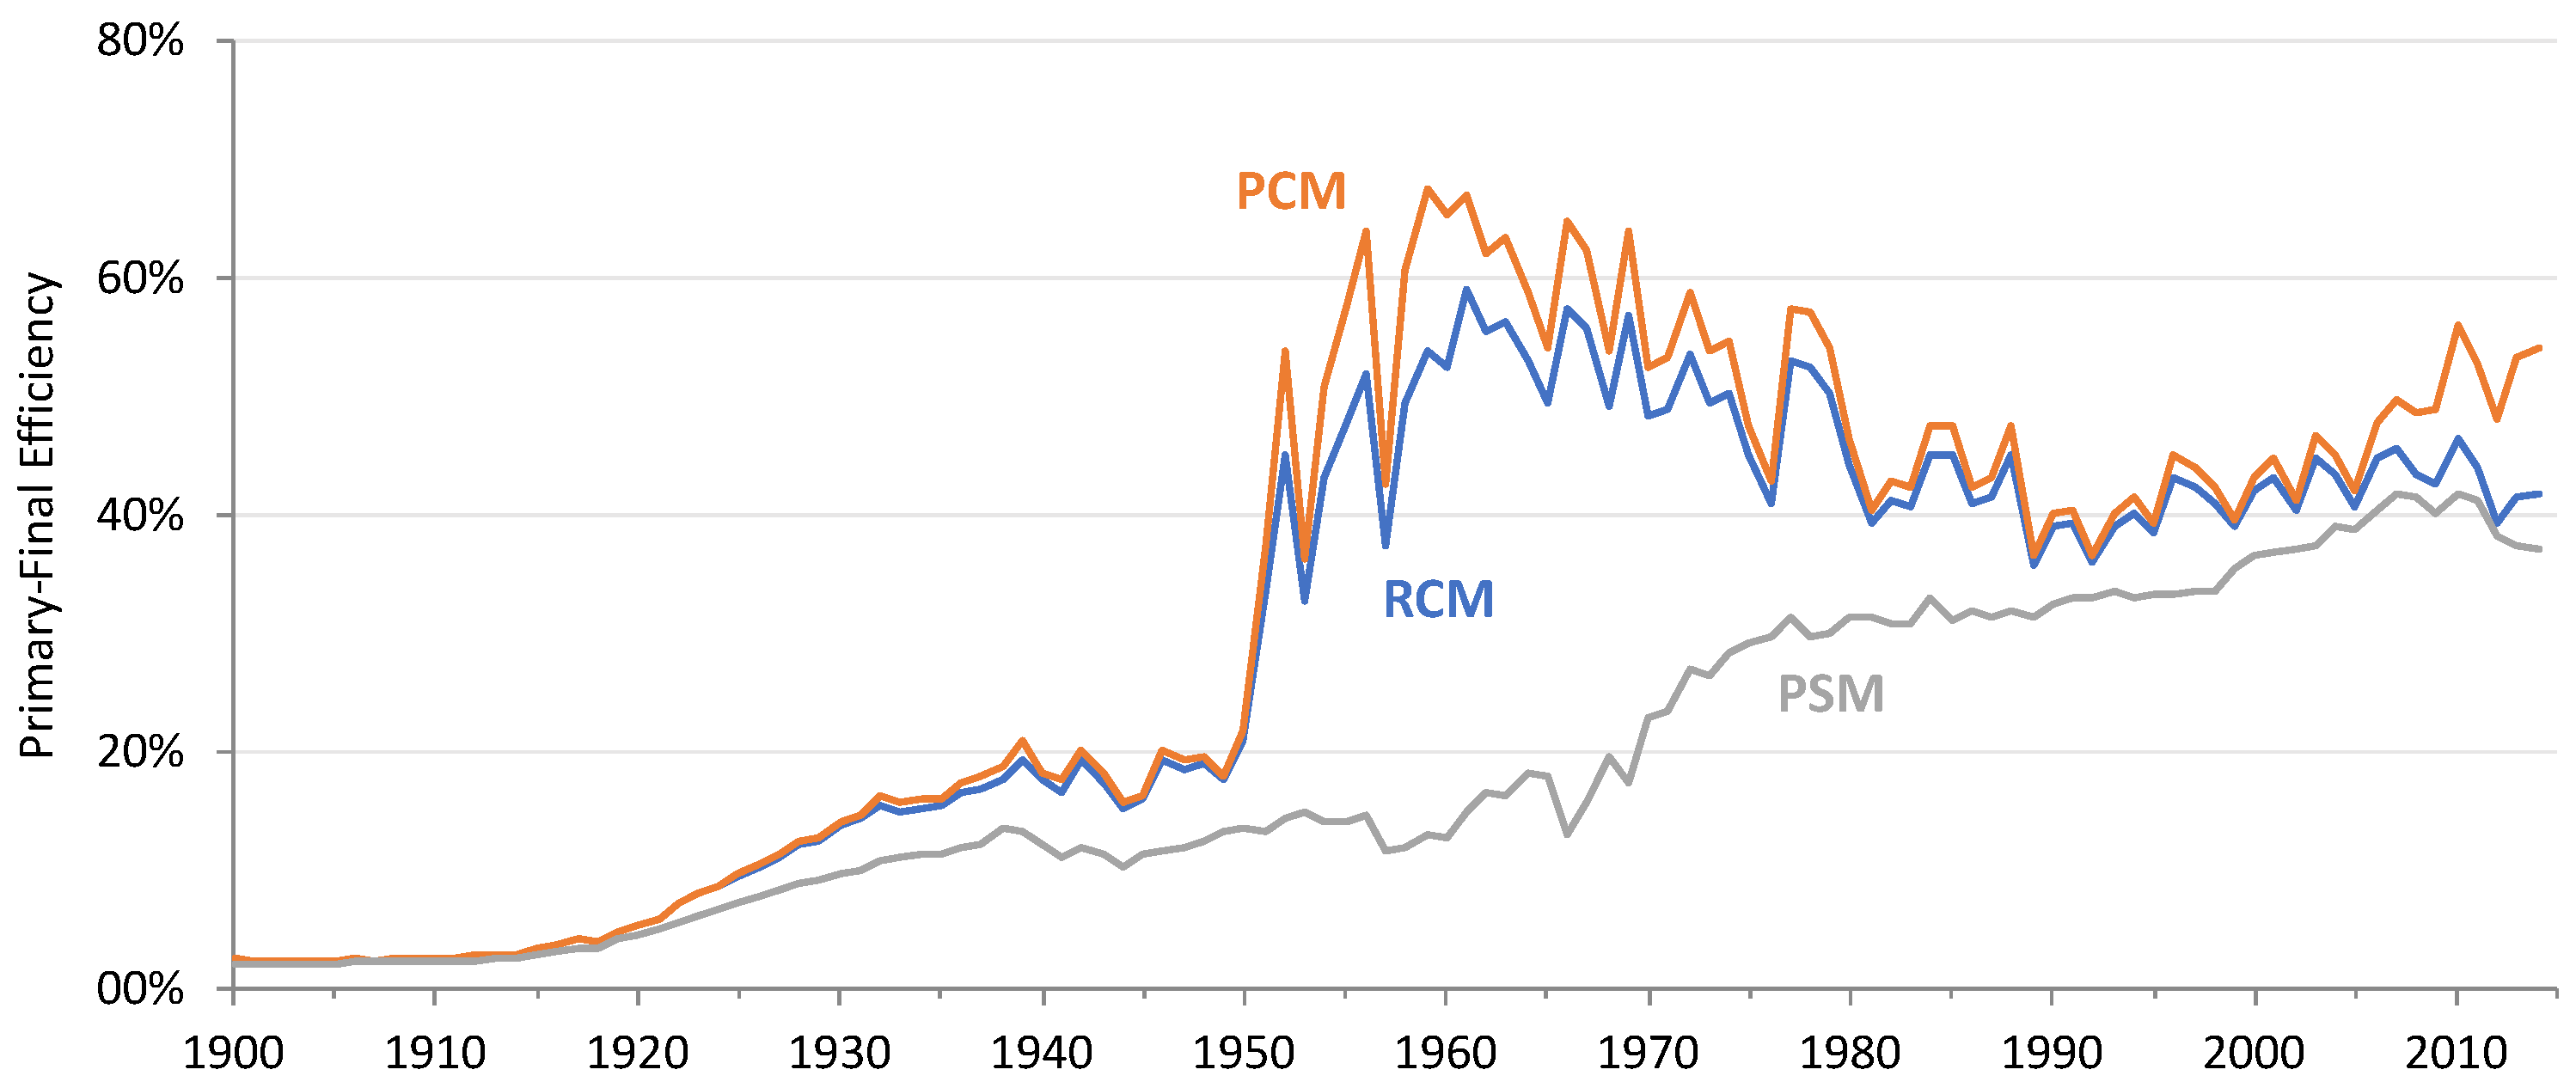
Using the PSM, primary-final exergy efficiency (
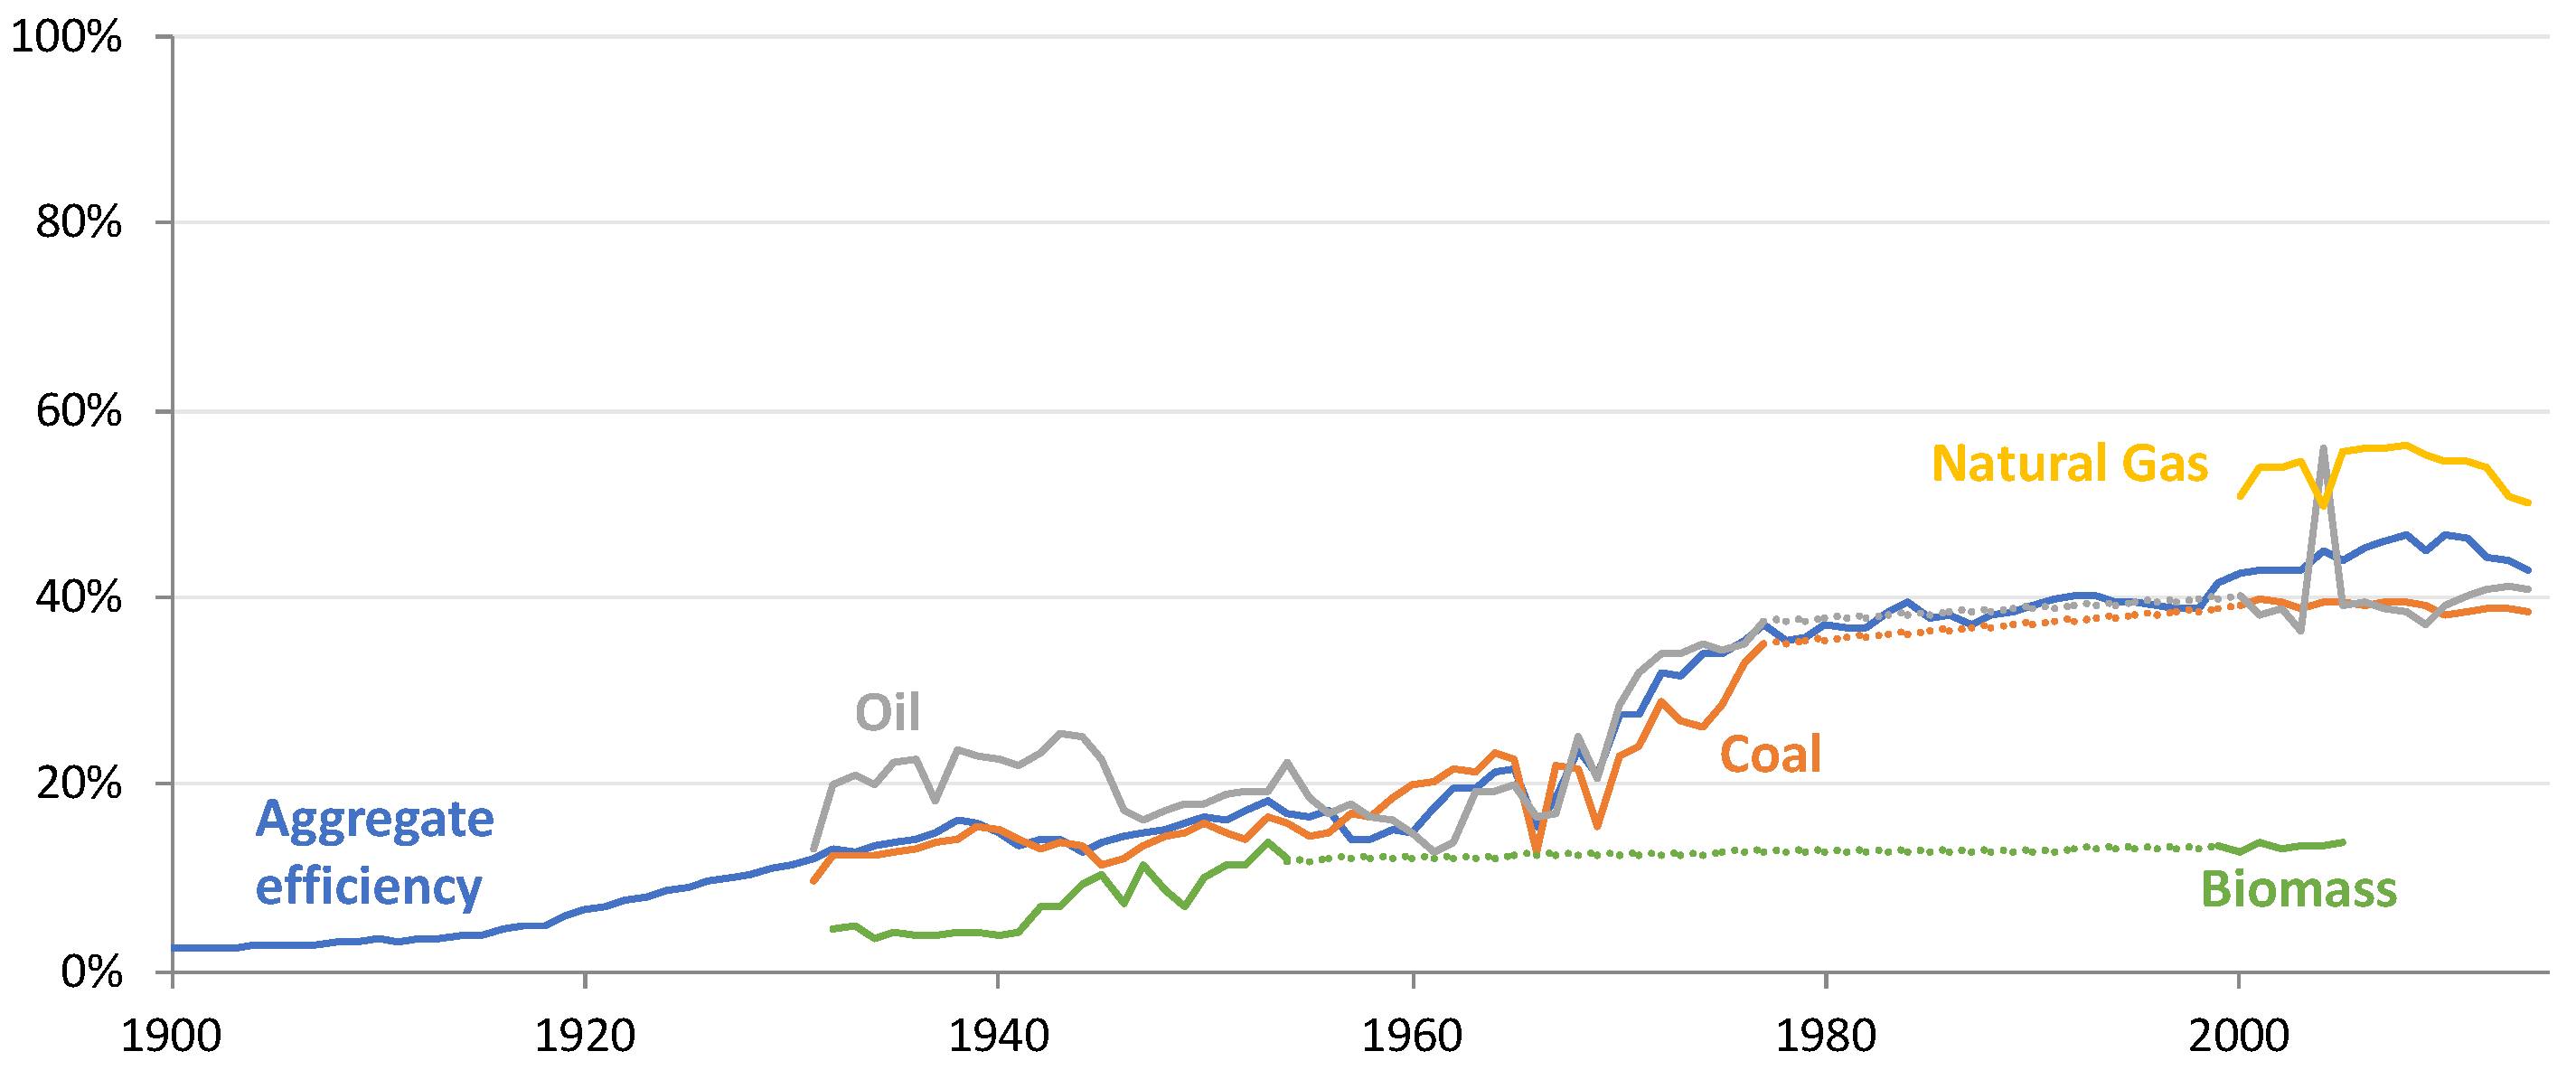
Figure 12) increases from 2% to 37% between 1900 and 2014. With this method, the primary electricity has the same efficiency as the thermoelectricity mix, thus a change in the mix of production towards hydro and wind has no impact on results. The continuous increase of efficiency is due to technological evolution that occurs when there are investments such as Sines refinery in the beginning of the 1970s. In 2005, there is a peak in efficiency which is motivated by a growth in consumption of natural gas in combined cycle power plants that have higher efficiencies than coal power plants. Afterwards, the efficiency decreases due to an increase in the use of coal which is less expensive than natural gas.
With the PCM, primary-final exergy efficiency is around 2.6% in 1900, reaching approximately 54% in 2014. With PCM, the fraction of renewables has a big impact on efficiency because it considers a 100% primary-final efficiency for primary electricity (except for geothermal). The geothermal exception is not relevant for Portugal because its share in the country mix is typically bellow 4–5%. The gap between the PSM and PCM exergy efficiencies increases in the 1950s and 1960s due to the golden years of hydropower. After the mid-2000s, there is another increase in the gap between PSM and PCM exergy efficiencies because of wind-based electricity. Using RCM, primary-to-final exergy efficiency is about 2.6% in 1900 and increases to approximately 42% in 2014. RCM efficiency is similar to PCM efficiency but it is lower in the golden period of hydro because the efficiency of hydro in RCM ranges between 75–85% while in PCM it is 100%. In contrast to PCM, it does not increase after the mid-2000s because the efficiency of wind is similar to the efficiency of thermoelectricity.
The drop in primary to final exergy efficiency obtained after the 1960s with the RCM and PCM methods was also observed by Williams et al. [11] for electricity production in Japan, for the 20th century, as a result from moving from renewables to fossil fuels in electricity generation. In Portugal, this trend has been reversed in the first decade of the XXI century with huge investments in wind-based electricity production which is observable in the PCM efficiency.
The exergy efficiencies of primary to useful are mostly controlled by the behavior of primary to final-efficiencies (Figure 13) with the exception of the period mid-1980s onwards where the dilution effect in final to useful aggregate efficiency had a negative impact on all primary to useful efficiencies. There are two dilution effect periods in the primary to useful efficiency. The first, is from the 1960 until the late 1980s due to a relative decrease of the importance of hydro. This period is identified by the RCM and PCM methods. The second is from mid-2000s onwards, due to a shift from natural gas to coal. This period is identified by the PSM and by the RCM that considers an efficiency for wind-based electricity that is similar to the efficiency of thermoelectricity. The RCM primary to useful efficiency increased from 1% in 1900 to 28% in mid-1960s and then decreased to 16% in 2014.
The method used has a significant impact in years with a high share of renewable resources in the mix of electricity production. For example, in 1960 in Portugal, primary to final exergy efficiency ranges from 65% when estimated using the Physical Content Method (PCM) to 13% using the Partial Substitution Method (PSM). While in 2005, when Portugal endured an extreme drought [65] that led to an electricity mix with approximately 85% of thermo-electricity, primary to final exergy efficiencies given by the three methods are very similar. The primary to final exergy efficiency is higher with the Physical Content method because renewable resources have had an important role in the country’s electricity production mix throughout time and this method highlights the use of those resources. The PSM, which estimates the exergy efficiency that would exist if only thermoelectric production was used, provides lower estimates because the efficiency of thermoelectric production is lower (less than half) of hydro efficiency—the main renewable resource used.

3.3. Carbon Intensity of Electricity Production and Electricity Use

The long-run evolution of CO2 emissions associated with electricity production is shown in Figure 14.
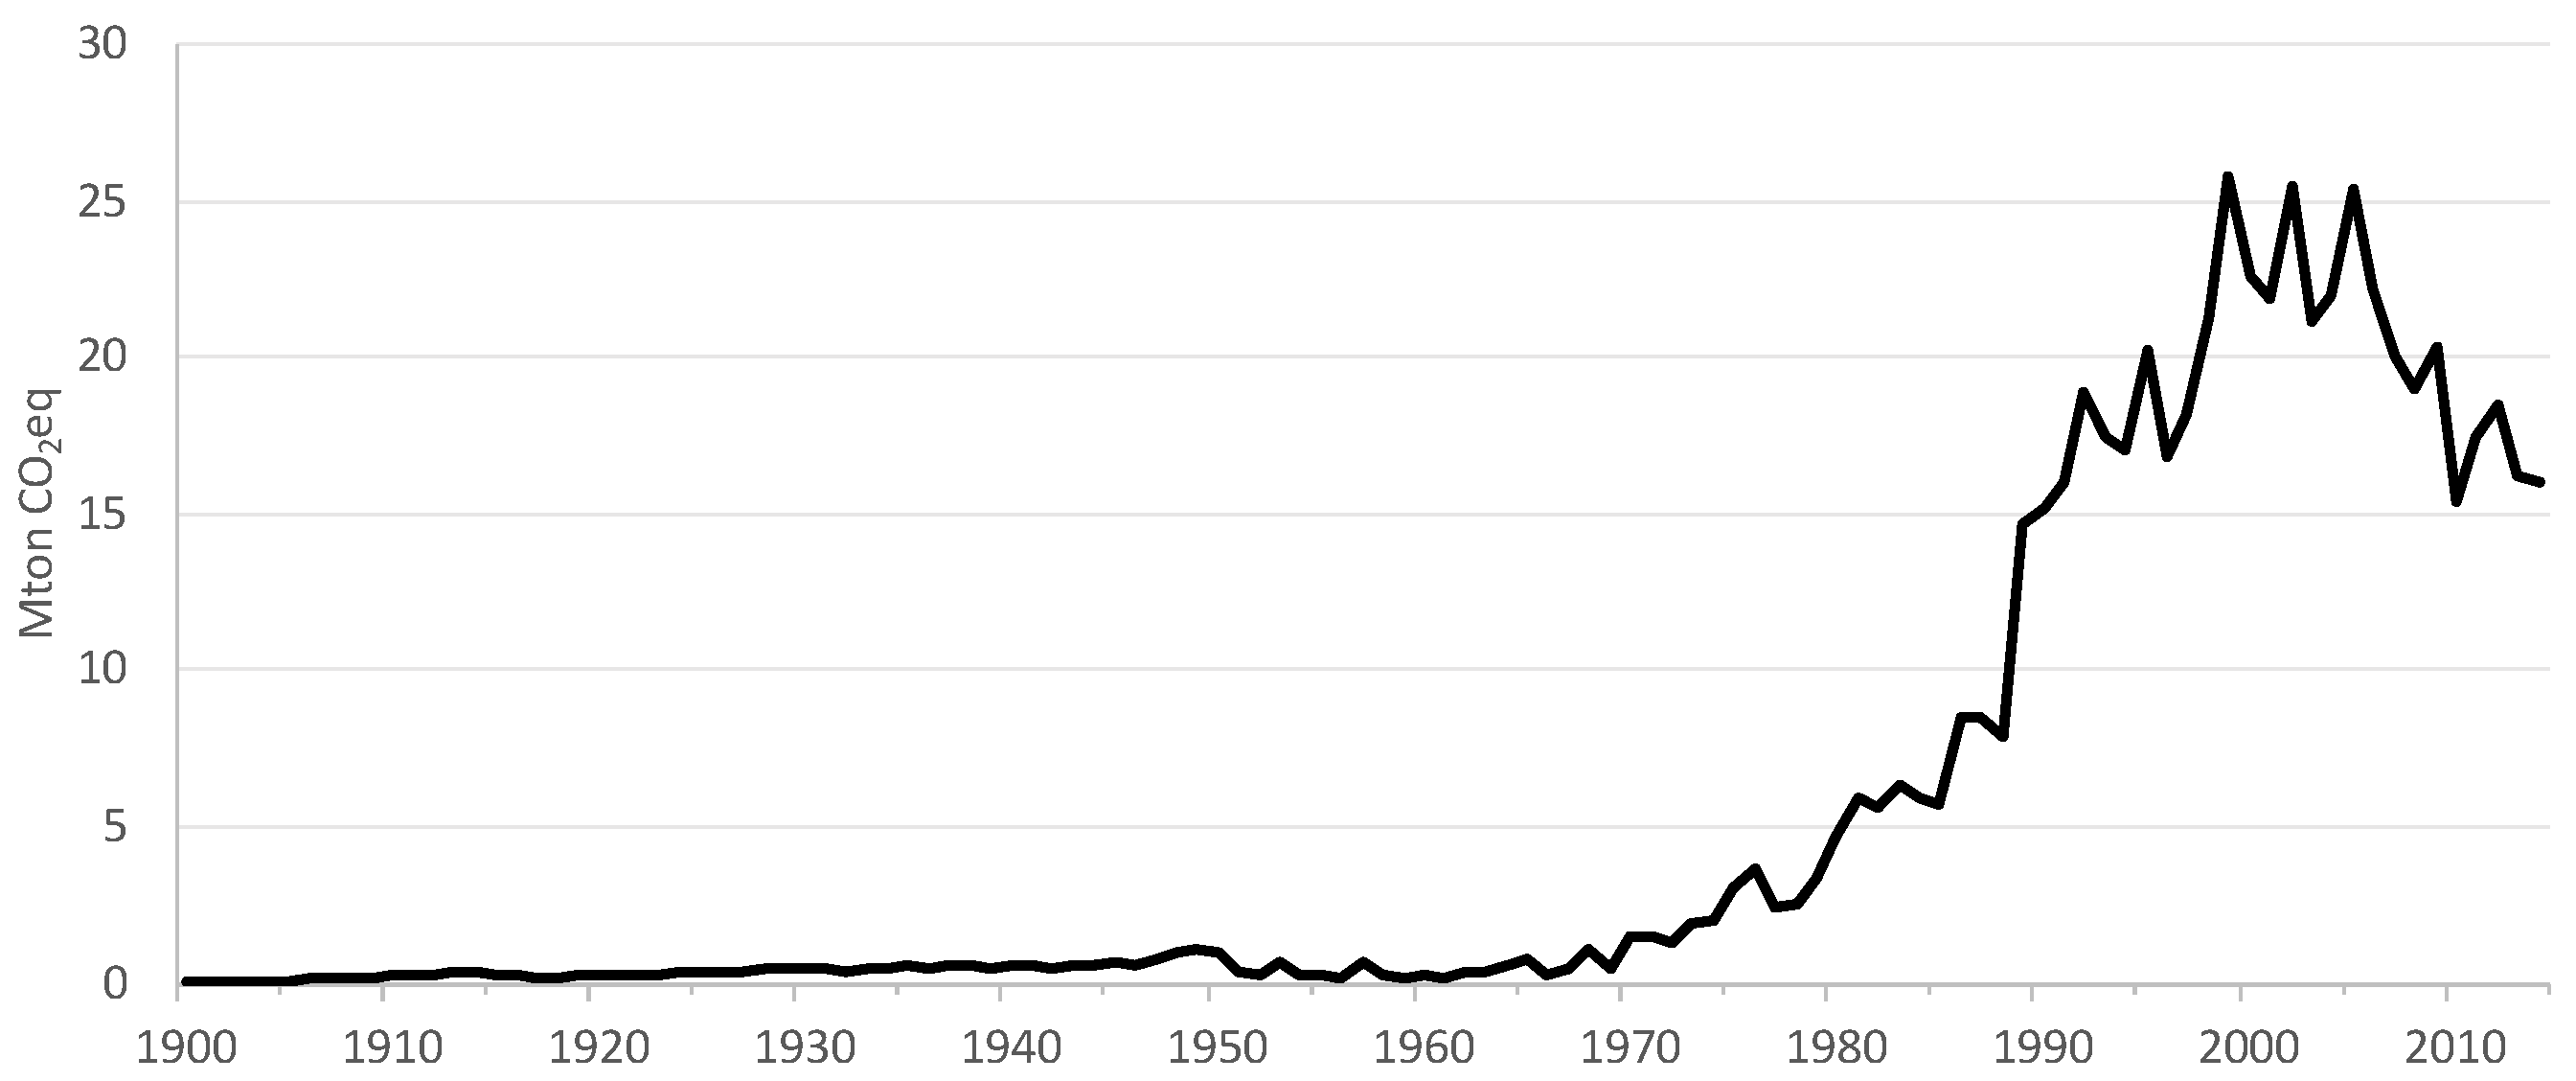
Emissions associated with electricity production in Portugal grew throughout the 20th century due to the increased production of electricity. The peaks in emissions after 2000 (Figure 14) correspond to dry years. The decline after 2005 is associated with wind-based electricity and a decline in the thermoelectricity production.
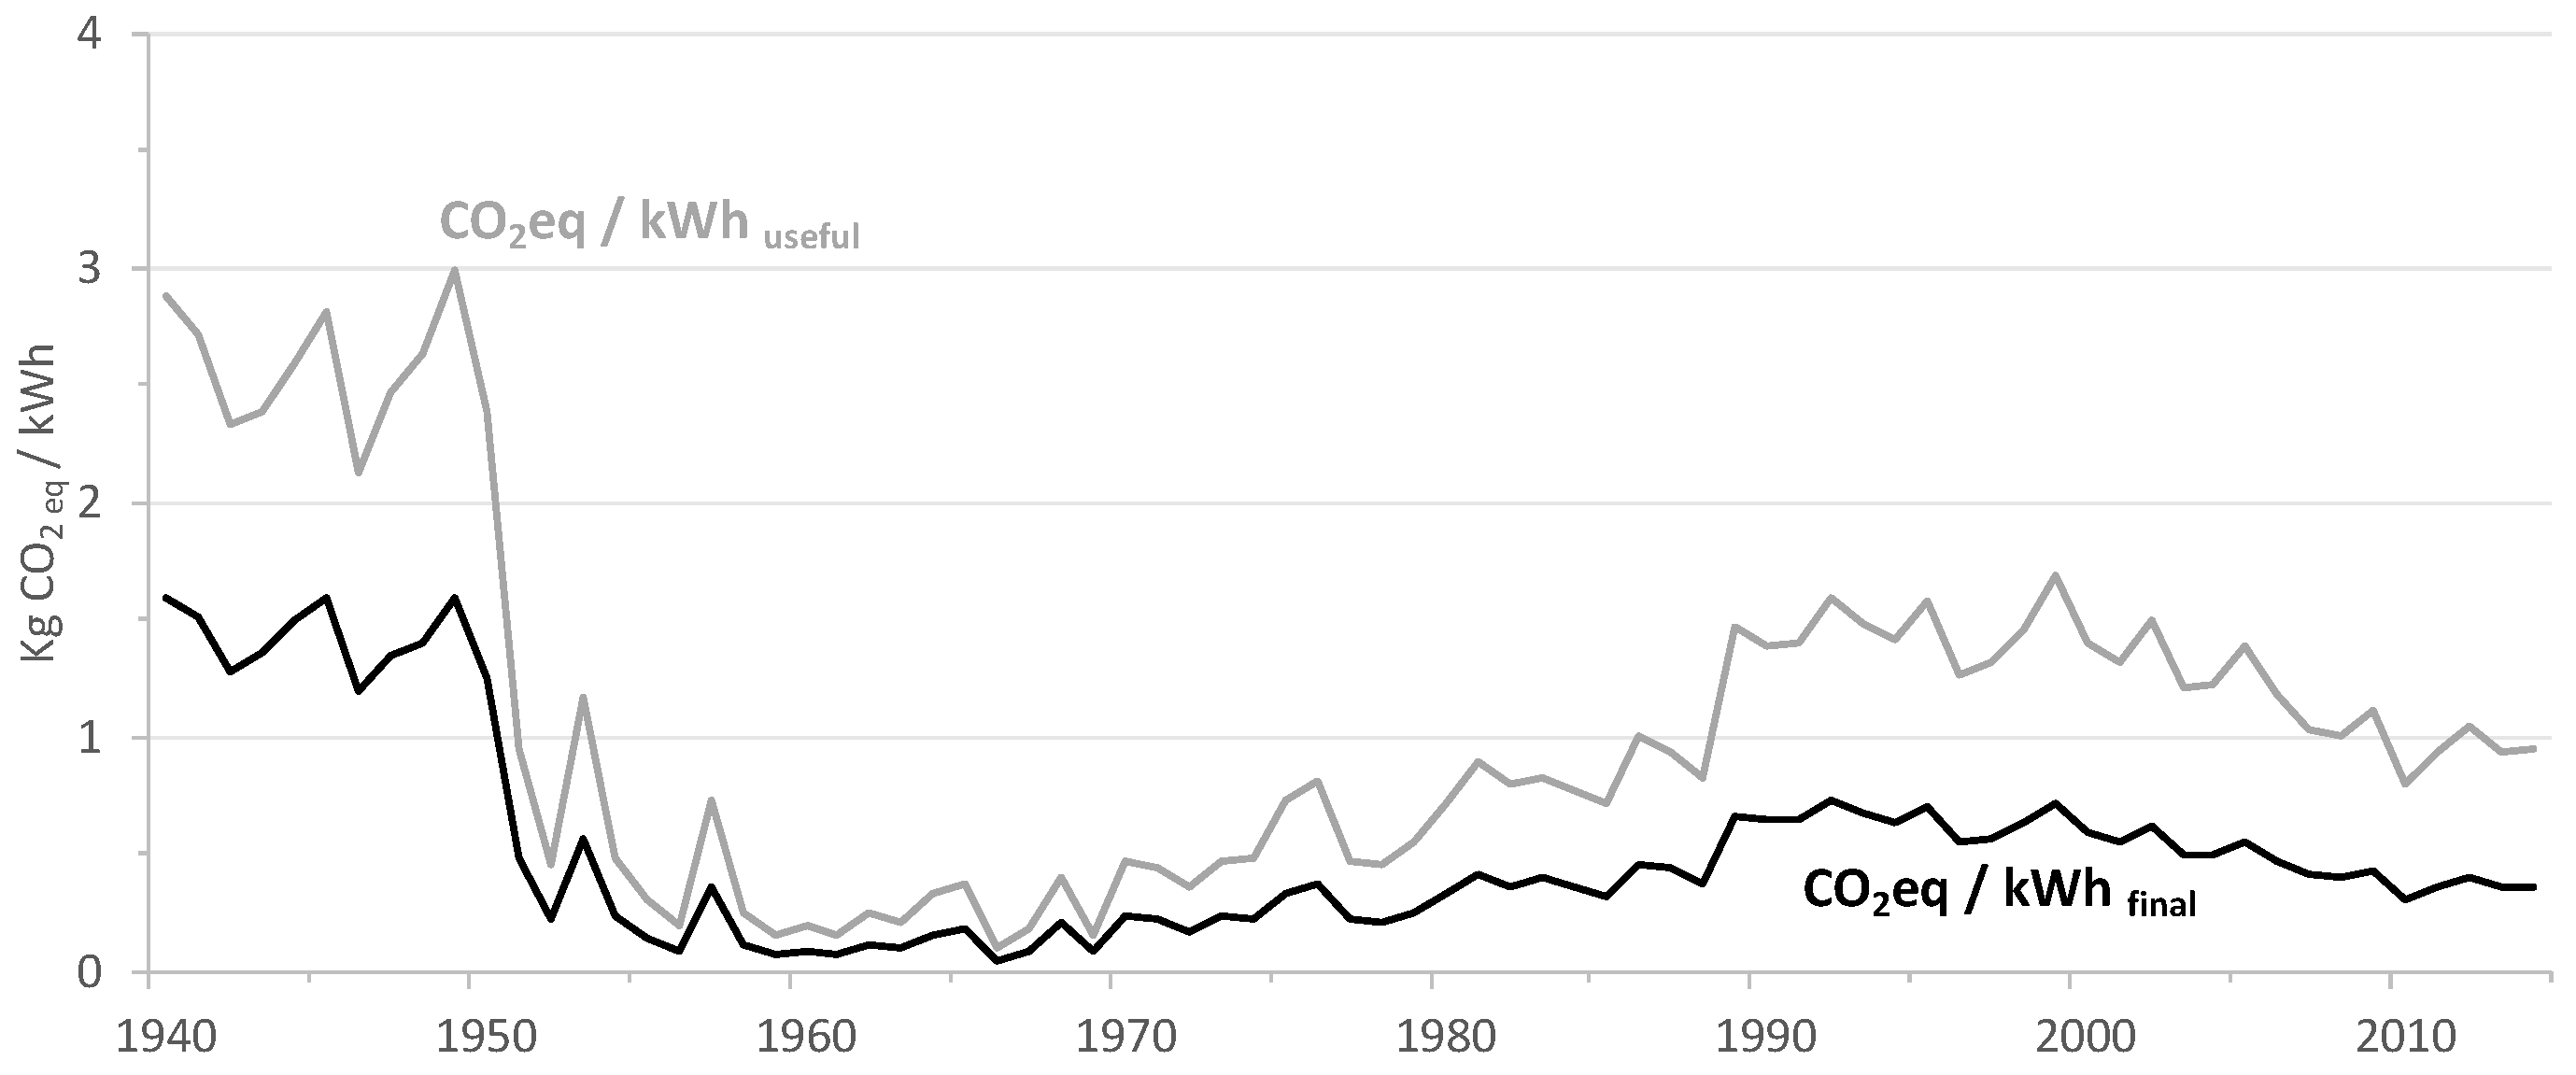
Figure 15 and Figure 16 show the aggregate carbon intensity of final exergy—electricity production (ACIEP) and the aggregate carbon intensity of useful exergy (ACIEU) from 1900 to 2014 and 1940 to 2014, respectively.
In Portugal, there are two periods of decarbonization, i.e., decrease in ACIEP and ACIEU. From 1900 to mid-1960s and from 2000 onwards. In contrast, the 1970s and the 1980s is a period of increase in carbon intensities.
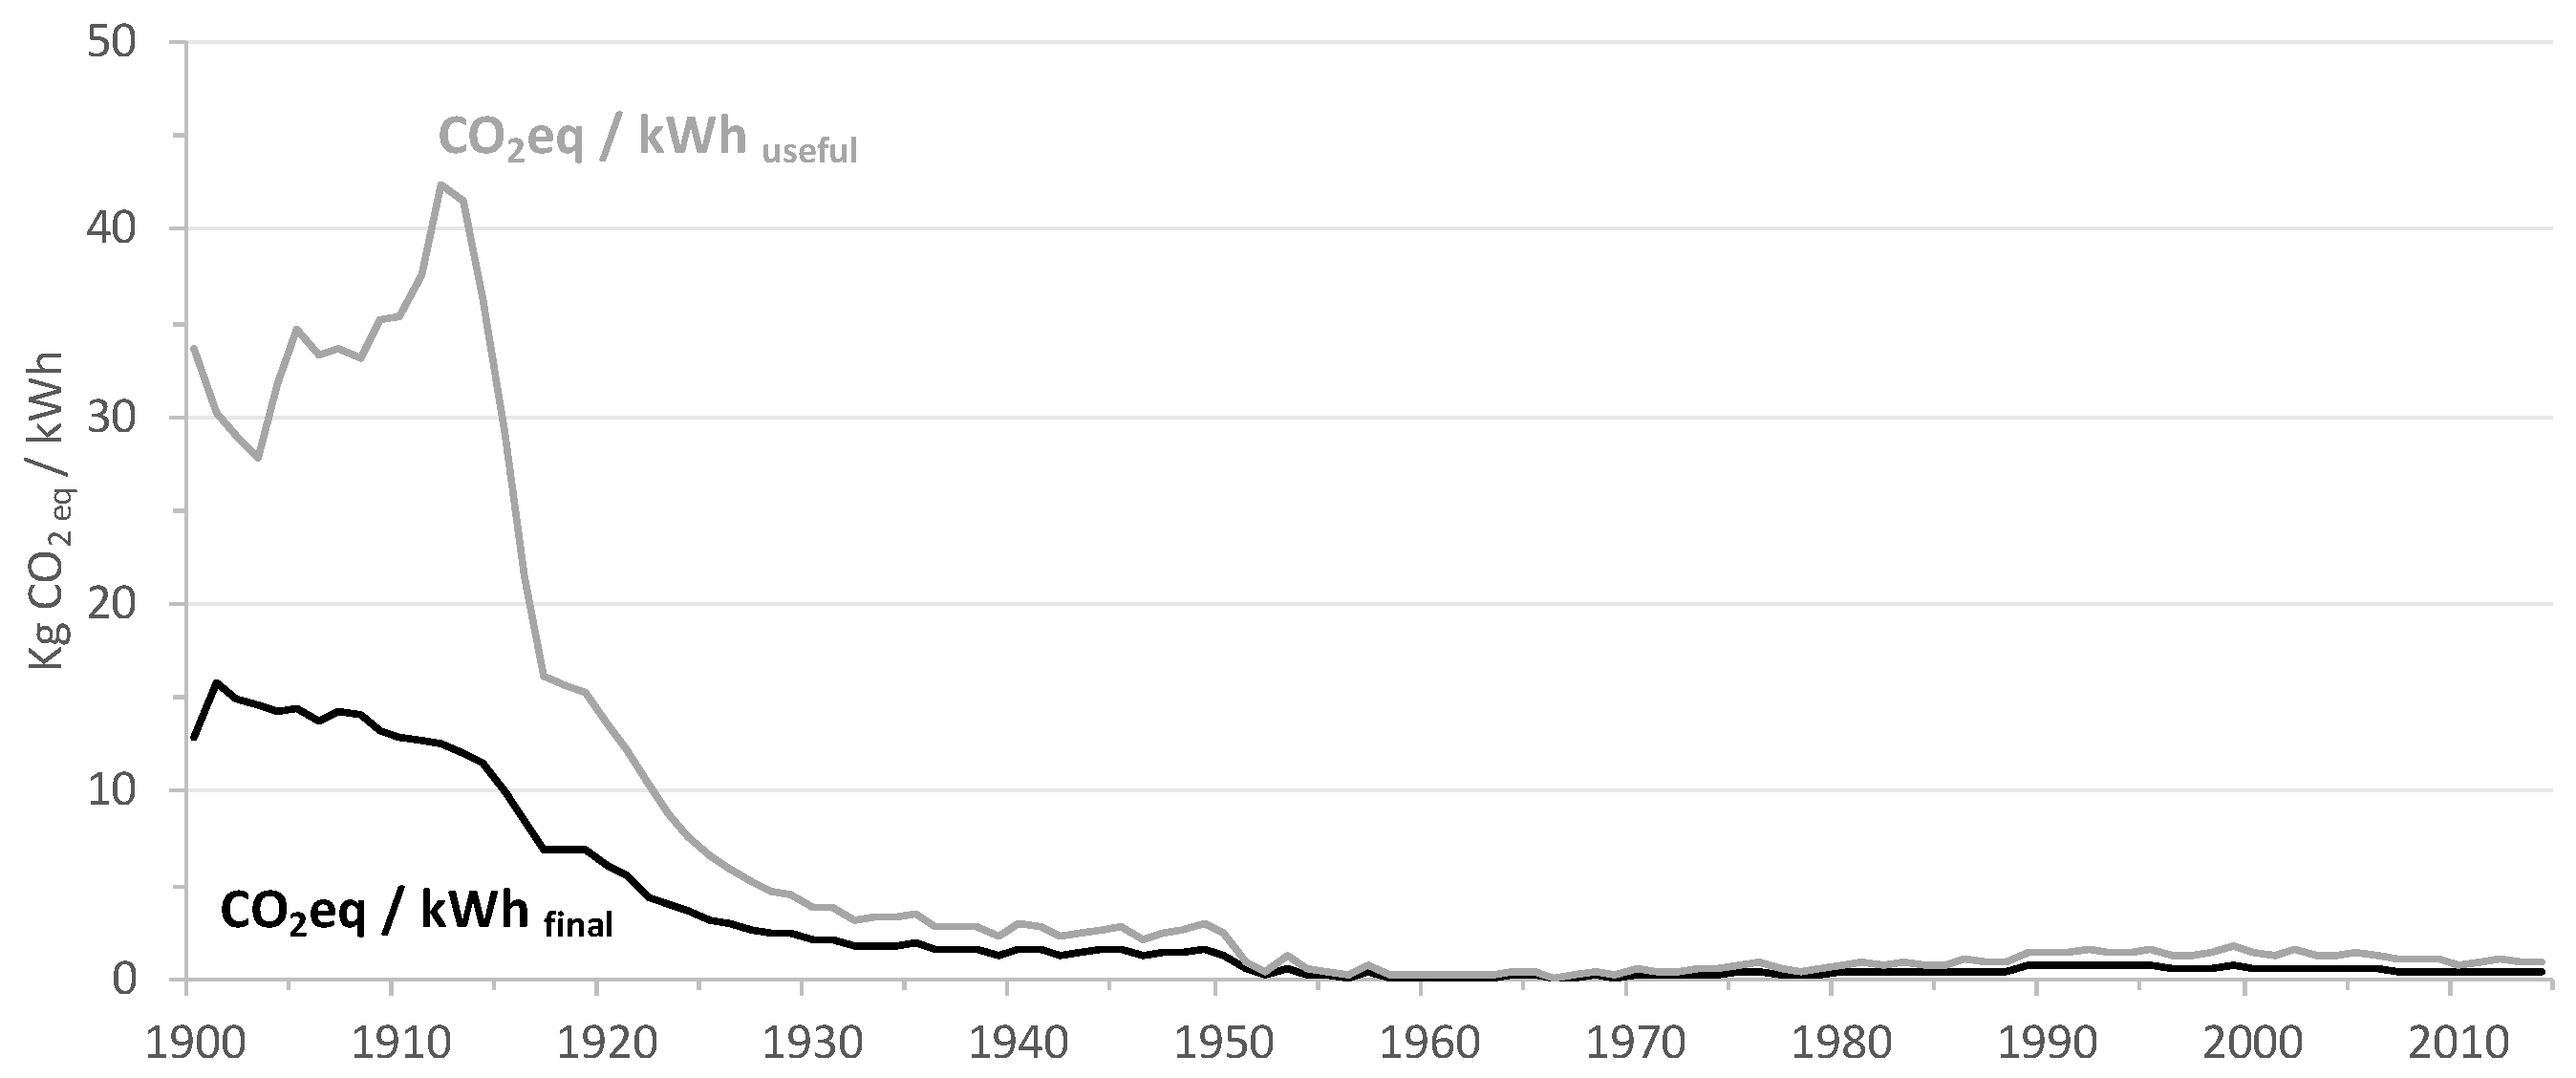
In the first period, from 1900 to mid-1960s, ACIEP decreased from 14 kg CO2eq/kWh to 0.2 kg CO2eq/kWh while ACIEU decreased from 34 kg CO2eq/kWh to 0.4 kg CO2eq/kWh. ACIEP and ACIEU have decreased steadily from 1900 to their lowest values in the mid-1960s. During this period (1900 to 1960), the decarbonization of the electric sector is associated with the increasing importance of hydropower and increase in thermoelectricity exergy efficiency (decrease in ACIEP) while the decarbonization of useful exergy (decrease in ACIEU) is associated also with an increase in final to useful exergy efficiency.
In the second period, the 1970s and 1980s, ACIEP and ACIEU increased again with the increasing importance of oil and coal in the electricity mix production to around 0.6 kg CO2eq/kWh and 1.4 kg CO2eq/kWh in 1990. During this period, the aggregate final to useful exergy efficiency decreased slightly which contributed to the increase in ACIEU.
From 2000 onwards, there is a decrease in ACIEP and ACIEU to ~0.4 kg CO2eq/kWh and 1 kg CO2eq/kWh in 2014 (values similar to the mid-1980s). During this period, the decarbonization of the electricity production was due to an increase in renewable electricity, mostly, wind and hydro. The decarbonization of the electric sector was enough to drive a decarbonization of the useful exergy, despite a decrease in aggregate final to useful exergy efficiency.
There is a period, from 1903 to 1912, where the ACIEP and the ACIEU have opposite trends. The ACIEP slightly decreases because of the increase in efficiency of thermoelectricity production while ACIEU increases and peaks around 1912 at 42.3 kg CO2eq/kWh, due to a drop in final-useful exergy efficiency. This drop is caused by an increase in the share of the residential and commercial sector (lighting) and a decrease of the transport sector.

4. Conclusions

This study shows how the use of more detailed data for electricity allocation and uses is relevant in estimating final to useful exergy efficiency for electricity. Serrenho et al. [14] that used proxies based on US data obtained an exergy efficiency for Portugal that increased from around 30% in 1900 to 40% in 1920s’ and then remained almost constant. This study, based mostly on national historical data, shows decreasing trends in exergy efficiency until World War I from 50% to 30% and since mid-1940s to 2014 from 58% to 40% with two dilution periods (mid-1940s to 1960 and from mid-1990s onwards). These dilution periods in final to useful exergy efficiency have occurred because the technological evolution that increased individual efficiencies was not enough to reverse the decline in aggregated final to useful exergy efficiency that resulted from changes in economic structure: 1) until World War I, the relative weight of the high-efficient transport sector decreases significantly while 2) from mid-1940s to 1960 and from mid-1990 onwards the relative weight of the low efficient commercial and residential sector increases significantly.
Regarding methodological options to account for primary electricity, we demonstrate that the method used has a significant impact in years with a high share of renewable resources in the mix of electricity production. We argue that the Resource Content Method (RCM) that quantifies primary energy associated with primary electricity using the efficiencies of the technology that converts renewable resources (kinetic and potential energy and radiation) into electricity is the method that is more adequate to estimate primary to final exergy efficiency when evaluating scenarios of renewable electricity based on different mixes of technologies, because it captures the evolution in the mix of renewable technologies used. With RCM, primary-to-final exergy efficiency increases from 2.6% in 1900 to approximately 60% in the mid-1960 and then decreases to 42% in 2014. There are two dilution periods in the primary to final efficiency of electricity. The first, is from the 1960 until the late 1980s due to a relative decrease of the importance of hydro compared to thermoelectricity production while the second is from mid-2000s onwards, due to a shift from natural gas to coal. With the RCM, the primary to useful exergy efficiency increased from 1% in 1900 to 16% in 2014.
The aggregated carbon intensity of electricity production (ACIEP) in Portugal has dropped significantly by a factor of 35:1 from 12.8 to 0.35 kg CO2/kWh between 1900 and 2014 while the aggregated carbon intensity of electricity use (ACIEU) has dropped by a factor of 37:1 from 33.6 to 0.9 kg CO2/kWh in the same period. Despite the long-term trends in decarbonization of electricity, there was a period of significant carbon deepening between 1960 and 1990 when the ACIEP and ACIEU increased due to the increasing importance of thermoelectricity. Additionally, there was a shorter period before World War I when ACIEU increased despite the decrease in ACIEP because there was a decrease in the share of the high-efficiency transport sector. The increase in renewable electricity from 2000 onwards, contributed to the decrease in ACIEP and the decrease in ACIEU, despite the decrease in aggregate final to useful efficiency.
Currently, the targets for energy efficiency proposed by the Portuguese National Plan of Action on Energy Efficiency (PNAEE) are focused on the reduction of primary and final energy consumption which is problematic because the decrease in consumption doesn’t necessarily require an effective increase of efficiency. Our results show that public policies that aim to increase the exergy efficiency and decrease the carbon intensity of electricity should promote: (1) the collection of data regarding the allocation of electricity to end-uses because the estimation of reliable primary to useful exergy efficiency and ACIEU depend on country-specific data (2) the electrification of the transport sector to reverse the efficiency dilution effect that resulted from the structural change of society towards services and (3) the production of renewable electricity and the phasing-out of coal to decrease the carbon intensity of electricity production. Policy targets and measures on electricity efficiency and decarbonization at the national level should be based on reliable primary to final and final to useful exergy efficiencies obtained through a societal exergy analysis using detailed country-specific data.
In the future, it is expected that the final to useful exergy efficiency of electricity will increase due to the electrification of the transport sector. The RCM primary to final exergy efficiency of electricity will stagnate because the efficiencies of renewable technologies that will be deployed on a larger scale (solar and wind) are not higher than the average thermoelectricity efficiency. Additionally, if batteries are added to the system, they will impose a penalty in terms of efficiency. In contrast, the prospects for decarbonization in a scenario where the majority of electricity is fully renewable and the final to useful efficiency has a positive trend due to a large-scale electrification of transport are more encouraging, with a possible significant drop in values for ACIEP and ACIEU.
Three key aspects that this study did not take into account and that should be included in future work are: (1) other final energy carriers, (2) all life-cycle emissions associated to renewables and (3) electricity prices. The inclusion of all energy carriers is important to establish priorities in the electrification of end-uses. The use of ACIEU that quantifies the carbon intensity of useful exergy will facilitate the comparison of carbon intensities of the same end-use (e.g., heat) provided by electricity and other energy carriers revealing the impact of electrification on decarbonization. Including indirect emissions of renewables associated to its processes of fabrication, transportation, decommissioning and disposal, might influence the results obtained for aggregated carbon intensities, so further work is needed on this to understand the extent of the impact on current results. Higher electricity prices promote more efficient uses of electricity but might inhibit the electrification of end-uses currently being provided by other energy carriers. The quantification of the impact of electricity prices on these factors in the past is important to evaluate the desirability of public policies that incentivize renewable electricity production or subsidize electricity prices.

Supplementary Materials

The following are available online at https://www.mdpi.com/1996-1073/12/3/534/s1. Table S1: Electricity end-use shares per sector, Table S1.1 Air-conditioning and refrigeration shares in Heat and Cooling categories, Table S2: Portugal’s electricity final exergy per sector and end-use, Table S3: Final-useful exergetic efficiencies per end-use, Table S4: Portugal’s electricity useful exergy per sector and end-use, Table S5. Portugal’s electricity thermo and renewable production, aggregate primary-final and final-useful efficiencies—RCM (TJ and %), Table S6: Portugal’s CO2eq emissions and aggregate carbon intensities ACIEP e ACIEU.

Author Contributions

Conceptualization, L.F., S.T.H., T.D. and T.S.; Formal analysis, L.F.; Investigation, L.F. and S.H.; Supervision, S.T.H. and T.S.; Writing—original draft, L.F., S.T.H. and T.S.; Writing—review & editing, L.F., S.T.H., A.S., T.D. and T.S.

Funding

Laura Felício research was funded by FCT/MCTES (PIDDAC), under the project UID/EEA/50009/2013. Sofia Henriques research was supported by the project “Energy use and economic growth: a long run European study (1870-2013)” funded by Jan Wallanders och Tom Hedelius Stiftelse samt Tore Browaldhs Stiftelse and Craaford foundation. This work was also supported by FCT/MCTES (PIDDAC) through project UID/EEA/50009/2019.

Acknowledgments

We thank the anonymous reviewers for the detailed and insightful comments and suggestions that were helpful in improving the paper. Additionally, we thank Tiago Ribeiro, from Instituto Superior Técnico, for the comments and discussions that helped sharpen the messages of the paper.

Conflicts of Interest

The authors declare no conflict of interest.

References

  1. Stern, D.I. Economic Growth and Energy. Available online: https://www.elsevier.com/solutions/sciencedirect/content/reference-modules (accessed on 4 January 2019).
  2. Devine, W.D. From shafts to wires: Historical perspective on electrification. J. Econ. Hist. 1983, 42, 347–372. [Google Scholar] [CrossRef]
  3. Rosenberg, N. Factors affecting the diffusion of technology. Explor. Econ. Hist. 1972. [Google Scholar] [CrossRef]
  4. IEA Energy Balances of OECD Countries. Available online: https://www.iea.org/statistics/balances/ (accessed on 4 January 2019).
  5. Alvarenga, A.; Marta-Pedroso, C.; Santos, J.; Felício, L.; Almeida Serra, L.; Palha, M.R.; Sarmento, N.; da Silva Vieira, R.; Teixeira, R.F.M.; Santos, S.; et al. Towards a Carbon Neutral Economy: How Can Portugal’s Economy Grow While Creating Employment? MEET 2030 Report for Business; Lisboa, Portugal, 2017; Available online: http://www.bcsdportugal.org/noticias/meet-2030-conclusoes (accessed on 4 January 2019).
  6. Domingos, T. Rumo a uma Quarta Revolução Industrial Sustentável: Resolver o Dilema da Energia e Crescimento. Público. 2018. Available online: https://www.publico.pt/2018/01/31/economia/opiniao/rumo-a-uma-quarta-revolucao-industrial-sustentavel-resolver-o-dilema-da-energia-e-crescimento-economico-1801314 a (accessed on 4 January 2019).
  7. Dennis, K. Environmentally beneficial electrification: Electricity as the end-use option. Electr. J. 2015. [Google Scholar] [CrossRef]
  8. Sousa, T.; Brockway, P.E.; Cullen, J.M.; Henriques, S.T.; Miller, J.; Serrenho, A.; Domingos, T. The need for robust, consistent methods in societal exergy accounting. Ecol. Econ. Econ. 2017, 141, 11–21. [Google Scholar] [CrossRef]
  9. Ayres, R.U.; Ayres, L.W.; Pokrovsky, V. On the efficiency of US electricity usage since 1900. Energy 2005, 30, 1092–1145. [Google Scholar] [CrossRef]
  10. Brockway, P.E.; Barrett, J.R.; Foxon, T.J.; Steinberger, J.K. Divergence of trends in US and UK aggregate exergy efficiencies 1960-2010. Environ. Sci. Technol. 2014, 48, 9874–9881. [Google Scholar] [CrossRef] [PubMed]
  11. Williams, E.; Warr, B.; Ayres, R.U. Efficiency dilution: Long-term exergy conversion trends in Japan. Environ. Sci. Technol. 2008, 42, 4964–4970. [Google Scholar] [CrossRef] [PubMed]
  12. Goh, T.; Ang, B.W.; Su, B.; Wang, H. Drivers of stagnating global carbon intensity of electricity and the way forward. Energy Policy 2018, 113, 149–156. [Google Scholar] [CrossRef]
  13. DGSE. Estatísticas das Instalações Eléctricas; Instituto Nacional de Estatística: Lisboa, Portugal, 1927. [Google Scholar]
  14. Serrenho, A.C.; Warr, B.; Sousa, T.; Ayres, R.U.; Domingos, T. Structure and dynamics of useful work along the agriculture-industry-services transition: Portugal from 1856 to 2009. Struct. Chang. Econ. Dyn. 2016, 36, 1–21. [Google Scholar] [CrossRef]
  15. Palma, M.; Sousa, T.; Guevara, Z. How much detail should we use to compute societal aggregated exergy efficiencies? Energies 2016, 9, 364. [Google Scholar] [CrossRef]
  16. Henriques, S.T. Energy Transitions, Economic Growth and Structural Change: Portugal in a Long-Run Comparative Perspective; Lund University: Lund, Sweeden, 2011; Volume 54, ISBN 978-91-7473-153-8. [Google Scholar]
  17. Matos, A.C. A electricidade em Portugal: Dos Primórdios à 2a Guerra Mundial; Museu da Electricidade; EDP—Museu da Electricidade: Lisboa, Portugal, 2004; ISBN 9728909004. [Google Scholar]
  18. Henriques, S.T.; Sharp, P. Without Coal in the Age of Steam and Dams in the Age of Electricity: An Explanation for the Failure of Portugal to Industrialize before the Second World War; Lund University: Lund, Sweeden, 2018. [Google Scholar]
  19. Madureira, C.; Baptista, V. Hidroelectricidade em Portugal—memória e desafio; Rede Eléctrica Nacional: Lisbon, Portugal, 2002. [Google Scholar]
  20. REN Centro de Informação REN—Centrais Hidroelécricas. Available online: http://www.centrodeinformacao.ren.pt/PT/InformacaoTecnica/Paginas/CentraisHidroelectricas.aspx (accessed on 6 December 2017).
  21. REN Centro de Informação REN—Centrais Termoeléctricas. Available online: http://www.centrodeinformacao.ren.pt/PT/InformacaoTecnica/Paginas/CentraisTermoelectricas.aspx (accessed on 6 December 2017).
  22. DGEG. Disponibilidade de energia eléctrica para consumo; DGEG: Lisboa, Portugal, 2017.
  23. Henriques, S. Energy consumption in Portugal 1856–2006; Consiglio Nazionale delle Ricerche: Napoli, Italy, 2009; ISBN 978-88-8080-109-2. [Google Scholar]
  24. DGEG Balanços Nacionais Energéticos. Available online: http://www.dgeg.gov.pt (accessed on 6 December 2017).
  25. Teives, S.; Bussola, D. O consumo doméstico de energia. In A História da Energia—Portugal 1890–1980; Madureira, N., Ed.; Livros Horizonte: Lisboa, Portugal, 2005; pp. 115–137. [Google Scholar]
  26. Silva, F.M. O povoamento da metrópole observado através dos censos; Publicações do Centro de Estudos Demográficos: Lisboa, Portugal, 1970. [Google Scholar]
  27. SMGEP. Serviços Municipalizados de Gás e Electricidade. In Relatórios Anuais (several issues); Imprensa Nacional: Porto, Brazil, 2014. [Google Scholar]
  28. INE; DGEG. Inquérito ao Consumo de Energia no sector doméstico 2010. (Survey on Energy Consumption, in Portuguese); INE, I.P./DGEG: Lisboa, Portugal, 2010.
  29. Serrenho, A.C.; Sousa, T.; Warr, B.; Ayres, R.U.; Domingos, T. Decomposition of useful work intensity: The EU (European Union)-15 countries from 1960 to 2009. Energy 2014, 76. [Google Scholar] [CrossRef]
  30. Ayres, R.U.; Ayres, L.W.; Warr, B. Exergy, power and work in the US economy, 1900–1998. Energy 2003, 28, 219–273. [Google Scholar] [CrossRef]
  31. Chen, G.Q.; Chen, B. Extended-exergy analysis of the Chinese society. Energy 2009. [Google Scholar] [CrossRef]
  32. Ertesvåg, I.S.; Mielnik, M. Exergy analysis of the Norwegian society. Energy 2000, 25, 957–973. [Google Scholar] [CrossRef]
  33. Wall, G.; Sciubba, E.; Naso, V. Exergy use in the Italian society. Energy 1994. [Google Scholar] [CrossRef]
  34. Serrenho, A. Useful Work as an energy end-use accounting method—Historical and economic transitions and European patterns; University of Lisbon-Instituto Superior Técnico: Lisbon, Portugal, 2013. [Google Scholar]
  35. INE; DGEG. Inquérito ao Consumo de Energia no sector doméstico 1989. (Survey on Energy Consumption, in Portuguese); INE, I.P./DGEG: Lisboa, Portugal, 1989.
  36. DGE; GEBEI. A Procura da Energia em Portugal (Cenários Alternativos); Direcção-Geral de Energia: Lisboa, Portugal, 1980. [Google Scholar]
  37. INE. Comércio Externo (several issues); Imprensa Nacional: Lisboa, Portugal, 2018. [Google Scholar]
  38. Mitchell, B. International historical statistics: Europe 1750–2005; Palgrave Macmillan: New York, NY, USA, 2007. [Google Scholar]
  39. EDP. EDP—simulador de potência e consumo. Available online: https://www.edp.pt/particulares/apoio-cliente/simulador-potencia/ (accessed on 6 December 2017).
  40. Loja da Luz Consumo médio de electricidade. Available online: https://lojaluz.com/consumo-medio-eletricidade (accessed on 6 December 2017).
  41. EHSE—Empresa Hidroeléctrica da Serra da Estrela. Empresa Hidroeléctrica da Serra da Estrela: Ao servico da nacao desde 1909; EHSE—Empresa Hidroeléctrica da Serra da Estrela: Lisboa, Portugal, 1959. [Google Scholar]
  42. Soda Póvoa. Soda Póvoa: 50 anos 1934–1984; SP: Póvoa de Santa Iria, Lisbon, Portugal, 1984. [Google Scholar]
  43. Ministério da Indústria e Energia; Direcção Geral da Indústria. A indústria química em Portugal; Imprensa Nacional: Lisboa, Portugal, 1992.
  44. INE. Estatísticas de produção industrial; Instituto Nacional de Estatística: Lisboa, Portugal, 1950. [Google Scholar]
  45. EDP. Relatórios técnicos EDP (several issues); EDP: Lisboa, Portugal, 1984. [Google Scholar]
  46. Fernandes, J. Frio Industrial: Caraterização geral de sistemas e principais oportunidades para o aumento da eficiência energética; University of Coimbra: Coimbra, Portugal, 2016. [Google Scholar]
  47. ISR—Universidade de Coimbra; ADENE. Programa Motor Challenge. Guia Técnico: Soluções para melhorar os sistemas accionados por mortores electricos; ADENE: Coimbra, Portugal, 2012. [Google Scholar]
  48. Henriques, S.T. New Series on Electricity Production and Consumption in Portugal 1900 to 1927. Available online: www.sofiateiveshenriques.com (accessed on 13 December 2018).
  49. Tereshchenko, T.; Nord, N. Uncertainty of the allocation factors of heat and electricity production of combined cycle power plant. Appl. Therm. Eng. 2015. [Google Scholar] [CrossRef]
  50. Ford, K.W.; Rochlin, G.I.; Socolow, R.H.; Hartley, D.L.; Hardesty, D.R.; Lapp, M.; Dooher, J.; Dryer, F.; Berman, S.M.; Silverstein, S.D. Efficient Use of Energy: The APS studies on the technical aspects of the more efficient use of energy. In AIP Conference Proceedings; Ford, K.W., Rochlin, G.I., Socolow, R.H., Hartley, D.L., Hardesty, D.R., Lapp, M., Dooher, J., Dryer, F., Berman, S.M., Silverstein, S.D., Eds.; AIP Publishing LLC.: Princetown, NJ, USA, 1975; Volume 25. [Google Scholar]
  51. Ayres, R.U.; Warr, B. The Economic Growth Engine: How Energy and Work drive Material Prosperity; Edward Elgar Publishing Limited: Cheltenham, UK, 2010. [Google Scholar]
  52. de Sá, F.P. Análise exergética e de trabalho útil do Brasil entre 1971 e 2009; University of Lisbon-Instituto Superior Técnico: Lisboa, Portugal, 2013. [Google Scholar]
  53. IGIL. Anais do Instituto Geofísico do Infante D. Luís; University of Lisbon: Lisboa, Portugal, 1856. [Google Scholar]
  54. PORDATA. Temperatura média do ar. Available online: https://www.pordata.pt/en/Portugal/Average+air+temperature+(yearly+average)-1067-10164 (accessed on 6 December 2017).
  55. Fouquet, R. A brief history of energy. In International Handbook on the Economics of Energy; Evans, J., Hunt, L.C., Eds.; Edward Elgar: Cheltenham, UK, 2009; pp. 1–19. [Google Scholar]
  56. Guevara, Z.; Sousa, T.; Domingos, T. Insights on energy transitions in Mexico from the analysis of useful exergy 1971–2009. Energies 2016, 9, 488. [Google Scholar] [CrossRef]
  57. Fouquet, R.; Pearson, P.J.G. Seven centuries of energy services: The price and use of light in the United Kingdom (1300–2000). Energy J. 2006, 27, 139–177. [Google Scholar] [CrossRef]
  58. Taib, M.Y.; Aziz, A.A.; Alias, A.B.S. Performance analysis of a domestic refrigerator. In 1st NCMER 2010, 26-27 May; Universiti Malaysia Pahang: Kuantan, Malaysia, 2010; pp. 582–591. [Google Scholar]
  59. Reistad, G.M. Available energy conversion and utilization in the United States. J. Eng. Power 1975, 97, 429. [Google Scholar] [CrossRef]
  60. Michel, A.; Bush, E.; Nipkow, J.; Brunner, C.U.; Bo, H. Energy efficient room air conditioners—best available technology (BAT). Available online: http://www.topten.info/uploads/File/023_Anette_Michel_final_paper_S.pdf (accessed on 4 January 2019).
  61. PORDATA. Temperatura máxima do mês mais quente do ano. Available online: https://www.pordata.pt/Portugal/Temperatura+máxima+do+ar+no+mês+mais+quente+do+ano+(média+mensal)-1339 (accessed on 6 December 2017).
  62. PORDATA. Temperatura mínima do ar. Available online: https://www.pordata.pt/Portugal/Temperatura+mínima+do+ar+(média+anual)-1069 (accessed on 6 December 2017).
  63. Heun, M.K.; Brockway, P.E. Meeting 2030 primary energy and economic growth goals: Mission impossible? Appl. Energy 2019. In review. [Google Scholar]
  64. Programme, N.G.G.I.; Eggleston, H.S.; Buendia, L.; Miwa, K.; Ngara, T.; Tanabe, K. (Eds.) IPCC Guidelines for national greenhouse gas inventories: Overview. In 2006 IPCC Guidelines for National Greenhouse Gas Inventories; Institute for Global Environmental Strategies (IGES): Hayama, Japan, 2006; ISBN 4-88788-032-4. [Google Scholar]
  65. Instituto de Meteorologia. Drought in mainland Portugal; Instituto de Meteorologia: Lisboa, Portugal, 2006.
Figure 1. Electricity produced by source 1894–2014 (TJ) (thermoelectric: includes production from coal, oil, natural gas, biomass and other non-renewables; primary electricity: includes production from hydro, wind, geothermal and solar photovoltaic). Data from Henriques [16,23] and national energy balances [24]. The dashed line is for the period were only aggregate thermoelectric production totals were available so it was not possible to compute the production form each resource separately, previous to the aggregate calculations.
Energies 12 00534 g001
Figure 2. Share of electricity produced by source in %, 1900–2014. Sources: 1900–1927: [23,24], 1927–1984: [13], 1984–1990: [25].
Energies 12 00534 g002
Figure 3. Share of main sectors in the final consumption of electricity (%). Source: 1900–1927: estimations from Teives [25]; 1927–1959: DGSE (Direcção-Geral dos Serviços Eléctricos) [13] and 1960–2015: IEA (International Energy Agency) [4].
Energies 12 00534 g003
Figure 4. Final exergy shares for Residential/Commercial sector per end-use 1900–2014.
Energies 12 00534 g004
Figure 5. Final exergy shares for industrial sector per end-use 1900–2014.
Energies 12 00534 g005
Figure 6. Electricity production energy efficiency by fuel, 1900 to 2014 [24,48]. The dashed are efficiencies obtained by interpolation due to incorrect or lack of data.
Energies 12 00534 g006
Figure 7. Final-useful exergy efficiencies per end-use in Industry (1900–2014).
Energies 12 00534 g007
Figure 8. Final-useful exergy efficiencies per end-use in Residential/Commercial (1900–2014).
Energies 12 00534 g008
Figure 9. Final-useful exergy efficiencies in Transport (1900–2014).
Energies 12 00534 g009
Figure 10. Portugal’s electricity aggregate final-useful exergy efficiency per sector 1900–2014.
Energies 12 00534 g010
Figure 11. Portugal’s electricity aggregate final-useful exergy efficiency 1900–2014. Grey line: results obtained in this study; black line: results obtained in Serrenho et al. [14].
Energies 12 00534 g011
Figure 12. Primary-final exergy efficiencies of electricity using RCM, PCM and PSM 1900–2014.
Energies 12 00534 g012
Figure 13. Primary-useful exergy efficiencies of electricity using RCM, PCM and PSM 1900–2014.
Energies 12 00534 g013
Figure 14. Electricity production GHG emissions (Mton CO2eq).
Energies 12 00534 g014
Figure 15. Aggregate Carbon Intensity of final electricity (ACIEP) in black and Aggregate Carbon Intensity of useful electricity (ACIEU) in grey 1900–2014.
Energies 12 00534 g015
Figure 16. Aggregate Carbon Intensity of final electricity (ACIEP) in black and Aggregate Carbon Intensity of useful electricity (ACIEU) in grey 1940–2014.
Energies 12 00534 g016
Table 1. Calculation process of electricity (final energy) to primary and useful exergy.
A—Final-PrimaryB—Final-Useful
1—Apply primary-final energy efficiencies to final electricity to obtain primary energy1—Convert final electricity into exergy
2—Convert primary energy into exergy2—Allocate final exergy consumption per sector to the different end-uses (e.g., mechanical work, high temperature heat, among others)
3—Apply final-useful exergy efficiencies to obtain useful exergy
4—Sum the disaggregate results per sector to obtain totals
Table 2. Exergy conversion factors per energy carrier [31,32,33,34].
Energy CarriersExergy Factors
Coal and Coal products1.06
Oil and Oil products1.06
Natural gas1.04
Combustible Renewables1.11
Electricity1
CHP heat0.6
Other non-conventional1
Table 3. Electricity consumption per wired consumer (residential/commercial), ownership and unit consumption of selected appliances 1935–1970.
YearElectricity Consumption Per Wired Consumer (kWh)aOwnership Per Wired Consumer (%)
RadioTVIronWashing MachineRefrigerators
193514915% 11%
194015728% 20%
195031040% 40% 2%
196042695%5%50%1%8%
197065399%32%75%2%43%
Unit consumption per appliance (kWh)1115083450275
Source: Electricity consumption: DGSE; ownership per wired consumer calculated from Mitchell [38] for radio and TV and INE, Comércio Externo for the remaining appliances. Unit consumption per appliance: Radio: based on estimates of three-hour daily usage of a 10 W Philips radio, all others from DGE/GEBEI were estimated based on 1977 electrical appliances’ stock proxies, calculated from national industrial statistics and external trade statistics, and assuming specific consumptions in line with other countries’ estimations—not specified in the DGE/GEBEI study [36]. Note: a excludes public lighting.
Table 4. Residential consumption per use in 1977, 1989 and 2010 in GWh/year (Data from 1977: [36], 1989, 2010: [28,35]).
Use197719892010
Lighting4704951294
Kitchen100824303867
Heating230309865
Water heating180746228
Other electrical uses6309593136
Cooling (air) 152
Total251849399542
Table 5. Electricity shares allocation in the Residential/Commercial sector.
Sources AllocationEquivalent End-Use Categories
%Kitchen uses + 100% water/space heatingHeat
LightingLight
% Kitchen usesMechanical drive (a % was allocated to cooling)
Electrical equipment (miscellaneous)Part allocated to electronics;
the rest divided 60% heat and 40% mechanical drive
Table 6. Exergy efficiency (ε) equations for electricity per end-uses. Adapted from Serrenho [34] based on [50]. Symbols: η is energy efficiency; COP is coefficient of performance; W is work; Q is heat; T0 is the environment temperature; T2 < T0 < T1.
SourceElectricity
End-Use W i n
Work W o u t ε =   η =   W o u t W i n
Heat Q1 added to warm reservoir at T1 Q 1 ( 1 T 0 T 1 ) ε =   Q 1 W i n ( 1 T 0 T 1 ) = C O P   ( 1 T 0 T 1 )
Heat Q2 extracted from cool reservoir at T2 Q 2 ( T 0 T 2 1 ) ε =   Q 2 W i n ( T 0 T 2 1 ) = C O P   ( T 0 T 2 1 )
Light, Electronics and Electrolytic processes ε =   η η i d e a l

