1. Introduction
Biogas produced by anaerobic digestion of biowaste and manure can be used to generate heat and electricity, or it can be upgraded to biomethane and be used as a fuel for transport or fed into a natural gas grid. While the energy sector is becoming more and more renewable, the share of renewable fuels used for transport is increasing at a slower pace. Several studies have assessed the environmental impacts from different utilization pathways for biogas [
1,
2,
3,
4]. Many of those studies conclude that biogas used as a fuel for transport is a promising solution when it comes to the reduction of greenhouse gas emissions.
The circular economy package adopted by the European Union introduces ambitious goals of increasing the amount of material sent to recycling [
5]. This will result in an increased access to separated biowaste, which in turn can lead to a growth in the number of anaerobic digestion plants in Europe, and in the volume of biogas produced. Finding useful and profitable applications of the biogas will be important to obtain an environmental benefit from the biowaste sent to recycling.
According to the Renewable Energy Directive, 10% of fuels for transport shall be renewable by 2020 in the EU [
6]. The European Commission has published a proposal in which half of the 10% biofuels targets should be met by second-generation biofuels [
7]. Upgraded biogas used as a transport fuel is most commonly applied in buses, typically for public transportation [
8]. The demand for renewable fuels are increasing, but there seems to be a lack of knowledge about biogas in general and the environmental impacts from biogas as a fuel compared with alternatives on the market [
9].
There are several studies comparing alternative fuels for transport, e.g., see references [
10,
11,
12,
13], but few of them included biogas as an alternative fuel. Kliucininkas et al. (2012) performed a comparative analyses of urban bus and trolleybus fuel chains in the city of Kaunas, Lithuania, and concluded that biogas-powered buses and electric trolleybuses was considered as the best alternatives per 1 km of travel [
13]. The study did not include biodiesel. A European study performing well to wheel analysis of a large variety of fuel options conclude that producing biogas, particularly from waste materials result in very low emissions of greenhouse gases [
14]. The European study only focused on climate change, and did not address other environmental challenges, such as acidification, eutrophication, or photochemical oxidant formation. In this study, the environmental performance of biogas as a fuel for transport in a life cycle perspective is assessed and compared with other existing nonrenewable and renewable alternatives on the market, such as diesel, biodiesel (hydrotreated vegetable oil (HVO) and fatty acid methyl esters (FAME)), and electricity. The assessment is performed for Euro 6 buses, and the intention is to reveal the positive and negative environmental aspects of using biogas as a fuel compared with current alternatives. The geographical scope of the study is Norway, but the results are likely to be representative for other European countries.
2. Materials and Methods
Life cycle assessment (LCA) methodology was applied to calculate the environmental impact from the transport fuel options for bus transport. The LCA methodology is standardized through the ISO system [
15], and includes an evaluation of the relevant environmental aspects for each part of the value chain, from extraction of material, transport, production, use, and end of life treatment. The LCA software SimaPro version 8.5.2 (PRé, Amersfoort, The Netherlands) was applied to perform the assessments [
16].
2.1. Scenarios
The assessment was done for EURO 6 buses, and the study was limited to the fuel types currently available on the market. The environmental impacts were calculated per km of transport. The following fuel alternatives were assessed:
Upgraded biogas (biomethane) from food waste
Upgraded biogas (biomethane) from manure
Natural gas
Electrical vehicle (electricity from hydropower)
Electrical vehicle (electricity from coal)
Biodiesel (HVO) based on waste cooking oil.
Biodiesel (FAME), based on rapeseed oil
Biodiesel (FAME) based on palm oil
Diesel (fossil)
The assumed fuel consumption for each alternative and the technical properties of the fuels are shown in
Table 1 and
Table 2.
The distance driven throughout the service life of one bus was assumed to be 390,000 km, which was estimated by multiplying the average amount of kilometers driven annually for buses in Norway [
20], with an assumed service life of 10 years.
2.2. System Boundaries and Life Cycle Phases
The life cycle of transport was divided into four life cycle phases: (1) Production of the fuel, (2) distribution of the fuel, (3) production and maintenance of vehicle, and (4) driving. Road and tire wear were assumed to be relatively equal for all alternatives and is thus not included in the study.
All assumptions and life cycle inventory for each of the fuel alternatives are described in
Appendix A. The main assumptions for the biogas alternatives are summarized below.
For biogas from food waste, the collection and transport of the waste is allocated to the previous life cycle (the food) and is considered outside the system boundaries in the base scenario. For biogas from manure, it is assumed that the manure is transported, on average, by 20 km with a EURO 6 diesel lorry 16–32 tonnes from the farm to the plant. The avoided emissions from shorter storage time is not included in the base scenario, but is assessed in the sensitivity assessment in
Section 4. Infrastructure and energy use for anaerobic digestion and upgrading of the gas to fuel quality and the waste handling of reject is based on the ecoinvent database. According to Liebetrau et al. (2017), it is very difficult to give general, average numbers for methane emissions from components or complete biogas plants [
21]. They found a large variability regarding the amount of emissions from biogas plants. In this study, a 1% leakage of methane at the anaerobic digestion plant was assumed and 1.5% methane slip from the upgrading process.
2.3. Life Cycle Impact Assessment
In the life cycle impact assessment phase of an LCA, the inventory data is converted into the potential impact on various environmental problems. The environmental impact categories presented in this paper are the ones commonly included in environmental product declarations (EPDs): Potential impact on global warming, stratospheric ozone depletion, photochemical oxidant formation, acidification potential, and eutrophication potential. The impact assessment method used was CMLIAb v3.05 [
22], except for global warming potential, where factors from IPCC (2013) were used [
23]. The characterization factor for fossil CO
2 is defined as 1 kg CO
2 equivalents/kg, while fossil methane is defined as 30.5. Emissions of biogenic carbon (carbon from renewable and not fossil sources) were given the characterization factor zero, because they do not contribute to increasing the amount of carbon in the atmosphere. Similarly, the emissions of biogenic methane were adjusted for the biogenic carbon content and were given a factor of 27.75 kg CO
2 equivalents/kg.
2.4. Sensitivity Assessment
The results in LCA can be highly dependent on the underlying assumptions. A sensitivity assessment tested how results changed when assumptions with a predicted important effect were varied.
Anaerobic digestion result in two co products: Biogas and digestate. In the base scenario, upgraded biogas was assumed to be a single product. None of the impacts from anaerobic digestion were allocated to the digestate product. If, however, the digestate is distributed to farmers that use it instead of mineral fertilizer, the joint production processes of biogas and digestate may be allocated between the two co-products. In the scenario FW allocation, the impacts of the anaerobic digestion process are allocated based on dry matter content (62% for biogas and 38% for digestate).
An alternative method to allocation for handling co products in LCA methodology is system expansion. In system expansion the avoided environmental burdens of substituting another product on the market is subtracted. Two different means of system expansion was applied: Substitution of mineral fertilizer due to the use of digestate as a biofertilizer and carbon storage effect (FW system expansion digestate) and the substitution of incineration of food waste with anaerobic digestion and biogas production (FW system expansion waste). The system expansion scenarios were calculated in the BioValueChain-model [
2].
In the base scenario presented in the main results, the transport of food waste was not included because it was considered as part of the life cycle of the food that became food waste. The sensitivity assessment includes a scenario where the collection and transportation of the waste to the anaerobic digestion plant is allocated to the biogas fuel. A transport distance of 19 km for waste collection vehicle and further transport of 28 km was assumed [
2]. This scenario was named
FW transport scenario.
Measurements have revealed that some biogas plants have a considerable leakage of methane [
21]. In the base scenario, the methane leakage from the anaerobic digestion process was assumed to be 1%. In the methane leakage scenario, the assumed leakage was increased from 1% of the produced amount to 4%.
For biogas from manure, two sensitivity assessment scenarios were assessed: Manure transport scenario where the transport distance was increased to 50 km, and Manure shortened storage time, where the avoided emissions of methane due to shortened storage time was included.
3. Results: Environmental Impacts for Fuel Alternatives
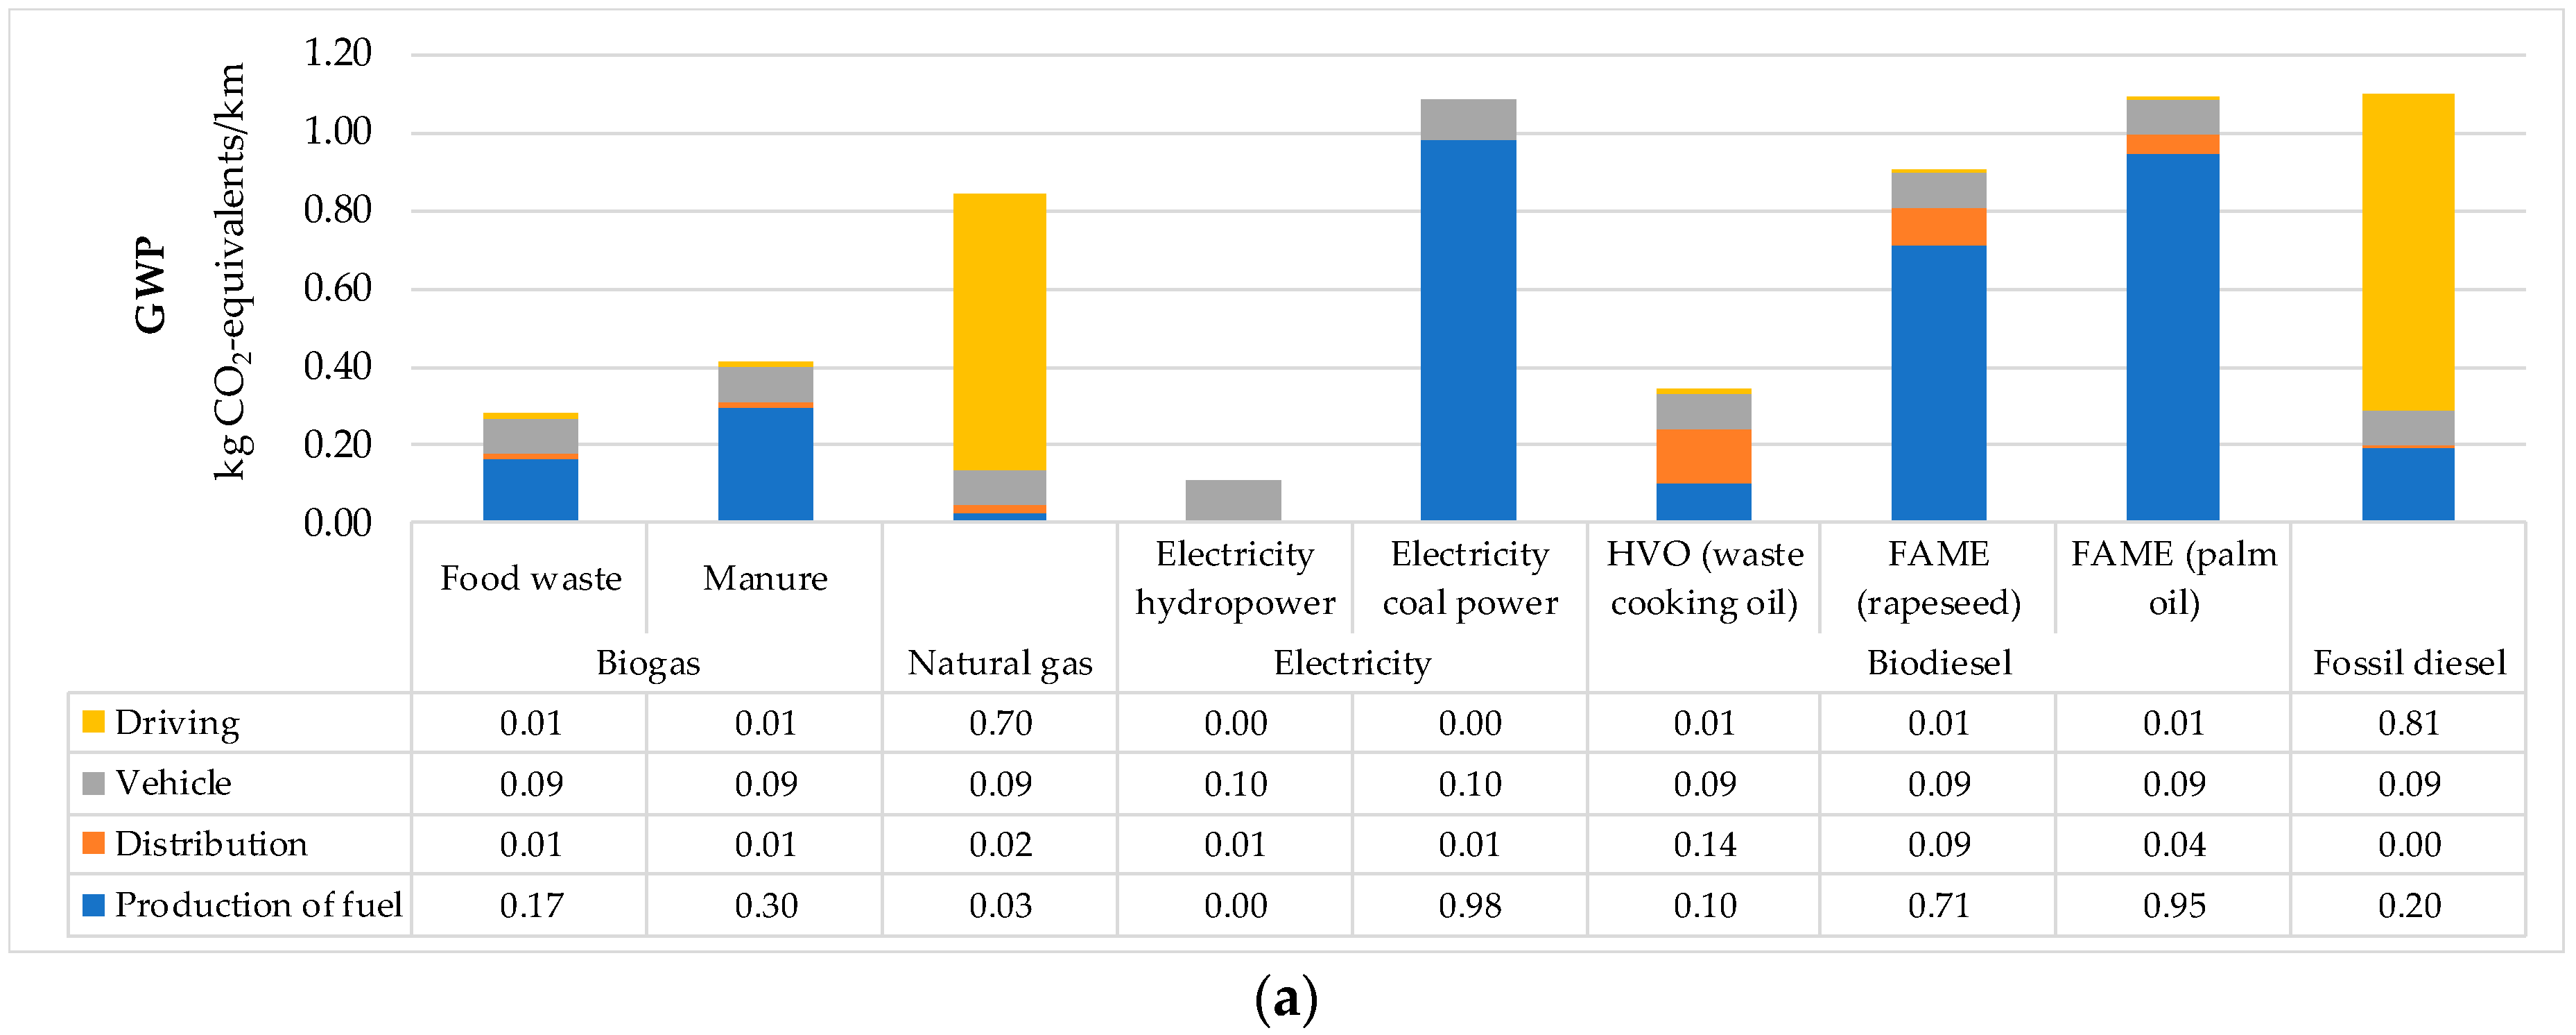
The results from the life cycle assessment are shown in
Figure 1. Regarding potential impact on global warming (
Figure 1a), the results show that the total emissions per km bus transport are the largest for the fossil fuel alternatives (diesel, electricity from coal, and natural gas) and for palm oil-based biodiesel. The high impacts from production of palm oil-based biodiesel are mostly due to land use change. For diesel and natural gas, the largest emissions occur during driving. For the renewable fuel alternatives, the largest impacts are from production of the fuel, except from bus transport on electricity from hydropower where production of the vehicle including the drive train is the life cycle stage with the highest contribution. The bus transport with the lowest emissions are bus transport performed with electricity from hydropower, HVO produced from waste cooking oil and biogas.
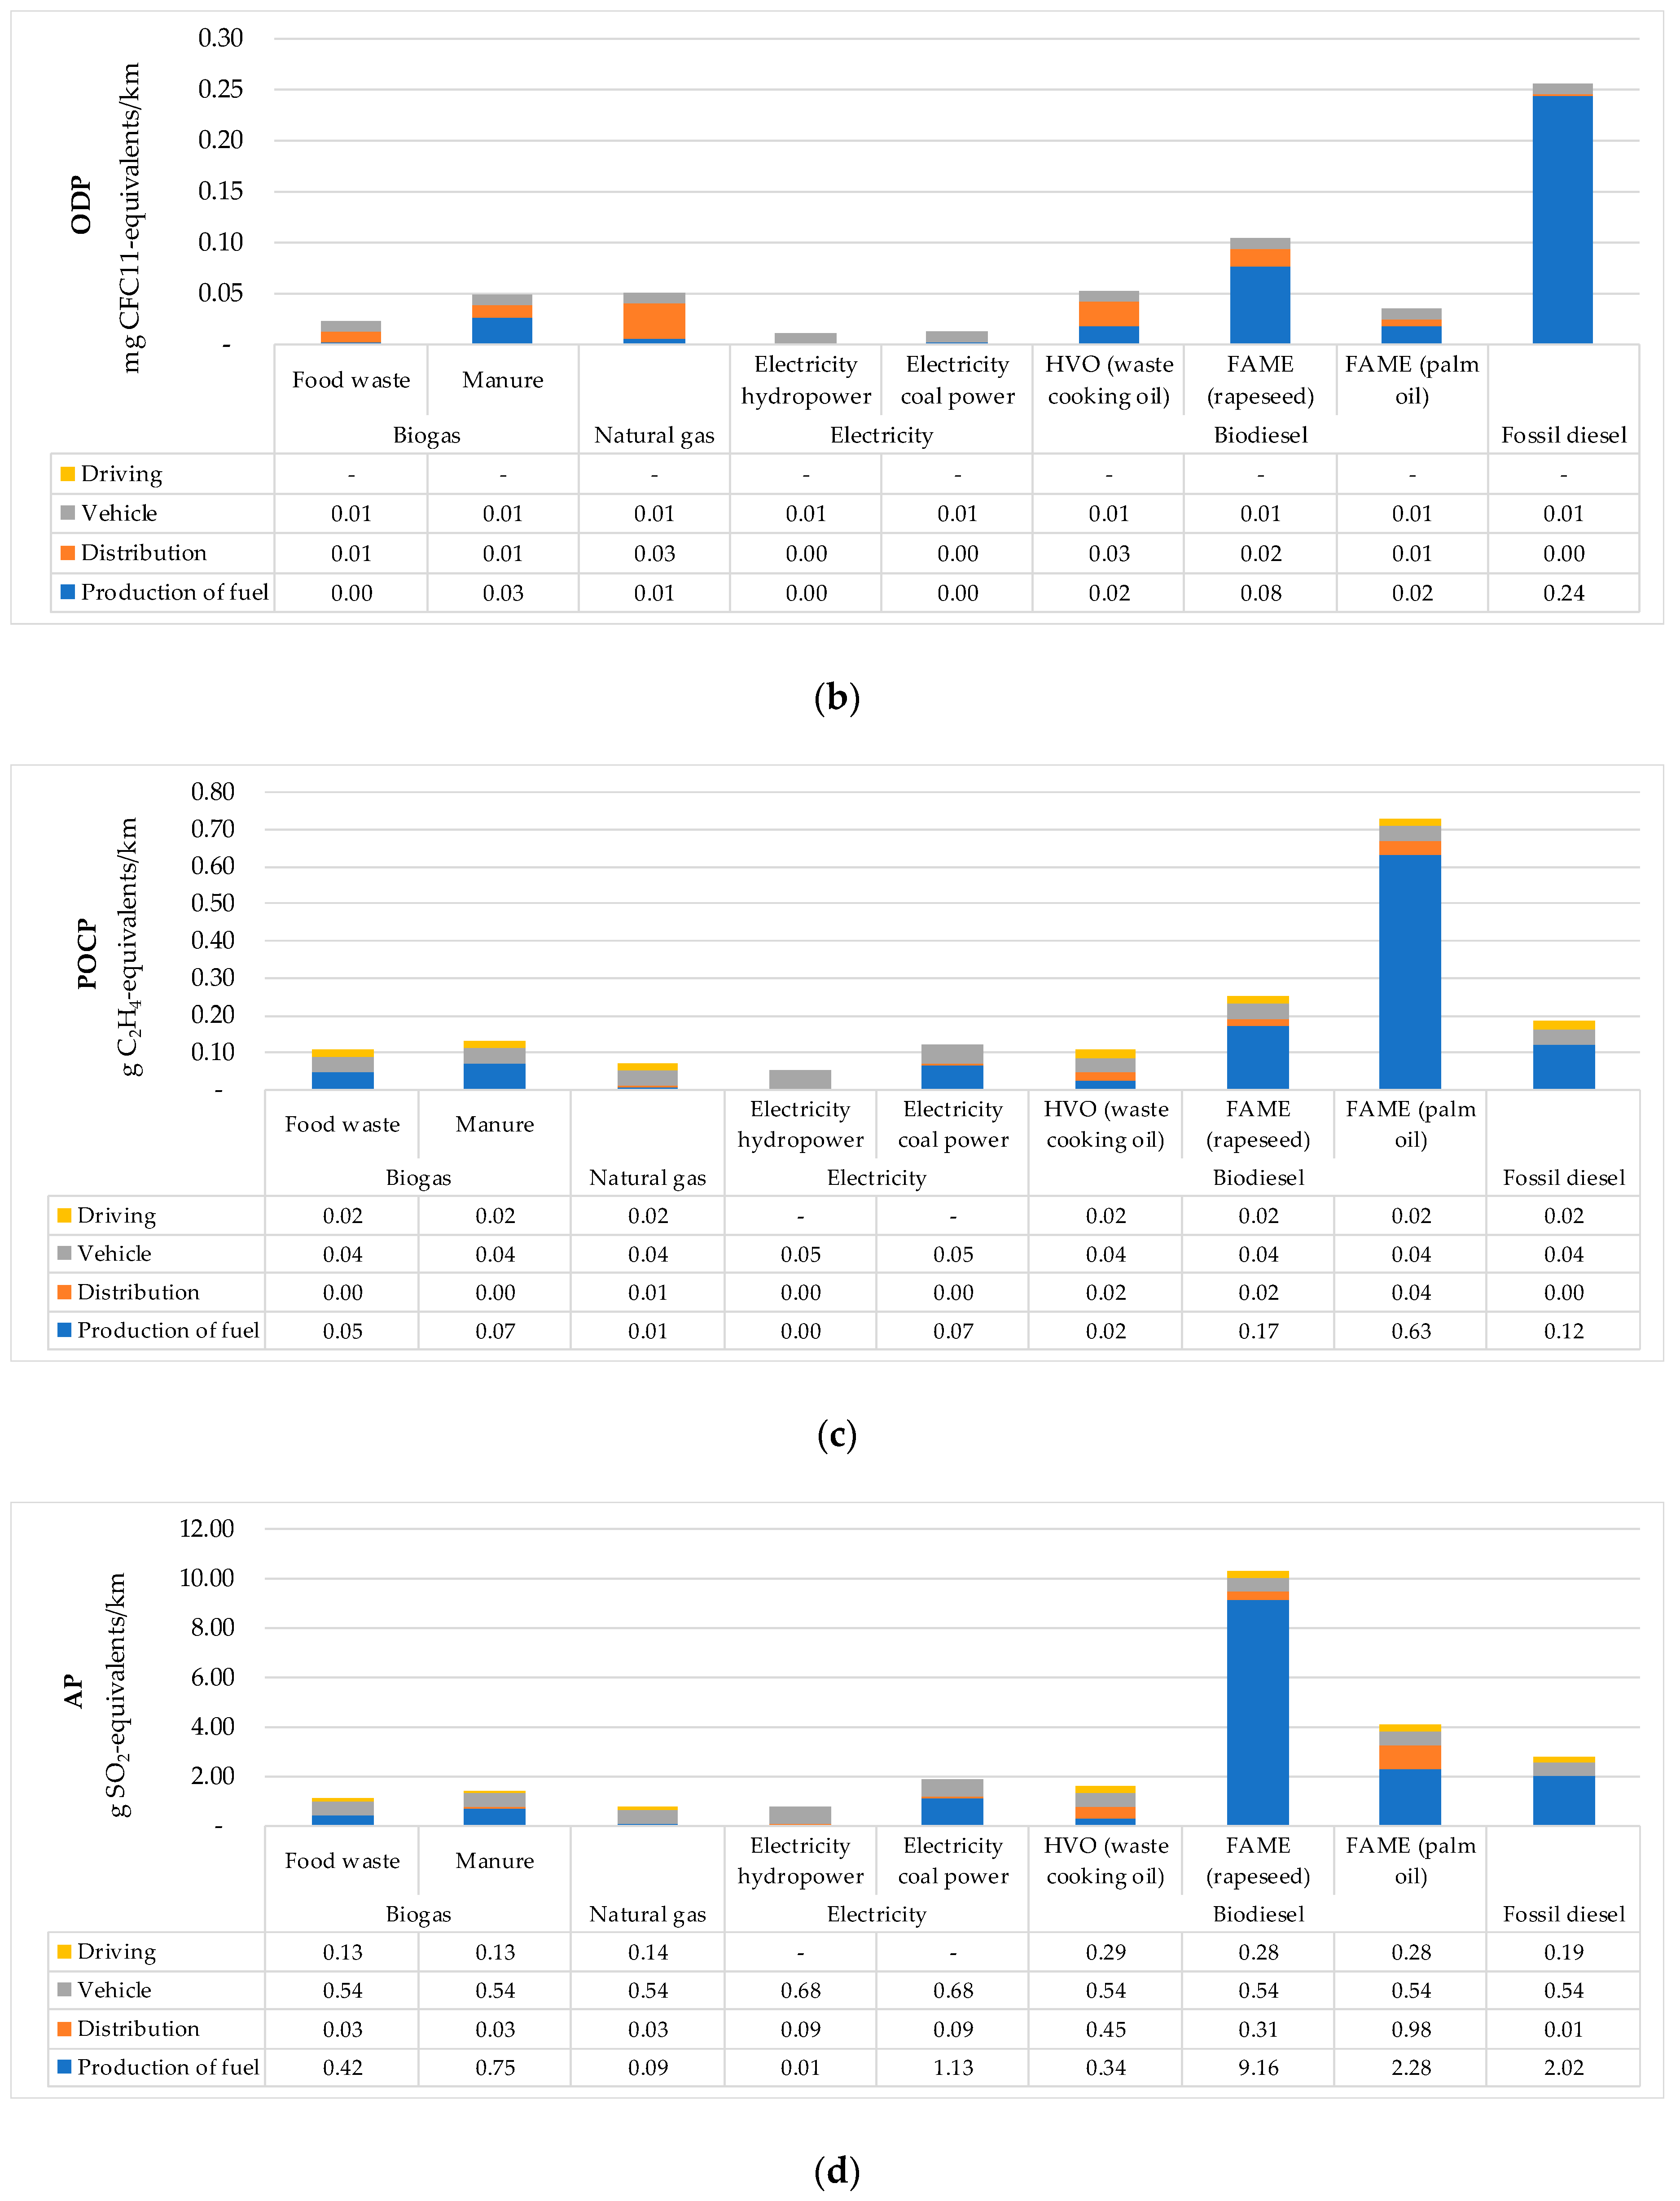
Fossil diesel has by far the largest impact of all the transport alternatives connected to potential impact on stratospheric ozone depletion (
Figure 1b). This is mostly due to emissions from the petroleum production. The fuels with the lowest impact in this category are the electricity alternatives and the fuels from waste (biogas from food waste and HVO from waste cooking oil).
In the category photochemical oxidant formation (POCP), the fuel alternative with the largest impact per km transport is palm oil-based biodiesel (
Figure 1c), due to the palm oil mill operation. FAME from rapeseed and diesel also has a relatively high impact from the production of the fuel.
The results for the environmental impact category acidification potential (
Figure 1d) show that FAME from rapeseed has the largest impact due to emissions from rapeseed production. Palm oil-based biodiesel and fossil diesel also have a relatively high impact compared with the alternatives, while the electricity alternatives have the lowest impact. Similarly, for potential impact on eutrophication, FAME based on rapeseed and on palm oil are the least beneficial options.
The results for electrical vehicle bus transport are largely dependent on the energy carrier of the electricity used for driving, as the assumptions regarding electricity mix has a large impact on the results. The two alternative energy carriers assessed in this study (hydropower and coal power) represent two extremes (best and worst case). In reality, the bus will consume a mix of different energy carriers, and the actual impact from bus transport will be somewhere between the two alternatives. As the share of renewable energy increases, each kilowatt hour of electricity will have a decreased impact on global warming. For all the transport alternatives, the impact from the vehicle itself has a relatively low contribution, even for the electrical vehicles with batteries.
The results show that upgraded biogas (biomethane) from food waste and manure has a relatively low impact in all the assessed environmental impact categories compared with the alternatives. Biogas from manure has higher environmental impacts than biogas from food waste. This is due to a higher water content per ton and a lower biogas potential per ton of dry matter, which means that a larger amount of manure must be supplied and treated to produce 1 Nm3 biogas. In addition, transport of the food waste was defined as outside the system boundaries, while the transport of manure was included as part of the fuel production.
The results are largely dependent on the underlying assumptions. The choice of system boundaries, allocation method, and other central assumptions connected to the production of fuel grade biogas are scrutinized as part of the subsequent discussion.
4. Discussion
The results show good environmental performance for biogas relative to other fuel and engine options for bus transport. There is a danger, however, that the results stem from favorable assumptions for the biogas life cycle. Before a more general discussion about the implication of the results, the assumptions for the biogas system are tested through a sensitivity assessment.
4.1. Sensitivity Assessment for the Biogas Alternatives
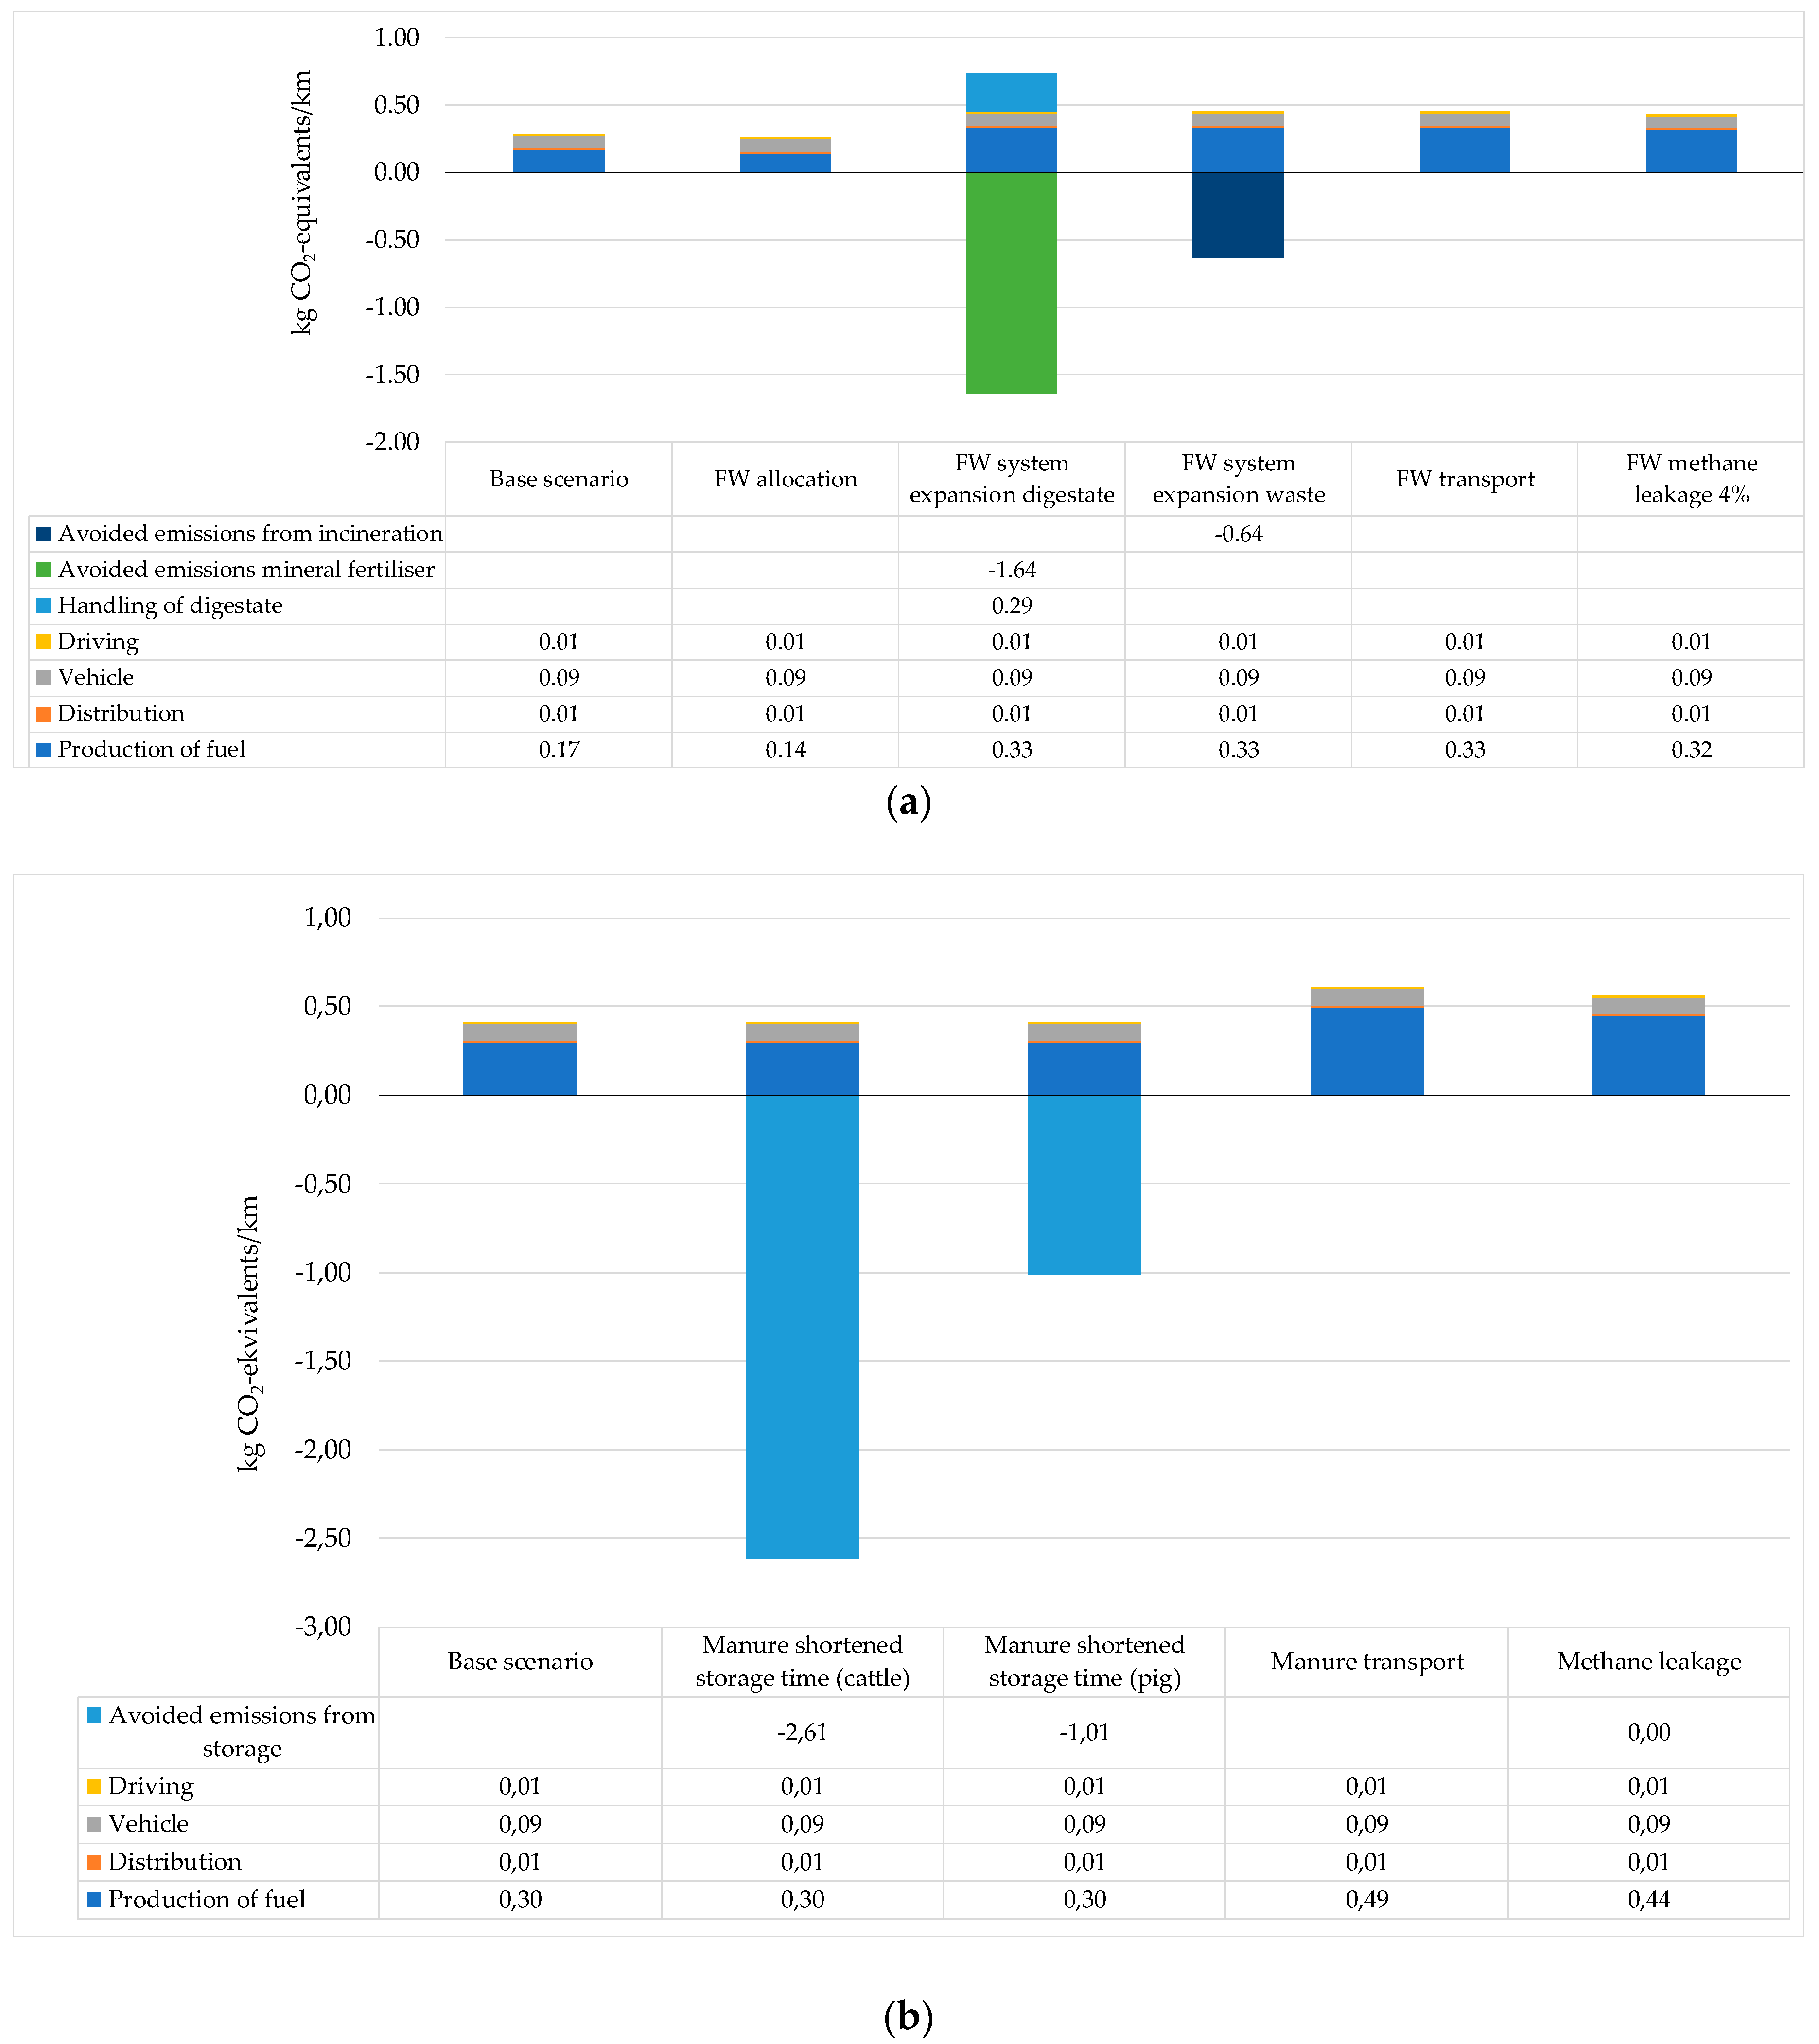
The scenarios assessed are described in
Section 2.4. The results for the potential impact on global warming are shown in
Figure 2.
If the impacts from anaerobic digestion of food waste can be allocated between the biogas and the digestate, the total potential impact on global warming per km is reduced from 0.28 to 0.26 kg CO
2 equivalents. In contrast, if system expansion is used to express the multifunctionality in the calculations, the substitution of mineral fertilizer can lead to net negative emissions of −0.90. These results are highly dependent on the assumptions on what and how much is being substituted. Net negative emissions can also be obtained if considering that food waste will be incinerated if not treated by anaerobic digestion. If assuming incineration with energy recovery where the heat generated substitutes Norwegian district heating mix, as described in Lyng et al. (2015) [
2], this gives net negative emissions of −0.19 kg CO
2 equivalents/km. If both of the two multifunctionalities are considered, the net result is −1.54 kg CO
2 equivalents/km.
For the life cycle of upgraded biogas used as a fuel made from manure, avoided emissions from reduced storage time of untreated manure can lead to greenhouse gas emission reductions between 2.6 and 1.0 kg/CO2 equivalents, which result in net negative emissions throughout the value chain of −2.2 and −0.6 CO2 equivalents/km bus transport. This is due to shortened storage time and subsequent emissions of methane when manure is used for anaerobic digestion.
This demonstrates that a system expansion approach allows for documenting the benefits of the multifunctionality of the value chain (waste treatment, production of fuel, and production of fertilizer/soil improvement product) to a larger extent than allocation. System expansion does, however, introduce more assumptions and more uncertainty to the results. The variations in results when applying different system boundaries for biogas production was also documented in a previous study applying the calculation rules of the renewable energy directive for biogas as a fuel [
24]. It is important to maintain a consistency of system boundaries when comparing different options.
The sensitivity assessment also shows that the transport distances for the raw materials used for biogas production is of importance. The results for biogas from food waste utilized as a fuel for bus transport can increase from 0.28 kg to 0.45 kg CO2 equivalents/km if the collection and transportation of the waste is regarded as part of the fuel production. The increase will be dependent on the transport distances, the efficiency of the transport (load factor) and how much biogas the anaerobic digestion plant is able to produce per ton food waste. If the transport distance for manure is increased from 20 km to 50 km, the emissions of greenhouse gases are increased from 0.41 to 0.61 kg CO2 equivalents.
If the methane leakage at the anaerobic digestion plant is increased from 1% to 4%, the potential greenhouse gas emissions per km is 0.43 kg CO2 equivalents for upgraded biogas produced from food waste and 0.56 kg CO2 equivalents for upgraded biogas produced from manure. This shows that it is important to minimize diffuse emissions and to develop plans to monitor potential leakages.
The sensitivity assessment clearly shows that the inclusion of extra burdens does not increase the results for impacts on climate change from biogas for fuel to the extent where the rank relative to other fuels and engine types are changed. Rather, the inclusion of measures of substitution can make biogas outperform other fuel systems for bus transport.
4.2. Uncertainties Exist in All Fuel Life Cycles
Similar sensitivity assessments as for biogas could have been performed for all the different fuel and engine types. This would create a multitude of potential results for all life cycles and make the comparison between different fuel types more difficult. In addition, there are uncertainties in the underlying data for all data sets. Often these uncertainties are well communicated for the fuel life cycle under scrutiny but underplayed for all other life cycles. There are reasons to believe that the data quality is good for emissions contributing to global warming, but poorer for other emissions. The effect of missing inventory data is difficult to quantify and the LCA practitioner is dependent on what other researchers have captured in their studies. The collection of specific data from more plants will reduce the uncertainty of the results, for instance by developing environmental product declarations.
This study has demonstrated that when applying a life cycle assessment approach, there are no zero emission vehicles. As the emissions in the different fuel alternatives occur in different life cycle stages, a life cycle perspective is useful when it comes to evaluating the environmental impacts from different fuels. The results show that the ranking of the fuel alternatives differ between the environmental impact categories, which illustrates that assessing more than global warming potential is important, to avoid unintentionally creating other environmental problems in the attempt to reduce the emission of greenhouse gases. In several cities across the globe, the use of fossil fuel engines is restricted on particular days where local air pollution is too severe. One must therefore keep attention to other impact categories and also where in the life cycle the impacts occur. For instance, the relatively large impact of potentially photochemical ozone creating emissions in palm oil production might be a problem if people live nearby, but negligible otherwise.
The dissemination of LCA data and results in fuels and engine technologies is important even if they contain large uncertainties and great dependency on assumptions. Through the public review of data and more studies quality is enhanced, and missing emissions identified.
5. Conclusions
The results from this study shows that when applying life cycle assessment to evaluate the environmental impacts from biogas as a fuel for transport, the results are largely dependent on the underlying assumptions. For the base scenarios defined in this study, biogas appears to be one of the fuels on the market with the lowest environmental impacts. Aspect that have considerable impact on the results for biogas used as a fuel, is system boundaries, transport distances and methane leakages.
Author Contributions
A.B. performed the initial analyses of this work and defined the basis scenarios, the functional unit and the life cycle stages. K.-A.L. finalized the analyses, performed the sensitivity assessments and has written the paper, with input from A.B.
Funding
This paper was written as part of the Bærekraftig Biogass project, funded by the EnergiX programme of the Norwegian Research Council.
Conflicts of Interest
The authors declare no conflict of interest.
Appendix A
The underlying assumptions and the sources and EcoInvent processes used for each of the fuel types are described in the tables below: bus transport with biogas as a fuel in
Table A1 and
Table A2, natural gas in
Table A3, electric bus in
Table A4 and
Table A5, biodiesel in
Table A6,
Table A7 and
Table A8, and fossil diesel in
Table A9. For all background data, the EcoInvent database version 3.4, cut off by classification, as implemented in SimaPro 8.5.2 [
16].
Table A1.
Biogas from food waste.
Table A1.
Biogas from food waste.
| Life Cycle Stage | Assumptions/Process Used |
|---|
| Production of fuel | Collection and transport of the waste is allocated to the previous life cycle (the food) and is considered outside the system boundaries in the base scenario. Infrastructure and energy use, and waste handling of reject is derived from the EcoInvent process Treatment of biowaste by anaerobic digestion where the electricity mix is changed to Norwegian. Energy use from upgrading of the biogas is derived from the EcoInvent process Biogas purification to methane 96-vol%. A leakage of biogenic methane of 1% of the produced biogas at the anaerobic digestion plant and 1.5% slip of biogenic methane from the upgrading process is included. |
| Distribution of fuel | Distribution derived from the EcoInvent process Natural gas, high pressure (NO), market for natural gas, high pressure, where all emissions from production of the diesel is removed so that only the distribution remains. In addition, a vehicle transport of the gas of 70 km is included. |
| Vehicle | EcoInvent process: Bus (GLO), market for. |
| Emissions from driving | Derived from EcoInvent processes |
Table A2.
Biogas from food livestock manure.
Table A2.
Biogas from food livestock manure.
| Life Cycle Stage | Assumptions/Process Used |
|---|
| Production of fuel | In the base scenario emissions from storage (and reduced emissions from shortened storage time) were not included. This is assessed separately in the sensitivity assessment.
Infrastructure and energy use from anaerobic digestion is based on the EcoInvent process Biogas CH Anaerobic digestion of manure, where the electricity mix are changed to Norwegian.
Energy use from upgrading of the biogas is derived from the EcoInvent process Biogas purification to methane 96-vol%.
A leakage of biogenic methane of 1% of the produced biogas at the anaerobic digestion plant and 1.5% slip of biogenic methane from the upgrading process is included. |
| Distribution of fuel | Distribution derived from the EcoInvent process Natural gas, high pressure (NO), market for natural gas, high pressure, where all emissions from production of the diesel is removed so that only the distribution remains. In addition, a vehicle transport of the gas of 70 km is included. |
| Vehicle | EcoInvent process: Bus (GLO), market for. |
| Direct emissions from driving | Derived from EcoInvent processes |
Table A3.
Natural gas.
| Life Cycle Stage | Assumptions/Process Used |
|---|
| Production of fuel | EcoInvent process: Natural gas, high pressure (NO), market for natural gas, high pressure |
| Distribution of fuel | Distribution derived from the EcoInvent process Natural gas, high pressure (NO), market for natural gas, high pressure, where all emissions from production of the diesel is removed so that only the distribution remains. |
| Vehicle | EcoInvent process: Bus (GLO), market for. |
| Direct emissions from driving | Derived from EcoInvent processes |
Table A4.
Electricity hydropower.
Table A4.
Electricity hydropower.
| Life Cycle Stage | Assumptions/Process Used |
|---|
| Production of fuel | Aggregated data from 11 hydroelectricity stations in Norway. |
| Distribution of fuel | Infrastructure and transmission losses from high voltage to low voltage are included based to electricity processes in EcoInvent. |
| Vehicle | EcoInvent process: Bus (GLO), market for, and a 500 kg battery: Battery, Li-On, Rechargeable, Prismatic [Glo], Production. |
| Direct emissions from driving | No emissions from driving |
Table A5.
Electricity coal power.
Table A5.
Electricity coal power.
| Life Cycle Stage | Assumptions/Process Used |
|---|
| Production of fuel | Based on the EcoInvent process Electricity, high voltage, DE, electricity production, hard coal. |
| Distribution of fuel | Infrastructure and transmission losses from high voltage to low voltage are included based to electricity processes in EcoInvent. |
| Vehicle | EcoInvent process: Bus (GLO), market for, and a 500 kg battery: Battery, Li-On, Rechargeable, Prismatic [Glo], Production. |
| Direct emissions from driving | No emissions from driving |
Table A6.
Biodiesel HVO.
| Life Cycle Stage | Assumptions/Process Used |
|---|
| Production of fuel | Based on the EcoInvent process Treatment of waste cooking oil, purified, esterification FR |
| Distribution of fuel | Transport of the fuel from France to Norway. |
| Vehicle | EcoInvent process: Bus (GLO), market for. |
| Direct emissions from driving | Derived from EcoInvent processes |
Table A7.
Biodiesel FAME.
Table A7.
Biodiesel FAME.
| Life Cycle Stage | Assumptions/Process Used |
|---|
| Production of fuel | Based on the EcoInvent process Esterification of rape oil Europe without Switzerland. |
| Distribution of fuel | Transport of the fuel from Germany to Norway. |
| Vehicle | EcoInvent process: Bus (GLO), market for. |
| Direct emissions from driving | Derived from EcoInvent processes |
Table A8.
Biodiesel palm oil.
Table A8.
Biodiesel palm oil.
| Life Cycle Stage | Assumptions/Process Used |
|---|
| Production of fuel | Based on the EcoInvent process Esterification of palm oil MY |
| Distribution of fuel | Transport of the fuel from Thailand to Norway. |
| Vehicle | EcoInvent process: Bus (GLO), market for. |
| Direct emissions from driving | Derived from EcoInvent processes |
Table A9.
Fossil diesel.
| Life Cycle Stage | Assumptions/Process Used |
|---|
| Production of fuel | Based on the EcoInvent process petroleum refinery operation Europe without Switzerland. |
| Distribution of fuel | Derived from the EcoInvent process Diesel, low sulphur, market for, where all emissions from production of the diesel is removed so that only the distribution remains. |
| Vehicle | EcoInvent process: Bus (GLO), market for. |
| Direct emissions from driving | Derived from EcoInvent processes |
References
- Patrizio, P.; Leduc, S.; Chinese, D.; Dotzauer, E.; Kraxner, F. Biomethane as transport fuel—A comparison with other biogas utilization pathways in northern Italy. Appl. Energy 2015, 157, 25–34. [Google Scholar] [CrossRef]
- Lyng, K.-A.; Modahl, I.S.; Møller, H.; Morken, J.; Briseid, T.; Hanssen, O.J. The BioValueChain model. A Norwegian model for calculating environmental impacts of biogas value chains. Int. J. Life Cycle Assess 2015, 20, 490–502. [Google Scholar] [CrossRef]
- Börjesson, P.; Berglund, M. Environmental systems analysis of biogas systems—Part II: The environmental impact of replacing various reference systems. Biomass Bioenergy 2007, 31, 326–344. [Google Scholar] [CrossRef]
- Poeschl, M.; Ward, S.; Owende, P. Environmental impacts of biogas deployment—Part II: Life cycle assessment of multiple production and utilization pathways. J. Clean. Prod. 2012, 24, 184–201. [Google Scholar] [CrossRef]
- European Commission Circular Economy Strategy. Closing the Loop—An EU Action Plan for the Circular Economy. 2015. Available online: http://ec.europa.eu/environment/circular-economy/index_en.htm (accessed on 13 December 2018).
- EUR-Lex—32009L0028—EN—EUR-Lex. Available online: https://eur-lex.europa.eu/legal-content/EN/ALL/?uri=CELEX%3A32009L0028 (accessed on 25 January 2019).
- Psomopoulos, C.S.; Chatziaras, N.; Ioannidis, G.C.; Karaisas, P. The role of the new commission’s proposal to minimize the climate impacts of biofuel production in energy and transport sectors. Fresenius Environ. Bull. 2014, 23, 2687–2694. [Google Scholar]
- IEA Bioenergy. IEA Bioenergy Task 37, Country Report, Summaries 2017; IEA Bioenergy: Dublin, Ireland, 2018. [Google Scholar]
- Sund, K.; Utgård, B.; Christensen, N.S. Muligheter og Barrierer for Økt Bruk av Biogass til Transport i Norge; Sund Energy: Oslo, Norway, 2017. [Google Scholar]
- Nanaki, E.A.; Koroneos, C.J. Comparative LCA of the use of biodiesel, diesel and gasoline for transportation. J. Clean. Prod. 2012, 20, 14–19. [Google Scholar] [CrossRef]
- Ally, J.; Pryor, T. Life-cycle assessment of diesel, natural gas and hydrogen fuel cell bus transportation systems. J. Power Sources 2007, 170, 401–411. [Google Scholar] [CrossRef]
- McKenzie, E.C.; Durango-Cohen, P.L. Environmental life-cycle assessment of transit buses with alternative fuel technology. Transp. Res. Part Transp. Environ. 2012, 17, 39–47. [Google Scholar] [CrossRef]
- Kliucininkas, L.; Matulevicius, J.; Martuzevicius, D. The life cycle assessment of alternative fuel chains for urban buses and trolleybuses. J. Environ. Manag. 2012, 99, 98–103. [Google Scholar] [CrossRef] [PubMed]
- Edwards, R.; Larive, J.-F.; Rickeard, D.; Weindorf, W. Well-to-Wheel Analysis of Future Automotive Powertrains in the European Context. Well-to Tank. Appendix 4—Version 4a. Description, Results and Input Data per Pathway; JRC Technical Reports; European Union: Luxembourg, 2014. [Google Scholar]
- ISO EN ISO 14044. Environmental Management. Life Cycle Assessment. Requirements and Guidelines; International Organization for Standardization (ISO): Geneva, Switzerland, 2006. [Google Scholar]
- PRé SimaPro Software. The Netherlands, 2018. Available online: https://www.pre-sustainability.com/ (accessed on 15 December 2018).
- Hagman, R. Busser, Euro VI og Avgassutslipp. Status 2016/2017; TØI Rapport 1540/2016; Norwegian Centre for Transport Research: Oslo, Norway, 2016. [Google Scholar]
- Hagman, R.; Astrid, H.A.; Ranta, M.; Nylund, N.-O. Klima- og Miljøvennlig Transport frem Mot 2025. Vurderinger av Mulige Teknologiske Løsninger for Buss; TØI Rapport 1571/2017; Norwegian Centre for Transport Research: Oslo, Norway, 2017. [Google Scholar]
- The Engineering Toolbox Fuels—Higher and Lower Calorific Values. Available online: https://www.engineeringtoolbox.com/fuels-higher-calorific-values-d_169.html (accessed on 17 January 2019).
- Statistics Norway. Road Traffic Volumes in Norway. Table 2 Road Traffic Volumes, by Type of Vehicle. Average per Vehicle. 2018. Available online: https://www.ssb.no/en/transport-og-reiseliv/statistikker/klreg (accessed on 20 December 2018).
- Liebetrau, J.; Reinelt, T.; Agostini, A.; Linke, B. Methane Emissions from Biogas Plants. Methods for Measurement, Results and Effect on Greenhouse Gas Balance of Electricity Produced; Murphy, J.D., Ed.; IEA Bioenergy: Dublin, Ireland, 2017. [Google Scholar]
- Leiden University. CML-IA Characterisation Factors; Leiden University, CML—Department of Industrial Ecology: Leiden, The Netherlands, 2016. [Google Scholar]
- IPCC. Climate Change 2013. The Physical Science Basis. Working Group I contribution to the Fifth Assessment Report of the Intergovernmental Panel on Climate Change (IPCC). 2013. Available online: http://www.climatechange2013.org (accessed on 10 December 2018).
- Manninen, K.; Koskela, S.; Nuppunen, A.; Sorvari, J.; Nevalainen, O.; Siitonen, S. The applicability of the renewable energy directive calculation to assess the sustainability of biogas production. Energy Policy 2013, 56, 549–557. [Google Scholar] [CrossRef]
© 2019 by the authors. Licensee MDPI, Basel, Switzerland. This article is an open access article distributed under the terms and conditions of the Creative Commons Attribution (CC BY) license (http://creativecommons.org/licenses/by/4.0/).


