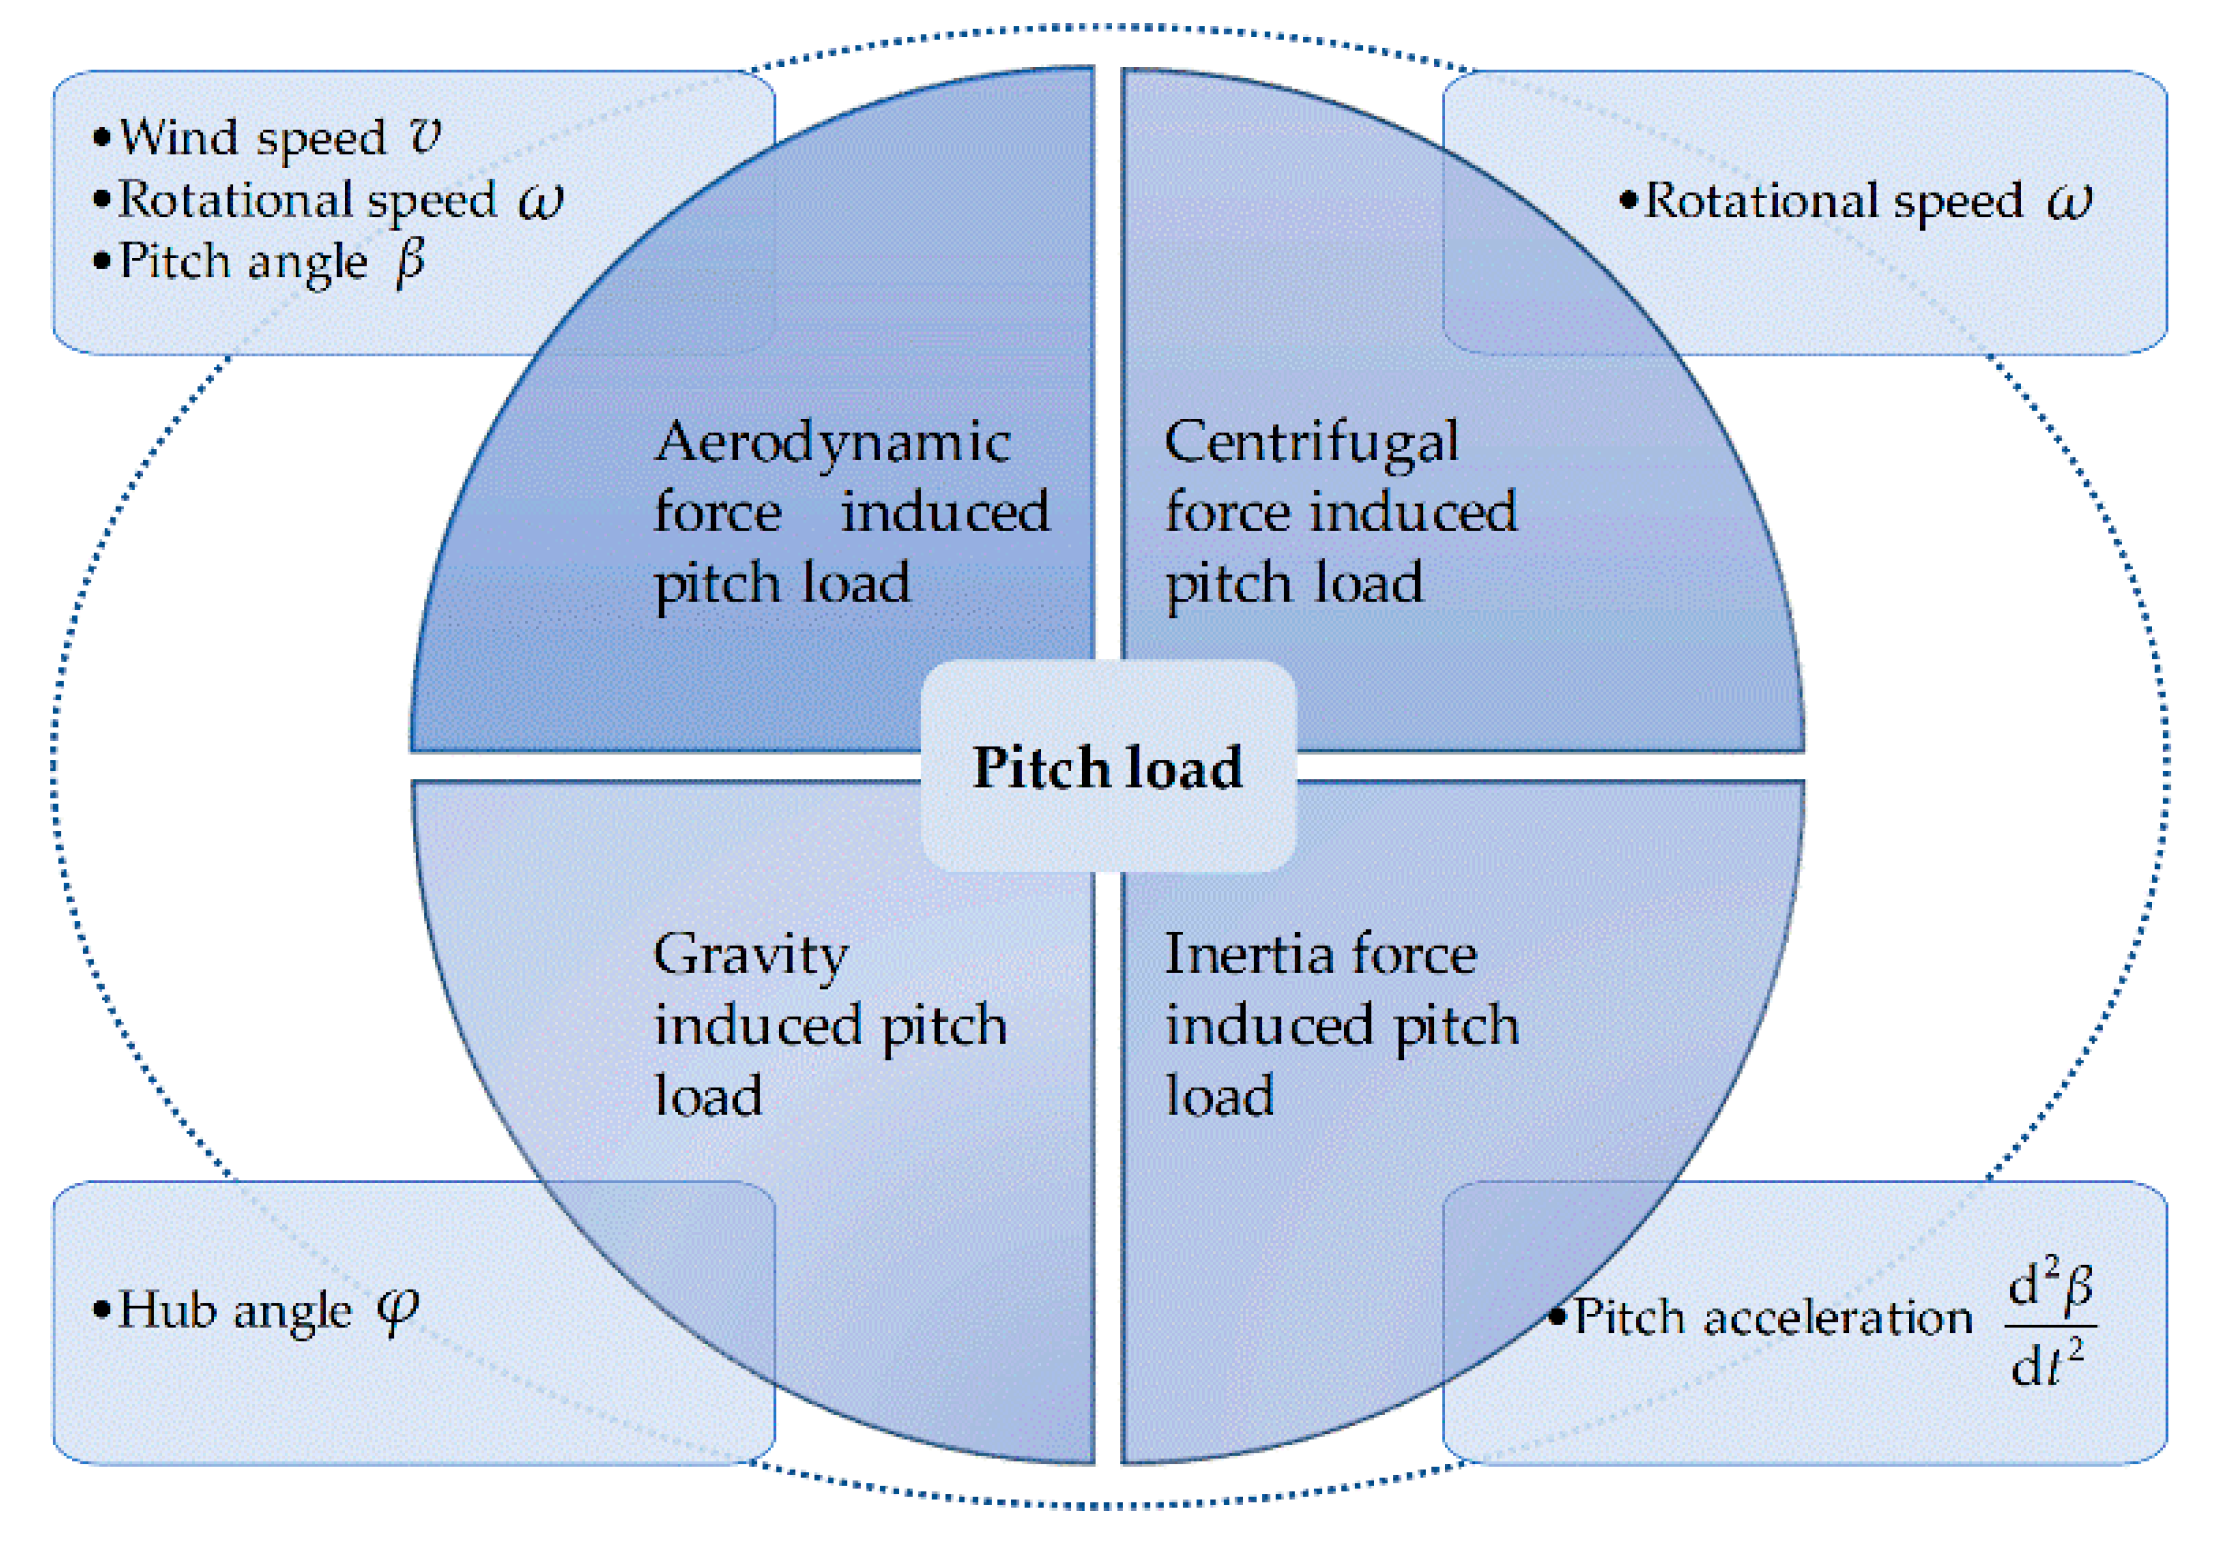
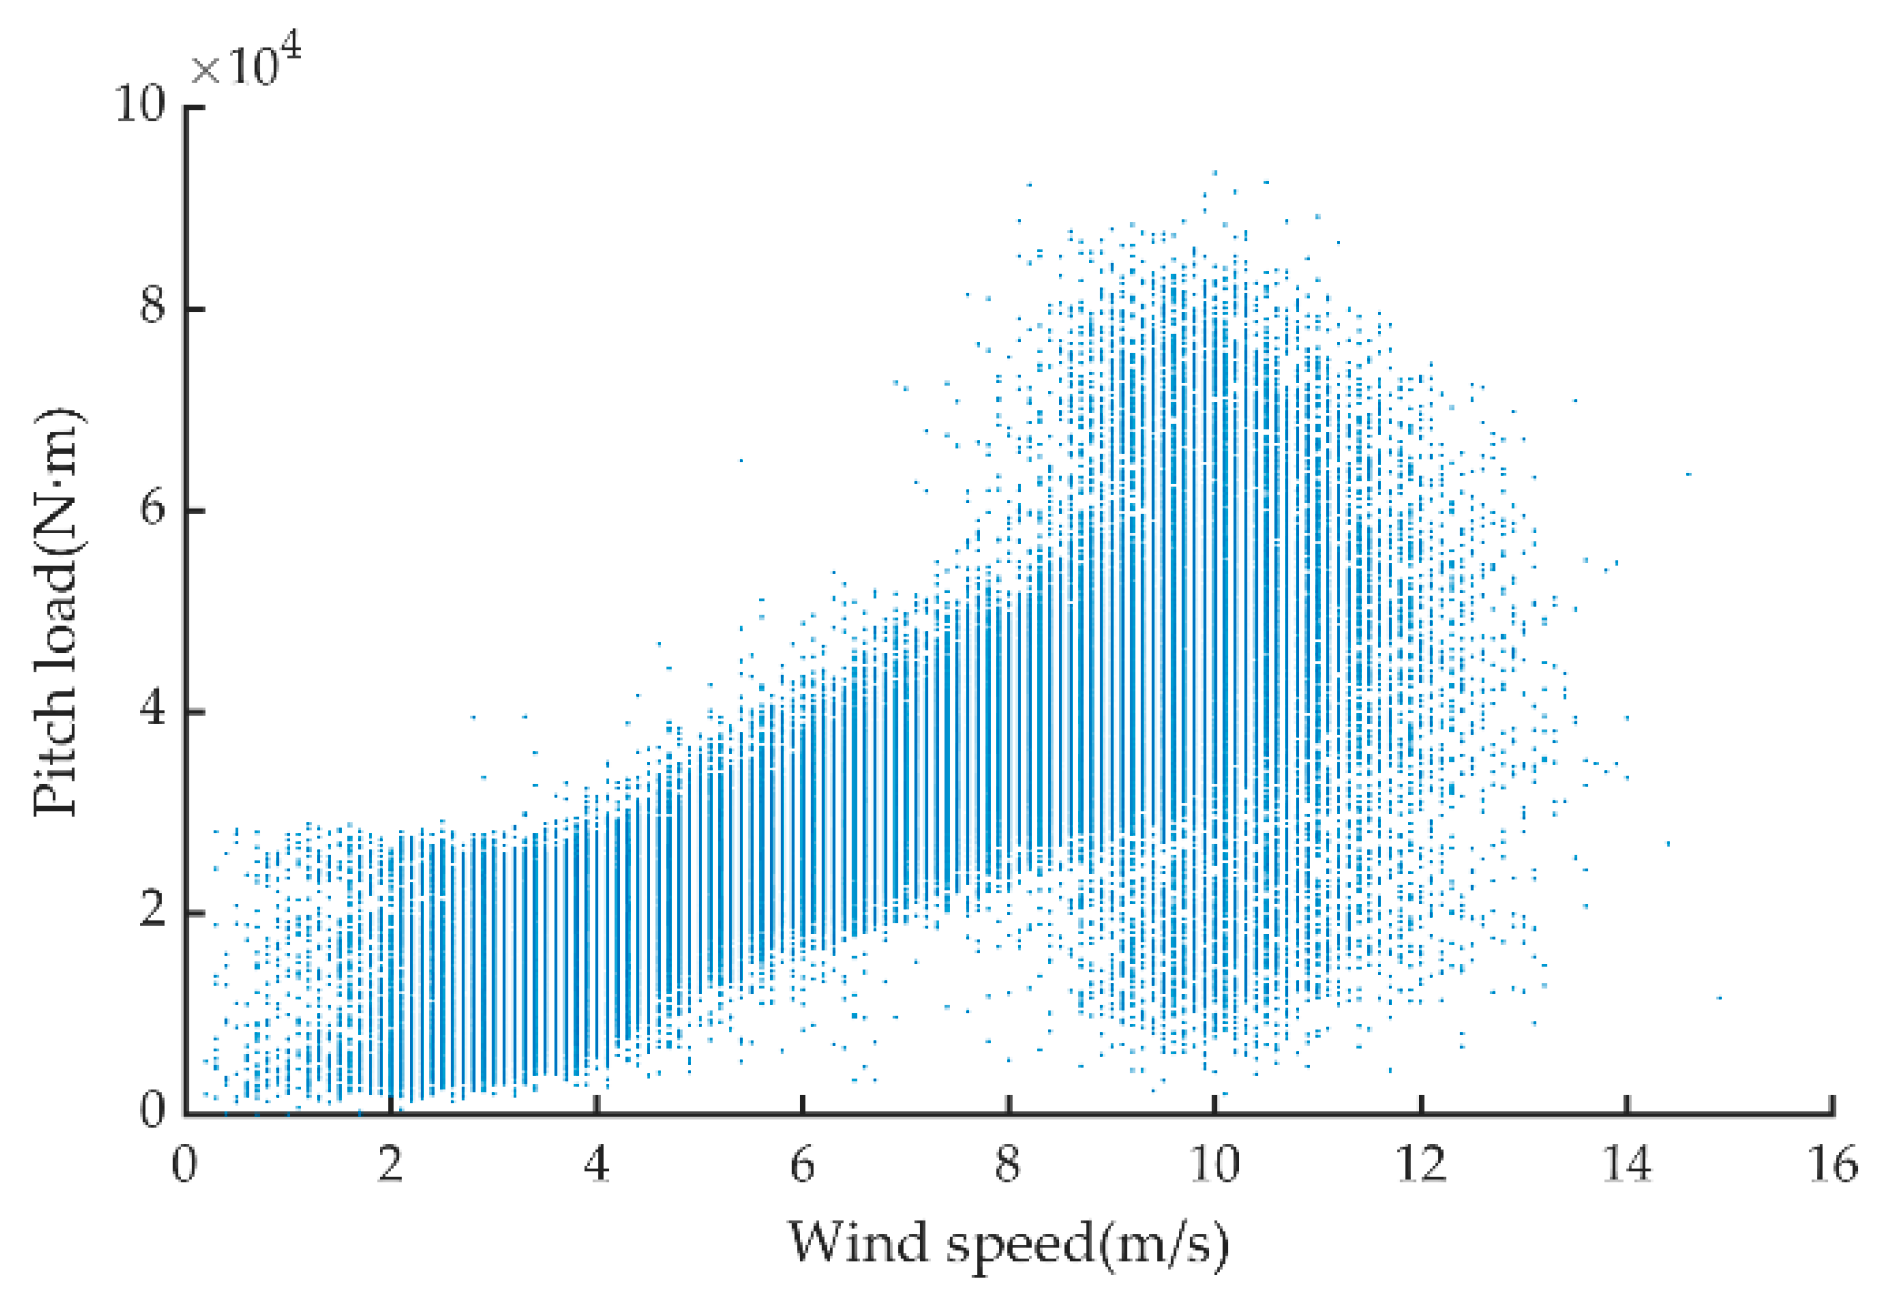
As mentioned in the previous section, the main factors affecting the pitch load of the wind turbine are wind speed, rotor speed, hub angle and pitch angle. The pitch angle is a special factor. If the pitch angle is greater than 0 rad, it means that the pitch mechanism has been started, that is, the wind turbine has been operating in the constant power operation state. The variation of the pitch load during this period becomes very complicated; therefore, when investigating the influence of wind speed, rotor speed and hub angle on the pitch load, the data samples with the pitch angle of 0 rad were selected. To understand the influence of each factor on the pitch load from a data point of view, this section will carry out the data investigation.
4.1. Investigation of Wind Speed on the Pitch Load
When investigating the influence of wind speed on the pitch load, the rotor speed and hub angle took a relatively definite value. The sample data extraction was performed as follows:
Step 1: Eliminate the data of the wind turbine in a pitch state by judging whether .
Step 2: Select the rotor speed of 0.9 rad/s, 1.0 rad/s, 1.1 rad/s, 1.2 rad/s, with a variation range of ±0.05 rad/s. The rotor speed level was determined to set aside the influence caused by operating the pitch mechanism.
Step 3: Extract the SCADA data corresponding to the hub angle of 0 rad, rad, rad, and rad under different rotor speeds. The extracted hub angle data have a variation range of ±0.1 rad.
The determination of the factor interval requires a balance between the analytical accuracy and the number of samples that exist within the interval. The smaller the variation range of the selected parameter is, the more accurate the analysis results are. However, if the parameter variation range is too small, the amount of data contained will be less, so that accurate statistical analyses cannot be performed. After screening the data, the scattered relationships between the wind speed and the pitch load are shown in
Figure 6a–d under different rotor speeds. For
Figure 6a, the hub angle is 0 rad; for
Figure 6b,
rad; for
Figure 6c,
rad; and for
Figure 6d,
rad. As shown in
Figure 6a–d, when the wind speed keeps a constant value, the pitch load changes in a certain range. Therefore, single-valued processing is employed to clearly reveal the relationship between the wind speed and the pitch load. Specifically, for a given wind speed, the corresponding probability distribution of the pitch load is constructed, and then the pitch load with the highest probability is extracted as the single-valued torque (load) corresponding to the given wind speed.
In the statistical field, there are two commonly used methods to estimate the overall probability distribution density of the sample, that is, the parametric method and the nonparametric method. The parametric method considers the form of the density function to be known, and only the specific parameters of the density function are determined by the sample. However, for the blade pitch load, there is no prior knowledge about the density function. Therefore, the kernel density estimation (KDE) [
34,
35,
36,
37], which is one kind of nonparametric density estimation method, is employed. The general definition of the KDE method is
where
is a sample of a continuous population,
is the kernel density estimation of the total density function
at any point
,
is the kernel function, and
is the window width.
The common kernel functions include Uniform, Triangle, and Gauss. In this paper, the Gaussian kernel function is selected, which is [
35]:
Then, the abovementioned method is applied to data processing, as shown in
Figure 5a–d, while the corresponding curves of the wind speed and the pitch load after single-valued processing are shown in
Figure 7a,
Figure 7b,
Figure 7c and
Figure 7d, respectively.
From
Figure 6 and
Figure 7, it can be seen that before data processing, the relationship between wind speed and pitch load is disperse, and it is difficult to see the influence of wind speed on the pitch load. After single value processing, the relationship between the wind speed and pitch load becomes clearer. As shown in
Figure 7, under a certain wind speed, the greater the rotor speed is, the larger the pitch load is. When the rotor speed is 1.2 rad/s, the corresponding pitch load is approximately 1.5 times that of the rotor speed at 0.9 rad/s. There is a noteworthy phenomenon that can be seen from
Figure 6: when the rotor speed is constant, the wind speed changes within a certain range, but the change of wind speed does not cause a significant change in the pitch load. Theoretically, as the wind speed increases, the pitch load increases, especially below the rated wind speed. This trend is also evident in
Figure 5. From another scenario, if the inflow wind speed is steady, a certain rotor speed corresponds to a certain wind speed below the rated wind speed. However, due to the randomness of the wind speed and the rapidity of the wind speed change (relative to the inertia of the wind rotor), when the rotor speed is constant, the wind speed is not constant but varies within a certain range. The strong randomness of the wind speed conceals the essential relationship between the wind speed data and the pitch load. This can reasonably explain why the rotor speed corresponds to a certain range of wind speed, but the pitch load is constant.
In addition, the pitch load is not obviously kept consistent in the “two ends” of the curve in
Figure 7. The reason for this phenomenon is that in the “two ends” of the curve, the amount of SCADA data that can be extracted is relatively small, and the data processing method is greatly affected by outliers, so some unreliable phenomena appear.
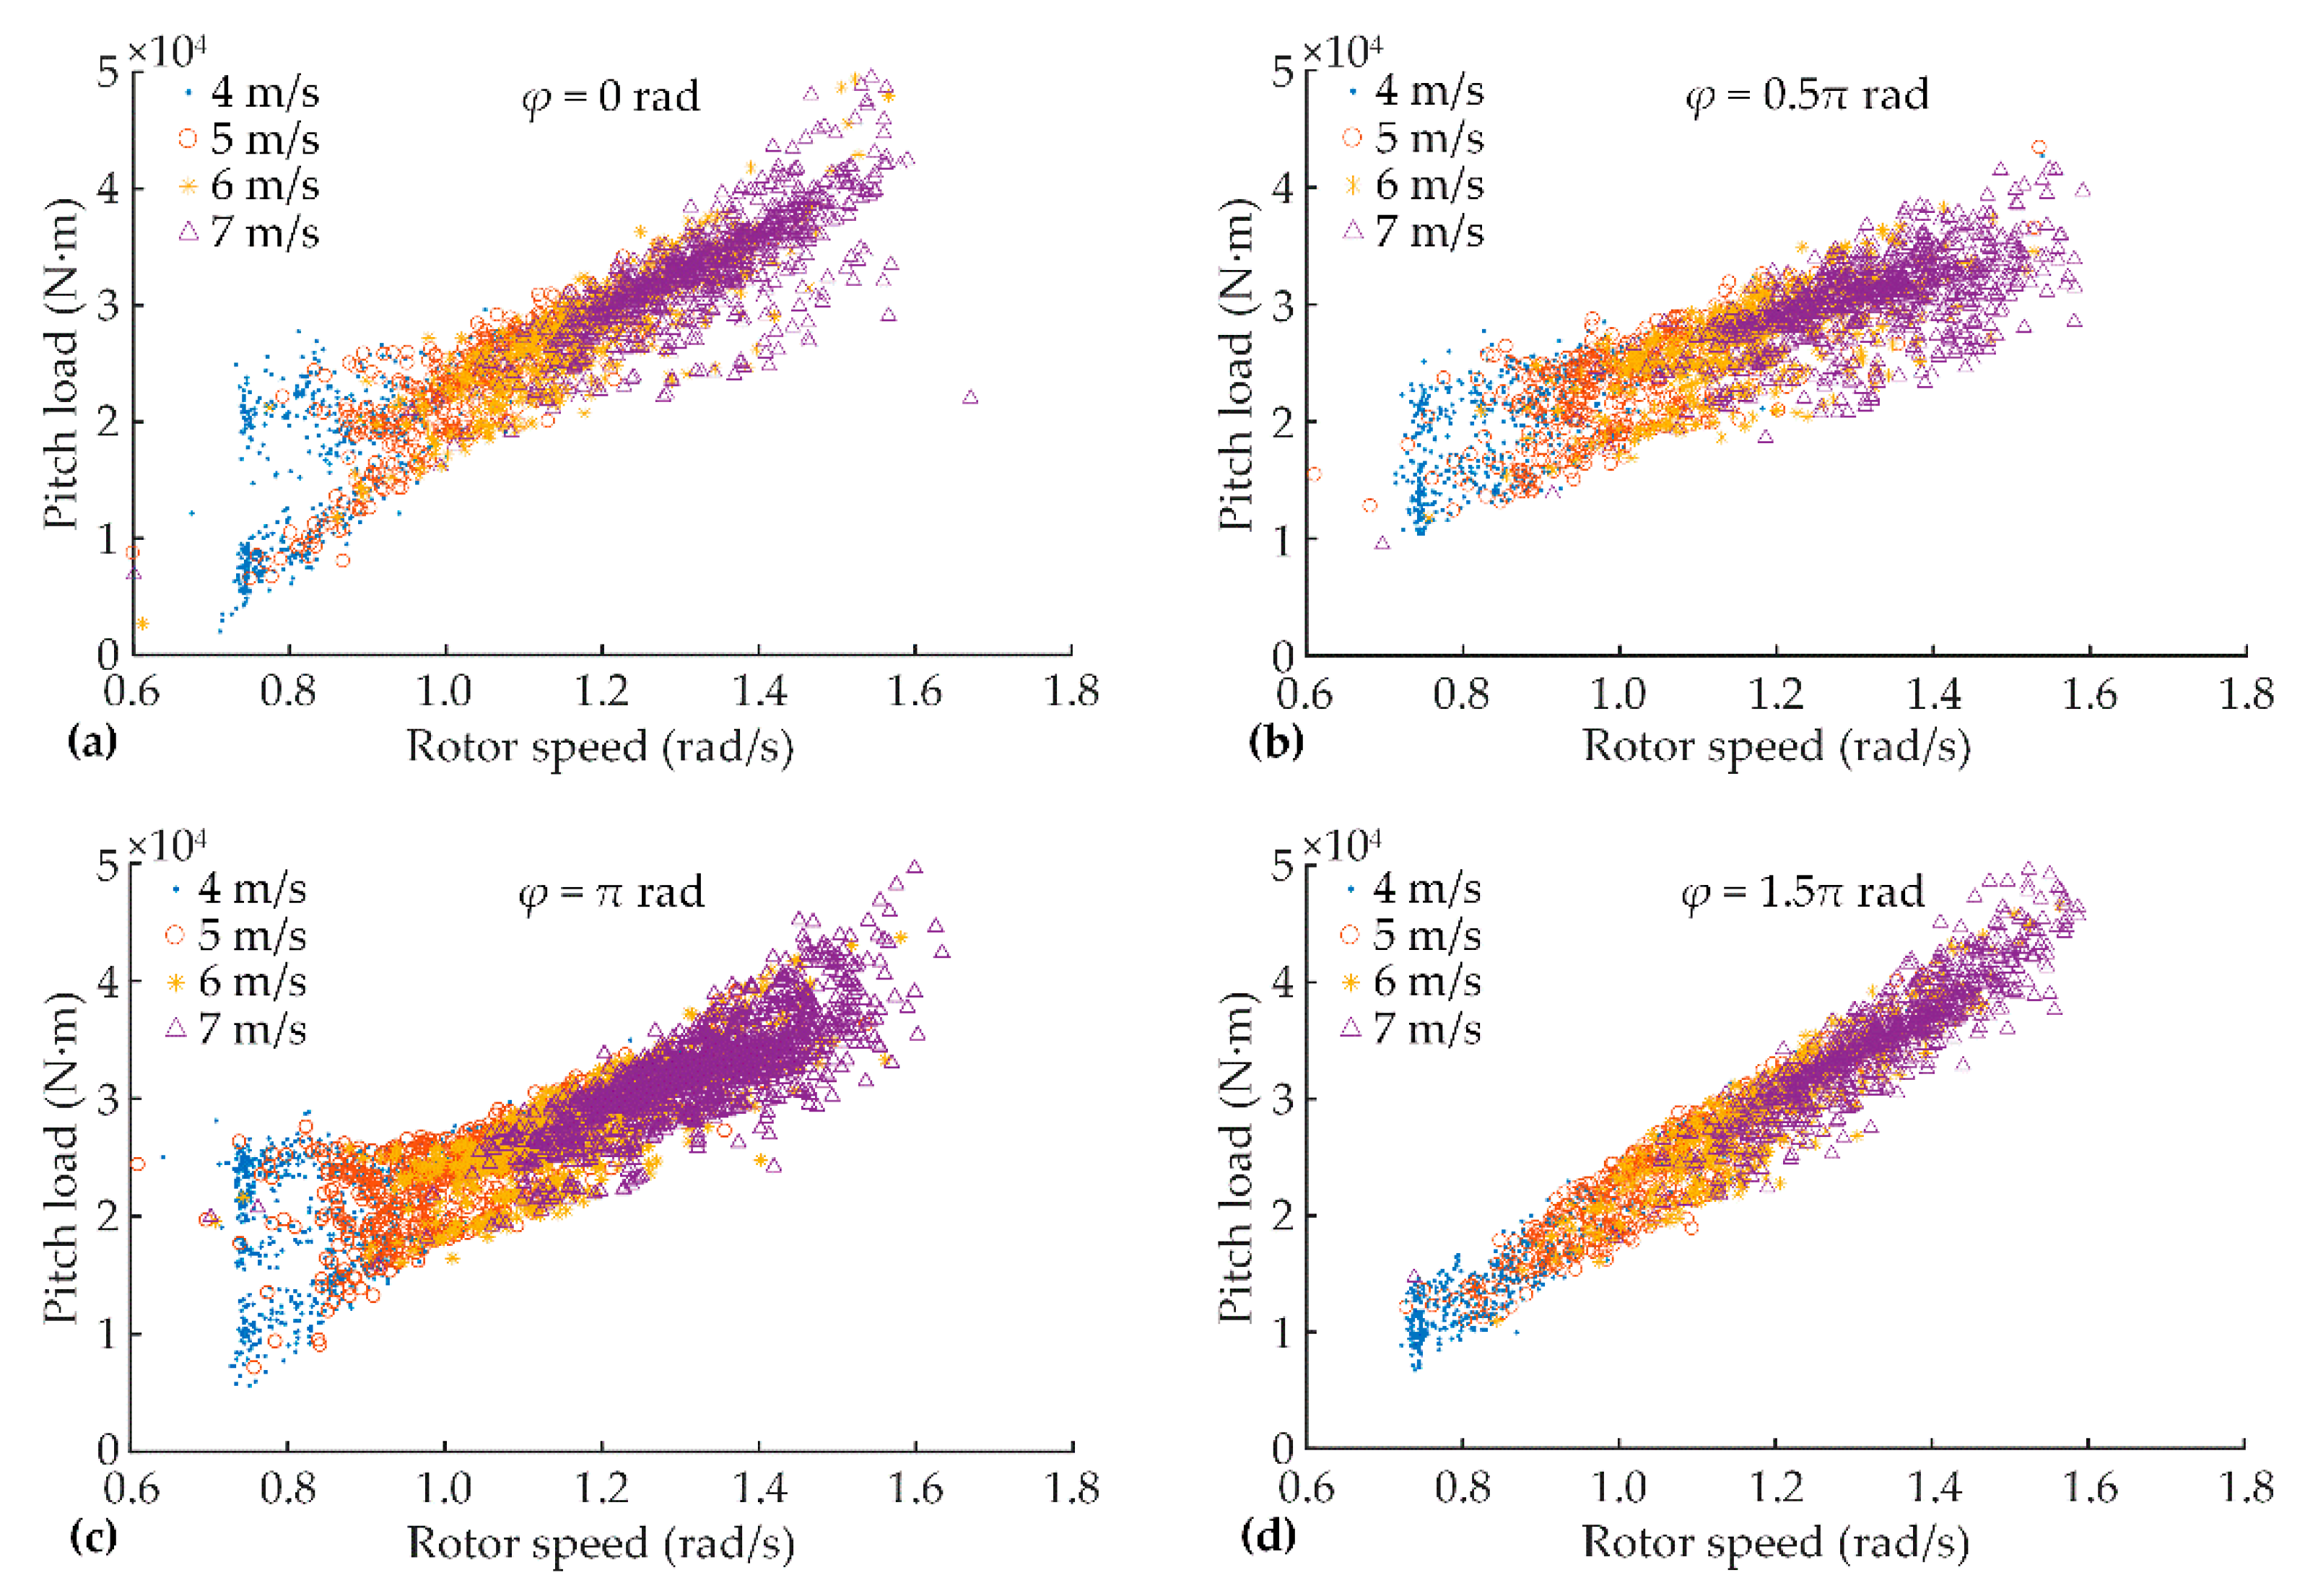
4.2. Influence of Rotor Speed on the Pitch Load
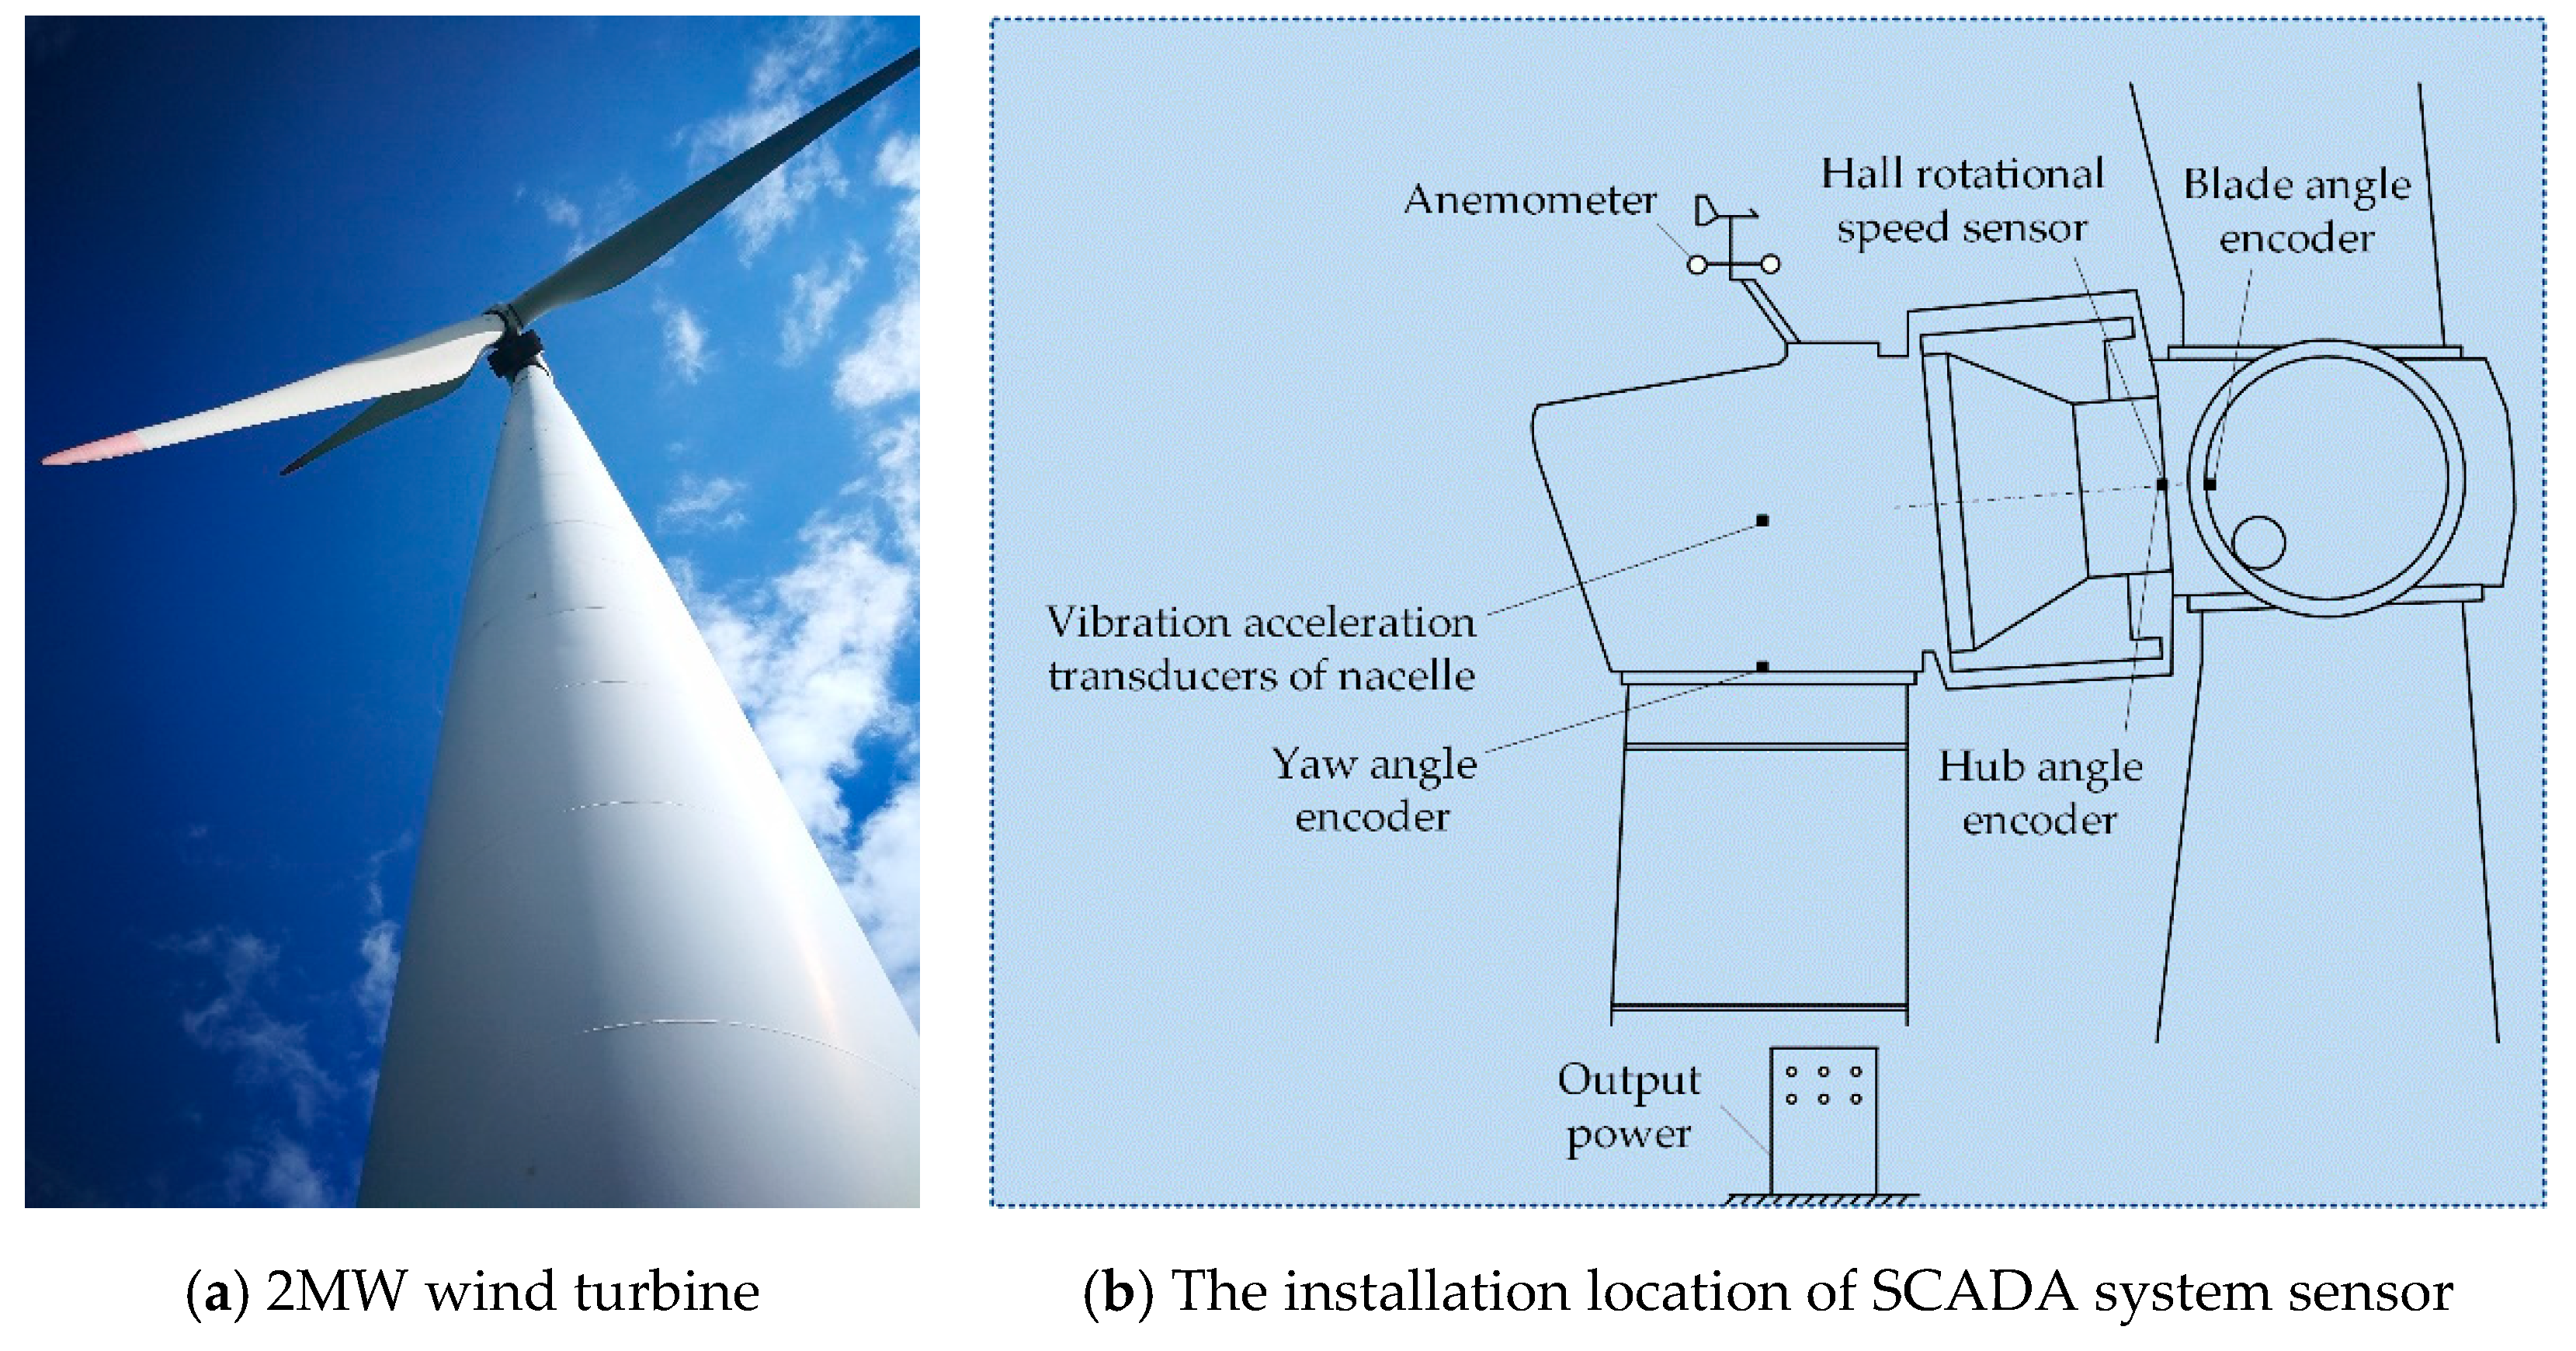
Rotor speed can be measured accurately in the SCADA system and can be precisely controlled by the appropriate control strategy. When investigating the influence of rotor speed on the pitch load, the extraction of SCADA data mainly includes three steps to construct the subset:
Step 1: Eliminate the data of the wind turbine in the pitch state by judging whether .
Step 2: Select the wind speed of 4 m/s, 5 m/s, 6 m/s and 7 m/s, with a variation range of ±0.5 m/s. The wind speed level is also determined to set aside the influence caused by the operation of the pitch mechanism.
Step 3: Extract the SCADA data corresponding to hub angle of 0 rad, rad, rad and rad under different wind speeds, with a variation range of rad.
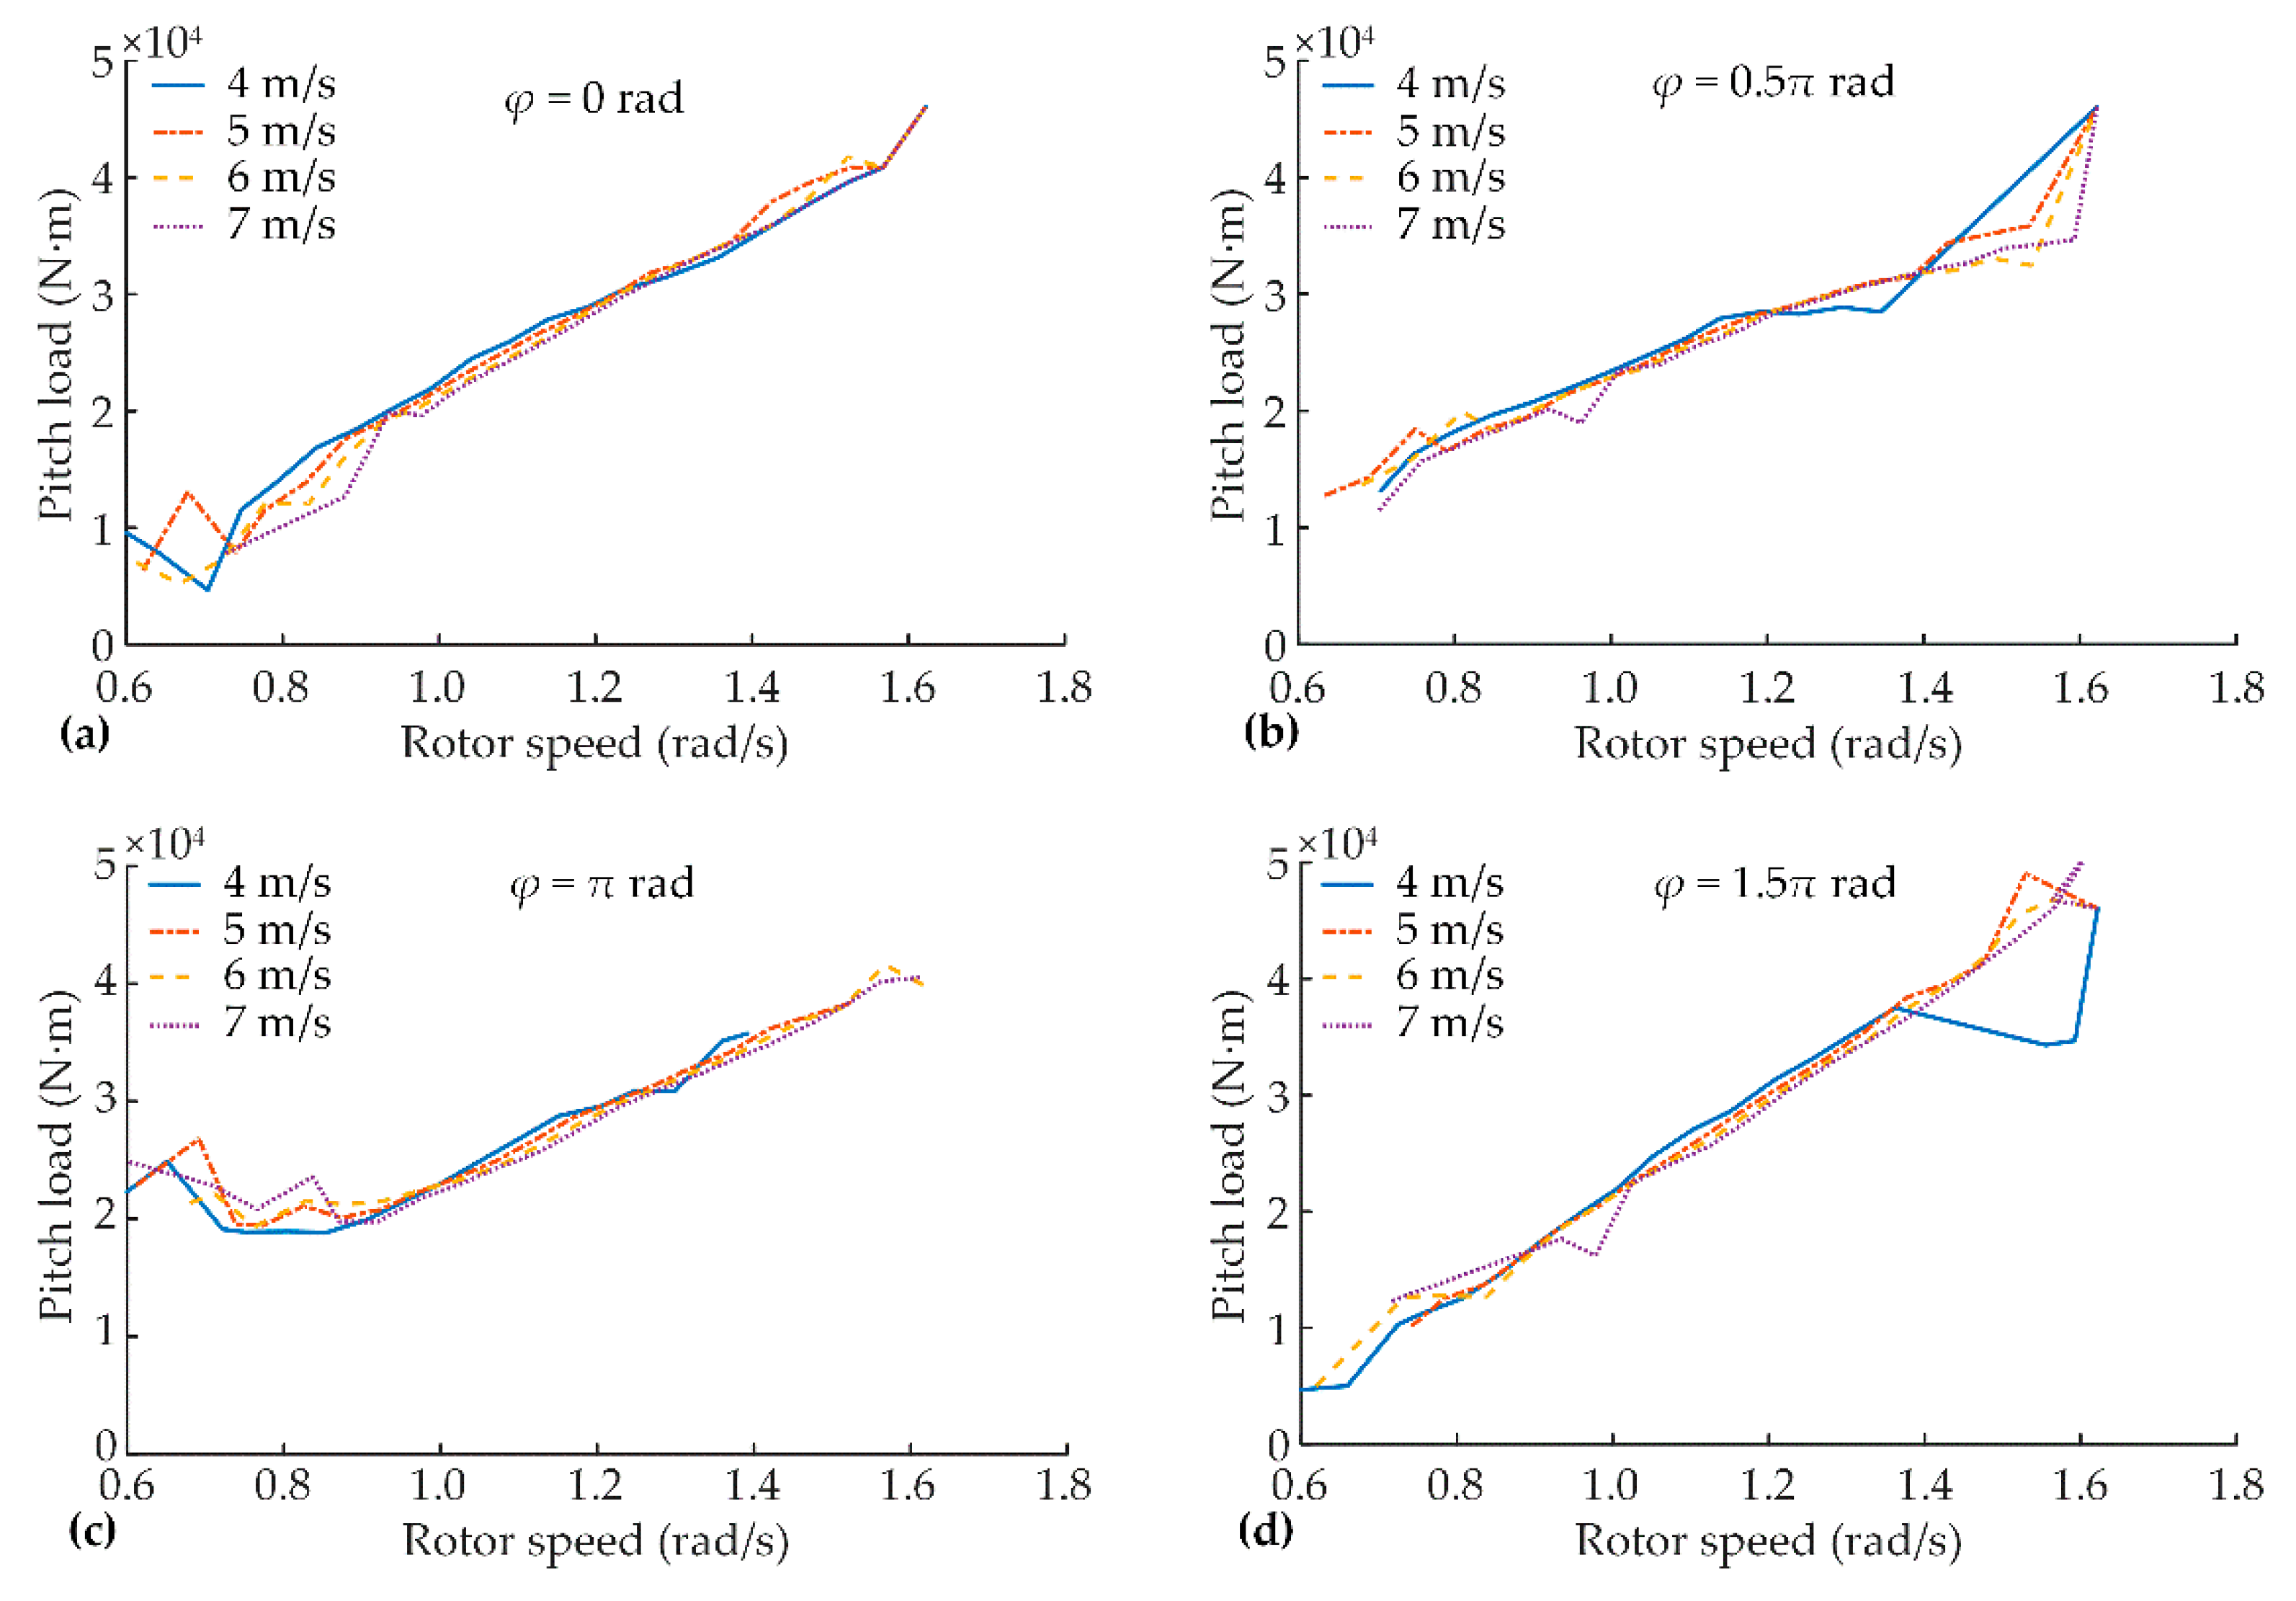
Under the different wind speed ranges, the relationship between the rotor speed and the pitch load is obtained, as shown in
Figure 8a–d. Obviously, the relationship between the rotor speed and the pitch load also has a scattered point relation, that is, a certain rotor speed corresponds to a series of pitch loads. Subsequently, the proposed KDE data processing method is used to process the relationship between the rotor speed and the pitch load in
Figure 8a–d, and the corresponding single-valued relationship between the rotor speed and the pitch load is obtained as shown in
Figure 9a–d.
It can be seen from
Figure 8 and
Figure 9 that when the wind speed is less than the rated wind speed and the blade angle is 0 rad, the influence of the rotor speed on the pitch load is more obvious than that of the wind speed, which shows an approximately liner relationship in general. To further quantitatively analyze the relationship between the pitch load and the rotor speed, their relationship function could be considered as:
where
is the pitch load; and
is rotor speed.
Let
be a function with an expression of
. Then, the least-square fittings are performed on the scattered data in
Figure 8a,
Figure 8b,
Figure 8c and
Figure 8d. The fitting result between the pitch load and the rotor speed is shown in Equation (7):
In Equation (7), the slopes of the function between the pitch load and the rotor speed are different at different hub angles. The main reason is that at different hub angles, the wind speeds acting on the wind turbine blades are different due to the influence of wind shear. Meanwhile, the aerodynamic force that induces the pitch load is related to not only the rotor speed but also the wind speed. In addition, the fitting result also shows that the intercepts of the relational expression of the pitch load and the rotor speed vary at different hub angles. The main reason is that when the hub angle varies, not only the wind speed acting on the wind turbine blades will change due to the influence of wind shear but also the pitch load induced by the blade gravity will change.
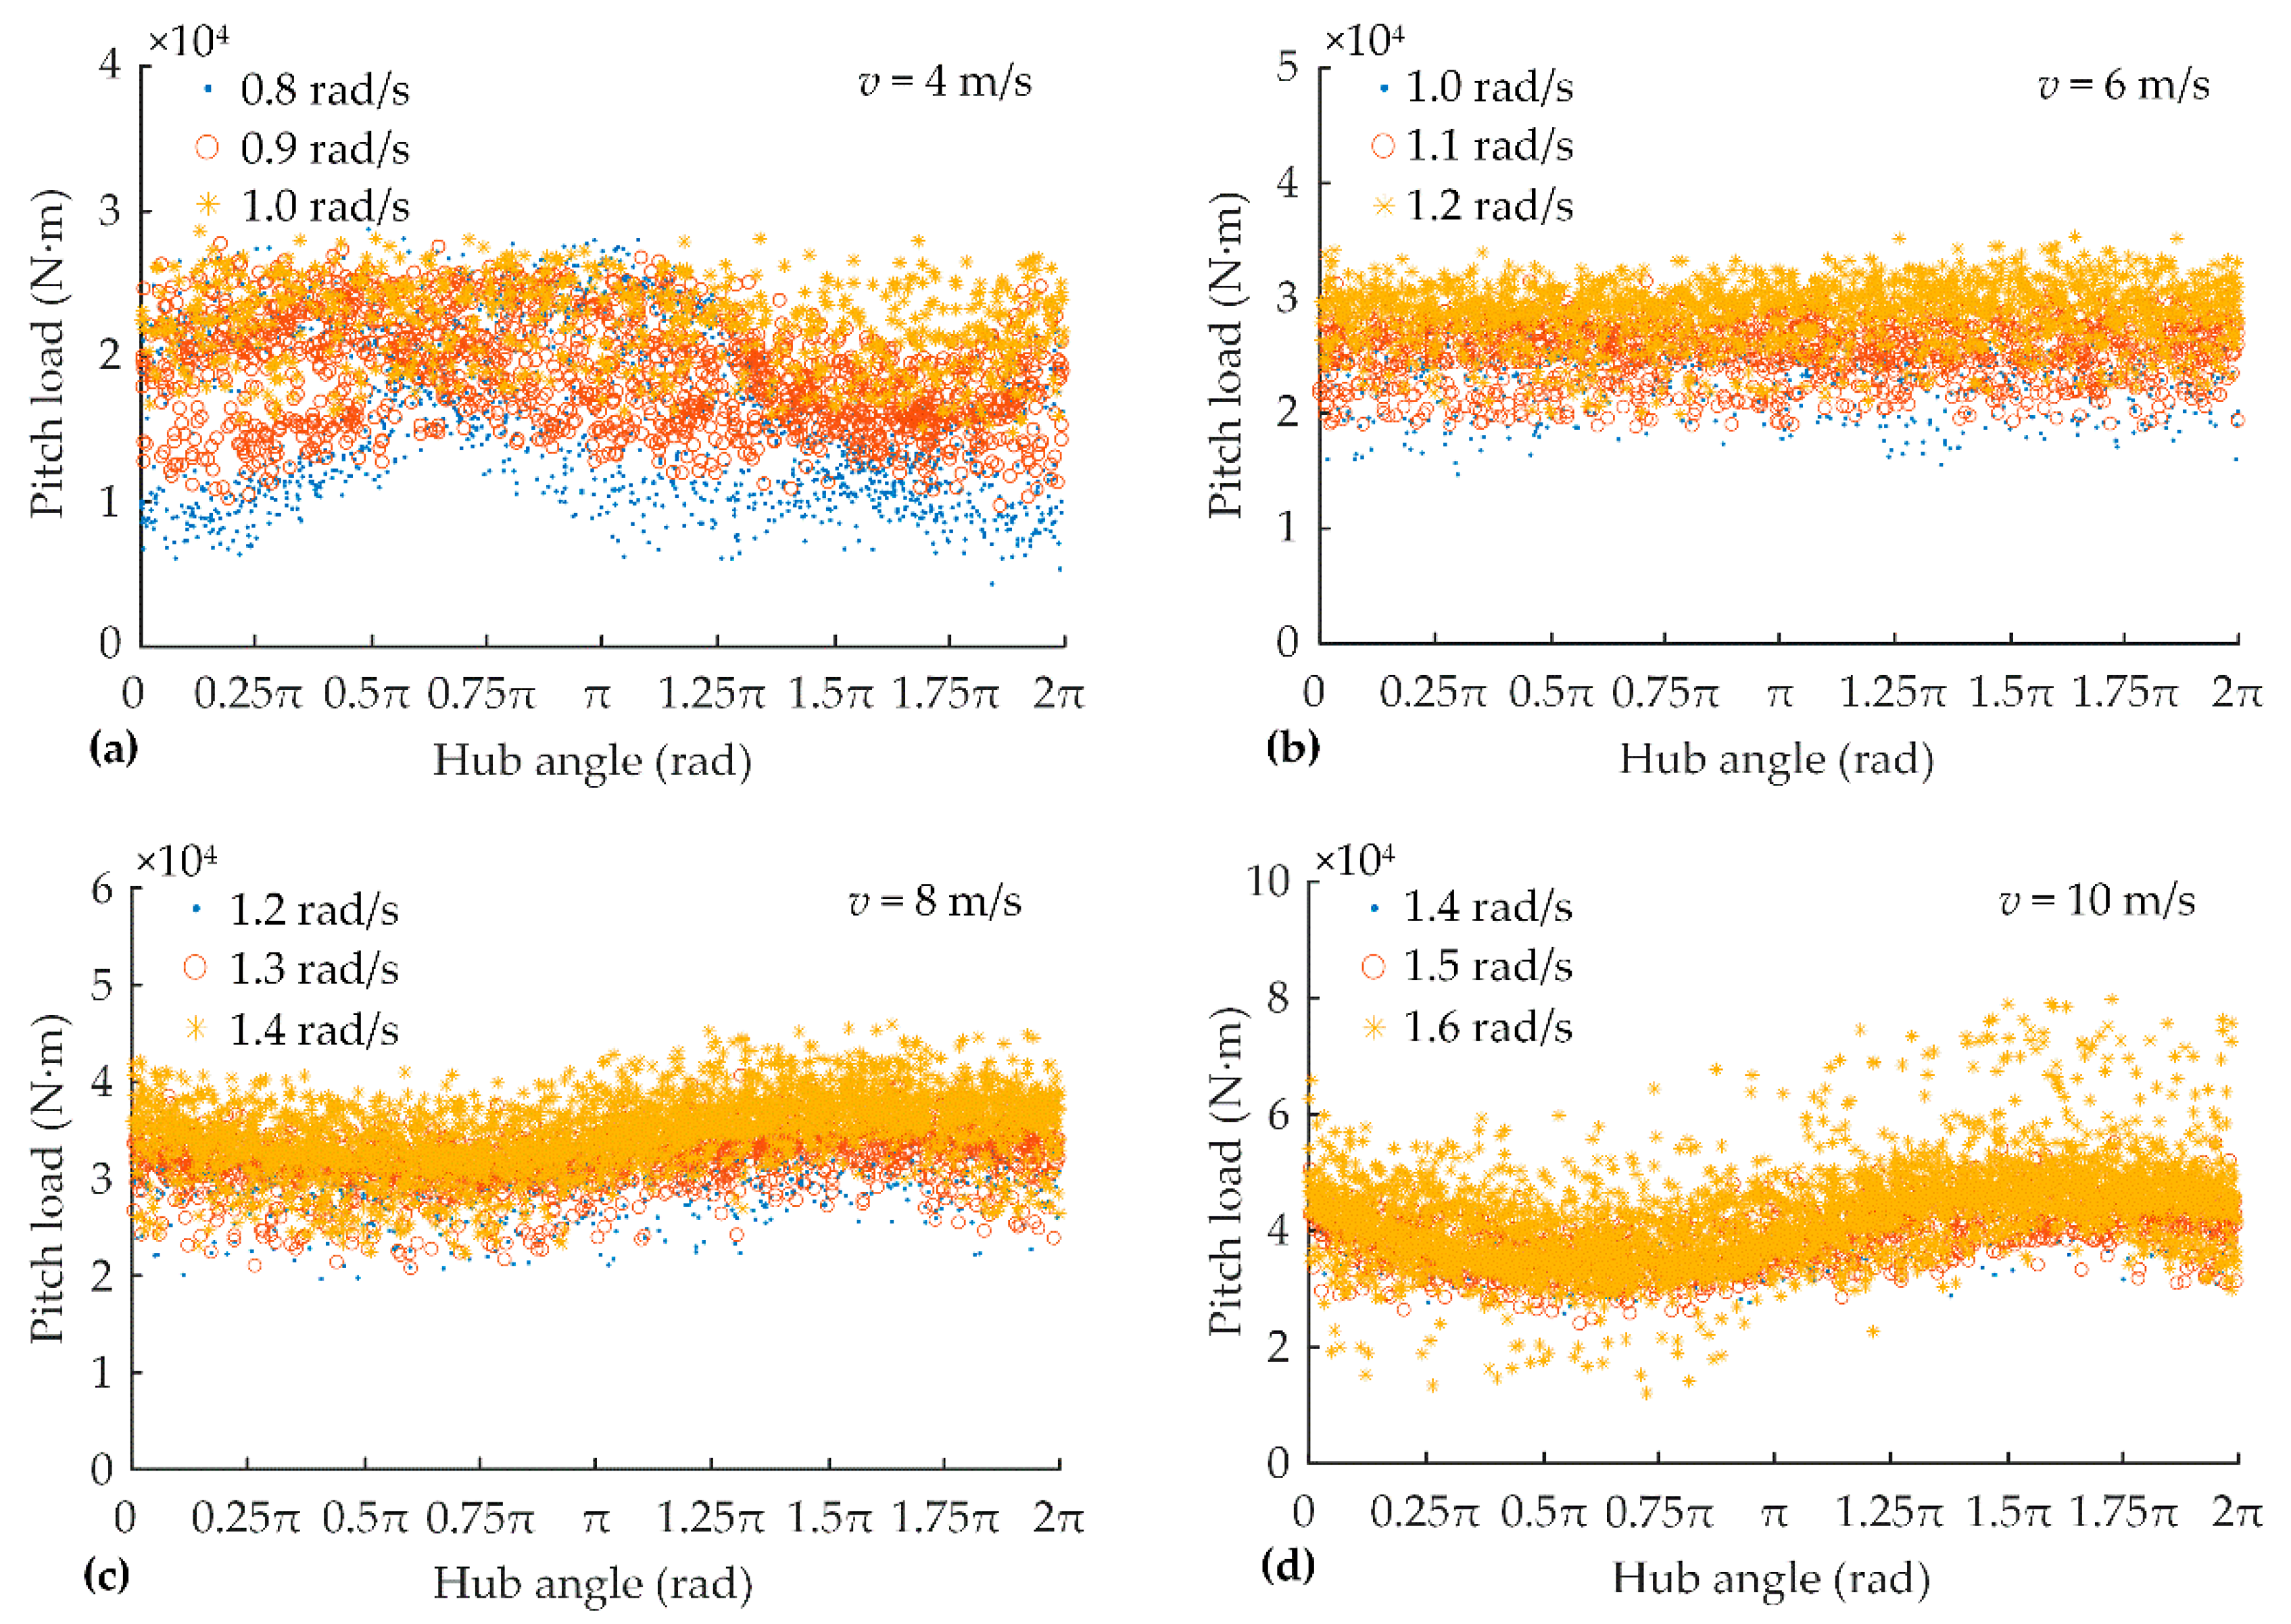
4.3. Influence of the Hub Angle on the Pitch Load
The variation in the hub angle will change the spatial position of the blade, thus affecting the pitch load induced by the blade gravity. Furthermore, the variation will also change the pitch load induced by the aerodynamic force acting on the blades (due to the influence of wind shear). When analyzing the influence of the hub angle on the pitch load, a new data subset is grouped and mainly includes three steps:
Step 1: Eliminate the data of the wind turbine in the pitch state by judging whether .
Step 2: Select the wind speed of 4 m/s, 6 m/s, 8 m/s and 10 m/s, with a variation range of m/s.
Step 3: Select the rotor speed levels from 0.8 rad/s to 1.6 rad/s, with an increase of 0.1 rad/s under different wind speeds, with a variation range of rad/s.
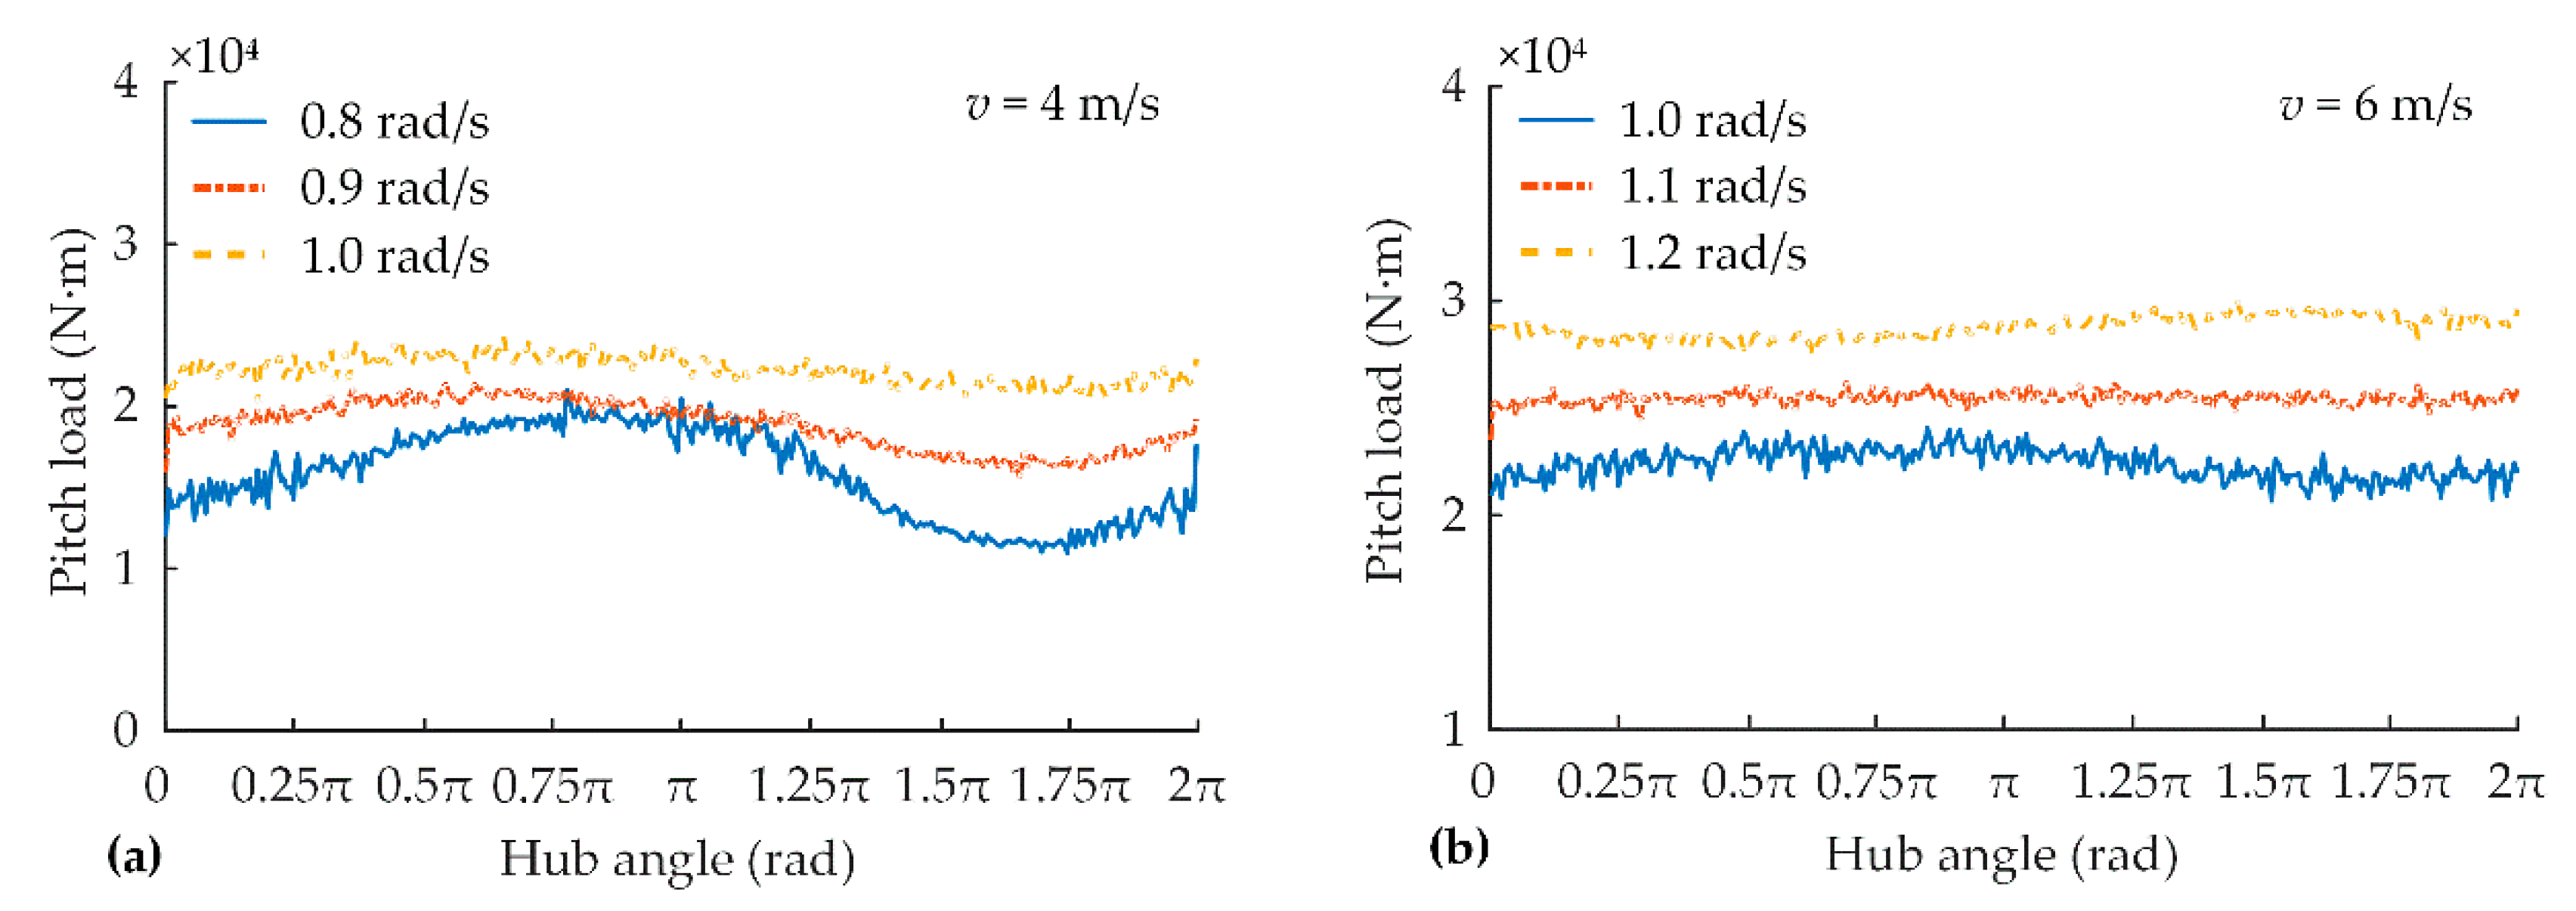
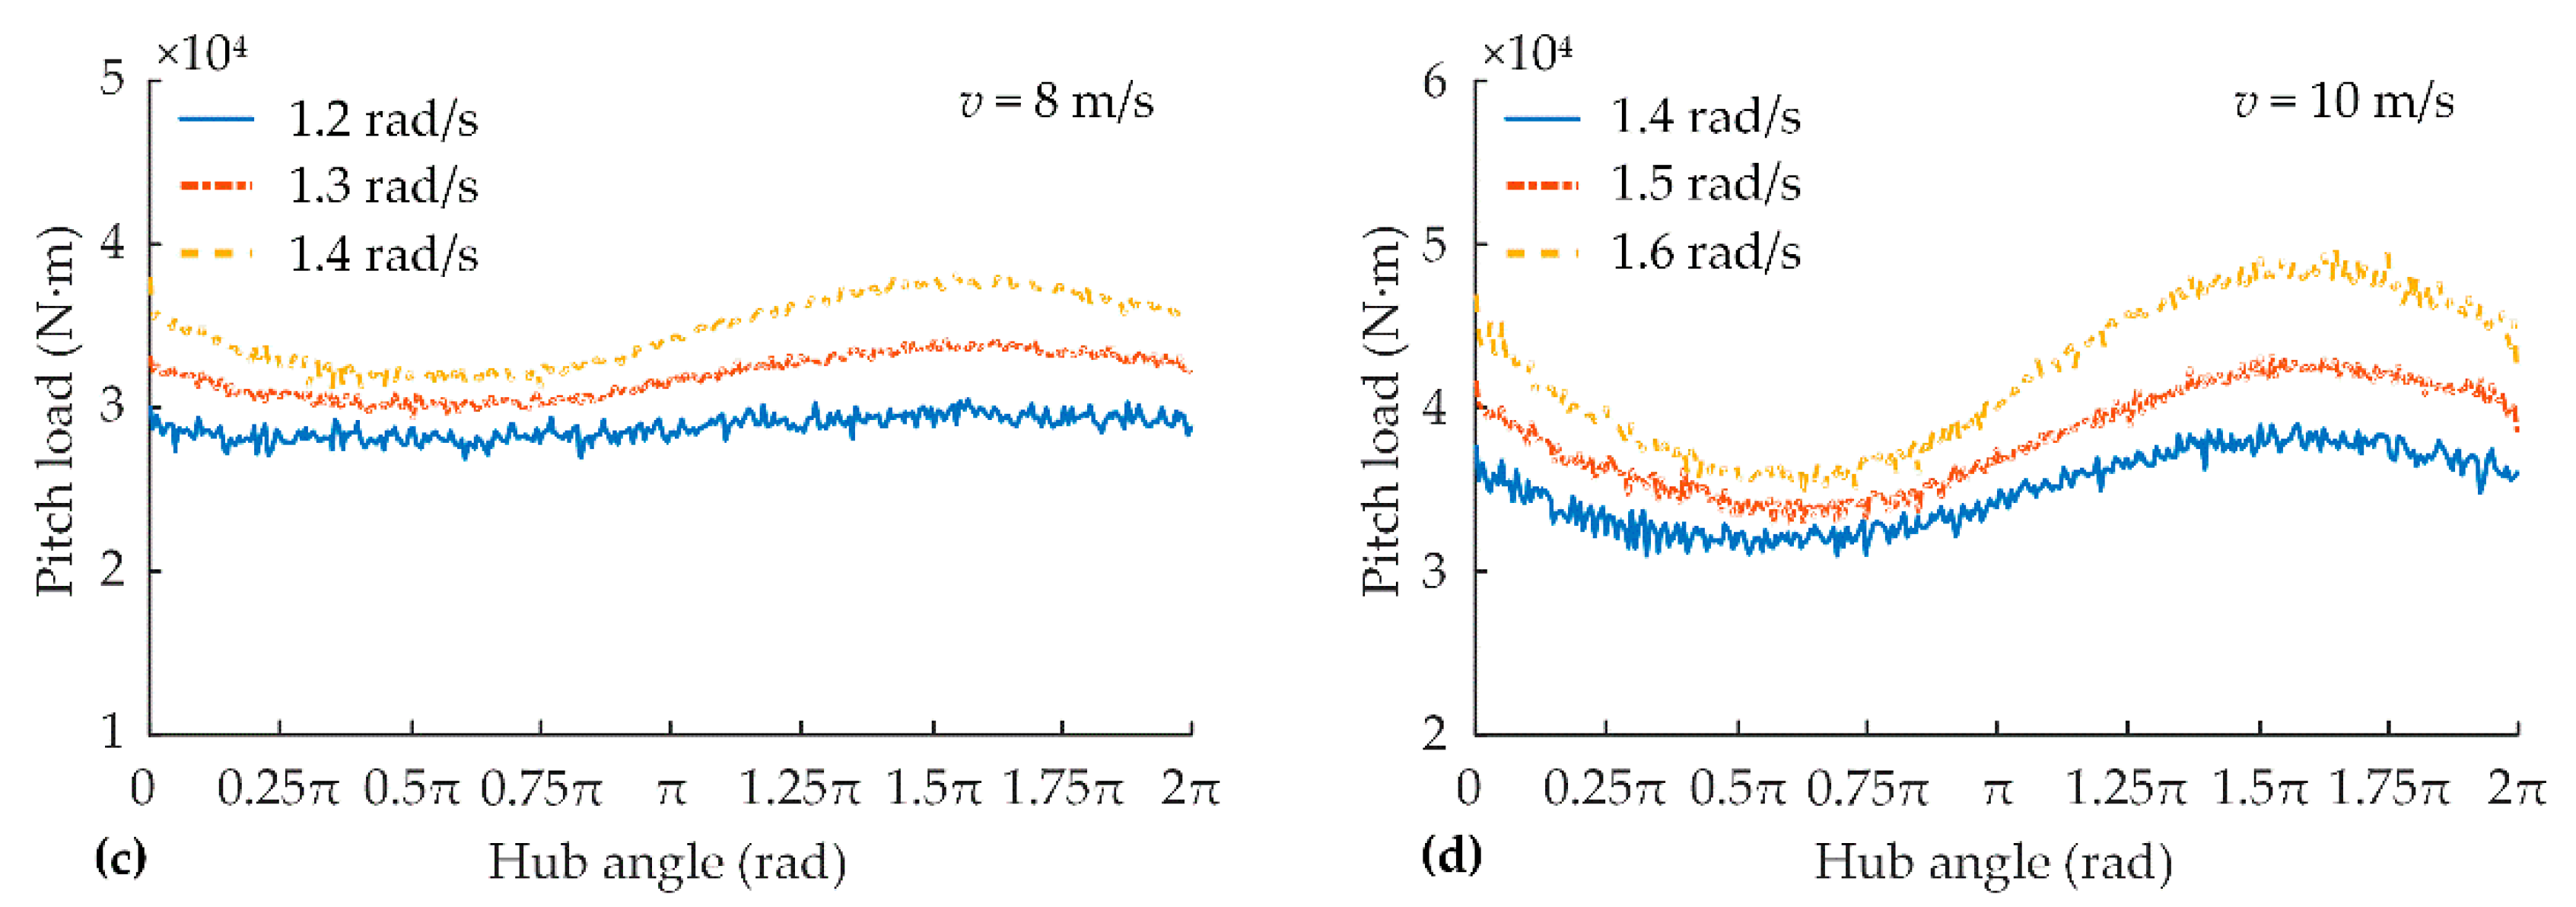
Subsequently, the relationships between the hub angle and the pitch load are obtained under different rotor speeds, which are shown in
Figure 10a–d. Obviously, there is a scatter point relationship between the hub angle and the pitch load in the figure. In other words, a hub angle value corresponds to the multiple pitch load values. By using the abovementioned KDE method, the pitch load data could be single-valued processed. The corresponding relationship between the hub angle and the pitch load is shown in
Figure 11a–d.
In
Figure 11a–d, when the rotor speed and the wind speed are constant, the variation trend of the pitch load (with the change of hub angle) is approximately a sine (cosine) curve. Under the same wind speed and hub angle, the greater the rotor speed is, the greater the pitch load is. To fit the relationship between the pitch load and the hub angle in
Figure 10a–d, an expression is employed as:
where
is the relationship function of the pitch load and the hub angle;
is the hub angle;
is the initial phase;
is the amplitude; and
is the offset.
Under different wind and rotor speeds, assume the pitch load samples are expressed by
. The pitch load sample of
corresponds to the wind speed
and rotor speed
;
corresponds to the wind speed
and rotor speed
. For a pitch load sample from
to
, one has
, where
is the sample number contained in the
k-th pitch load sample set
. Then, using the least square method, the specific expression of Equation (8) could be obtained. The objective function is:
According to Equation (9), under different wind and rotor speeds, the values of
,
and
in Equation (8) can be obtained (as shown in
Table 3). As seen from
Table 3, with the increase in the wind and rotor speeds, amplitude
A decreases first and then increases; the initial phase
keeps decreasing; and the intercept
b keeps increasing. Among the four components of pitch load (aerodynamic force, centrifugal force, gravity, inertia force), pitch load induced by the centrifugal force and pitch load induced by the inertia force are independent of the hub angle; pitch load induced by the aerodynamic force and pitch load induced by gravity are related to the hub angle. This also means that the “sine” trends of pitch load shown in
Figure 10 and
Figure 11 are caused by the aerodynamic force and the blade gravity.
Since the magnitude and phase of sinusoidal changes of the pitch load induced by the gravity component are all determinable, it can be deduced that the phenomenon of amplitude
decreasing first and then increasing, as shown in
Table 3, is caused by the change in the aerodynamic force component. In other words, the initial phase of the pitch load induced by the aerodynamic force is various at different wind and rotor speeds, which leads to the phenomenon that amplitude
decreases first and then increases, and the initial phase
keeps decreasing after the superposition of various pitch load components. In addition, amplitude
reflects the fluctuation of the pitch load during the maximum wind energy capture stage. It can be seen in
Table 3 that the maximum value of
is 6555 N·m, which means the maximum fluctuation of pitch load is
.
Since the SCADA data with constant pitch angle were selected, the influence of the inertia load on the fitting results can be excluded. During the rotation of the rotor, the centrifugal force of the blade is always along the extension direction of the blade. Therefore, the pitch loads induced by centrifugal force are not influenced by the change of the hub angle but are only related to the rotor speed. Therefore, the change in the centrifugal force will not affect parameters
A and
in
Table 3, but only affect the change of intercept
b. It can also be seen from
Table 3 that intercept
is increasing with the increase of the rotor speed. This means the greater the rotor speed is, the greater the pitch load induced by centrifugal force is.
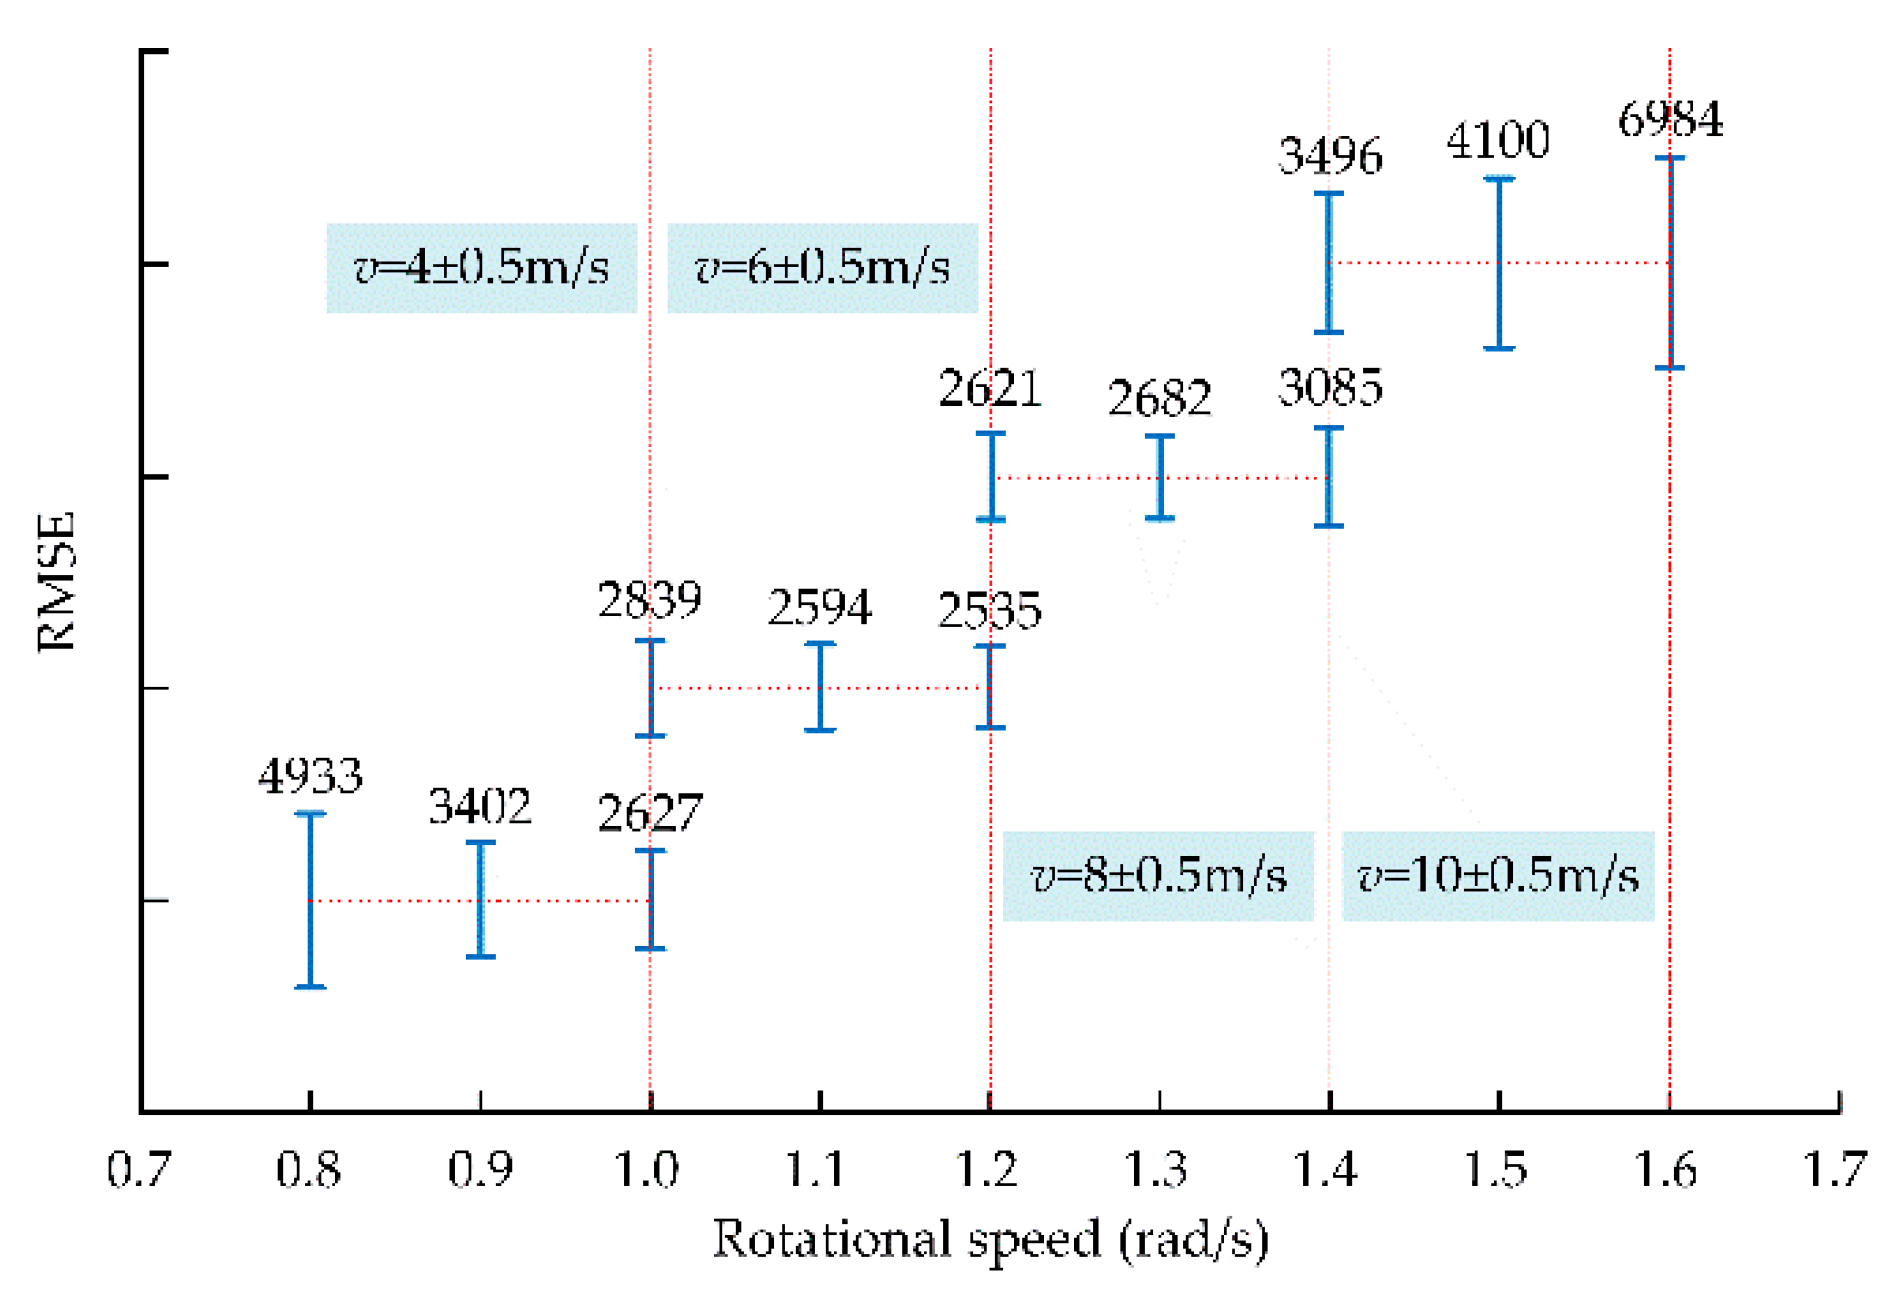
When realizing Equation (8) by using the least square method, the variation trend of the fitting root-mean-square error (RMSE) with the change of the wind and rotor speeds are shown in
Figure 12.
In
Figure 12, the length of the line segment is used to describe the size of the fitting root-mean-square error. The fitting root-mean-square error reflects the deviation of the relation curve (between the hub angle and the pitch load) with respect to the sine function described in Equation (8). In other words, the larger the fitting root-mean-square error is, the greater the deviation is. The fitting root-mean-square error also reflects the comprehensive composition relation of the pitch load induced by aerodynamic force, the pitch load induced by the centrifugal force and the pitch load induced by the blade gravity. As seen from
Figure 12, under a certain rotor speed, the greater the wind speed is, the greater the fitting root-mean-square error is. Since the pitch load induced by centrifugal force stays unchanged and the “sine” change of the pitch load induced by the blade gravity are not affected by the rotor speed, it can be understood that the greater the wind speed is, the more dispersed the pitch load induced by the aerodynamic force is.
4.4. The Influence of Pitch Angle on the Pitch Load
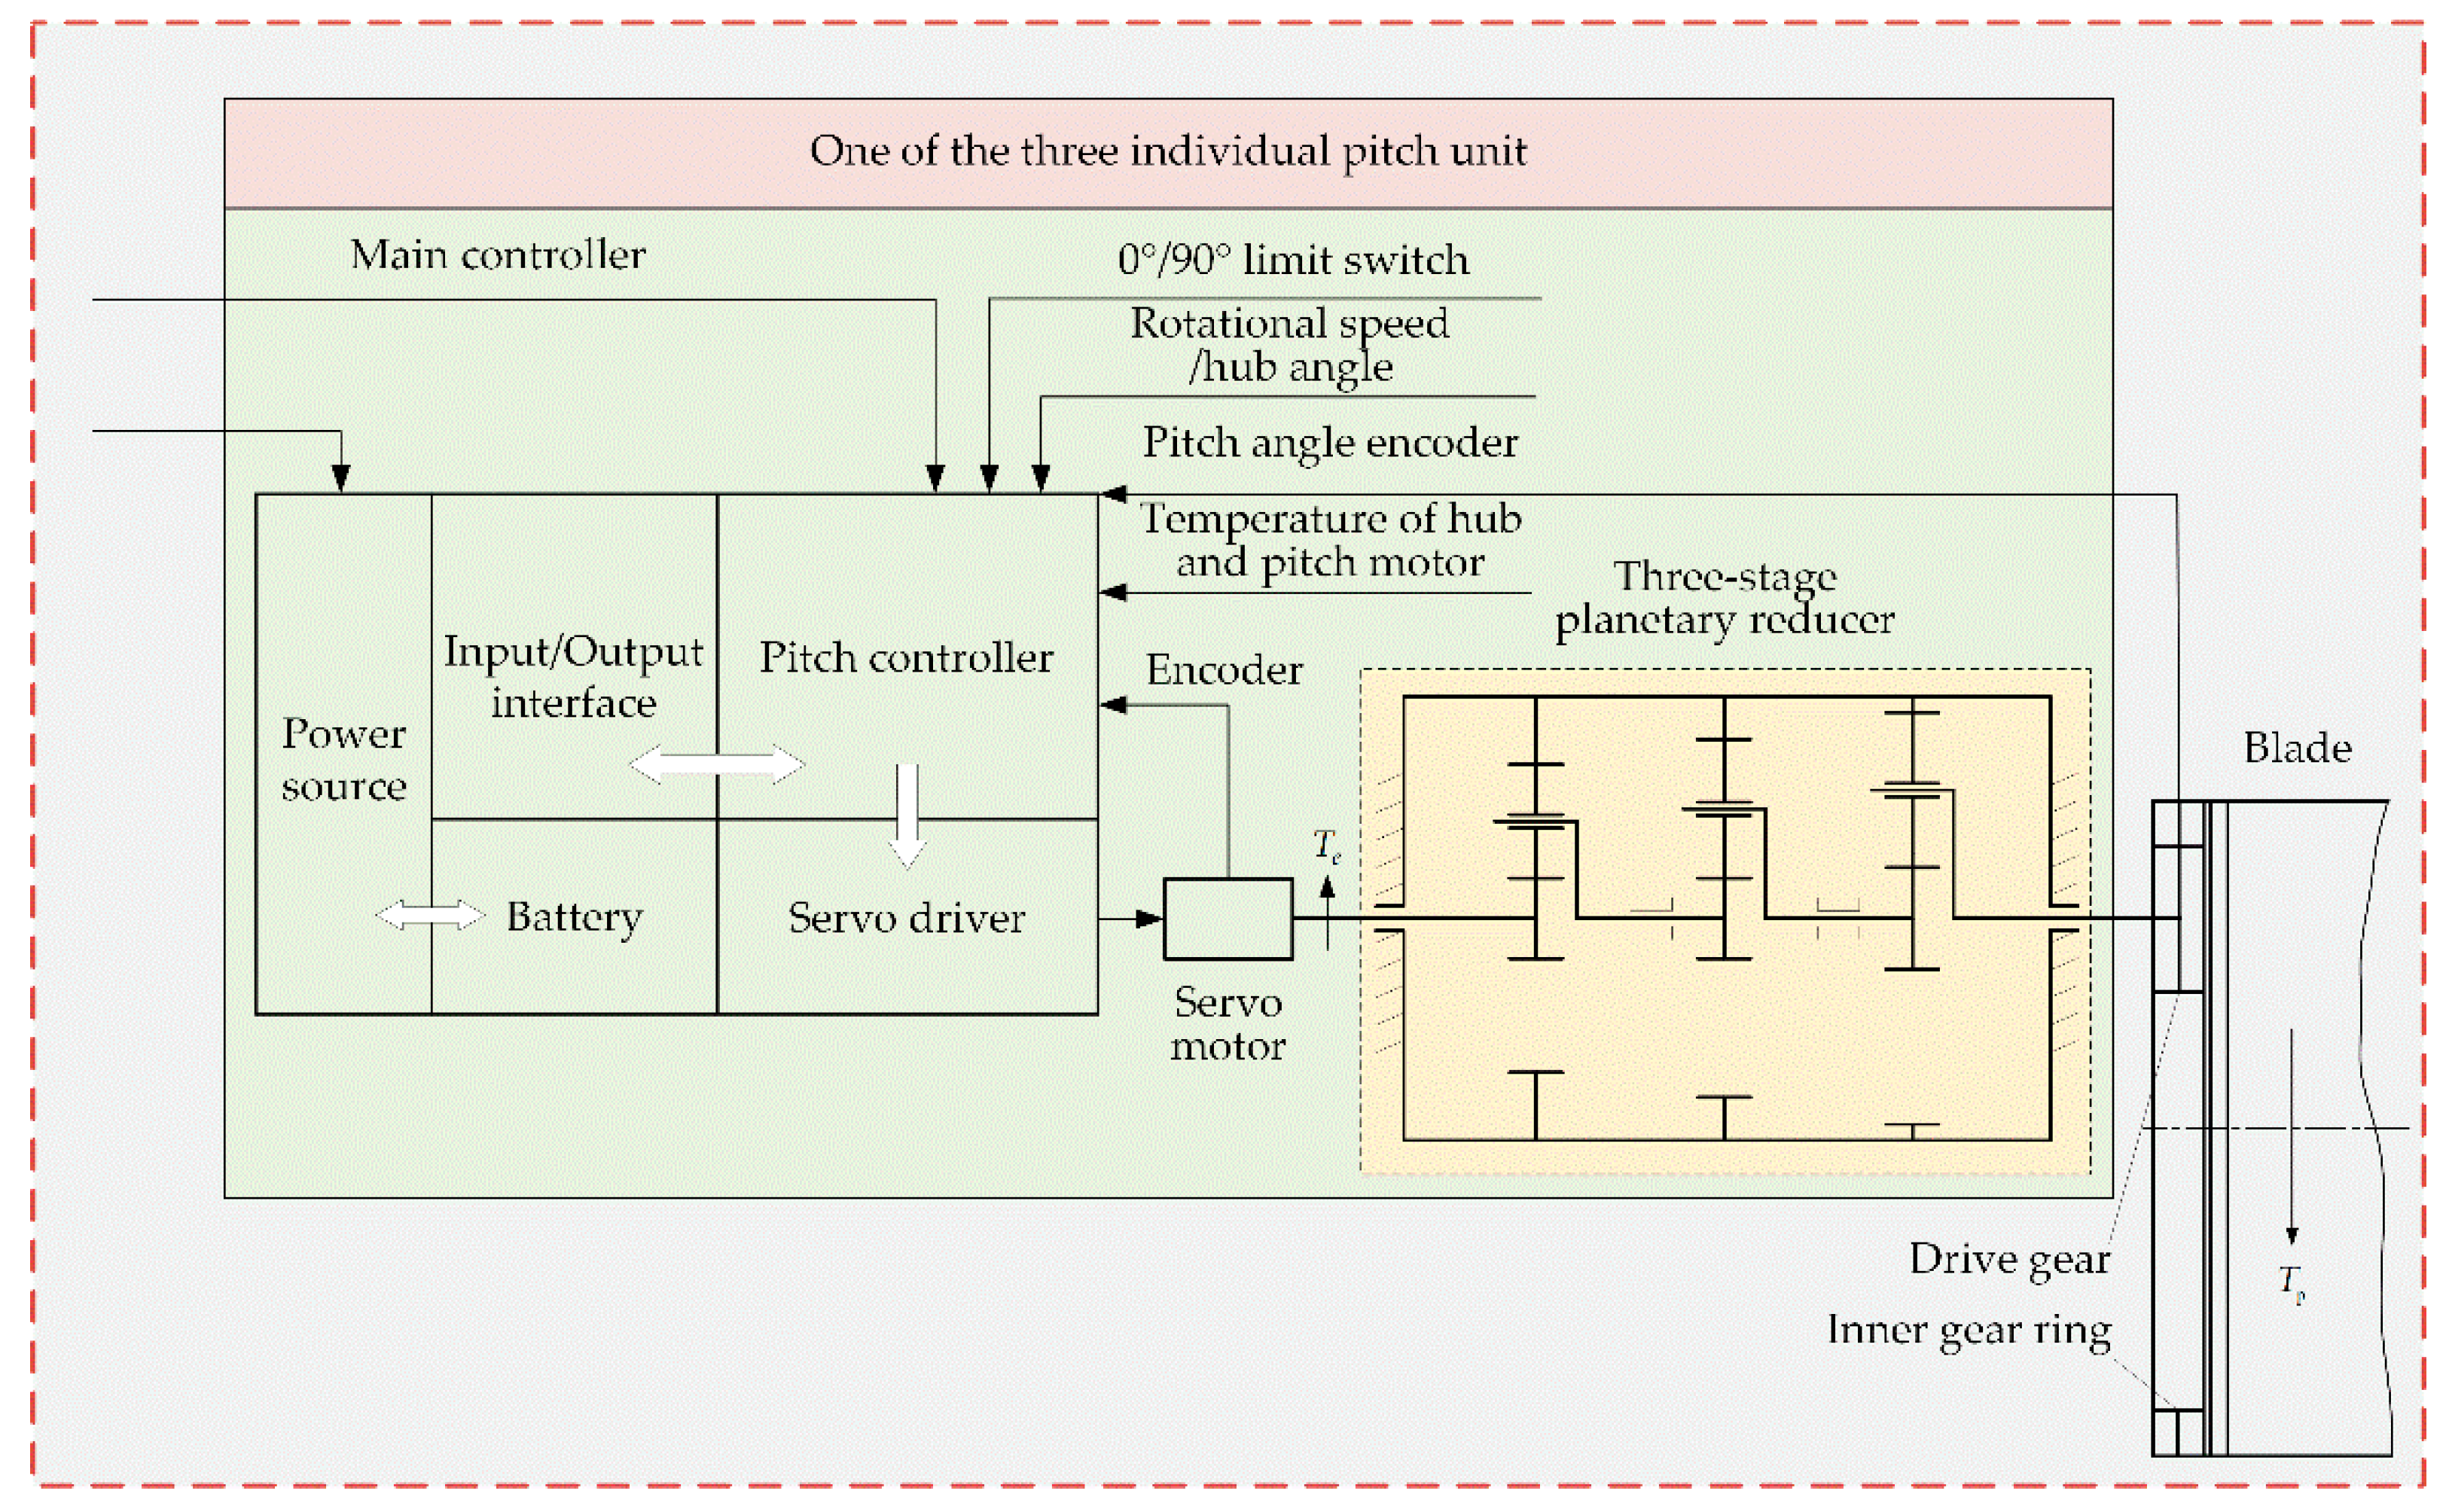
To control the wind energy capture, wind turbines could control the pitch angle, which also changes the load acting on the blade. Theoretically, when the wind speed is lower than the rated wind speed, the pitch mechanism is fixed, and the pitch angle is 0 rad. During this period, the wind turbine runs at the maximum wind energy capture stage by maintaining the optimal tip speed ratio through controlling the rotor speed. When the wind speed is higher than the rated wind speed, the wind turbine starts the pitch mechanism and controls the pitch angle to adapt to the change in wind speed, so that the output power keeps at the rated power level, which is called the constant power operation stage. However, in practice, the start-up of the pitch mechanism is determined by the power of the wind turbine, not the wind speed. Although the wind speed sometimes does not reach the rated wind speed, the pitch mechanism still may have been started.
During the operating of the pitch mechanism, there are two operating states, that is, the increase of the pitch angle and the decrease of the pitch angle. This means that even at the same pitch angle, the wind turbine may be running at different operating states, and the load characteristics may be different under different conditions. To this end, the pitch rate is defined to determine the state of the pitch mechanism. That is:
where,
is the corresponding pitch angle at time
; and
is the data sampling period of the SCADA system.
Considering the fluctuation of the pitch angle in the process of varying pitch, the pitch rate is modified as:
When
satisfies
in Equation (11), the pitch load is considered to be SCADA data with a continuously increasing pitch angle. When
is satisfied, the pitch load is considered to be a SCADA data with a continuously decreasing pitch angle. When
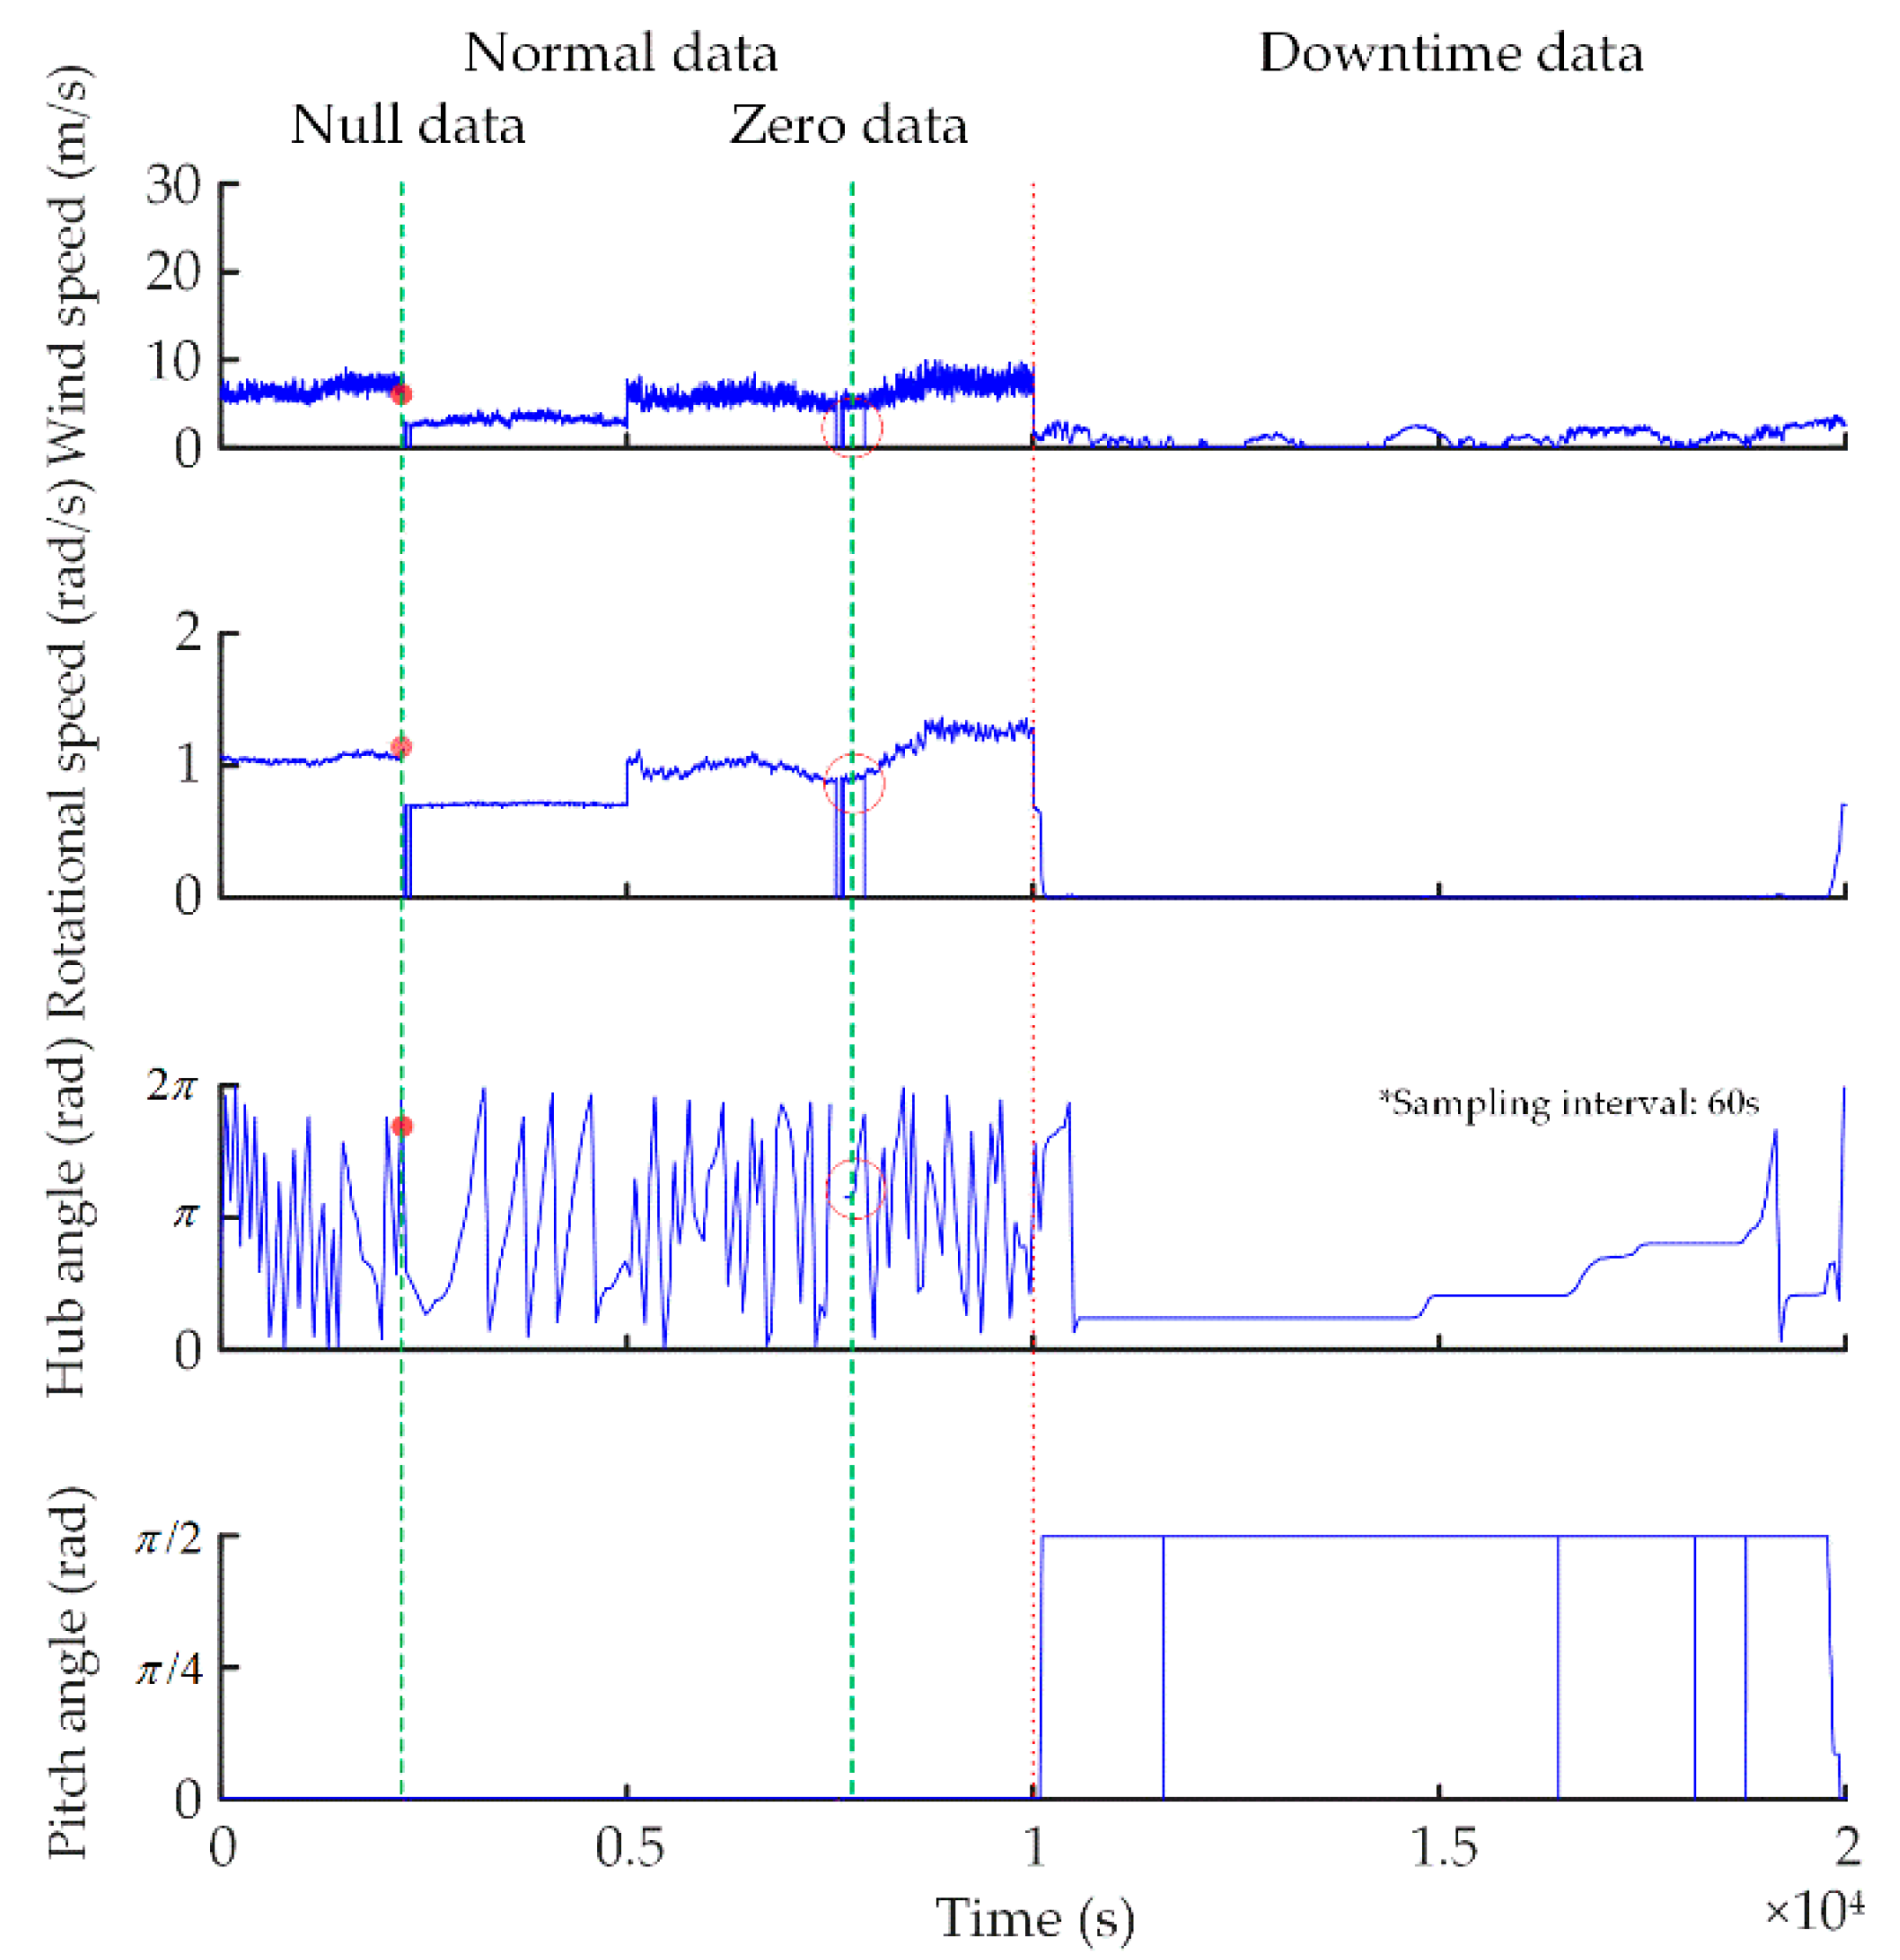
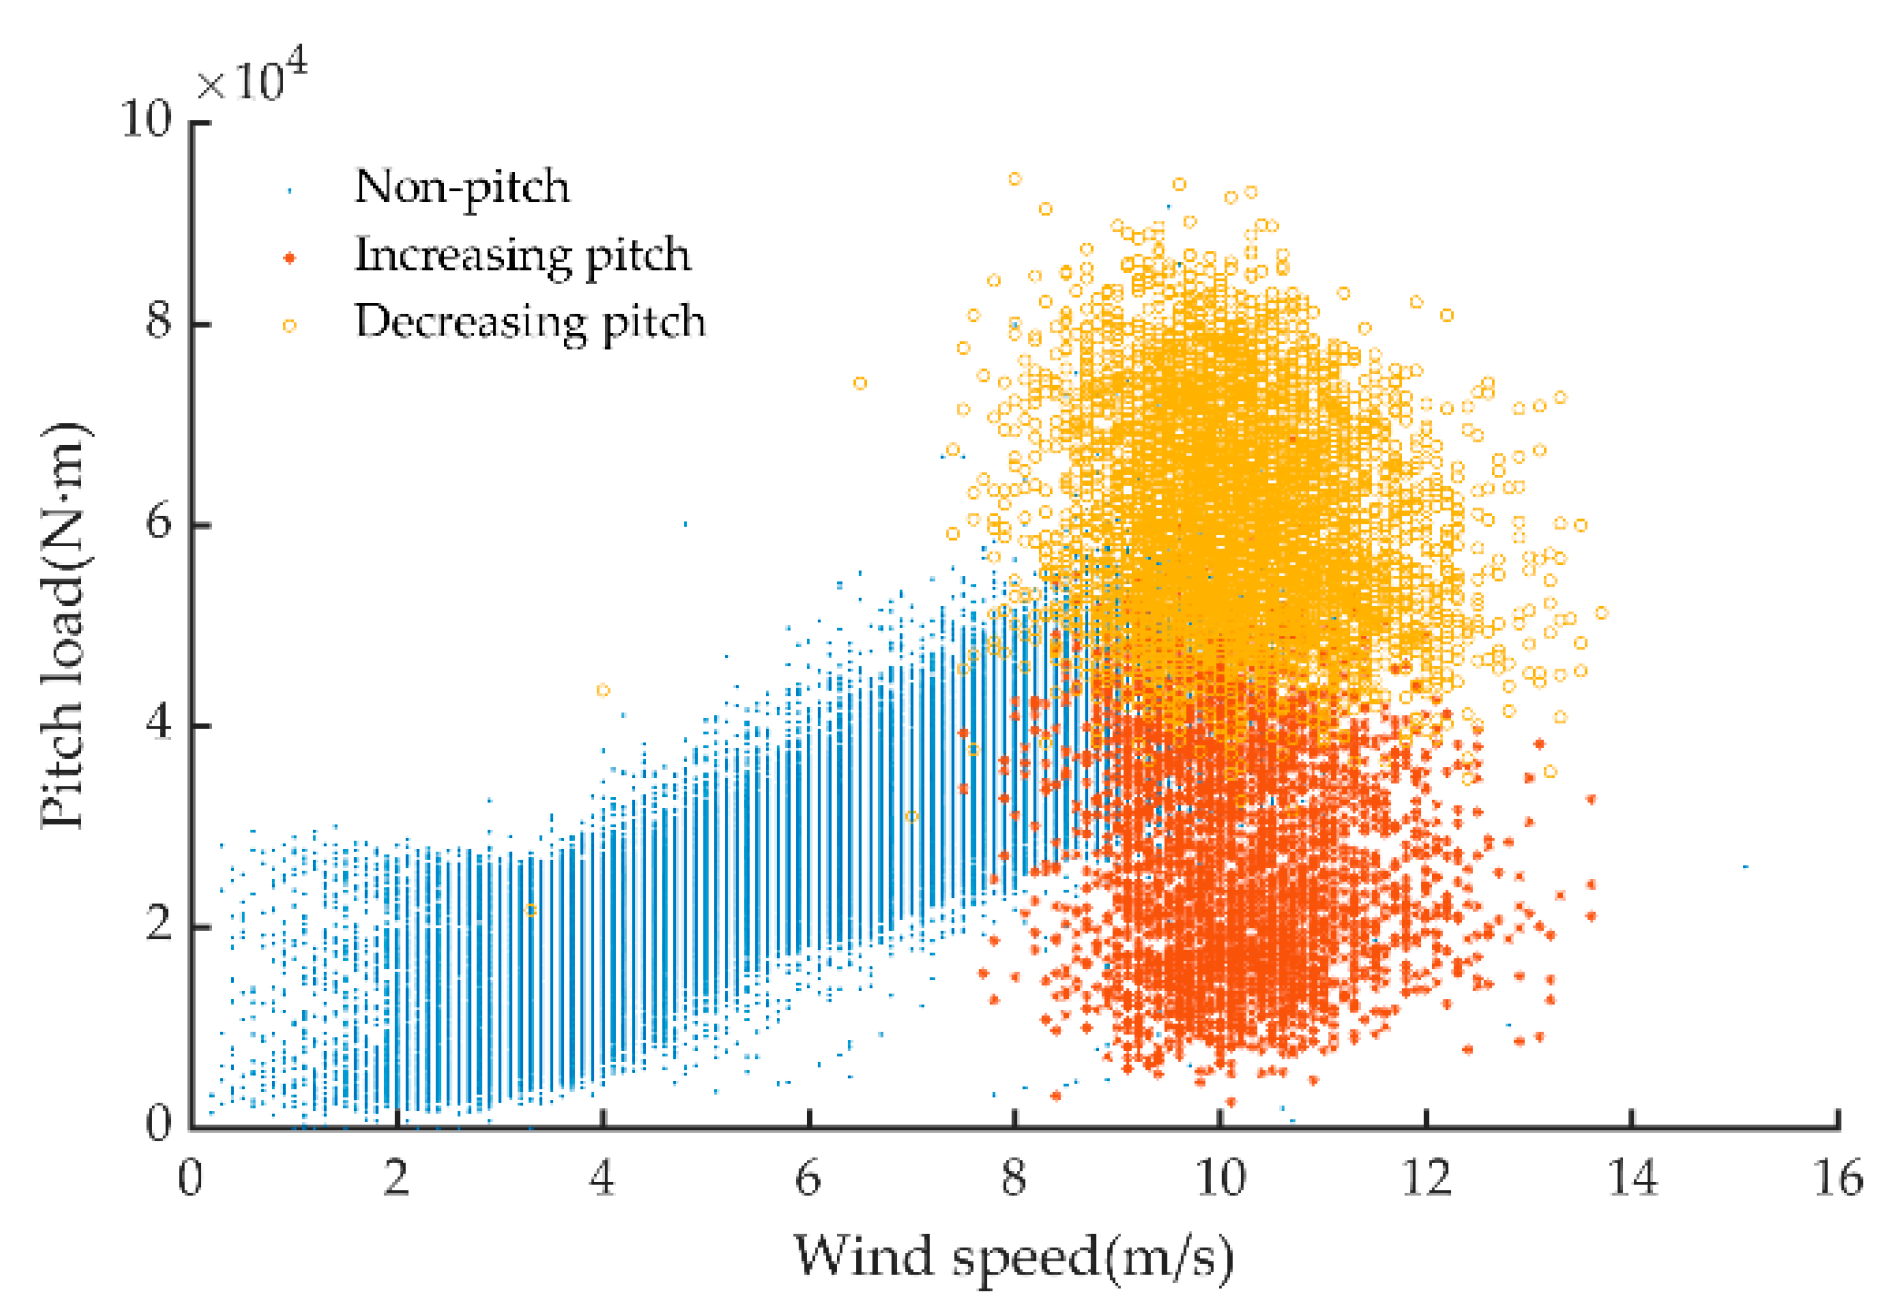
is satisfied, the pitch load is considered to be SCADA data with a constant pitch angle. Therefore, the data set distribution illustrated in
Figure 5 is transformed into that which is illustrated in
Figure 13. It can be seen from
Figure 13 that the data samples with wind speeds greater than 8 m/s correspond to three types: (1) data with a constant pitch angle, which is defined as non-pitch; (2) data during the increase of the pitch angle, which is defined as increasing pitch; (3) data during the decrease of the pitch angle, which is defined as the decreasing pitch. Considering there are more data samples distributed near the rated wind speed, a subset of data samples with a wind speed of 11 m/s and a rotor speed of 1.78 rad/s is extracted, and then four subsets of the rotor angles of 0 rad,
rad,
rad, and
rad are divided from the subset to analyze the influences of pitch angle to the pitch load.
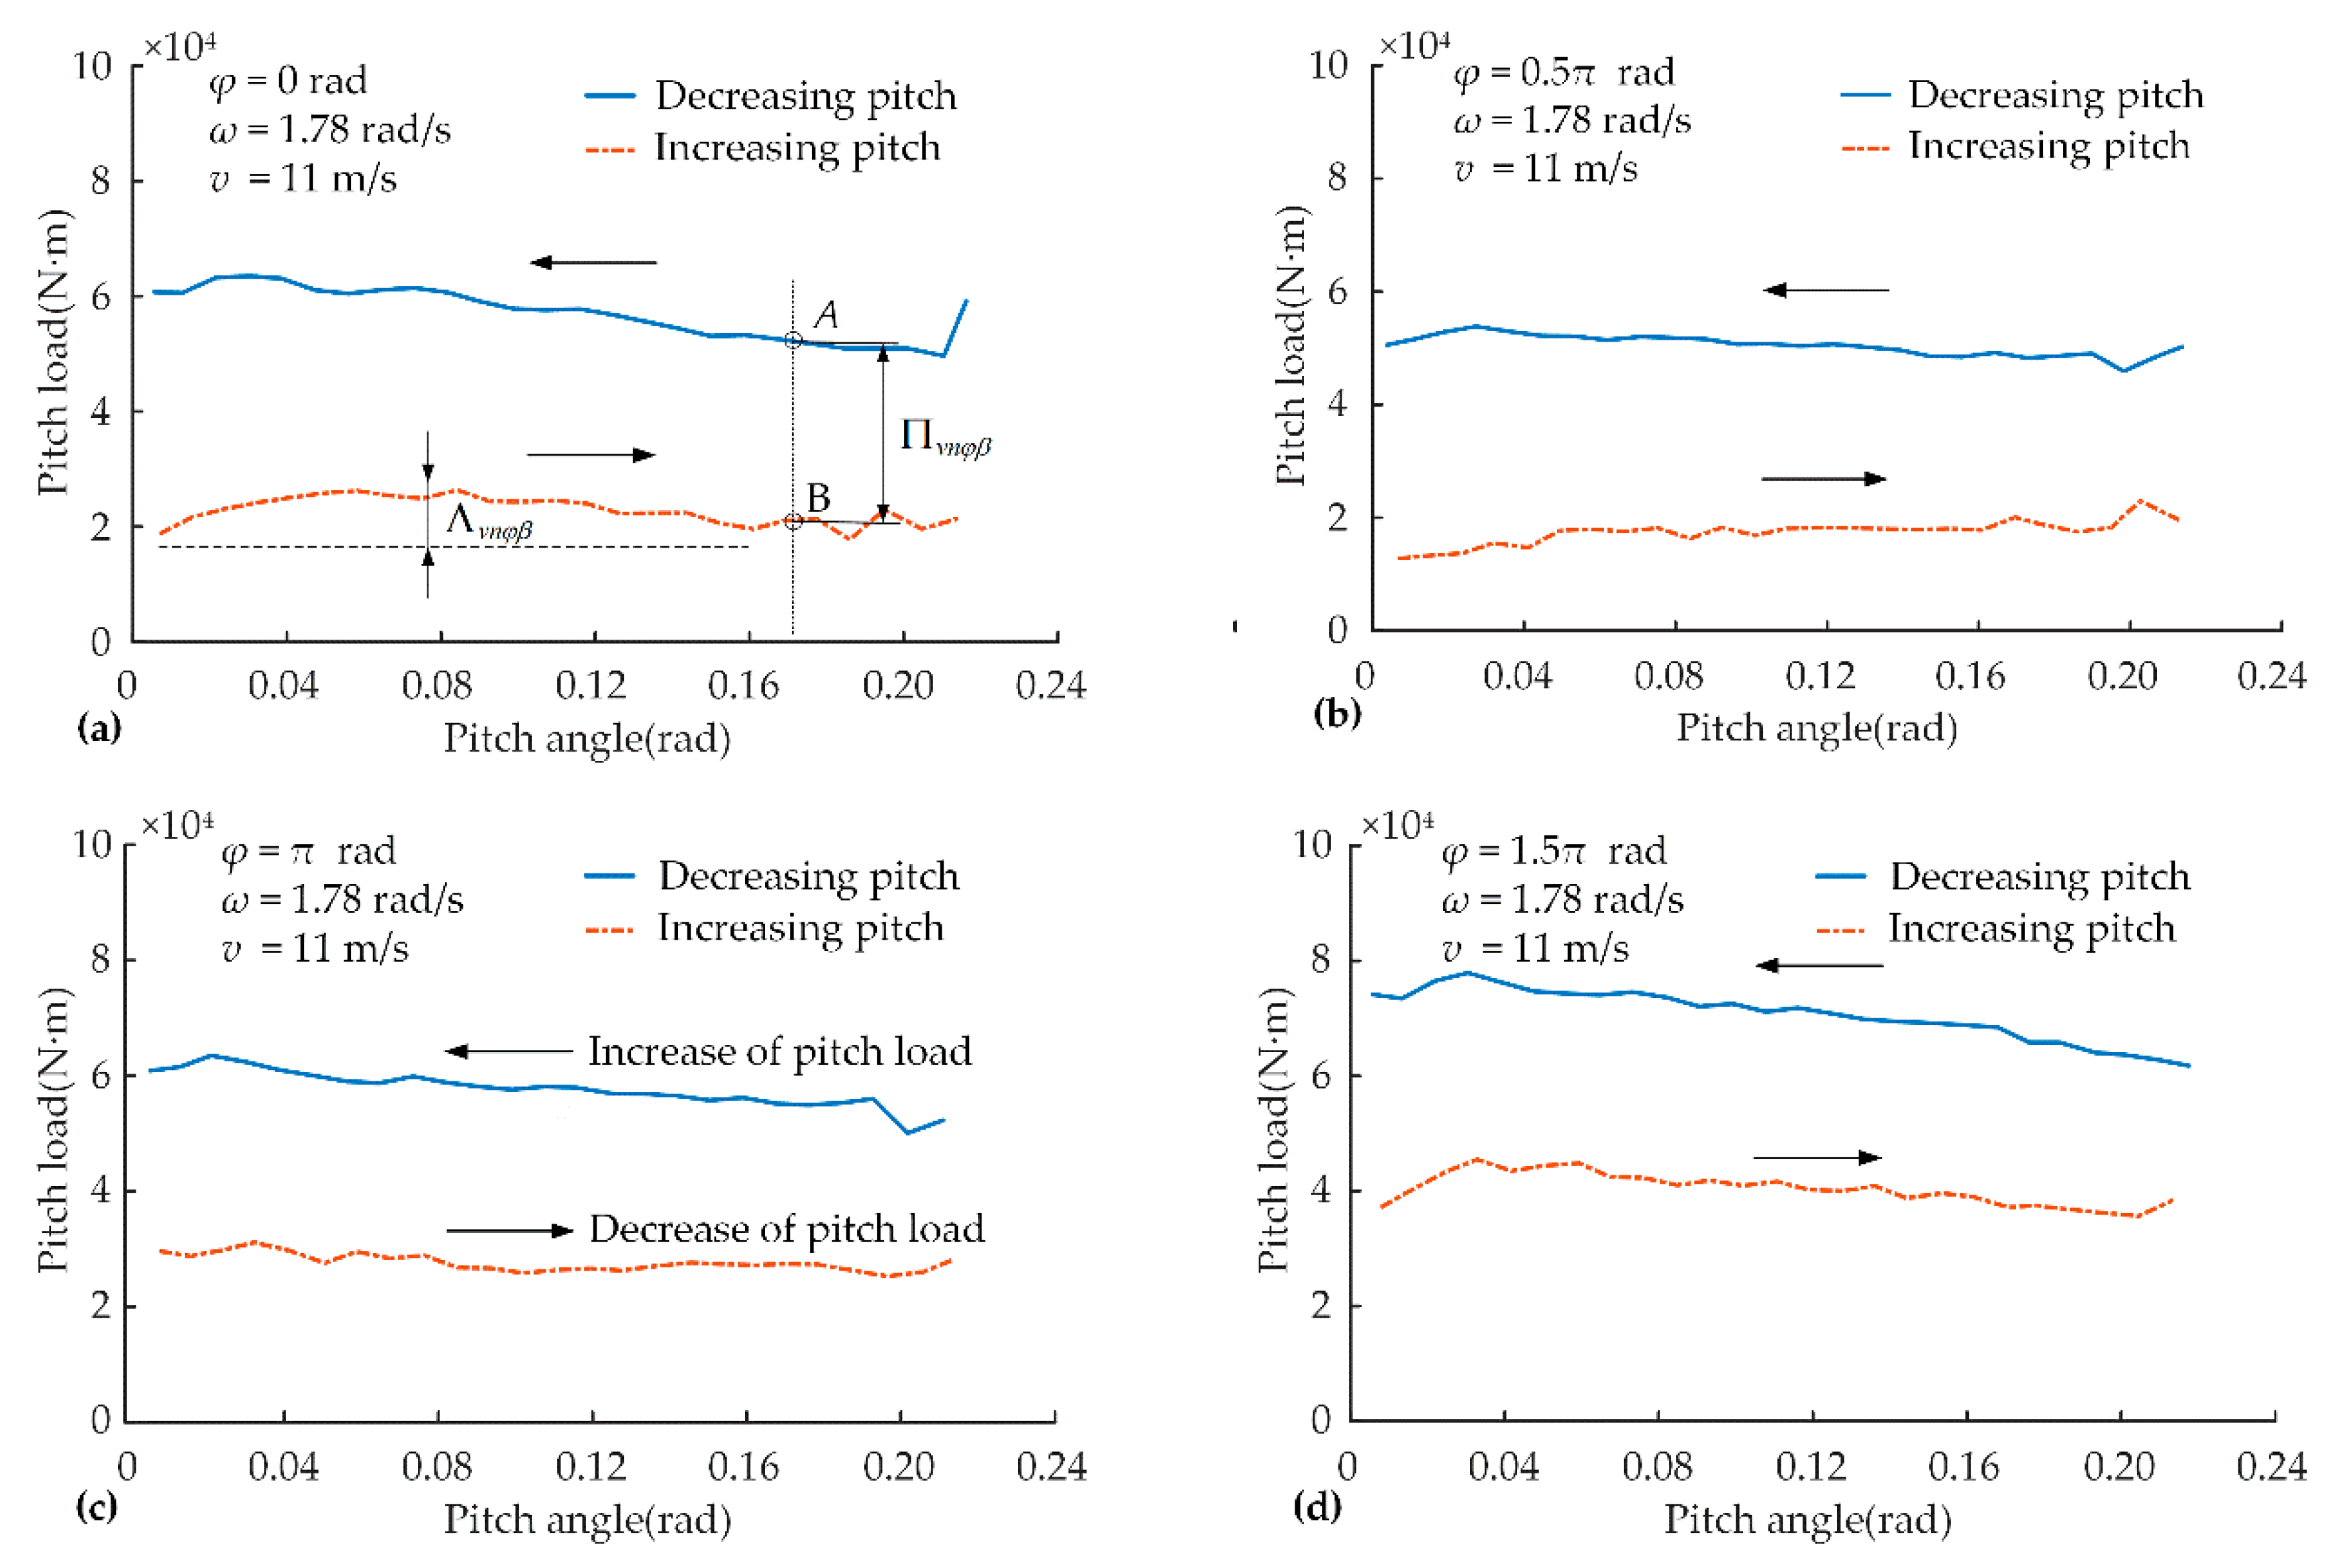
The relationships between the pitch angle and the pitch load are plotted in
Figure 14a,
Figure 14b,
Figure 14c and
Figure 14d, which correspond to the hub angles of 0 rad,
rad,
rad, and
rad, respectively.
Obviously, there is a scattered multivalued relation between the pitch angle and the pitch load. Using the abovementioned KDE method, the data are processed to obtain the single-valued relation between the pitch angle and pitch load. The results are shown in
Figure 15a,
Figure 15b,
Figure 15c and
Figure 15d, respectively.
Figure 14 and
Figure 15 show that under constant wind and rotor speeds, the pitch load generally declines in the increasing pitch status and gradually increases in the decreasing pitch status. From
Figure 15a to
Figure 15d, it is clear that under the same wind speed, rotor speed and hub angle, the pitch load in the increasing pitch status is significantly less than that in the decreasing pitch status. The load fluctuation
marked in
Figure 15a reflects the comprehensive influence of three pitch load components; that is, the aerodynamic-force-induced pitch load, the centrifugal-force-induced pitch load and the gravity-induced pitch load. For points A and B in
Figure 15a, they have the same pitch angle, which means that the pitch load components that are induced by gravity are the same. Meanwhile, the pitch load components induced by the centrifugal force are also the same due to the same rotor speed. Thus, the differences in the pitch load (denoted by
) between points A and B are caused by the difference of the pitch load induced by aerodynamic force. This also illustrates that in the increasing pitch status, the aerodynamic force will push the blade rotation as a motive force. In the decreasing pitch status, the aerodynamic force will block the blade rotation in resistance. Furthermore, under different hub angles, the effects of this kind of “push” or “block” are different.
To quantitatively describe the different
of the pitch load induced by the aerodynamic force in the process of variable pitch, a difference index of the pitch load is proposed. Assuming that under different hub angles, the pitch load dataset with decreasing pitch status is
, while the pitch load data set is
with increasing pitch status. Then,
,
, and
; where
is the sample number of the pitch load dataset when the wind speed is
, the rotor speed is
, and the hub angle is
). The “difference index” is to be expressed as:
where
denotes the “difference index” between the pitch load in the decreasing pitch status and the pitch load in the increasing pitch status under the condition that the wind speed is
, the rotor speed is
and the hub angle is
.
According to Equation (12), and under the condition that wind speed is and the rotor speed is , the difference indexes are , , , and corresponding to the hub angles of 0 rad, rad, rad and rad, respectively. The calculation results show that the difference indexes under different hub angles are small. It also reflects the variation amplitude of the pitch load during the working process of the pitch system. Compared with the maximum wind energy capture stage discussed earlier, the maximum load and variable amplitude of the variable propeller load of the wind turbine in the constant power operation stage was much larger. It was required to pay sufficient attention to the design and maintenance of the pitch mechanism of the wind turbine.


