Abstract
This research investigates the role of new hybrid energy system applications for developing a new plant refurbishment strategy to deploy small scale smart energy systems. This work deals with a dynamic simulation of trans-critical carbon dioxide heat pump application for boosting low temperature distribution networks to share heat for dwellings. Heat pumps provide high temperature heat to use the traditional emission systems. The new plant layout consists of an air source heat pump, four trans-critical carbon dioxide heat pumps (CO2-HPs), photovoltaic arrays, and a combined heat and power (CHP) for both domestic hot water production and electricity to partially drive the heat pumps. Furthermore, electric storage devices adoption has been evaluated. That layout has been compared to the traditional one based on separated generation systems using several energy performance indicators. Additionally, a sensitivity analysis on the primary energy saving, primary fossil energy consumptions, renewable energy fraction and renewable heat, with changes in building power to heat ratios, has been carried out. Obtained results highlighted that using the hybrid system with storage device it is possible to get a saving of 50% approximately. Consequently, CO2-HPs and hybrid systems adoption could be a viable option to achieve Near Zero Energy Building (NZEB) qualification.
1. Introduction
Nowadays, the environmental externalities of the energy systems and the conscious use of energy resources constitutes an important political debate issue, thanks also to the European Union directives. In particular, atmospheric pollution, greenhouse gas (GHG) emissions, related climatic variations and increasingly frequency of environmental disasters are making necessary new preventive and recovery measures. Considering that the building sector is responsible for a large part of the global energy consumption and the CO2 emissions, building envelope adaptation actions allow reducinng the energy demand of existing buildings by improving their energy performance [1]. In this framework, increasing the energy efficiency of existing buildings is a great challenge to face, investigating the best measures to match the restrictive regulations targets and the architectural limitations [2]. Indeed, some studies are ongoing to find innovative plant engineering solutions at a technological level, based on the study of efficient materials [3] and the newest energy generation systems [4,5,6,7]. According to several studies, the payback period of this kind of interventions is up to 25–30 years [8,9]. The renewable energy integration is not always possible because of landscaping or urban constraints [10,11] even if the plant is technically feasible. For this reason, an alternative solution could be the implementation of new heating and electricity facilities [12]. This research aims to mediate between the potential role of hybrid energy systems and the heating share concept [13,14] providing electricity and heat to overcome such limitations. In addition, focusing the research attention only to the energy generation efficiency, the possibility to design a new plant refurbishment strategy has been investigated in order to promote the use of small-scale smart energy systems. As a consequence, that approach can positively contribute to achieve the NZEB qualification due to the CO2 emissions reduction [15,16,17] over the consumption process. For that reason, the adoption of a hybrid energy system capable of combining fossil fuel with renewable energy sources [18,19,20] can be considered as a valuable solution for primary energy savings in existing buildings. It is noteworthy how hybrid systems based on CHP and heat pumps have recently been considered in the literature, as a potential option for balancing the renewable source intermittency, especially in all those locations where large district heating networks have been developed [21]. Having accounted for those technologies, the authors propose the synergy between the high temperature and low temperature heating production devices along with electric renewables. In so doing, a foreseeable modification in the common operation of trans-critical CO2 heat pumps has been conceptualized so as to boost the low temperature distribution network for dwellings. That heat pumps typology has widely investigated by several authors especially in the field of refrigeration [22,23,24,25,26,27,28,29,30]. Typical applications consist of contemporary generation of heat and cool or for air conditioning. Indeed, some authors have proposed modifying some operating parameters in order to increase the evaporating temperature in the trans-critical cycles [31]
In the end, this project shows how it is possible to share the heat for a small group of buildings through the use of an innovative hybrid energy system. Moreover, it has been compared with the traditional energy production system, pinpointing advantages and disadvantages.
2. Methods
Although solar panels, cogenerators (CHP) and heat pumps are considered some of the most efficient energy solutions [32], the widest adopted appliances for heating purpose, in natural gas based-countries, such as Italy, are NG boilers. The typical separated generation system has been compared with the novel option based on the plant hybridization for generating electricity and high temperature heat anyhow (i.e., for water supply temperature equals to 65 °C or 70 °C). Specifically, it is important to highlight that the dwellings are not provided with fan coils or radiant floors to manage thermal loads over the winter and the summer time; indeed, the aim of the paper is to investigate on the feasible innovative solutions to upgrade existing buildings using the high temperature emission systems.
A group of four buildings, where the power plant is a combination of an air source heat pump (35 kWt), a micro CHP (6 kWe–10 kWt), four trans-critical CO2 electric heat pumps (CO2-HPs of 12.5 kWt) and PV arrays (7 kWp), has been analyzed as a reference building layout. The usable surface is about 170 m2 for each building arranged on two floors. The distribution network has been designed in a central position in order to reduce the heat losses and improve its performance. In addition, two buildings have been equipped with photovoltaic panels integrated on the roof. The traditional heat pump has been installed to provide and distribute low temperature hot water, about 35 °C, by means of the hydraulic water loop representing the shared cold heat sink for the CO2-HPs. Notwithstanding, the air source heat pump could be replaced with a ground source one, a sea water heat pump or other low temperature heat pumps to produce low temperature heat, depending on the location as well as the local sources availability. That ensures the interconnection of the four buildings by a hydraulic loop in a small-scale heating network. Consequently, are CO2-HPs driven by shared heat sink while the electricity is generated by PV arrays and CHP. As a result, the CHP can provide domestic hot water (DHW) 24 h a day. Yang et al. [33] successfully implemented a trans-critical CO2 heat pump model showing how to improve the system performance decreasing the distribution network temperature within pipes and increasing the mass flow rate of cooling water, reducing at the same time the optimal heat rejections pressure and obtaining the maximum COP. The current research mainly focuses on the implementation of a smart energy system based on the employment of trans-critical CO2 heat pumps, as reported in the Figure 1.
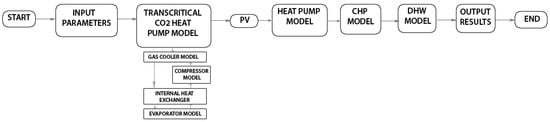
Figure 1.
Flowchart for the hybrid energy system model.
The first part of the research has been focused on the review of scientific literature of the research topic. Smart energy systems are integrated with more sectors (electricity, heating, cooling, industry, buildings and transportation), allowing the identification of more suitable solutions to make possible the transformation into renewable and sustainable energy systems [34].
2.1. Description of the Case Study
The case study consists in a residential complex of four buildings arranged in a single lot, each of them at the same distance. The energy generation system is placed centrally providing the equal distributions of the fluid so as to minimize the head losses. The plan of the examined lot is reported in Figure 2.
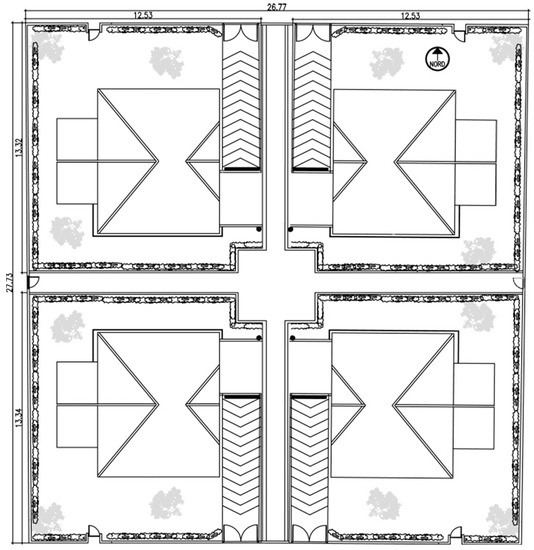
Figure 2.
Plan of the examined four residential dwellings.
Each building consists of two levels (ground floor and basement) and is characterized by a usable area of 170 m2. The basement includes one guest room, one bathroom, the hall and an outdoor garage. The internal staircase leads to the upper floor where the master bedrooms, the kitchen and a bathroom are located. Figure 3 respectively show the ground floor and the basement layout of each building, while geometrical data are reported in Table 1.
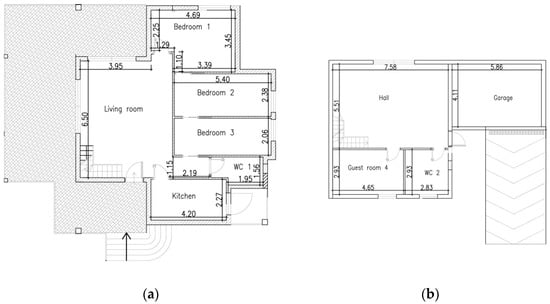
Figure 3.
Level of examined buildings: (a) ground floor plan and (b) basement plan of each residential dwelling.

Table 1.
Geometrical data of the dwellings’ inner spaces.
Building thermal loads have been calculated according to the procedures of the Italian law 10/91 by the certified software of the Italian Thermo-technical Committee (CTI), an entity federated with UNI. It has the purpose of unifying activities and procedures in the different thermo-technical sectors according to the current regulatory framework. These calculation tools have to ensure that the values of energy performance index have a maximum deviation of 5% compared to the established parameters. Table 2 summarizes the geometrical data for the energy analysis of the dwellings ground floor and basement, respectively.
Table 2.
Ground floor and basement geometrical data.
2.2. Matlab Simulink Analysis
All the hybrid system components have been implemented and simulated by MATLAB SIMULINK (version R2018) and each energy scenario has been analysed on the basis of four different energy indicators: Primary energy consumption (PEC), primary energy saving (PES), renewable energy fraction (fRES) and renewable heat delivered to the end-user. Finally, a sensitivity analysis varying the building’s power to heat ratio (see Equation (20)) values, from 0.1 up to 0.8, has been performed. Assembling each simplified mathematical model related to the energy generators (i.e., the traditional heat pump, the trans-critical CO2 electric heat pump, CHP and PV array) along with the resulting building energy needs, the hybrid system energy performance have been determined and discussed. The sensitivity analysis allowed to assess how the energy performance indicators are affected by the boundary conditions changes when those ones ranges in ±15%.
2.3. Mathematical modelling
The innovative plant layout associated to the hybrid energy system consists of four trans-critical CO2 electric heat pumps (CO2-HP), to produce high temperature hot water to feed traditional building heating systems: Thus, an air source heat pump for low temperature water production has been connected in order to keep under control the water temperature difference flowing through the CO2-HPs cold heat sinks; lastly a micro CHP has been integrated so as to provide domestic hot water and electricity for the HPs driving along with PV arrays, as shown in Figure 4.
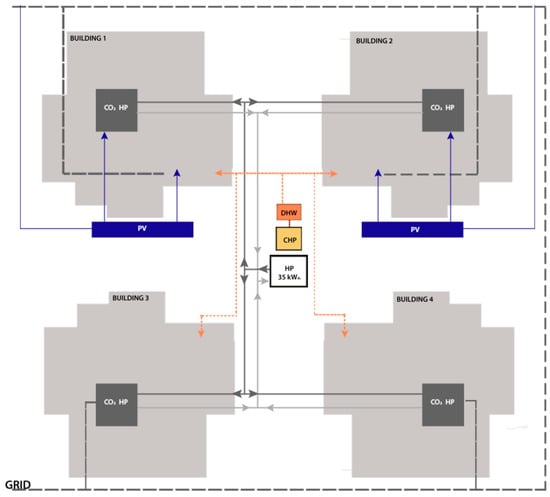
Figure 4.
Hybrid energy system layout.
Thanks to the physical properties of carbon dioxide, the CO2 HPs coefficient of performance can achieve v high values owing to its good heat transmission properties and the possibility to use small compressors [35]. In any case, the global warming footprint of the heat pump, depending on refrigerant leakage to the environment, and the footprint of electric power or steam used for the compressor are not considered in the present analysis. This is due to the fact that the project aim is to evaluate the achievable energy saving hailing from the adoption of such a hybridised power plant.
Having said this, it is worth noticing that there are three main factors requiring special attention when CO2 is used as a working fluid [36,37,38]: the first concerns the high operating pressure, exceeding 73.75 bar; the second is the low critical temperature, since the carbon dioxide reaches its critical point at a temperature of 31 °C; lastly, it should be considered that the refrigerants could leak and need refilling, in this case using CO2 quite often derived from fossil sources.
Furthermore, compared to other refrigerants, carbon dioxide requires a carefully designed system to cope with its peculiar temperature and pressure characteristics. The costs of production and distribution of CO2 systems are relatively low compared to other refrigerants, since its use is not subject to patents and consequently is not limited; moreover, it is a non-toxic and non-flammable substance, that makes its use safe. CO2 cycles must be carefully studied because, given its characteristics, it is not assimilated to traditional cycles. Although the above cited experiments are useful and provide valuable data, evaluation times and instrumentation costs present an ever-present obstacle to research. Therefore, more immediate approaches based on numerical simulations have been used [36,37]. Using thermodynamic analyses and the study of the transport characteristics of the refrigerant and the secondary fluid, it was possible to mathematically model the trans-critical carbon dioxide heat pump. The CO2 HP simplified model has been built within the MATLAB (R2018) environment implementing the energy balance equation related to the following five components: the vapour compressor, the gas cooler, the evaporator, the expansion valve and the internal heat exchanger. As can be seen both in the pressure-enthalpy diagram (Figure 5) and in Table 3, the design pressure reaches 150 bar inside the gas cooler and the 70 bar inside the evaporator, with a calculated compression ratio (p2/p1) equal to 2.143. The gas temperature drops down from 134.2 °C to 60.85 °C in the gas cooler, then from 60.85 to 33. 67 in the internal heat exchanger, and it reaches a value of 28.67 °C in the evaporator.
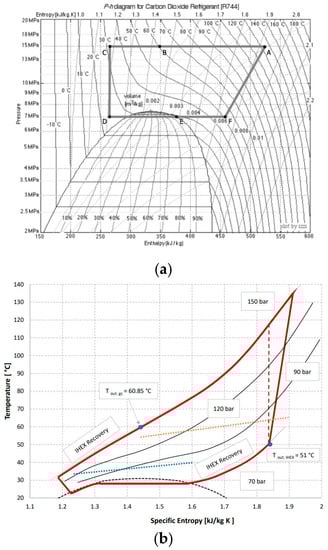
Figure 5.
(a) P-h diagram carbon dioxide refrigerant [R744] and (b) T-S diagram (A: Inlet gas cooler; B: Inlet internal heat exchanger; C: Throttle valve; D: Inlet evaporator; E: Inlet internal heat exchanger; F: Inlet compressor).
Table 3.
Transcritical CO2 heat pump parameters.
The efficiency of the heat pumps is measured by the coefficient of performance (COP) given by the ratio between the useful energy (heat transferred to the environment to be heated) and the electricity consumed. The COP of the CO2-HPs is around 3.6 and is influenced by various operating variables, such as the chilled water outlet temperature or the carbon dioxide outlet temperature from the gas cooler.
2.4. Trans-Critical CO2 HP Energy Balance
The initial temperature difference has been assumed and in Figure 6 the general scheme of the considered system is reported.
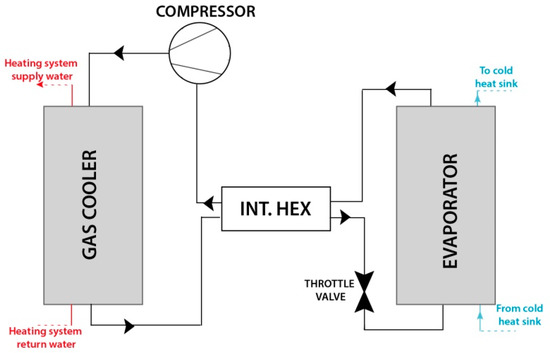
Figure 6.
Transcritical CO2 heat pump layout.
2.4.1. Gas Cooler
Designing a gas cooler is quite hard due to its differences with the traditional condenser. The maximum working pressure is 150 bar and the working temperature is limited to 134.2 °C. Another problem that can be found in a CO2 system is the high influence of the outlet temperature of the gas cooler on the system efficiency (COP). Indeed, as that temperature increases, the discharging pressure has to be enhanced according to Sarkar et al. [39]. Yet, that enhancement penalise strongly the HP coefficient of performance due to the higher mechanical power required by compressor. To overcome that drawback the evaporating temperature has been increased in order to recover low temperature thermal cascade:
Tout + DTdes = Tin,gc
Tin + DTdes = Tout,gc
hin,gc − hout,gc = Dhgc
2.4.2. Compressor
The natural CO2 refrigerant provides two features: the high working pressure and differential pressure; these pressure levels are four up to 10 times higher than HFC refrigerants. Two factors have been considered when developing CO2 compressors: the high efficiency and the resistance to high working pressure, because of the pressure difference that goes from 70 to 150 bar in the trans-critical CO2 system examined. The thermodynamic equations are shown below:
hout,comp − hin,com = Dhcom
2.4.3. Evaporator
Energy balance equations for the evaporator and the internal heat exchanger read as follows:
Lh + Dhsub = Dhev
2.4.4. Internal Heat Exchanger
h(Treg) − h(Tev) = Dhreg
Dhreg + hout,IHEX = hout,gc
Tev,CO2 + DTcold,reg = Tout,IHEX
2.5. CHP and Boiler Models
Internal combustion engine has been considered as the reference technology for CHP applications. The energy model of that component is based on the fundamental relations of the first law of thermodynamics. Specifically, once the CHP electric size, the electric efficiency, as well as the heat recovery efficiency of the engine, have been fixed, it is possible to calculate thermal output and fuel consumptions. Additionally, using a MATLAB look-up table tool, the electric efficiency curve typical for small CHPs has been implemented. In such a way, it is possible to evaluate all the energy outputs when the CHP runs in partial load conditions. Having said, the CHP control strategy for the DHW production is the so-called thermal tracking. In detail, keeping under control the hot water temperature, the control unit decreases the engine rotational speed up to the shootdown. In this way, both electrical and thermal power can be modulated. To do so, a linear controller has been implemented in MATLAB. Similarly, the same approach has been used for the conventional boiler. Indeed, the efficiency curve has been created by the look-up table tool and the same strategy has been applied for the reference scenario. As regard the CHP electrical and heat recovery efficiencies values, they have been assumed equal to 0.29 and 0.51, respectively, at rated power output. On the other hand, the conventional boiler thermal efficiency has been fixed as 0.85.
2.6. Balance Equations
As aforementioned, the new plant design allows the four building HPs to share a cold heat sink (35–40 °C) where the low-grade heat is produced by the traditional HP characterised by a SCOP (Seasonal COP) equal to 3.5. In so doing, CO2-HPs are driven by the shared heat sink and the electricity is powered by PV arrays and CHP. Specifically, the two southern buildings are equipped with photovoltaic panels for an overall peak power of 7 kW and the CHP is able to supply DHW with the employment of a hot thermal storage. The following balance equations have been considered to analyse the first system:
2.6.1. Electric Balance
Eel,Build + Eel,HP = Eel,CHP + Eel,PV + Eel,Grid + Eel,Excess
2.6.2. Heat Balance
EH,Build + EDHW = EH,HPCO2 + EDHW,CHP
Referring to Equation (16), the electrical energy Eel,HP includes the energy needs for driving both the air source and transcritical carbon dioxide heat pumps. According to the NZEB concept, all the hybrid systems components should be studied on the basis of four principles such as: primary energy consumption (PEC), primary energy saving (PES), renewable energy fraction (fRES) and renewable heat delivered to end-users. Since the PTHR is a key role parameter in terms of defining the most effective sizing process, the sensitivity analysis was realized by varying that value in a wide range (0.1–0.8). The PES is the result of the difference between the PEC by the reference system and the energy consumed by the hybrid system. These values are estimated as it follows:
The research analyses in addition a traditional system that employs a boiler for the heat and domestic hot water production. The related equations are shown below.
Eel,Build = Eel,Grid
EH,Build = EH,Boiler + EH,BoilerDHW
Once the reference values have been computed, the performance indicators related to the hybrid system have been calculated and compared. Finally, the base scenarios have been compared each other when the building PTHR changes so as to perform the sensitivity analysis.
2.7. Network Heat Losses
A fluid flowing through a pipe causes head losses (e.g., pressure drops due to the internal friction between pipe inner layer and fluid). The head losses are in turn divided into two categories: distributed and concentrated. The first are distributed everywhere in the pipes, while the concentrated head losses are located in a defined point and are due to obstacles such as a tap, a branch, an elbow. The equations used for calculating the networks head losses are listed below:
G = flow [L/h]
D = diameter [mm]
The x factor depends on the form of the localized loss and can be determined with appropriate formulas or with laboratory tests. As regards the heat losses along the distribution network, they are strongly dependent on the average operating temperature, pipe materials as well as on the insulation materials and their thickness. As it is well known, the lower the operating temperature the lower the energy losses are. For that reason, the additional aim of this study is to evaluate the potential benefits associated the novel plant layout adoption. To perform simulations, all of the supply and return pipes have been assumed as buried (Figure 7). As a consequence, a dedicated calculation model has been used according to Equations (28)–(34). Since the distribution network is not extensive the same diameter for both supply and return pipes has been assumed. In the end, the total dispersions of both plant layouts have been calculated and compared each other.
where α is a convective heat exchange coefficient, is the pipes thermal conductivity, is the insulation thermal conductivity, is the waterproof case thermal conductivity, ground thermal conductivity, H is the depth of laying, is the equivalent thermal resistance, C is the distance of laying. The values of thermal power dissipated per unit of length can therefore be identified as qf for the supply line and qr for the return line, both expressed in W/m and calculated according to Equations (32)–(34):
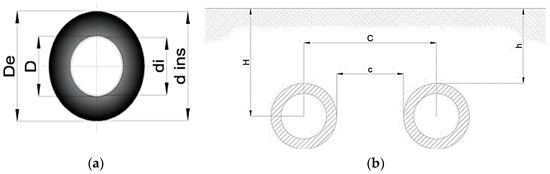
Figure 7.
(a) Pipes Diameters; D = Pipe external diameter; di = Pipe internal diameter; De = Waterproof case external diameter; d ins = Insulating external diameter, (b) Pipes position.
Thus, the pipes dimensional parameters for the distribution networks have been outlined in Table 4.
Table 4.
Pipe diameter and insulation.
The feeding pump mechanical power to offset the pressure drops has been calculated on the basis of the head losses related to the maximum water mass flow rate. That condition typically occurs when the building thermal loads are the highest. The plant partial load operation is ensured by the use of an electronic pump with variable rotational speed characterised by a flow rate equal to 12 /h and the hydraulic head of 11 m. The DAB EVOPLUS SMALL-B 120/220.32 M [40] datasheet and the characteristic curve have been assumed as references for calculations
3. Results and Discussion
A parametric study has been carried out to investigate the response of the trans-critical CO2 cycle during different operating conditions and how the hybrid system is influenced by it, if compared to a NZEB building’s perspective. In this section the main findings derived from calculations have been presented and discussed. Considering the hybrid system, the total thermal energy has been estimated by the sum of four CO2 heat pumps, a CHP and a traditional HP energy. The total system efficiency associated to the fossil fuel use is 0.8466, considering the electricity bought from the national grid and the electricity sold due to the employment of PV panels and micro CHP. The electrical demand and the electricity excess profiles are reported in Figure 8. According to the electric energy balance Equation (16), the electricity excess is reported with negative values in Figure 9 since that energy has discharged into the grid. Basically, all of electric consumptions have been considered positive values, while are negative the unbalanced electric power which is released out of the energy system. Furthermore, when net metering option is implemented, that energy could be managed to reduce the levelized cost of electricity by selling it to local utilities. Alternatively, by installing batteries bank it could be stored for a time-shifted use.
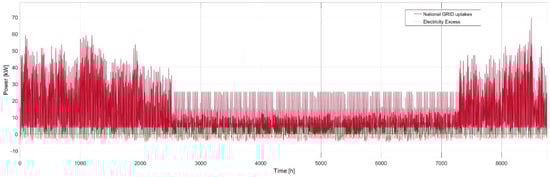
Figure 8.
Electrical demand and electricity excess (in red the amount of energy purchased in one year and in green the energy produced).
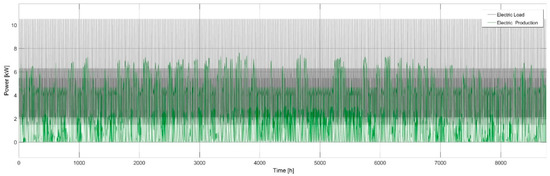
Figure 9.
Electric load vs PV electricity production.
The PV panels power output profile as well as and the overall buildings electric load are superimposed on the same chart as shown in Figure 9.
The whole energy of the hybrid system, sorted by typology, is summarized in Figure 10a, while Figure 10b shows the electric, heat and DHW demand of the traditional energy system.
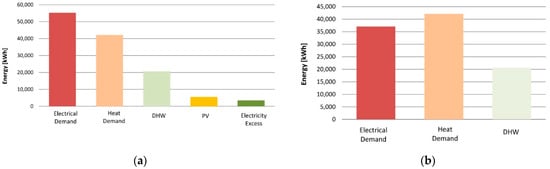
Figure 10.
Total energy produced in the hybrid energy system (a) and in the traditional energy system (b).
The global efficiency has been estimated considering the performance indicators as detailed before. Comparing the energy scenarios, it emerges how the hybridisation lead to better performance resulting in the First Law Efficiency, based on the fossil fuel use, equal to 0.5528 and 0.8395 for traditional energy system and the hybrid one, respectively. The further energy performance indicators have been summarised in Table 5 and Table 6.
Table 5.
Comparison between hybrid and traditional systems.
Table 6.
Heat Transcritical hybrid and traditional systems performance indicators.
The simulation outcomes confirmed that the efficiency is higher in the hybrid system, demonstrating that NZEB target is more difficult to achieve with fossil fuels. Indeed, electricity employment is eased with the hybrid system rather than fossil fuels (e.g., heat pumps against fossil fuels boilers); in addition, renewable energy ratio is not close to zero because it includes off-site energy produced by renewable sources [41]. In detail, the heating efficiency is calculated as the ratio between the total heat produced and the primary fossil energy. For that reason, the heating efficiency is higher than 1.
Finally, the sensitivity analysis has been carried out changing both electric and thermal loads of −15% and +15%, so as to modify the building PTHR, as reported in Figure 11 and Figure 12, together with the evaluated performance indicators.
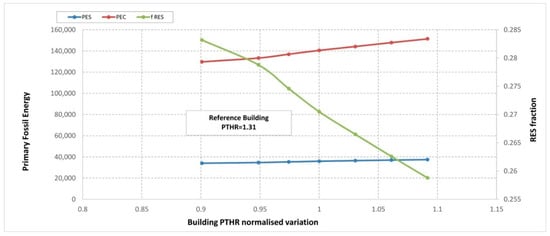
Figure 11.
Performance indicator values with changes in building electrical loads.
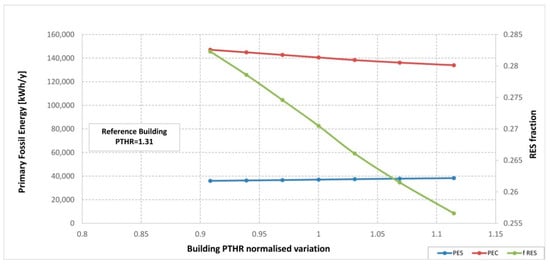
Figure 12.
Performance indicator values with changes in building thermal loads.
Here below, the main outcomes associated to both cases are summarised:
- In the first case, due to the higher electricity demand, the PEC increases; the additional electric energy has to be purchased from the national grid. On the contrary, in the second case, when the Thermal load enhances, the PEC tends to shrink.
- When the building PTHR is higher the Renewable fraction fRES goes down almost linearly due to the fact that the overall required energy is larger; notwithstanding, the renewable electricity production remains constant and its fraction on final electricity consumption lessens accordingly.
- The PES tends to slightly increase as the building PTHR grows up, owing to the electricity excess reduction.
The following two graphs depict the sensitivity analysis of the electricity excess with varying the building PTHR, distinguishing also the renewable and fossil amounts. It is worth of noticing that the larger the electrical load, implying a higher PTHR value, the lower the electricity excess is; conversely, when the electrical load decreases more energy is available to be either converted in heat by the HPs or to be stored within dedicated devices (see Figure 13a). The same approach has been used in order to evaluate how the renewable energy can contribute to the electricity excess, by chancing the thermal load as shown in Figure 13b. Additionally, Figure 14 and Figure 15 show sensitivity analysis of performance indicators with changes in thermal and electric loads respectively when a batteries bank is connected. In particular, Figure 14 and Figure 16, provide the sensitivity analysis results related to the hybrid system performance indicators, once it has been equipped with a storage device. For those calculations, the round-trip efficiency for the storage bank has been assumed equal to 0.8. Consequently, from data reported in Figure 13 it has been possible to immediately assess the actual storable electricity, which is able to positively affect the building primary fossil energy consumption as well as the RES fraction.
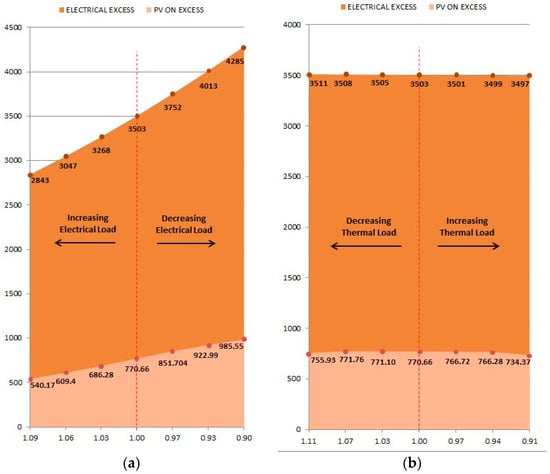
Figure 13.
Sensitivity analysis on electrical excess with changes in normalized PTHR, increasing Electrical Load (a) and Thermal Load (b).
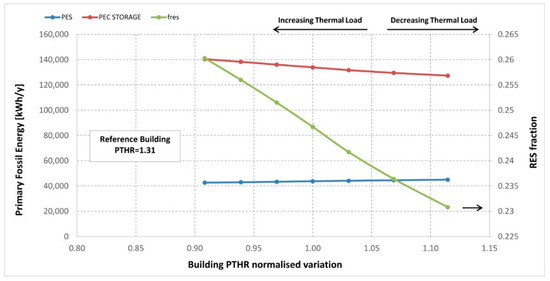
Figure 14.
Sensitivity analysis on Performance indicators with changes in Thermal loads when a batteries bank is connected.
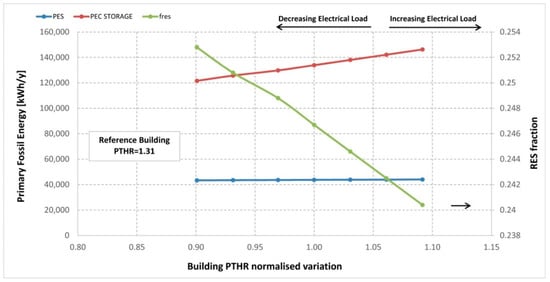
Figure 15.
Sensitivity analysis on Performance indicators with changes in building Electrical loads, when a batteries bank is connected.
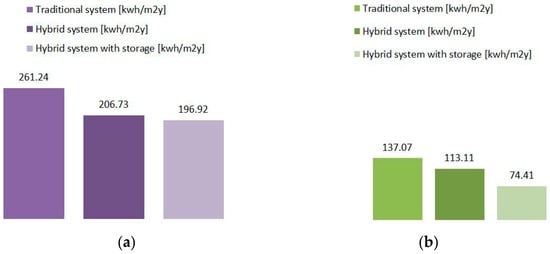
Figure 16.
Normalized building primary fossil energy need over one year (a), normalized building primary fossil energy need over one year neglecting the electricity contribution (b).
Comparing the reference hybrid scenarios (i.e., building PTHR equal to 1), the hybrid system with the integrated electrical storage device shows a further reduction in primary fossil energy consumption starting from 140,583 kWh to 133,909 kWh. Given that the electricity excess is equal to 3503 kWh, the usable electricity from batteries is only 2802 kWh, because of the energy losses for charging and discharging process have been accounted for. As a consequence, it is possible to state that implementing complex hybrid systems along with storage represents a viable alternative option for lowering the dwellings primary fossil energy consumption. In such a way, a more effective and rational use of renewables can be attained, favouring the pathway towards the NZEB qualification associated to the existing buildings. Referring to Figure 14 and Figure 15 it is noteworthy how the PEC reduction associated to the storage device application is higher when building PTHR is equal to 0.9. Indeed, in that case the computed benefit is 8163 kWh, whilst it is equal to 5218 kWh once the building PTHR is 1.09. Moreover, when the building PTHR changes owing to the thermal load variations the PEC trend line shifts down and its slope is basically constant.
In the final analysis, the 3 case studies were compared through a histogram, showing the building primary energy need in the case of the traditional system, the hybrid system and the hybrid system with storage. The use of a high-performance energy generation system reduces energy requirements by almost 50%, as shown in Figure 16. Figure 16b represents the primary energy requirement according to the legislative decree 192/05 implementing the directive 2002/91 of the European Community [42]. The energy certification system provides that the lighting and driving force contribution is not counted in energy consumption, showing a significantly lower primary fossil energy need. For the purposes of energy certification, the values shown in Figure 16b are taken into consideration. In the case of the hybrid storage system, the primary energy need of the building is equal to 74 kWh/m2y, not yet in line with what is reported in the NZEB classification terms.
4. Conclusions
This paper investigated on the possibility to build a new hybrid system based on the trans-critical carbon dioxide heat pumps integration. Specifically, a shared cold heat sink for those heat pumps has been conceptualized modifying the common operating parameters of trans-critical CO2 HPs. Renewable sources together with micro CHP have been coupled to produce on site the electricity for the HPs driving. Performing dynamic simulations, the energy benefits coming out that innovative system have been evaluated. The main findings can be outlined as follows:
- The proposed hybrid system adoption leads to an overall First Law Efficiency equal to 0.84 instead of 0.55. The achievable renewable fraction is 27% while the primary energy saving corresponds to 37%, approximately. The large use of renewables (i.e., aerothermal and solar) allows to get a heating efficiency in terms of primary fossil energy higher than 2;
- The low temperature distribution network development contributes positively to the system efficiency due to the thermal losses and head losses reduction. Even if the water flow rate is high, owing to the HPs operating temperature difference which is limited to 5 °C, the electric consumption for water pumping is lower. Notwithstanding, the piping diameters are greater than those related to the traditional heating plant.
- The use of PV and CHP makes the electricity purchase affordable, despite a large amount of electricity excess is sold to the Grid by the Net metering option. When electric storage devices are applied, a better exploitation of renewable energy occurs, increasing the energy classification of buildings, according to the performance indicators changes;
- Even if the conversion efficiency for DHW production is low due to the CHP heat recovery efficiency, the CHP electric power output favours the final reduction in the hybrid system PEC;
- By comparing the hybrid system with storage device with the traditional one, is it possible to get a considerable primary fossil energy saving (−50% approximately). Therefore, higher efficiency has been registered when replacing the most common technologies with the new commercial ones and along with the heat sharing solutions and electric storage devices. The batteries bank integration allows to reduce the electricity purchase from the national grid affecting positively the PEC values;
- According to the sensitivity analysis, the building PTHR increases and the fRES decreases consistently. However, the primary fossil energy consumption is higher than the Figures shown in the first scenario, but the energy saving increases.
- In order to achieve NZEB qualification, CO2-HPs and hybrid systems adoption are viable solutions. Our next step would be to improve the hybrid system by taking CO2 potential at its peak. Furthermore, harmful refrigerants will be limited in the future, so it would be possible to use transcritical CO2 heat pumps.
Author Contributions
G.L.B. conceived and designed the study, G.S. wrote the paper and made the calculations, D.A.G., G.P. and L.d.S. supervised and revised the paper writing.
Funding
This research was funded by the Italian Ministry of Education, Universities and Research (MIUR) grant number 2015S7E247 within the “Renovation of existing buildings in NZEB vision (nearly Zero Energy Buildings)” Project of National Interest (Progetto di Ricerca di Interesse Nazionale—PRIN).
Acknowledgments
This research has been carried out thanks to the “Renovation of existing buildings in NZEB vision (nearly Zero Energy Buildings)” Project of National Interest (Progetto di Ricerca di Interesse Nazionale—PRIN) funded by the Italian Ministry of Education, Universities and Research (MIUR).
Conflicts of Interest
The authors declare no conflict of interest.
Nomenclature
| Cp | Specific heat (J/kg K) |
| D | Diameter (mm) |
| E | Energy (kWh) |
| G | Flow (l/h) |
| h | Enthalpy (kJ/kg) |
| Lh | Latent heat |
| Mass flow rate (kg/s) | |
| P | Pressure (bar) |
| Q | Heat load (kW) |
| r | Distributed load loss (mmH2O) |
| r | Density (kg/m3) |
| T | Temperature (°C) |
| v | Speed |
| W | Compressor work |
| x | Localized loss coefficient |
| η | Efficiency |
| λ | Thermal conductivity [W/m2K] |
| ν | Viscosity |
| Subscripts | |
| com | Compressor |
| des | Design |
| e | Electrical |
| ev | Evaporator |
| gc | Gas cooler |
| in | Inlet |
| is | Isentropic |
| out | Outlet |
| reg | Regeneration |
| sub | Sub cooling |
| t | Thermal |
| w | Water |
| Abbreviations | |
| CHP | Combined heat and power |
| CO2 | Carbon dioxide |
| COP | Coefficient of performance |
| DHW | Domestic hot water |
| fRES | Renewable energy fraction |
| GHG | Greenhouse gas |
| GWP | Global warming potential |
| HP | Heat pump |
| IHEX | Internal heat exchanger |
| nZEB | Nearly zero emission buildings |
| ODP | Ozone Depletion Potential |
| PEC | Primary energy consumption |
| PES | Primary energy saving |
| PTHR | Power to heat ratio |
| PV | Photovoltaic panels |
| RES | Renewable energy sources |
References
- EPBD. European Directive /31/UE on the Energy Performance of Buildings. 2010. Available online: http://eur-lex.europa.eu/legal-content/EN/ALL/ ?uri=CELEX:32010L0031 (accessed on 15 November 2018).
- Deng, S.; Wang, R.Z.; Dai, Y.J. How to evaluate performance of net zero energy building—A literature research. Energy 2014, 71, 1–16. [Google Scholar] [CrossRef]
- Braulio-Gonzalo, M.; Bovea, M.D. Environmental and cost performance of building’s envelope insulation materials to reduce energy demand: Thickness optimization. Energy Build. 2017, 150, 527–545. [Google Scholar] [CrossRef]
- Del Amo, A.; Martínez-Gracia, A.; Bayod-Rújula, A.A.; Antoñanzas, J. An innovative urban energy system constituted by a photovoltaic/ thermal hybrid solar installation: Design, simulation and monitoring. Appl. Energy 2017, 186, 140–151. [Google Scholar] [CrossRef]
- Dincer, I.; Acar, C. Smart energy systems for a sustainable future. Appl. Energy 2017, 194, 225–235. [Google Scholar] [CrossRef]
- Castellani, B.; Gambelli, A.M.; Morini, E.; Nastasi, B.; Presciutti, A.; Filipponi, M.; Nicolini, A.; Rossi, F. Experimental Investigation on CO2 Methanation Process for Solar Energy Storage Compared to COc-Based Methanol Synthesis. Energies 2017, 10, 855. [Google Scholar] [CrossRef]
- Noussan, M.; Nastasi, B. Data Analysis of Heating Systems for Buildings-A Tool for Energy Planning, Policies and Systems Simulation. Energies 2018, 11. [Google Scholar] [CrossRef]
- Rosa, F.; Carbonara, E. An analysis on technological plant retrofitting on the masonry behaviour structures of 19th century traditional historical buildings (THB) in Rome. Energy Procedia 2017, 133, 121–134. [Google Scholar] [CrossRef]
- Albo, A.; Rosa, F.; Tiberi, M.; Vivio, B. High-efficiency and low-environmental impact systems on a historical building in rome: An InWall solution. WIT Trans. Built Environ. 2014, 142, 529–540. [Google Scholar] [CrossRef]
- Groppi, D.; de Santoli, L.; Cumo, F.; Astiaso Garcia, D. A GIS-based model to assess buildings energy consumption and usable solar energy potential in urban areas. Sustain. Cities Soc. 2018, 40, 546–558. [Google Scholar] [CrossRef]
- Lo Basso, G.; Rosa, F.; Astiaso Garcia, D.; Cumo, F. Hybrid systems adoption for lowering historic buildings PFEC (primary fossil energy consumption)—A comparative energy analysis. Renew. Energy 2018, 117, 414–433. [Google Scholar] [CrossRef]
- Groppi, D.; Astiaso Garcia, D.; Lo Basso, G.; Cumo, F.; De Santoli, L. Analysing economic and environmental sustainability related to the use of battery and hydrogen energy storages for increasing the energy independence of small islands. Energy Convers. Manag. 2018, 177, 64–76. [Google Scholar] [CrossRef]
- Dominković, D.F.; Bačeković, I.; Sveinbjörnsson, D.; Pedersen, A.S.; Krajačić, G. On the way towards smart energy supply in cities: The impact of interconnecting geographically distributed district heating grids on the energy system. Energy 2017, 137, 941–960. [Google Scholar] [CrossRef]
- Dominković, D.F.; Bin Abdul Rashid, K.A.; Romagnoli, A.; Pedersen, A.S.; Leong, K.C.; Krajačić, G.; Duić, N. Potential of district cooling in hot and humid climates. Appl. Energy 2017, 208, 49–61. [Google Scholar] [CrossRef]
- Becchio, C.; Dabbene, P.; Fabrizio, E.; Monetti, V.; Filippi, M. Cost optimality assessment of a single family house: Building and technical systems solutions for the nZEB target. Energy Build. 2015, 90, 173–187. [Google Scholar] [CrossRef]
- Nastasi, B.; Di Matteo, U. Innovative use of Hydrogen in energy retrofitting of listed buildings. Energy Procedia 2017, 111, 435–441. [Google Scholar] [CrossRef]
- Bourrelle, J.S.; Andresen, I.; Gustavsen, A. Energy payback: An attributional and environmentally focused approach to energy balance in net zero energy buildings. Energy Build. 2013, 65, 84–92. [Google Scholar] [CrossRef]
- Zhao, Y.; Lu, Y.; Yan, C.; Wang, S. MPC-based optimal scheduling of grid-connected low energy buildings with thermal energy storages. Energy Build. 2015, 86, 415–426. [Google Scholar] [CrossRef]
- Mitra, S.; Sun, L.; Grossmann, I.E. Optimal scheduling of industrial combined heat and power plants under time-sensitive electricity prices. Energy 2013, 54, 194–211. [Google Scholar] [CrossRef]
- Al-Sharafi, A.; Yilbas, B.S.; Sahin, A.Z.; Ayar, T. Performance assessment of hybrid power generation systems: Economic and environmental impacts. Energy Convers. Manag. 2017, 132, 418–431. [Google Scholar] [CrossRef]
- Levihn, F. CHP and heat pumps to balance renewable power production: Lessons from the district heating network in Stockholm. Energy 2017, 137, 670–678. [Google Scholar] [CrossRef]
- Aprea, C.; Maiorino, A. An experimental evaluation of the transcritical CO2 refrigerator performances using an internal heat exchanger. Int. J. Refrig. 2008, 1006–1011. [Google Scholar] [CrossRef]
- Cabello, R.; Sanchez, D.; Llopis, R.; Torrella, E. Experimental evaluation of the energy efficiency of a CO2 refrigerating plant working in transcritical conditions. Appl. Therm. Eng. 2008, 1596–1604. [Google Scholar] [CrossRef]
- Cavallini, A.; Cecchinato, L.; Corradi, M.; Fornasieri, E.; Zilio, C. Two-stage transcritical carbon dioxide cycle optimisation: A theoretical and experimental analysis. Int. J. Refrig. 2008, 28, 1274–1283. [Google Scholar] [CrossRef]
- Cecchinato, L.; Corradi, M.; Fornasieri, E.; Zamboni, L. Carbon dioxide as refrigerant for tap water heat pumps: A comparison with the traditional solution. Int. J. Refrig. 2005, 28, 1250–1258. [Google Scholar] [CrossRef]
- Cho, H.; Lee, M.Y.; Kim, Y. Numerical evaluation on the performance of advanced CO2 cycles in the cooling mode operation. Appl. Therm. Eng. 2009, 29, 1485–1492. [Google Scholar] [CrossRef]
- Kauf, F. Determination of the optimum high pressure for transcritical CO2 refrigeration cycle. Int. J. Therm. Sci. 1999, 38, 325–330. [Google Scholar] [CrossRef]
- Kim, M.H.; Pettersen, J.; Bullard, C.W. Fundamental process and system design issues in CO2 vapor compression systems. Prog. Energy Combust. Sci. 2004, 30, 119–174. [Google Scholar] [CrossRef]
- Liao, S.M.; Zhao, T.S.; Jakobsen, A. A correlation of optimal heat rejection pressures in transcritical carbon dioxide cycles. Appl. Therm. Eng. 2000, 20, 831–841. [Google Scholar] [CrossRef]
- Wang, H.; Maa, Y.; Tian, T.; Li, M. Theoretical analysis and experimental research on transcritical CO2 two stage compression cycle with two gas coolers (TSCC + TG) and the cycle with intercooler (TSCC + IC). Energy Convers. Manag. 2011, 52, 2819–2828. [Google Scholar] [CrossRef]
- Kim, S.C.; Kim, M.S.; Hwang, I.C.; Lim, T.W. Heating performance enhancement of a CO2 heat pump system recovering stack exhaust thermal energy in fuel cell vehicles. Int. J. Refrig. 2007, 1215–1226. [Google Scholar] [CrossRef]
- Scoccia, R.; Toppi, T.; Aprile, M.; Motta, M. Absorption and compression heat pump systems for space heating and DHW in European buildings: Energy, environmental and economic analysis. J. Build. Eng. 2018, 16, 94–105. [Google Scholar] [CrossRef]
- Lan Yang, J.; Tai Ma, Y.; Li, M.X.; Hua, J. Modeling and simulating the transcritical CO2 heat pump system. Energy 2010, 35, 4812–4818. [Google Scholar] [CrossRef]
- Lund, H.; AlbergØstergaard, P.; VadMathiesen, B. Smart energy and smart energy systems. Energy 2010, 137, 556–565. [Google Scholar] [CrossRef]
- Sarkar, J.; Bhattacharyya, S.; Gopal, M.S. Natural refrigerant-based subcritical and transcritical cycles for high temperature heating. Int. J. Refrig. 2007, 30, 3–10. [Google Scholar] [CrossRef]
- Hepbasli, A.; Kalinci, Y. A review of heat pump water heating systems. Renew. Sustain. Energy Rev. 2009, 13, 1211–1229. [Google Scholar] [CrossRef]
- Xie, Y.; Wang, Z.; Cui, K.; Zhang, X. The Exergy Analysis of Gas Cooler In CO2 Heat Pump System. Procedia Environ. Sci. 2011, 11, 1555–1560. [Google Scholar] [CrossRef]
- CO2 As Refrigerant: The Transcritical Cycle. Available online: https://www.achrnews.com/articles/94092-co2-as-refrigerant-the-transcritical-cycle (accessed on 15 November 2018).
- Sarkar, J.; Bhattacharyya, S.; Gopal, M.R. Optimization of a transcritical CO2 heat pump cycle for simultaneous cooling and heating applications. Int. J. Refrig. 2004, 830–838. [Google Scholar] [CrossRef]
- Evoplus-B 120/220.32 M Product Specifications. Available online: https://www.dabpumps.com/it/evoplus-small (accessed on 15 November 2018).
- Oliveira Panão, M.J.N. The overall renewable energy fraction: An alternative performance indicator for evaluating Net Zero Energy Buildings. Energy Build. 2016, 127, 736–774. [Google Scholar] [CrossRef]
- Desideri, U.; Proietti, S.; Arcioni, L.; Leonardi, D.; Sdringola, P. Comparative analysis of three methodologies for the energy certification applied to residential buildings, developed in Italy in conformity with European directive EPBD 2002/91. In Proceedings of the ECOS 2007—Proceedings of the 20th International Conference on Efficiency, Cost, Optimization, Simulation and Environmental Impact of Energy Systems, Padua, Italy, 25–28 June 2007; p. 1495. [Google Scholar]


© 2019 by the authors. Licensee MDPI, Basel, Switzerland. This article is an open access article distributed under the terms and conditions of the Creative Commons Attribution (CC BY) license (http://creativecommons.org/licenses/by/4.0/).