Article

Multi-Dimensional Indexes for the Sustainability Evaluation of an Active Distribution Network

1
School of Electrical & Electronic Engineering, North China Electric Power University, Baoding 071003, China
2
State Grid Hebei Electric Power Supply Co., Ltd., Shijiazhuang 050022, China
3
State Key Laboratory of Alternate Electrical Power System with Renewable Energy Sources, Baoding 071003, China
4
State Grid Hebei Electric Power Corporation Limited Economic Technology Research Institute, Shijiazhuang 050021, China
5
Escuela de Ingeniería, Pontificia Universidad Católica de Chile, Vicuña Mackenna 4860, Santiago, Chile
6
Centro de Energía, Pontificia Universidad Católica de Chile, Vicuña Mackenna 4860, Santiago, Chile
*
Author to whom correspondence should be addressed.
Energies 2019, 12(3), 369; https://doi.org/10.3390/en12030369
Submission received: 20 December 2018 / Revised: 19 January 2019 / Accepted: 21 January 2019 / Published: 24 January 2019
(This article belongs to the Special Issue Recent Research Progress for Energy Policy)

Abstract

:
An active distribution network (ADN) differs from a traditional distribution network in many aspects, one of which is the integration of a large amount of distributed generation (DG), especially intermittent photovoltaics (PVs). The integration of intermittent PVs has both pros and cons for the distribution system. As the platform on which new techniques work and the main body of a greener future energy system, the development of an ADN has to be sustainable, need-oriented, and environmentally friendly, and the traditional technical–economic evaluation method cannot meet the requirements and provide advice in the decision-making process. Based on the concept of sustainable development, we used an ADN with the integration of a large number of distributed PVs (DGPVs) as an example and established a multi-dimensional index system to evaluate the sustainable development level (SDI) of the ADN. The analysis was based on a platform we built with consideration of the investment feasibility of the DGPVs’ investors, state and industrial policies, and their interactions with the distribution system. We first compared the development of DGPVs and the SDI of the ADN as the carrier of DGPVs under different state policies, and second, we compared the SDIs of three city ADNs with different solar resources and demand levels, but under the same state policy. The analysis results showed that different integration levels of DGPVs can be set for a city/area ADN with different solar resources and demand to achieve a comparable SDI, and a comprehensive incentive mechanism could be adopted for the development of DGPVs. In this way, the benefits of different parties can be considered at the same time and finally, the coordination of the sustainable development of multi-parties can be achieved.

1. Introduction

The continued growth in power demand, the shortage of traditional energy sources, and the introduction of new market players are driving the grid towards an efficient, flexible, intelligent, and sustainable way to adapt to future technological needs. Especially in developing countries, there is no way to avoid the contradiction between vigorously developing the economy and protecting the environment.
The emergence and application of many new ideas and technologies have overturned the traditional operation and management models of power systems, especially at the distribution network level. An active distribution network (ADN) differs from a traditional distribution network in many aspects, one of which is the integration of a large amount of distributed generation (DG), especially intermittent photovoltaics (PVs). A distribution network, as the platform where customers can benefit from a series of technology (large-scale DG access, electric vehicle development, and a series of advanced load response), is the key to the coordinated development of the multi-parties involved. The integration of distributed PVs (DGPVs), electric vehicles (EVs), and the implementation of the demand response (DR) can reduce the transmission losses, lower the need for traditional fossil fuels, and increase the CO2 emission benefit as well as increase the operational flexibility by the active involvement of customers [1,2,3]. However, when the integration reaches a higher level, its impact on the distribution devices cannot been ignored. For example, the changes in the shape of the load curve could hasten the degradation of distribution transformers [4] and bring prior costs to the distribution devices [5]. Different objectives of a green, reliable, and economical distribution system could be contradicted under a short-term frame; however, when under a longer time frame, they could be complementary to each other. The evaluation of an ADN must be performed under a wider frame in multiple dimensions. The vision of a future ADN should be economically feasible, need-oriented, self-dependent, and environmentally friendly, which is just the right fit for the definition of sustainable development defined in Brutland Report in 1987 by the World Commission on Environment and Development.
In this study, we propose a multi-dimensional index system to evaluate the sustainability of an ADN to fill in the blanks in this area. The rest of the paper is organized as follows: We review the sustainability evaluation in power system applications and the multi-dimension index system of Sustainability evaluation (SE) in this area and in other areas in Section 2. In Section 3, we propose a multi-dimension index system for the sustainability evaluation of the ADN. In Section 4, the simulation platform used to obtain the raw data for the sustainable evaluation of the ADN is briefly introduced. In Section 5, two groups of cases are designed. The comparison of the sustainability development levels (SDIs) is given for the same city ADN under different policies, and a comparison of the SDIs of three city ADNs that show significant differences in solar resources, population, and renewable integration level at the transmission level is given. The last section presents our conclusions and implications based on the outcomes of the study.

2. Review

2.1. Sustainability Evaluation in Power System Applications

As shown in Figure 1, publications focusing on the sustainability evaluation of an energy system have targeted the following themes, from macro to micro: energy system evaluation; power system planning and management; city electrification and micro-grid; and generation technologies and projects. With different themes, they mainly differ in the evaluation time frame (current, short-term, mid-term, and long-term), dimensions and indicators, and evaluation method (life-cycle analysis, scenario analysis, and dynamic system method) [2,6]. Table 1 provides a list of publications in related fields of the SE of power systems.
The dimensions of the evaluation index system is one of the keys to sustainable development evaluation. The literature review [6] showed that the choice of dimensions has varied little, but the design of the index has been flexible. The main reason for this is that the definition of the indicator is mostly defined according to the availability of raw data. Therefore, for the same research object, different researchers may define different index systems according to the data that may be obtained.
Since the interactions between generation technology, power system, energy policy, the environment, and society show dynamic and nonlinear characteristics, the sustainable development of such a complex system essentially needs long-term planning [7]. The simulation methods include life-cycle analysis, multiple scenarios analysis with load forecasting, and sensitivity analysis. Life-cycle analysis is mainly used in analysis in the economic dimension and sometimes in the social dimension. The authors in [8] integrated scenario analysis into life-cycle analysis for the sustainability evaluation of micro-grids. Eleven scenarios were designed taking into account different generation technologies, a different mix, and a different target of climate changes under a time frame of 50 years. Reference [9] captured the technology development in three different target years and performed a sustainability evaluation of the 3 years, and [10] analyzed the sensitivity of each indicator to the SE index.
In order to better reflect the complicated interactions among different dimensions, the system dynamic (SD) method is commonly used for system modeling [7]. For example, reference [11] used the SD method to study the incentive policies on the development of photovoltaics. Reference [12] used the SD method to model the long-term evolution of the power system in China. However, the operation and control of a distribution network need to solve the nonlinear equation, but the flow diagram of the SD method and the description form of stock are difficult when describing such a complex algorithm. With the rapid development of active distribution networks, the diversity and complexity of the interactions between other subjects (distributed power supply, energy storage, load response agent, and power selling company, etc.) and the distribution network are bound to continuously increase. The access to a large amount of distributed power supplies and the possible changes in the topology of the future distribution network also make the static and dynamic characteristics of distribution networks increasingly complex. The SD method alone, ignoring the technical details of the distribution network operation, will lead to macro and microscopic disconnect. On the other hand, the traditional distribution network simulation platform and modeling ideas can only realize the technical and economic aspects of the simulation. The two types of approaches, which, in essence, retain the separation of policy/economy/technology/environment, do not describe the dynamic behavior of this complex system well and do not provide the necessary data support for the study of the sustainable development of active distribution networks.

2.2. Multi-Dimension Index System

Many works have been published on the evaluation of the reliability, economy, and sustainability of generation techniques, projects, and energy systems at different levels. In the following text, the most commonly adopted indexes given in [13,14,15,16,17,18,19,20,21,22,23,24,25,26,27,28] in each dimension in the above-mentioned research topics are listed in Table 2, Table 3, Table 4, Table 5 and Table 6, as a reference of the index system for the sustainability evaluation of an ADN. We only classify the commonly used indexes in this paper. Please go to [28] for detailed reference information. Table 6 gives a summation of the indicators of three typical references [9,15,19] on the sustainability evaluation of the national energy system, power system, and micro-grid.
The most utilized economic indicators can be classified into three classes: (1) indicators related to investment opportunity and capability, for example, the availability of funds, the economic level of the city or country, and subsidies; (2) indicators suitable for the evaluation of a project’s feasibility, which is decided by investment and production, for example, economic efficiency and similar indicators, the lifetime of a type of technology or project; and (3) other indicators, including the investment of necessary infrastructure, research & development (R&D), economic sustainability, and savings on greenhouse gas emissions. Among the three categories, the first category indicates whether investment is allowed, while the second category indicates whether the investment is economically feasible.
The most commonly used environment indicators can be classified into three classes: (1) indicators with objective measurements, for example, the emissions of pollutants, land and water use, air quality, and land transformation, etc.; (2) indirect indicators including the impacts on residents and biodiversity; and (3) administrative indicators including the adoption of an independently audited environmental management system, which helps the supervision of project implementation.
The most commonly utilized social indicators can be classified into four classes: (1) direct indicators, for example, job creation and employment, salary, improvement of service quality, and social welfare and cultural heritage protection; (2) indirect indicators, including the effects on the economy, human health, life quality and surroundings, energy security, and the elimination of social unfairness; (3) the acceptance of the technology or program by the society; and (4) comprehensive indicators, including energy economy structure, risk analysis and management, and the compatibility with a political and legislative framework.
The most commonly utilized technical indicators are given in Table 5. They can be classified into three classes: (1) direct indicators, including efficiency and its calculation; (2) performance indicators, including reliability, security, and the production characteristics of intermittent generations; and (3) comprehensive indicators, including the suitability of micro-grids, technology maturity, and augmentation capability.
As we can see in Table 3, Table 4 and Table 5, indicators in the first category can be obtained either by objective measurement, such as temperature, or by simple evaluation, such as job creation, while sub-indicators or methodologies are further needed for indicators in the second and the third categories.
Table 6 gives the sub-indicators of the economic, social, environmental and technical, operation and reliability dimensions proposed in [9,15,19] for the sustainability evaluation of power system applications at different levels. As shown in Table 6, LOLP and ELOE are commonly used reliability indexes, and are the abbreviation of loss of load probability and the abbreviation of expected loss of energy, respectively. Since ADN introduces renewable generation technologies, which are basically renewable generation projects, new kinds of load, and responses of customers to the traditional distribution network, the SDI indexes for the sustainability evaluation of ADN can be obtained through a comprehensive consideration of indicators given in Table 2, Table 3, Table 4 and Table 5 and Table 6.

3. The Index System for the Sustainability Evaluation of an ADN

3.1. The Index System

Based on the review of indexes in multiple dimensions given in Table 2, Table 3, Table 4, Table 5 and Table 6, we selected the following indicators for the evaluation of the sustainability of ADNs when considering the differences between different ADNs. The index system included fifteen indicators in four dimensions as given in Table 7. When the number of indicators in the index system is large, the weight of a single indicator will be small, which will decrease the sensitivity of the SDI to the variation of a single indicator. Besides, we also need to consider the data availability of indicators. Subjective indicators bring uncertainty to the evaluation result. Therefore, we mainly chose indicators of the first category in Table 2, Table 3 and Table 4, and commonly used technical indicators in traditional technical evaluations in power system applications. The differences between an ADN and a traditional distribution system lie in the following aspects: (1) multiple investment entities; (2) the integration of renewable distributed generations; and (3) demand response. The design and evaluation of the index system should focus on the impacts of the above-mentioned aspects on the planning and operation of a distribution system. A comparison of the sustainable development of an ADN can be made between different cities or countries. In China, the city distribution systems are under the management of two different grid corporations. Under the same regulation standards, different ADNs differ mainly in terms of local incentives, renewable resources, the scale of distribution networks, population and economic development, and load mix. Aside from the above-mentioned differences, ADNs in different countries differ in state policies.

3.1.1. Economic Indicators (Eco)

In China, the traditional distribution system is monopolistic. In response to the advocation to intensify the modernization of the city’s distribution system, distribution companies started to admit investment from other parties in March 2015, as one of the key characteristics of the new round of the power system regime. The purpose of this was to facilitate the development of a distribution network and improve the distribution network’s operation efficiency and service level while revitalizing social capital and promoting local economic development. However, the breakdown of the monopolistic construction and operation of a traditional state-run distribution system has impacts on the reliability and economic operation of a distribution system.
The multi-party investment mode has both pros and cons: (1) a contradiction exists between the highly profit-pursuing nature of a private distribution network and the characteristics of the charitability of a power network as one of the most important infrastructures. An increase in the tariff as a result of privatization will increase pressure from society; (2) the conflicts of interest between different parties are difficult to solve; (3) the low profit of running a distribution network cannot meet the expectation of the investors; (4) the problem of the “last kilometer” is more significant; and (5) the requirements for supervision are higher under the multi-party investment mode.
Therefore, the investment opportunity reflects whether other investors are allowed and the extent that other investors are involved in the operation of the ADN. Economic efficiency is evaluated by the income and cost of the ADN. From an economic perspective, the business model of a distribution company must evolve and expand beyond that of traditional distribution companies, because their revenue base will shrink with the existence of other players. Figure 2 illustrates the existing and new services, flow of revenue, costs, and interactions of key players in an extended business model of distribution system operators (DSOs). Key players include transmission system operator (TSOs), different consumers, DSOs, DGs and storage operators, and retail suppliers [29]. The revenue sources of a DSO will be expanded beyond just connection charge and energy transport charges by providing extra services to other players, while its cost will also be expanded through receiving services of new players. Therefore, the revenue of an ADN company includes the connection charge, data supply to DG operators and retail suppliers, use of system charge, premium reliability for important commercial and industrial consumers, and local balancing provided to TSO. The costs of DSO include that of grid reinforcement, use of system charge to TSO, the ancillary services provided either by the traditional approach or DGs and storage, energy loss, and operation & maintenance (O&M).

3.1.2. Environment Indicators (En)

One of the demands of an ADN is to reduce the losses and increase the accommodation level of “green” generation through the access of renewable distributed power and electric vehicles, load response, and energy saving measures. Therefore, the effect of new elements in the distribution system (distributed generations, EV loads, load response, energy storage systems) can be evaluated by the pollutants released, land use, temperature, and air quality. Unlike pollutant release and land use, which can be estimated directly, temperature and air quality are affected by multiple factors, and the effect of an ADN on them cannot be effectively extracted. However, objective measurements can be obtained as the effectiveness of the measures or new techniques adopted by the ADN to alleviate environmental problems.

3.1.3. Society Indicators (Soc)

The social dimension index has a supervisory function. The distribution network must bear the social responsibility of its universal service. The new round of reforms of an ADN will break the monopoly and result in the decrease of the profit of the distribution network, which may lead to a lower service quality. Regulation is therefore required. The introduction of social dimension indicators, such as the impact on the quality of life, is actually the introduction of public regulation of the reform. In addition, employment opportunities, the acceptance of new technologies, and income levels will affect the investment enthusiasm of third-parties in new technologies. “Per capita consumption of new energy” reflects the integration level of the development of renewable energies at both the transmission and distribution levels.

3.1.4. Operation Indicators (Ope)

Operation indicators reflect the operational performance of an ADN under the integration of large-scale intermittent and variable sources and loads. The operational performance of an ADN is mainly affected by the variability of resources (including DGPVs and loads), the infrastructure, and the management, and the control level. Therefore, in the dimension two indicators, we included the variability of resources and flexibility provided by the ADN to cope with the operational uncertainty due to variable resources.
Considering the existence of the reliability benchmark, the reliability of city distribution systems under the same grid company or different grid companies showed no significant differences; therefore, we did not include the reliability indicator in the index system. Instead, we included the flexibility.
• Flexibility
Conceptually, flexibility is considered as the technical ability of the system to react to variations in supply and demand at a minimal additional cost [30]. Therefore, the flexibility of the power system is decided by its capability to cope with variabilities in system operation. Reference [31] classified the interventions that help to increase the flexibility in power system operation due to the variability, as given in Figure 3. The countermeasures cover all aspects from generation, transmission, and distribution to the utilization of electricity, including lowering the impact of variability by increasing the forecasting accuracy of renewable generation and intra-hour dispatching; increasing the frequency and voltage controllability by adjusting the output of renewable generation and increasing the transmission margin; coping with the variability introduced by renewable generation by performing a demand side response; and increasing the ramping speed of generation and installing energy storage systems to charge when having surplus generation and discharge when having insufficient generations. At the distribution network level, installing generation forecasting system for each DGPV is not feasible due to the increase of investment and the geographic dispersion of multiple DGPVs. However, DGPVs could provide a certain amount of reactive power by increasing the capacity of the converter of the DGPV or decreasing the real power generation of the DGPV. Through this, the voltage profile of the out-feeder is improved. Implementing a demand response, installing energy storage, and upgrading the distribution lines and devices can eliminate the operational problems to some extent due to the integration of large scale DGPVs and EVs. Although multiple measures can be chosen at the distribution network level to increase the flexibility of the system, the costs of implementing each measure should be considered. Different measures have different costs. The cost of the measures listed in Figure 3 increases from left to right and from bottom to top.
The definition of flexibility and its quantification differs with the research focus. In [32], the authors defined the flexibility of the generation system as the techniques or measures that the generators could use to adjust their output to meet the demands. The flexibility provided by the demand side response, especially by residential smart appliances in the distribution system, is complicated as demand affects the distribution tariff if the dynamic tariff is used, and the tariff, in return, will affect customer behavior [33]. The authors in [34] defined the flexibility of EV aggregated demand as the probability of demand increase in EV charging loads. The study by [30] compared the flexibility of different generation technologies, taking into account the probability that the actual generation is lower than its forecasted generation. Reference [33] proposed evaluating the flexibility of residential demand as the maximum energy consumption that users can be transferred.
In order to make the different methods comparable, we evaluated the flexibility of an ADN to be the cost that the ADN needs to pay to cope with the variability introduced by large-scale distributed PV and EV loads.
The flexibility of an ADN in this study is evaluated by Equation (1):
F = i = 1 n C i · w i · a i
where wi is the weight of measure i on the improvement of flexibility of the system; ai is the control flexibility provided by measure i; and Ci is the cost needed to pay to obtain ai. With proper control, a DGPV can output reactive power and improve the voltage profile of downstream systems of the installation site. An inverter with a higher capacity or lowering the real power generation of PV is needed, which increases the investment or decreases the revenue of the PV system. Furthermore, a control system and communication infrastructure are needed for the implementation of real time control of the reactive power output of a PV system.

3.2. Weighting Method and Aggregated Sustainability Index (SDI)

The aggregated SDI can be calculated by Equation (2):
SDI = i = 1 5 j = 1 N i w i j x i j
where SDI is a weighted summation of all indicators in different dimensions. The simplest weighting methods are the equal pillar method (each dimension is given the same weight) and the equal indicator method (all indicators are given the same weight). The former assigns an equal weight to each dimension and is suitable for the comparison of the developing level among dimensions. The latter shows no preference for each indicator; however, when the number of indicators is high, the effect of each indicator on the SDI is diminished.
The entropy method [28] is an objective weighting method to decide the weight of the indicators by their variability. The smaller the information entropy of an indicator, the higher the indictor’s variability, and the more information the indicator provides. Therefore, the weight of the indicator should be bigger and its values more in the evaluation.
A vector of x j = ( x 1 j ,   x 2 j , , x m j ) after standardization represents the set X in terms of the ith criterion. The weight of each criterion is calculated through the following steps:
  • Calculate X j = i = 1 m x i j ; j = 1 , 2 , , n ;
  • The entropy measure of the jth criterion contrast intensity is e j = 1 ln m i = 1 m ( x i j X j ln x i j X j ) ;
  • Calculate the normalized weight of each criterion: w j = 1 e j j = 1 m ( 1 e j ) ; i = 1 m w j = 1 .

4. Simulated Method

4.1. Modeling the Interactions among Multi-Parties and Dynamics under a Long-Term Frame

An ADN differs from the traditional distribution network in many aspects, one of which is the integration of DGPVs. In this study, we focused on the dynamics brought by the integration of DGPVs.
The development of an ADN involves two kinds of dynamics.
  • The first class is dynamics that can be modeled by a monotonically increasing or decreasing trend, as given in Table 8. As given by the references, population, load demand, O&M costs, and population familiar with new technologies increased over time. The annually averaged electricity price increase was indicated to be slow. The investment of DGPV panels, price of EV batteries, and population familiar with new technologies decreased over time.
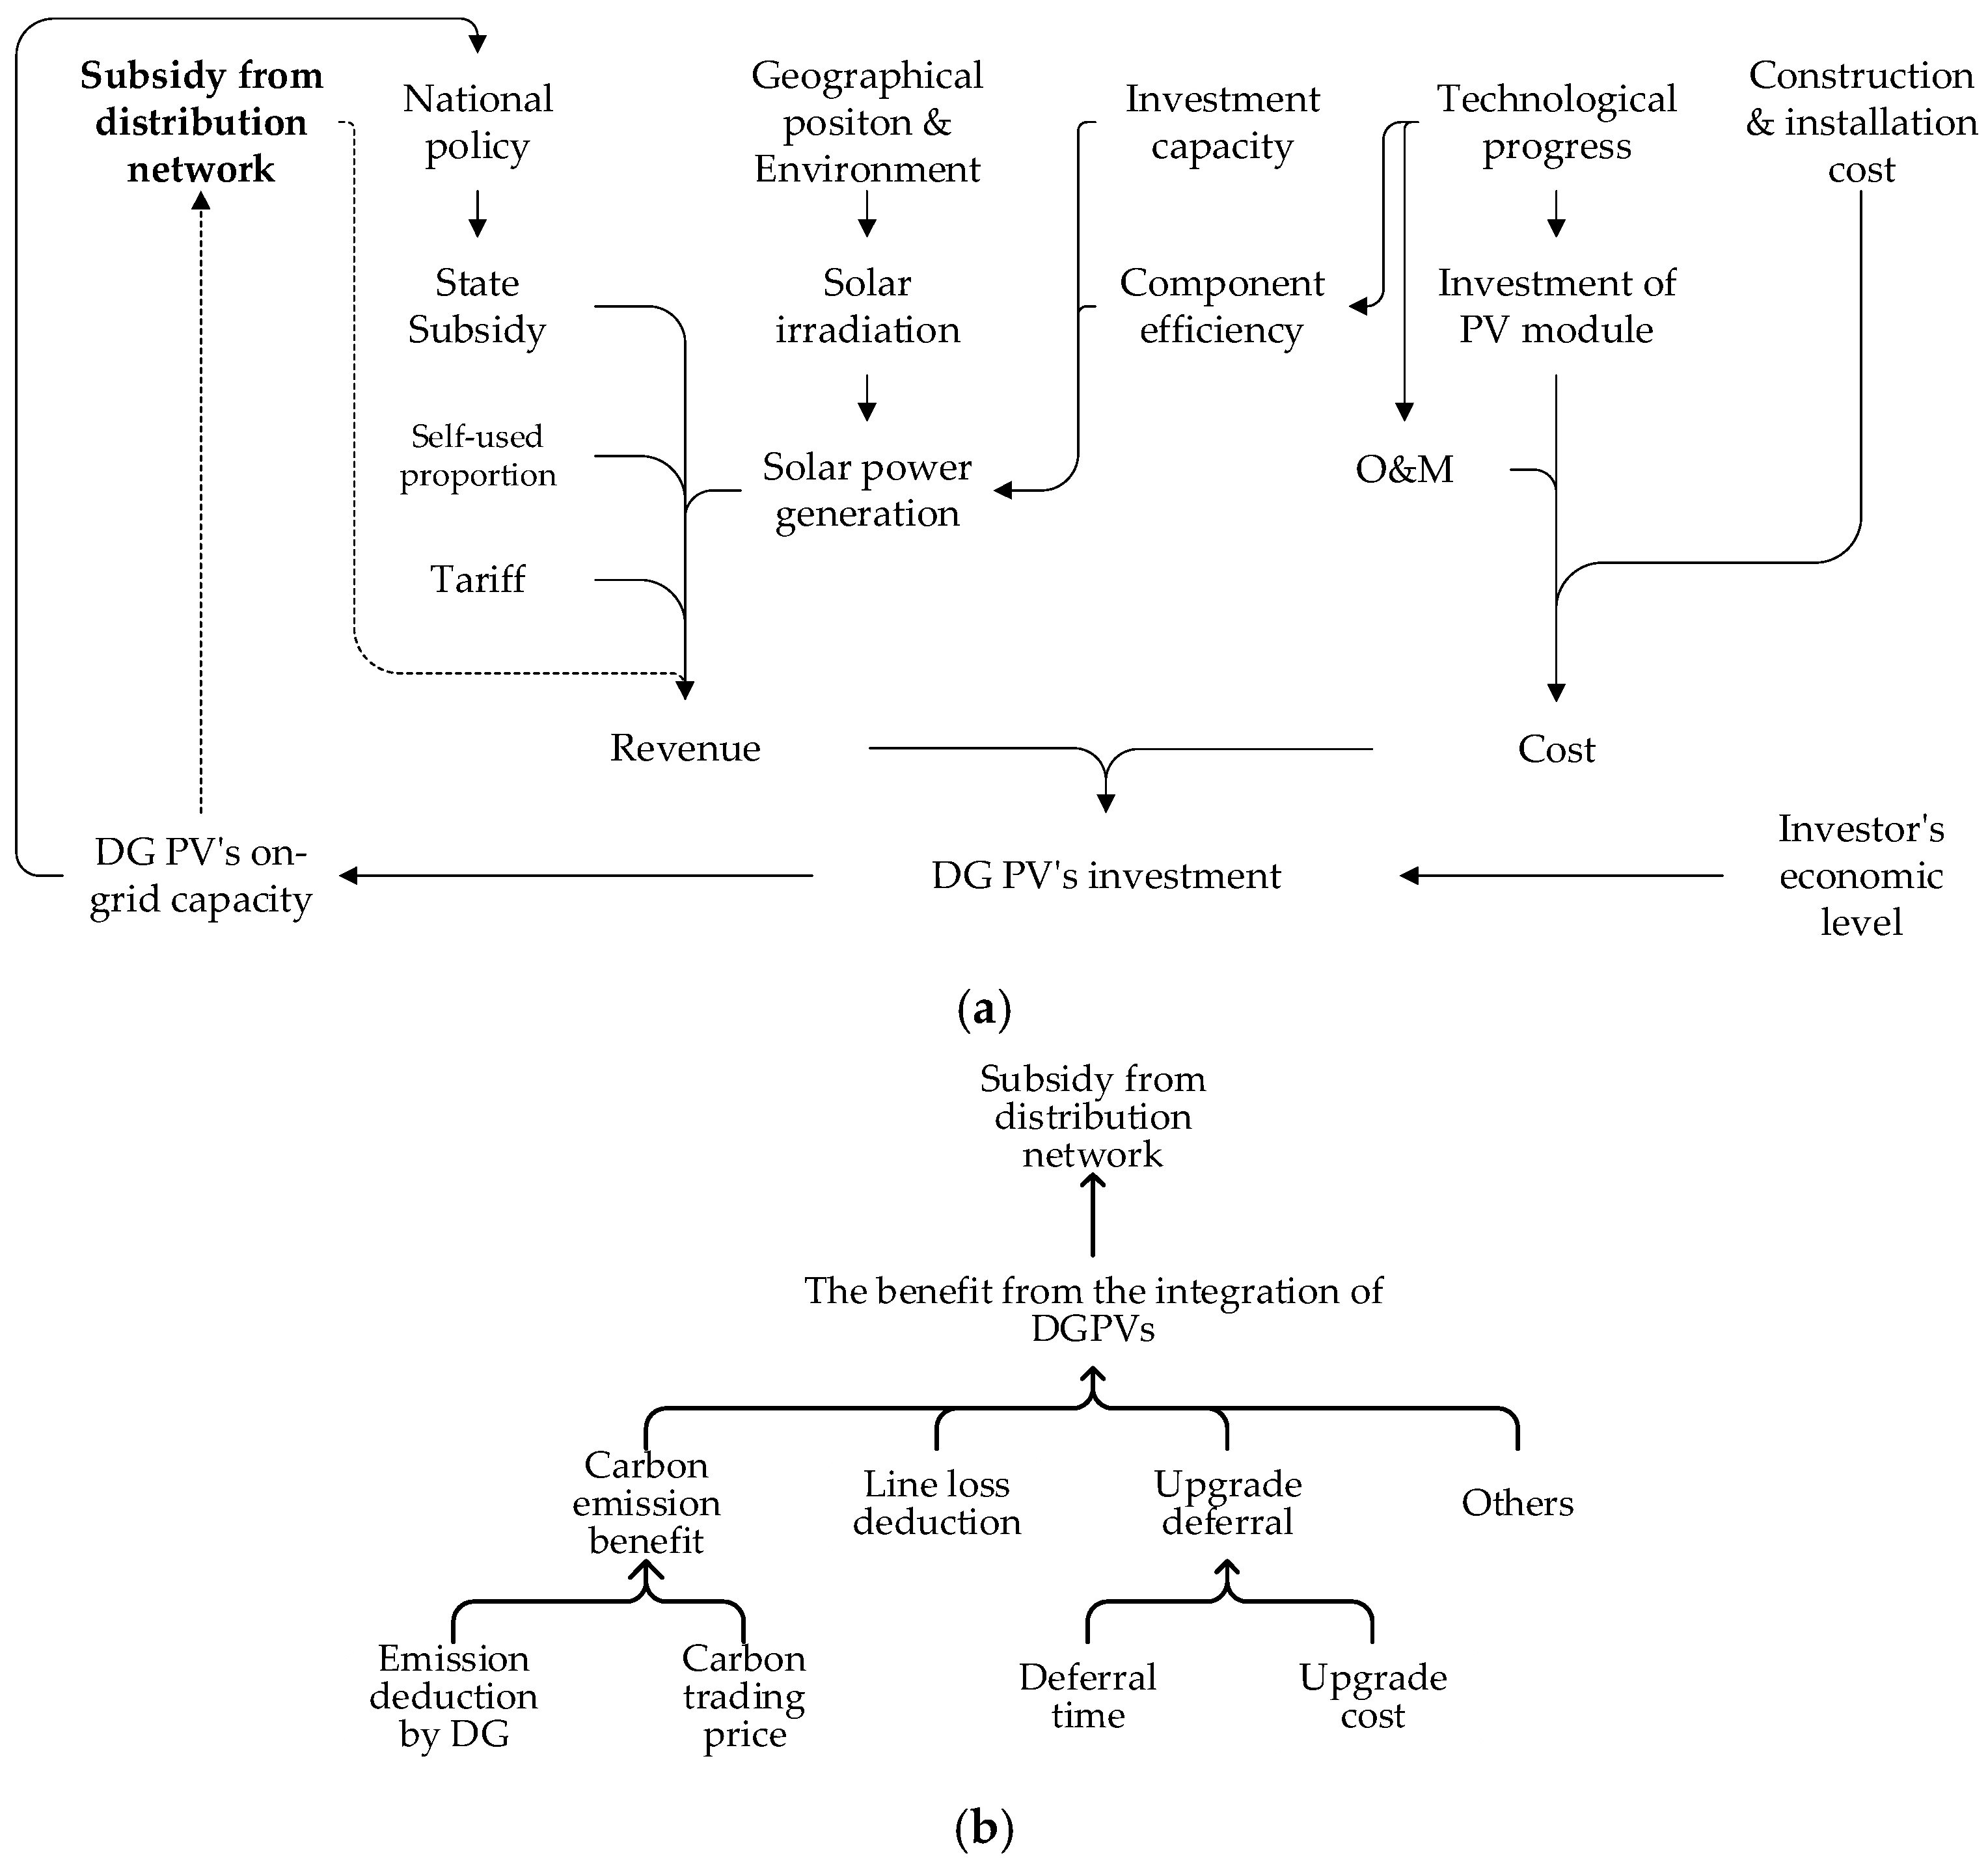
  • The second class of dynamics is the interactions among the benefits of the distribution network, DGs, and other investors or service providers, and society and policies, as given in Figure 4. The usage of electricity generated by the DGPV reduces the usage of electricity from conventional generation and defers the upgrade of distribution facilities, which delivers environmental benefits to the society. Incentives from the government are necessary conditions for the development of DGPVs. The integration of large-scale DGPVs brings extra opportunities to the investors and service providers to gain benefits, increases the uncertainty in the operation of the distribution system, but also provides more control flexibility and increases prior investment [5]. The effect of the integration of DGPV into the operation and planning of distribution systems varies with the increase in the integration capacity. Therefore, the benefit obtained from the integration of a DGPV also varies [39], which, in return, affects the investment into DGPVs.
The on-grid capacity of the DGPVs of a city is decided not only by the willingness of investors to invest in DGPVs, but also the investment potential of the city. When the project is economically feasible, rational investors have the willingness to invest. The economic feasibility of a DGPV project is commonly reflected by its internal return rate (IRR), which is calculated by the revenue and the cost of the project. Figure 5 gives the factors that impact a DGPV project’s revenue and cost. The cost of DGPV includes the construction and installation costs, the capital investment of PV modules, and O&M. The capital investment of PV modules decreases along with technological development. The revenue of DGPV mainly comes from selling PV generations, which is decided by the solar resourcs of the area, the installation capacity, the distribution tariff system, the feed-in-traiff, and the self-used proportion of PV generation. The sine qua non of an investment is an IRR higher than the minimum attractive rate of return of the investor. Besides the IRR, the investment volume of DGPVs of the city is also affected by the population of the city, the income levels of residents, and the familiarity and acceptance of the technology. Please go to [39] for a detailed explanation of the DGPV investment model.
Post integration, the owner gains income from the electricity fed into the grid by the DGPV, deducts the cost of self-consumed solar electricity, and can even obtain extra compensation under a comprehensive compensation mechanism [39,40] because of the line loss deduction, carbon emissions deduction, and upgrade deferral, as given in Figure 5b, thus enlarging the investors’ profit space. When the on-grid capacity of the DGPV changes, the benefits brought by the DGPV change accordingly. In conjunction with the variation of other factors associated with the photovoltaic investments listed in Table 8, the operational condition of the distribution network will be constantly under change.

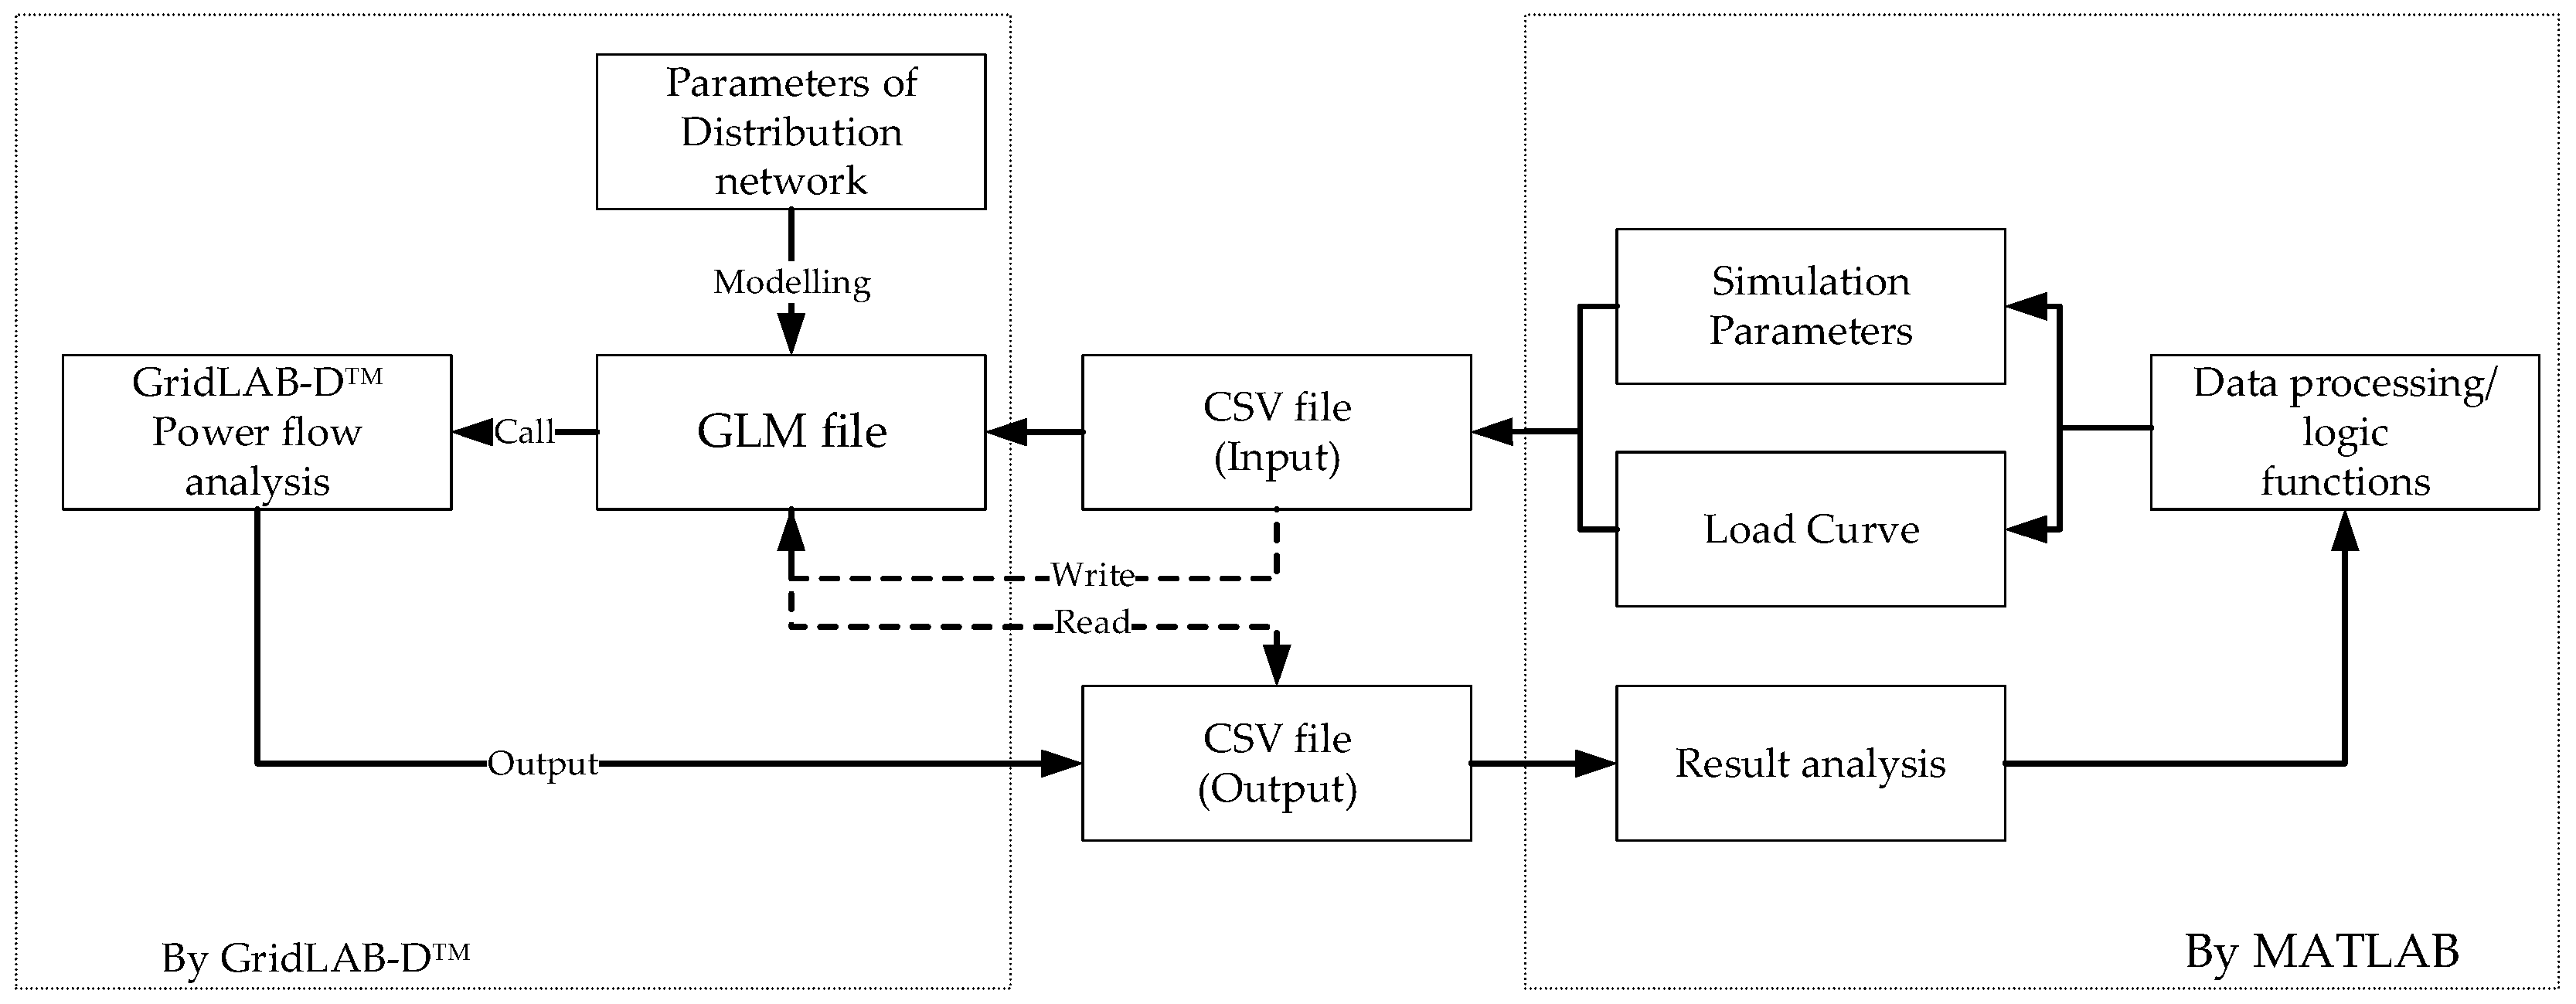
4.2. Simulation Tool

The co-simulation of GridLAB-DTM (Version 4.0, U.S. Department of Energy at Pacific Northwest National Laboratory, Richland, WA, USA) and MATLAB (R2016a, MathWorks, Natick, MA, USA), as given in Figure 6, was chosen for the simulation under a time-frame of 10 years. The operation of the distribution system was simulated by GridLAB-DTM, and the decision of investors to invest in the DGPV and the compensation of DR were calculated by the models built in MATLAB. The data exchange between GridLAB-DTM and MATLAB can be implemented by sharing internal memory, data files, and APP in MATLAB. We chose the simplest CSV data file to exchange data between GridLAB-DTM and MATLAB applications.
The detailed simulation steps were as follows:
Step 1: Initialization. The matching factors of three cities—Beijing, Ningbo, and Chengdu—were calculated to map the generation capacity and load of the city to those of IEEE-13 test systems. This was implemented in MATLAB.
Step 2: The investment volume of DGPVs was determined according to the investment model given in [39]. This was implemented in MATLAB.
Step 3: The integration positions of DGPVs in the IEEE-13 system were randomly chosen. The input file of the GridLAB-DTM was modified according to the integration positions of the DGPVs, their investment capacity, and their construction time. This was implemented in MATLAB.
Step 4: A power flow analysis was conducted by GridLAB-DTM.
A yearly load curve was constructed according to the load curves of each city and averaged PV generations of each city.
Step 5: The following calculation was performed in MATLAB at the end of the simulation year:
  • The distribution lines were upgraded by the methodology given in [39] to meet the reliability requirements of the system;
  • The upgrade deferral benefit, the monthly line loss deduction benefit, and the carbon emission benefit were calculated. Please go to [39] for a detailed explanation.
  • The distribution benefit and subsidy from distribution network were calculated according to Figure 5b.
  • The IRR of the year was calculated, and the 5-year averaged IRR was upgraded.
  • The parameters given in Table 8 were upgraded.
Step 6: If the simulation period was not reached, we returned to step 2; otherwise, we exited the simulation.

4.3. The Estimation of Sub-Indicators

In Table 9, we briefly explain how we evaluated each sub-indicator with the simulation data obtained through the co-simulation platform.

5. Analysis Results and Discussion

We designed two groups of test cases to obtain the raw data for the SDI analysis of the ADN. The raw data of each criterion in each case were standardized first. The benchmark of each criterion was taken to be the case with the maximum value.
Group 1: Comparing the SDI of the ADN of Beijing under different levels of policy support for the investment of the DGPVs.
The co-simulation of GridLAB-DTM and MATLAB was chosen for the simulation under a time-frame of 10 years. By considering the factors given in Figure 5, the latest 5-year average IRR values for PV projects of 3 kW, 100 kW, and 10 MW were calculated as the decision factors for investors to invest in DGPVs, and the state subsidy Feed-in-Tariff (FIT) was 0.42 CNY/kWh. The purchasing price of electricity produced by the DGPVs at the local wholesale benchmark price of non-sulfur coal-fired generation was around 0.35–0.45 CNY/kWh [40] plus the FIT. The sale of DGPV electric energy I E , m was calculated by Equation (3):
I E , m = ( 1 A s e l f ) E m ( P E , m ¯ + FIT ) + A s e l f E m ( P E , m + FIT )
where P E , m ¯ is the price applied to the non-self-consumed portion; E m is the monthly produced electricity; and P E , m is the sales price. A s e l f is the self-consumption proportion for 10 kW DGPVs, which was 0.8.
Table 10 lists six cases with different on-grid capacities of the DGPVs due to different levels of policy support. The indicators in the SDI index system given in Table 7 vary, resulting in different SDIs for the ADN in the same city.
Group 2: Comparing the SDIs of three different city ADNs with different levels of the global horizontal irradiance (GHI) tariff with consideration of investment feasibility.
Three cities—Beijing, Ningbo, and Chengdu—with different populations, solar resources, provincial subsidies, and an integration percentage of renewable generation at the transmission level were chosen for our analysis. The subsidy system and solar resources affected the IRR of DGPV projects in the three cities; moreover, both the level of income of the city residents and the population of the city also affected the investing volume of DGPVs. These differences resulted in the different SDIs of the three city ADNs.

5.1. The SDI of the ADN in Group 1 under Different State/Industrial Policies

The six cases in group 1 differed in terms of composite subsidy, as shown in Table 10. At the end of the 10th simulation year, the ADN of Beijing city in each case reached a different on-grid DGPV capacity and different capacity mix (3 kW, 100 kW, and 10 MW). For the ADN of the same city, we assumed that the population, increase in load, climate, air quality, and the integration level of renewable generation of the upper transmission level remained the same for each case. Therefore, the weights for indicators En3, En4, Soc4, and Soc5 were zero. We assumed that necessary upgrades were implemented to meet the reliability requirement of the state grid corporation. Therefore, the upgrade capacity of distribution feeders and the corresponding investment varied slightly due to the integration of DGPVs and the load increase. Therefore, the Ope3 values of the six cases varied little, and the Ope2 values of the six cases was the same. Ope1 evaluated the variation of loads and DGPV generation. However, the variation was low due to the integration percentage of DGPVs. Therefore, the weights of indicators in the operation dimension were very small. The installation of 10 MW DGPV occupied a large area of land. By combining it with a greenhouse project, land use could be reduced. The 3 kW and 100 kW DGPVs are commonly mounted on top of the roofs; therefore, they had no effect on land use. However, the percentage of the 10 MW DGPV varied little among the six cases, and the weight of En2 was almost zero too.
Figure 7a shows the non-zero weighted investment opportunity (Eco1), the economic efficiency (Eco2), the jobs created (Soc1), the acceptance of new technology (Soc2), and the renewable generation consumption per capita (Soc3).
Figure 7b presents the SDIs of the six cases in group 1, the on-grid capacity of the DGPVs, and the economic efficiency (Eco2). As given in Table 11, the integration proportions of the DGPVs from case 1 to case 6 were 17.4%, 17.6%, 15.7%, 13.9%, 11.7%, and 10.4%, respectively. With the decrease of on-grid DGPVs, the SDI of the ADN decreased, and the economic efficiency of the ADN increased. In the simulation, the economic efficiency of the ADN included the cost of buying electricity from the transmission system and DGPVs, which included losses from the distribution devices as well as the income from selling electricity to the end users, the investment in distribution line upgrades to maintain the same reliability level with the load increase during a period of 10 years, and the distribution compensation for DGPV investors for line loss reduction, CO2 emissions deduction, and upgrade deferral [39] (please see [39] for the detailed calculation method and results). As given in Figure 7b, the on-grid capacity of the DGPVs in the Beijing distribution network decreased as the state subsidy decreased for the generation of the DGPVs. When the distribution subsidy replaced 10% of the state subsidy, the on-grid capacity of the DGPV increased slightly more than the whole state FIT case. The SDI changed with the same pattern as the changes in the DGPV’s on-grid capacity. Due to the difference in the line loss deduction and upgrade costs for the system to maintain the same reliability level, the economic efficiency of case 2 slightly increased by 0.4% over that of case 1.

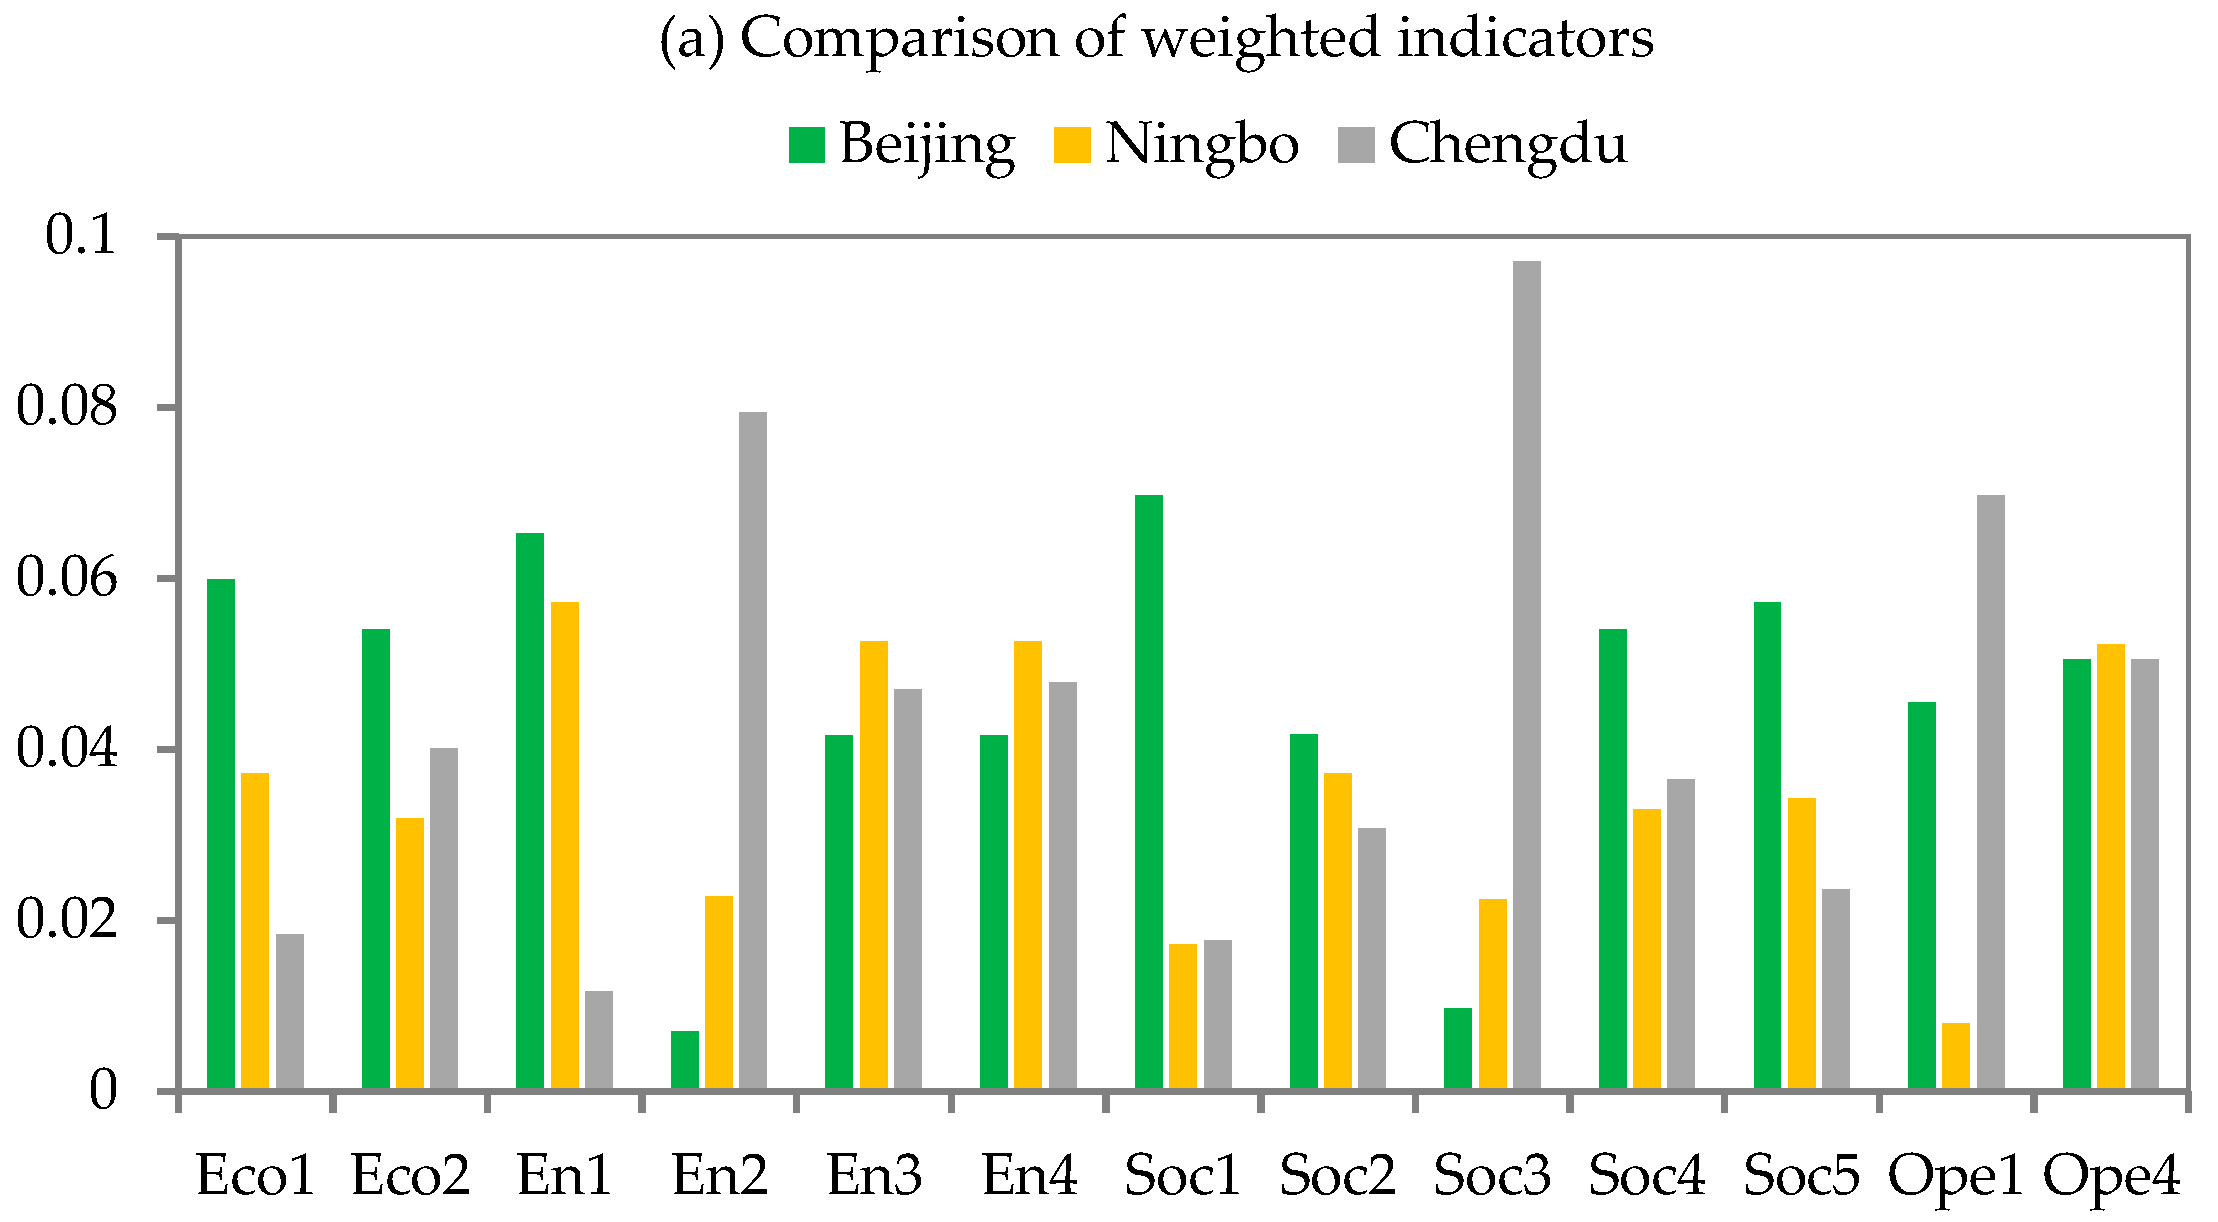
5.2. SDI Comparison of Different City ADNs

We determined the on-grid capacity of the DGPVs of three cities, Beijing, Ningbo, and Chengdu, by using the DGPV project’s investment economy. The conditions of the three cities varied in several aspects, as given in Table 12. Figure 8a shows the weighted indicators where the three cities showed differences. The distribution companies of Beijing, Ningbo and Chengdu belong to the same power grid corporation and follow the same reliability standards. Therefore, their Ope2 (reliability) values showed no differences. Ten megawatt DGPVs can provide a certain voltage control flexibility with the configuration of their communication systems, while the communication and control of 100 kW and 3 kW DGPVs will be difficult due to their geographical dispersive nature and the low capacity of a single unit. In this simulation, since the integration levels of the DGPVs of the three cities were all very low, the differences in flexibility were not obvious; therefore, in Figure 8a, Ope2 (flexibility) was omitted.
As given by Figure 8b, the weights of En1, En2, Soc1, Soc3, and Ope1 were greater than any of the others. The weighted indicators En1, En2, Soc1, Soc3, and Ope1 also showed obvious differences among the three cities. Comparing the SDIs of the three cities, we can see that the SDIs of Beijing and Chengdu showed very little difference, and the SDI of Ningbo was lower than that of the other two cities. However, the on-grid capacity of Beijing was almost four times as large as that of Chengdu. The on-grid capacities of Chengdu and Ningbo were similar. The advantage that Beijing gained by the larger on-grid capacity of the DGPV was offset by En2 and Soc3 due to the lower renewable integration level at the transmission level and the large population. For Ningbo and Chengdu, although they had almost the same integration level for the DGPV and solar resources, Chengdu came out ahead because it could buy cleaner electricity from the transmission network. The economic efficiency of the three cites, as given in Table 13, differed mainly due to the differences in the on-grid capacity of the DGPV.
From the simulation and analysis, we can see that the development of the DGPV differed in different areas due to the different solar resources, and the corresponding decrease in economic efficiency also varied but could reach the same sustainability level. Therefore, different city ADNs should set different goals for the development of DGPV. Compared with setting a fixed integration level that is applicable to all ADNs, SDI evaluation is a better tool for deciding the proper DGPV integration level of a city ADN.

6. Conclusions

An active distribution network differs from a conventional distribution system in many ways, one of which is the integration of a large amount of distributed generation, especially photovoltaics. A new party is then introduced into the operation of the distribution system. The investment in DGPVs, state policy, and the operation of the distribution system all interact and affect each other; therefore, a new perspective is needed to evaluate the development of such a complex system. Based on the review of the sustainability evaluation in power system applications and a review of a multi-dimensional index system for sustainability evaluation, we built a multi-dimension index system for the sustainability evaluation of an active distribution network with integration of DGPVs. The SDI has 15 indicators in economic, environment, social, and operation dimensions. The entropy method was used to decide the weights of each indicator. Data needed for the sustainability evaluation were obtained through simulations on the platform that we built by taking into account the interactions of the DGPV’s investors, state and industrial incentive policies, and the operation of the distribution system. Two groups of cases were designed to observe (1) the SDIs of same city ADNs under different state and industrial policies; and (2) the SDIs of different city ADNs under the same state policies.
The simulation results show that for the same city, because the solar resources, population, income level, and the environment remain roughly the same, the SDI of a city ADN increases as the integration level of DGPVs increases, while the economic efficiency of the ADN decreases as the integration level of DGPVs increases. When the state subsidy decreases by 10% and the line loss reduction benefit, carbon emission benefit, and upgrade deferral benefit are treated as distribution benefits and are returned to the DGPV’s investors (case 2), the SDI of the city ADN and the economic benefit both increase slightly, compared with the case with no distribution benefit (case 1).
The comparison of the SDIs of three different cities show that the SDI of a city ADN is affected by multiple factors. Even though the integration level of DGPV of Beijing is four times as high as that of Chengdu, the SDIs of the Beijing ADN and the Chengdu ADN are similar, because substantial differences remain in the populations, subsidy policies, distribution tariffs, residents’ income levels, and percentages of renewable generation at the transmission level of these two cities. The on-grid capacity of the DGPVs of the Chengdu ADN and Ningbo ADN are similar; however, the SDI of the former is clearly higher than that of the latter. Compared with setting a fixed integration level that is applicable to all ADNs, SDI evaluation is a better tool to decide the proper integration level of the DGPV of a city ADN.

Author Contributions

All authors worked on this manuscript together and all authors read and approved the final manuscript. Conceptualization, Z.M. and D.W.; Data curation, H.R., Z.J. and J.L.; Methodology, C.S., H.R., J.L. and D.W.; Software, C.S.; Writing—original draft, C.S. and H.R.; Writing—review & editing, H.R.

Funding

This research was partially funded by the State Grid Hebei Electric Power Corporation Limited Economic Technology Research Institute, grant number SGHEJY00GHJS1800092; CORFO (Corporación de Fomento de la Producción), project number 13CEI2-21803; the Center for Solar Energy Technology FCR—CSET (Centro de Tecnologías para Energía Solar); the Research Grant CONICYT/FONDAP/15110019 and CONICYT/FONDECYT/1181136.

Conflicts of Interest

The authors declare no conflict of interest. The founding sponsors had a role in the collection of data.

Abbreviations

ADN, ADNsActive distribution network, active distribution networks
PV, PVsPhoto Voltaic, Photo Voltaics
DG, DGsDistribution generation, distribution generations
SDISustainable development level
EVElectric vehicle
DRDemand response
DGPVDistributed PV
SDSystem dynamic
R&DResearch & Development
LOLPLoss of load probability
ELOEExpected loss of energy
GDPGross domestic product
DSODistribution system operator
TSOTransmission system operator
O&MOperation & Maintenance
IRRInternal return rate
SAIDIThe system average interruption duration index
SAIFIThe system average interruption frequency index
FITFeed-in tariff
GHIGlobal horizontal irradiance
MW106 Watts

References

  1. Picciariello, A.; Reneses, J.; Frias, P.; Soder, L. Distributed generation and distribution pricing: Why do we need new tariff design methodologies? Electr. Power Syst. Res. 2015, 119, 370–376. [Google Scholar] [CrossRef]
  2. Mirsaeidi, S.; Said, D.M.; Mustafa, M.W.; Habibuddin, M.H.; Ghaffari, K. An analytical literature review of the available techniques for the protection of micro-grids. Int. J. Electr. Power Energy Syst. 2014, 58, 300–306. [Google Scholar] [CrossRef]
  3. Balamurugan, K.; Srinivasan, D.; Reindl, T. Impact of Distributed Generation on Power Distribution Systems. Energy Procedia 2012, 25, 93–100. [Google Scholar] [CrossRef] [Green Version]
  4. Medina, R.D.; Romero, A.A.; Mombello, E.E.; Rattá, G. Assessing degradation of power transformer solid insulation considering thermal stress and moisture variation. Electr. Power Syst. Res. 2017, 151, 1–11. [Google Scholar] [CrossRef]
  5. Horowitz, K.A.; Palmintier, B.; Mather, B.; Denholm, P. Distribution system costs associated with the deployment of photovoltaic systems. Renew. Sustain. Energy Rev. 2018, 90, 420–433. [Google Scholar] [CrossRef]
  6. Sun, C.; Mi, Z.; Ren, H.; Lu, J.; Chen, Q.; Watts, D.; Zhang, L. Sustainability Evaluation in Power System Related Applications—A Review. In Proceedings of the PowerCon 2016, Wollongong, NSW, Australia, 28 September–1 October 2016. [Google Scholar]
  7. Musango, J.K.; Brent, A.C. A conceptual framework for energy technology sustainability assessment. Energy Sustain. Dev. 2011, 15, 84–91. [Google Scholar] [CrossRef] [Green Version]
  8. Santoyo-Castelazo, E.; Azapagic, A. Sustainability assessment of energy systems: Integrating environmental, economic and social aspects. J. Clean. Prod. 2014, 80, 119–138. [Google Scholar] [CrossRef]
  9. Helms, T.; Loock, M.; Bohnsack, R. Timing-based business models for flexibility creation in the electric power sector. Energy Policy 2016, 92, 348–358. [Google Scholar] [CrossRef]
  10. Luthra, S.; Mangla, S.K.; Kharb, R.K. Sustainable assessment in energy planning and management in India perspective. Renew. Sustain. Energy Rev. 2015, 47, 58–73. [Google Scholar] [CrossRef]
  11. Guo, X.; Guo, X. China’s photovoltaic power development under policy incentives: A system dynamics analysis. Energy 2015, 93, 589–598. [Google Scholar] [CrossRef]
  12. Han, J.; Tan, Z. Models for evolution of China electricity system in long run. Syst. Eng. Theory Pract. 2010, 30, 1521–1529. [Google Scholar]
  13. Iddrisu, I.; Bhattacharyya, S.C. Sustainable Energy Development Index: A multi-dimensional indicator for measuring sustainable energy development. Renew. Sustain. Energy Rev. 2015, 50, 513–530. [Google Scholar] [CrossRef] [Green Version]
  14. Golušin, M.O.; Ivanović, M.; Redžepagić, S. Transition from traditional to sustainable energy development in the region of Western Balkans–Current level and requirements. Appl. Energy 2013, 101, 182–191. [Google Scholar] [CrossRef]
  15. Schlor, H.; Fischer, W.; Hake, J.-F. Methods of measuring sustainable development of the German energy sector. Appl. Energy 2013, 101, 172–181. [Google Scholar] [CrossRef]
  16. Angelis-Dimakis, A.; Arampatzis, G.; Assimacopoulos, D. Monitoring the sustainability of the Greek energy system. Energy Sustain. Dev. 2012, 16, 51–56. [Google Scholar] [CrossRef] [Green Version]
  17. Sharma, T.; Balachandra, P. Benchmarking sustainability of Indian electricity system: An indicator approach. Appl. Energy. 2015, 142, 206–220. [Google Scholar] [CrossRef] [Green Version]
  18. Doukas, H.; Papadopoulou, A.; Savvakis, N.; Tsoutsos, T.; Psarras, J. Assessing energy sustainability of rural communities using Principal Component Analysis. Renew. Sustain. Energy Rev. 2012, 16, 1949–1957. [Google Scholar] [CrossRef]
  19. Prete, C.L.; Hobbs, B.F.; Norman, C.S.; Cano-Andrade, S.; Fuentes, A.; Von Spakovsky, M.R.; Mili, L. Sustainability and reliability assessment of microgrids in a regional electricity market. Energy 2012, 41, 192–202. [Google Scholar] [CrossRef]
  20. Mainali, B.; Silveira, S. Using a sustainability index to assess energy technologies for rural electrification. Renew. Sustain. Energy Rev. 2015, 41, 1351–1365. [Google Scholar] [CrossRef]
  21. Dombi, M.; Kuti, I.; Balogh, P. Sustainability assessment of renewable power and heat generation technologies. Energy Policy 2014, 67, 264–271. [Google Scholar] [CrossRef]
  22. Maxim, A. Sustainability assessment of electricity generation technologies using weighted multi-criteria decision analysis. Energy Policy 2014, 65, 284–297. [Google Scholar] [CrossRef]
  23. Liu, J.; Zuo, J.; Sun, Z.; Zillante, G.; Chen, X. Sustainability in hydropower development—A case study. Renew. Sustain. Energy Rev. 2013, 19, 230–237. [Google Scholar] [CrossRef]
  24. Karger, C.R.; Hennings, W. Sustainability evaluation of decentralized electricity generation. Renew. Sustain. Energy Rev. 2009, 13, 583–593. [Google Scholar] [CrossRef]
  25. Afgan, N.H.; Carvalho, M.G.; Carvalho, M.D.G. Sustainability assessment of a hybrid energy system. Energy Policy 2008, 36, 2903–2910. [Google Scholar] [CrossRef]
  26. Stamford, L.; Azapagic, A. Sustainability indicators for the assessment of nuclear power. Energy 2011, 36, 6037–6057. [Google Scholar] [CrossRef]
  27. Stamford, L.; Azapagic, A. Life cycle sustainability assessment of electricity options for the UK. Int. J. Energy Res. 2012, 36, 1263–1290. [Google Scholar] [CrossRef]
  28. Simsek, Y.; Watts, D.; Escobar, R. Sustainability evaluation of Concentrated Solar Power (CSP) projects under Clean Development Mechanism (CDM) by using Multi Criteria Decision Method (MCDM). Renew. Sustain. Energy Rev. 2018, 93, 421–438. [Google Scholar] [CrossRef]
  29. Poudineh, R.; Jamasb, T. Distributed generation, storage, demand response and energy efficiency as alternatives to grid capacity enhancement. Energy Policy 2014, 67, 222–231. [Google Scholar] [CrossRef] [Green Version]
  30. Heydarian-Forushani, E.; Golshan, M.E.H.; Siano, P.; Golshan, M.E.H. Evaluating the Operational Flexibility of Generation Mixture with an Innovative Techno-Economic Measure. IEEE Trans. Power Syst. 2018, 33, 2205–2218. [Google Scholar] [CrossRef]
  31. Bri-Mathias Hodge. Renewable Energy Integration from Resource Assessment to Power System Impacts. Available online: http://inside.mines.edu/UserFiles/File/Nuclear/Bri-Mathius%20seminar.pdf (accessed on 22 January 2019).
  32. Lund, P.D.; Lindgren, J.; Mikkola, J.; Salpakari, J. Review of energy system flexibility measures to enable high levels of variable renewable electricity. Renew. Sustain. Energy Rev. 2015, 45, 785–807. [Google Scholar] [CrossRef] [Green Version]
  33. D’Hulst, R.; Labeeuw, W.; Beusen, B.; Claessens, S.; Deconinck, G.; Vanthournout, K. Demand response flexibility and flexibility potential of residential smart appliances: Experiences from large pilot test in Belgium. Appl. Energy 2015, 155, 79–90. [Google Scholar] [CrossRef]
  34. Munshi, A.A.; Mohamed, Y.A.-R.I. Extracting and Defining Flexibility of Residential Electrical Vehicle Charging Loads. IEEE Trans. Ind. Inform. 2018, 14, 448–461. [Google Scholar] [CrossRef]
  35. Statistics of Population Growth Rate in China in 2014. Available online: http://data.stats.gov.cn/easyquery.htm?cn=C01&zb=A0302&sj=2014 (accessed on 26 March 2016).
  36. Li, W. Risk Analysis of Power Systems—Models, Methods, and Applications; John Wiley & Sons: Hoboken, NJ, USA, 2005. [Google Scholar]
  37. Zhang, F.; Deng, H.; Margolis, R.; Su, J. Analysis of distributed-generation photovoltaic deployment, installation time and cost, market barriers, and policies in China. Energy Policy 2015, 81, 43–55. [Google Scholar] [CrossRef] [Green Version]
  38. Jeon, C.; Shin, J. Long-term renewable energy technology valuation using system dynamics and Monte Carlo simulation: Photovoltaic technology case. Energy 2014, 66, 447–457. [Google Scholar] [CrossRef]
  39. Sun, C.; Mi, Z.; Ren, H.; Wang, F.; Chen, J.; Watts, D.; Lu, J. Study on the Incentives Mechanism for the Development of Distributed Photovoltaic Systems from a Long-Term Perspective. Energies 2018, 11, 1291. [Google Scholar] [CrossRef]
  40. Zhang, Y.; Peng, X.; Du, M.; Zhou, B.; Li, Z. Research on comprehensive compensation mechanism of distributed generation. Power Demand Side Manag. 2015, 17, 13–20. [Google Scholar]
Figure 1. The classification of Sustainability evaluation (SE) on energy related topics. [Reproduced with permission from [6], Chenjun Sun, etc., IEEE Proceedings, IEEE, 2016.]
Energies 12 00369 g001
Figure 2. The extended business model for a distribution system operator (DSO). Lines in different colors are used to increase clarity. [Reproduced/Adapted with permission from [29]. Energy Policy, Elsevier, 2014.]
Energies 12 00369 g002
Figure 3. The classification of interventions to increase flexibility [31]. RE: renewable generations.
Energies 12 00369 g003
Figure 4. Interactions among multiple entities involved in the operation and planning of an ADN.
Energies 12 00369 g004
Figure 5. Factors affecting the investment of DGPVs [39]. (a) Factors that affect the investment feasibility of DGPVs. (b) Benefits of the integration of a DGPV into the distribution network.
Energies 12 00369 g005
Figure 6. Co-simulation by GridLAB-DTM and MATLAB.
Energies 12 00369 g006
Figure 7. Indicators and SDIs of six cases in group 1. (a) Comparison of the significant weighted indicators; (b) comparison of the SDI, the on-grid capacity of the DGPVs, and the economic efficiency.
Energies 12 00369 g007
Figure 8. Comparison of sustainability evaluation of three city ADNs. (a) Comparison of the weighted indicators; (b) weights of the indicators; (c) annual generation of per kW DGPVs.
Energies 12 00369 g008aEnergies 12 00369 g008b
Table 1. An introduction of works in the sustainability evaluation of power system-related fields [Adapted with permission from [6], Chenjun Sun, etc., IEEE Proceedings, IEEE, 2016.]
Ref.Pub. TimeReg.Time FrameScopeDimension/IndicatorsMethodsMain Contributions
[10]2015India-National level, power system5/26Sensitivity analysis
Fuzzy AHP method
Proposes a decision framework for policy makers to assess the sustainability in energy systems. Sensitivity analysis is provided.
[13]2015Multiple countries-Energy system5/11-Provides a review of the indicator sustainable energy development index (SEDI). Provides a correlation analysis of SEDI and other well-accepted indexes. Twenty countries are ranked by SEDI.
[14]2013Balkans-Regional level3/10-National energy development in six countries in the Balkan area. A composite index by weighted summation of indicators is provided.
[15]2013German1997–2050National energy system3/7-SE of the German power sector. Provides two aggregated indexes, and considers the over-fulfillment issue. Compares the equal pillar method and the equal indicator method.
[16]2012GreeceRecent 50 yearsNational energy system3/9-Provides the evolution of sustainability indexes of Greek energy systems.
[17]2015India-National energy system4/85-Provides threshold values, and accounts for attributes in various dimensions to give better understanding of the position of India. Provides a method to construct the baseline for electricity sustainability indicators. Proposes the National Electricity System Sustainability Index (NESSI)
[18]2012European community-Rural electrification-/9Principle component analysis (PCA)Proposes the Energy Sustainability Index (ESI). Compares eight rural (mountainous, agricultural, and island) communities in different countries.
[19]2012Northwest Europe-Micro-grid4/11Sensitivity analysis, scenario analysisA power market model (COMPETES models are applied to 12 power producers in four countries) and reliability evaluation model are imbedded.
[20]2015Sweden2005, 2010, 2015Generation technology for rural electrification5/11PCAProposes the ETSI (Energy Technology Sustainability Index).
[21]2014Hungary-Generation & heat technologies-/7-Sustainability assessment of 10 generation technologies and seven technologies of heat supply. Weights of indicators are decided by a survey.
[22]2014Romania-Generation technologies4/10Weighted sum Multi-attribute utility methodProposes a sustainability assessment framework and ranks 13 generation technologies. Uses numerical valuation approaches for missing data.
[8]2014Mexico-Generation technologies-/17Scenario analysis, life-cycle analysis, SMARTEleven scenarios. The results suggested that trade-offs are obligatory to identify the ‘most sustainable’ option.
[23]2013China-Hydro power development3/---Three Gorges Project evaluation.
[24]2009German-Distributed generation technologies5/19Scenario analysis, value tree analysis--
[25]2008Belgium-Multi-generation technologies-/5Sensitivity analysis of weight coefficientsSE of power system with hybrid generation technologies (four generation technologies)
[26,27]2011/2012UK-Nuclear generation technologies3/43Life-cycle analysisProposes a decision framework for policy makers to assess the sustainability of energy systems. A sensitivity analysis is provided
[28]2018Multiple countries-Concentrated solar power projects4/10Multiple weighting comparisonProposes a framework and provides a method of understanding for decision makers to evaluate the sustainability of CDM energy projects. Provides perceptions to future installations and further insights for the development of sustainable CDM energy projects around the world.
Table 2. The most commonly utilized economic indicators.
Economic IndicatorsClassification
Investment opportunitiesClass 1 indicators: investment opportunities
GDP
Availability of funds
Cross-subsidization
Energy productivityClass 2 indicators: related to techniques
Economic effectiveness
Energy raw material productivity
Fuel cost
Capital and energy levelized cost
Payback period
Net profit on capita
Competitiveness of economy
Affordability
Operational life
Offsetting infrastructure costClass 3 indicators: others
R&D expenditure
Economic sustainability
Savings on greenhouse gas emissions
Table 3. The most commonly utilized environment indicators.
Environment IndicatorsClassification
Emissions, pollutantsClass 1 indicators: direct effect on environment
Carbon emission
Land use
Water use
Air quality in the region
Fossil fuel depletion
Noise and light pollution
Soil quality degradation
Land transformation
Use of chemicals
Freshwater eutrophication
Interference in the landscape
Need for waste disposal
Climate-related problems and issues
Acidification potential
Resource efficiency
Biodiversity and ecological impactClass 2 indicators: indirect effect
The impact of local residential life
Adoption of independently audited environmental management systemClass 3 indicators: administrative measures
Environmental management
Table 4. The most commonly utilized social indicators.
Social IndicatorsClassification
Job creation and employmentClass 1 indicators: direct
Salary
Improved service availability
Social benefits
Cultural heritage protection
Impact on the local economyClass 2 indicators: indirect
Impact on human health
Impact on life quality
Effect on surrounding region
Energy security of households
Eliminating social inequality
Social acceptanceClass 3 indicators:
Local government support
Public support
Feasibility
Shaping new energy cultureClass 4 indicators: administrative or comprehensive indicators
Risk analysis and management
Compatibility with political, legislative framework
Fatalities
Table 5. The most commonly utilized technical indicators.
Technical IndicatorsClassification
EfficiencyClass 1 indicator: related to efficiency and its calculation
Exergy efficiency
Transmission loss
Distribution loss
Capacity factor
Reserve/production ratio
Storage hours
Demand
Potential power generation
Direct energy consumption
Operation temperature
Reliability
Duration of plant power outageClass 2 indicator: performance
Network availability
Continuity and predictability of performance
Safety of energy system
Hybridization
Micro grid suitabilityClass 3 indicator: integrated ones
Technology maturity
Augmentation capability
Table 6. Examples of sustainable development criteria of power system applications at different levels [9,15,18].
DimensionNational Energy SystemPower SystemMicro-Grid
EconomicEnergy productivityPayback period, economic efficiency, investment opportunityAnnualized capital costs
EnvironmentalEmissions, land use,Emissions and management, land use and managementEmissions
SocialEmploymentSocietal equity, human health, social acceptance, cultural, living standard-
Technical, operational, reliabilityReliability, flexibilityReliability, flexibility, resource allocation and usage, diversification in source.Electric efficiency, Loss of load probability (LOLP), Expected loss of energy (ELOE)
Table 7. Sustainability indicators of an active distribution network (ADN).
Economic DimensionEnvironment DimensionSocial DimensionOperation Dimension
1. Investment opportunity1. Pollutant1. Employment1. Energy efficiency
2. Economic efficiency2. Land use2. Acceptance of new technology2. Variability
3. Climate3. Renewable energy consumption per capita3. Reliability
4. Air quality4. Income level4. Flexibility
5. Impact on life quality
Table 8. Variation in parameters during the simulation.
Annually Changed FactorsTrendPercentage and Explanation
PopulationUp+0.5%/year [35]
Load demandUp+2%/year [36]
O&M costsUp+2.5%/year [37]
Electricity priceUp+1%/year, based on historical data [37]
Investment of distributed PV panelsDownPredicted based on the two-factor learning curve [38]
Population interested in new technology Up+5% to reflect the increase of awareness of new technology
Table 9. Introduction of data for the calculation of the sustainable development level (SDI).
Data by GridLAB-DTM/MATLABData by EstimationDescription
System Demand--
Losses
Voltage
Power flow
SAIDI/SAIFI
Distribution line margin
-ReliabilityEstimated by SAIDI (The system average interruption duration index) and SAIFI (The system average interruption frequency index), voltage quality, and power flow margin
O&M costEstimated by the size of the distribution system and the integration capacity of renewable generations
Auxiliary service securedEstimated by the capacity of the DGPV with voltage control capability
Income from data serviceOmitted in the simulation
Income from balancing serviceOmitted in the simulation
Electricity purchasing costCost of purchasing electricity from the transmission network and DGPV/energy storage/EV
Income of electricity sellingEstimated by the load mix of each city and the tariff for the residential load, commercial load, and industrial load
Integration costNo integration fee is charged right now in China
Upgrade costCalculated by the method given in the Appendix of [39]
Capacity of integrated DGEstimated by the model given in [39]
Energy efficiencyEstimated by the capacities of the distribution devices and load demand
Table 10. Case introduction. The distribution benefit evaluation is shown in Figure 5b.
CasesFIT
Case 1state FIT = 0.42 CNY/kWh
Case 20.9 × state FIT + Distribution benefit
Case 30.8 × state FIT + Distribution benefit
Case 40.7 × state FIT + Distribution benefit
Case 50.6 × state FIT + Distribution benefit
Case 60.5 × state FIT + Distribution benefit
Table 11. Integration percentage of DGPVs (on-grid capacity of DGPV/averaged daily load demand) taking into account the investment economy.
Case 1Case 2Case 3Case 4Case 5Case 6
17.4%17.6%15.7%13.9%11.7%10.4%
Table 12. Difference of three city ADNs.
ItemsBeijingNingboChengdu
DGPV’s annual generation (kWh/kW) *140410841050
Population (104)2172.97872030
State subsidy + city subsidy (Yuan/kWh)0.37 + 0.30.37 + 0.150.37 + 0
Standardized income level by average salary10.6090.675
Percentage of renewable generation at the transmission level0.080.1930.835
* by PVWatts and the coordinates of three cities.
Table 13. Comparison of economic efficiency of three city ADNs.
ItemBeijingNingboChengdu
Economic Efficiency10.5910.743
Note: the economic efficiency of Beijing was used as the benchmark.

