Article

Optimal Deception Strategies in Power System Fortification against Deliberate Attacks

1
College of Systems Engineering, National University of Defense Technology, Changsha 410073, China
2
Energy Internet Research Center, China Aerospace Science and Technology Corporation, Beijing 100048, China
3
State Key Laboratory of High Performance Computing, National University of Defense Technology, Changsha 410073, China
*
Author to whom correspondence should be addressed.
Energies 2019, 12(3), 342; https://doi.org/10.3390/en12030342
Submission received: 27 December 2018 / Revised: 16 January 2019 / Accepted: 17 January 2019 / Published: 22 January 2019
(This article belongs to the Section F: Electrical Engineering)

Abstract

:
As a critical infrastructure, the modern electrical network is faced with various types of threats, such as accidental natural disaster attacks and deliberate artificial attacks, thus the power system fortification has attracted great concerns in the community of academic, industry, and military. Nevertheless, the attacker is commonly assumed to be capable of accessing all information in the literature (e.g., network configuration and defensive plan are explicitly provided to the attacker), which might always be the truth since the grid data access permission is usually restricted. In this paper, the information asymmetry between defender and attacker is investigated, leading to an optimal deception strategy problem for power system fortification. Both the proposed deception and traditional protection strategies are formulated as a tri-level mixed-integer linear programming (MILP) problem and solved via two-stage robust optimization (RO) framework and the column-and-constraint generation (CCG) algorithm. Comprehensive case studies on the 6-bus system and IEEE 57-bus system are implemented to reveal the difference between these two strategies and identify the significance of information deception. Numerical results indicate that deception strategy is superior to protection strategy. In addition, detailed discussions on the performance evaluation and convergence analysis are presented as well.

1. Introduction

In order to facilitate the community to achieve stable and reliable power supply, a lot of new technologies and equipment are extensively integrated into the modern power grid, such as advanced metering infrastructure (AMI) and intelligent electronic device (IED). Definitely, the integration of new items complicates the network, leading to a reduction of system invulnerability since more accessories mean higher failure probability and the supervisory control and data acquisition (SCADA) is more difficult to implement in complex systems [1]. In addition to critical reliability issues, the power grid suffers various types of threats, e.g., accidental natural disaster attacks [2,3] and deliberate artificial attacks (military or terrorist, since power grid is a critical infrastructure) [4], causing huge economic losses and major social impacts due to the resulting cascading failures. Therefore, the power system fortification has attracted great concerns in the community of academics, industry, and military.
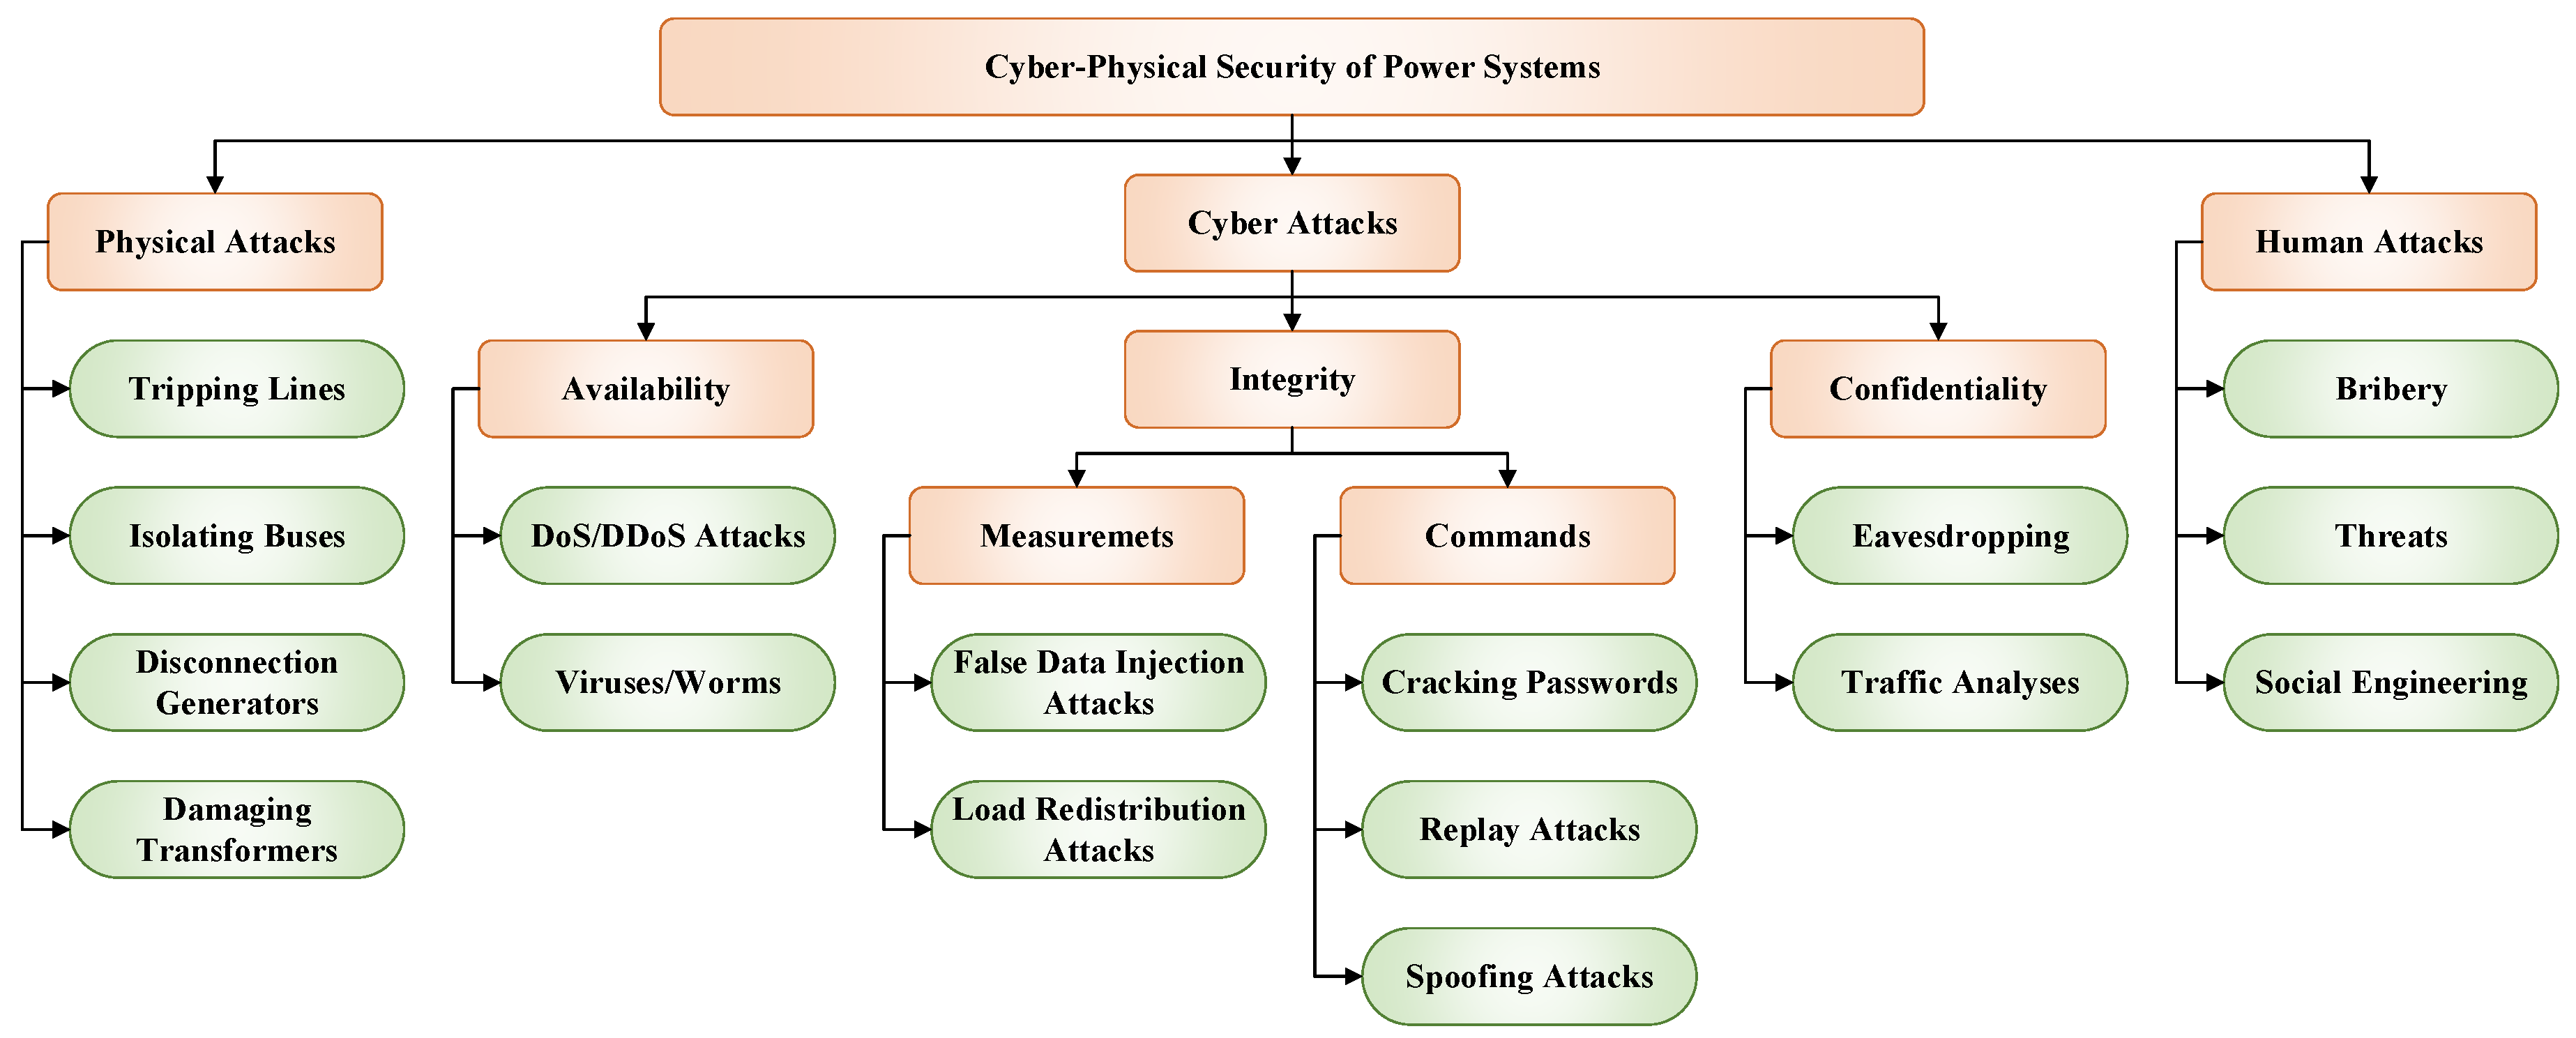
In order to design a robust fortification plan, the target attack pattern should be determined first. It is reported in [5] that attacks are mainly implemented on three aspects: physical, cyber, and human since the power grid is a cyber-physical interconnected network operated by engineers. For quick reference, Figure 1 depicts a full scheme of different attacks, where each type is investigated in the literature with either separated or coordinated pattern. In [6], a general mathematical framework for cyber-physical systems, attacks, and monitors is proposed for power systems, transportation networks, industrial control processes, and critical infrastructures. In [7], several physical attack scenarios are fabricated and investigated, where system potential cascading events are modeled with power flow calculation, hidden failures are simulated by the Monte Carlo method, and operator performance is analyzed via a simple human reliability model. Cyber systems are extensively integrated in the physical grid for power generation, transmission, and distribution, such as communication networks, metering units, and control centers, etc. [8]. In cyber-physical systems, deliberate attacks are implemented not only on their physical infrastructure, but also on their data management and communication layer [6]. A  comprehensive review of false data injection attack (FDIA) is given in [9], where theoretical basis, physical and economical impacts, defensive strategies, and potential future research directions of FDIA are investigated and discussed. The optimal attacks implemented on substations and transmission lines are investigated in [10] based on the proposed component interdependency graph. The contribution and impact of branches when they are employed or removed from a power system are analyzed in  [11], leading to the identification of sensitive regions of each line based on a cyclic addition algorithm. In Refs. [12] and [13], the cascading failures caused by line breakdown is investigated using complex network theories, such as small-world and scale-free networks, where electrical characteristics of nodes are considered on the basis of pure structure topology. Although there are various types of attacks, physical attack via tripping lines is determined as the target attack pattern in this paper. We intend to claim that, although the exemplified attack is tripping lines, the solution methodology reported in this paper can be easily extended to other types of attacks.
Faced with different kinds of attacks, the defensive plan could be various. Taking the tripping line attack as an example, the defensive strategy includes: (1) adding new devices (both generators and transmission lines) to improve the redundancy; (2) enhancing the defensive strength to guarantee the protected assets are invulnerable during attacks; and (3) allocating portable components (e.g., distributed generators) to dynamically reconfigure the distribution network. Whatever the attack pattern and defense resource are, the optimization problem of generating an optimal defensive plan is related to two opposite agents, i.e., the defender and attacker to protect and destroy the system respectively. According to the number of action rounds, the game between these agents can be classified as an attacker–defender (AD) model and the defender–attacker–defender (DAD) model. Traditionally, the AD model is formulated as the bi-level min–max programming problem, which is challenging due to its non-convex discrete property. In [14], an equivalent single-level reformulation of the AD model is proposed to address the optimal defense problem, where transmission line switching is employed for protection. A coordinated cyber-physical attack is analyzed in a proposed bi-level model in [15], which  is transformed into a mixed-integer linear programming (MILP) problem and addressed via a rigorous two-stage solution approach. In order to investigate cyber-attack on multiple transmission lines in economic dispatch, a bi-level MILP model with the capability to overload branches is proposed in [16], where remarkable computational efficiency is achieved.
On the other hand, the DAD model is usually formulated as a tri-level programming problem with three rounds of action [17]:
  • In the first stage (upper-level problem), the defender determines an optimal defensive plan with the goal of minimizing system power imbalance/mismatch, where the reaction of attacker should be considered and the defensive resource is limited.
  • In the second stage (middle-level problem), the attacker is faced with an enhanced system where the defensive plan generated in the first stage has been implemented, and whose goal is maximizing the unserved energy of the confronted network with restricted attack resources.
  • In the third stage (lower-level problem), both initial defensive plan and subsequent attack scheme have been carried out, leading to a partially destroyed system, whose power imbalance will be minimized in this stage via system redispatch.
In order to defend against terrorist attacks, a tri-level optimization model of resource allocation is proposed in [18], which is then tackled by a decomposition approach. The superiority of tri-level optimization over bi-level optimization in electric power network defense is validated with case studies. In [19], uncertain attacks and load types are integrated into the DAD model for power system protection, which is then addressed by two-stage robust optimization (RO) approach and column-and-constraint generation (CCG) algorithm. The CCG method is proposed in [20] and [21], whose performance in RO framework has been extensively verified on different types of power system optimization problems, such as transmission expansion planning [22], economic dispatch  [23], unit commitment [24], and distribution network reconfiguration [25], etc. Based on RO and CCG, a  lot of power system defensive research has been implemented, e.g., Ref. [26] investigates the problem of allocating fortification resources with the objective of maximizing the power system’s immunity against malicious attacks, Ref. [27] proposes an approach to mitigate network vulnerability toward worst-case spatially localized attacks, and Ref. [28] develops a practical and efficient tool for utility transmission planners to protect critical facilities from potential physical attacks, etc.
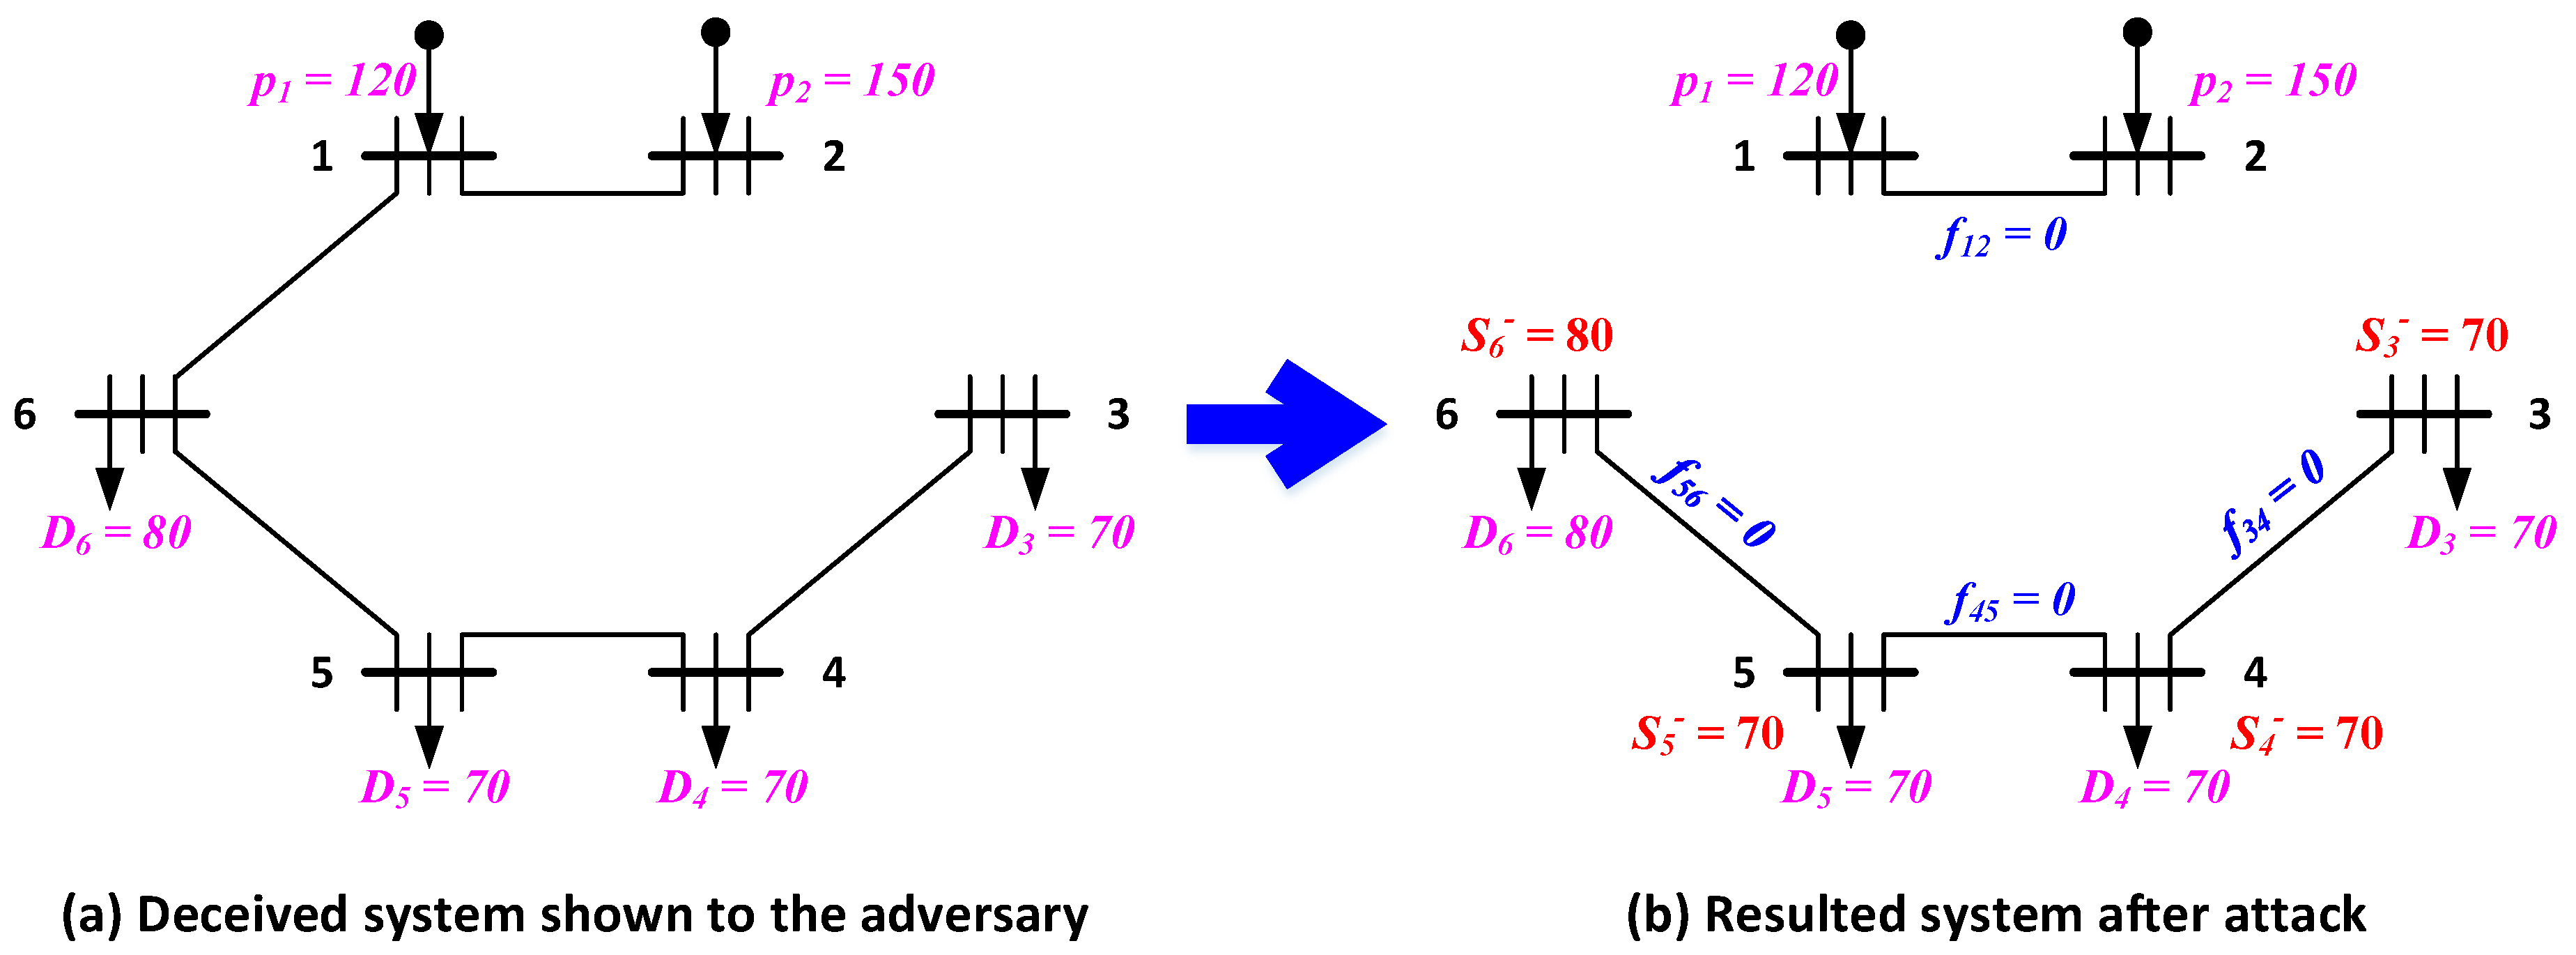
Although advanced algorithms and sophisticated problem formulations are proposed in the literature, one limitation is shared in the above references, i.e., the attacker is assumed to be capable of accessing sufficient information. The attacker’s decision is made in the second stage based on all information revealed at that time. In the literature, it is commonly assumed that all information is accessible by the attacker including network topology, device parameters, physical capacity, and defensive decisions made by the defender in the first stage. Nevertheless, it is very difficult or even impossible to get access all information, especially in war and terrorist attacks where the defender is supposed to hide some critical information or even do some deception activities. Actually, in a DAD model, the attacker is exposed to the defender due to: (1) the attacker always intends to cause the worst consequence, thus the decision can be figured out if the input information is fixed; and (2) the defender’s decision can withstand the worst case incurred by the attacker, not to mention those randomly generated attack plans. It can be concluded that there is an information asymmetry between the defender and attacker, which can be utilized to squeeze benefits. For example, given a real configuration A, if the information is symmetry, then the worst attack plan B will be proposed by the attacker, leading to a system power imbalance M. On the other hand, if the deception strategy is implemented to show a fake configuration A to the attacker, then the worst attack plan B will be generated, whose power mismatch is M . For real configuration A, as the DAD model is targeted at the worst case, it can be concluded that there is no attack can produce larger power mismatch than M, i.e., M M , thus the system power imbalance might be reduced by information asymmetry.
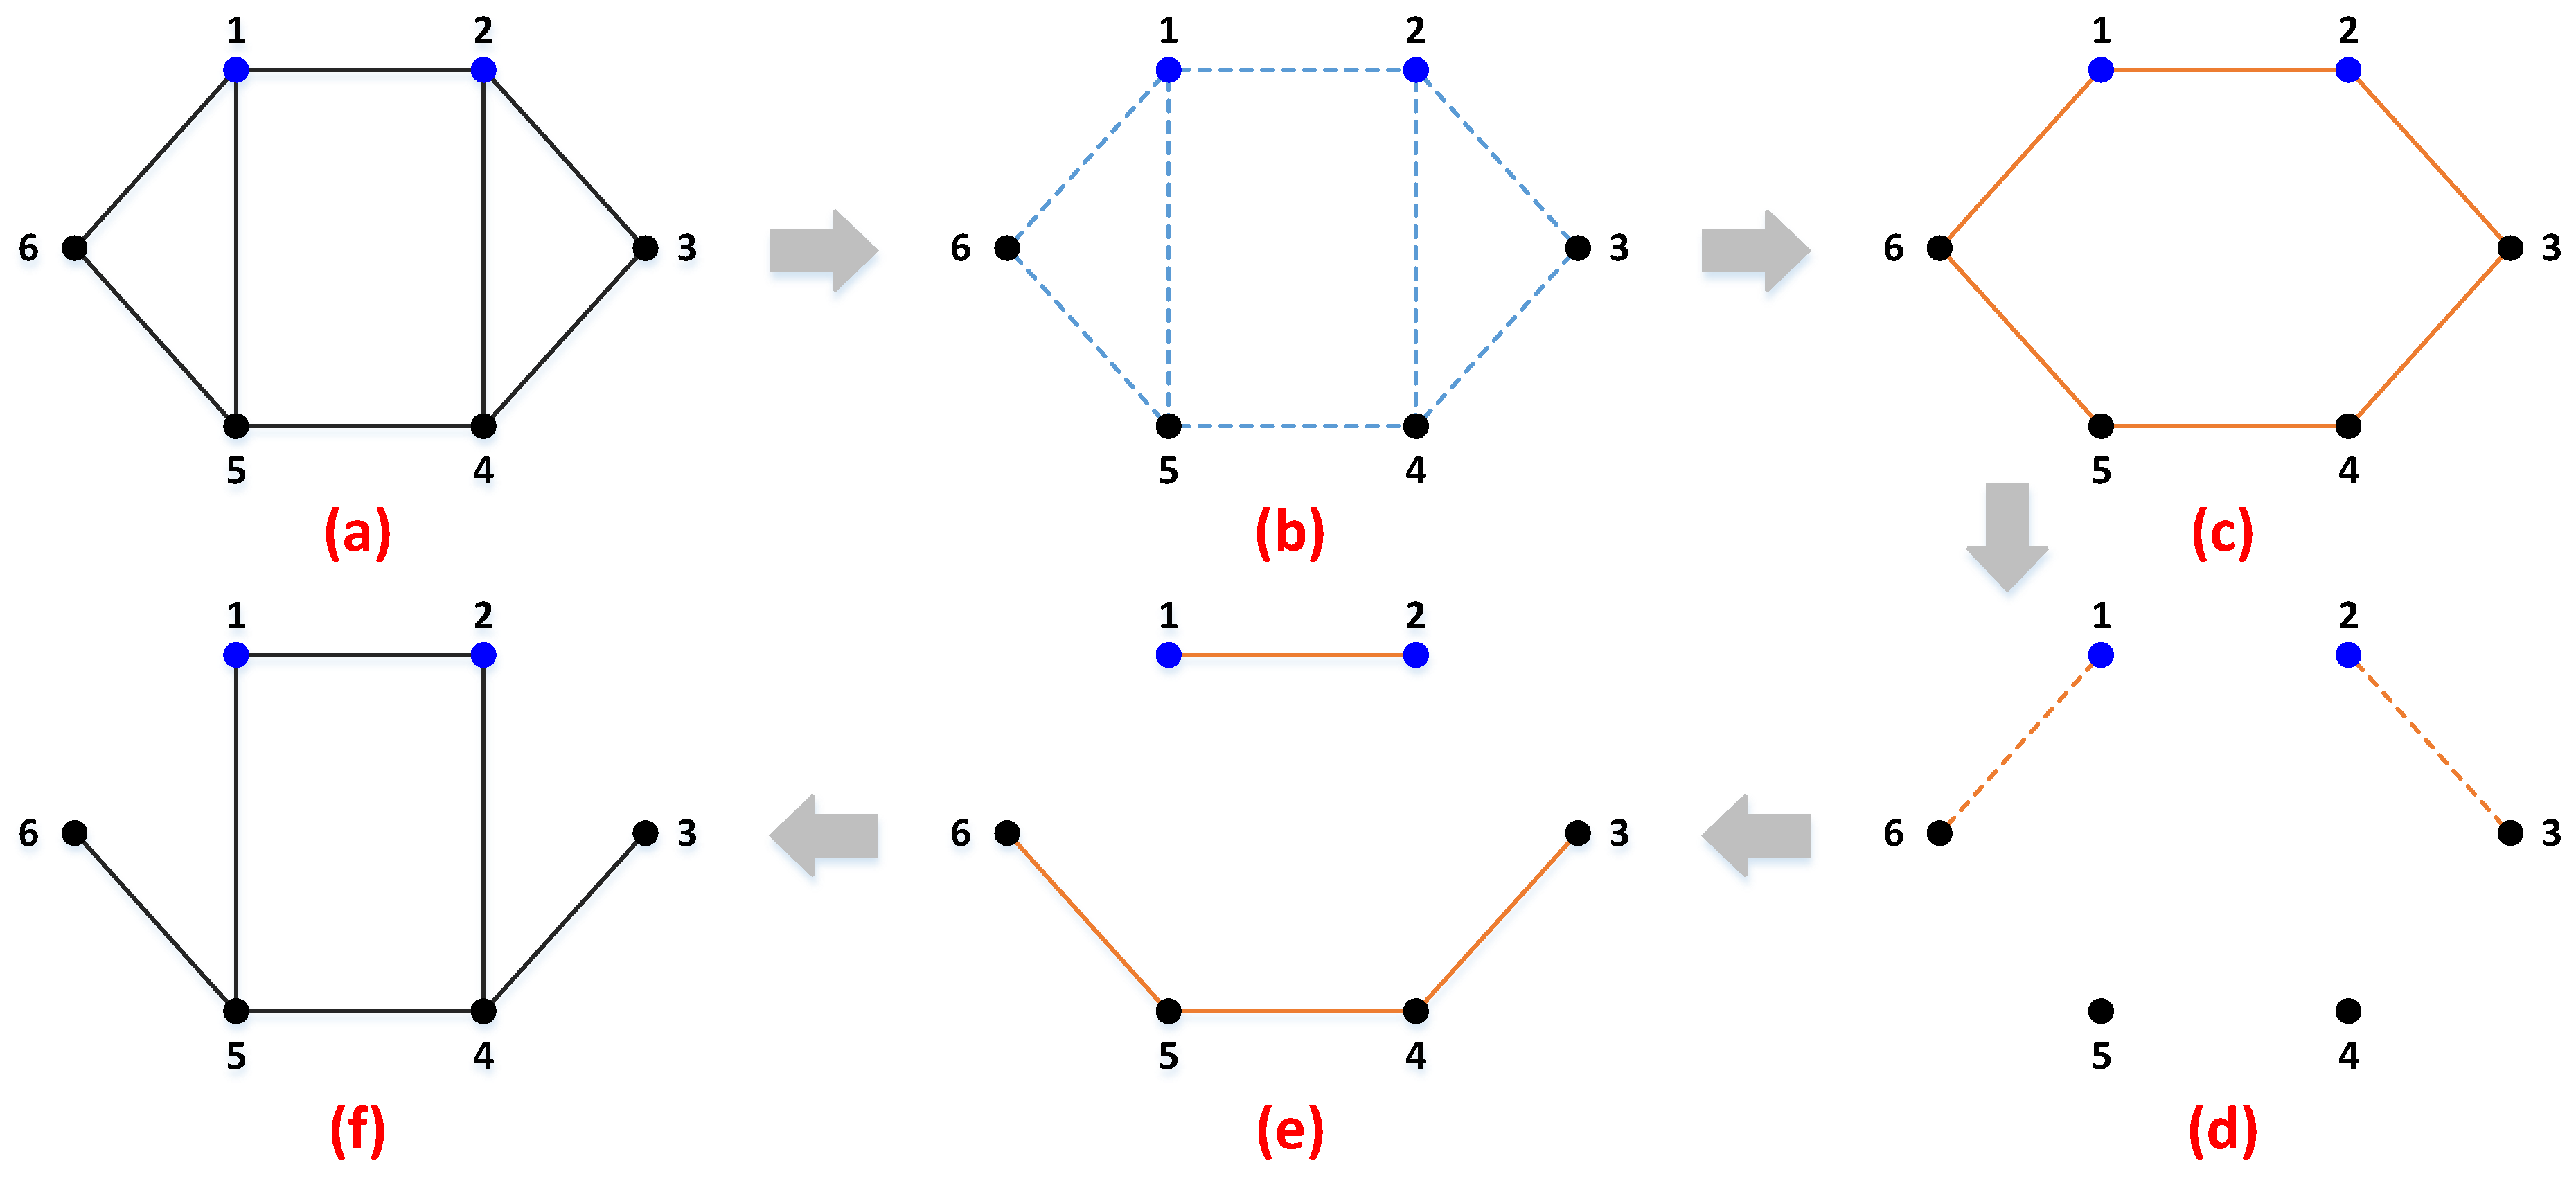
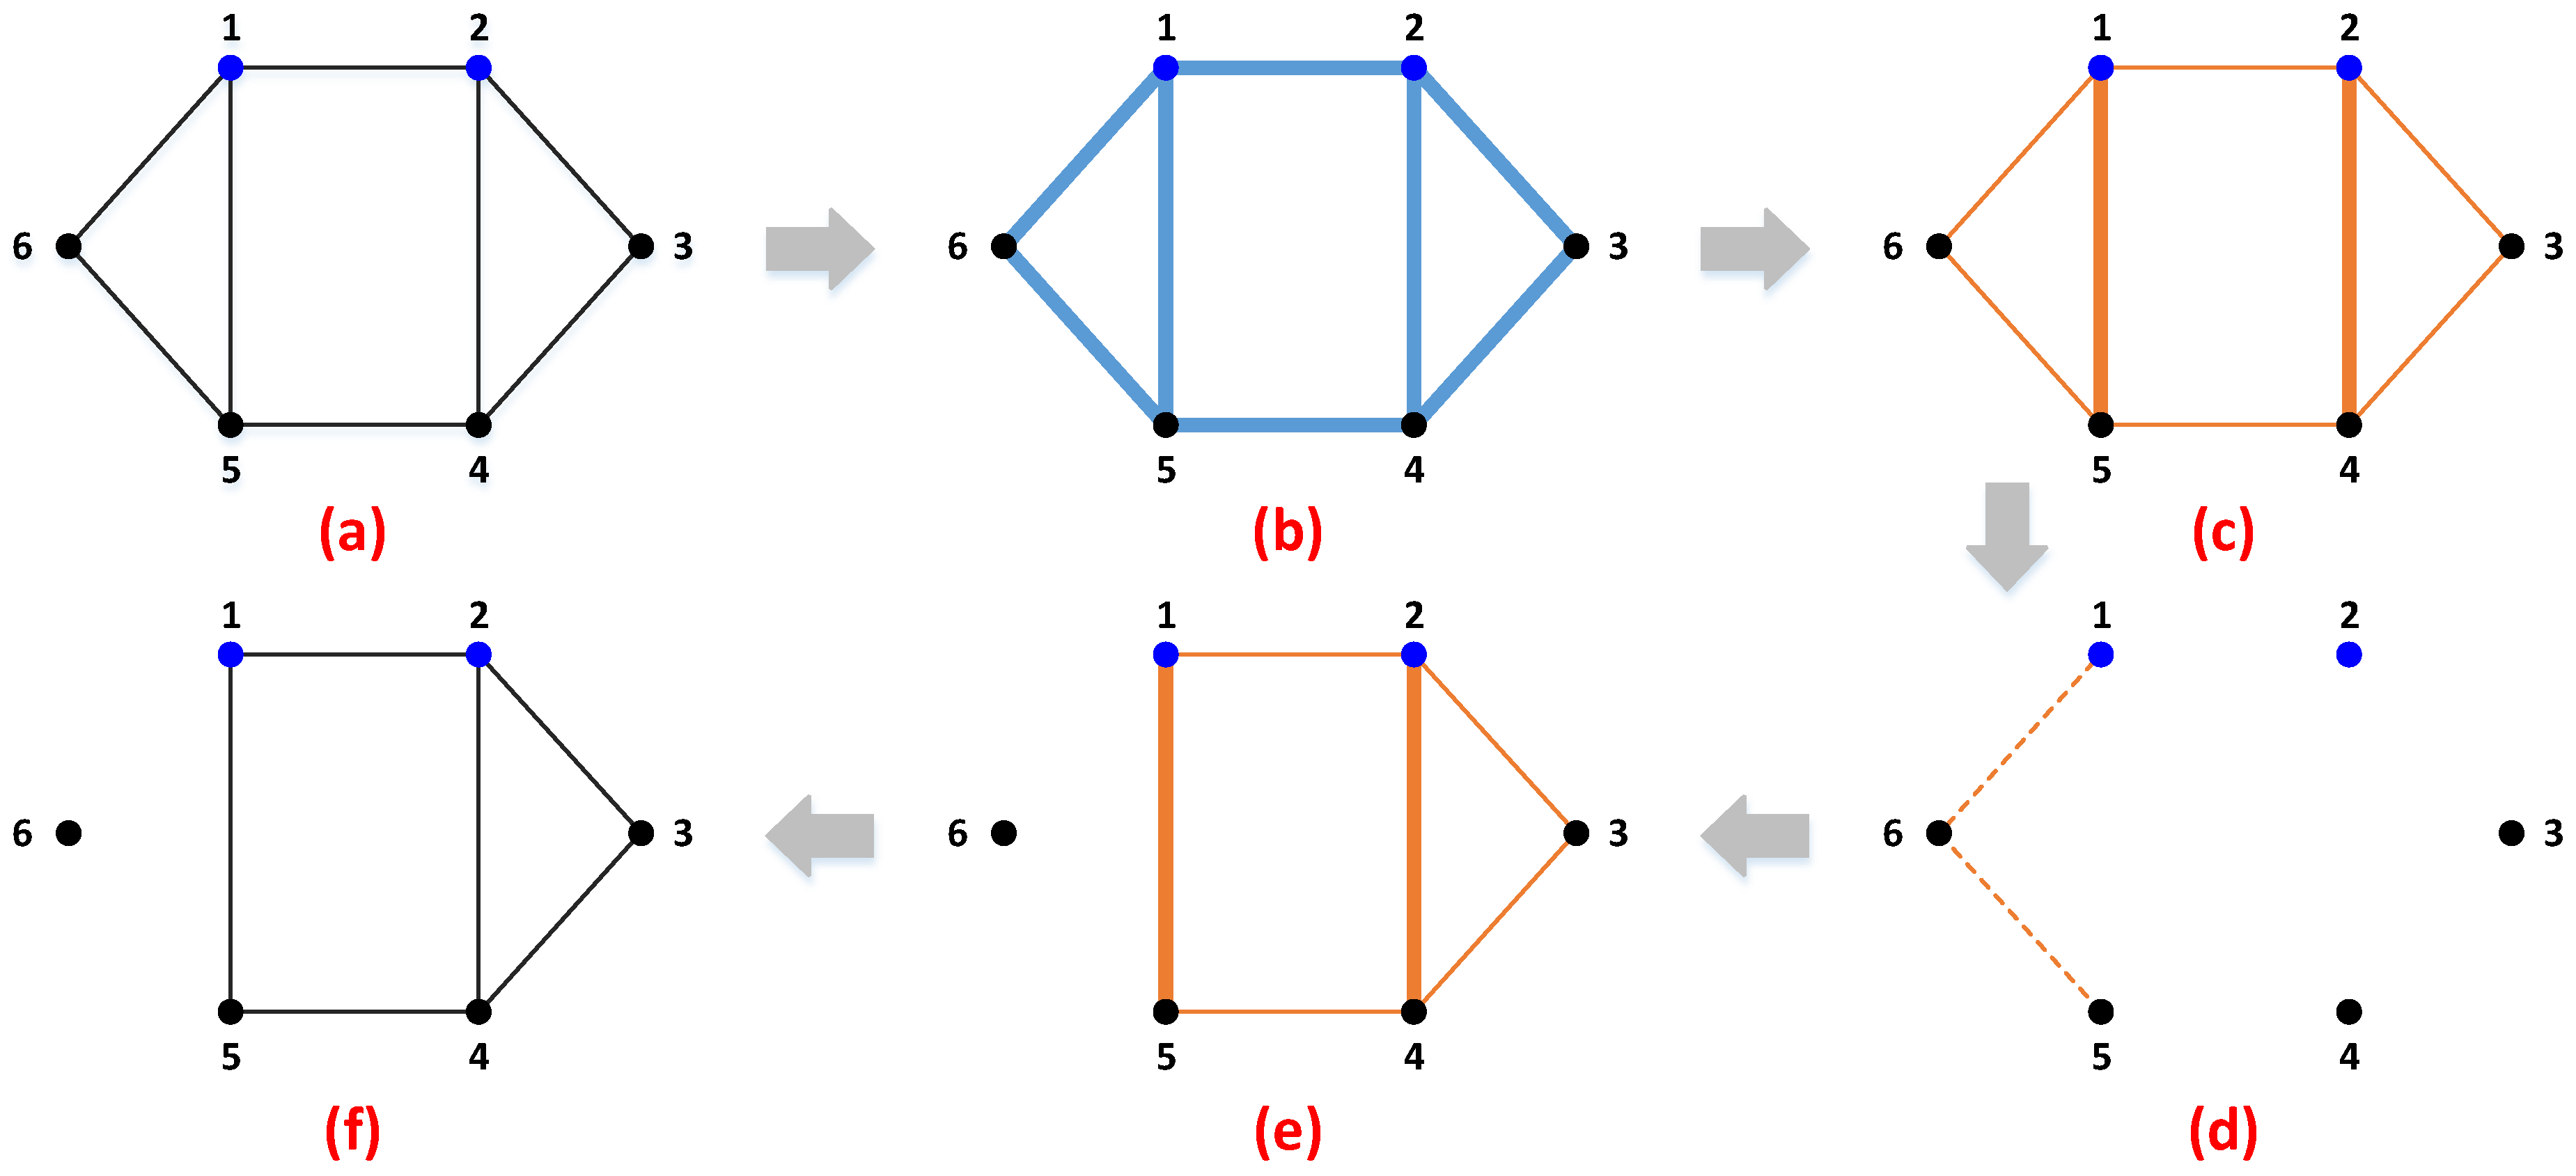
In this paper, we intend to investigate the optimal deception strategies in power system fortification against deliberate attacks. The deception strategy is described in detail based on a full comparison with the traditional protection strategy in Section 2. According to the step-by-step theoretical analysis of a 6-bus system, the potential of deception strategy is revealed. In order to numerically derive the optimal deception and protection strategy, tri-level programming problems are established based on the DAD model. In accordance with the literature, the tri-level programming problem is addressed with RO in Section 3, where both subproblem and master problem are explicitly formulated based on dual theory, big-M method, and CCG constraints. Case studies are implemented on a 6-bus system and the IEEE 57-bus system in Section 4, where the smaller network is utilized to identify the superiority and analyze the inner mechanism, while the larger system is employed to investigate the performance under different circumstance and discuss the convergence property. Results indicate that the deception strategy achieves less unserved power and faster convergence rate. Finally, conclusions and future work are summarized in Section 5.
The main contributions of this paper are as follows: (1) the deception conception is proposed and formulated, providing a general framework for more complicated defensive strategies based on information asymmetry in the future; (2) an RO solution framework for the optimal deception strategy is developed on the basis of CCG constraints, and the convergence property is discussed; and (3) comprehensive numerical experiments are implemented to verify the advantageous of deception strategy, including less objective value and faster convergence rate.

2. Problem Formulation

In this section, the target problem will be established based on the illustrative description and mathematical formulation. In Section 2.1, the deception and protection strategies in power system fortification are illustrated, compared, and discussed based on an invented 6-bus power system. Section 2.2 gives a tri-level MILP formulation for the deception strategy, based on which the optimal protection problem is derived as well. The abbreviation and nomenclature are attached at the end of this paper.

2.1. Differences between Deception and Protection Strategies

In order to establish the significance of this work, the deception strategy is compared with conventional protection program in this subsection. A 6-bus system with eight branches shown in Figure 2a and Figure 3a is employed for demonstration, where nodes 1 and 2 are generators. For the sake of fairness and justice, it is assumed that both strategies have the same candidate set and implementation capability. In this example, all existing branches can be deceived/protected, and the maximum number of lines to be hidden/enhanced is 2 due to the limited budget.
Figure 2 depicts the deception strategy in power system fortification. If branches 1–5 and 2–4 are hidden, the resulted power system shown in Figure 2c will be presented to the adversary. Given an attack budget (in this example, it is assumed that the budget can be utilized for tripping branch is 2), the attacker can easily derive an attack plan as shown in Figure 2d by the solution of a bilinear m a x - m i n problem to isolate all four load buses. Figure 2e displays the expected power system by the terrorist after attack, which is obtained from Figure 2c by the elimination of Figure 2d. Nevertheless, the actual power system after attack should be Figure 2f, which is retrieved from Figure 2a by the excluding of Figure 2d. It should be pointed out that the resulted system would be Figure 2e if no deception strategy is adopted, whose load curtailment is very large since two generators are isolated. On the other hand, the unserved energy in Figure 2f could be as low as 0 since all loads are connected to the generator. It is worth noting that the observed (target) systems for defender and attacker are different, i.e., Figure 2a,c respectively; therefore, the deliberate attack plan proposed by the attacker based on Figure 2c has a limited impact over Figure 2a. The difference between defender and attacker on the observed system is defined as information asymmetry in this paper.
Figure 3 illustrates the protection strategy in power system fortification, where both agents have equivalent information and the protected branches are invulnerable during attacks. If branches 1–5 and 2–4 are protected, the power system shown in Figure 3c will be derived and seen by both the defender and the attacker. With a budget of attacking two branches, the optimal attack plan shown in Figure 3d will be obtained to isolate node 6, resulting in a broken power system (see Figure 3e). Due to the same perspective of defender and attacker, the actual power system after attack shown in Figure 3f is identical with Figure 3e, where the system power imbalance is positive since node 6 is isolated.
Comparing Figure 2 and Figure 3, the only difference is that branches 1–5 and 2–4 are either hidden or protected. If hidden, the adversary cannot see them; if protected, the adversary cannot destroy them, but they are observable. Therefore, the resulted systems shown to the adversary after deception/protection are different; see Figure 2c and Figure 3c. Although the same attack strategy (e.g., maximizing the system power imbalance) is employed by the attacker, the generated attack plan (Figure 2d and Figure 3d) and the resulting system (Figure 2e and Figure 3e) are different since the target system is distinct. In addition, the actual power system (Figure 2f and Figure 3f) after attack is different. It should be noted that Figure 2 consumes/confronts the same resources/enemies with Figure 3, but the system power imbalance is much lesser, which is mainly due to the deception mechanism, i.e., the power of information asymmetry between the defender and attacker is revealed and harnessed.

2.2. Mathematical Formulation

Following the intrinsic logic of deception in power system fortification revealed above, the target problem can be formulated as a DAD model. In the first stage, the defender proposes an optimal deception scheme with the objective of minimizing the damage will be induced by the attacker. In the second stage, given a deceived power system obtained from the implementation of deception plan, the attacker intends to tear it via tripping power lines with the purpose of maximizing the power imbalance. In the third stage, the defender reacts to the former stages by OPF for the resulted system with the goal of minimizing the unserved energy. Therefore, a tri-level optimization structure for the target problem is given as follows:
min x l Δ s u b j e c t t o :
x l = { 0 , 1 } ; l L
l L x l N A
0 Δ Δ ¯
Δ = max z l { δ . s u b j e c t t o :
z l = { 0 , 1 } ; l L
l L z l N B
z l 1 x l ; l L
δ = min p i , f l , S b + , S b , θ f r ( l ) , θ t o ( l ) b N S b + + S b s u b j e c t t o :
i I | b u ( i ) = b p i + l ( L ) | t o ( l ) = b f l l ( L ) | f r ( l ) = b f l S b + + S b = D b : ( β b ) ; b N
f l = ( 1 x l z l ) γ l ( θ f r ( l ) θ t o ( l ) ) : ( π l ) ; l L
F l f l F l : ( σ l , ϕ l ) ; l L
0 p i P i : ( μ i ) ; i I
S b + 0 , S b 0 ; b N . ] . } .
The optimization problem (1)–(14) consists of three levels in accordance with DAD model: (1) the upper-level (1)–(5) corresponds to the defender’s first stage deception decision; (2) the middle-level  (5)–(9) includes the attacker’s second stage attack plan; and (3) the lower-level (9)–(14) is the defender’s third stage OPF reaction scheme. Dual variables associated with the lower-level problem are in parentheses. Note that the lower level is parameterized in terms of upper-level variables x l and middle-level variables z l .
The objective function (1) to be minimized is the system power imbalance that the attacker can deduce with his/her best effort. Constraints (2) and (3) define the binary nature of deception decision variables and the budget of deception operations. Constraint (4) sets the maximum level of system power imbalance. Equation (5) is both constraint and objective function for the upper-level and middle-level problems, representing the maximum power imbalance after attack. Constraints (6) and (7) model the binary nature of attack variable and its budget bound. Constraint  (8) describes that the attack can only be implemented on those branches appeared in the deceived power system, i.e., if 1 x l = 0 , the corresponding z l should be 0 as well. Equation (9) formulates the minimal unserved energy after deception and attack. Constraint (10) represents the nodal power balance equations. Based on the DCPF model, constraint (11) establishes the power flow for branches, where coefficients ( 1 x l z l ) are guaranteed to be nonnegative due to constraints (8). Constraints  (12), (13), and (14) enforce the limits for line flow, generation, and power surplus/deficit,  respectively.
In Equation (1)–(14), the tri-level optimization problem is joined by the system power imbalance, which is defined in Equation (9) and calculated via Equation (10). In order to achieve the nodal power balance shown in (10), S b + and S b are included as slack variables. In (10), if the left-hand side is smaller than the right-hand side, then S b + = 0 and S b > 0 ; otherwise, S b + > 0 and S b = 0 . Therefore, b N S b + + S b is defined as a system power imbalance in this paper, whose interpretation includes power mismatch and load shed as well.
In terms of conventional protection problems, the formulation can be easily revised from (1)–(14) with the following three steps:
  • Change the definition of binary decision variables x l . Let x l = 1 represent the protection of line l, and vice versa.
  • Delete the constraint (8). Since all the lines are visible for the adversary, each line l is attackable no matter x l = 1 or not.
  • Revise the constraint (11). It is assumed that the protected line cannot be destroyed, i.e., if x l = 1 , the power flow of line l is guaranteed to be nonzero whatever the attack z l is conducted or not. Therefore, constraint (11) can be reformulated as
    f l = ( 1 z l + x l z l ) γ l ( θ f r ( l ) θ t o ( l ) ) : ( π l ) ; l L .
Based on the above processes, the optimal protection strategy problem is formulated as
min x l Δ s u b j e c t t o :
C o n s t r a i n t s ( 2 ) ( 7 ) , ( 9 ) ( 10 ) , ( 12 ) ( 14 ) , ( 15 ) .
It should be noted that the above tri-level optimization problems (1)–(14) and (16)–(17) are just simple mathematical formulations for demonstration, they can be easily extended to include more details, such as the cost in the objective function and more realistic constraints.

3. Solution Methodology

In this section, the developed tri-level MILP problem (1)–(14) will be tackled with two-stage RO algorithm and CCG strategy, resulting in a master-subproblem solution framework, where Δ constitutes the recourse function. The master problem provides a lower bound for the system power imbalance and generates a deception scheme. Due to feedback mechanism from subproblem, the number of constraints in master problems keeps increasing as the iteration goes on, thus the lower bound is monotonically increasing. On the other hand, the subproblem yields the worst attack plan for a given deceived power system, producing an upper bound for the target problem. The solution process terminates when these two bounds merge into a predefined value ϵ , e.g., 10 2 . The convergence of RO and CCG are guaranteed in a finite number of iterations—for more details, please refer to [29] and [21]. In addition, the distance between these two bounds can be utilized to identify the quality of intermediate solutions at each iteration.

3.1. Subproblem

At each iteration k, the subproblems (5)–(14) maximize the system power imbalance Δ for the deceived power system resulting from the upper-level deception plan. Therefore, the subproblem is parameterized by the upper-level decision variables x l . Nevertheless, the mixed-integer bilinear m a x - m i n problem is intractable for most off-the-shelf solvers. Fortunately, it can be reformulated into single-level MILP, which is suitable for various solvers, e.g., Cplex, Matlab, and Lingo, etc., based on dual theory or Karush–Kuhn–Tucker (KKT) conditions.
Based on dual theory, the single-level equivalent of the subproblem is obtained as follows:
Δ = max z l , β b , π l , σ l , ϕ l , μ i b N D b β b l ( L A L B ) F l σ l l ( L A L B ) F l ϕ l i I P i μ i
      subject to:
z l = { 0 , 1 } ; l L
l L z l N B
z l 1 x l ( j ) ; l L
β b u ( i ) μ i 0 ; i I
β t o ( l ) β f r ( l ) + π l + σ l ϕ l = 0 ; l L
1 β b 1 ; b N
l L | t o ( l ) = b 1 x l ( j ) z l γ l π l l L | f r ( l ) = b 1 x l ( j ) z l γ l π l = 0 ; b N
σ l , ϕ l 0 ; l L
μ i 0 ; i I ,
where constraints (19)–(21) are in accordance with middle-level constraints (6)–(8), whereas (22)–(25) are the dual constraints corresponding to primal variables p i , f l , S b + , S b , and θ , respectively.
It is noticeable that constraints (25) are nonlinear due to the products between middle-level binary variables and lower-level dual continuous variables. In order to facilitate the linear solver, linearizion process is implemented on (25), resulting in the following constraints:
l L | t o ( l ) = b 1 x l ( j ) γ l π l γ l τ l l L | f r ( l ) = b 1 x l ( j ) γ l π l γ l τ l = 0 ; b N
π l ¯ ( 1 z l ) τ l π l π l ¯ ( 1 z l ) ; l L
π l ¯ z l τ l π l ¯ z l ; l L ,
where τ l = z l π l are new variables to represent the nonlinear terms; constraints (29)–(30) are utilized to achieve the equivalence.
The subproblem of conventional optimal protection strategy problem is similar to (18)–(27) except that the coefficients in constraints (25) should be revised as (31) according to (15). Correspondingly, the  linearized constraints (28) should be changed as (32) as well:
l L | t o ( l ) = b 1 z l + x l ( j ) z l γ l π l l L | f r ( l ) = b 1 z l + x l ( j ) z l γ l π l = 0 ; b N ,
l L | t o ( l ) = b γ l π l γ l τ l + x l ( j ) γ l τ l l L | f r ( l ) = b γ l π l γ l τ l + x l ( j ) γ l τ l = 0 ; b N .
Therefore, the subproblem of optimal protection strategy problem can be summarized as
Δ = max z l , β b , π l , σ l , ϕ l , μ i , τ l b N D b β b l ( L A L B ) F l σ l l ( L A L B ) F l ϕ l i I P i μ i ,
      subject to:
C o n s t r a i n t s ( 19 ) ( 24 ) , ( 26 ) and ( 27 ) , ( 29 ) and ( 30 ) , ( 32 ) .

3.2. Master Problem

According to the CCG algorithm, the master problem of the optimal deception strategy problem can be generated as follows:
min x l , p i m , f l m , S b + m , S b m , θ f r ( l ) m , θ t o ( l ) m Δ
subject to:
C o n s t r a i n t s ( 2 ) ( 4 )
Δ b N S b + m + S b m ; m = 1 , , j 1
i I b p i m + l ( L ) | t o ( l ) = b f l m l ( L ) | f r ( l ) = b f l m S b + m + S b m = D b ; b N , m = 1 , , j 1
f l m = ( 1 x l z l m ) γ l ( θ f r ( l ) m θ t o ( l ) m ) ; l L , m = 1 , , j 1
F l f l m F l ; l L , m = 1 , , j 1
0 p i m P i ; i I , m = 1 , , j 1
S b + m 0 , S b m 0 ; b N , m = 1 , , j 1 ,
where m is the number of iterations. It should be noted that the scale of the master problem is increasing at each iteration with constraints (36)–(42) and decision variables p i m , f l m , S b + m , S b m , θ f r ( l ) m , and θ t o ( l ) m .
It is noticeable that constraint (39) is nonlinear due to the product term x l θ m . According to constraint (21), the term ( 1 x l z l m ) in constraints (39) should be nonnegative. Nevertheless, in the current form of (39), the nonnegative is not guaranteed, e.g., if x l = 1 and z l m = 1 , there is 1 x l z l m = 1 , which means that the attack is conducted on a hidden line, but the result is equivalent with building a new line since f l m = γ l ( θ f r ( l ) m θ t o ( l ) m ) . Admittedly, constraint (39) is inappropriate, thus a reformulation is inevitable. In order to achieve the most concise form, the logic relationship between f l m , x l , and z l m is summarized in Table 1.
Based on the Big-M experiences, constraint (39) is linearized as (43) and (44), which are applicable with the logic relationship shown in Table 1. It should be noted that the Big-M in (43) and (44) is valued with M l = 2 F l due to the nature constraint of f l :
M l ( 1 x l ) z l m f l m γ l ( θ f r ( l ) m θ t o ( l ) m ) M l ( 1 x l ) z l m ; l L A , m = 1 , , j 1
M l 1 ( 1 x l ) z l m f l m M l 1 ( 1 x l ) z l m ; l L A , m = 1 , , j 1 .
Replace constraints (39) with (43) and (44), the MILP master problem is developed. By iteratively solving the master problem and subproblem, their objective function values (corresponding to the lower and upper bounds of the original problem) will merge together, thus the convergence is achieved.
Substitute constraint (39) in (35)–(42) with (45), the master problem of conventional optimal protection strategy problem can be generated. The logic relationship enclosed in (45) between f l m , x l , and z l m is identical with Table 1, thus the linearization form of (45) can be represented by (43) and (44) as well. Therefore, the master problem of both optimal deception and protection strategy problems have the same formulation:
f l m = ( 1 z l m + x l z l m ) γ l ( θ f r ( l ) m θ t o ( l ) m ) ; l L , m = 1 , , j 1 .

4. Numerical Experiments

In this section, two cases retrieved from Matpower [30] are employed to validate the proposed model and solution methodology, i.e., the 6-bus system and IEEE 57-bus system. The smaller system is utilized to reveal calculation details and information asymmetry with all power flow data is reported, while the larger system is resorted to perform sensitivity analysis and demonstrate the scalability. Both deception and protection strategies are implemented for comparison and discussion. All simulation tests are coded in Matlab 2018a, called Cplex 12.8.0 with YALMIP [31]. The execution platform is a 64-bit Windows PC with two Intel Core i7-8550U CPU at 1.80 GHz and 16.0 GB of RAM.

4.1. The 6-Bus System

In accordance with the illustrative 6-bus system given in Figure 2 and Figure 3, the configuration and parameter of the original system case6ww given in [30] are partially revised. For reproductivity purposes, Table 2 and Table 3 present all the input data for the 6-bus system.
Figure 4 depicts the detailed power flow and load shed for both strategies under different defense and attack budgets. If N A = N B = 2 , both strategies intend to hide or protect branches 1–5 and 2–4, nevertheless, the attacked lines are different although the same attack policy is utilized, resulting in the same configurations with Figure 2f and Figure 3f. The reason and stage-wise transformation process have been discussed in Section 2.1, thus Figure 4a,b just reports the results, where full data on the power flow is given for validation. It can be seen that the whole system power imbalance for deception and protection strategies under N A = N B = 2 is 58.9 MW and 80.0 MW, respectively. In order to further reveal the difference between these two strategies, the defense budget is increased by 1 in Figure 4c,d, i.e., N A = 3 and N B = 2 . Results show that the unserved power has reduced to 20 MW and 60 MW respectively. Therefore, it can be concluded that the deception strategy performances better than the protection strategy under various circumstance; in addition, the deception strategy gains much better performance improvement by adding the defense budget.
Although results have been reported and discussed in the above, the inner mechanism for Figure 4c,d has not been disclosed. In Figure 4d, the protected branches are 1–5, 1–6, and 2–3. Thus, two lines 2–4 and 4–5 are attacked, resulting in a 60 MW power imbalance at bus 3. The entire calculation process strictly follows the problem formulation and solution methodology developed for the protection strategy, which are explicitly given in Section 2 and Section 3, respectively. In terms of Figure 4c, the hidden branches are 1–5, 2–3, and 2–4, leading to a very fragile system appearing to the enemy. Figure 5a presents the deceived system, where lines 1–6 is the unique branch to connect the generator and load buses. Therefore, the adversary destroyed only one branch (1–6) since breaking other visible lines (1–2, 3–4, 4–5, and 5–6) cannot increase the power imbalance (as all the load buses are isolated, i.e., the maximum unserved power 290 MW is achieved). Figure 5b illustrates the system after attack, where f 12 = 0 , f 34 = 0 , f 45 = 0 , and f 56 = 0 , which means that attacking them is not required and does not make any sense. It should be pointed that the comparison between Figure 4c,d is fair since the attack strategy is the same, although the finally implemented attack times are different. In order to achieve “fair” comparison, four more attack plans are enumerated in Table 4. It can be observed that the system power imbalance is less than 60 MW (the protection strategy) for the majority of attack plans, and the average is only 34 MW, thus the deception strategy still gains superiority.

4.2. IEEE 57-Bus System

The dataset of IEEE 57-bus system is fetched from [30]; however, the power flow capacity of each branch is incomplete, thus we randomly generated F l for each line with the following equation:
F l = 70 + r o u n d ( 10 r l ) ,
where r l [ 0 , 1 ] is a random number subject to uniform distribution, r o u n d ( ) is the rounding function. It should be noted that F l [ 70 , 80 ] pushes the system into a critical point, i.e., the power balance is achievable under normal state, but power imbalance is easy to appear if some branches are attacked. For the purpose of quick reference, all data related to IEEE 57-bus system are attached in Appendix A, and the single line diagram is given in Figure 6.

4.2.1. Performance Evaluation

In order to further identify the difference between two strategies, a lot of experiments are implemented on the IEEE 57-bus system under different defense and attack budgets, i.e., corresponding to various numbers of N A and N B . All results are summarized in Table 5. To facilitate the description, Figure 7 illustrates the results of protection strategy. At point D ( N A = N B = 0 ), the power imbalance Δ is 0, indicating that the system is sufficient in the original status. From point D to A, the maximum number of attacks is increasing while the protection budget is fixed, thus Figure 7 demonstrates a monotonically increasing trend on the unserved power. On the other hand, from point A to B, the defense budget is increasing, but the attack strength is constant, resulting in a monotonically reducing trend on the system power imbalance, which is observable in Figure 7. Therefore, it can be concluded that the elimination of power imbalance from A to B and D is due to the increase of defense budget N A and the decrease of attack capability N B , respectively. However, the decrease rate is different since Δ ( B ) is 151.9 MW while Δ ( D ) is 0 MW, showing that the variation of N B has a stronger influence on the system power imbalance. This phenomenon can also be partially identified with point B, where a large amount of unserved power has appeared although N A is equal to N B . Even if N A = 7 and N B = 1 , the system power imbalance shown in Figure 7 is still positive.
Figure 8 presents the results with deception strategy, where similar trends with Figure 7 from point A to B and D are observable. The power imbalance levels from point A to D (where N A = 0 , i.e., there is no protection or deception) reported in Figure 8 are identical to Figure 7, indicating that the attack policy is the same. Nevertheless, the point B shown in Figure 8 is much lower than Figure 7, which means that the deception gains have better performance than the protection strategy. Actually, all points shown in Figure 8 are less than or equal to Figure 7. As discussed in Figure 7, Δ is positive at point ( N A , N B ) = ( 7 , 1 ) ; nevertheless, Δ = 0 is achieved in Figure 8.
Based on the above comparison, the superiority of deception strategy over protection strategy is established. In order to further investigate the differences between these two strategies, Figure 9 is generated, where the data at each point are obtained from the substitution of corresponding points shown in Figure 7 and Figure 8. Firstly, all points are nonnegative, which is expected according to the above analysis. Then, an interesting observation is that the variation is higher as N A and N B are larger. Bigger values of N A and N B mean larger solution space and more system flexibility, indicating that the full potential of deception strategy is easier to be fulfilled with complicated problems.

4.2.2. Convergence Analysis

In this subsection, the convergence property of both strategies is analyzed in three specified scenarios. Since both N A and N B are valued in [ 0 , 7 ] , there are 64 combinations to generate experiment scenario. In this case study, three complicated (large N A and N B ) but balanced ( N A is equal to N B ) are determined as testbed, i.e., Scenario A ( N A = N B = 5 ), Scenario B ( N A = N B = 6 ), and Scenario C ( N A = N B = 7 ). Figure 10 illustrates the convergence property of deception and protection strategies under different scenarios. The difference on power imbalance level is obvious, and the reason has been discussed in the above subsection. Both strategies achieved the convergence under a finite number of iterations, but the convergence rate is different. Deception strategy finished the calculation within 10 iterations, while 30–60 iterations are required to eliminate the gap between lower and upper bounds. If the scale of master problems and subproblems are fixed, then the execution time will linearly increase as iteration goes on. Nevertheless, the scale of master problem is increasing since CCG constraints will be iteratively included, i.e., more time is required to solve the master problem in latter iterations; therefore, the whole execution time increase rate would be super-linear, which is validated with the comparison between deception and protection strategies. The reason for the smaller number of iterations with deception strategy might be explained from two aspects: (1) the hidden lines reduced the solution space of the subproblem, resulting in the worst attack plan being easy to be found; (2) the hidden lines changed the configuration of subproblem solution space, leading to the CCG constraints being capable of eliminating more intermediate solutions; and (3) the variation on objectives between defender and attacker makes their decisions be diametrically opposed, resulting in the room for bargaining is limited, thus the number of iterations is smaller.

5. Conclusions

The power system fortification problem against deliberate attacks is investigated in this paper. Different from traditional protection strategy, where the attacker is assumed to be capable of accessing sufficient information, including network topology, device parameters, physical capacity, and defensive decision, the information asymmetry between defender and attacker is introduced in this work, resulting in an optimal deception strategy problem. In order to explicitly reveal the advantageous and significance of information in the two-player game, both deception and protection strategies are described in detail with the invented 6-bus system, formulated into the tri-level MILP problem, and solved via two-stage RO and CCG algorithms. Numerical experiments are carried out on both the 6-bus system and the IEEE 57-bus system. In the first network, numerical validation of the superiority of deception is presented. On the other hand, performance evaluation and convergence analysis are given based on the second grid. Although deception strategy is integrated into power system fortification, the considered defensive operation is still limited. In the future, more comprehensive deception and attack strategies will be investigated, e.g., setting up fake components (including transmission lines, generators, and loads, etc.), concealing critical loads, and attacking nodes in addition to branches, etc. In addition, different from binary metrics, the success rate/probability of deception and protection operation implemented on each branch will be included in the solution framework.

Author Contributions

Investigation, P.J.; Methodology, P.J.; Supervision, T.Z.; Validation, S.H.; Writing—Original Draft, S.H.; Writing—Review and Editing, T.Z.

Funding

This work was supported by the Distinguished Natural Science Foundation of Hunan Province (No. 2017JJ1001) and the National Natural Science Foundation of China (Nos. 61773390, 71571187). This work was also supported by the China Postdoctoral Science Foundation (No. 2017M623381).

Conflicts of Interest

The authors declare no conflict of interest.

Abbreviations

The following abbreviations are used in this manuscript:
ADAttacker–Defender
AMIAdvanced Metering Infrastructure
CCGColumn-and-Constraint Generation
DADDefender-Attacker-Defender
FDIAFalse Data Injection Attack
IEDIntelligent Electronic Device
KKTKarush–Kuhn–Tucker
LPLinear Programming
MILPMixed-Integer Linear Programming
RORobust Optimization
SCADASupervisory Control And Data Acquisition
Nomenclature
Δ System power imbalance, given x l .
e x l Binary variable that is equal to 1 if line l is hidden for deception; being 0 otherwise.
LSet of branch indexes.
N A Maximum number of lines can be hidden for deception.
Δ ¯ Maximum level of system power imbalance.
δ System power imbalance, given x l , and z l .
z l Binary variable that is equal to 1 if line l is attacked; being 0 otherwise.
N B Maximum number of lines can be attacked.
p i Power output of generator i.
b u ( i ) The bus that generator i is connected to.
f l Power flow of line l.
f r ( l ) Sending or origin bus of line l.
t o ( l ) Receiving or destination bus of line l.
S b + Power surplus at bus b.
S b Power deficit at bus b.
D b Demand at bus b.
NSet of bus indexes.
γ l Suspectance of line l.
θ b Phase angle at bus b.
F l Power flow capacity of line l.
P i Capacity of generator i.
ISet of generator indexes.

Appendix A. The Dataset of IEEE 57-Bus System

For the purpose of quick reference and reproductivity, the generation, load, and branch data of IEEE 57-bus system are reported in Table A1 and Table A2.
Table A1. Generation and load data for IEEE 57-bus system.
Bus No. P i (MW) D b (MW)Bus No. P i (MW) D b (MW)Bus No. P i (MW) D b (MW)
1575.88552002.33900
2100321004000
31404122004106.3
4002306.34207.1
501324004302
6100752506.344012
70026004500
85501502709.34600
91001212804.647029.7
1005290174800
11003003.649018
124103773105.850021
130183201.651018
14010.53303.85204.9
15022340053020
1604335065404.1
1704236005506.8
18027.237005607.6
1903.3380145706.7
Table A2. Branch data for IEEE 57-bus system.
From–ToRe. (p.u.) F l (MW)From–ToRe. (p.u.) F l (MW)From–ToRe. (p.u.) F l (MW)
1–20.02807214–150.05477641–420.352079
2–30.08507118–190.68507341–430.412075
3–40.03667919–200.43407838–440.058570
4–50.13207121–200.77677315–450.104277
4–60.14807421–220.11708014–460.073574
6–70.10207922–230.01527746–470.068078
6–80.17307723–240.25608047–480.023372
8–90.05057524–251.18207948–490.129077
9–100.16797024–251.23007249–500.128075
9–110.08487024–260.04737350–510.220073
9–120.29507826–270.25407710–510.071271
9–130.15807027–280.09547013–490.191070
13–140.04347028–290.05878029–520.187075
13–150.0869757–290.06487652–530.098479
1–150.09107225–300.20207653–540.232079
1–160.20607930–310.49707254–550.226577
1–170.10807631–320.75507211–430.153072
3–150.05307132–330.03607844–450.124277
4–180.55507234–320.95307540–561.195072
4–180.43007034–350.07807656–410.549078
5–60.06417335–360.05377456–420.354071
7–80.07128036–370.03667339–571.355077
10–120.12627237–380.10097257–560.260078
11–130.07327137–390.03797738–490.177077
12–130.05807336–400.04667338–480.048274
12–160.08137222–380.0295739–550.120575
12–170.17907311–410.749078

References

  1. Boyer, S.A. SCADA: Supervisory Control and Data Acquisition; International Society of Automation: Pittsburgh, PA, USA, 2009. [Google Scholar]
  2. Chen, C.; Wang, J.; Qiu, F.; Zhao, D. Resilient distribution system by microgrids formation after natural disasters. IEEE Trans. Smart Grid 2016, 7, 958–966. [Google Scholar] [CrossRef]
  3. Yuan, W.; Wang, J.; Qiu, F.; Chen, C.; Kang, C.; Zeng, B. Robust optimization-based resilient distribution network planning against natural disasters. IEEE Trans. Smart Grid 2016, 7, 2817–2826. [Google Scholar] [CrossRef]
  4. Xu, X.; Mitra, J.; Cai, N.; Mou, L. Planning of reliable microgrids in the presence of random and catastrophic events. Int. Trans. Electr. Energy Syst. 2014, 24, 1151–1167. [Google Scholar] [CrossRef]
  5. Xiang, Y.; Wang, L.; Liu, N. Coordinated attacks on electric power systems in a cyber-physical environment. Electr. Power Syst. Res. 2017, 149, 156–168. [Google Scholar] [CrossRef]
  6. Pasqualetti, F.; Dörfler, F.; Bullo, F. Attack detection and identification in cyber-physical systems. IEEE Trans. Autom. Control 2013, 58, 2715–2729. [Google Scholar] [CrossRef]
  7. Bilis, E.I.; Kröger, W.; Nan, C. Performance of electric power systems under physical malicious attacks. IEEE Syst. J. 2013, 7, 854–865. [Google Scholar] [CrossRef]
  8. Sridhar, S.; Hahn, A.; Govindarasu, M. Cyber-Physical System Security for the Electric Power Grid. Proc. IEEE 2012, 100, 210–224. [Google Scholar] [CrossRef]
  9. Liang, G.; Zhao, J.; Luo, F.; Weller, S.R.; Dong, Z.Y. A review of false data injection attacks against modern power systems. IEEE Trans. Smart Grid 2017, 8, 1630–1638. [Google Scholar] [CrossRef]
  10. Zhu, Y.; Yan, J.; Tang, Y.; Sun, Y.L.; He, H. Joint substation-transmission line vulnerability assessment against the smart grid. IEEE Trans. Inf. Forensics Secur. 2015, 10, 1010–1024. [Google Scholar] [CrossRef]
  11. Wang, Z.; He, J.; Nechifor, A.; Zhang, D.; Crossley, P. Identification of critical transmission lines in complex power networks. Energies 2017, 10, 1294. [Google Scholar] [CrossRef]
  12. Zhang, G.; Li, Z.; Zhang, B.; Qiu, D.; Halang, W.A. Cascading failures of power grids caused by line breakdown. Int. J. Circuit Theory Appl. 2015, 43, 1807–1814. [Google Scholar] [CrossRef]
  13. Wenli, F.; Zhigang, L.; Ping, H.; Shengwei, M. Cascading failure model in power grids using the complex network theory. IET Gener. Transm. Distrib. 2016, 10, 3940–3949. [Google Scholar] [CrossRef]
  14. Zhao, L.; Zeng, B. Vulnerability analysis of power grids with line switching. IEEE Trans. Power Syst. 2013, 28, 2727–2736. [Google Scholar] [CrossRef]
  15. Li, Z.; Shahidehpour, M.; Alabdulwahab, A.; Abusorrah, A. Bilevel model for analyzing coordinated cyber-physical attacks on power systems. IEEE Trans. Smart Grid 2016, 7, 2260–2272. [Google Scholar] [CrossRef]
  16. Tan, Y.; Li, Y.; Cao, Y.; Shahidehpour, M. Cyber-Attack on Overloading Multiple Lines: A Bilevel Mixed-Integer Linear Programming Model. IEEE Trans. Smart Grid 2018, 9, 1534–1536. [Google Scholar] [CrossRef]
  17. Lai, K.; Illindala, M.; Subramaniam, K. A tri-level optimization model to mitigate coordinated attacks on electric power systems in a cyber-physical environment. Appl. Energy 2019, 235, 204–218. [Google Scholar] [CrossRef]
  18. Yao, Y.; Edmunds, T.; Papageorgiou, D.; Alvarez, R. Trilevel optimization in power network defense. IEEE Trans. Syst. Man Cybern. Part C Appl. Rev. 2007, 37, 712–718. [Google Scholar] [CrossRef]
  19. Ding, T.; Yao, L.; Li, F. A multi-uncertainty-set based two-stage robust optimization to defender–attacker–defender model for power system protection. Reliab. Eng. Syst. Saf. 2018, 169, 179–186. [Google Scholar] [CrossRef]
  20. Zhao, L.; Zeng, B. Robust unit commitment problem with demand response and wind energy. In Proceedings of the 2012 IEEE Power and Energy Society General Meeting, San Diego, CA, USA, 22–26 July 2012; pp. 1–8. [Google Scholar]
  21. Zeng, B.; Zhao, L. Solving two-stage robust optimization problems using a column-and-constraint generation method. Oper. Res. Lett. 2013, 41, 457–461. [Google Scholar] [CrossRef]
  22. Ruiz, C.; Conejo, A.J. Robust transmission expansion planning. Eur. J. Oper. Res. 2015, 242, 390–401. [Google Scholar] [CrossRef]
  23. Lorca, A.; Sun, X.A. Adaptive robust optimization with dynamic uncertainty sets for multi-period economic dispatch under significant wind. IEEE Trans. Power Syst. 2015, 30, 1702–1713. [Google Scholar] [CrossRef]
  24. Huang, S.; Dinavahi, V. A comparison of implicit and explicit methods for contingency constrained unit commitment. In Proceedings of the 2017 North American Power Symposium (NAPS), Morgantown, WV, USA, 17–19 September 2017; pp. 1–6. [Google Scholar]
  25. Lee, C.; Liu, C.; Mehrotra, S.; Bie, Z. Robust Distribution Network Reconfiguration. IEEE Trans. Smart Grid 2015, 6, 836–842. [Google Scholar] [CrossRef]
  26. Costa, A.; Georgiadis, D.; Ng, T.S.; Sim, M. An optimization model for power grid fortification to maximize attack immunity. Int. J. Electr. Power Energy Syst. 2018, 99, 594–602. [Google Scholar] [CrossRef]
  27. Ouyang, M.; Xu, M.; Zhang, C.; Huang, S. Mitigating electric power system vulnerability to worst-case spatially localized attacks. Reliab. Eng. Syst. Saf. 2017, 165, 144–154. [Google Scholar] [CrossRef]
  28. Wu, X.; Conejo, A.J. An efficient tri-level optimization model for electric grid defense planning. IEEE Trans. Power Syst. 2017, 32, 2984–2994. [Google Scholar] [CrossRef]
  29. Bertsimas, D.; Brown, D.B.; Caramanis, C. Theory and applications of robust optimization. SIAM Rev. 2011, 53, 464–501. [Google Scholar] [CrossRef]
  30. Zimmerman, R.D.; Murillo-Sanchez, C.E.; Thomas, R.J. MATPOWER: Steady-State Operations, Planning, and Analysis Tools for Power Systems Research and Education. IEEE Trans. Power Syst. 2011, 26, 12–19. [Google Scholar] [CrossRef] [Green Version]
  31. Löfberg, J. YALMIP: A Toolbox for Modeling and Optimization in MATLAB. In Proceedings of the 2004 IEEE International Conference on Robotics and Automation, New Orleans, LA, USA, 2–4 September 2004; pp. 284–289. [Google Scholar]
Figure 1. Various types of attacks against the modern power grid [5].
Energies 12 00342 g001
Figure 2. Demonstration of deception strategies in power system fortification: (a) original power system; (b) candidate deception branch set; (c) deceived power system shown to the adversary; (d) deliberate attack plan; (e) expected power system by the terrorist after attack; (f) actual power system after attack.
Energies 12 00342 g002
Figure 3. Demonstration of protection strategies in power system fortification: (a) original power system; (b) candidate protection branch set; (c) enhanced power system shown to the adversary; (d) deliberate attack plan; (e) expected power system by the terrorist after attack; (f) actual power system after attack.
Energies 12 00342 g003
Figure 4. Performance of the optimal deception and protection strategies on the 6-bus system under different defense and attack budgets.
Energies 12 00342 g004
Figure 5. Intermediate systems for the deception strategy with N A = 3 and N B = 2 .
Energies 12 00342 g005
Figure 6. Single line diagram of the IEEE 57-bus system.
Energies 12 00342 g006
Figure 7. Power imbalance with the protection strategy under different defense and attack budgets.
Energies 12 00342 g007
Figure 8. Power imbalance with the deception strategy under different defense and attack budgets.
Energies 12 00342 g008
Figure 9. Difference of power imbalance with various fortification strategies under different defense and attack budgets.
Energies 12 00342 g009
Figure 10. Convergence property of deception and protection strategies.
Energies 12 00342 g010
Table 1. Logic relationship between f l m , x l , and z l m for the optimal deception strategy problem.
x l z l m f l m Explanation
00 γ l ( θ f r ( l ) m θ t o ( l ) m ) Line is neither hidden nor attacked.
010Line is attacked.
10 γ l ( θ f r ( l ) m θ t o ( l ) m ) Line is hidden.
11 γ l ( θ f r ( l ) m θ t o ( l ) m ) Line is hidden and attacked.
Table 2. Generation and load data for the 6-bus system.
Bus No.Generation P i (MW)Load D b (MW)Bus No.Generation P i (MW)Load D b (MW)
118004070
215005070
30706080
Table 3. Branch data for the 6-bus system.
From–ToReactance (p.u.)Capacity F l (MW)From–ToReactance (p.u.)Capacity F l (MW)
1–20.20802–40.10120
1–50.301203–40.2680
1–60.30804–50.4080
2–30.25805–60.3060
Table 4. System power imbalance under different attack plans.
Attack PlansNode Power Imbalance (MW)System Power Imbalance (MW)
1–6 S 6 = 20 20
1–6 & 1–2 S 6 = 20 20
1–6 & 3–4 S 6 = 20 20
1–6 & 4–5 S 5 = 10 , S 6 = 20 30
1–6 & 5–6 S 6 = 80 80
Average34
Table 5. Power imbalance with both strategies under different defense and attack budgets.
Power Imbalance (MW) N A = 0 N A = 1 N A = 2 N A = 3 N A = 4 N A = 5 N A = 6 N A = 7
N B = 0 0.00, D0.000.000.000.000.000.000.00, C
N B = 1 66.9648.4246.1341.9341.6131.0417.6714.23
N B = 2 115.29104.5299.7590.7079.5151.7346.0239.00
Protection N B = 3 171.23162.78148.01131.82108.0577.2365.7355.47
Strategy N B = 4 226.82219.86200.78158.60123.24114.6581.9181.11
N B = 5 295.74274.45228.60187.60167.58138.34114.43100.10
N B = 6 305.60297.60257.60221.68180.13162.60143.93131.02
N B = 7 376.6, A327.80279.60236.60212.44188.80168.47151.9, B
N B = 0 0.00, D0.000.000.000.000.000.000.00, C
N B = 1 66.9646.1341.6141.6131.043.683.680.00
N B = 2 115.29104.5290.8379.5135.6335.6324.963.68
Deception N B = 3 171.23159.35147.2095.3585.5358.0034.1614.02
Strategy N B = 4 226.82219.86153.60145.60109.7670.3135.8440.29
N B = 5 295.74226.60221.60172.80124.1570.3138.3441.23
N B = 6 305.60297.60248.80185.80124.1570.8648.3844.34
N B = 7 376.6, A324.80261.80185.80125.2079.7269.6146.72, B
A, B, C, D: Points will be utilized in Figure 7, Figure 8 and Figure 9 to facilitate the description.

