Power to Hydrogen Through Polygeneration Systems Based on Solid Oxide Cell Systems


Abstract
1. Introduction
2. Modelling of the Main Components
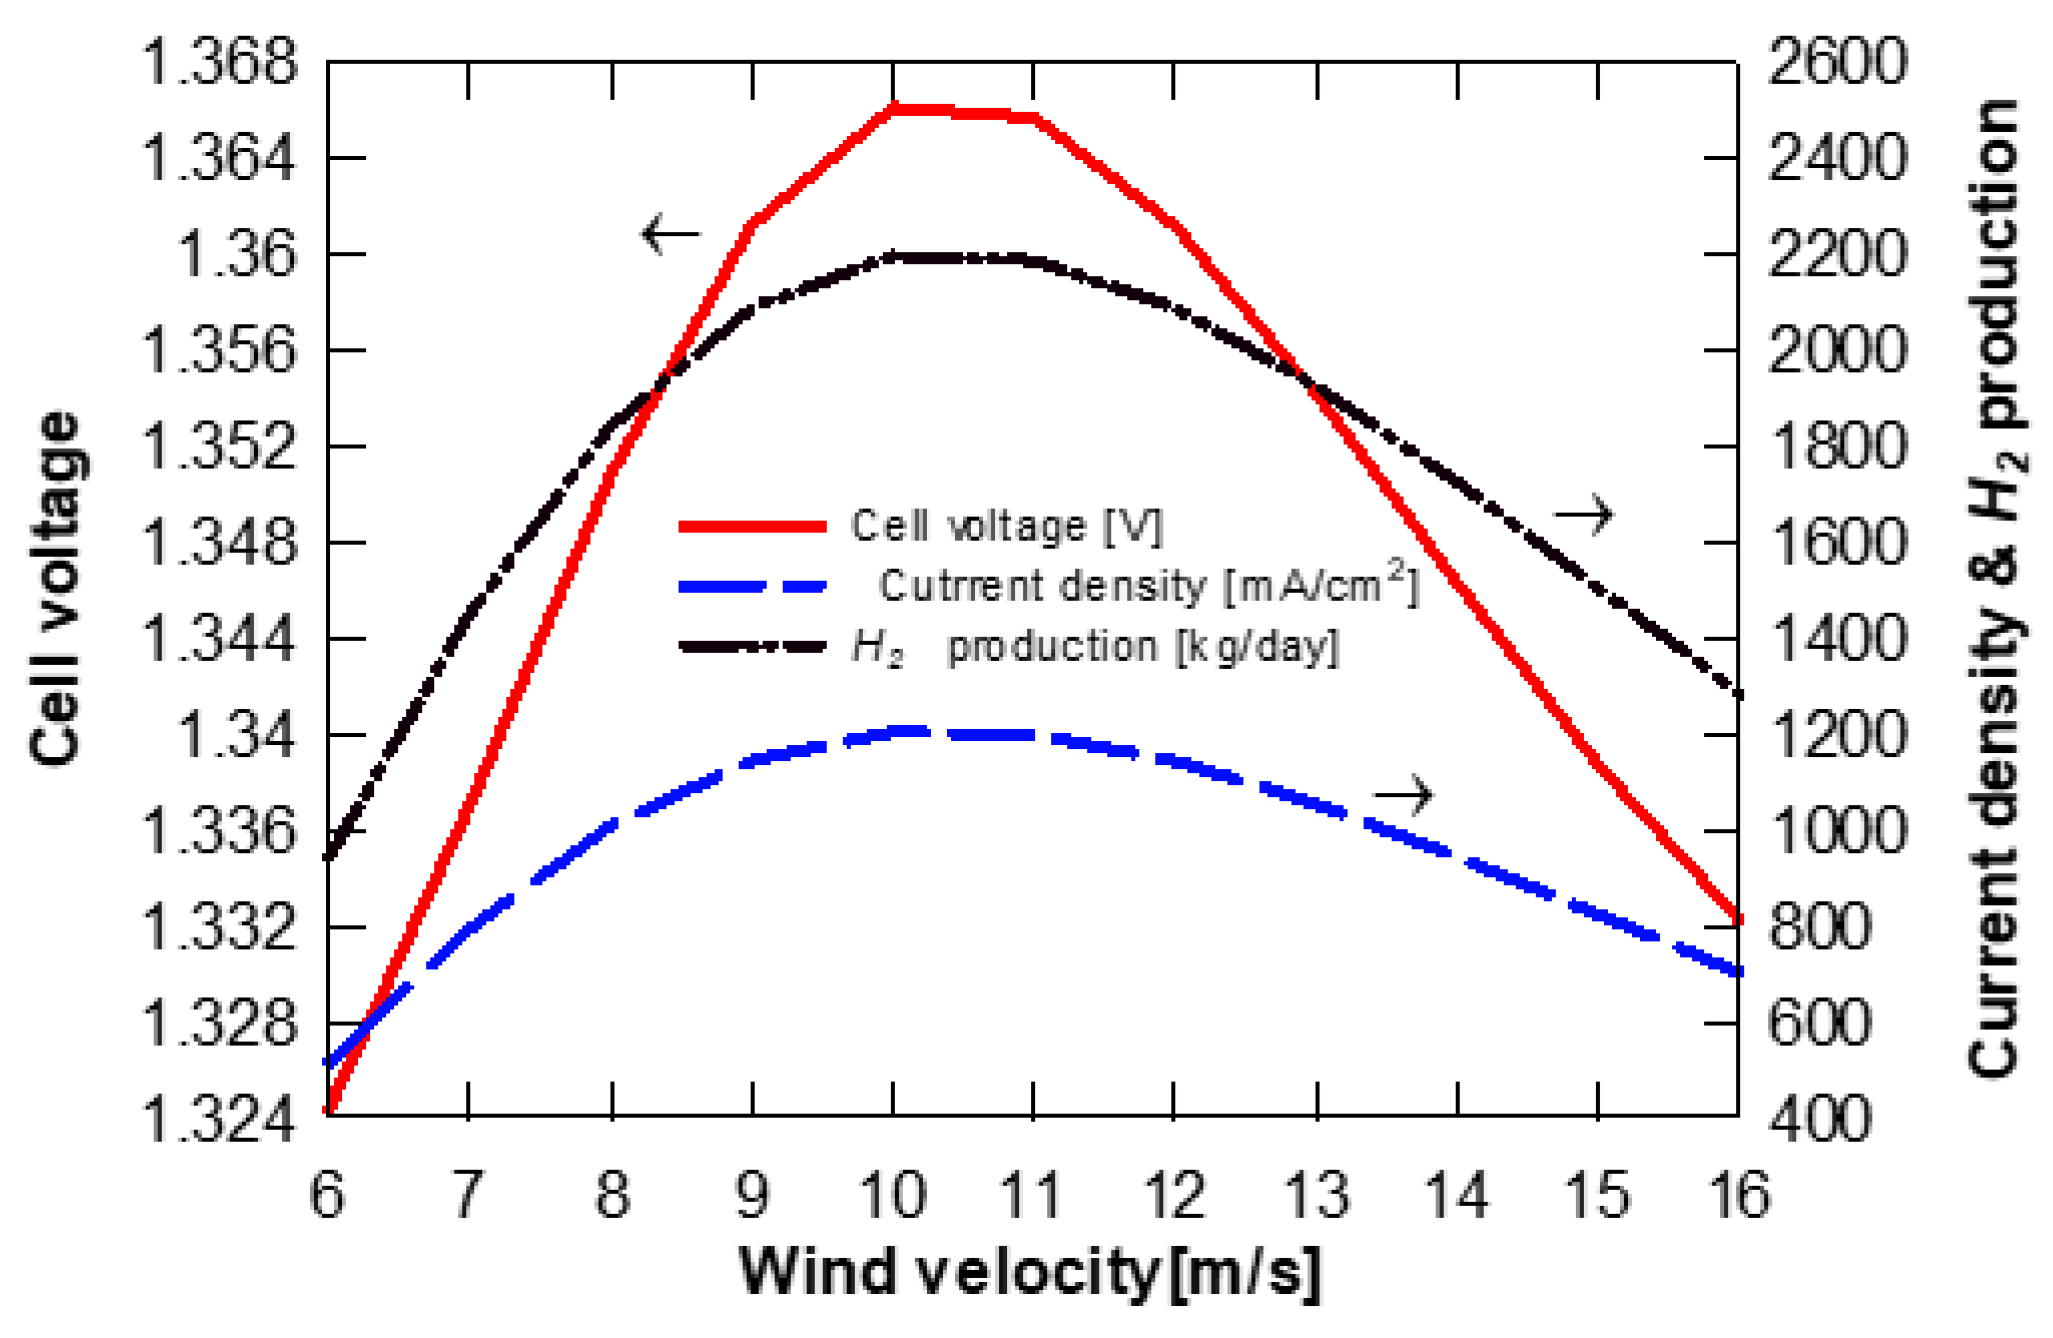
2.1. RSOC Modelling
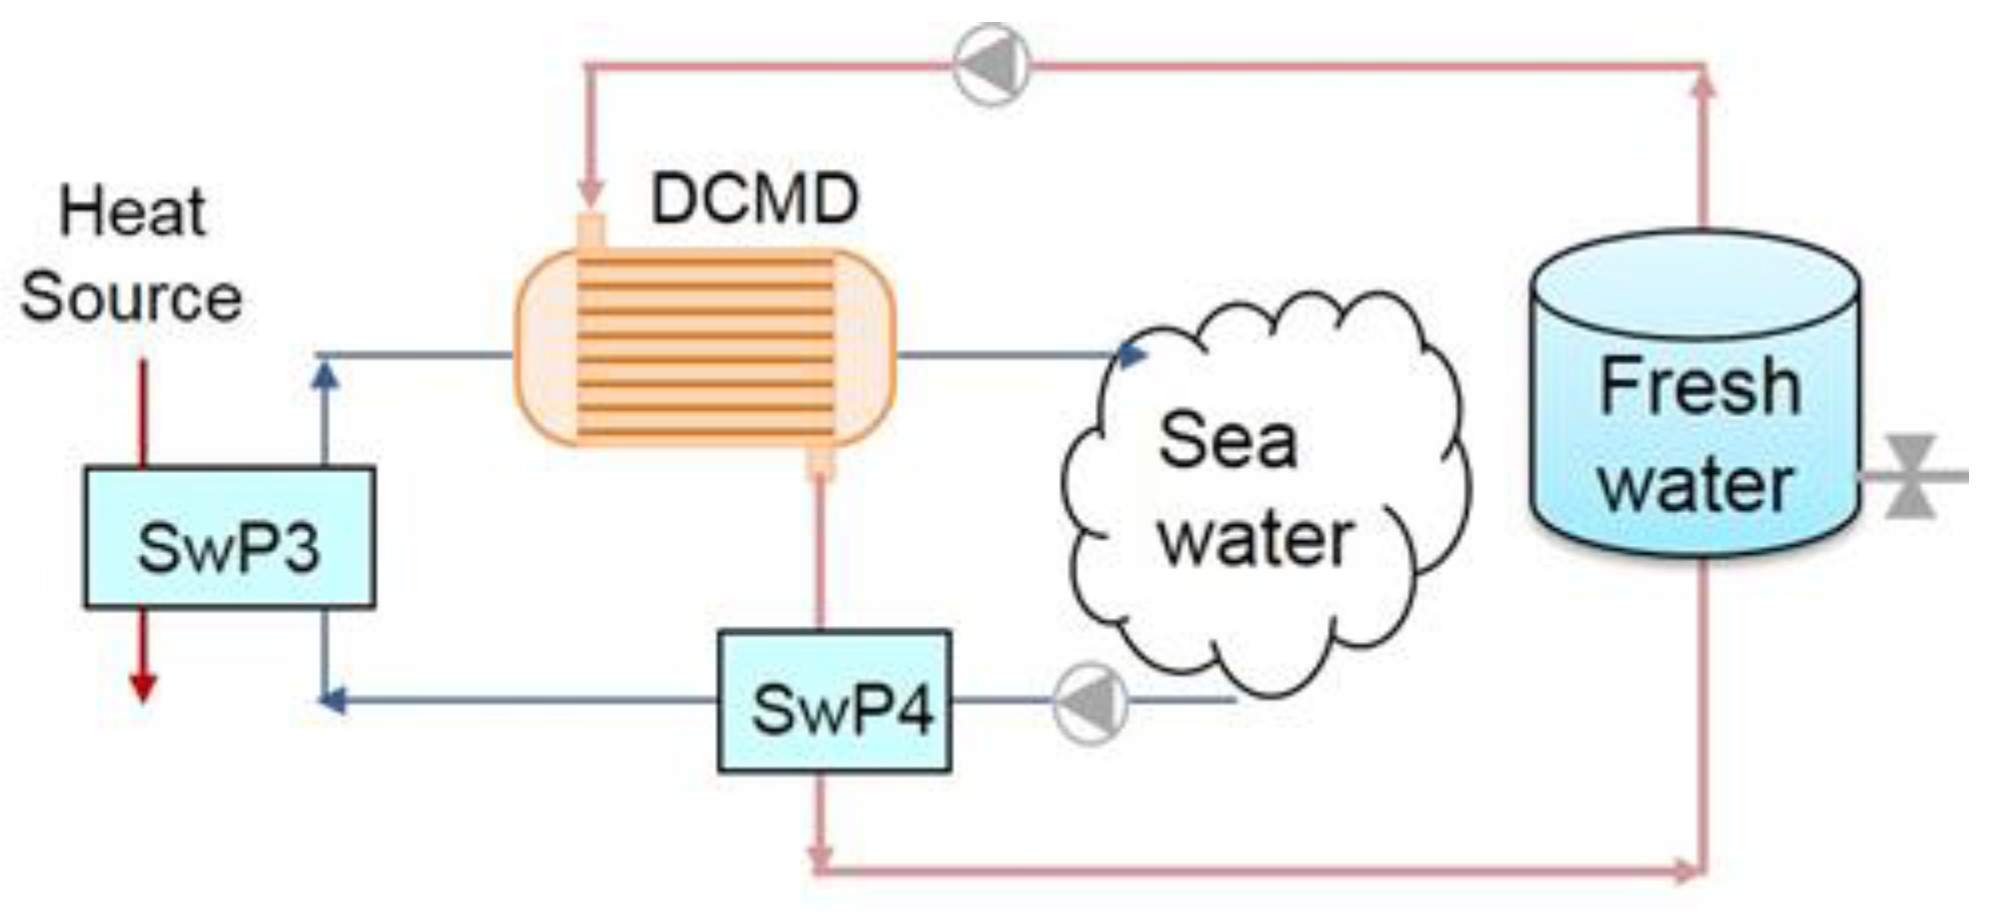
2.2. Direct Contact Membrane Desaliantion (DCMD) Modelling
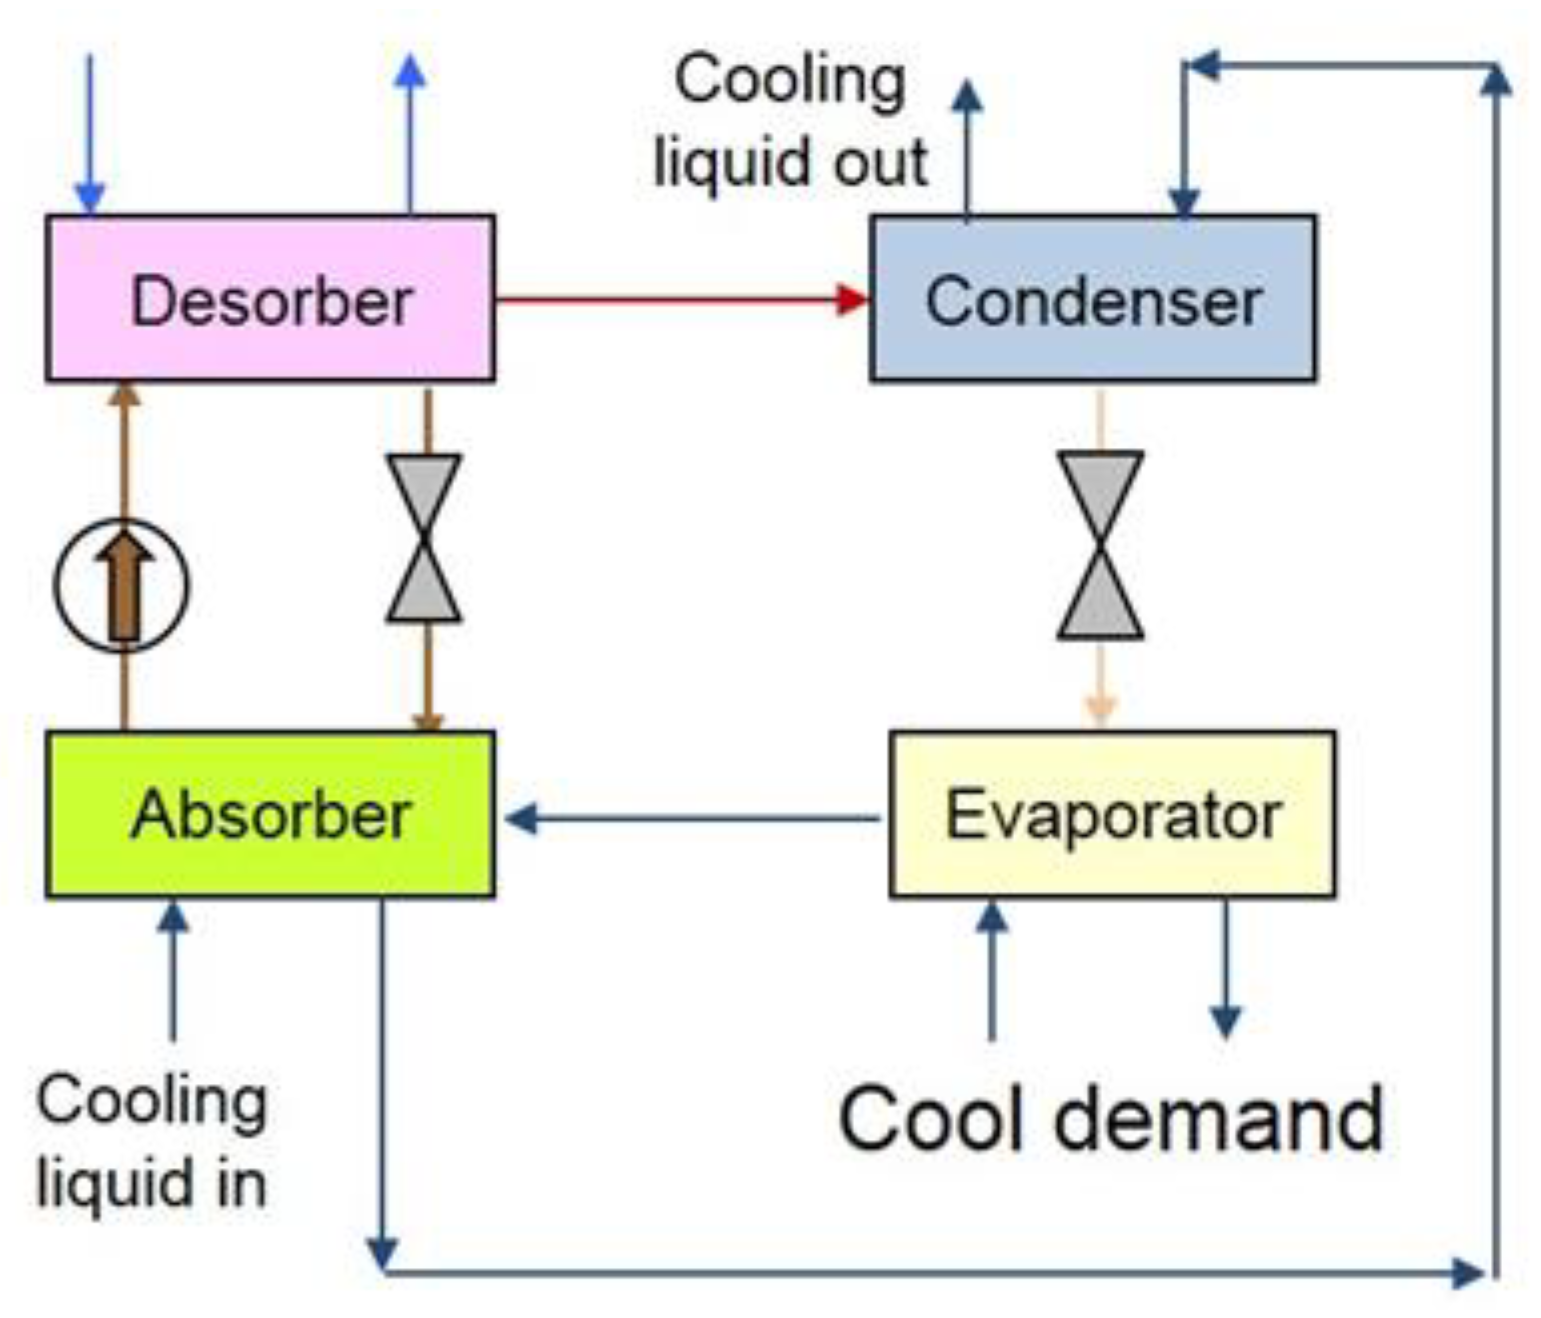
2.3. Single Stage Absorption Chiller Modelling
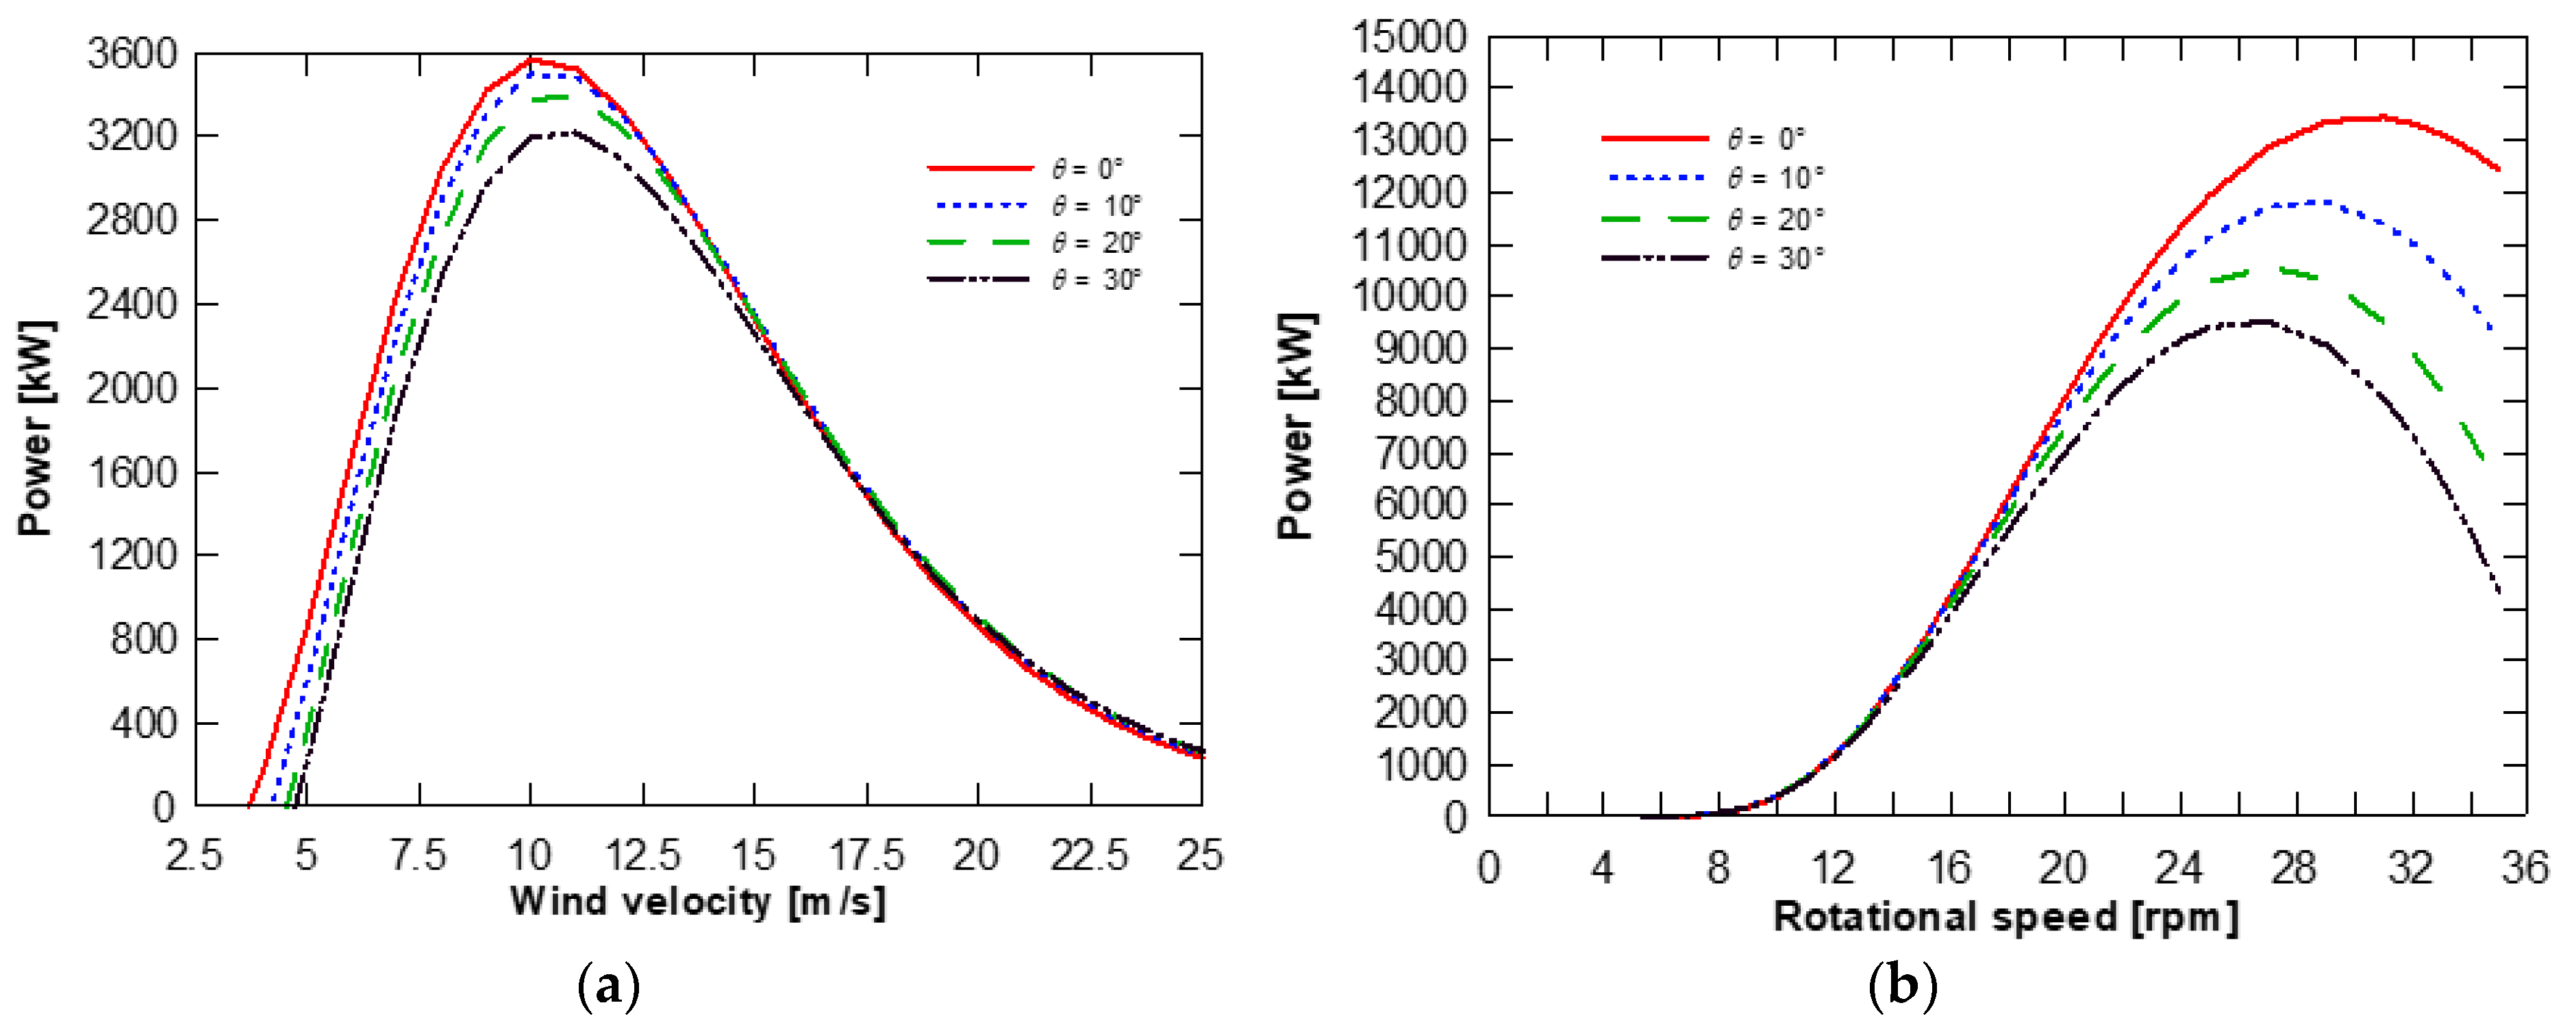
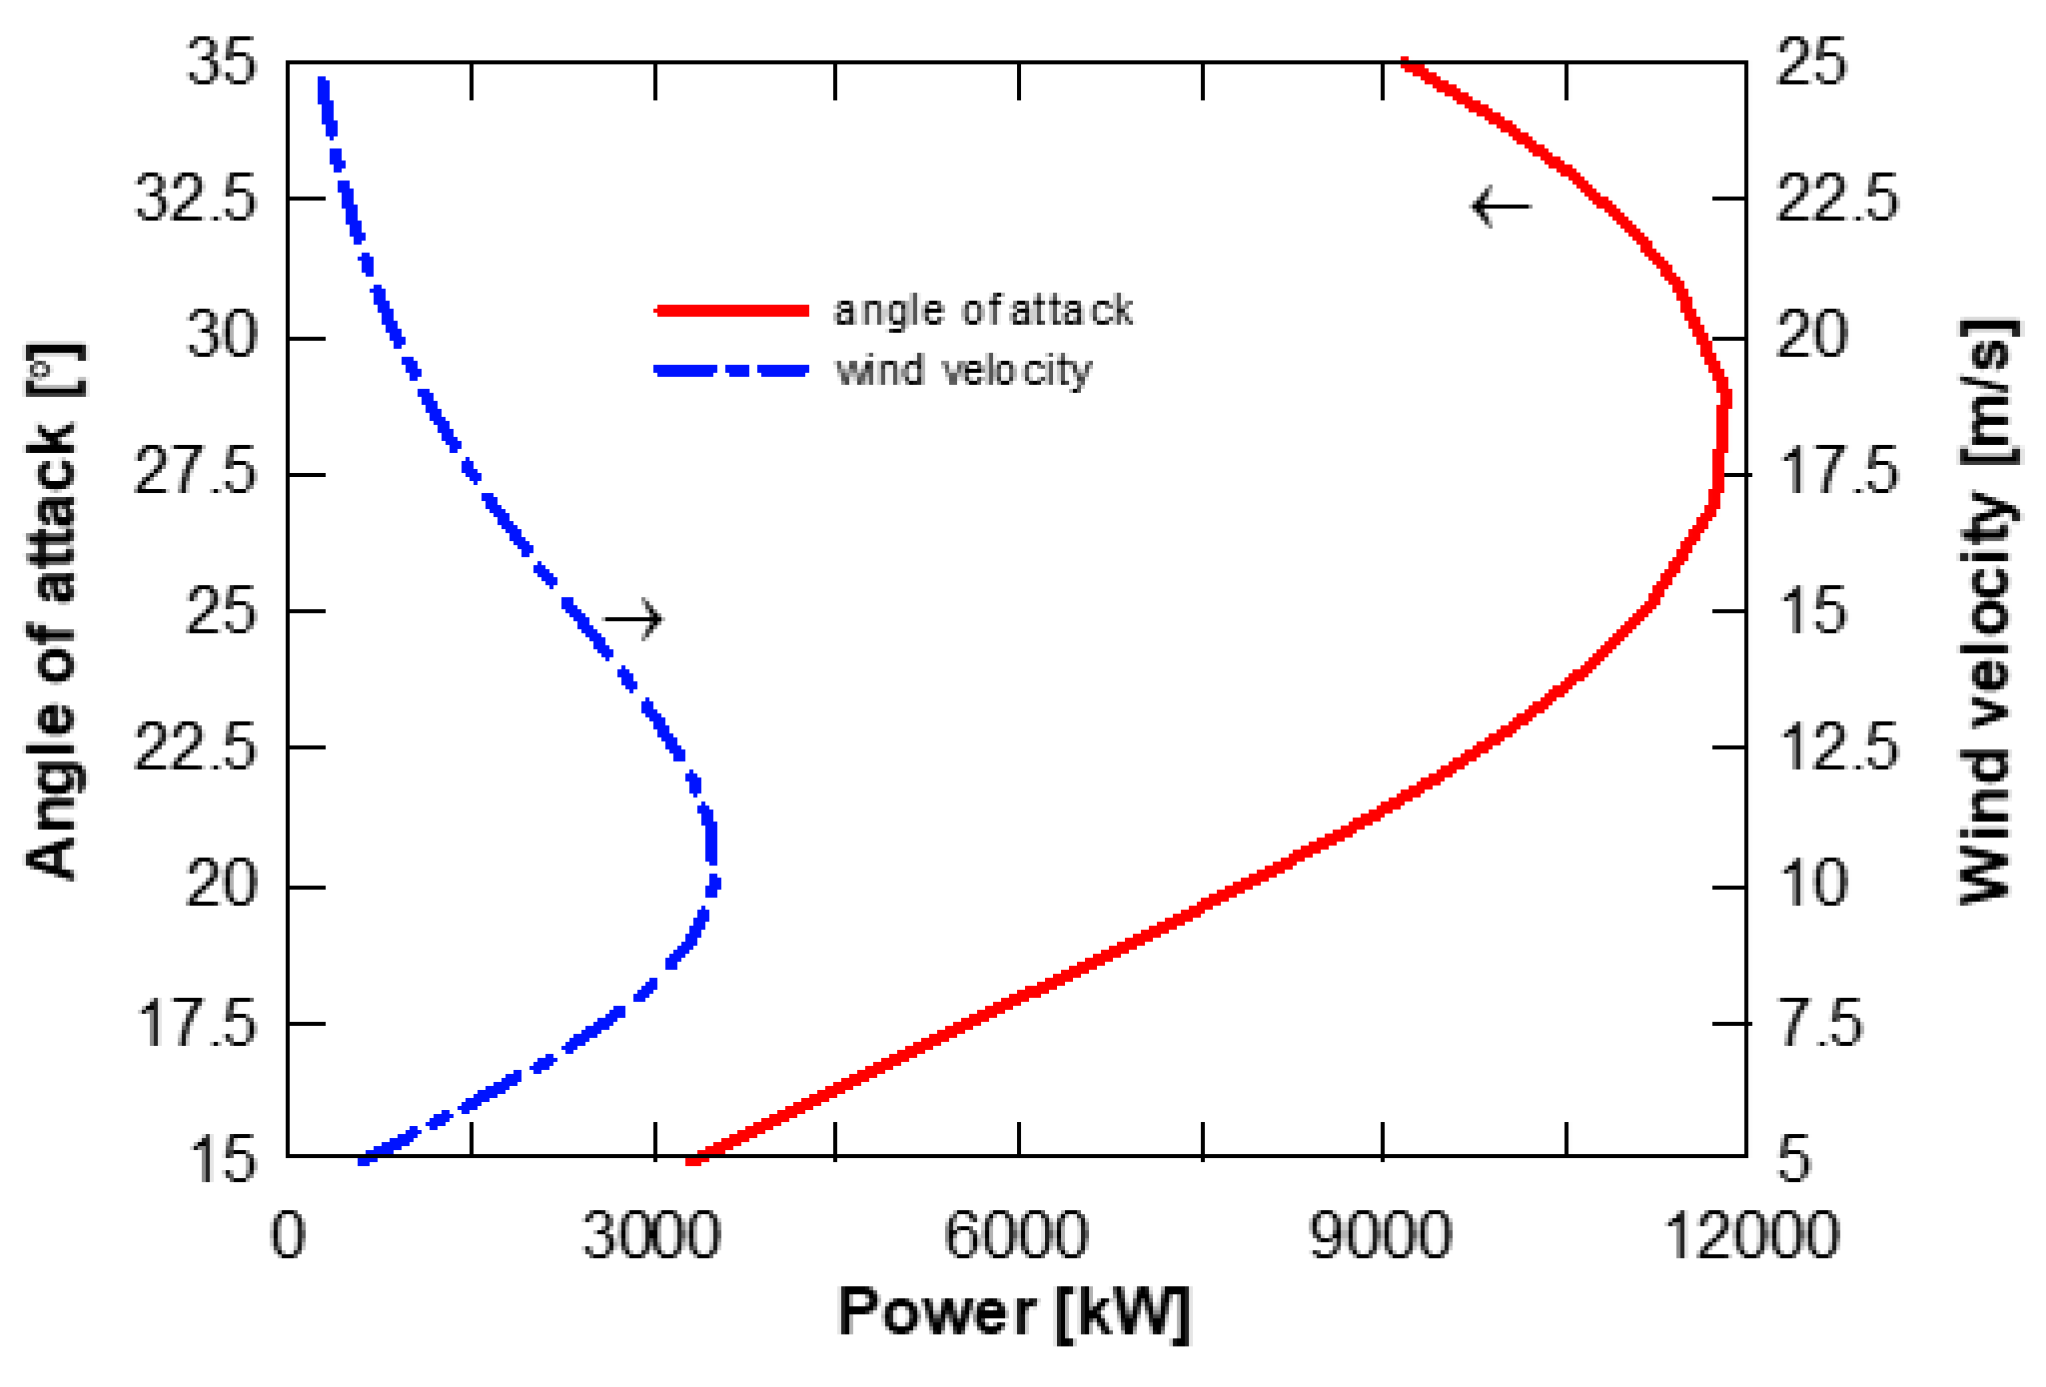
2.4. Wind Turbine Modelling
2.5. Modelling of PTSC (Parabolic Trough Solar Collector)
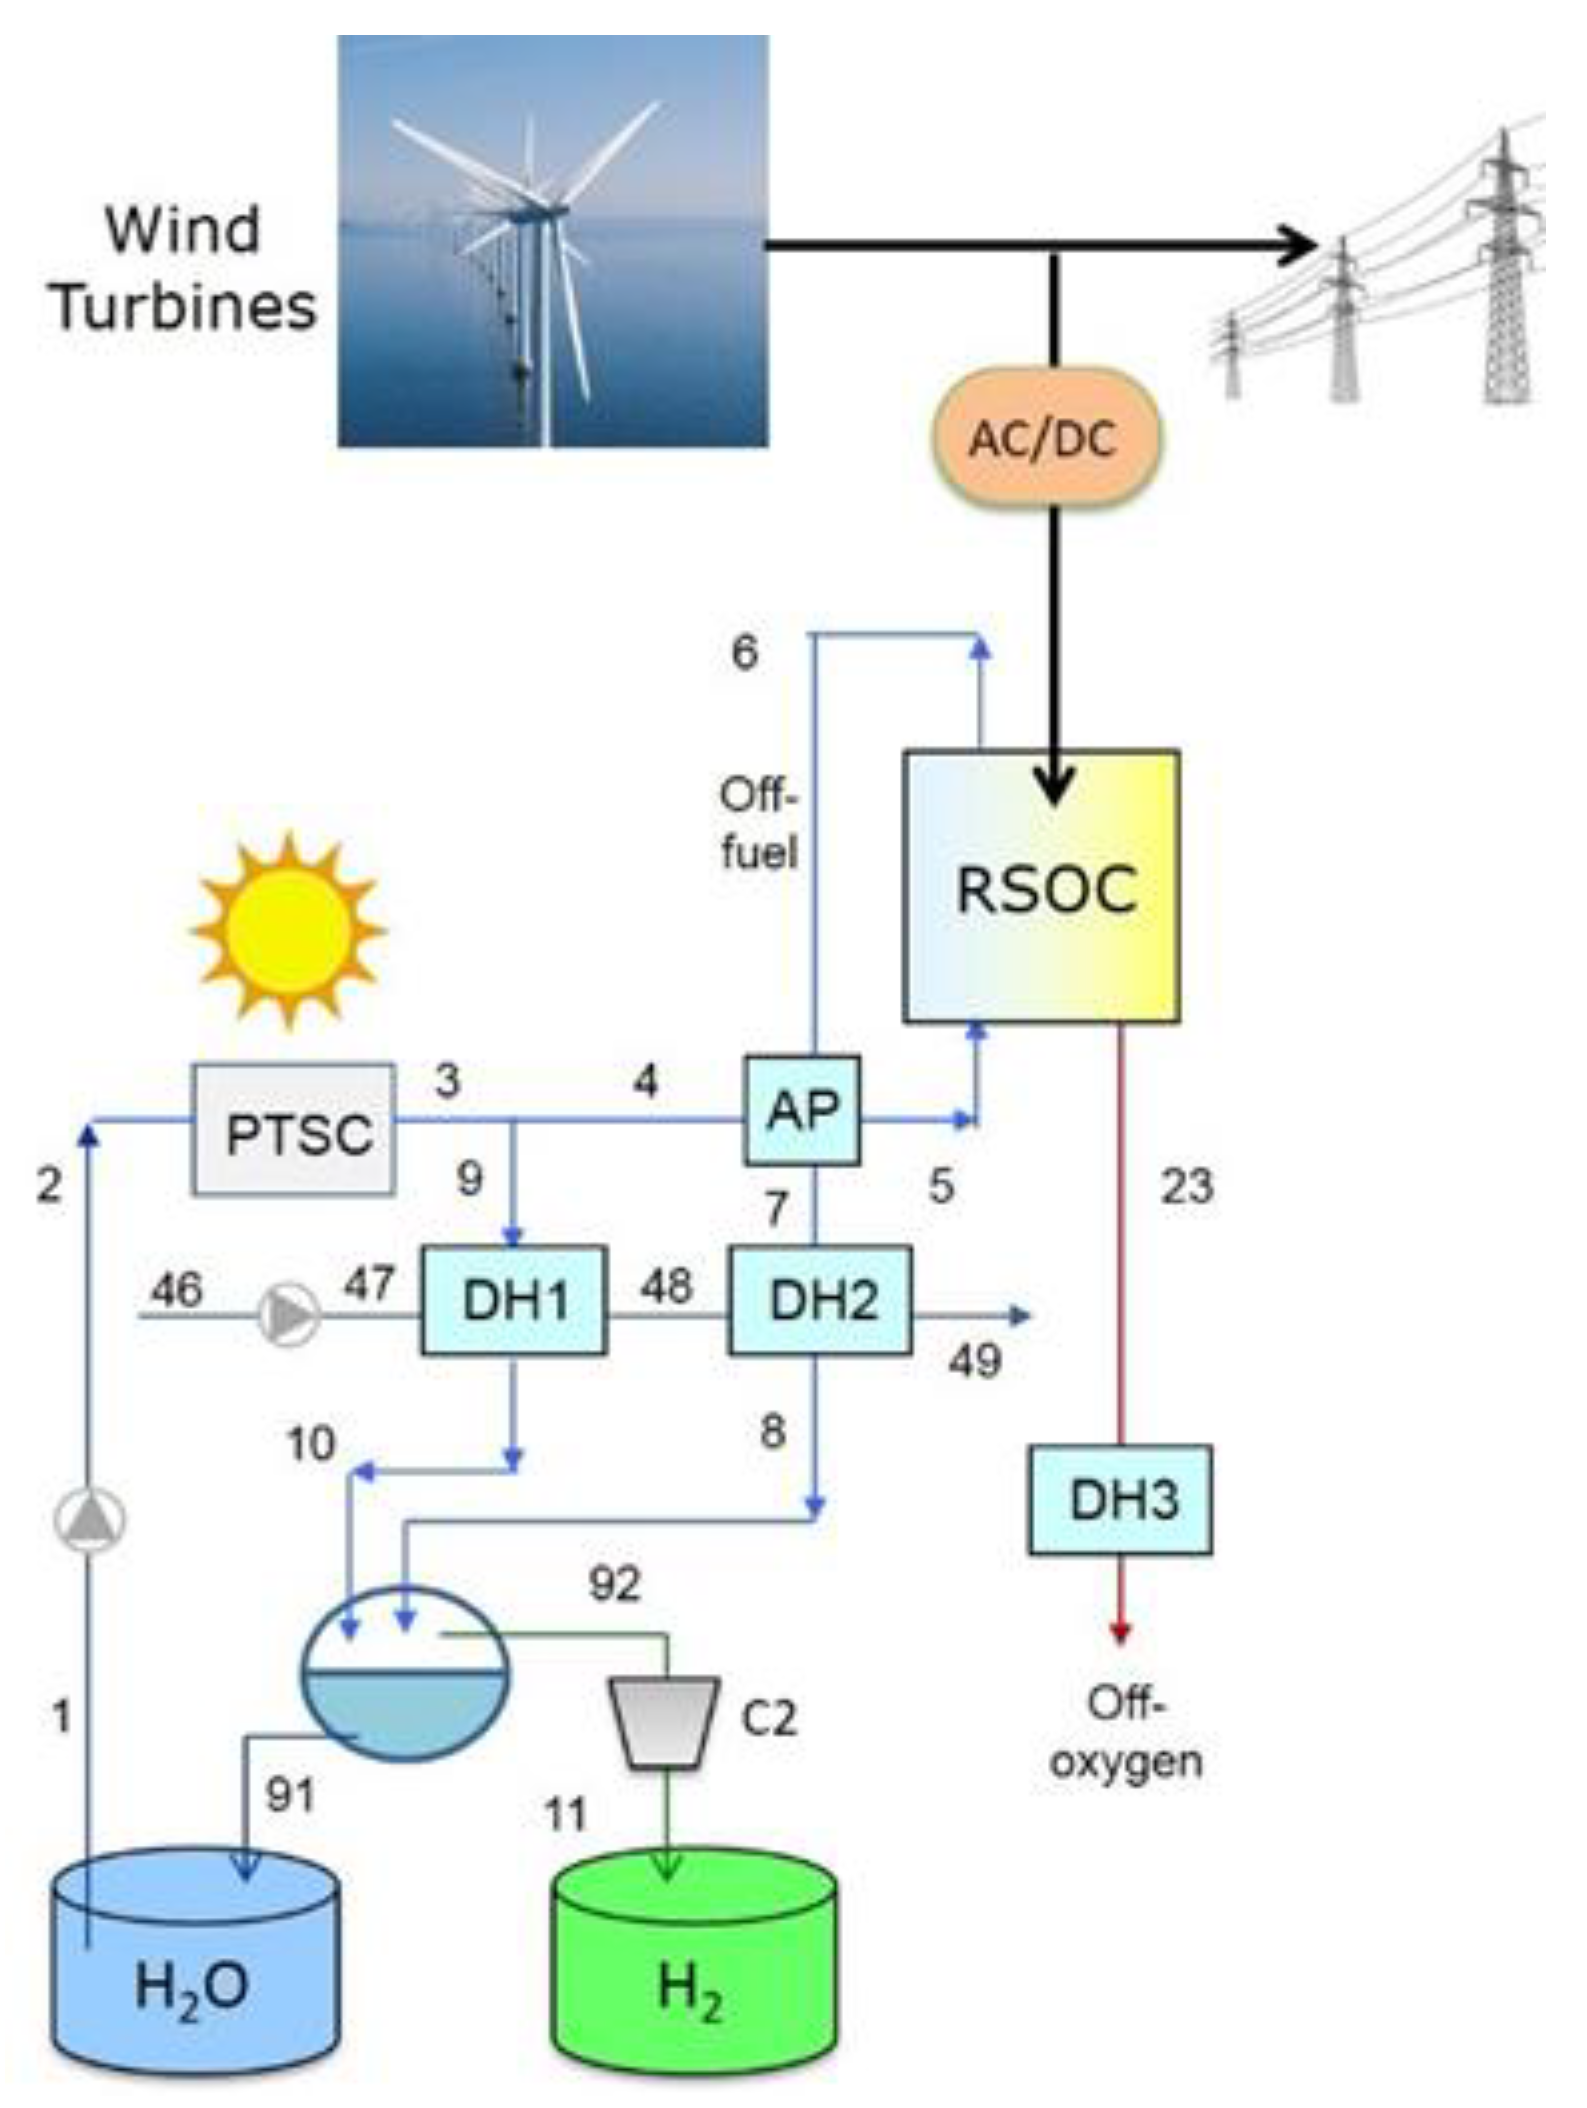
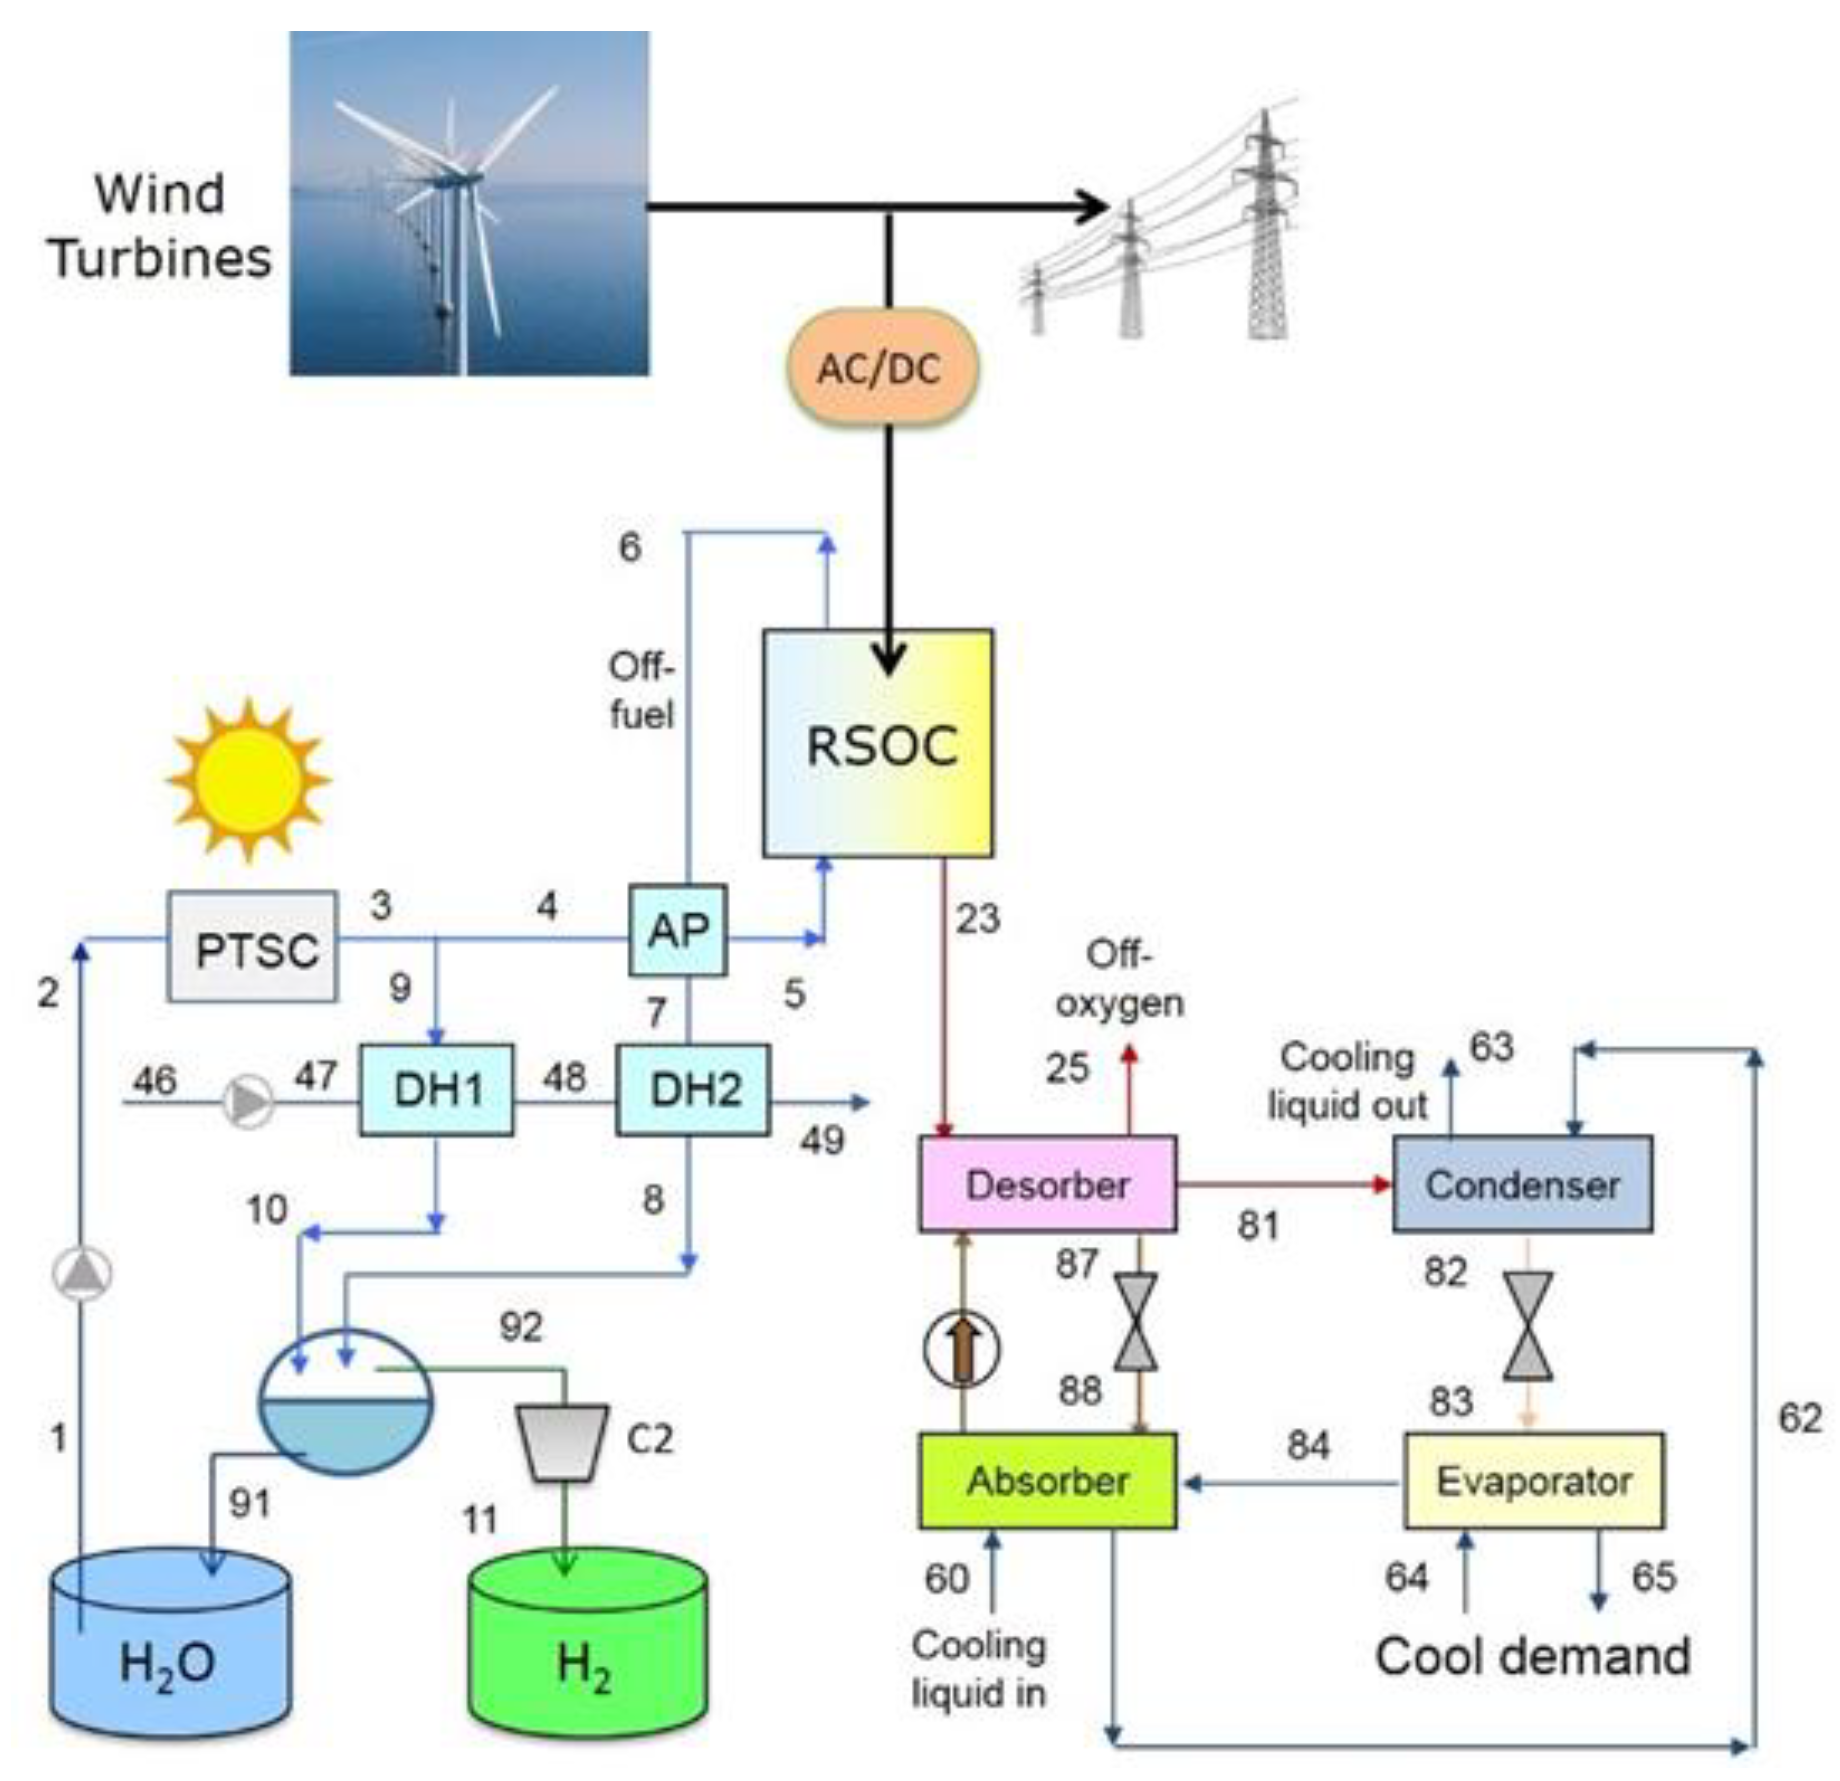
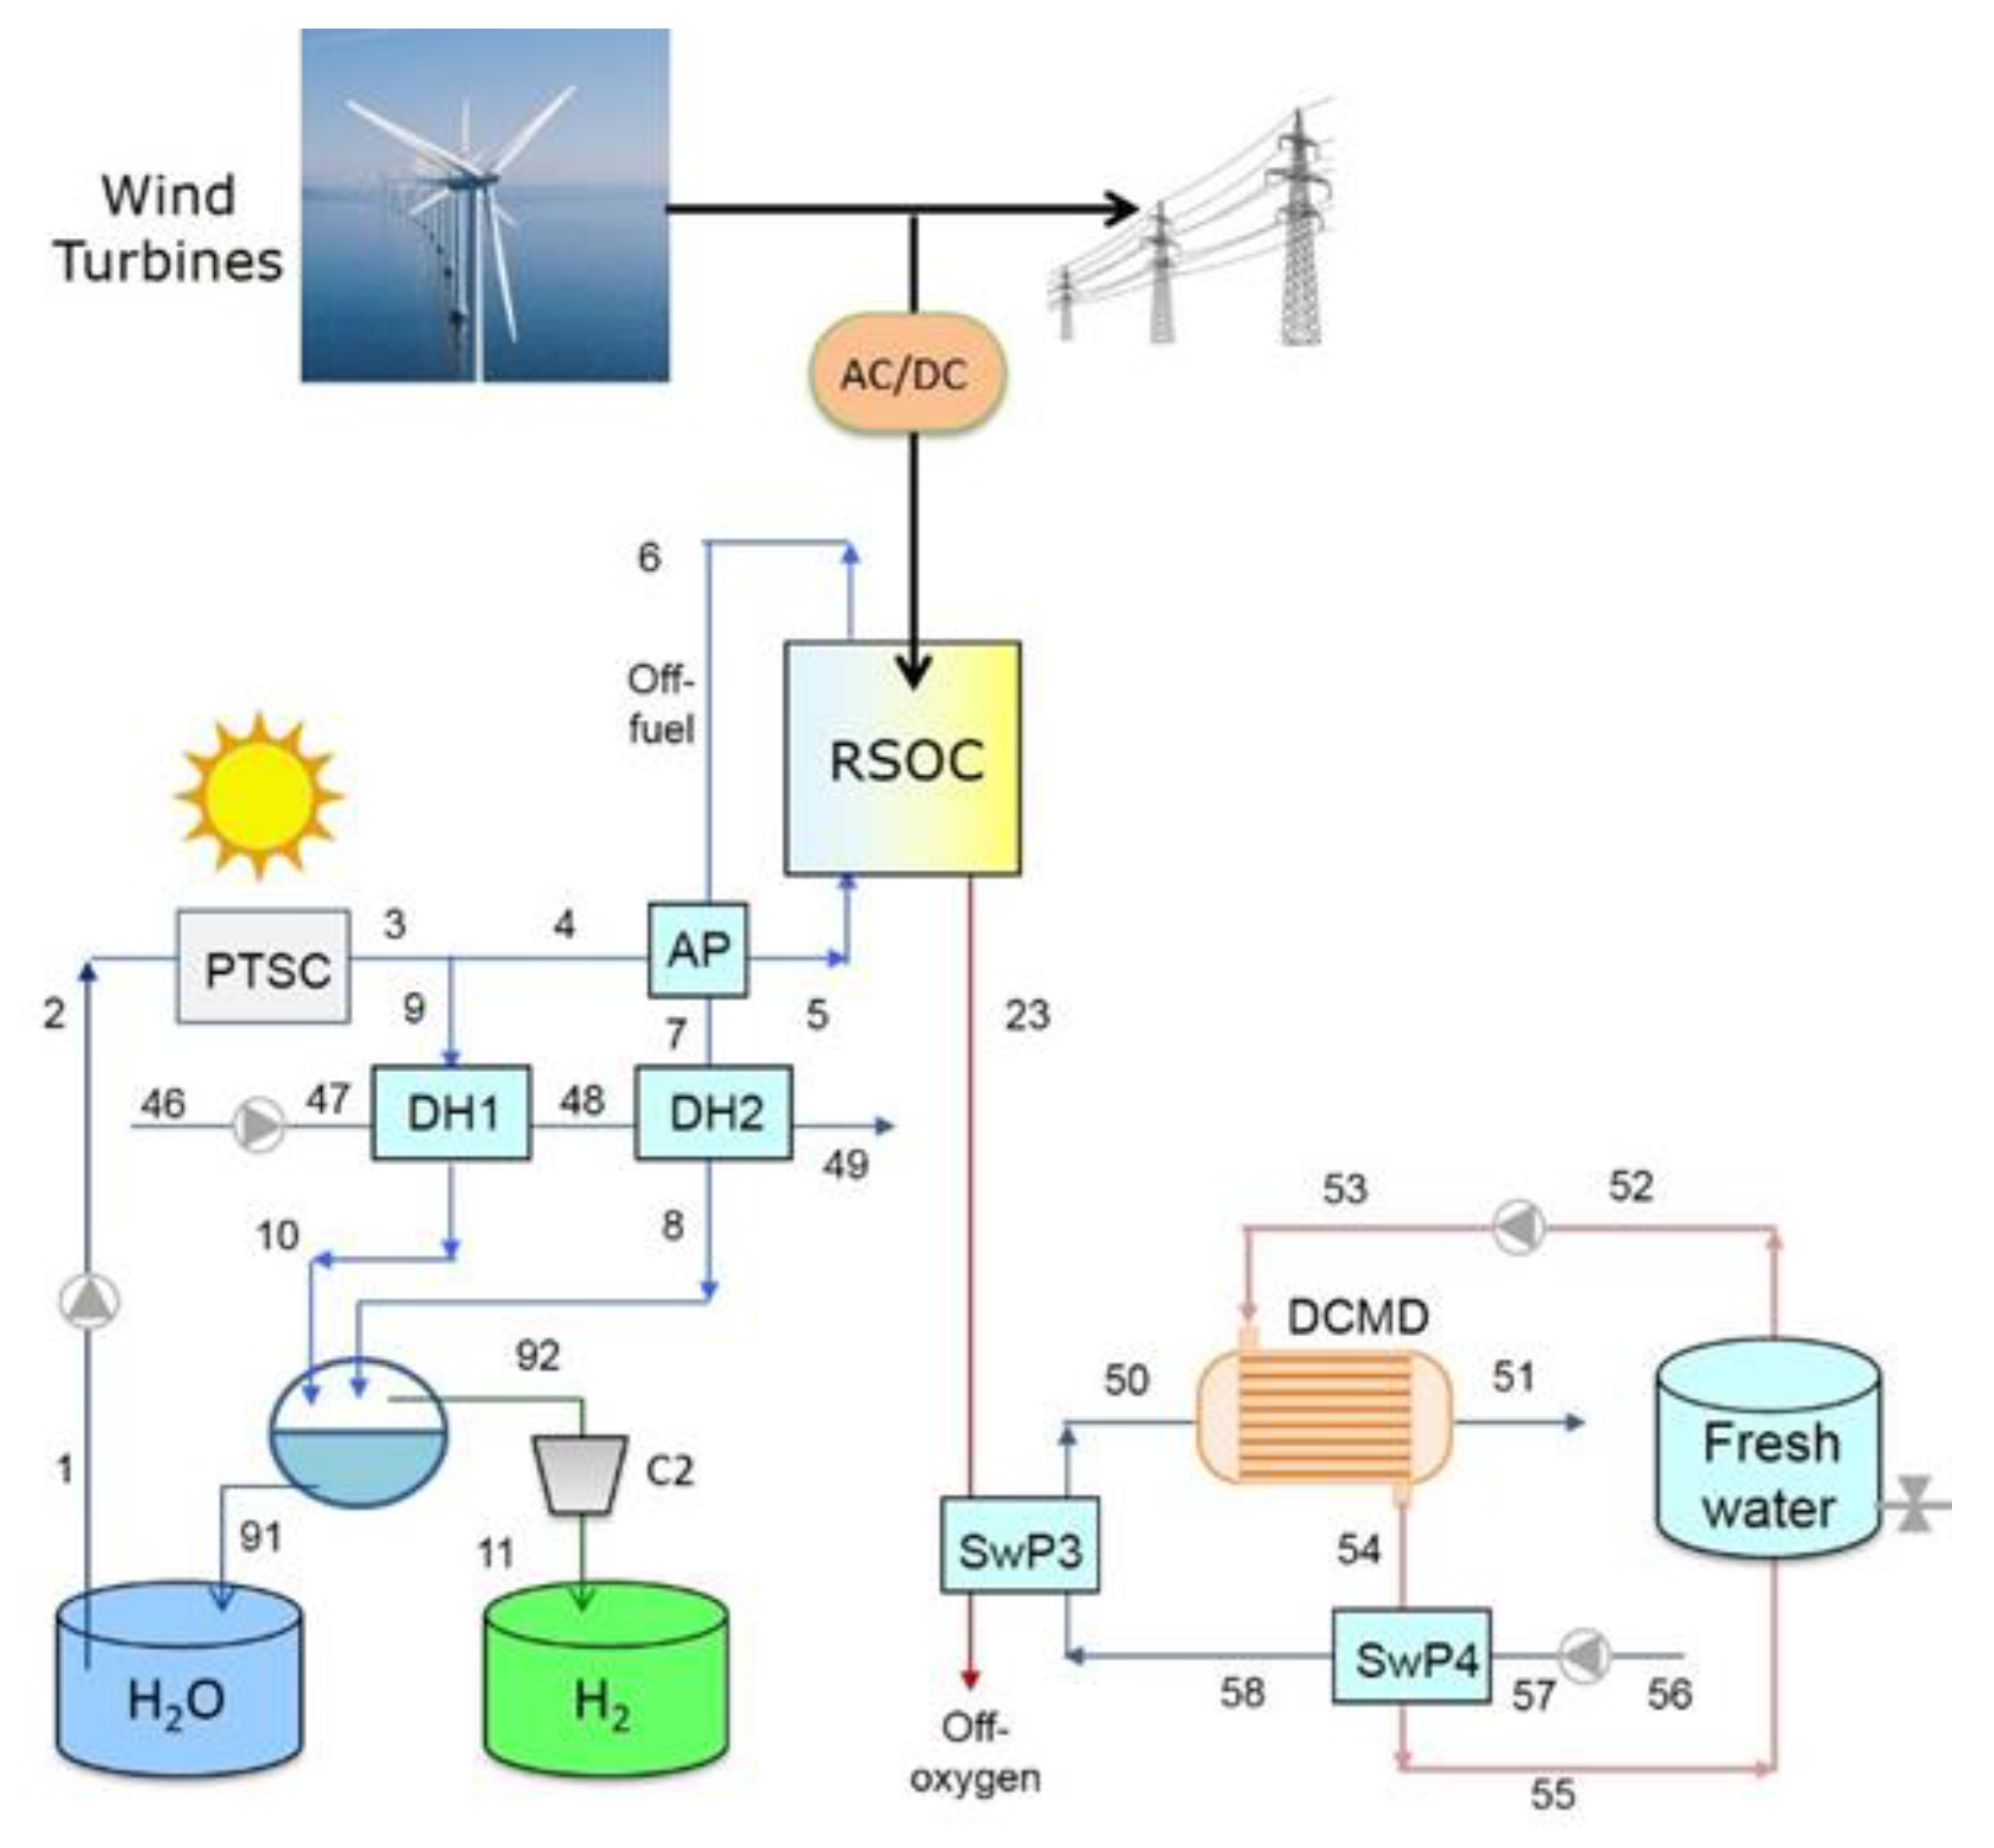
3. Proposed Plant Schemes
4. Results and Discussions
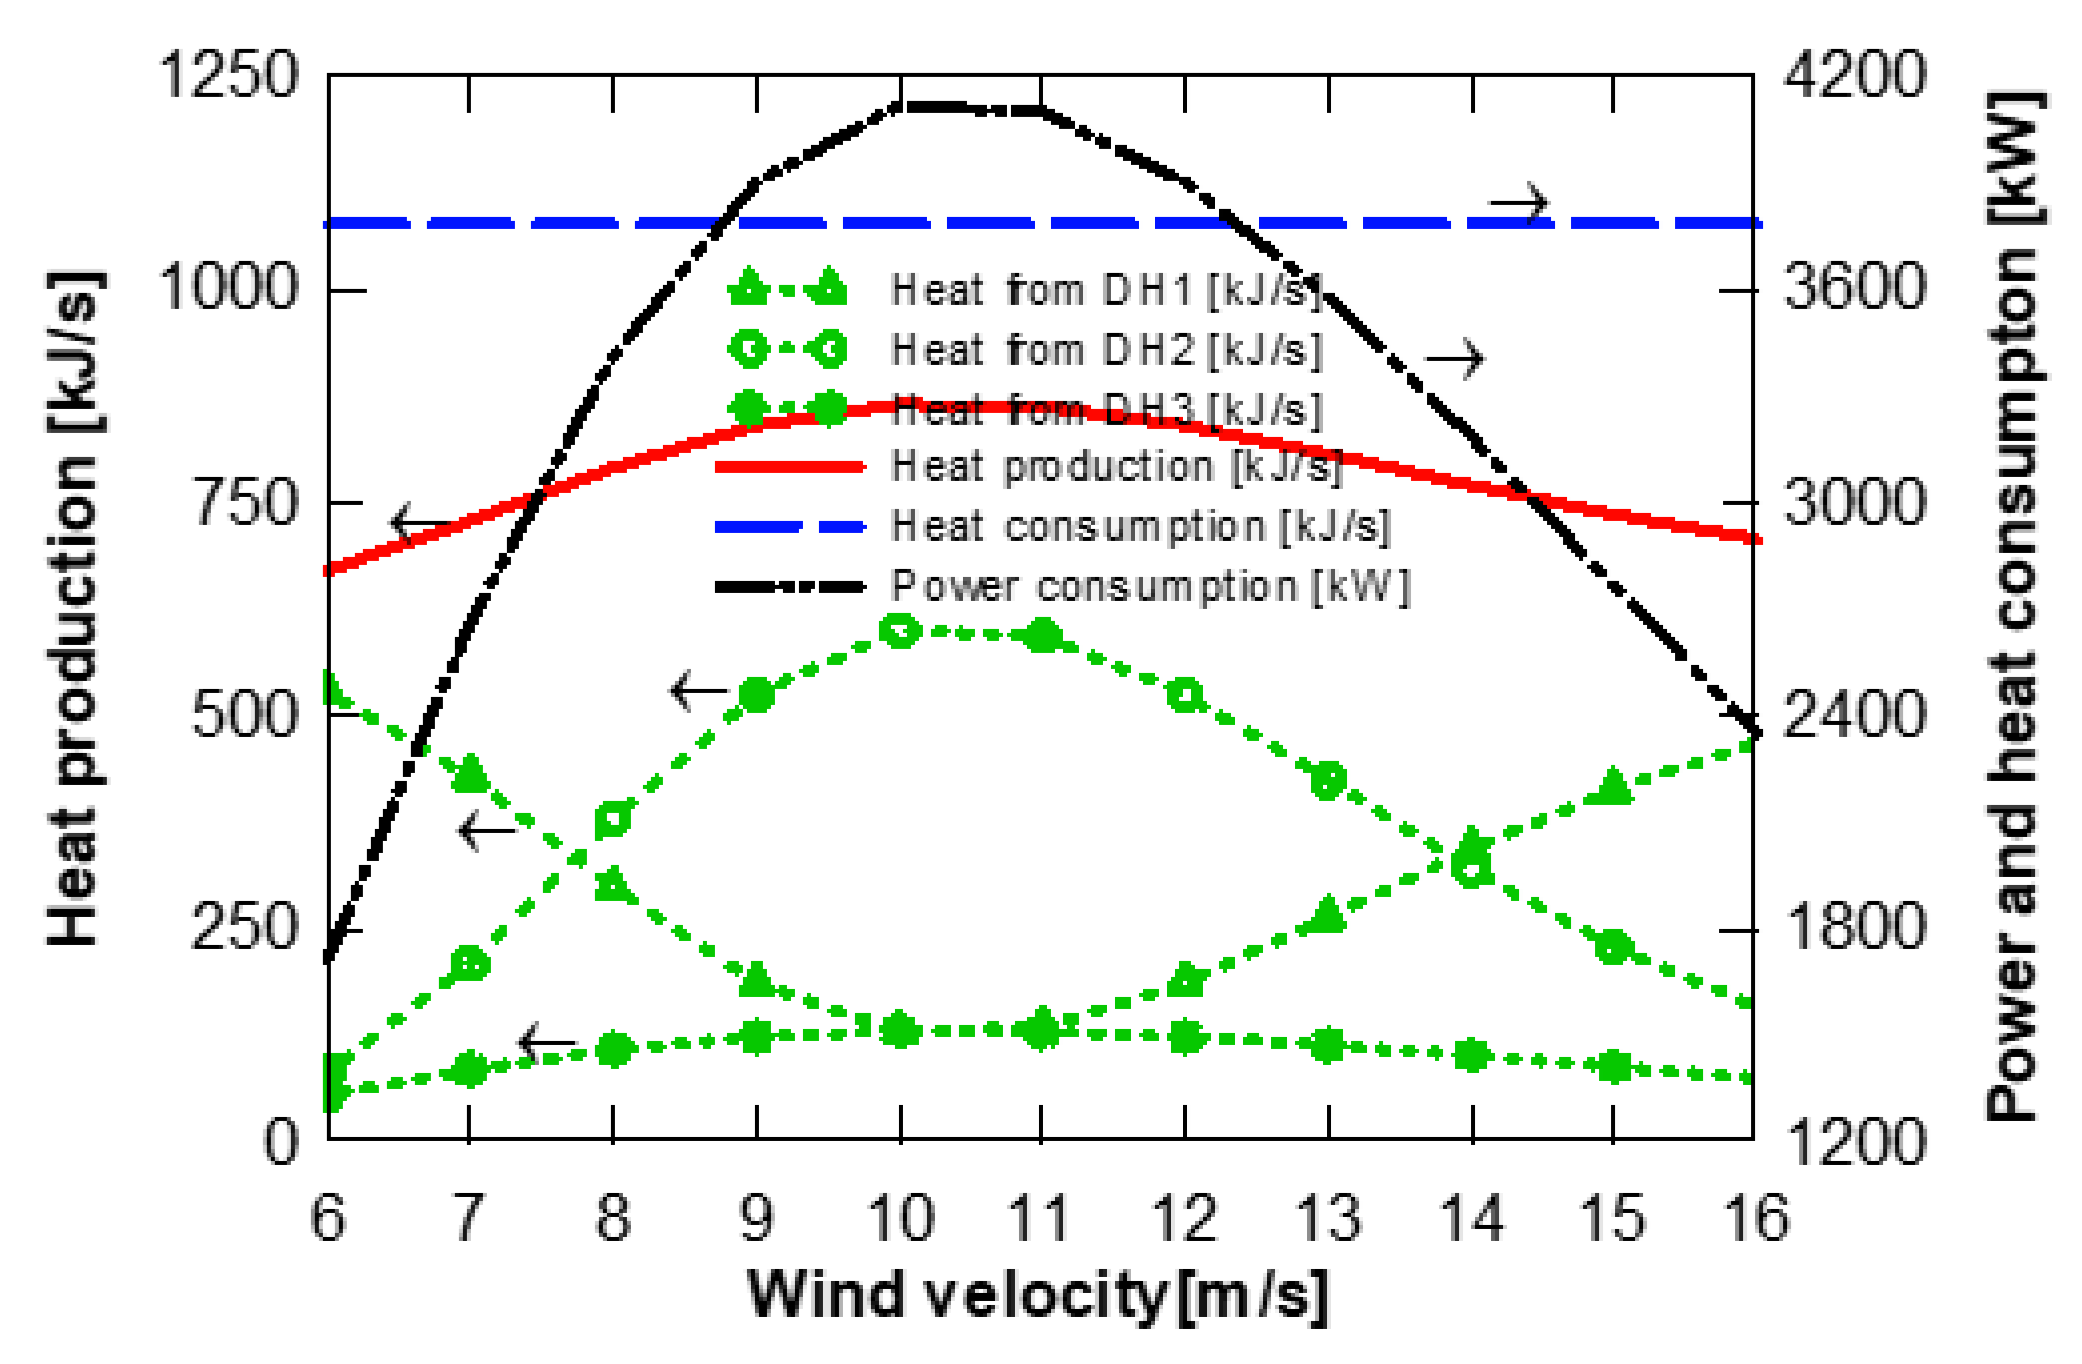
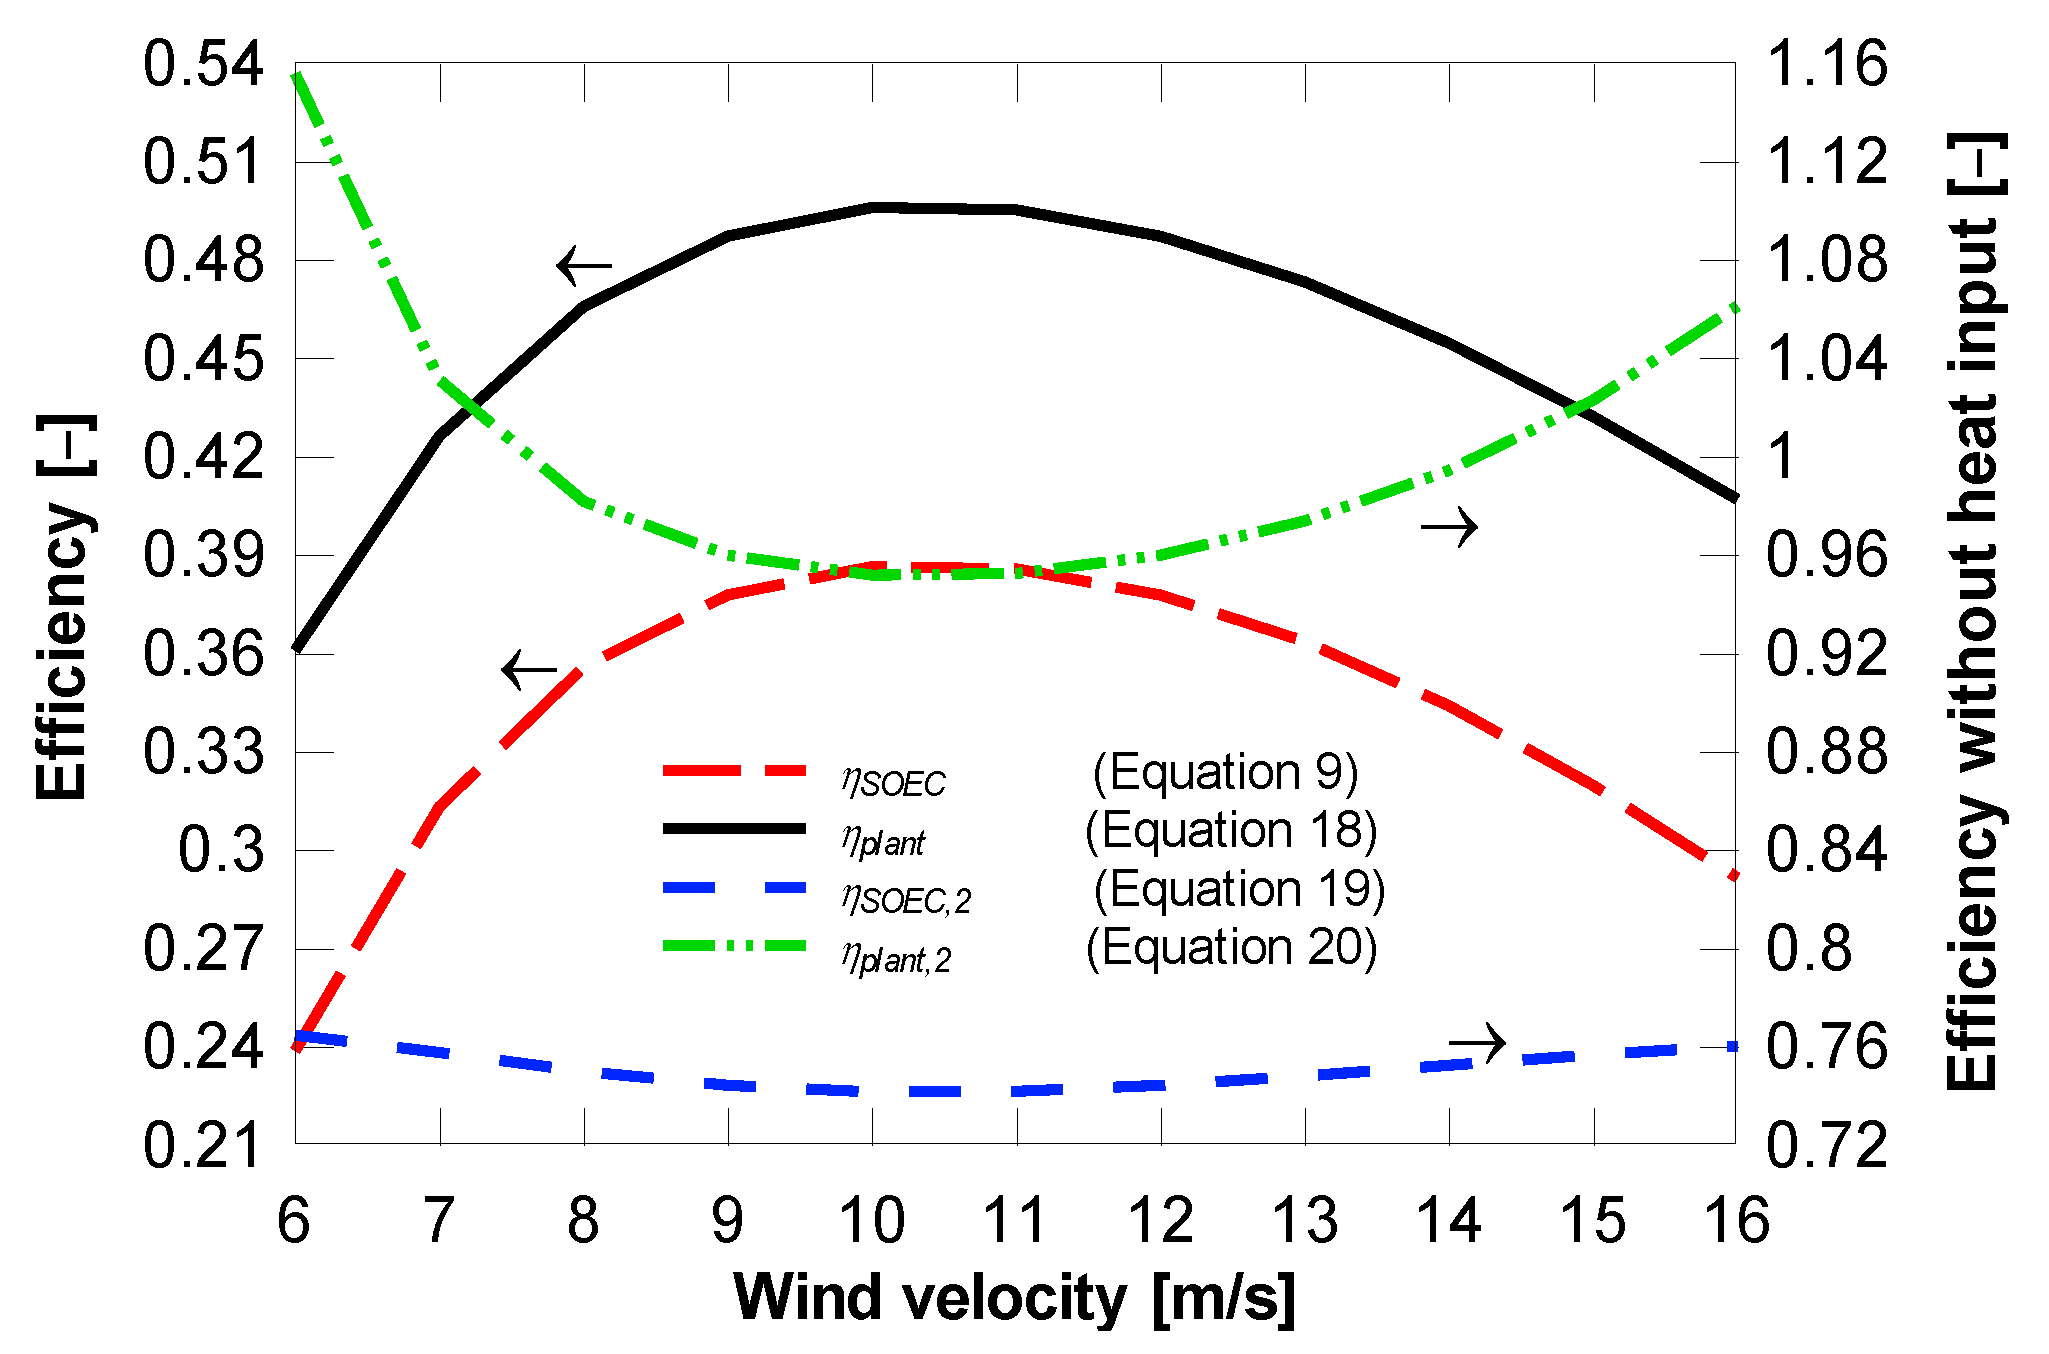
4.1. Plant with District Heating Only
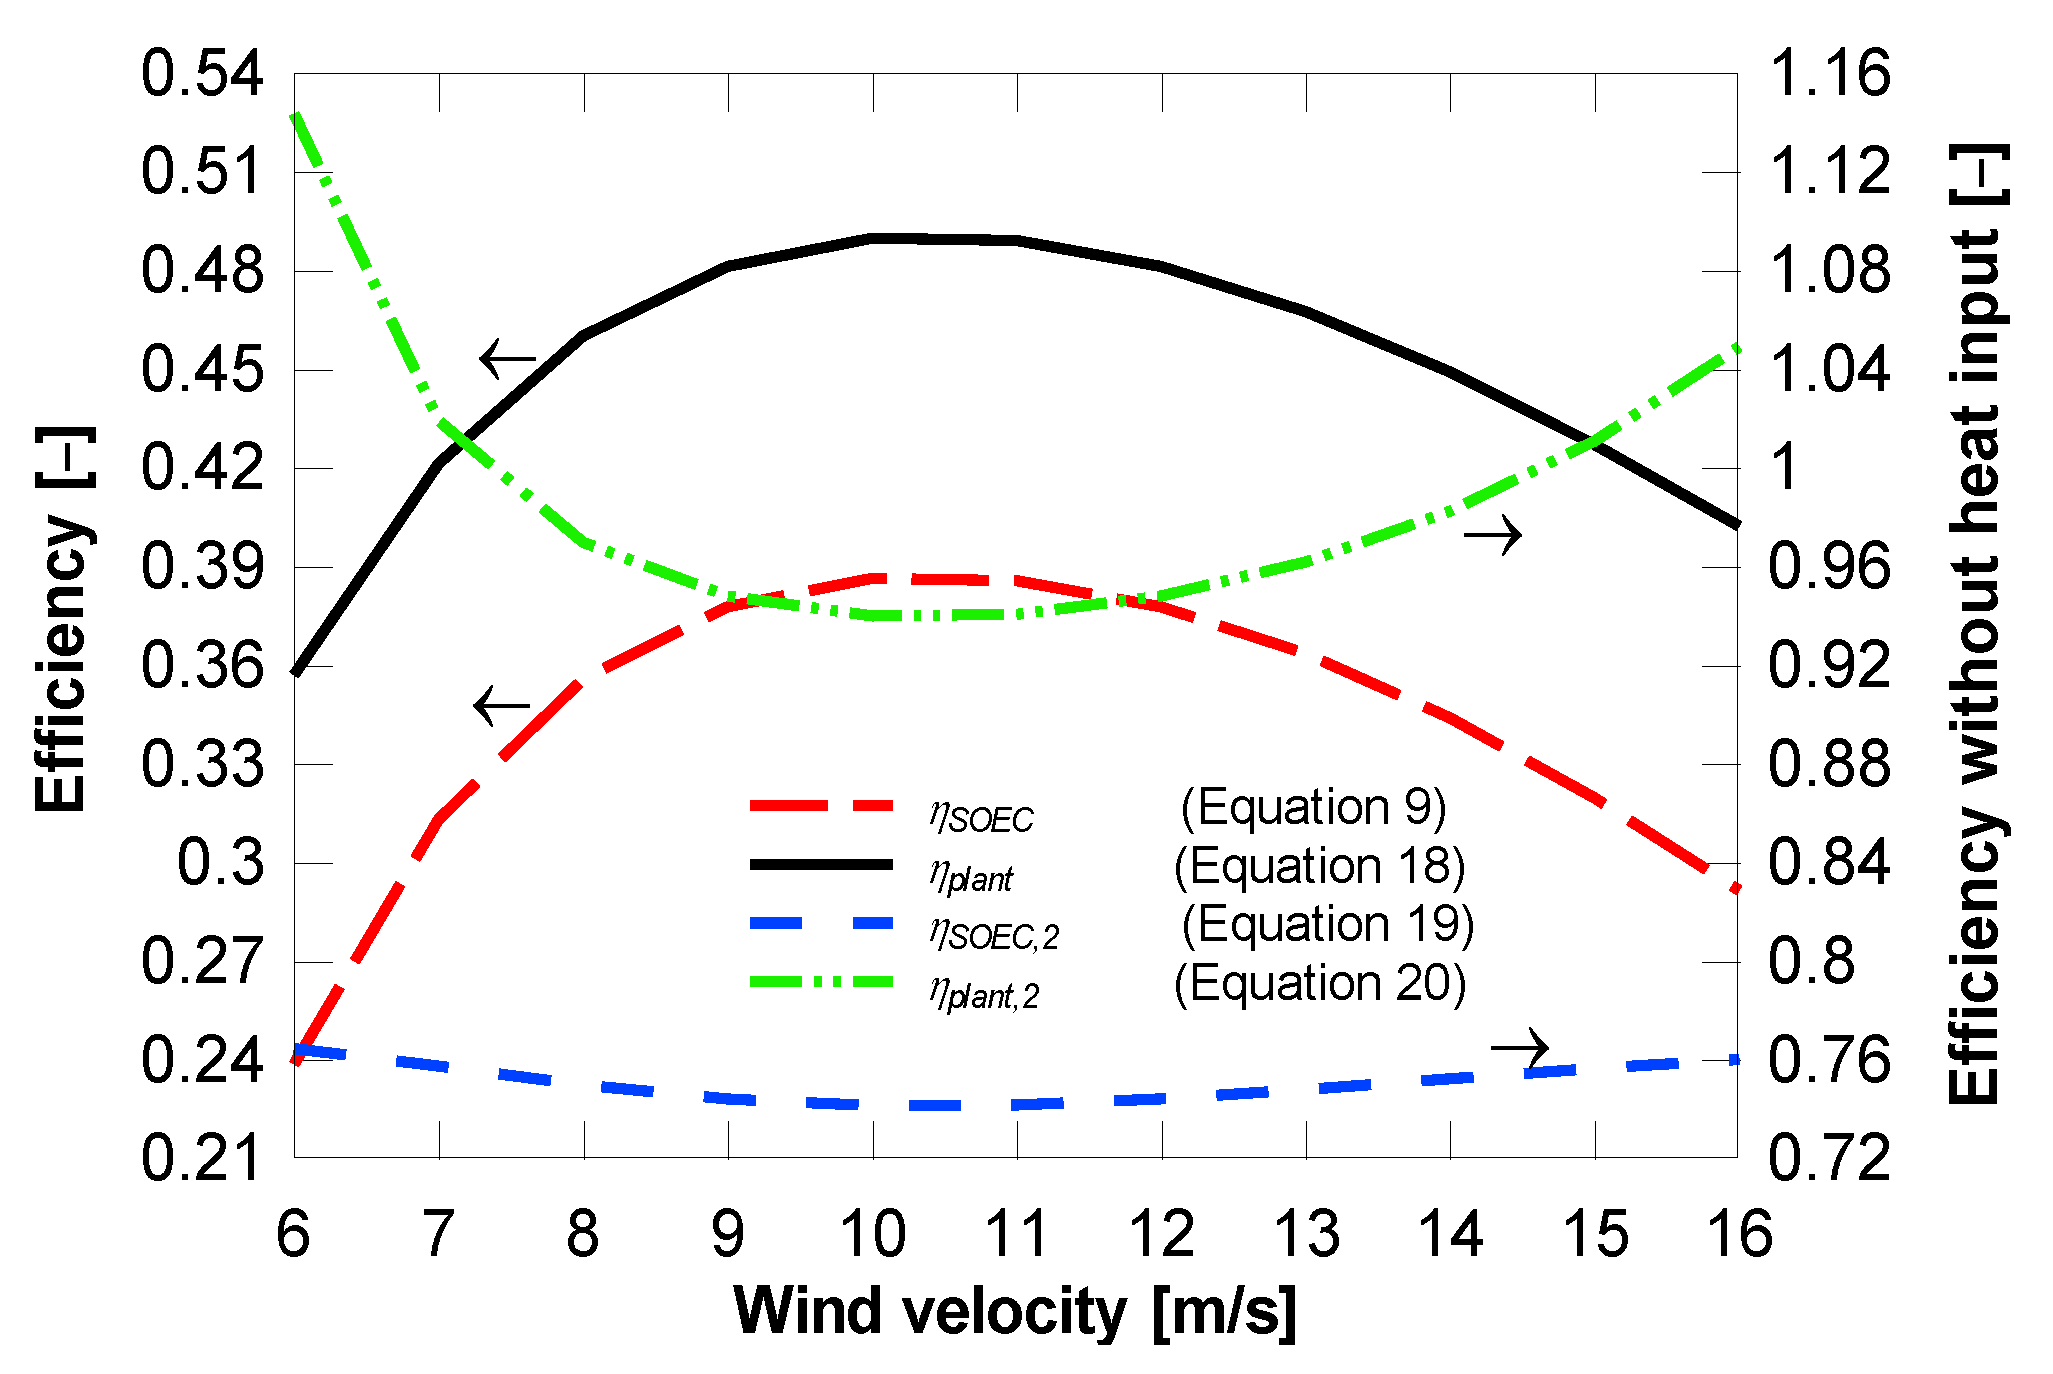
4.2. Plant with District Heating and Cooling
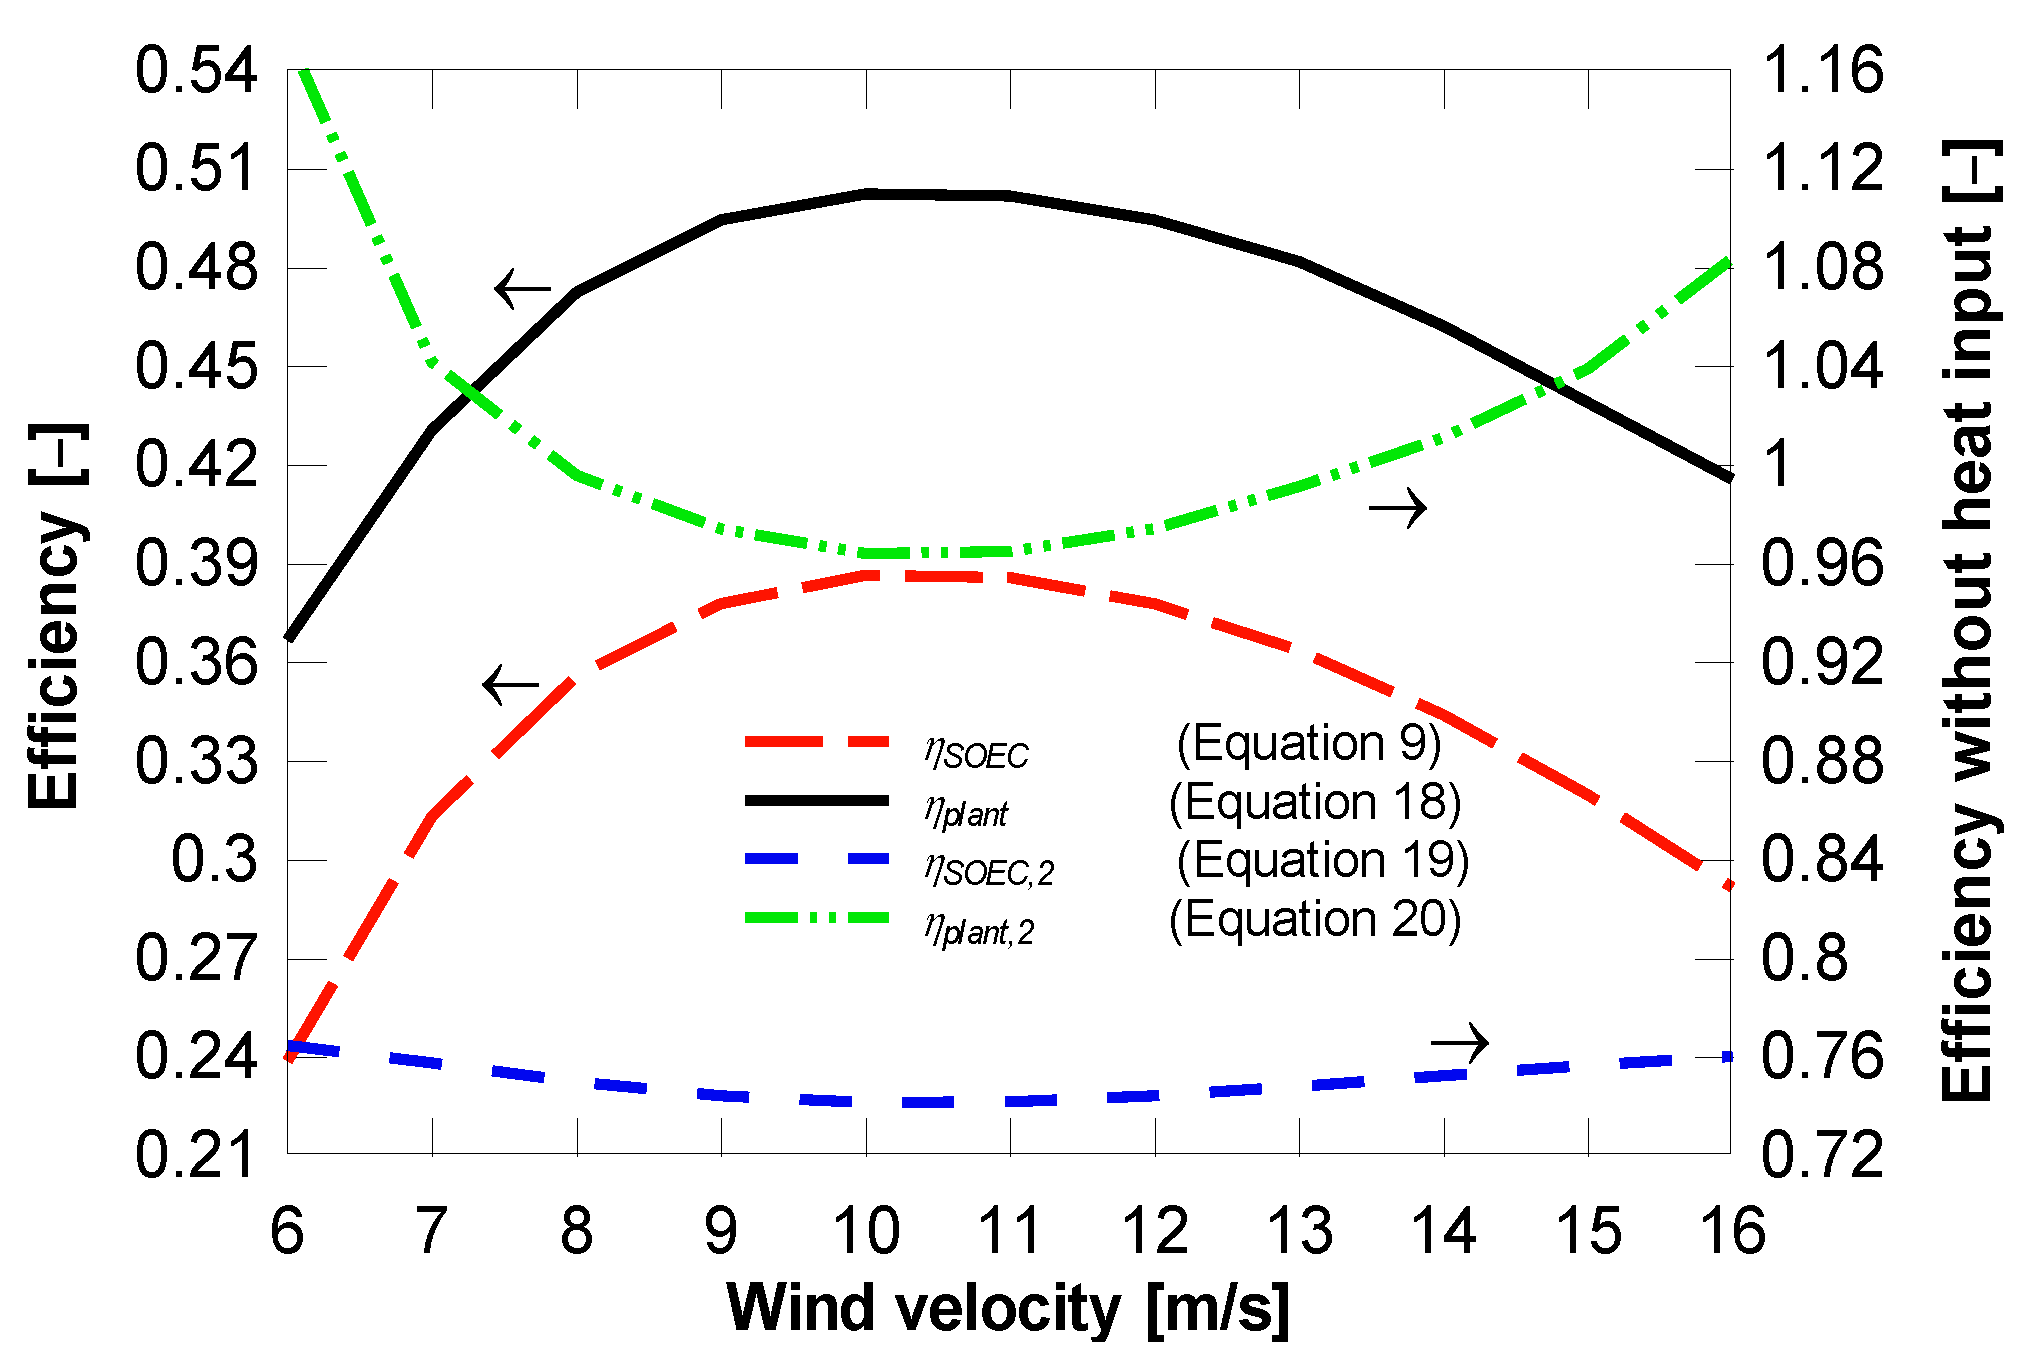
4.3. Plant with District Heating and Freshwater
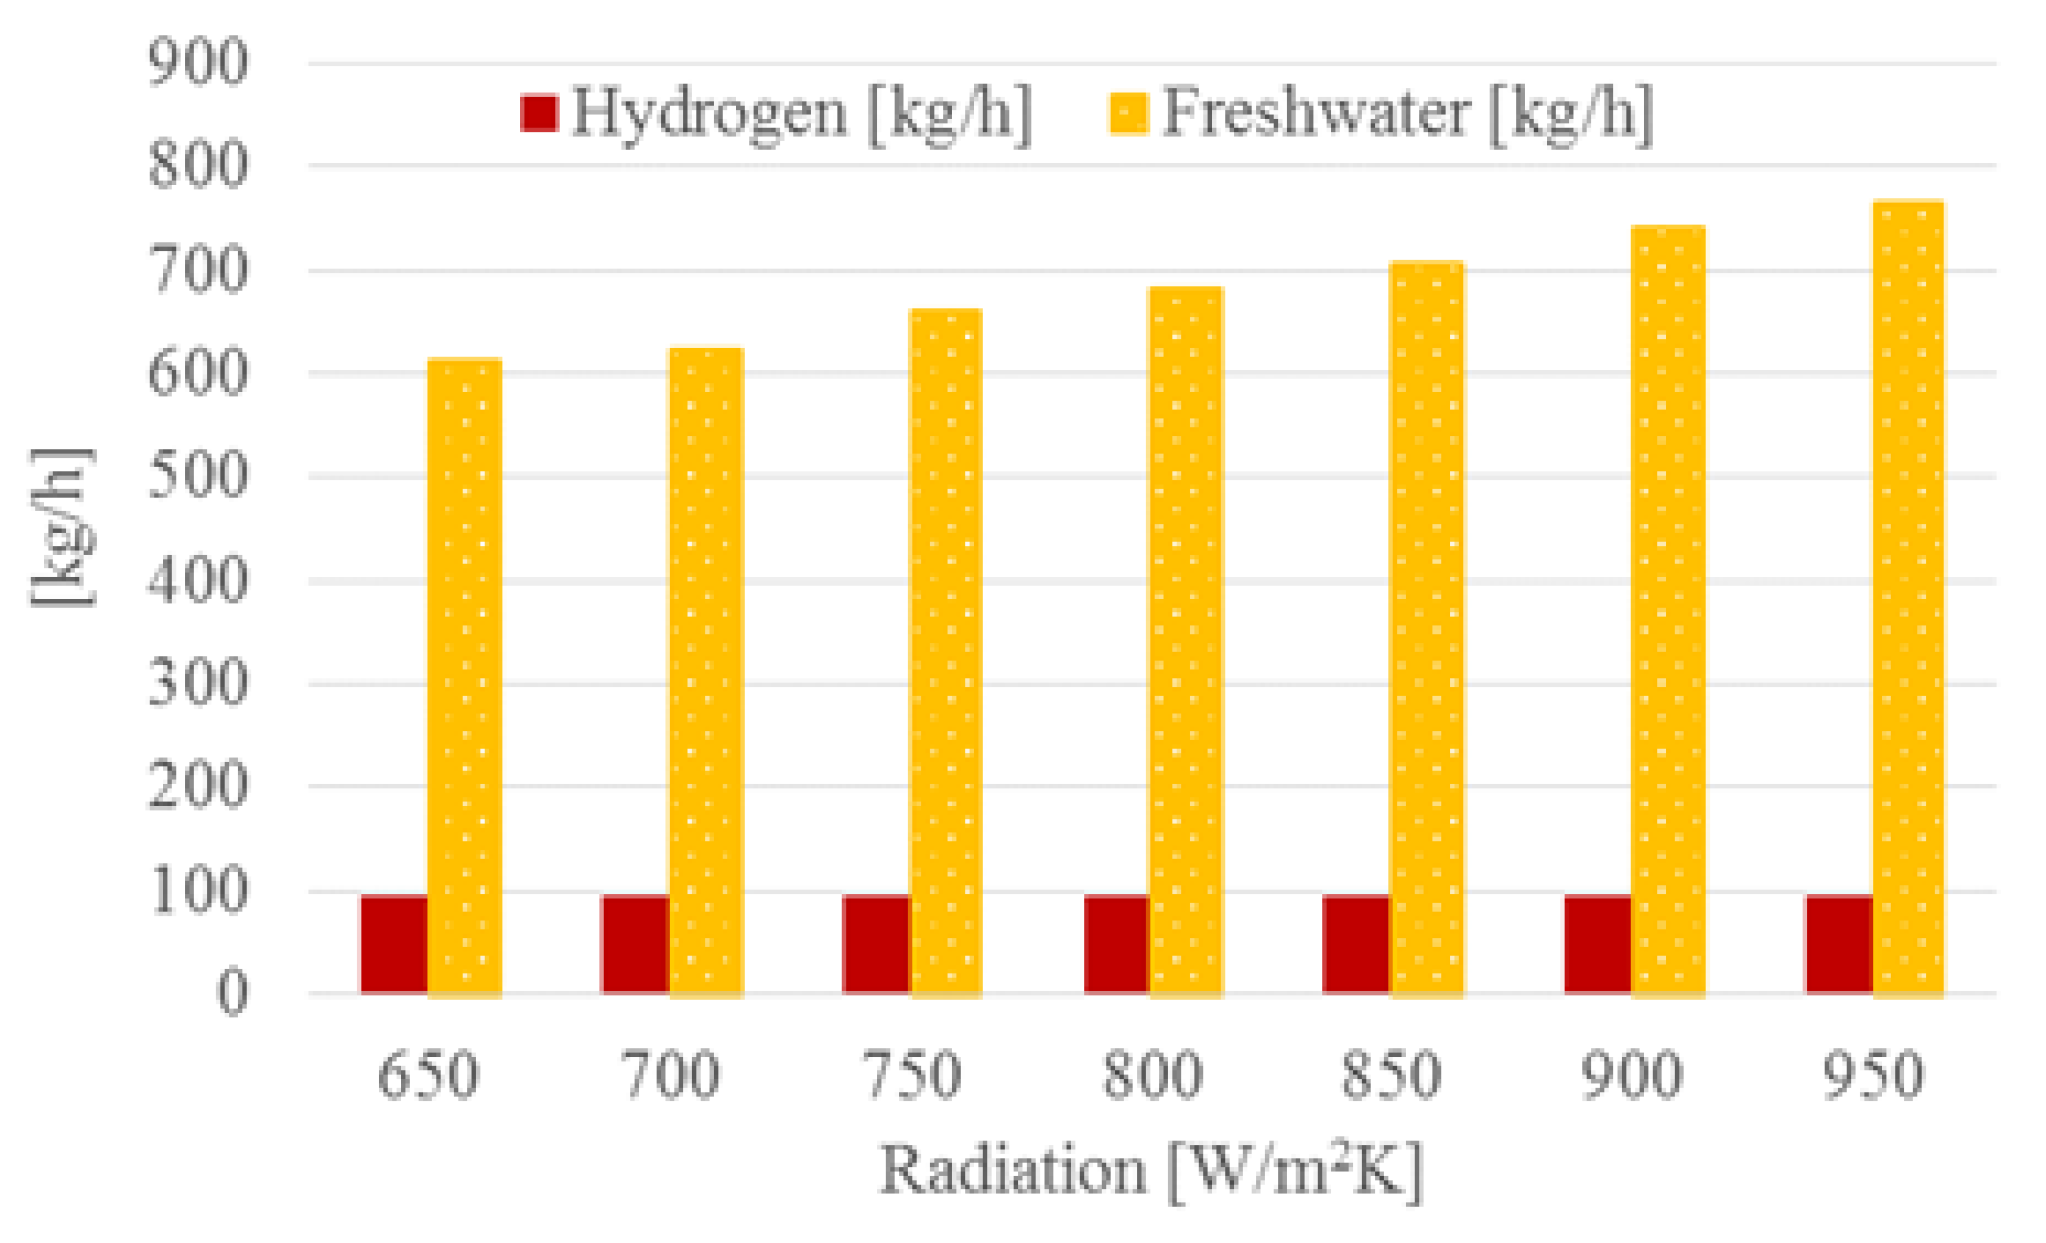
4.4. Effect of Solar Radiation
5. Conclusions
Conflicts of Interest
Nomenclature
| Symbol | Meaning (unit) |
| A | Area (m2) |
| Cp | Power coefficient (Equation (14)) |
| E | Voltage (V) |
| J | Current (A) |
| h | Enthalpy (J·kg−1) |
| Mass flow (kg·s−1) | |
| N | Number (–) |
| n | Angular velocity [rpm] |
| P | Power (W) |
| p | Pressure (N·m−2) |
| Q | Heat (J/s) |
| R | Rotor radius (m) |
| S | Swept area (m2) |
| T | Temperature (K) or (°C) |
| U | Heat transfer coefficient (W·m−2) |
| uw | Wind velocity (m·s−1) |
| W | Work (W) |
| w | Angular rotation (rad·s−1) |
| Greek letters | |
| Letter | Meaning (unit) |
| η | Efficiency (–) |
| λ | Tip speed ratio (rad) |
| Pitch angle (°) | |
| ρ | Density (kg·s−1) |
| Δ | Difference |
| Abbreviations | |
| Abbreviation | Meaning |
| DCMD | Direct contact membrane distillation |
| LHV | Lower heating value (J·kg−1) |
| RSOC | Reversible solid oxide cell |
| Subscripts | |
| Subscript | Meaning |
| amb | Ambient |
| act | Activation |
| cons | Concentration |
| ohm | Ohmic |
| prod | Production |
| rom | Mean at the outer surface |
| SOEC | Solid oxide electrolysis cell |
References
- Ni, M.; Leung, M.K.; Leung, D.Y. Technological development of hydrogen production by solid oxide electrolyzer cell (SOEC). Int. J. Hydrogen Energy 2008, 33, 2337–2354. [Google Scholar] [CrossRef]
- Zhang, X.; O’Brien, J.E.; O’Brien, R.C.; Housley, G.K. Durability evaluation of reversible solid oxide cells. J. Power Sources 2013, 242, 566–574. [Google Scholar] [CrossRef]
- Abuadala, A.; Dincer, I. Exergoeconomic analysis of a hybrid system based on steam biomass gasification products for hydrogen production. Int. J. Hydrogen Energy 2011, 36, 12780–12793. [Google Scholar] [CrossRef]
- Jensen, S.H.; Sun, X.; Ebbesen, S.D.; Knibbe, R.; Mogensen, M. Hydrogen and synthetic fuel production using pressurized solid oxide electrolysis cells. Int. J. Hydrogen Energy 2010, 35, 9544–9549. [Google Scholar] [CrossRef]
- Viviani, M.; Canu, G.; Carpanese, M.P.; Barbucci, A.; Sanson, A.; Mercadelli, E.; Nicolella, C.; Vladikova, D.; Stoynov, Z.; Chesnaud, A.; et al. Dual cells with mixed protonic-anionic conductivity for reversible SOFC/SOEC operation. Energy Procedia 2012, 2, 182–189. [Google Scholar] [CrossRef]
- Dillig, M.; Leimert, J.; Karl, J. Planar High Temperature Heat Pipes for SOFC/SOEC Stack Applications. Fuel Cells 2014, 14, 479–488. [Google Scholar] [CrossRef]
- Koytsoumpa, E.I.; Bergins, C.; Buddenberg, T.; Wu, S. The Challenge of Energy Storage in Europe: Focus on Power to Fuel. ASME Energy Resour. Technol. 2016, 138, 042002. [Google Scholar] [CrossRef]
- Chen, Z.; Zhang, Y.; Ji, T.; Li, C.; Xu, Z.; Cai, Z. Economic dispatch model for wind power integrated system considering the dispatchability of power to gas. IET Gener. Transm. Distrib. 2019, 13, 1535–1544. [Google Scholar] [CrossRef]
- Peters, R.; Baltruweit, M.; Grube, T.; Samsun, R.C.; Stolten, D. A techno economic analysis of the power to gas route. J. CO2 Util. 2019, 4, 616–634. [Google Scholar] [CrossRef]
- Schemme, S.; Samsun, R.C.; Peters, R.; Stolten, D. Power-to-fuel as a key to sustainable transport systems—An analysis of diesel fuels produced from CO2 and renewable electricity. Fuel 2017, 205, 198–221. [Google Scholar] [CrossRef]
- Mazza, A.; Bompard, E.; Chicco, G. Applications of power to gas technologies in emerging electrical systems. Renew. Sustain. Energy Rev. 2018, 92, 794–806. [Google Scholar] [CrossRef]
- Kouchachvili, L.; Entchey, E. Power to gas and H2/NG blend in SMART energy networks concept. Renew. Energy 2018, 122, 456–464. [Google Scholar] [CrossRef]
- Vo, T.T.; Xia, A.; Wall, D.M.; Murphy, J.D. Use of surplus wind electricity in Ireland to produce compressed renewable gaseous transport fuel through biological power to gas systems. Renew. Energy 2017, 105, 495–504. [Google Scholar] [CrossRef]
- Liu, W.; Wang, D.; Yu, X.; Jia, H.; Wang, W.; Yang, X.; Zhi, Y. Optimal of multi-source microgrid considering power to gas technology and wind power uncertainty. Energy Procedia 2017, 143, 668–673. [Google Scholar] [CrossRef]
- Collet, P.; Flottes, E.; Favre, A.; Raynal, L.; Pierre, H.; Capela, S.; Peregrina, C. Techno-economic and Life Cycle Assessment of methane production via biogas upgrading and power to gas technology. Appl. Energy 2017, 192, 282–295. [Google Scholar] [CrossRef]
- Koytsoumpa, E.I.; Karellas, S.; Kakaras, E. Modelling of Substitute Natural Gas production via combined gasification and power to fuel. Renew. Energy 2019, 135, 1354–1370. [Google Scholar] [CrossRef]
- Burgoyne, A.; Vahdati, M.M. Direct Contact Membrane Distillation. Desalin. Water Treat. 2000, 35, 1257–1284. [Google Scholar] [CrossRef]
- Shirazi, M.M.A.; Kargari, A.; Shirazi, M.J.A. Direct contact membrane distillation for seawater desalination. Sep. Sci. Technol. 2012, 49, 368–375. [Google Scholar] [CrossRef]
- Suárez, F.; Ruskowitz, J.A.; Tyler, S.W.; Childress, A.E. Renewable water: Direct contact membrane distillation coupled with solar ponds. Appl. Energy 2015, 158, 532–539. [Google Scholar] [CrossRef]
- Nakoa, K.; Date, A.; Akbarzadeh, A. DCMD modelling and experimental study using PTFE membrane. Desalin. Water Treat. 2016, 57, 3835–3845. [Google Scholar] [CrossRef]
- Cath, T.Y.; Adams, V.D.; Childress, A.E. Experimental study of desalination using direct contact membrane distillation: A new approach to flux enhancement. J. Membr. Sci. 2003, 228, 5–16. [Google Scholar] [CrossRef]
- Akikur, R.K.; Saidur, R.; Ping, H.W.; Ullah, K.R. Performance analysis of a co-generation system using solar energy and SOFC technology. Energy Convers. Manag. 2014, 79, 415–430. [Google Scholar] [CrossRef]
- Ni, M.; Leung, K.H.; Leung, D.Y.C. Energy and exergy analysis of hydrogen production by solid oxide steam electrolyzer plant. Int. J. Hydrogen Energy 2007, 32, 4648–4660. [Google Scholar] [CrossRef]
- Rokni, M. Thermodynamic analyses of municipal solid waste gasification plant integrated with solid oxide fuel cell and Stirling hybrid system. Int. J. Hydrogen Energy 2015, 40, 7855–7869. [Google Scholar] [CrossRef]
- Hernández-Pacheco, E.; Singh, D.; Nutton, P.N.; Patel, N.; Mann, M.D. A macro-level model for determining the performance characteristics of solid oxide fuel cells. J. Power Sources 2004, 138, 174–186. [Google Scholar] [CrossRef]
- Kim, Y.D.; Thu, K.; Ghaffour, N.; Ng, K.C. Performance investigation of a solar-assisted direct contact membrane. Membr. Sci. 2013, 427, 345–364. [Google Scholar] [CrossRef]
- Franchinia, G.; Notarbartolo, E.; Padovan, L.E.; Perdichizzi, A. Modeling, Design and Construction of a Micro-scale Absorption Chiller. Energy Procedia 2015, 82, 577–583. [Google Scholar] [CrossRef]
- de Vega, M.; Almendros-Ibanez, J.A.; Ruiz, G. Performance of a LiBr–water absorption chiller operating with plate heat exchangers. Energy Convers. Manag. 2006, 47, 3393–3407. [Google Scholar] [CrossRef]
- Porumb, R.; Porumb, B.; Balan, M. Numerical investigation on solar absorption chiller with LiBr-H2O operating conditions and performances. Energy Procedia 2017, 112, 108–117. [Google Scholar] [CrossRef]
- Misra, R.D.; Sahoo, P.K.; Gupta, A. Thermoeconomic Optimization of a LiBr/H2O Absorption Chiller Using Structural Method. Energy Resour. Technol. 2005, 127, 119–124. [Google Scholar] [CrossRef]
- Patek, J.; Klomfar, J. A computationally effective formulation of the thermodynamic properties of LiBr-H2O solutions from 273 to 500 K over full composition range. Int. J. Refrig. 2006, 29, 566–578. [Google Scholar] [CrossRef]
- Manyonge, A.W.; Ochieng, R.; Onyango, F.; Shichikha, J. Mathematical modelling of wind turbine in a wind energy conversion system: Power coefficient analysis. Appl. Math. Sci. 2012, 6, 4527–4536. [Google Scholar]
- Odeh, S.D.; Morrison, G.L.; Behnia, M. Modeling of parabolic trough direct steam generation solar collectors. Sol. Energy 1998, 62, 395–406. [Google Scholar] [CrossRef]
- Duffie, J.A.; Beckman, W.A. Solar Engineering of Thermal Processes, 4th ed.; John Wiley and Sons: Hoboken, NJ, USA, 2013; ISBN 978-1-118-41541-2 (ebk). [Google Scholar]
- Nellis, G.; Klein, S. Heat Transfer; Cambridge Press: Cambridge, UK, 2009; ISBN 978-0-521-88107-4. [Google Scholar]
- Gungor, K.E.; Winteron, R.H.S. A general correlation for flow boiling in tubes and annuli. Int. J. Heat Mass Transf. 1986, 29, 351–358. [Google Scholar] [CrossRef]


| Parameter | Value |
|---|---|
| Anode thickness | 600 μm (nickel and yttria stabilized zirconia cermet) |
| Cathode thickness | 50 μm (strontium-doped lanthanum manganite) |
| Electrolyte thickness | 10 μm (yttria stabilized zirconia) |
| Cell area | 144 cm2 (12 cm × 12 cm) |
| Operating temperature | 750 °C |
| Porosity | 30% |
| Tortuosity | 2.5 |
| Nr. of cells per stack | 70 |
| Number of stacks | 200 |
| Parameter | Value |
|---|---|
| Fibre length | 0.4 m |
| Inner diameter of fibre | 0.3 mm |
| Membrane thickness | 60 μm |
| Porosity | 75% |
| Membrane conductivity | 0.25 W/mK |
| Shell diameter | 0.003 m |
| Number of fibres | 3000 |
| Packing density | 60% |
| Inlet temperature | 80°C |
| Model Constants | |
| Ck | 15.18 × 10⁻⁴ |
| Cm | 5.1 × 10³ m−1 |
| Cp | 12.97 × 10⁻¹¹ m |
| Parameter | Value |
|---|---|
| Desorber gas outlet temperature | 90 °C |
| Rich solution | 0.593 |
| Week solution | 0.548 |
| Condenser outlet temperature | 32 °C |
| Rich solution pressure after valve | 0.008 bar |
| Absorber cooling inlet temperature | 15 °C |
| Solution pump pressure | 0.05 bar |
| Cooling deliver temperature | 4 °C |
| Cooling return temperature | 11 °C |
| Cooling flow pressure | 16 bar |
| Parameter | Value |
|---|---|
| Blade radius | 30 m |
| Hub height | 100 m |
| Rotational speed | 15 rpm |
| Angle of attack | 10° |
| Conversion efficiency | 0.85 |
| Number of wind turbines | 13 |
| Wind speed (default) | 10 m/s |
| PTSC | Value |
|---|---|
| Length | 250 m |
| Number of rows | 10 |
| Receiver | |
| Diameters (Dri, Dro) | 33, 38 mm |
| Material | Stainless steel |
| Conductivity (kr) | 60 W/mK |
| Coating | Black Niquel |
| Emissivity (εr) | 0.06 |
| Absorptivity (α ) | 0.94 |
| Cover | |
| Diameters (Dci, Dco) | 84, 90 mm |
| Material | Glass |
| Conductivity (kc) | 0.035 W/mK |
| Emissivity (εc) | 0.84 |
| Transmissivity (τ ) | 0.94 |
| Air pressure in the gap (pm) | 0.5 mbar |
| Concentrator | |
| Reflectivity () | 0.93 |
| Intercept factor (γ ) | 0.93 |
| Aperture | 2.5 m |
| Incidence angle modifier (β ) | 1 |
| Manifold losses | 20% of the heat to ambient |
| Other Information | |
| Ambient temperature (Tamb) | 28 °C |
| Sky temperature (Tsky) | 20 °C |
| Wind velocity (Vwind) | 5 m/s |
| Saturation temperature (Tsat) | 80 °C (253 K) |
© 2019 by the author. Licensee MDPI, Basel, Switzerland. This article is an open access article distributed under the terms and conditions of the Creative Commons Attribution (CC BY) license (http://creativecommons.org/licenses/by/4.0/).
Share and Cite
Rokni, M.M. Power to Hydrogen Through Polygeneration Systems Based on Solid Oxide Cell Systems. Energies 2019, 12, 4793. https://doi.org/10.3390/en12244793
Rokni MM. Power to Hydrogen Through Polygeneration Systems Based on Solid Oxide Cell Systems. Energies. 2019; 12(24):4793. https://doi.org/10.3390/en12244793
Chicago/Turabian StyleRokni, Marvin M. 2019. "Power to Hydrogen Through Polygeneration Systems Based on Solid Oxide Cell Systems" Energies 12, no. 24: 4793. https://doi.org/10.3390/en12244793
APA StyleRokni, M. M. (2019). Power to Hydrogen Through Polygeneration Systems Based on Solid Oxide Cell Systems. Energies, 12(24), 4793. https://doi.org/10.3390/en12244793