


Abstract
In power systems with a high proportion of renewable power sources (PSHPRPSs), the power constraints of the tie-line may limit the ability of the reserve power to accommodate uncertain power generation, resulting in difficulties for the grid power balance. As uncertain power generation cannot be predicted accurately and in accordance with the law of probability and statistics, it is necessary to use a probability model to calculate the uncertain power of the tie-line. Here, day-ahead prediction error probability optimal power flow (DPEPOPF) is proposed to calculate the tie-line reserve power probability margin (TRPPM) in day-ahead dispatching. In day-ahead dispatching, TRPPM is reserved for real-time dispatching to accommodate uncertain power generation, so as to avoid tie-line power congestion. This study classifies the area of the grid based on the principle of area control error accommodation, and the DPEPOPF is divided into two categories: An inter-area day-ahead prediction error probability optimal power flow mathematical model, and an intra-area day-ahead prediction error probability optimal power flow mathematical model. The point estimate optimization algorithm was implemented in MATLAB 8.3.0.532 (R2014a) to calculate the TRPPM. The simulation results verify the accuracy of the model and effectively avoid power congestion of the tie-line.
1. Introduction
Renewable power sources such as wind and solar power have uncertainties characterized based on randomness and intermittence. Grids with a high proportion of uncertain power sources are power systems with a high proportion of renewable power sources (PSHPRPSs). PSHPRPSs have a large degree of uncertain power generation. In order to maintain grid power balance, the PSHPRPSs must have a dispatch control system (DCS) with power accommodation capability to accommodate uncertain power generation. Conventional power grids do not have any uncertain power sources, so the day-ahead prediction of load power is relatively accurate. Therefore, the power prediction error is within the regulation range of the automatic generation control (AGC); accordingly, there is no requirement for other power balance links. In contrast, because of the large proportion of uncertain power sources, the error in day-ahead power prediction for PSHPRPSs is large, and the AGC cannot balance the uncertain power unless a real-time scaled power balance link is added. For the grid DCS, some studies have suggested three time scale options (short-term dispatching, real-time dispatching, and AGC [1]), while others propose four time scale options (day-ahead dispatching, rolling power dispatching, real-time dispatching, and AGC [2]). Research on the DCS of PSHPRPSs has mainly focused on increasing the power balance link over a short time scale, and on modifying the generation plan step-by-step to accommodate uncertain power generation [3,4,5,6,7,8]. Considering that the presence of too many short time scale power balancing links will affect the efficiency of the grid DCS, this study has adopted a three time scale DCS with day-ahead dispatching, real-time dispatching, and AGC.
In the DCS of PSHPRPSs, the accommodation of uncertain power generation is based on power forecasting. The day-ahead dispatching plan is formulated according to the day-ahead power forecast. According to the uncertain power source power prediction error between the real-time and day-ahead predictions (i.e., the uncertain power generation), a real-time power generation plan is formulated to ensure that the power error after real-time accommodation is within the AGC accommodation range. To effectively accommodate uncertain power generation in real-time dispatching, the day-ahead dispatching needs to reserve sufficient reserve power for real-time dispatching, including controllable power sources [9,10,11,12,13], energy storage technology [14,15,16], and active load [17,18,19,20]. Uncertain power generation cannot be accurately predicted with current technology, whether or not the physical prediction method [21,22,23], statistical prediction method [24,25,26,27], or comprehensive prediction method [28,29,30] is used. Therefore, the reserved power capacity is uncertain.
To accommodate the power prediction error of renewable energy sources, some works have conducted uncertainty analysis research. Considering a small hydropower source with no reservoir, a day-ahead dispatching model was proposed in reference [31] for a distributed power grid system which contains several distributed generators, such as small hydropower and wind power sources, and energy storage systems. In the presence of renewable energy sources and storage devices, Papari et al. proposed a stochastic framework for the optimal operation and management of hybrid alternating current (AC)–direct current (DC) microgrids [32]. A multi-time scale robust economic dispatch strategy with a multi-source hybrid power system based on variable confidence levels was proposed to reduce the impact of the renewable energy power prediction uncertainty [33]. Additionally, Papari et al. also developed a new two-stage approach for accurate modeling and prediction of tidal current to utilize renewable energy sources with unreliable and intermittent characteristics [34]. Each of the above works has provided good progress towards accommodating the power prediction error of renewable energy sources. However, these literatures do not study this problem from the perspective of power grid DCS, which requires reserve power to accommodate the power prediction error of renewable energy sources. To avoid tie-line power congestion affecting the utilization of reserve power, it is necessary to reserve a tie-line power margin for reserve power in the day-ahead dispatching of PSHPRPSs. Therefore, in comparison with the existing literature, the main contributions of this work can be summarized as follows: (1) The tie-line reserve power probability margin (TRPPM) is set aside for reserve power in the day-ahead dispatching to avoid power congestion in real-time dispatching. (2) The power prediction error of renewable energy sources is accommodated from the perspective of grid DCS. (3) The day-ahead prediction error probability optimal power flow (DPEPOPF) can simplify the probabilistic optimal power flow model and improve its efficiency.
The day-ahead predicted errors of uncertain power generation conform to the laws of probability and statistics [35,36,37], and the tie-line reserve power margin for balancing day-ahead predicted errors conforms to probability and statistics laws. Therefore, the probability model is adopted in this study. Sensitivity is used to estimate the effect of parameter changes on the transfer capacity. This procedure is linearly approximate and quick [38]. Due to the large error of power forecasting, the day-ahead dispatching plan cannot be accurate, and the power prediction error is accommodated by real-time dispatching and AGC. On this basis, we developed a mathematical model of DPEPOPF, which solves the numerical characteristics of the TRPPM in day-ahead dispatching. Based on this, the tie-line reserve power probability margin can be determined, which lays a foundation for real-time dispatching to effectively accommodate uncertain power.
The remainder of this paper is structured as follows. Section 2 presents the divided power grid according to the property of the power source. Section 3 presents the DPEPOPF mathematical model and its solution. Section 4 presents the simulation results for the DPEPOPF, as applied to the Institute of Electrical and Electronics Engineers (IEEE) 118 bus test system to calculate the TRPPM in the day-ahead dispatching. Finally, the conclusions of this work are presented in Section 5.
2. Grid Area Division Based on Power Source Properties
To reduce or avoid the impact of the power generation uncertainty on other grid areas, the uncertain power generation needs to be accommodated in a way that complies with the principle of area control error accommodation. The power generated from large uncertain power sources such as large wind and photovoltaic power stations needs to be transported via a tie-line to other grid areas where the load is concentrated. For large uncertain power sources that cannot be accommodated nearby, it is necessary to use the reserve power of other grid areas for accommodation. Based on the principle of area control error accommodation, the whole power system needs to be divided into several power grid areas.
2.1. Types of Grid Area Division Based on Power Source Properties
There are many methods for dividing the power grid area. According to the property of the power source in the grid areas, this study divides them into three types: A type I grid not only contains an uncertain power sources, but also has accommodation capacity. A type II grid is a power system with only uncertain power sources. A type III grid is a power system without an uncertain power sources, but which has the ability to accommodate uncertain power generation. In addition, other factors such as the uncertain power source correlation and geographical distance should also be considered when dividing a power grid area. After division, uncertain power sources in the same power grid area have greater correlations, while uncertain power sources in different power grid areas have lesser correlations.
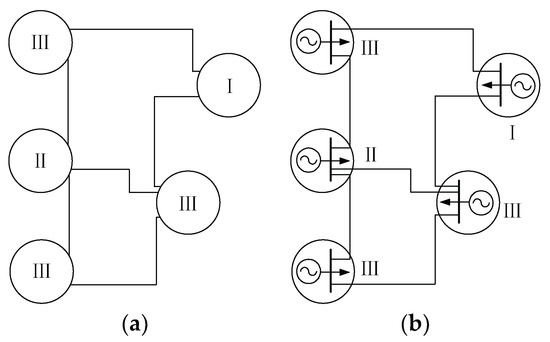
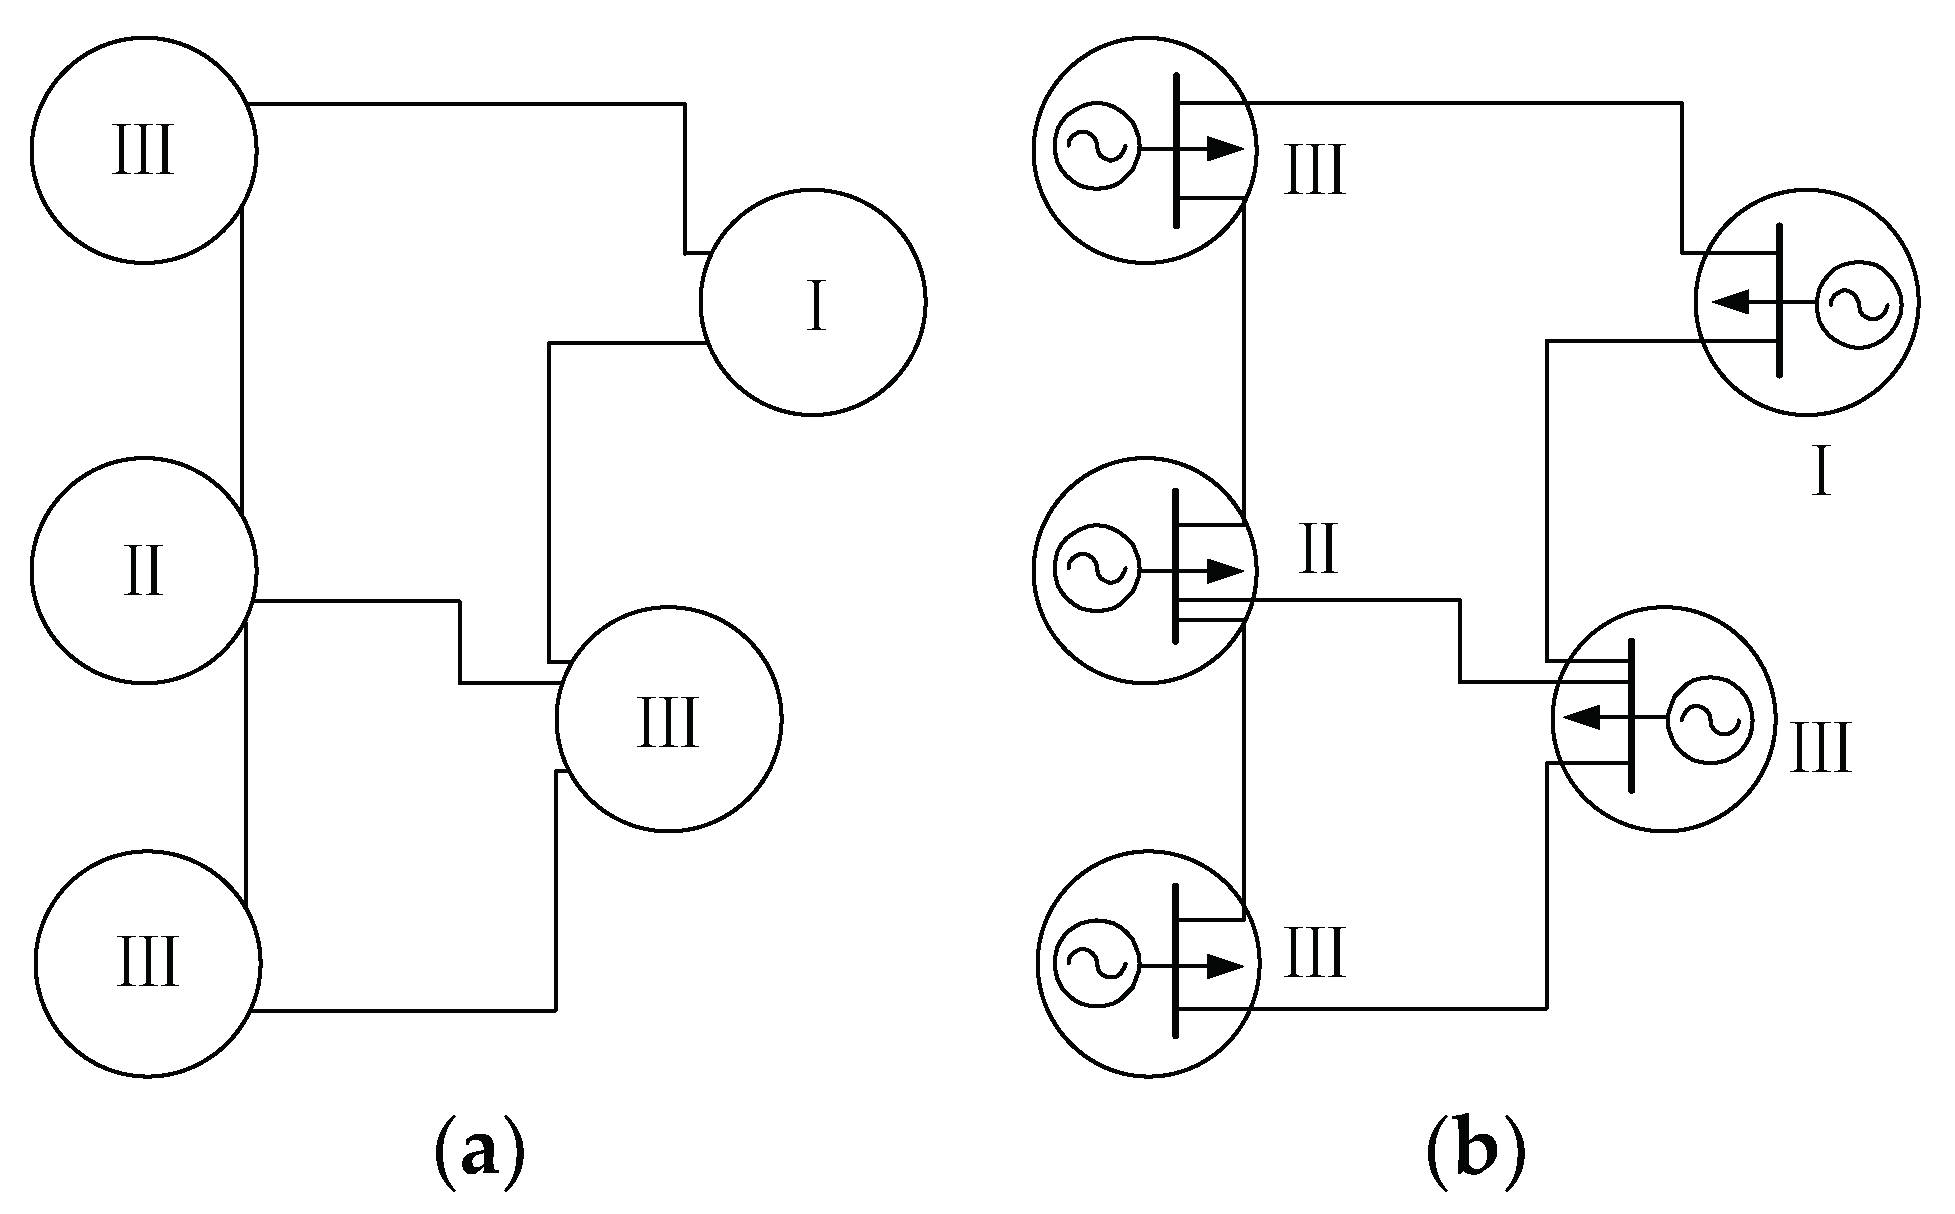
According to the property of power supply, a power grid can be divided into power grid areas of types I, II, and III. For example, the power system shown in Figure 1a consists of five grids: One type I, one type II, and three type III grids. Each power grid area is equivalent to a power source and a load. The equivalent diagram of the power grid area is shown in Figure 1b.
Figure 1.
Schematic diagram of the power grid area division process. (a) Power grid area schematic diagram; (b) equivalent grid area schematic diagram.
2.2. Equivalent Parameters of Power Grid Area
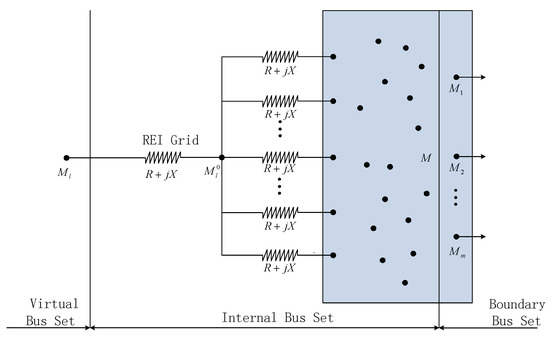
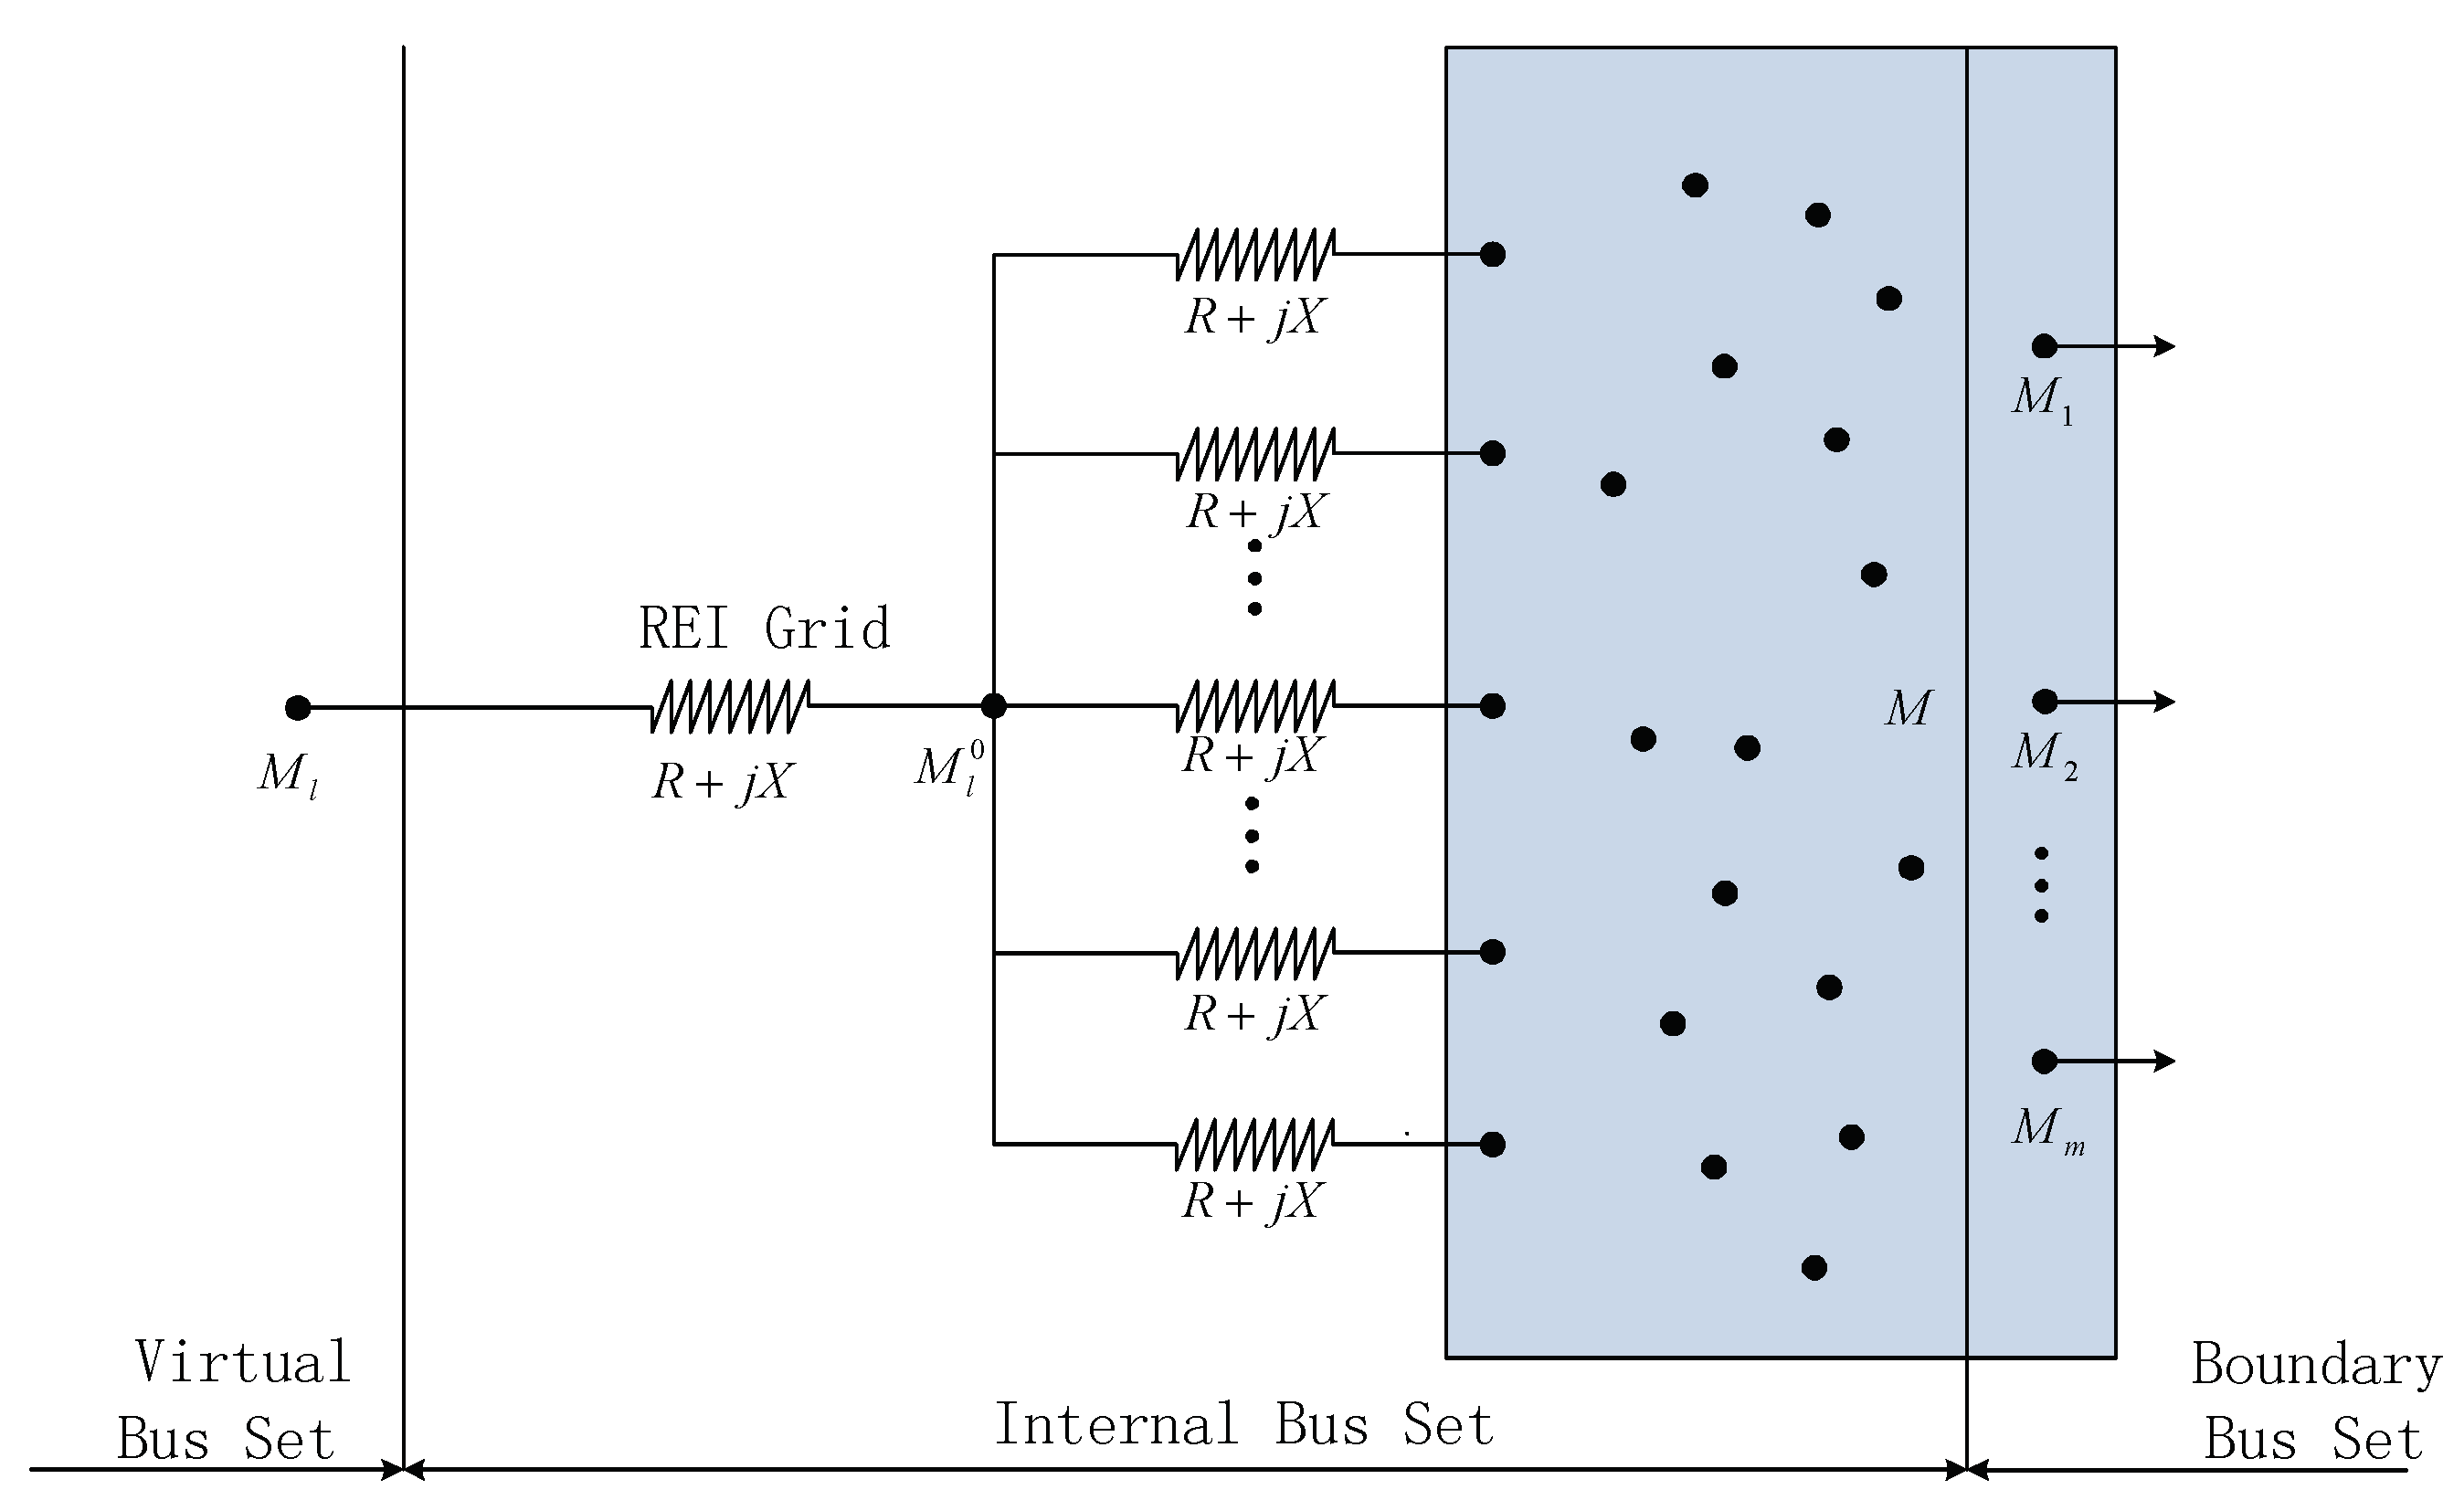
Equivalent parameters of a power grid area can be divided into internal equivalence parameters and tie-line equivalence parameters. The equivalent power grid with buses is shown in Figure 2 [39]. According to the principle of radial equivalent independent (REI) equivalence, the grid area containing buses is equivalent to a single equivalent bus .
Figure 2.
Diagram of an equivalent power grid.
For the grid area with power sources, the total active power of the grid is equivalent to the active power of equivalent bus . The active power of the equivalent bus is defined by Equation (1):
where is the active power of each power source.
For the grid area with loads, the total load of the grid is equivalent to the load power of equivalent bus . The load power of the equivalent bus is defined by Equation (2):
where is the power of each load.
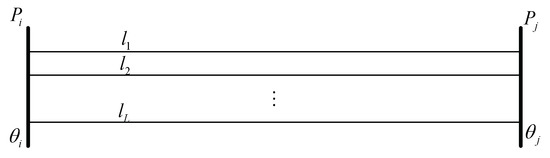
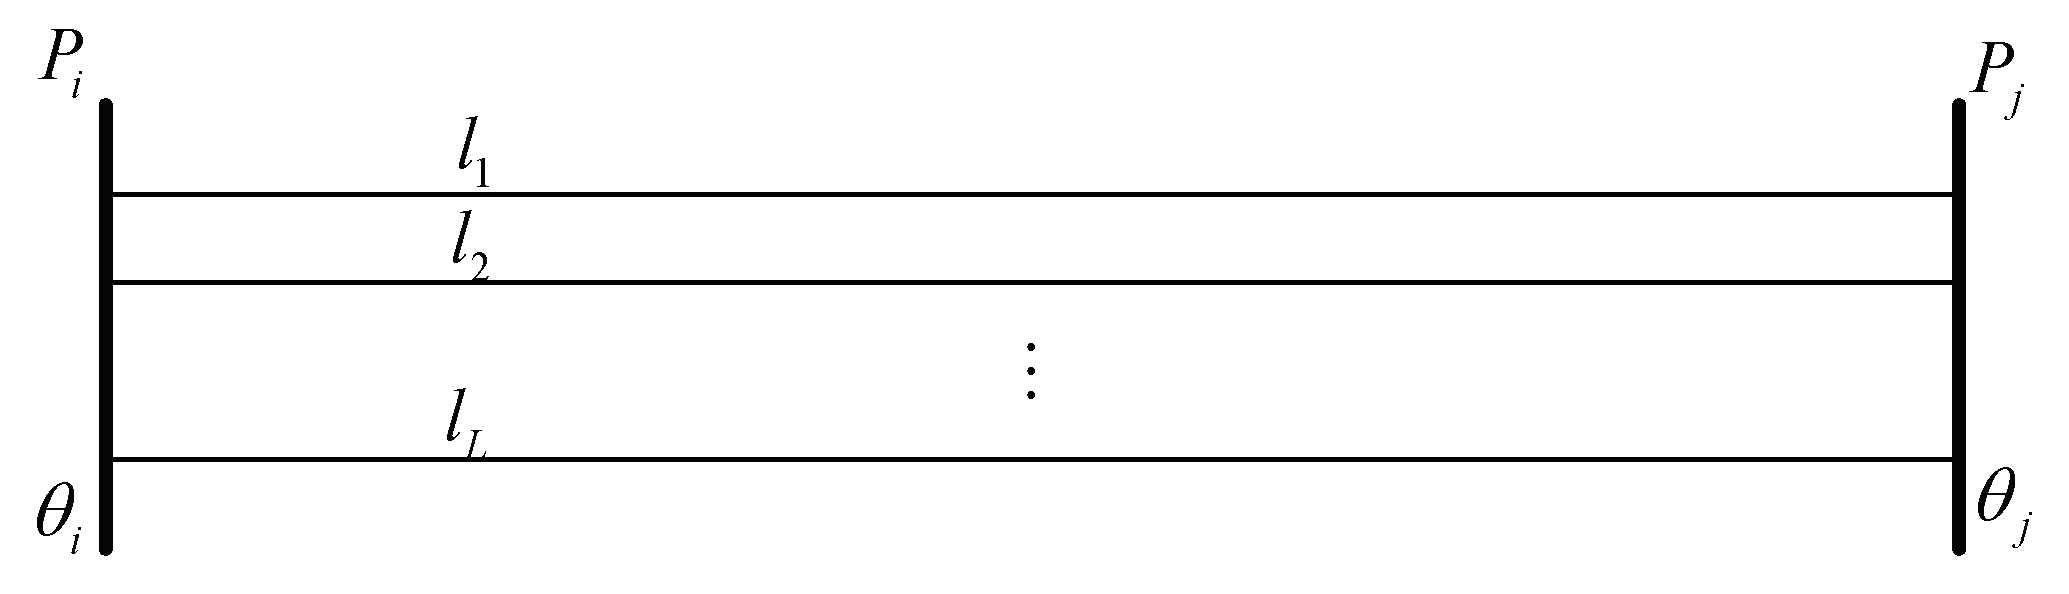
Generally, there are several tie-lines between the two power grid areas, as shown in Figure 3.
Figure 3.
Inter-area tie-lines between two grids in the power grid area.
After the power grid area is equivalent to an equivalent bus. As shown in Figure 3, there are tie-lines between the two equivalent buses; the reactance of the th tie-line is . The equivalent active powers of the two equivalent buses are and ; the equivalent phase angles of two equivalent buses are and .
According to the DC power flow model, the active power of th tie-line is defined by Equation (3):
The tie-line power between two equivalent buses is the sum of each tie-line power. The total active power of the tie-line between the two equivalent buses is defined by Equation (4):
where is the total power of tie-line; is the power of th tie-line.
According to Equations (3) and (4), the total reactance between the two equivalent buses can be calculated. Therefore, the equivalent parameter of the tie-line between two equivalent buses is defined by Equation (5):
3. Prediction Error Probability Optimal Power Flow for Day-Ahead Dispatching
The day-ahead dispatching power consists of the day-ahead power prediction value and power prediction error. According to the power predicted value of the day-ahead dispatching, the day-ahead power generation plan is formulated. According to historical statistical data for power prediction error, the reserve power is set. To avoid tie-line power congestion, the day-ahead dispatching needs to reserve the TRPPM for the reserve power. Previous research has shown that uncertain power generation obeys probability distributions [40,41,42], and many studies assume that the day-ahead power prediction error of uncertain power source obeys the normal distribution [43,44,45]. Given this context, this section proposes the DPEPOPF and its optimization algorithm to solve the TRPPM.
3.1. DPEPOPF Based on Grid Area Division
Uncertain power generation affects the amplitude and frequency of voltage. To avoid a larger area being affected by the uncertain power generation, the uncertain power generation should be accommodated for in the area control. Therefore, this study divides the power grid and accommodates the uncertain power generation in its own power grid area based on the principle of area control error accommodation to avoid affecting other power grid areas. Based on the power grid division, this study divides the tie-lines into inter-area tie-lines and intra-area tie-lines. In China, renewable energy sources and main loads are generally distributed in different power grid areas. Therefore, the tie-lines between renewable energy sources and main loads are important objects of our research. For this reason, we need to study the reserve power margin of the inter-area tie-line. On this basis, the DPEPOPF is divided into two models: An inter-area DPEPOPF mathematical model, and an intra-area DPEPOPF mathematical model. The TRPPM can be divided into the inter-area TRPPM and intra-area TRPPM. In this study, the inter-area DPEPOPF and intra-area DPEPOPF methods are used to calculate the inter-area TRPPM and the intra-area TRPPM, respectively.
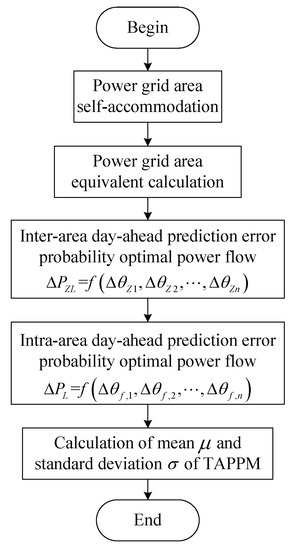
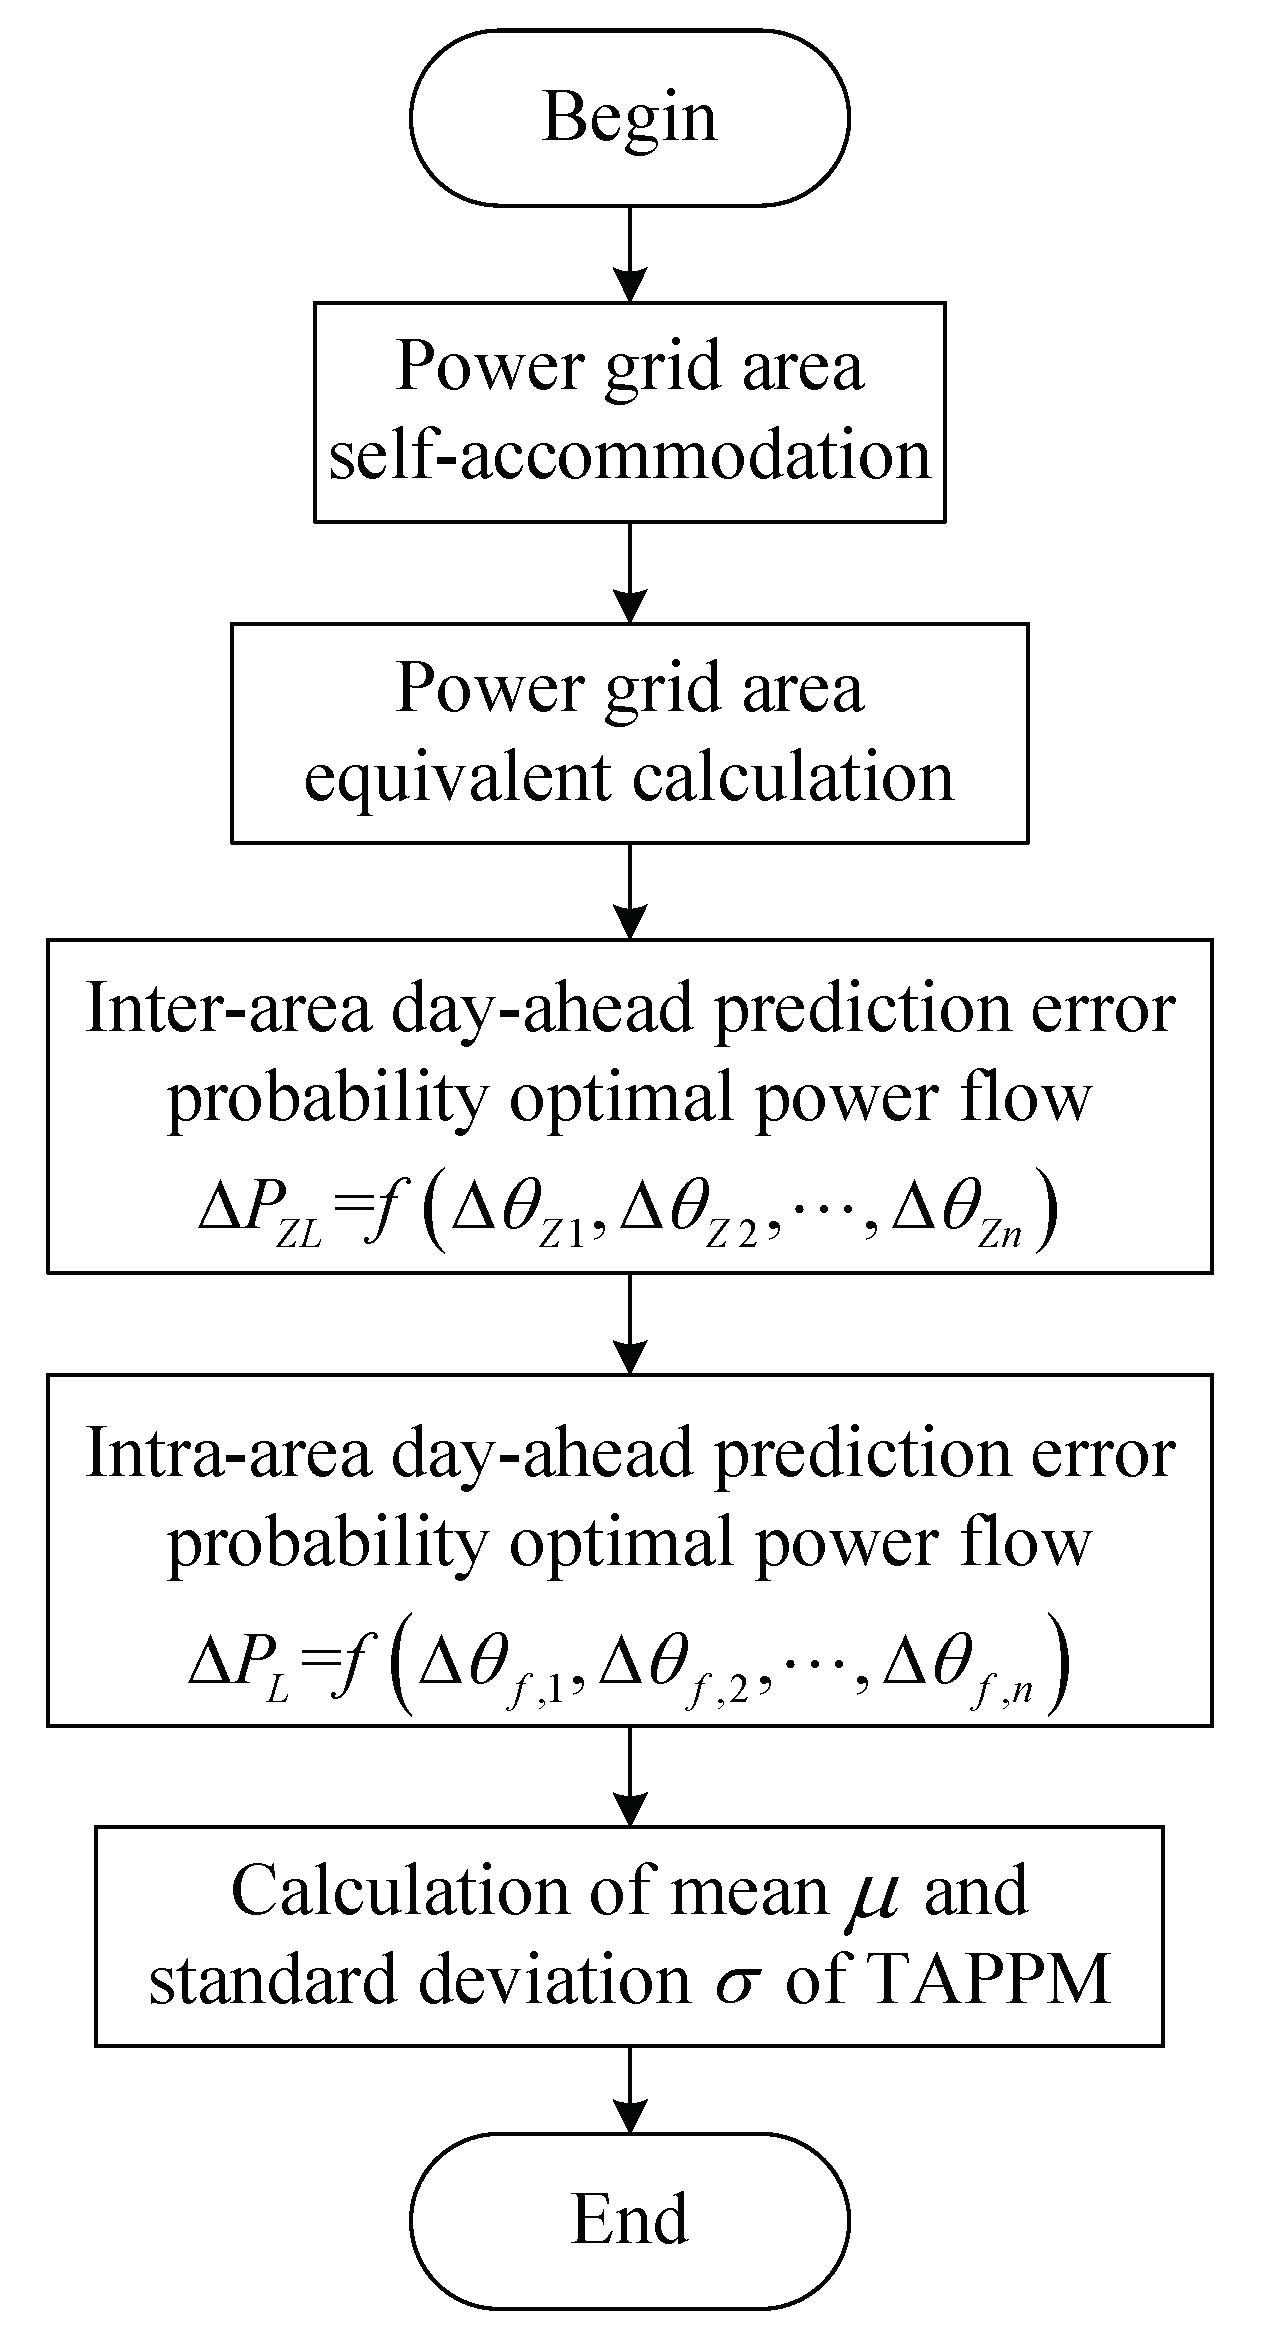
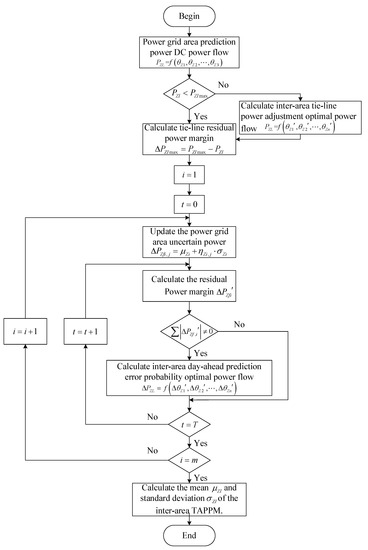
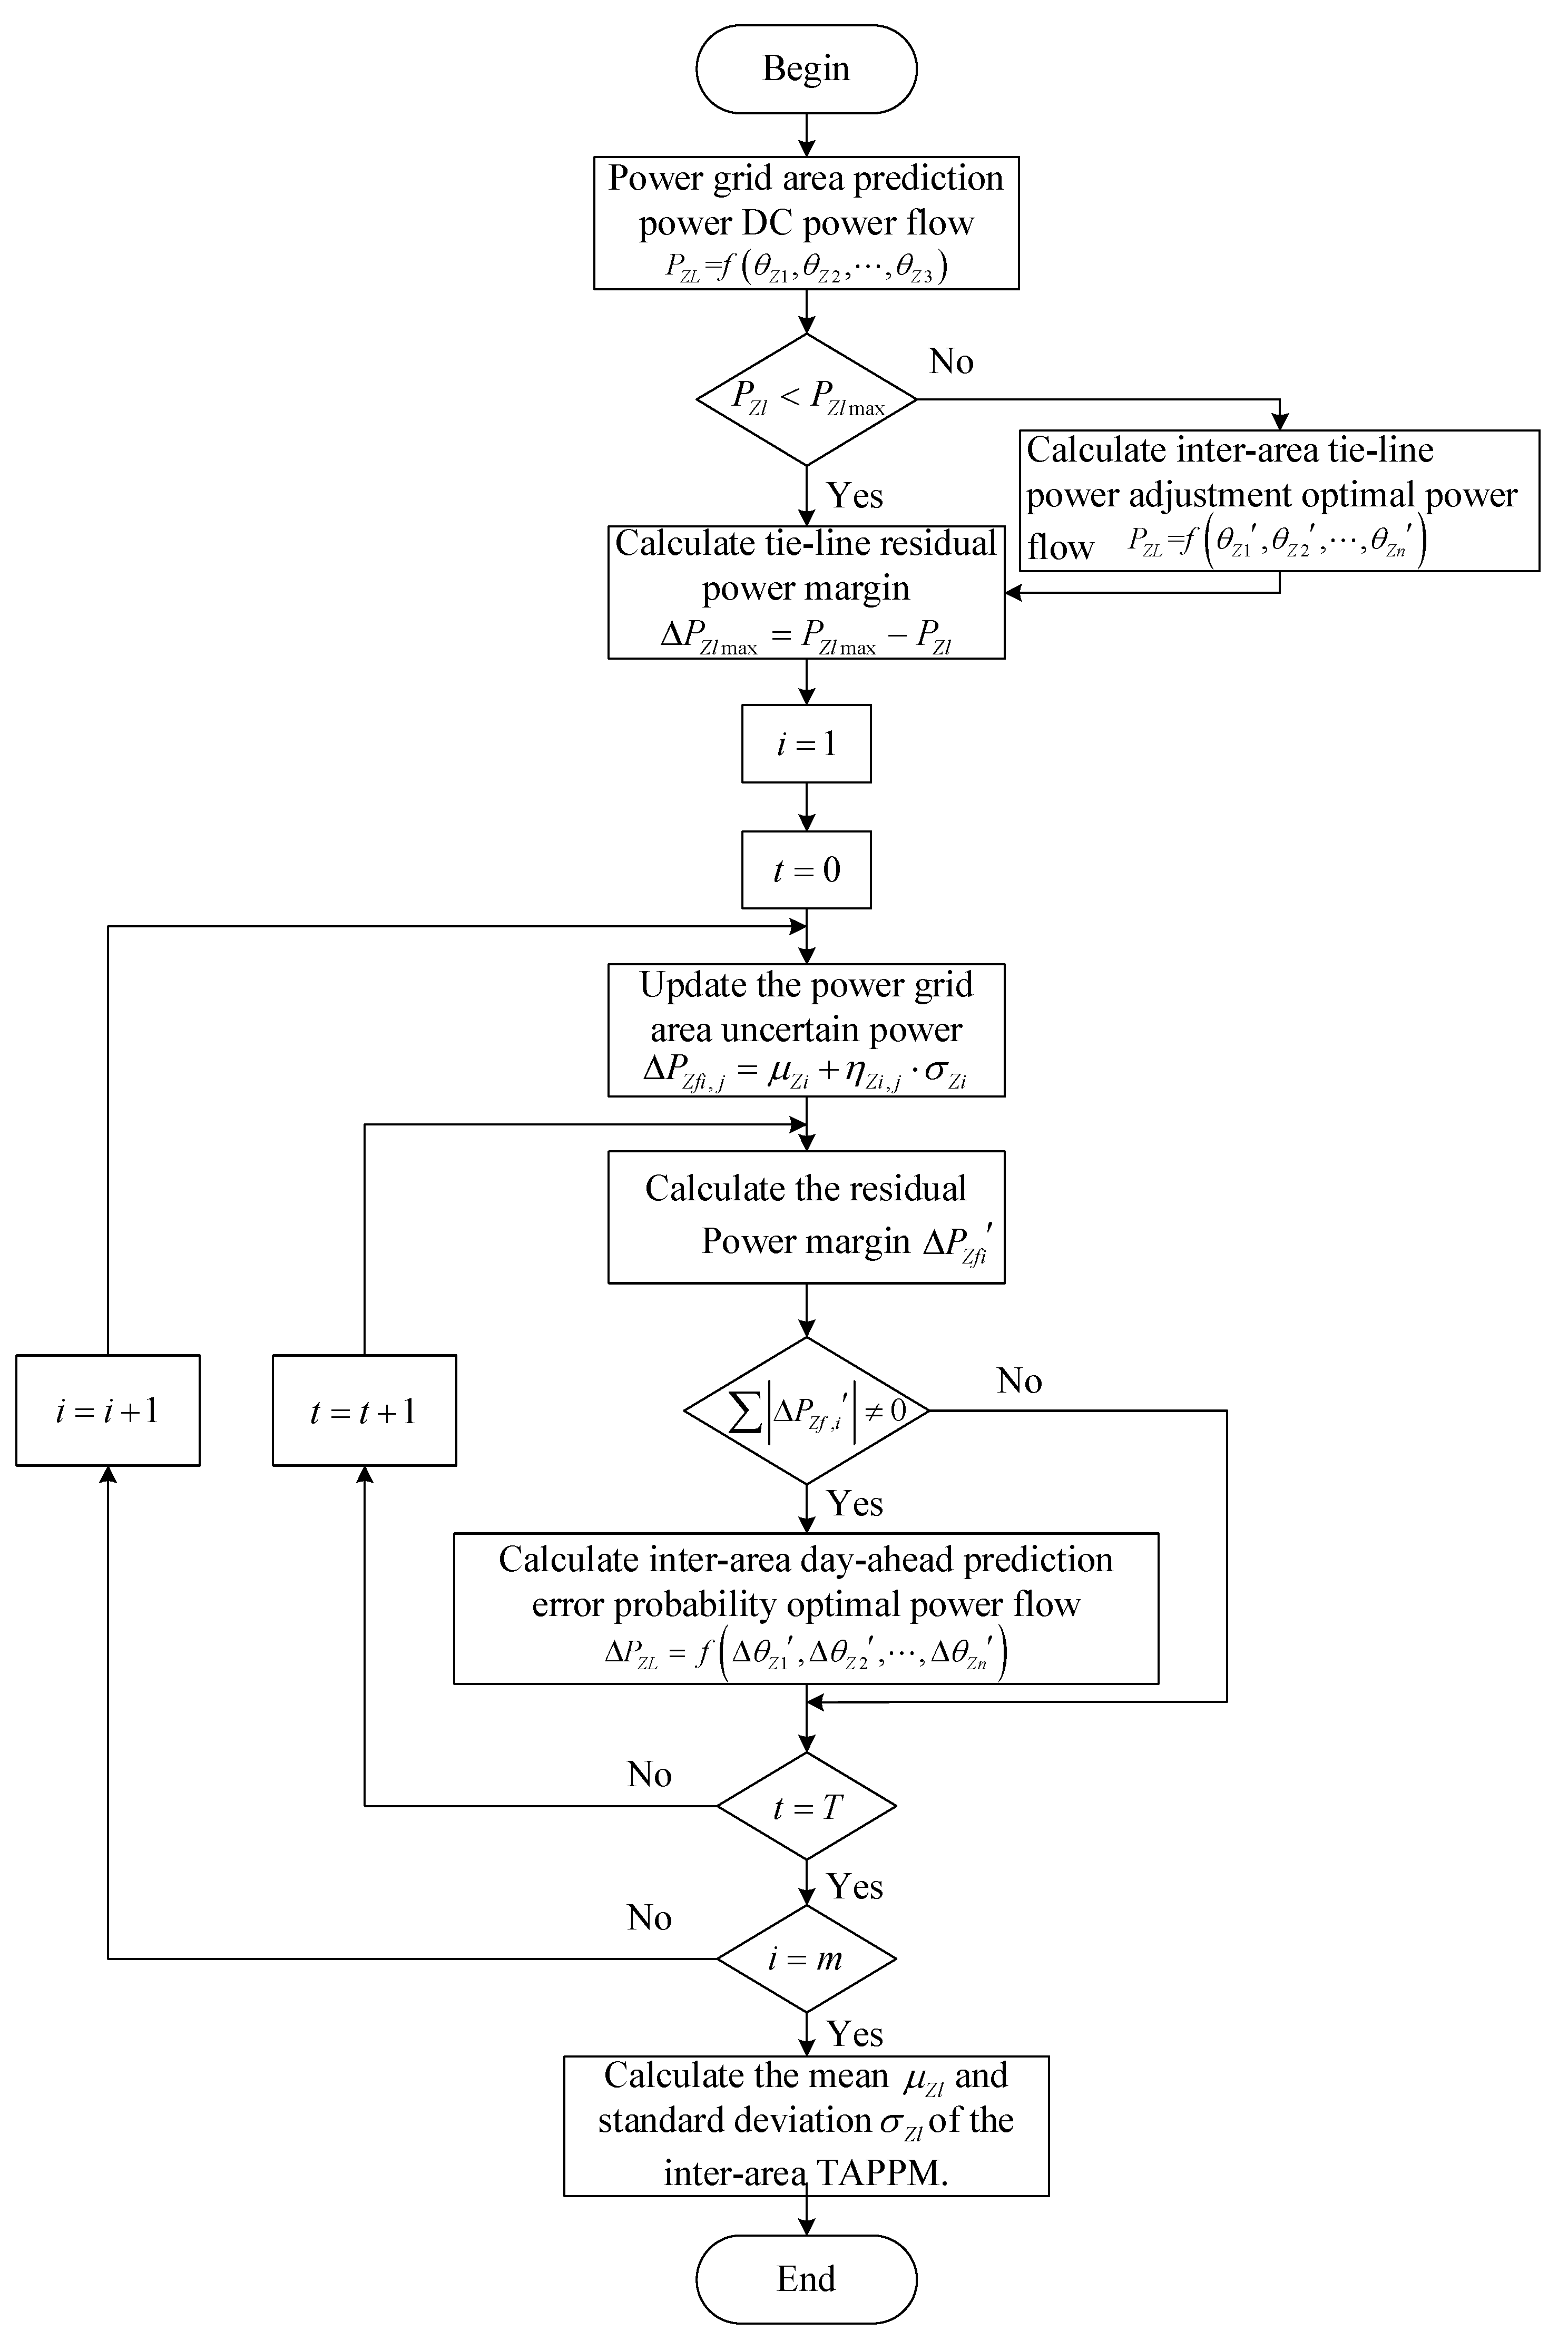
Based on the principle of area control error accommodation, the power grid area first carries out self-accommodation, and then carries out a grid equivalent calculation. For the equivalent grid area, the inter-area TRPPM is calculated by the inter-area DPEPOPF. The calculation value of inter-area TRPPM is taken as the original data of the buses at both ends of the tie-line, and is brought into the intra-area day-ahead DPEPOPF to calculate the intra-area TRPPM. The calculation flow chart is shown in Figure 4.
Figure 4.
Flow chart of day-ahead prediction error probability optimal power flow (DPEPOPF) calculation.
3.2. Inter-Area DPEPOPF
3.2.1. Prediction Error Probability Optimal Power Flow Mathematical Model
Active power distribution is mainly considered in day-ahead dispatching. Active power is significantly affected by the phase angle of the bus voltage. To calculate the line power, the phase angle of bus voltage should be calculated first.
For a PSHPRPSs that can be divided into power grid areas, each power grid area is equivalent to a single bus. The power variation of equivalent buses caused by uncertain power generation is defined by Equation (6):
where is an dimensional variable representing the power variation of equivalent bus. The vector element is defined by Equation (7):
where is the active power of the equivalent bus; is the calculated value of equivalent bus active power. is calculated using AC power flow equations, which can reduce the error in the calculation of .
The variable is dimensional and represents the phase angle variable of the equivalent bus. The voltage phase angle error calculated by the modified active power error is more accurate. The coefficient matrix is an dimensional matrix whose elements are as shown in Equation (8), where is the inter-area tie-line equivalent parameter calculated according to Equation (5).
Since the matrix is an invertible matrix, Equation (6) is transformed into Equation (9):
For any branch , the from-bus is the bus, and the to-bus is the bus. The active power variation of the line between bus and bus is defined by Equation (10):
where represents the admittance between bus and the zero-potential bus; represents the conductance between bus and bus ; and represents the reactance between bus and bus .
According to Equation (10), Equation (11) is used to calculate the power margin of each inter-area tie-line.
When the power of the tie-line between power grid areas exceeds the upper limit, it is necessary to adjust this power. For the PSHPRPSs, which can be divided into power grid areas, the tie-line power adjustment mathematical model is given by Equation (12). This equation satisfies the line power constraint.
In order to avoid power congestion of tie-line between power grid areas, the maximum value of tie-line reserve power probability margin is selected. The inter-area day-ahead prediction error probability optimal power flow mathematical model is defined by Equation (13):
The intra-area day-ahead prediction error probability optimal power flow mathematical model of PSHPRPSs is constrained by power balance constraints, tie-line power constraints, and reserve capacity constraints, as described and quantified below.
(1) Power balance constraint
Equation (14) is a power balance constraint formula, where denotes the day-ahead power prediction error and denotes the reserve power.
(2) Tie-line power constraint
The active power variation of the power grid area tie-line should not be greater than the line residual power margin . The constraint is expressed as shown in Equation (15):
(3) Reserve capacity constraint
The variable denotes the reserve power of the th power grid area, which satisfies the capacity constraint shown in Equation (16):
Type I and type III power grids have the capacity of accommodation. According to the principle of area control error accommodation, uncertain power generation should avoid flow to the external power grid. Therefore, a type I power grid should be used first to accommodate uncertain power generation. The accommodation capacity of a type I grid is , and that of a type III grid is . The variable denotes the reserve power function and is defined by Equation (17):
3.2.2. Inter-Area Point Estimation Optimization Algorithm for DPEPOPF
The tie-line power variation and each value of power grid area uncertainty power generation power satisfy the functional relationship shown in Equation (18):
where represents the uncertain power generation of the th regional power grid; the mean is and the standard deviation is . The value of is calculated using Equation (19) [46]:
where denotes the standard location coefficient, which is calculated using Equation (20):
where is calculated using the ratio of central moments to standard deviation . The value is calculated using Equation (21) and using Equation (22):
In Equation (21), represents the probability density function (PDF) of the power grid area uncertainty power generation.
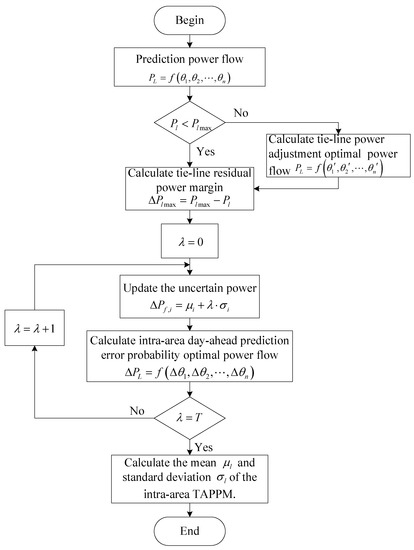
According to Equation (18), if the power prediction error of uncertainty power source obeys the probability distribution, the inter-area tie-line power variation will also obey the probability distribution. Here, the point estimation optimization algorithm for inter-area DPEPOPF is used to obtain the numerical characteristics of inter-area tie-line power variation . The calculation steps of the point estimation optimization algorithm are as follows:
- (1)
- According to Equation (23), the inter-area tie-line power is calculated using the power grid area uncertainty power source predicted value:
- (2)
- Whether any tie-line exceeds the upper limit power is detected according to Equation (24); if the upper limit is exceeded, the third step will be executed; otherwise, the fourth step will be executed:
- (3)
- According to Equation (12), the mathematical model of the inter-area tie-line power adjustment power flow is used to adjust the tie-line power.
- (4)
- The inter-area tie-line residual power margin is calculated according to Equation (25):
- (5)
- According to the point estimation optimization algorithm for the DPEPOPF, the variables are selected in turn.
- (6)
- The power grid area uncertain power generation probability variable is updated according to Equation (19).
- (7)
- After the power grid area is self-accommodated, the residual power margin of power grid area is calculated.
- (8)
- According to Equation (11), the inter-area DPEPOPF is calculated.
- (9)
- The mean and standard deviation of the inter-area TRPPM are calculated.
A flow chart of the inter-area point estimation optimization algorithm for DPEPOPF is shown in Figure 5.
Figure 5.
Flow chart of the inter-area point estimation optimization algorithm for DPEPOPF.
3.3. Intra-Area DPEPOPF
3.3.1. Prediction Error Probability Optimal Power Flow Mathematical Model
For a PSHPRPS with buses, the bus power variation caused by uncertain power generation is defined by Equation (26):
where is an dimensional variable representing the bus power variation. The vector element is defined by Equation (27):
where is the bus active power, and is the initially calculated bus active power. is calculated using AC power flow equations, which can reduce the error in the . The is an dimensional variable representing the bus phase angle. The voltage phase angle error calculated using the modified active power error is more accurate. The coefficient matrix is an dimensional matrix whose elements are as shown in Equation (8).
According to Equation (10), Equation (28) is used to calculate the power margin of each intra-area tie-line.
When the power of the tie-line exceeds the upper limit, it is necessary to adjust the tie-line power. For a PSHPRPS with buses, the mathematical model of the tie-line power adjustment is given by Equation (29). This equation satisfies the line power constraint.
To avoid tie-line power congestion, the maximum value of the tie-line reserve power probability margin is selected. The intra-area DPEPOPF mathematical model is defined by Equation (30):
The intra-area DPEPOPF mathematical model of PSHPRPSs is constrained by power balance constraints, tie-line power constraints, and reserve capacity constraints, as described and quantified below.
(1) Power balance constraint
Equation (31) is an expression of the power balance constraint:
where represents the intra-area uncertain generating power; and represents total reserve power.
(2) Tie-line power constraint
The active power variation of the power grid area tie-line should not be greater than the line residual power margin . The constraint is expressed by Equation (32):
(3) Reserve capacity constraint
The number of reserve power sources in the power grid is , and represents the reserve power generation power, which satisfies the reserve capacity constraint shown in Equation (33):
3.3.2. Intra-Area DPEPOPF
Uncertain power generation obeys the probability distribution. The tie-line power variation and uncertainty power generation power satisfy the functional relationship shown in Equation (34):
where represents the th uncertain power generation variation; the mean is , and the standard deviation is . According to the principle of power grid area division, the uncertain power sources in the same power grid area are highly correlated, and is calculated using Equation (35):
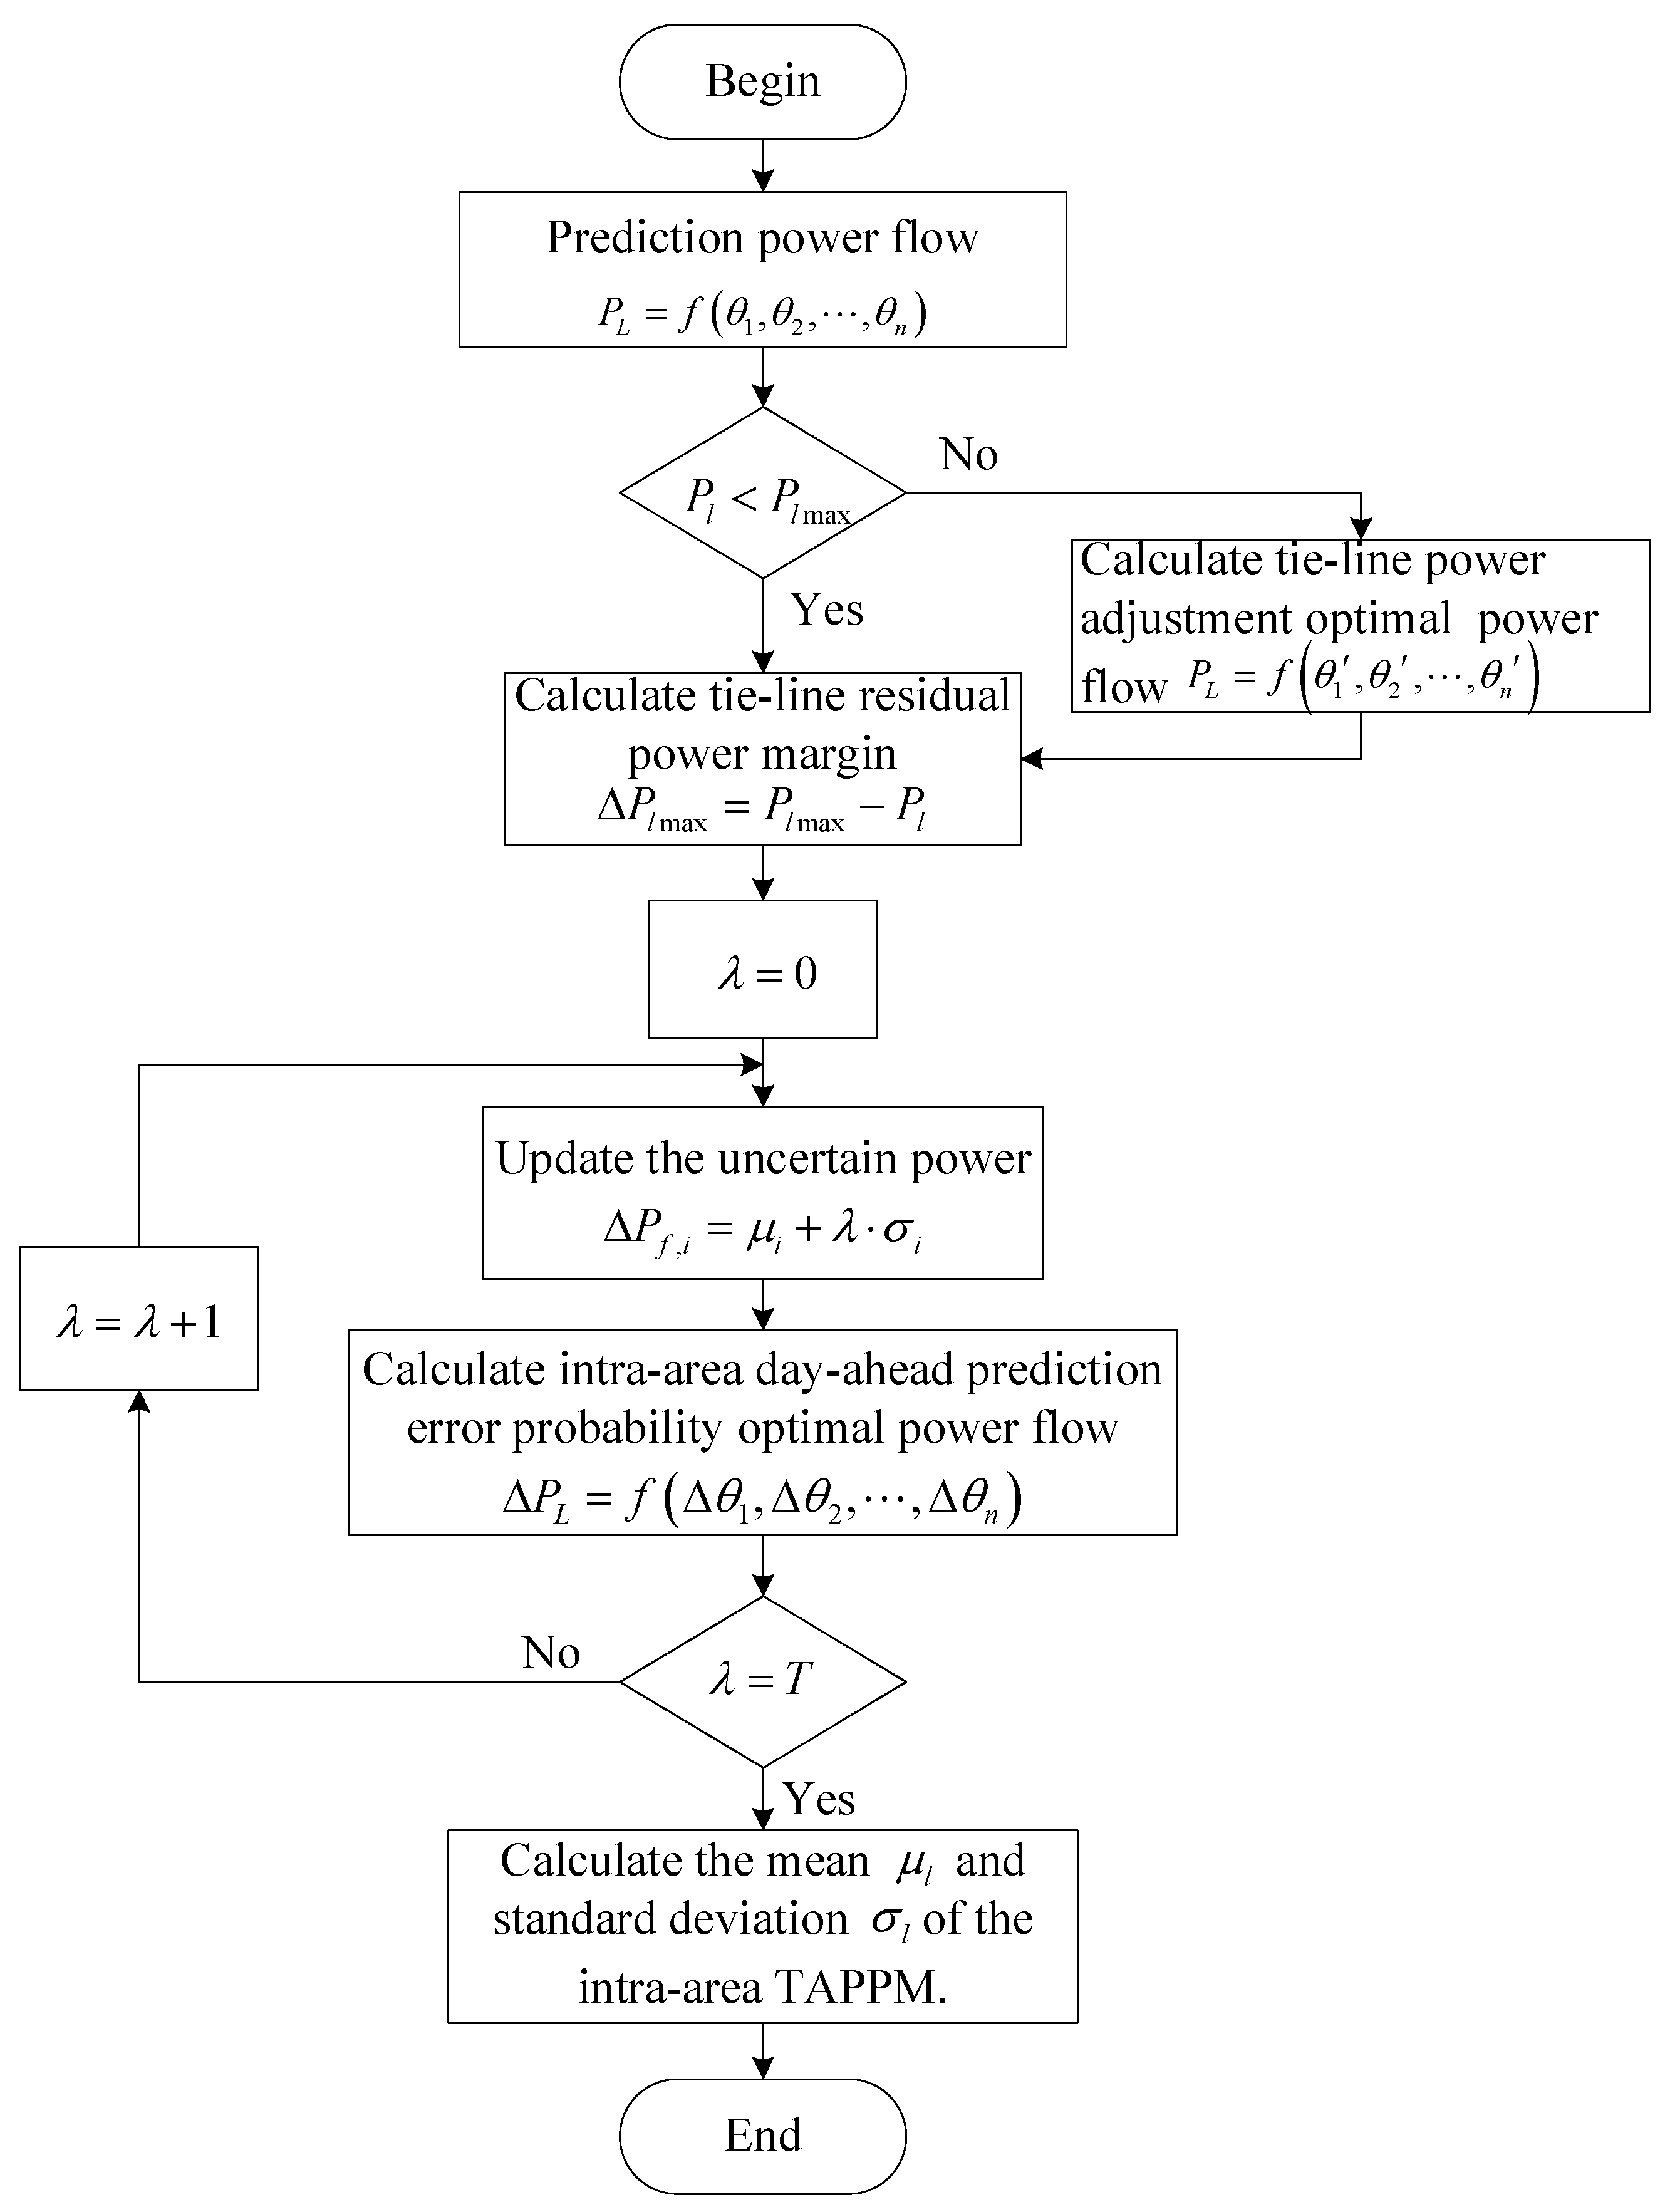
According to Equation (34), the generation power uncertainty will lead to tie-line power variation obeying the probability distribution. Here, the intra-area DPEPOPF optimization algorithm is used to obtain the numerical characteristics of intra-area tie-line power variation . The calculation steps are as follows:
- (1)
- According to Equation (36), the tie-line power is calculated using the uncertainty power source predicted value:
- (2)
- Detecting whether each tie-line power exceeds the upper limit according to Equation (37). If the upper limit is exceeded, the third step will be executed, otherwise the fourth step will be executed.
- (3)
- According to Equation (29), a mathematical model of the intra-area tie-line power adjustment power flow is used to adjust the tie-line power.
- (4)
- Each value of the tie-line residual power margin is calculated according to Equation (38):
- (5)
- Update the uncertain power generation probability variable according to Equation (35).
- (6)
- According to Equation (28), the intra-area DPEPOPF is calculated.
- (7)
- Calculate the mean and standard deviation of the intra-area TRPPM.
A flow chart of the intra-area the DPEPOPF optimization algorithm is shown in Figure 6.
Figure 6.
Flow chart of the intra-area DPEPOPF optimization algorithm.
4. Simulation Results
4.1. Modified IEEE 118 Bus Test System Raw Data
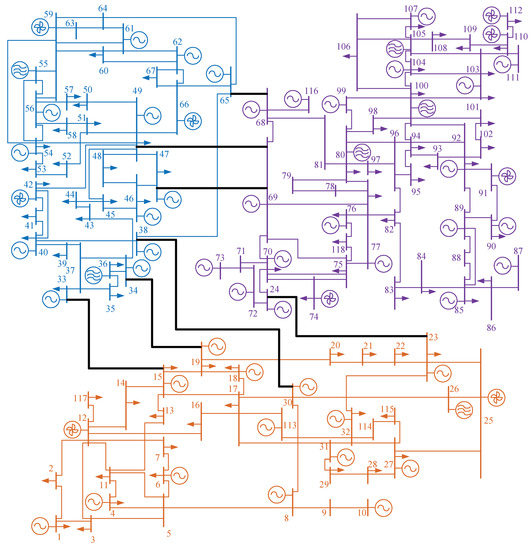
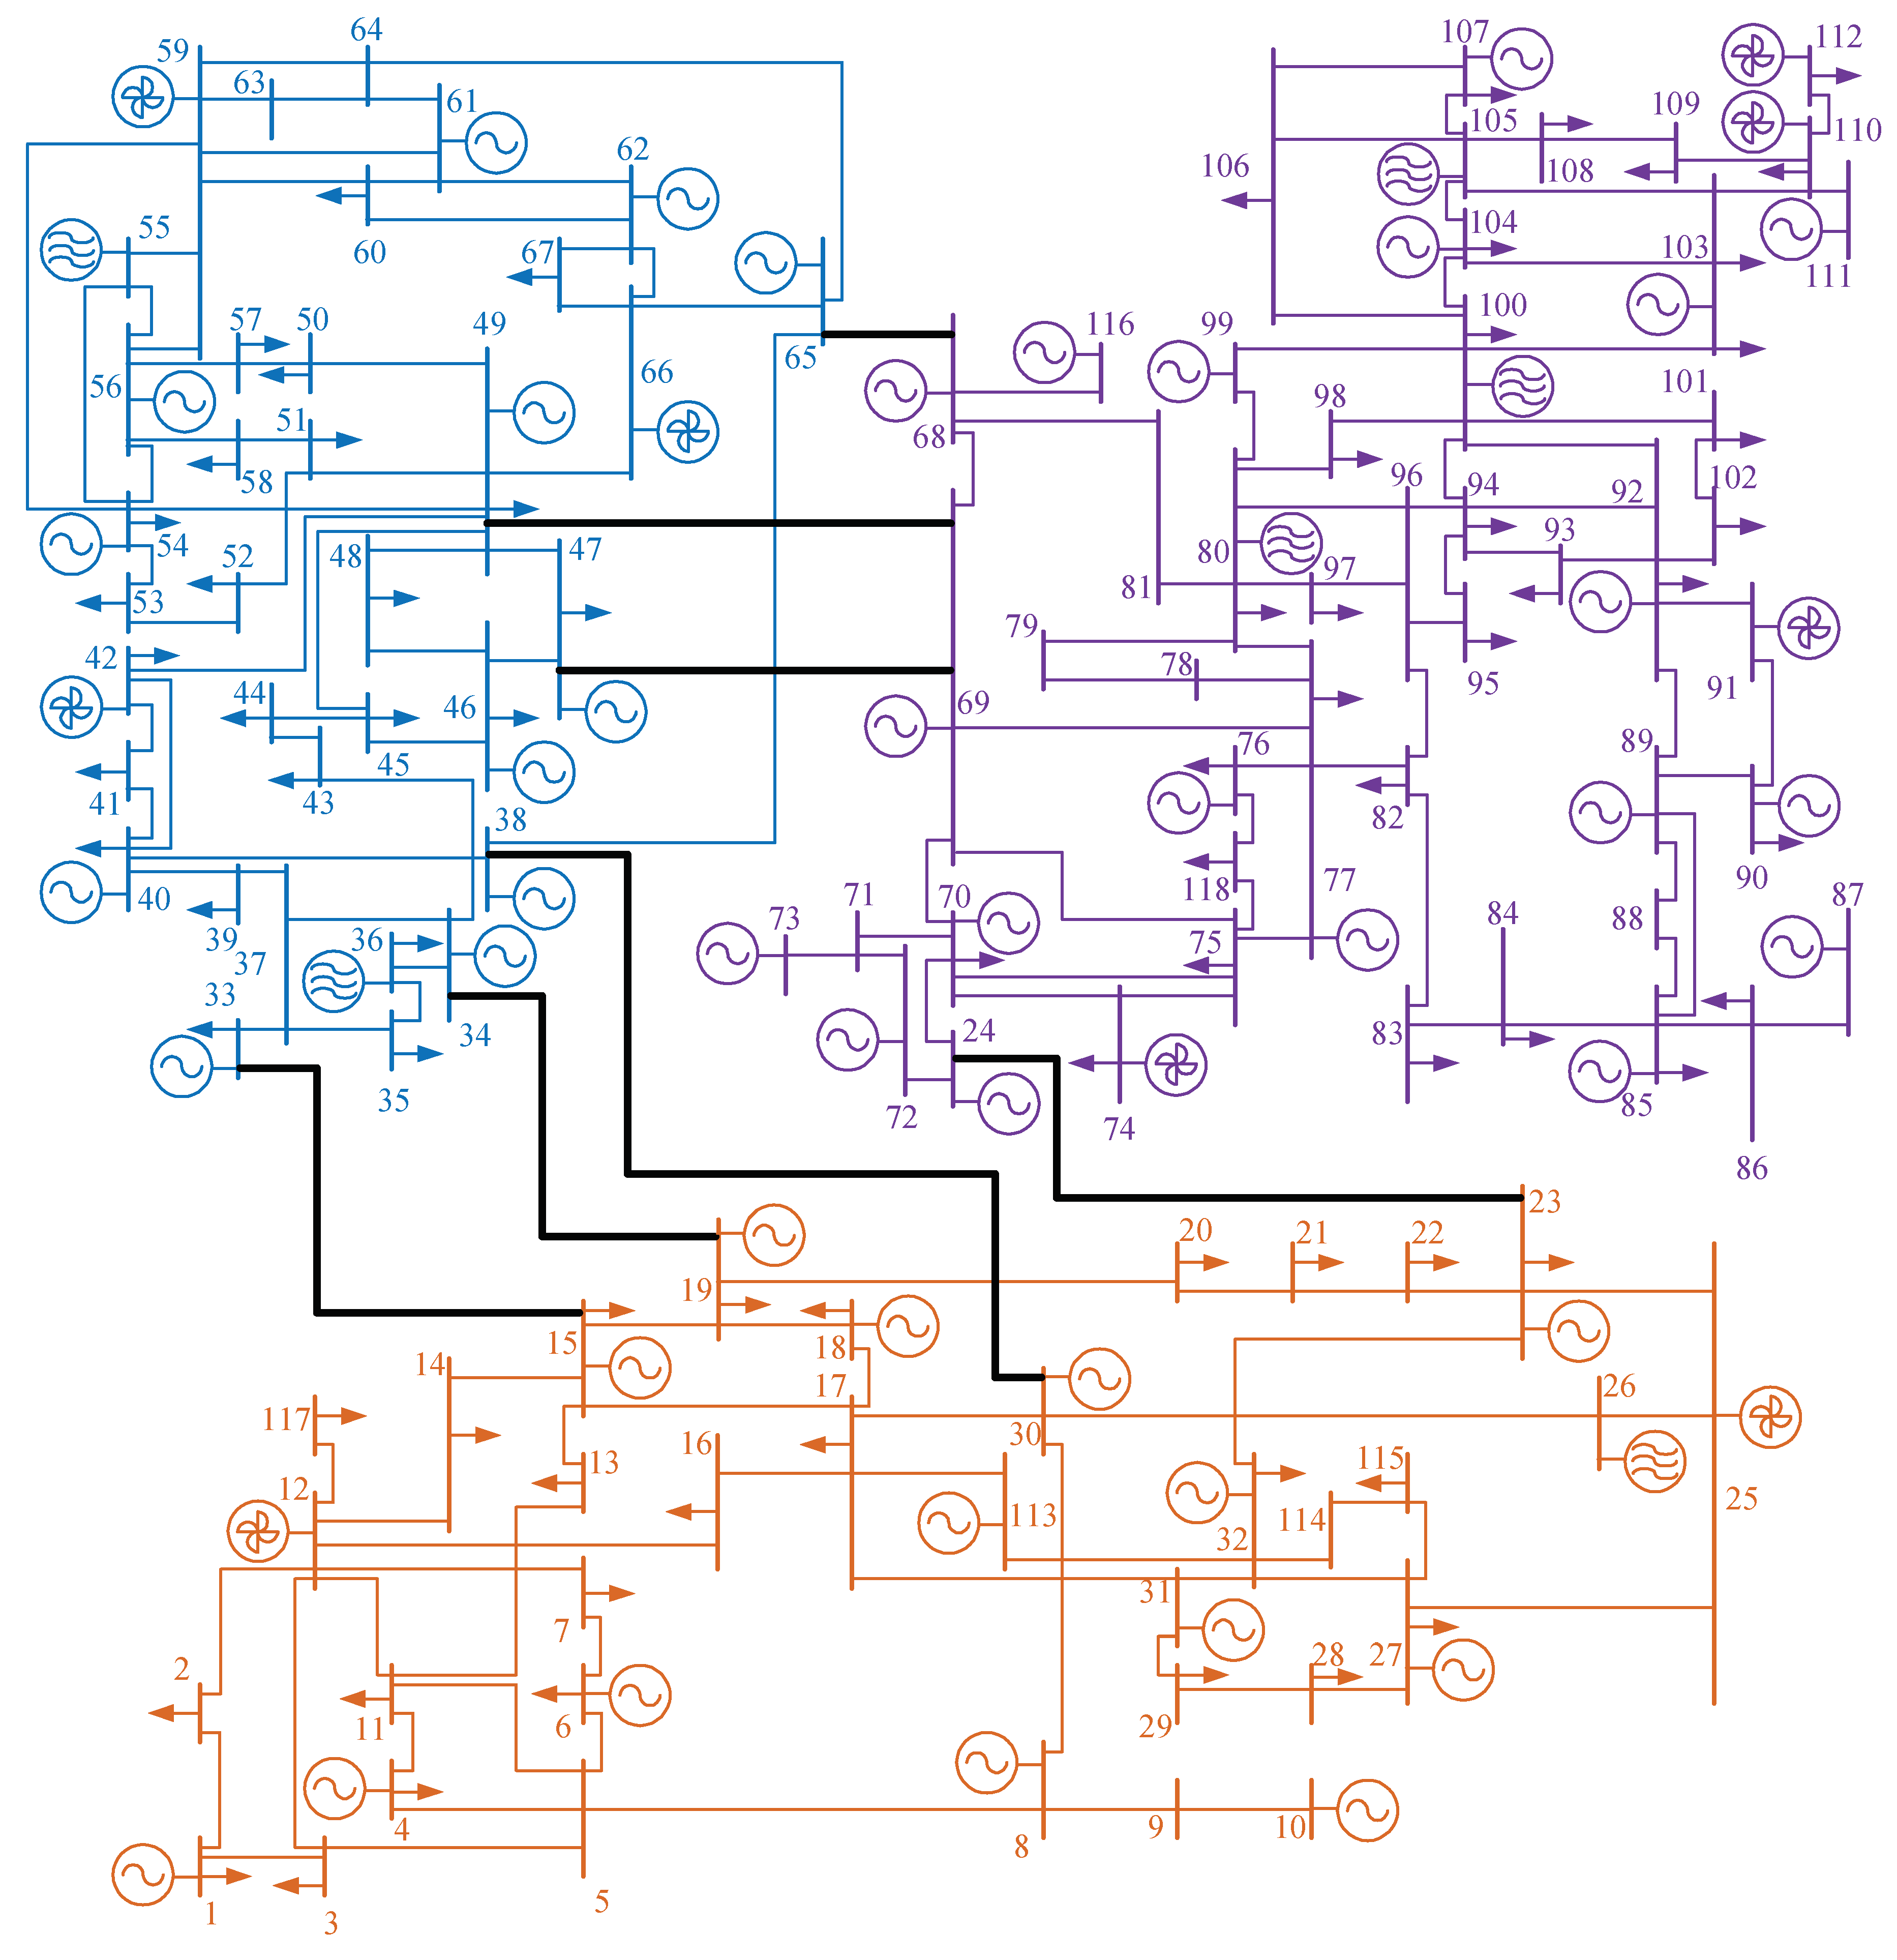
To verify the feasibility of the model, the DPEPOPF is applied to the modified IEEE 118 bus test system to calculate the TRPPM for the day-ahead dispatching. The modified IEEE 118 bus test system diagram is shown in Figure 7. Simulations were performed in MATLAB 8.3.0.532 (R2014a, The MathWorks, Inc, Natick, MA, USA) on a personal computer with an i3-4170 CPU, 3.70 GHz processor, and 4.0 GB RAM.
Figure 7.
Modified Institute of Electrical and Electronics Engineers (IEEE) 118 bus test system diagram. The orange power area grid is area 1; the blue power area grid is area 2; and the purple power area grid is area 3. The thick black line is the inter-area tie-line.
According to the principles of the power grid area division explained in Section 2, this study divides the modified IEEE 118 bus test system into three power grid areas [47]. The mean and standard deviation of the uncertain power source prediction error are shown in Table A1.
Here, the DPEPOPF is used to calculate the TRPPM for day-ahead dispatching. Uncertainty power source power prediction error obeying the probability distribution will lead to tie-line power variation obeying the probability distribution. In the day-ahead dispatch, the tie-line needs to reserve the TRPPM for reserve power. According to the PDF, the probability values corresponding to the different TRPPM can be obtained.
4.2. Simulation Results of Inter-Area TRPPM
According to Equation (11), the inter-area DPEPOPF mathematical model is used to solve the inter-area TRPPM. Table 1 shows the numerical characteristics of the inter-area TRPPM. Using the mean and standard deviation, the PDF and cumulative distribution function (CDF) of the inter-area TRPPM can be calculated. According to the PDF, TRPPM is reserved for corresponding uncertain power generations. Therefore, the accuracy of the inter-area DPEPOPF mathematical model and its optimization algorithm are verified.
Table 1.
Numerical characteristics of the tie-line reserve power probability margin (TRPPM).
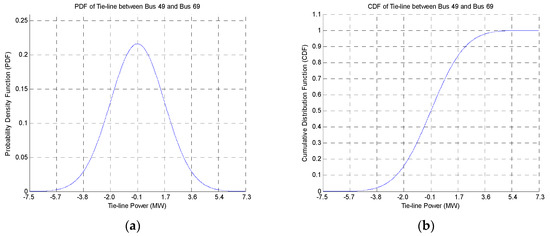
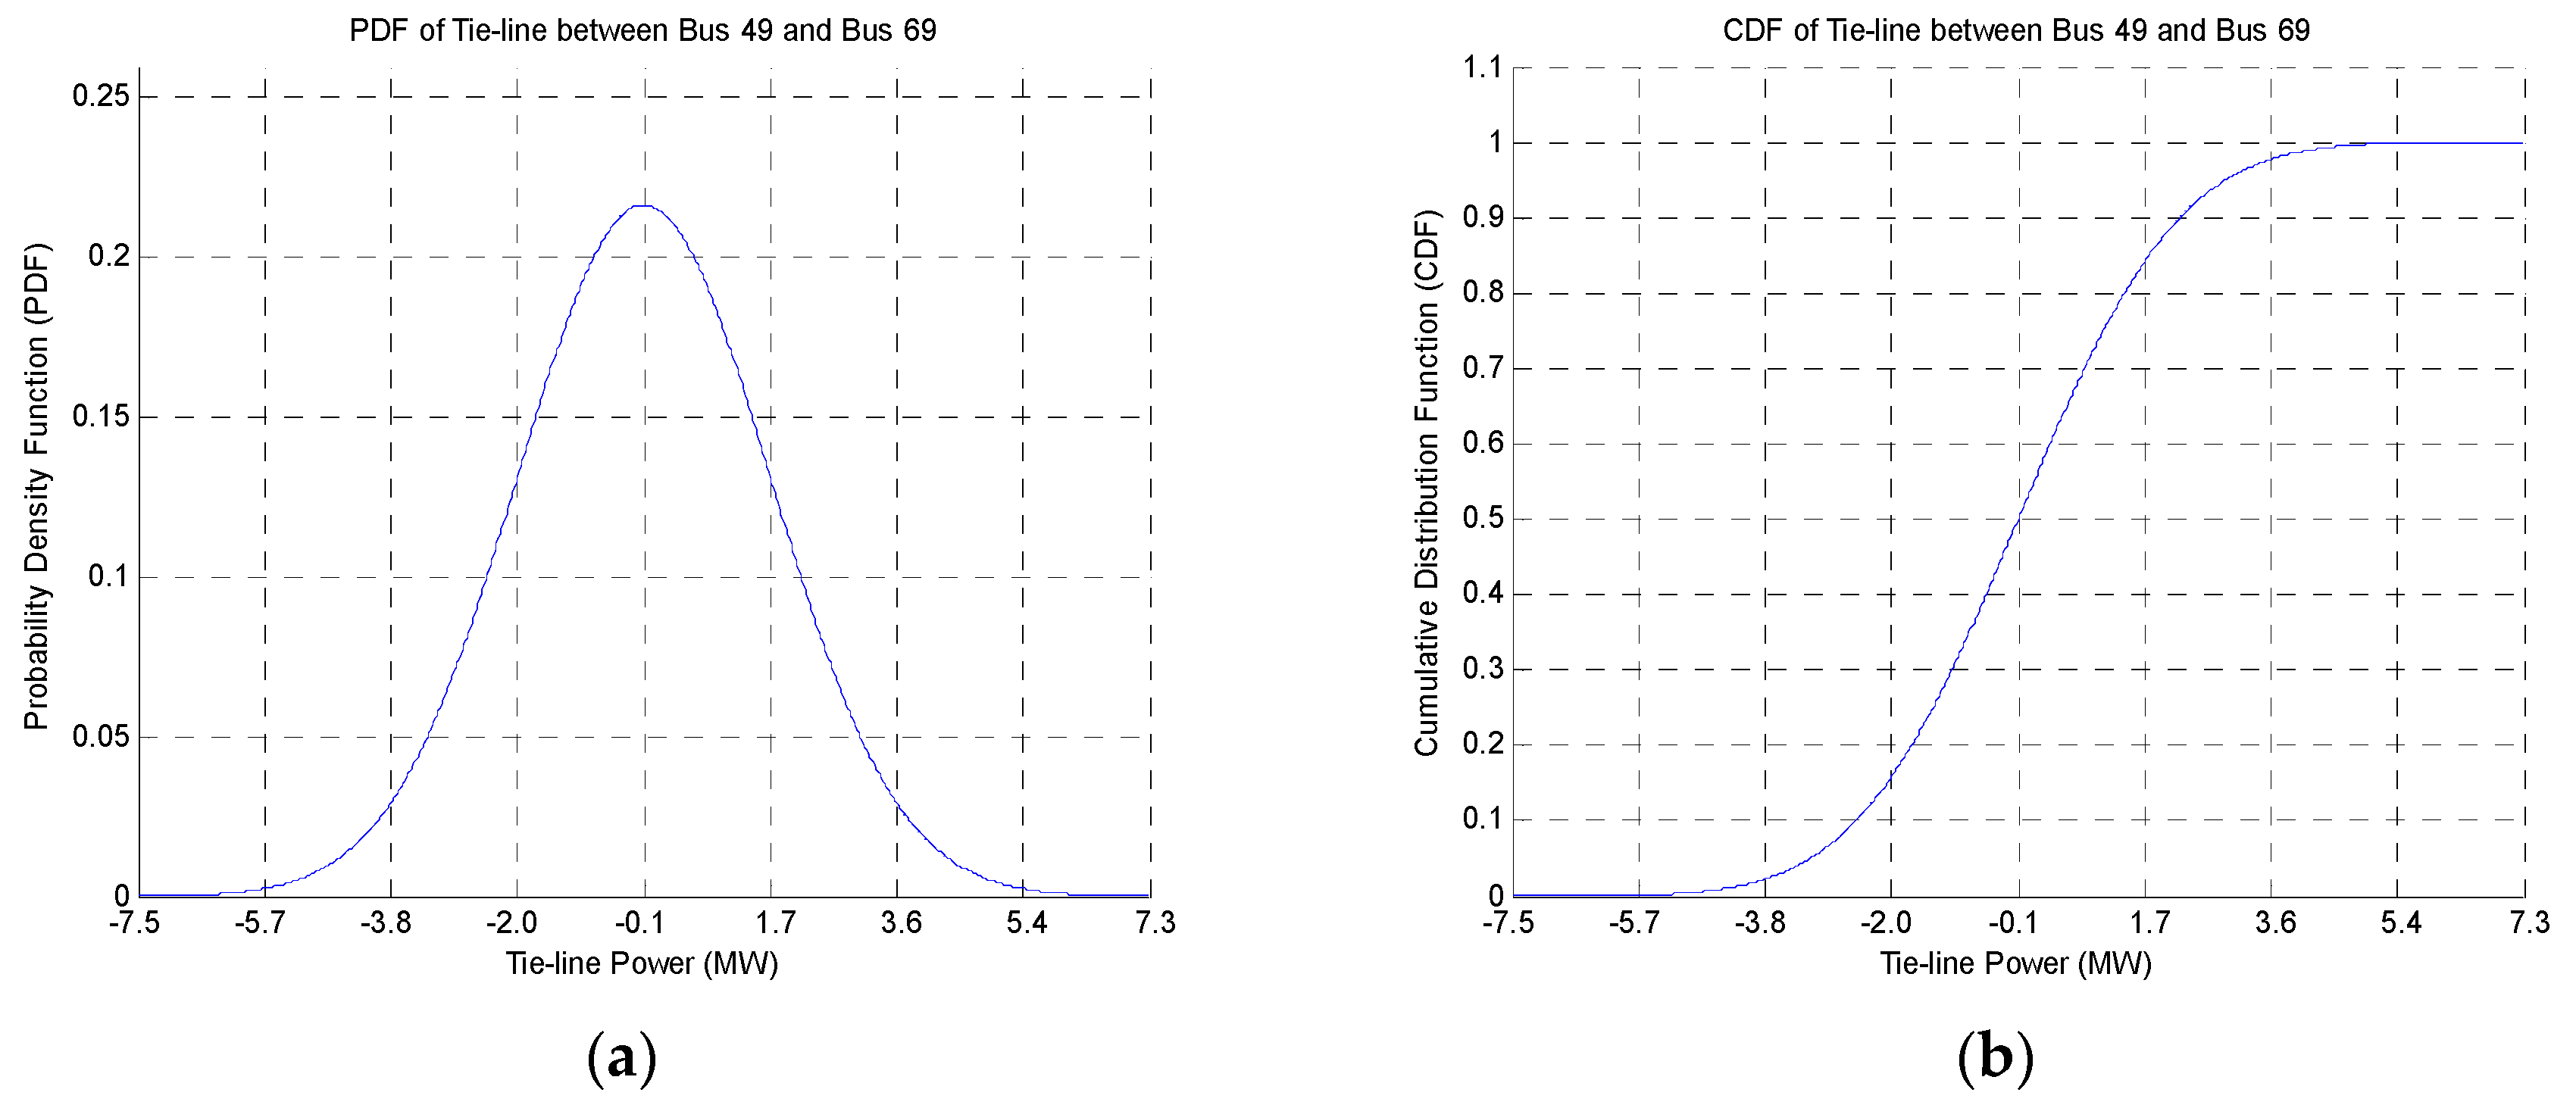
According to Table 1, the tie-line with the minimum mean and standard deviation is that between bus 49 and bus 69; its PDF and CDF are shown in Figure 8. Under the same uncertain power generation, the probability of the reserved power margin of the tie-line corresponding to the minimum mean and standard deviation is smaller. In the process of accommodating power to participate in dispatching, line power congestion is likely. Therefore, it is meaningful to study the TRPPM for such tie-lines to avoid power congestion.
Figure 8.
Probability density function (PDF) and cumulative distribution function (CDF) of the TRPPM between bus 49 and bus 69. (a) PDF; (b) CDF.
4.3. Simulation Results of Intra-Area TRPPM
According to Equation (28), the TRPPM in areas 1–3 are calculated based on the intra-area DPEPOPF and its optimization algorithm.
Table A2, Table A3 and Table A4 (Appendix B) show the numerical characteristics of the TRPPM calculated by simulation in power grid areas 1–3, respectively. Using the mean and standard deviation, the PDF and CDF of intra-area TRPPM can be calculated. In day-ahead dispatching, according to the PDF of TRPPM, different sizes of the TRPPM are reserved for different magnitudes of uncertain power generation.
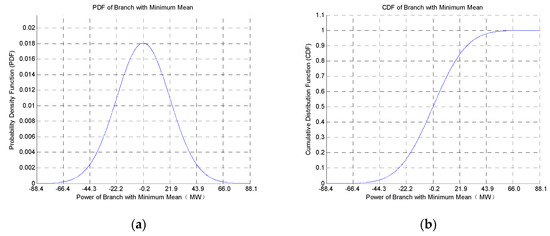
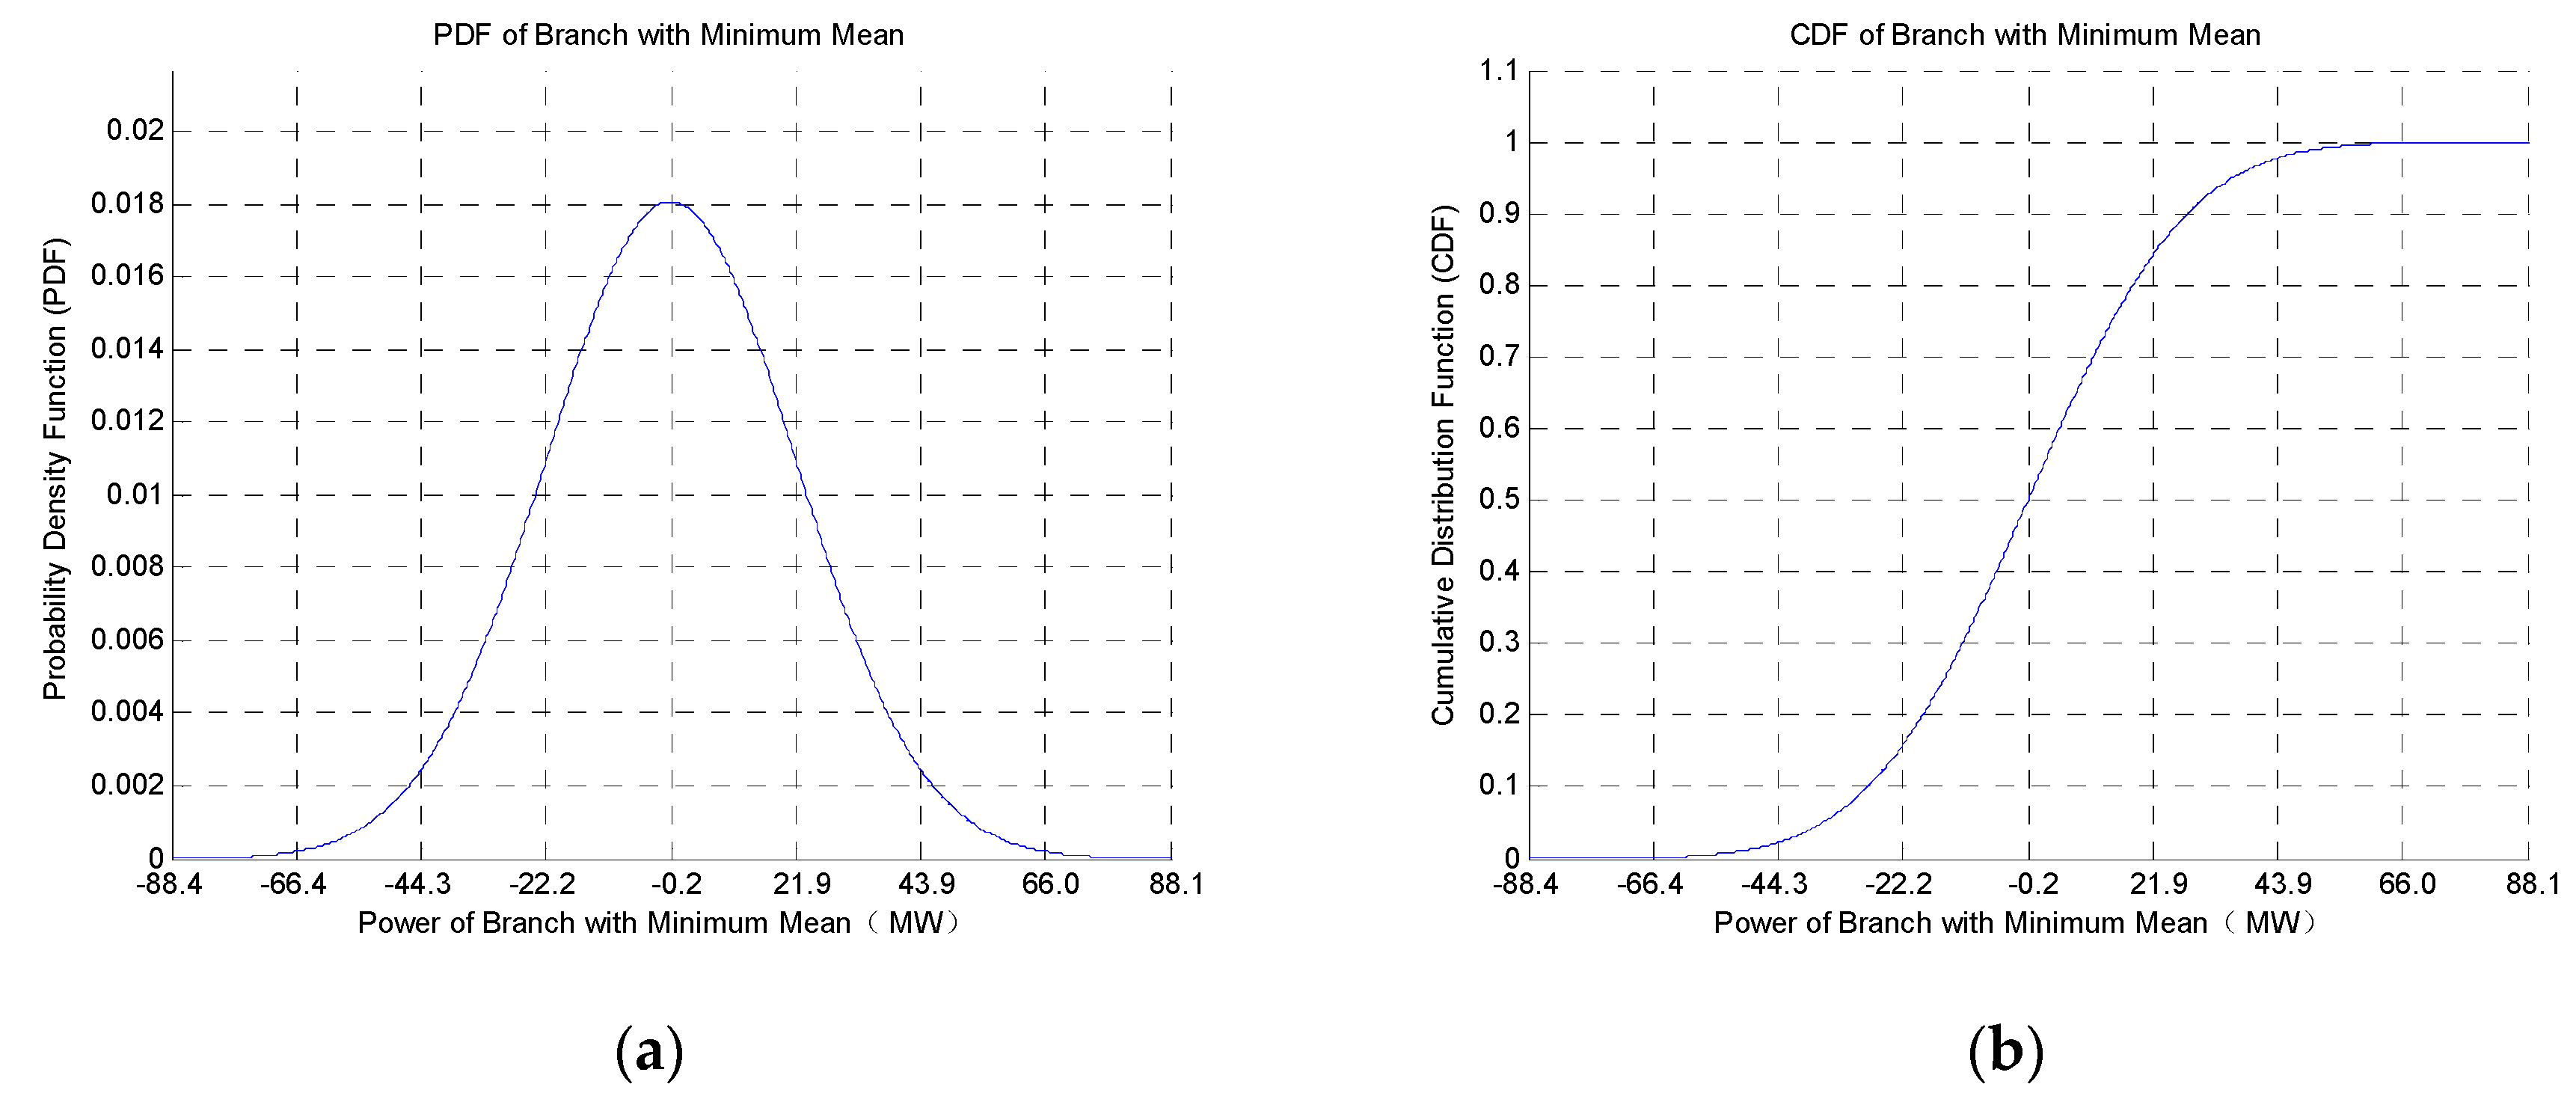
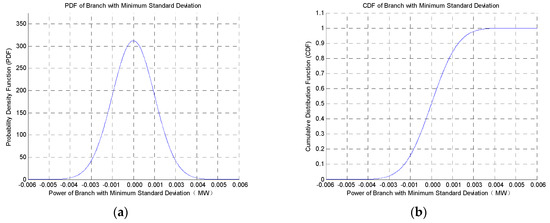
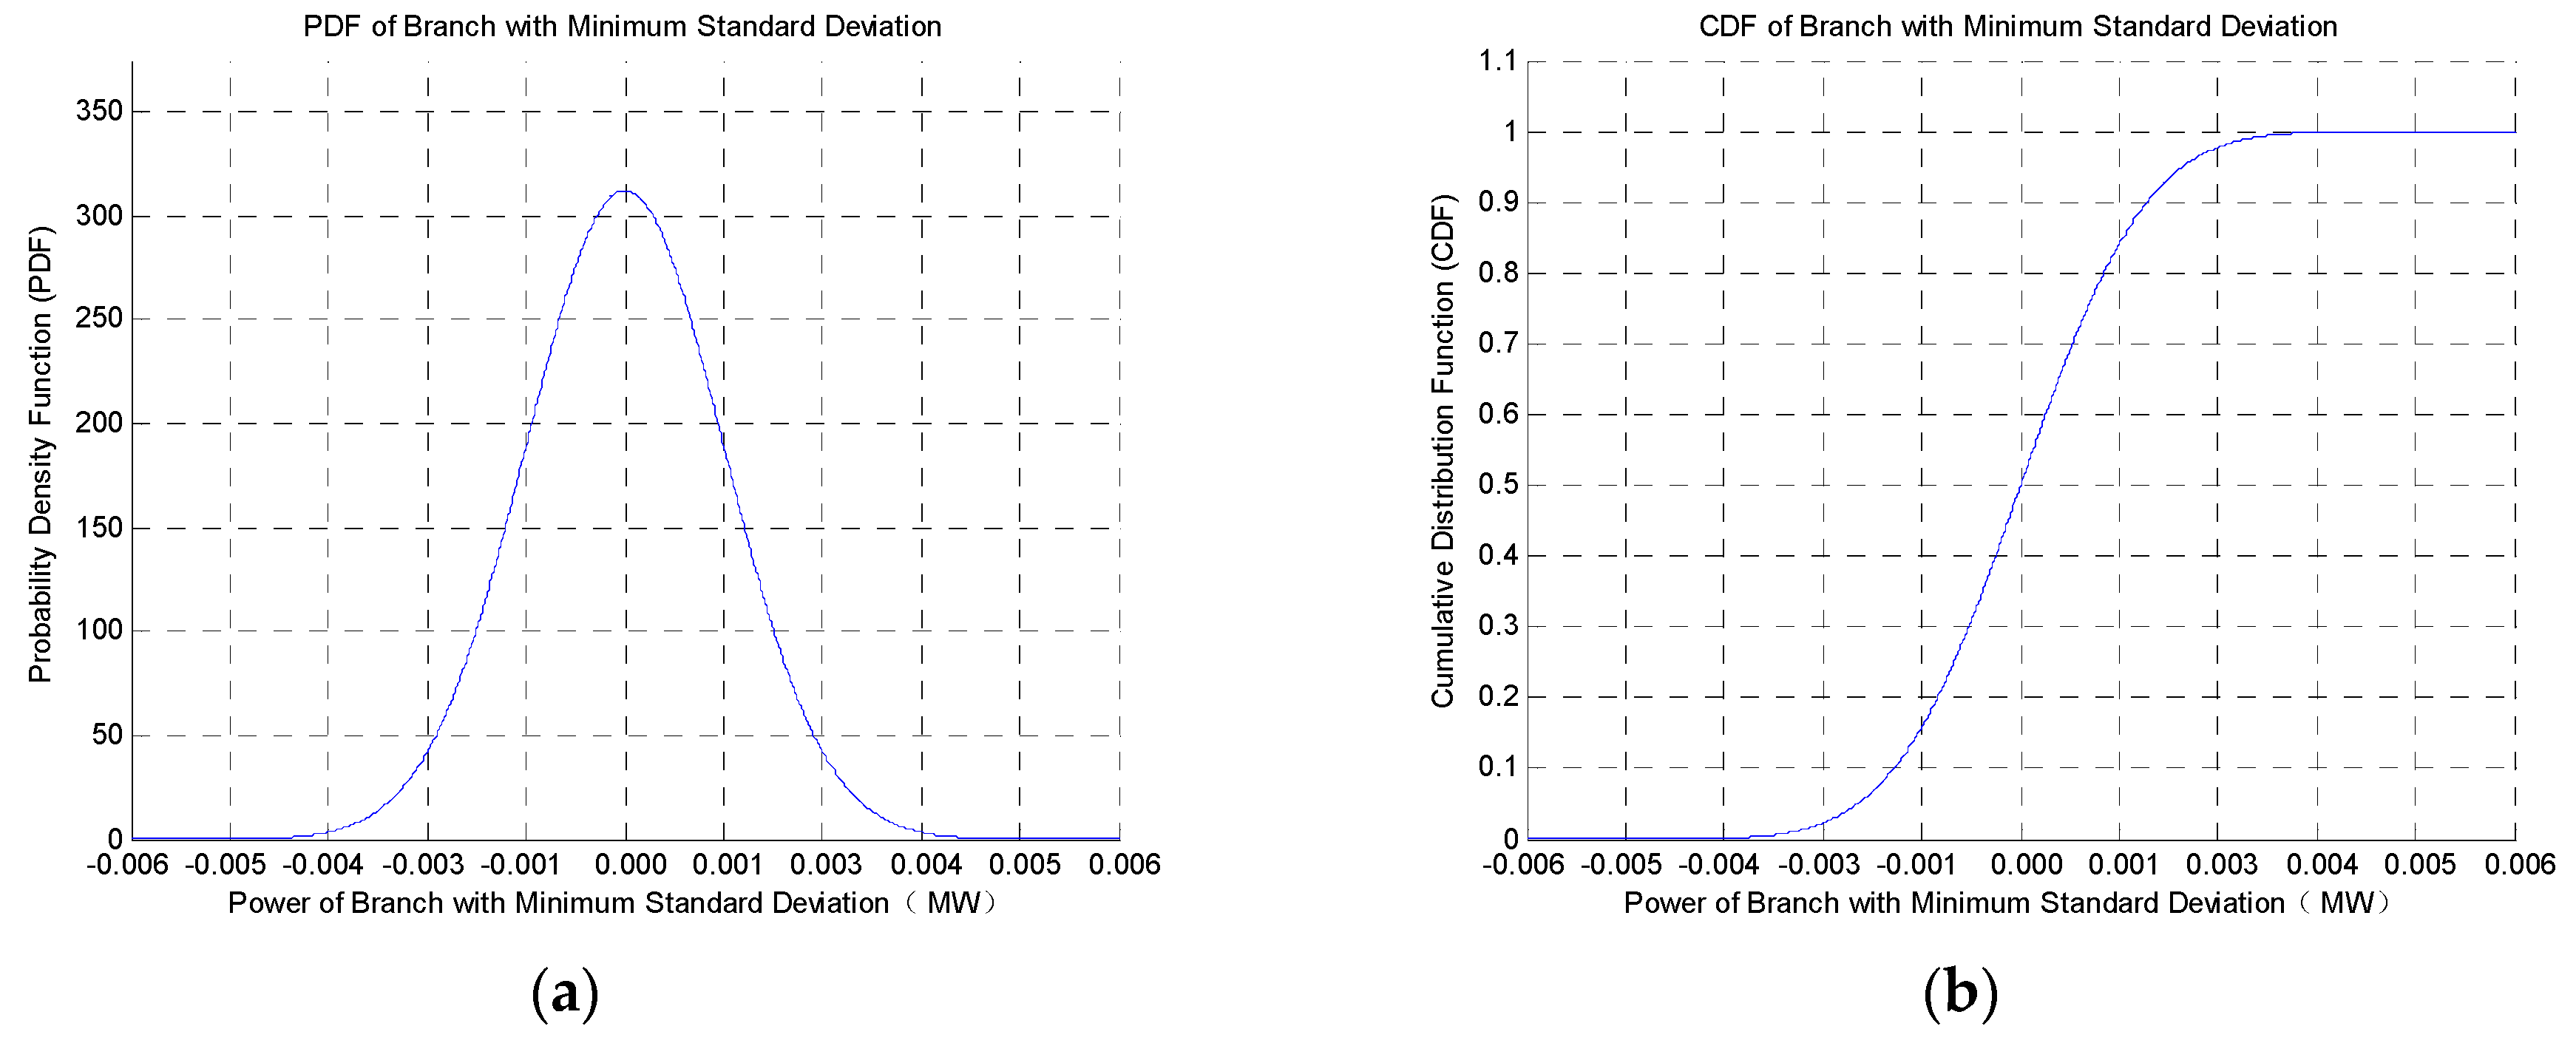
For the three regions, Table 2 shows the numerical characteristics of the mean and standard deviation corresponding to the minimum TRPPM. The mean of the TRPPM between bus 18 and bus 19 is the smallest, and the standard deviation of the TRPPM between bus 68 and bus 116 is the smallest.
Table 2.
Numerical characteristics of the mean and standard deviation corresponding to the minimum TRPPM.
Figure 9 and Figure 10, respectively, depict the PDF and CDF of the corresponding TRPPM when the mean and standard deviation are minimum. According to the PDF, the TRPPM is reserved for different magnitudes of uncertain power generation. Therefore, the accuracy of the intra-area DPEPOPF mathematical model and its optimization algorithm is verified.
Figure 9.
PDF and CDF of the mean minimum corresponding TRPPM. (a) PDF; (b) CDF.
Figure 10.
PDF and CDF of the standard deviation minimum corresponding to the TRPPM. (a) PDF; (b) CDF.
4.4. Discussion
Equations (6) and (9) are DC power flow model equations. Equations (7) and (10) are AC power flow model equations. Therefore, the DPEPOPF mathematical model is a combination of AC power flow and DC power flow. In reference [48], a probabilistic optimal DC power flow model is proposed and solved by the method of combined cumulants and Gram–Charlier expansion. In this paper, the calculation results of the DPEPOPF model and the DC power flow model were compared with the AC power flow model, respectively, to verify that the calculation results of the power flow model proposed in this paper are more accurate than the DC power flow model, and approximate to the AC model results. In this paper, the operation time of the DPEPOPF model, the DC power flow model, and the AC power flow model were compared to verify that the operation speed of the model proposed in this paper is faster than that of the AC model, and is similar to that of the DC model.
In order to verify the accuracy of the calculation results of the power flow model proposed in this paper, the calculation results of the DPEPOPF model and the DC power flow model were compared with the AC power flow model, respectively. The relative error of the calculation results of the two models relative to the AC power flow model is defined by Equation (39):
where represents the percentage error of the simulation result; represents the simulation result of the AC power flow model; represents the simulation result of the DPEPOPF mathematical model or DC power flow model. The average percentage error is calculated by Equation (40):
where represents the total number of percentages error.
According to Table 3, the average relative error of the DPEPOPF and the AC power flow calculation result is 0.396%; the average relative error of the DC power flow and the AC power flow calculation result is 11.05%. The simulation results show that the results of the optimal power flow model proposed in this paper are similar to those of the AC power flow model, and more accurate than those of the DC power flow model. What is more, the proportion of uncertain power source in PSHPRPSs is higher, and the day-ahead prediction error of renewable energy sources is generally about 25%. According to Table 3, the average relative error of the DPEPOPF and the AC power flow calculation result is 0.396%, which is much smaller than the power prediction error in PSHPRPSs. Therefore, the simulation results prove the accuracy of the DPEPOPF model proposed in this paper.
Table 3.
Average percentage error of simulation results. DC, direct current.
In order to verify the efficiency of the proposed model, the operation time of the optimal power flow model, AC power flow model, and DC power flow model are compared.
As shown in Table 4, the operation time of the DPEPOPF model is shorter than that of the AC power flow, and similar to that of the DC power flow. Therefore, the simulation results show that the proposed model has high computational efficiency.
Table 4.
Simulation operation time. AC, alternating current.
The simulation results show that the proposed probabilistic optimal power flow model not only has high calculation accuracy, but also has high calculation efficiency.
Large-scale renewable energy sources and main loads are usually distributed in different power grid areas. The power generated by large renewable energy sources needs to be transmitted via a tie-line to other grid areas where the load is concentrated. Therefore, to accommodate the uncertain power generation of large renewable energy sources, it is necessary to reserve a reserve power probability margin for inter-area tie-lines. The simulation results presented in Section 4.2 show the solution of TRPPM of inter-area tie-lines, which was obtained using the inter-area DPEPOPF and its optimization algorithm. To accommodate the intra-area uncertain power generation, it is necessary to reserve a reserve power probability margin for the intra-area tie-lines. The simulation results in Section 4.3 show the solution of TRPPM of intra-area tie-lines, which was obtained using the intra-area DPEPOPF and its optimization algorithm. As the uncertain power generation cannot be predicted in advance, in order to avoid the impact of tie-line congestion on the real-time dispatching and to accommodate uncertain power generation, this study calculated the PDF and CDF of the TRPPM for each tie-line. Thus, the TRPPM is reserved for uncertain power generation with different probabilities. Based on the simulation results presented in Section 4.2 and Section 4.3, the model proposed in this paper and its optimization algorithm can effectively reserve the TRPPM for each tie-line. Based on the comparison of DPEPOPF mathematical model and AC power flow simulation results, the accuracy of the DPEPOPF mathematical model and its optimization algorithm is verified.
5. Conclusions
To avoid tie-line power congestion in the process of accommodating uncertain power generation in PSHPRPSs, this study developed a DPEPOPF. To avoid uncertain power generation affecting the external power grid, this study adopted the principle of area control error accommodation and divides the power grid area according to the properties of the power source. Based on the grid area division, the DPEPOPF was divided into two categories: An inter-area DPEPOPF mathematical model and an intra-area DPEPOPF mathematical model. The mathematical model was solved using the point estimation method of probabilistic optimal power flow, and the mean and standard deviation of TRPPM for each tie-line are obtained. Furthermore, the PDF and CDF of the TRPPM were obtained. To avoid tie-line power congestion, this model can reserve different TRPPM for different uncertain power generation. The simulation results verify the accuracy of the model and effectively avoid power congestion in the tie-line. For day-ahead dispatching with low accuracy requirements, this model significantly improves operation efficiency.
Author Contributions
Conceptualization, Y.C. and Z.G.; methodology, Y.C.; software, Y.C.; validation, Y.C. and Z.G.; formal analysis, A.T.T.; investigation, H.L.; resources, G.W.; data curation, Y.H.; writing—original draft preparation, Y.C.; writing—review and editing, A.T.T.; visualization, Y.H.; supervision, H.L.; project administration, G.W.
Funding
This research was funded in part by the National Natural Science Foundation of China (grant number 51877047).
Conflicts of Interest
The authors declare no conflicts of interest.
Nomenclature
| PSHPRPSs | Power systems with a high proportion of renewable power sources |
| DPEPOPF | Day-ahead prediction error probability optimal power flow |
| TRPPM | Tie-line reserve power probability margin |
| DCS | Dispatch control system |
| AGC | Automatic generation control |
| CDF | Cumulative distribution function |
| Probability density function | |
| IEEE | Institute of Electrical and Electronics Engineers |
| DC | Direct current |
| REI | Radial equivalent independent |
| AC | Alternating current |
| Equivalent bus | |
| Active power of the equivalent bus | |
| Active power of each power source | |
| Power of each load | |
| Total power of tie-line | |
| Power of tth tie-line | |
| Reactance of the tth tie-line | |
| Power variation of equivalent bus | |
| Active power of the equivalent bus | |
| Phase angle variable of the equivalent bus | |
| Calculated value of equivalent bus active power | |
| Admittance between bus i and the zero-potential bus | |
| Conductance between bus i and bus j | |
| Represents the reactance between bus i and bus j | |
| Power margin of inter-area tie-line | |
| Day-ahead power prediction error | |
| Reserve power | |
| Line residual power margin | |
| Reserve power of the ith power grid area | |
| Reserve power function | |
| Accommodation capacity of a type I grid | |
| Accommodation capacity of a type III grid | |
| Uncertain power generation of the ith regional power grid | |
| Standard location coefficient | |
| Central moments | |
| Mean | |
| Standard deviation | |
| PDF of the power grid area uncertainty power generation | |
| Power prediction error of uncertainty power source | |
| Inter-area tie-line residual power margin | |
| Intra-area uncertain generating power | |
| Total reserve power | |
| Percentage error of the simulation result | |
| Simulation result of the AC power flow model | |
| Simulation result of the DPEPOPF mathematical model | |
| Average percentage error |
Appendix A
Appendix A presents the numerical characteristics of uncertain power source prediction errors for the modified IEEE 118 bus test system (see Section 4.1 for details).
Table A1.
Numerical characteristics of uncertain power source prediction errors for the modified IEEE 118 bus test system.
Appendix B
Appendix B presents the simulation results of the modified IEEE 118 bus test system intra-area TRPPM (see Section 4.3 for details).
Table A2.
Numerical characteristics of the TRPPM in area 1.
Table A3.
Numerical characteristics of the TRPPM in area 2.
Table A4.
Numerical characteristics of the TRPPM in area 3.
References
- Wang, Z.; Guo, Z. On Critical Timescale of Real-Time Power Balancing in Power Systems with Intermittent Power Sources. Electr. Power Syst. Res. 2018, 155, 246–253. [Google Scholar] [CrossRef] [Scilit]
- Zhang, B.; Wu, W.; Zheng, T.; Sun, H. Design of a Multi-Time Scale Coordinated Active Power Dispatching System for Accommodating Large Scale Wind Power Penetration. Autom. Electr. Power Syst. 2011, 35, 1–6. [Google Scholar]
- Zhai, J.; Ren, J.; Zhou, M.; Li, Z. Multi-Time Scale Fuzzy Chance Constrained Dynamic Economic Dispstch Model for Power System with Wind Power. Power Syst. Technol. 2016, 40, 1094–1099. [Google Scholar]
- Shang, J. Coordination Model and Algorithm of Energy-Saving Power Generation Dispatching Based on Time Scale. Power Syst. Technol. 2008, 32, 56–61. [Google Scholar]
- Happ, H.H. Optimal Power Dispatch-A Comprehensive Survey. IEEE Trans. Appar. Syst. 1977, 96, 841–854. [Google Scholar] [CrossRef] [Scilit]
- Wang, K.; Zhang, B.; Yan, D.; Li, Y.; Luo, T. A Multi-Time Scale Rolling Coordination Scheduling Method for Power Grid Integrated with Large Scale Wind Farm. Power Syst. Technol. 2014, 38, 2434–2440. [Google Scholar]
- Liu, C.; Chao, Q.; Wei, L. Wind-Storage Coupling Based on Actual Data and Fuzzy Control in Multiple Time Scales for Real-Time Rolling Smoothing of Fluctuation. Electr. Power Autom. Equip. 2015, 35, 35–41. [Google Scholar]
- Wang, H.; He, C.; Fang, G.; Fu, L. A Gradual Optimization Model of Dispatching Schedule Taking Account of Wind Power Prediction Error Bands. Autom. Electr. Power Syst. 2011, 35, 131–135. [Google Scholar]
- Cheng, C.; Li, G.; Cheng, X.; Shen, J.; Lu, J. Large-Scale Ultra Voltage Direct Current Hydropower Absorption and Its Experiences. Proc. CSEE 2015, 35, 549–560. [Google Scholar]
- Huang, C.; Ding, J.; Tian, G.; Tang, H. Hydropower Operation Modes of Large-Scale Wind Power Grid Integration. Autom. Electr. Power Syst. 2011, 35, 37–40. [Google Scholar]
- Zhang, G.; Zhang, B. Optimal Power Flow Approach Consider Secondary Reserve Demand with Wind Power Integration. Autom. Electr. Power Syst. 2009, 33, 25–28. [Google Scholar]
- Liu, J.; Yu, J.; Liu, Z. An Intelligent Optimal Dispatch Strategy for Spinning Reserve Coping with Wind Intermittent Disturbance. Proc. CSEE 2013, 33, 163–170. [Google Scholar]
- Qadrdan, M.; Wu, J.; Jenkins, N.; Ekanayake, J. Operating Strategies for a GB Integrated Gas and Electricity Network Considering the Uncertainty in Wind Power Forecasts. IEEE Trans. Sustain. Energy 2014, 5, 128–138. [Google Scholar] [CrossRef] [Scilit]
- Dai, X.; Deng, Z.; Liu, G.; Tang, X.; Zhang, F.; Deng, Z. Review on Advanced Flywheel Energy Storage System with Large Scale. Trans. China Electrotech. Soc. 2011, 26, 133–140. [Google Scholar]
- Hou, Y.; Jiang, X.; Jiang, J. SMES Based Unified Power Quality Conditioner and Control Strategy. Autom. Electr. Power Syst. 2003, 27, 49–53. [Google Scholar]
- Huang, X.; Zhang, L.; Zheng, Q.; Alfred, R. Optimization Design of Electricity Saving Device in Hybrid Energy Storage System Based on Compressed Air and Supercapacitors. J. Power Supply 2013, 50, 72–78. [Google Scholar]
- Yang, N.; Wang, B.; Liu, D.; Zhao, J.; Wang, H. An Integrated Supply-Demand Stochastic Optimization Method Considering Large-Scale Wind Power and Flexible Load. Proc. CSEE 2013, 33, 63–69. [Google Scholar]
- Wang, B.; Liu, X.; Li, Y. Day-Ahead Generation Scheduling and Operation Simulation Considering Demand Response in Large-Capacity Wind Power Integrated Systems. Proc. CSEE 2013, 33, 35–44. [Google Scholar]
- Yu, D.; Song, S.; Zhang, B.; Han, X. Synergistic Dispatch of PEVs Charging and Wind Power in Chinese Regional Power Grids. Autom. Electr. Power Syst. 2011, 35, 24–29. [Google Scholar]
- Xiao, X.; Chen, Z.; Liu, N. Integrated Mode and Key Issues of Renewable Energy Sources and Electric Vehicles’ Charging and Discharging Facilities in Microgrid. Trans. China Electrotech. Soc. 2013, 28, 1–14. [Google Scholar]
- Dong, Z.; Yang, D.; Reindl, T.; Walsh, W.M. Satellite Image Analysis and a Hybrid ESSS/ANN Model to Forecast Solar Irradiance in the Tropics. Energy Convers. Manag. 2014, 79, 66–73. [Google Scholar] [CrossRef] [Scilit]
- Ding, M.; Yang, R. Research on Short-Term Prediction of PV Output Power Based on Weather Forecast. Renew. Energy Resour. 2014, 32, 385–391. [Google Scholar]
- Dong, Y.; Guo, H.; Wu, S.; Wang, Z.; Ming, F.A.N. Model Prediction Tree for Forecasting Photovoltaic Power Generation. Renew. Energy Resour. 2014, 32, 253–258. [Google Scholar]
- Yang, X.; Xiao, Y.; Chen, S. Wind Speed and Generated Power Forecasting Wind Farm. Proc. CSEE 2005, 25, 1–5. [Google Scholar]
- Wang, S.; Yu, J. Joint Conditions Probability Forecast Method for Wind Speed and Wind Power. Proc. CSEE 2011, 31, 7–15. [Google Scholar]
- Elena Dragomir, O.; Dragomir, F.; Stefan, V.; Minca, E. Adaptive Neuro-Fuzzy Inference Systems as a Strategy for Predicting and Controling the Energy Produced from Renewable Sources. Energies 2015, 8, 13047–13061. [Google Scholar] [CrossRef] [Scilit]
- Monteiro, C.; Santos, T.; Fernandez-Jimenez, L.A.; Ramirez-Rosado, I.J.; Terreros-Olarte, M.S. Short-Term Power Forecasting Model for Photovoltaic Plants Based on Historical Similarity. Energies 2013, 6, 2624–2643. [Google Scholar] [CrossRef] [Scilit]
- Niya, C.; Zheng, Q.; Ian, T.N. Wind Power Forecasts Using Gaussian Processes and Numerical Weather Prediction. IEEE Trans. Power Syst. 2014, 29, 656–665. [Google Scholar]
- Wang, F.; Mi, Z.; Su, S.; Zhao, H. Short-Term Solar Irradiance Forecasting Model Based on Artificial Neural Network Using Statistical Feature Parameters. Energies 2012, 5, 1355–1370. [Google Scholar] [CrossRef] [Scilit]
- Das, U.K.; Tey, K.S.; Seyedmahmoudian, M.; Idna Idris, M.Y.; Mekhilef, S.; Horan, B.; Stojcevski, A. SVR-Based Model to Forecast PV Power Generation under Different Weather Conditions. Energies 2017, 10, 876. [Google Scholar] [CrossRef] [Scilit]
- Dong, J.; Yang, P.; Nie, S. Day-Ahead Scheduling Model of the Distributed Small Hydro-Wind-Energy Storage Power System Based on Two-Stage Stochastic Robust Optimization. Sustainability 2019, 11, 2829. [Google Scholar] [CrossRef] [Scilit]
- Papari, B.; Edrington, C.S.; Bhattacharya, I.; Rudman, G. Effective Energy Management of Hybrid AC-DC Microgrids with Storage Devices. IEEE Trans. Smart Grid 2019, 10, 193–203. [Google Scholar] [CrossRef] [Scilit]
- Zhu, J.; Liu, Q.; Xiong, X.; Ouyang, J.; Xuan, P.; Xie, P.; Zou, J. Multi-time-scale robust economic dispatching method for the power system with clean energy. J. Eng. 2019, 2019, 1377–1381. [Google Scholar] [CrossRef] [Scilit]
- Papari, B.; Edrington, C.S.; Kavousi-Fard, F. An Effective Fuzzy Feature Selection and Prediction Method for Modeling Tidal Current: A Case of Persian Gulf. IEEE Trans. Geosci. Remote Sens. 2017, 55, 4956–4961. [Google Scholar] [CrossRef] [Scilit]
- Jabr, R.A.; Pal, B.C. Intermittent wind generation in optimal power flow dispatching. IET Gener. Transm. Distrib. 2009, 3, 66–74. [Google Scholar] [CrossRef] [Scilit]
- Wang, Z.; Bian, Q.; Xin, H.; Gan, D. A Distributionally Robust Co-Ordinated Reserve Scheduling Model Considering CVaR-Based Wind Power Reserve Requirements. IEEE Trans. Sustain. Energy 2016, 7, 625–636. [Google Scholar] [CrossRef] [Scilit]
- Xu, Y.; Hu, Q.; Li, F. Probabilistic Model of Payment Cost Minimization Considering Wind Power and Its Uncertainty. IEEE Trans. Sustain. Energy 2013, 4, 716–724. [Google Scholar] [CrossRef] [Scilit]
- Dobson, I.; Greene, S.; Rajaraman, R.; DeMarco, C.L.; Alvarado, F.L.; Glavic, M.; Zhang, J.; Zimmerman, R. Electric Power Transfer Capability: Concepts, Applications, Sensitivity and Uncertainty; PSERC Publication: Tempe, AZ, USA, 2001; pp. 1–34. [Google Scholar]
- Zhizhong, G. Power Network Analytic Wheel; Science Press: Beijing, China, 2008; pp. 262–279. [Google Scholar]
- Liu, B.; Zhou, J.; Zhou, H.; Liu, K. An Improved Model for Wind Power Forecast Error Distribution. East China Electr. Power 2012, 40, 286–291. [Google Scholar]
- Nan, X.; Li, Q. Energy Storage Power and Capacity Allocation Based on Wind Power Forecasting Error Distribution. Electr. Power Autom. Equip. 2013, 33, 117–122. [Google Scholar]
- Aidan, T.; Eleanor, D.; Mark, O. Rolling Unit Commitment for Systems with Significant Installed Wind Capacity. In Proceedings of the 2007 IEEE Lausanne Power Tech, Lausanne, Switzerland, 1–5 July 2007. [Google Scholar]
- Makarov, Y.V.; Etingov, P.V.; Ma, J.; Huang, Z.; Subbarao, K. Incorporating Uncertainty of Wind Power Generation Forecast into Power System Operation, Dispatch, and Unit Commitment Procedures. IEEE Trans. Sustain. Energy 2011, 2, 433–442. [Google Scholar] [CrossRef] [Scilit]
- Pappala, V.S.; Erlich, I.; Rohrig, K.; Dobschinski, J. A Stochastic Model for the Optimal Operation of a Wind-Thermal Power System. IEEE Trans. Power Syst. 2009, 24, 940–950. [Google Scholar] [CrossRef] [Scilit]
- Tewari, S.; Geyer, C.J.; Mohan, N. A Statistical Model for Wind Power Forecast Error and its Application to the Estimation of Penalties in Liberalized Markets. IEEE Trans. Power Syst. 2011, 26, 2031–2039. [Google Scholar] [CrossRef] [Scilit]
- Morales, J.M.; Perez-Ruiz, J. Point Estimate Schemes to Solve the Probabilistic Power Flow. IEEE Trans. Power Syst. 2007, 22, 1594–1601. [Google Scholar] [CrossRef] [Scilit]
- Wang, J.; Shahidehpour, M.; Li, Z. Security-Constrained Unit Commitment with Volatile Wind Power Generation. IEEE Trans. Power Syst. 2008, 23, 1319–1327. [Google Scholar] [CrossRef] [Scilit]
- Pei, Z.; Lee, S.T. Probabilistic load flow computation using the method of combined cumulants and Gram-Charlier expansion. IEEE Trans. Power Syst. 2004, 19, 676–682. [Google Scholar]

© 2019 by the authors. Licensee MDPI, Basel, Switzerland. This article is an open access article distributed under the terms and conditions of the Creative Commons Attribution (CC BY) license (http://creativecommons.org/licenses/by/4.0/).