Article

A Study on Energy-Saving Technologies Optimization towards Nearly Zero Energy Educational Buildings in Four Major Climatic Regions of China

Tianjin Key Lab of Indoor Air Environmental Quality Control, School of Environmental Science and Engineering, Tianjin University, Tianjin 300350, China
*
Author to whom correspondence should be addressed.
Energies 2019, 12(24), 4734; https://doi.org/10.3390/en12244734
Submission received: 12 November 2019 / Revised: 10 December 2019 / Accepted: 10 December 2019 / Published: 12 December 2019
(This article belongs to the Special Issue Low and Zero Energy Highly Performing Buildings)

Abstract

:
An educational building is a kind of public building with a high density of occupants and high energy consumption. Energy-saving technology utilization is an effective measure to achieve high-performance buildings. However, numerous studies are greatly limited to practical application due to their strong regional pertinence and technical simplicity. This paper aims to further optimize various commonly used technologies on the basis of the current national standards, and to individually establish four recommended technology selection systems corresponding to four major climatic regions for realizing nearly zero energy educational buildings (nZEEBs) in China. An educational building was selected as the case study. An evaluation index of energy-saving contribution rate (ECR) was proposed for measuring the energy efficiency of each technology. Thereafter, high energy efficiency technologies were selected and implemented together in the four basic cases representing different climatic regions. The results showed that the total energy-saving rate in severe cold regions increased by 70.74% compared with current national standards, and about 60% of the total energy-saving rate can be improved in cold regions. However, to realize nZEEBs in hot summer and cold winter regions as well as in hot summer and warm winter regions, photovoltaic (PV) technology needs to be further supplemented.

1. Introduction

Building energy consumption accounts for almost 40% of the primary energy in the United States or Europe, and nearly 30% in China [1,2,3]. To reduce the consumption of building primary energy and achieve sustainable development, many countries, organizations, and associations have successively formulated plenty of energy-saving politics and goals. In the United States, new building energy codes released by the energy department in 2016 promote more than 30% energy savings compared to the codes from a decade ago [4,5]. The European Union updated the “Energy Efficiency Guidelines for Buildings” (EPBD) in 2010, requiring all new buildings to meet “nearly zero” energy requirements after 31 December 2018 [6]. Sweden set a target to achieve 20% and 50% of building energy savings by 2020 and 2050, respectively, compared with 1995 levels [7]. The Belgian regions are (considering) raising energy performance levels (and the current implementation of EPBD) to “low energy” or “near zero energy” levels [8]. The Danish Building Regulations (BR) has set a goal of saving 25% of the energy use by 2010, 50% by 2015, and 75% by 2020 for all new buildings compared with 2006 standard levels [9].
To achieve these goals of very low or nearly zero energy consumption in the building section, an innovative concept of nearly zero energy buildings (nZEBs) representing high-performance buildings was proposed [9,10]. The nZEB refers to the low energy consumption of buildings by adopting energy-saving technologies or renewable energy measures [11,12]. A great number of studies have been conducted on energy-saving technologies. The building envelope is in direct contact with the external environment. Ascione et al. [13] found that the heat losses through the external envelope account for approximately 70% of the overall heat losses in buildings. Therefore, improving the performance of the building envelope is significant to optimize the building energy-saving design. Wang et al. [14] discussed the influence of external walls and roofs with different heat transfer coefficient (U-value) on building energy consumption, and found that appropriate improvement of envelope performance had significant energy-saving effect on building energy conservation. Touloupaki et al. [15] optimized the insulation thickness of the external envelope to determine the optimal insulation thickness by measuring the primary energy demand and cost of the building, and they found that the U-value of the building elements decrease and cause highest energy savings (75%) before 11–15 cm of insulation. Windows are a special kind of component whose overall U-value is normally five times greater than that of other components of a building’s envelope, and responsible for as much as 60% of the total energy consumption of a building [16]. Alam et al. [17] have pointed out that, nowadays, it is possible to reduce energy consumption of the window by using high-performance windows and glazing systems, such as double or triple glazing, insulating gas sandwiched between panes, etc. Hassouneh et al. [18] studied eight types of glass and found the most suitable type of glass for each direction. Through a case study, they showed that energy-saving windows can save more energy and reduce heating load in winter. Besides, Kirimtat et al. [19] thought shading system of the window is one of the most common strategies to improve facade performance for designers, and adjustable shading devices are a common choice for low energy consumption buildings [20]. Palmero-Marrero et al. [21] investigated the effect of louver shading devices applied to different facades of a building, and the results showed that a large amount of energy can be saved by using louver shading devices. Liu et al. [22] surveyed different shading panel configurations, including length, number, and angle, for typical public rental housing buildings in Hong Kong. The results showed an energy-saving potential up to 8.0% when shading panels are applied to flats with westward-facing facades. Gago et al. [23] found the electricity consumption of lighting and cooling in the European Union can be greatly reduced by appropriate lighting control measure. Boyano et al. [24] found that installing partial or total lighting control to reduce the equivalent operating time can result in total energy savings of up to 18% (for partial lighting control) or 36% (for total lighting control). Nowadays, with the improvement of air tightness of the room, the amount of infiltration air through the building decreases. Therefore, the demand for introducing outdoor fresh air into the room by mechanical means increases. The ventilation load accounts for 20–50% of heating demand in new and refurbished buildings [25,26,27,28,29]. To reduce the energy consumption of fresh air treatment, more and more buildings in China use air heat exchangers [30]. Roulet et al. [26] addressed real energy recovery with air handling units from a theoretical point of view and presented results of measurements on 13 units and Kang et al. [31] analyzed the applicability of heat recovery ventilators in supermarkets of the four climate zones, and the results showed that the latent heat recovery is not suitable for ventilation energy savings in all the four climate zones. In addition, Dell’Osso et al. [32] also studied natural ventilation as a low-cost passive strategy which realizes the exchange of indoor and outdoor air by pressure or temperature differences to achieve thermal comfort and energy savings. Renewable energy plays a crucial role for nZEBs, which can be used to minimize the primary energy consumption or offset the remaining energy needs [33,34]. Concentrated solar photovoltaic (PV) and enhanced geothermal energy are regarded as renewable technologies with high potential as suitable substitutes for fossil fuels [35]. Good et al. [36] studied different solar energy solutions for a Norwegian residential building and compared separate PV, solar thermal systems, and hybrid photovoltaic–thermal systems. The results showed that the building with only high-efficiency PV modules comes closest to reaching a zero energy balance. Wu et al. [37] found that ground source heat pump (GSHP) used less energy than the air source heat pump (ASHP) in 11 out of 15 zones across the United States, particularly in cold climate zones like Chicago through Duluth, where savings ranged from 24.3% to 39.2%.
The application of various energy-saving technologies to building is not a process of blind selection. To achieve efficient energy savings, the study on the optimization design of single technology is indispensable. Ascione et al. [38] analyzed the effects of earth-to-air heat exchanger with different design air flow rate for nZEB in Mediterranean climate, and concluded that earth-to-air heat exchanger with the maximum air flow rate in summer and minimum air flow rate in winter can realize the best energy-saving effect. Raji et al. [39] optimized the envelope design solutions for office buildings in temperate climate. The results showed that about 42% energy can be saved by the office building designed with high-performance envelope. In addition, the optimization on high-performance office building facades also has been done by Pikas et al. [40] and Wang et al. [14], and their research results all indicated that the high-performance envelope has an important contribution to building energy conservation. Through dynamic monitoring, Rey-Hernandez et al. [41] analyzed the role of renewable energy (photovoltaic system, earth-to-air heat exchanger, biomass boiler) in buildings and the applicability of these energy efficiency policies in the construction of nZEBs. In the same year, Rey-Hernandez et al. [42] used DesignBuilder to analyze and design solar photovoltaic systems, biomass and earth–air heat exchanger to meet the needs of electricity, cooling and heating, so as to achieve nZEB energy balance. Fernández Hernánde et al. [43] discussed how to achieve a good balance of daylight, energy consumption, and comfort by adopting proper types of windows, shading, and lighting controls.
Most technical optimization research on nZEB is based on case studies. Some case studies on nZEB in recent years are summarized in Table 1. It shows quite a few studies examining residential and office buildings, while there is little research on nZEB concerning educational buildings. Therefore, it is urgent to explore the optimization design scheme of various energy-saving technologies for nearly zero energy educational buildings (nZEEBs). Moreover, regarding the relevant literature, these studies tend to focus on a certain type of energy-saving technology or be combined with several technologies to realize nZEBs, and most of them only analyzed within a single climatic region, which limits the practical application of the obtained conclusions. The definition of nZEB is mainly related to energy saving [5]. Therefore, this paper aims to optimize the design of various energy-saving technologies based on the current national standards under the consideration of appropriate indoor comfort range and mainly from the perspective of energy saving, and to establish four recommended technology selection systems corresponding to four major climatic regions, respectively, to achieve the goal of nZEEB. An educational building was selected as the case study to optimize the various technologies in four major climatic regions in China. The paper is organized as follows. In Section 2.1, the case study model was established and validated, and the energy consumption of the base case under four climatic regions was given. The evaluation index is introduced in Section 2.2. The optimization process, results and the establishment of the recommended technology selection system for each climatic region are described in Section 3. The evaluation of various energy-saving technologies is discussed in Section 4. Conclusions are summarized in Section 5.

2. Methodology

A design strategy for nZEBs is to apply energy efficiency measures to minimize energy consumption in buildings and adopt renewable energy and other technologies to meet the remaining energy needs [11,33]. This paper further optimized various universal energy-saving technologies on the basis of the existing national building energy conservation design standards, and aims to give the recommended technology and technical parameters for realizing nZEEBs in China. Combined with the study case of an educational building, three passive technologies including high-performance enclosure structure, shading, and natural ventilation; active technologies involving light control and air-to-air heat recovery; and renewable technology of ground source heat pump (GSHP) were firstly optimized one by one to minimize the energy consumption. An evaluation index of the energy-saving contribution rate (ECR) is proposed to measure the energy efficiency of different technologies. The total energy-saving rate can then be obtained by jointly implementing the technologies with high energy efficiency in one case building, so as to judge whether the nZEB level has been reached. If not, PV technology will be further considered to compensate for the remaining energy needs. Finally, four recommended technology selection systems individually corresponding to four typical climatic regions were established for realizing nZEEB in China.

2.1. Case Study

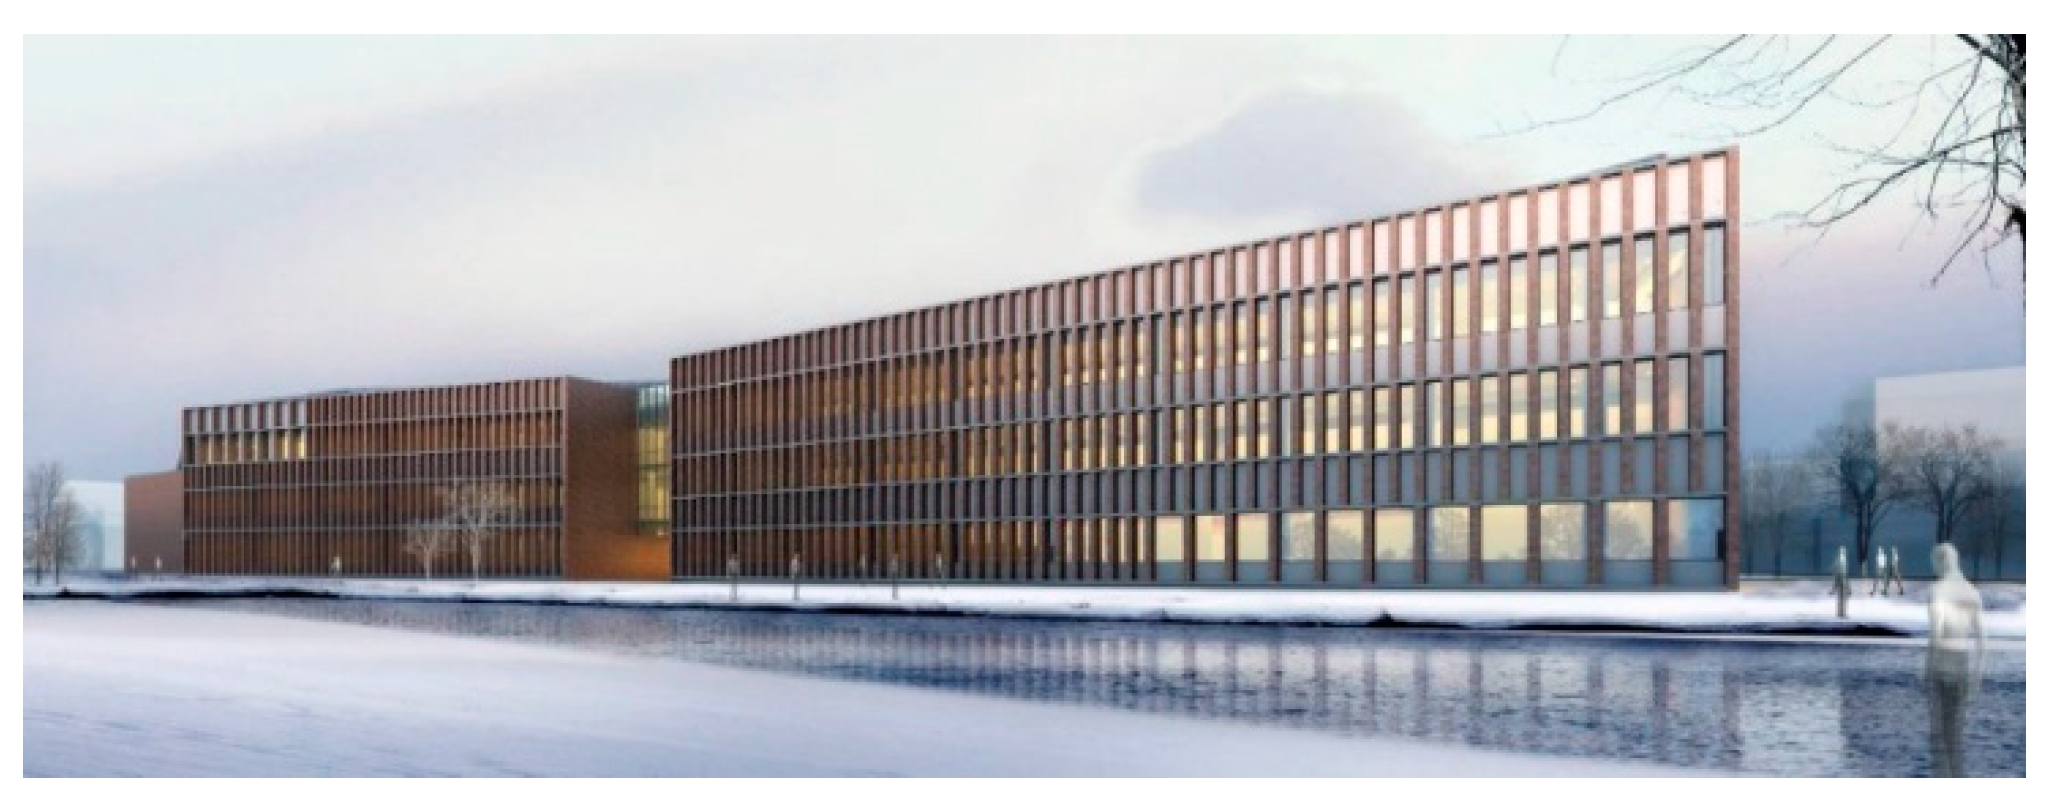
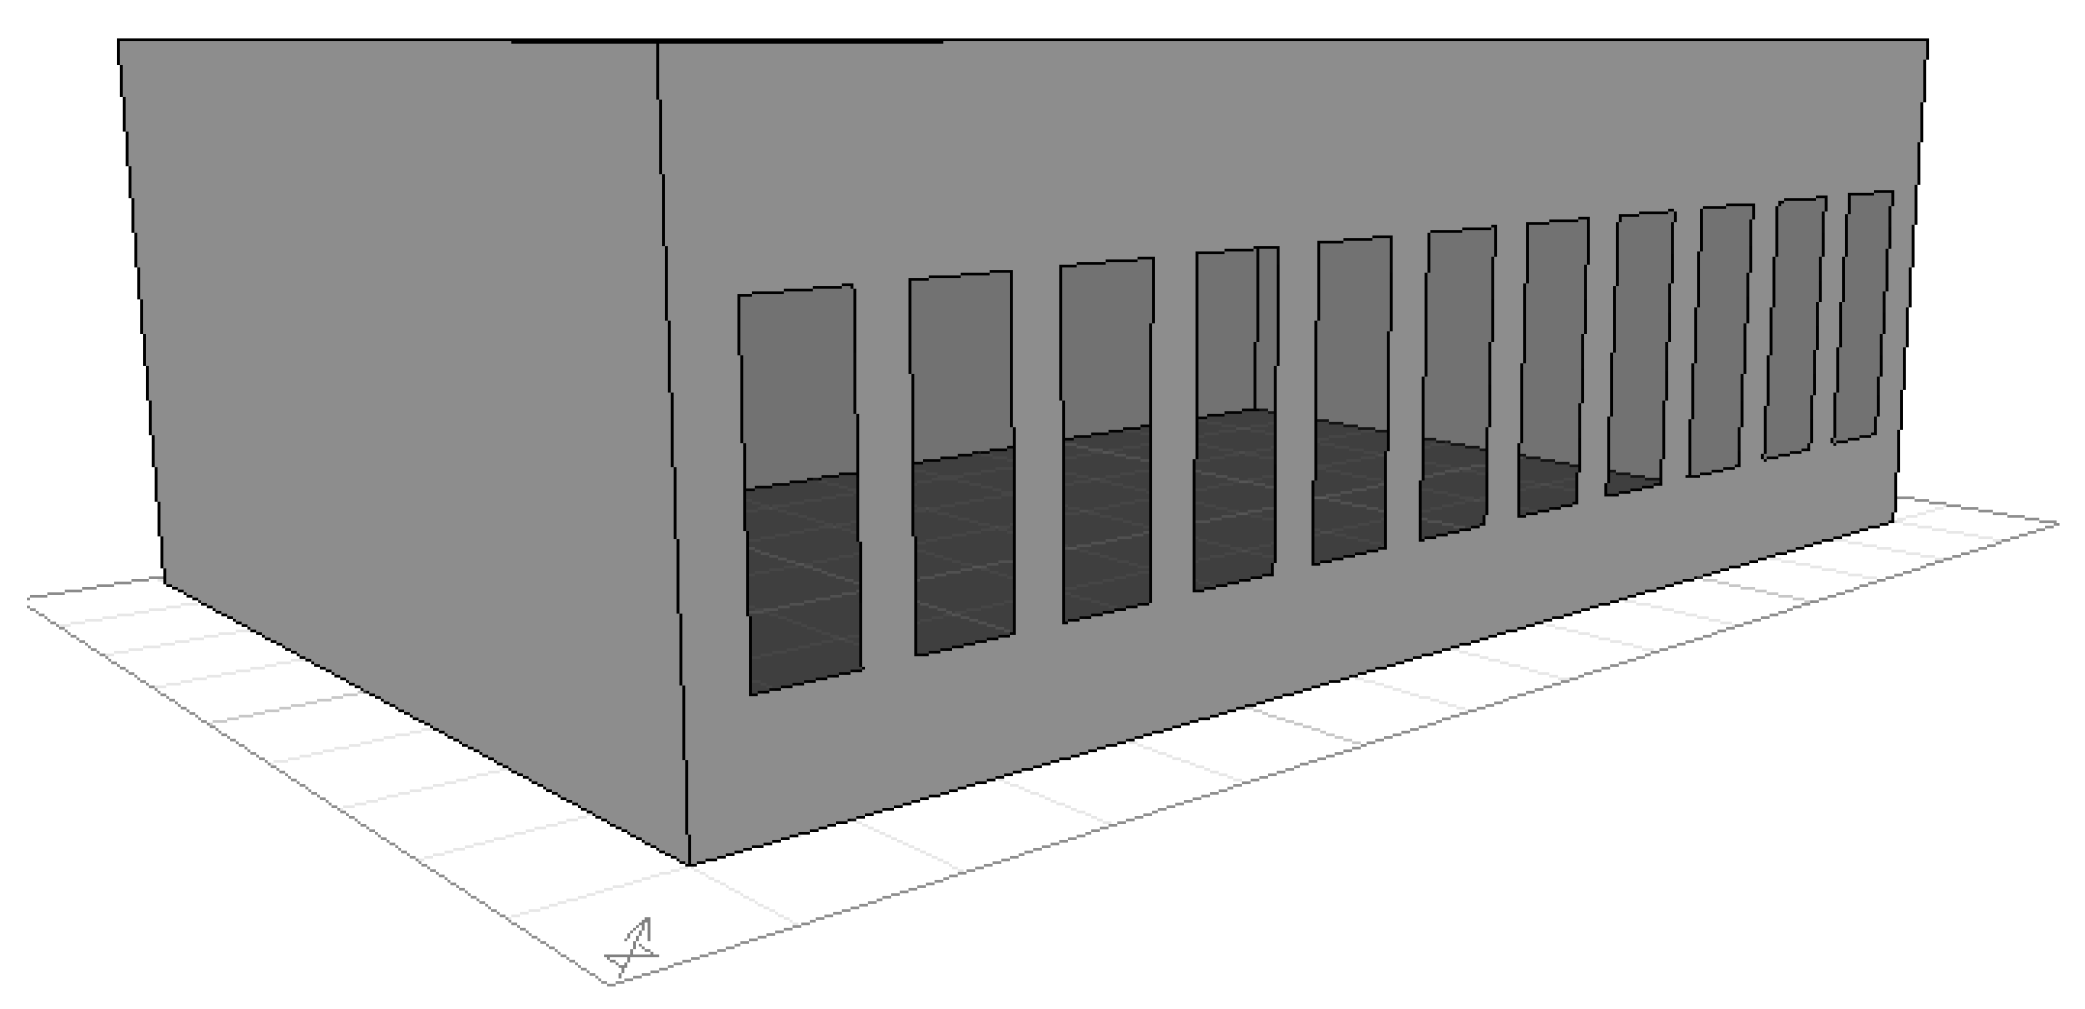
2.1.1. Building Description

A three-star green educational building is located at Tianjin University in China. Its main functional area is 35 classrooms without laboratories, and was selected as the case study, as shown in Figure 1. The entire building is divided into two parts: north and south. There are three floors in the south, each 4.5 m high, and two floors in the north, each 6.75 m high. The two parts are connected by a split-level connection. The total area of the building is 11,048 m2, and the S/V (surface to volume) ratio is 0.18 m−1.
The exterior wall adopts aerated concrete block and rock wool is used as the exterior insulation material, the roof is installed with expanded polystyrene board (EPS) as the exterior insulation material, the window glazing type is 6 mm + 12 mm Air + 6 mm low emissivity (6 + 12A + 6 Low-E) insulating glass. The WWRs of east, west, south and north are 0.13, 0.15, 0.34, and 0.43, respectively. The energy of heating and cooling is supplied by the campus energy station and the heating and cooling source is GSHP, with a cooling performance coefficient of 5.1 and a heating performance coefficient of 4.6. The room thermostat setpoint temperature was 26 °C in summer (June 1 to September 30) and 20 °C in winter (November 15 to March 15). More detailed building information, including indoor design parameters and component parameters, is shown in Table 2 and Table 3. The building was mainly occupied from 7:00 to 18:00. In order to obtain the realistic operation conditions of the building, the density of occupants, office equipment, and lighting were collected, as shown in Table 4.

2.1.2. Model Development and Verification

Due to the long development history supported by DOE, EnergyPlus has gained global acceptance by engineers and researchers [49]. The biggest drawback is that EnergyPlus is a parametric interface with poor visualization. DesignBuilder (DB) is one of the most comprehensive user interfaces for the EnergyPlus dynamic thermal simulation engine [45] and can provide detailed building energy performance information. The modeling process in DB follows a block made up of zones and zones made up of sites. Input parameters involve building information, air conditioning system information, usage information (Section 2.1.1), and typical meteorological year weather data. The model of the case study was established in DB, as shown in Figure 2.
Model verification is an essential link to ensure the model built is proper and the further simulation results are credible. Parameters for model validation can be energy consumption, indoor temperature, cooling or heating load, etc. Hourly, daily, or monthly data can be used for model verification [45,50,51]. ANSI/ASHRAE Standard 14-2014 [52] is widely accepted to evaluate the accuracy of modeling, in which normalized mean bias error (NMBE) and coefficient of variation of the root mean square error (CVRMSE) are introduced. Detailed expressions are presented as Equations (1) and (2) [52]. ASHRAE Guideline 14-2014 suggests that models are declared to be reliable if the NMBE is within 10% and CVRMSE is within 30% when using hourly data, and they are 5% and 15% respectively with monthly data [52].
N M B E = 100 × i = 1 n ( E s i E m i ) ( n p ) × E m ¯
C V R M S E = 100 × [ ( E s i E m i ) 2 / ( n p ) ] 1 2 E m ¯
where E s i is the simulated data; E m i is the measured data, E m ¯ is the average value of measured data; n is the number of days in this paper; p = 1.
Since there is no real-time recording and storage function for the onsite electricity meter, the data of model verification are recorded by the author in the field. The collected data were daily electricity energy consumption, including lighting, office equipment, and HVAC (heating or cooling), for seven days in winter (18–22, 26, and 27 December 2018) and four days in summer (26–29 June 2018). The actual building energy consumption data and the simulation data from DB are compared, as shown in Figure 3. Based on Equations (1) and (2), the NMBE and CVRMSE are 3.5% (<5%) and 9.5% (<15%), respectively. Therefore, it is more reasonable to firmly believe that the model established in DB is in good agreement with the actual building.

2.1.3. Base Models in Four Cities

There are five climatic regions in China: severe cold (SC), cold climate (CC), hot summer and cold winter (HS/CW), hot summer and warm winter (HS/WW), and mild climate (MC). The climate characteristics are given in Table 5. The average annual air temperature in MC region is relatively suitable and stable, and the demand for air conditioning is relatively small. Therefore, MC region is not considered in this paper. Harbin, Tianjin, Shanghai, and Guangzhou were chosen to represent SC, CC, HS/CW, and HS/WW regions, respectively. The design parameters of the base model under four climatic regions are consistent with current national energy-saving design standards [53,54,55] as shown in Table 6. The density of occupant, equipment, and lighting reflects the actual operation of educational building. The parameter settings are given in Table 4.
Building total energy simulation results include HVAC (heating and cooling) energy consumption, lighting, and office equipment energy consumption. According to some studies [56,57], the coefficient of conversion of electricity energy into primary energy is 0.36, and the coefficient of conversion of gas into primary energy is 1. Figure 4a shows the monthly total primary energy consumption, including the primary energy consumption of HVAC, lighting, and office equipment; Figure 4b shows the monthly primary energy consumption of HVAC in cooling season and Figure 4c shows the monthly primary energy consumption of HVAC in heating season. The cooling primary energy consumption of HVAC in Guangzhou and Shanghai is greater than that of Harbin and Tianjin, and the large cooling energy consumption of HVAC was generated in June for the four cities (Figure 4b). In Harbin and Tianjin, the heating primary energy consumption of HVAC dominates the total energy consumption, and the peak of heating energy consumption of HVAC appears in December (Figure 4c). Due to summer and winter vacation for educational buildings, the energy consumption of educational buildings in August and February is relatively lower. The total primary energy consumption in four climatic cities is 180, 133, 117, and 169 kWh/(m2·a). The primary energy consumption requirements of non-residential buildings with near-zero energy consumption in EU countries are within the range of 0–270 kWh/(m2·a) [58]. In Denmark’s “Building Regulations 2020”, the energy demand of low-energy buildings is stipulated to be less than 25 kWh/(m2·a) [59], although the primary energy consumption per unit area of the four typical climatic buildings are all in the range of 0–270 kWh/(m2·a), due to the energy use habits between different countries, climate characteristics, and the unique operation cycle of the educational building itself. Therefore, targeted energy-saving solutions should be studied and discussed.

2.2. Evaluation Index and Weight Calculation Method

ECR is proposed as an index for quantitative analysis of energy efficiency of energy-saving technology. It is defined as the ratio of the reduction or increase of primary energy consumption to the primary energy consumption of the base case. The detailed expression of ECR is shown as Equation (3).
E C R = Q 0 Q n Q 0
where E C R is energy-saving contribution rate, Q n represents the building primary energy consumption after the technology is used (kWh/(m2·a)), and Q 0 is the building primary energy consumption of benchmark building, which is designed in accordance with national design standards (kWh/(m2·a)).
Weight reflects the relative importance between different factors. In practical application, the method of ignoring low-weight influencing factors is often adopted, which not only ensures little influence on the final conclusion, but also simplifies the problem handling or brings convenience. Based on the weight of the ECR, the recommended selection techniques for each of the four climate regions can be determined. The mathematical formula of weight is shown as Equation (4).
E C R i * = E C R i i = 1 n E C R i
where E C R i is the ECR of each technology; E C R i * is the weight of each technology; n is equal to 6 in this paper.

3. Analysis and Results

3.1. Passive Energy-Saving Technologies

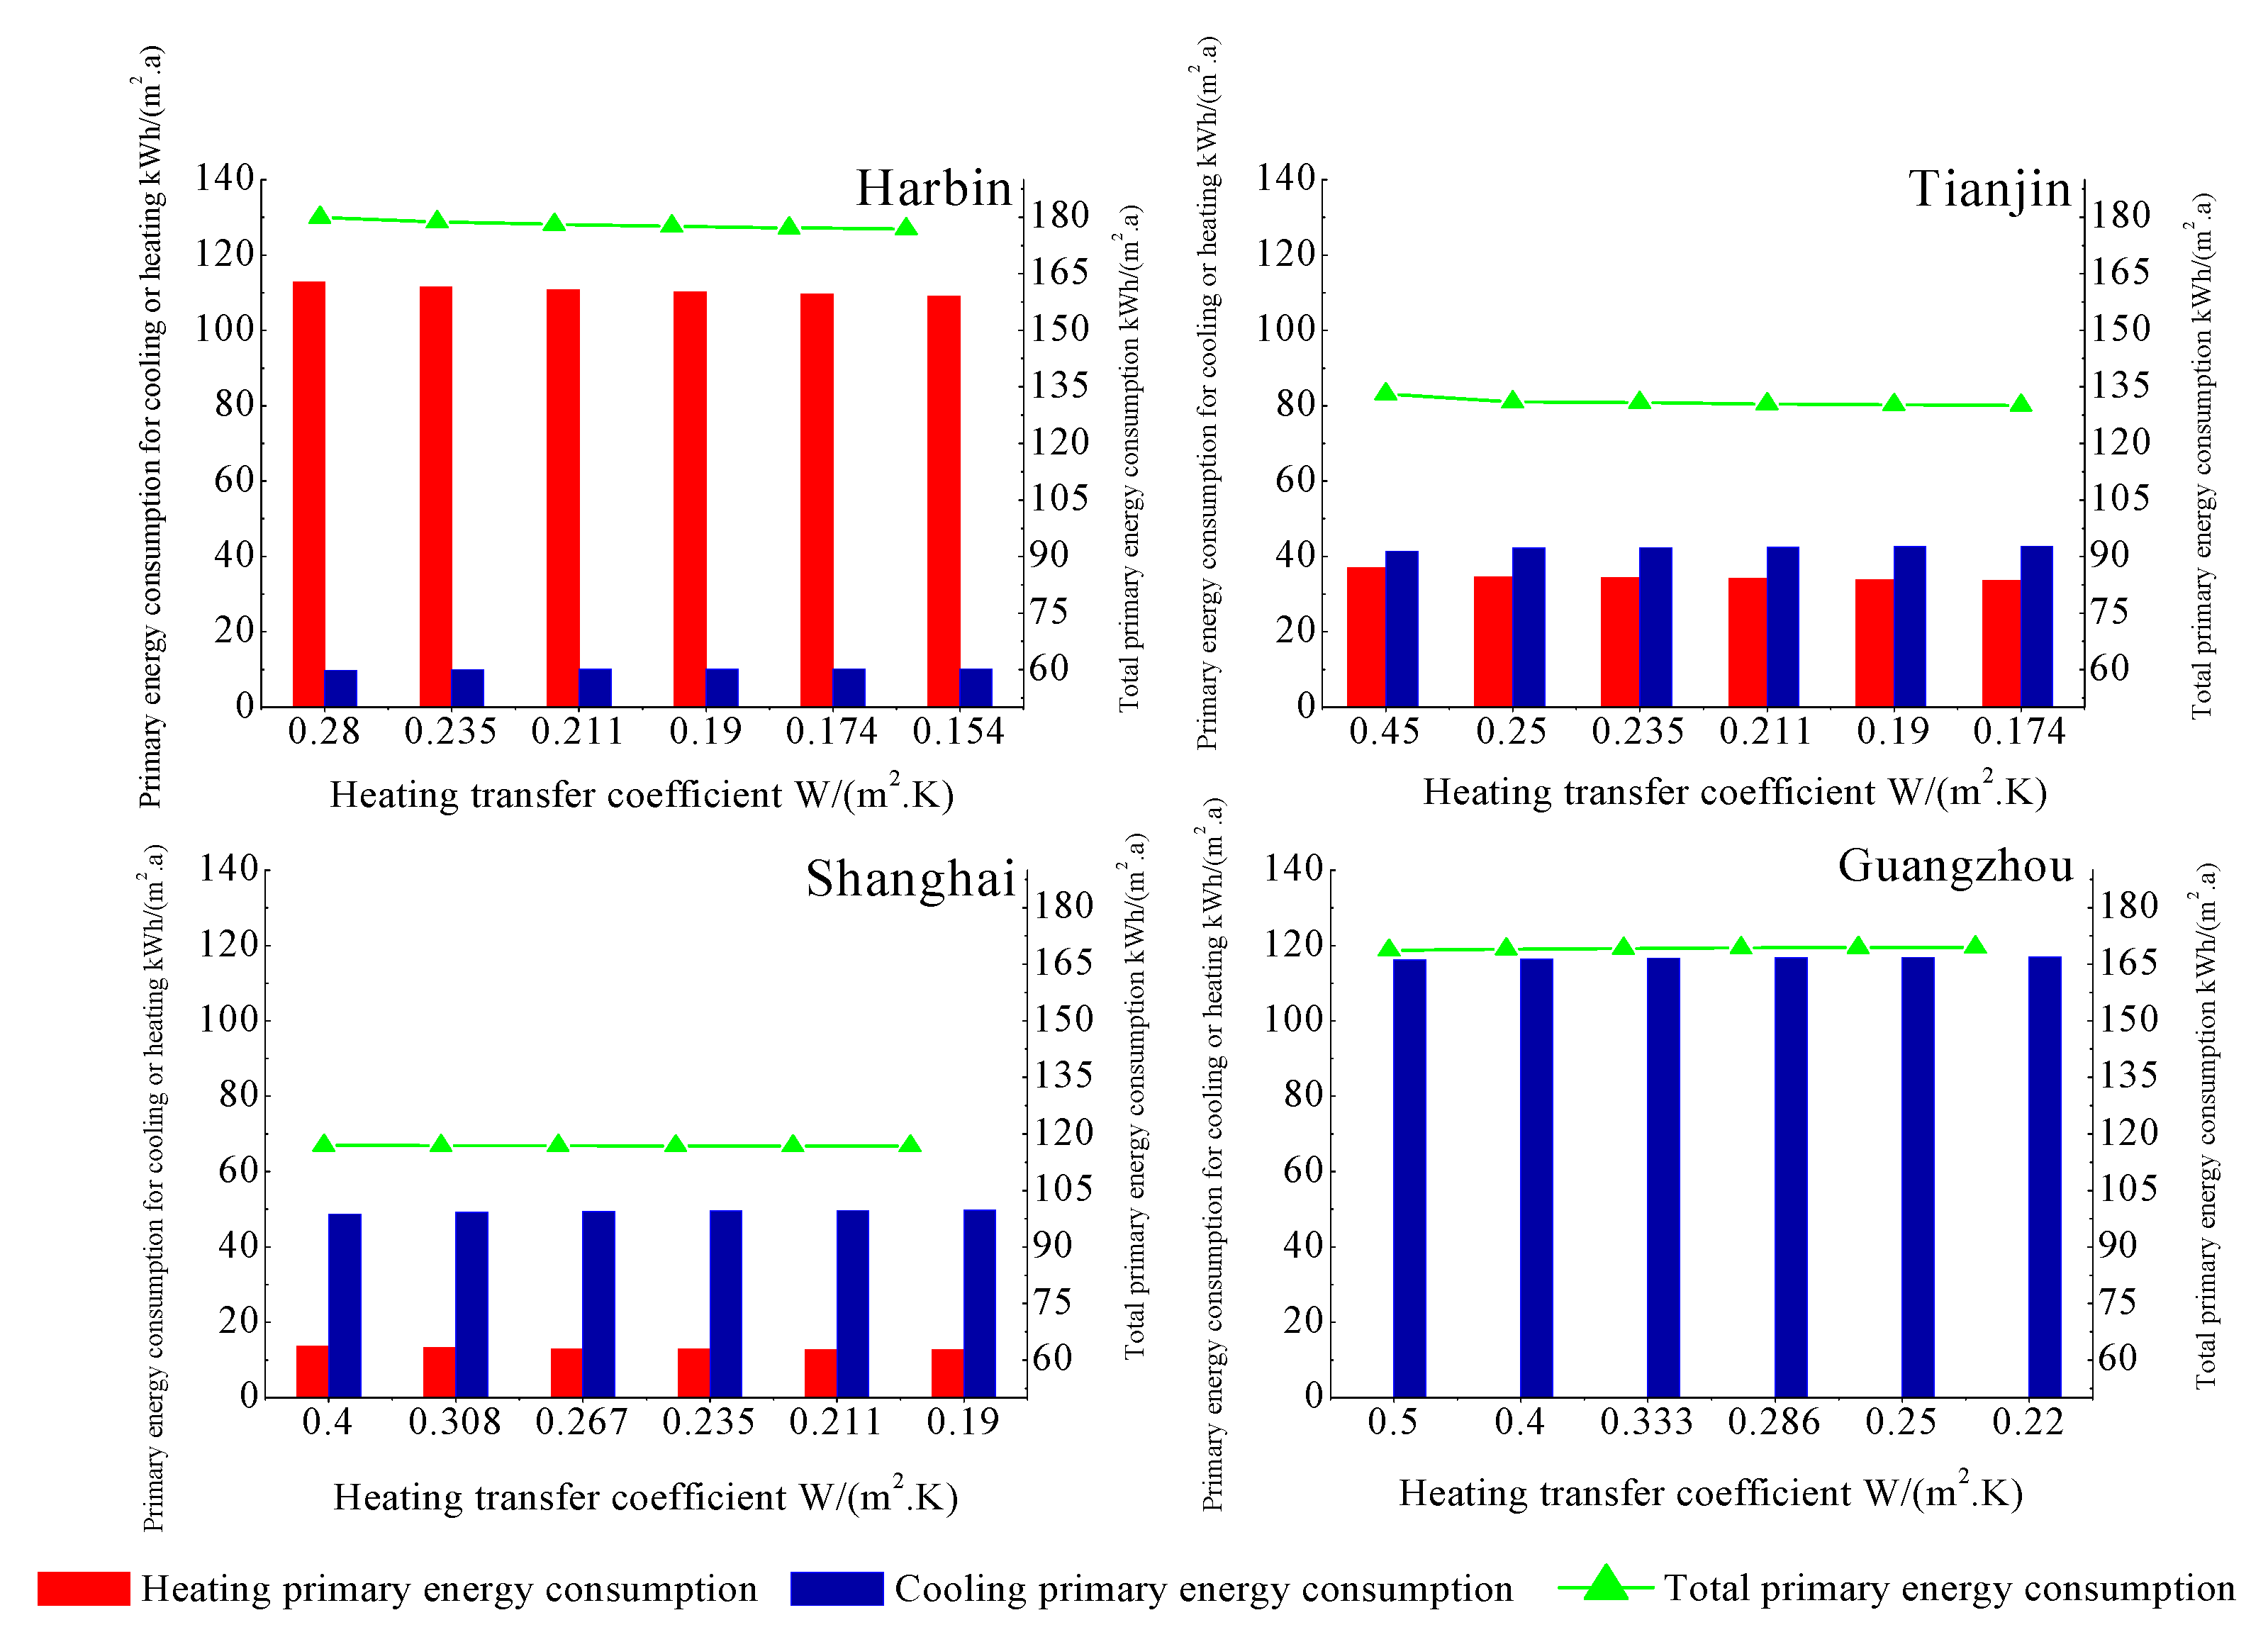
3.1.1. High-Performance Envelope
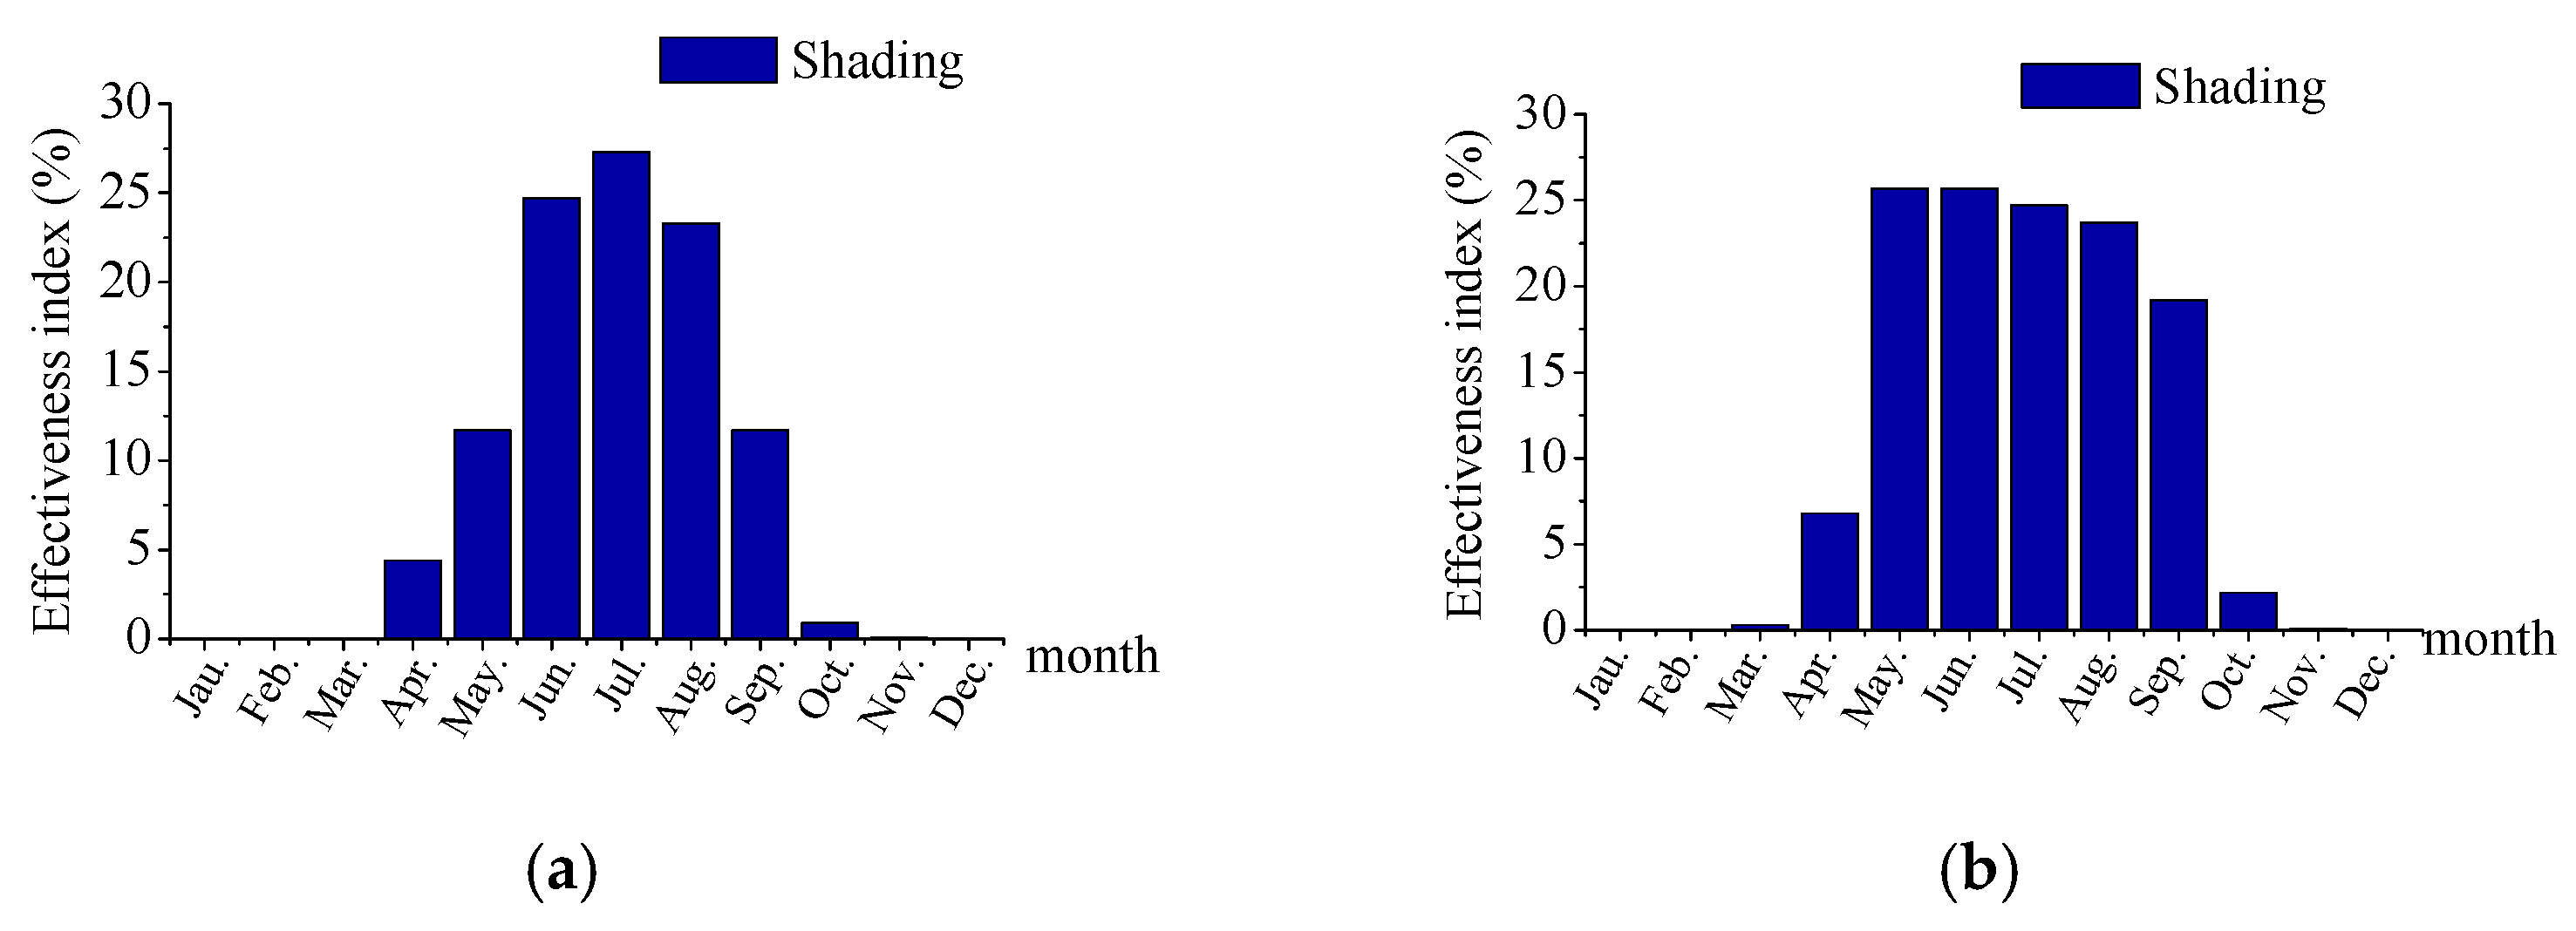
Poor performance of building envelope is a barrier to building energy savings and comfortable indoor environments. Hence, improving envelope performance is deemed as the first and key step of nZEB design [33,60]. As an important part of a building envelope, the performance of exterior wall is directly related to the outdoor environment and energy consumption. The method to improve the performance of exterior walls is to optimize its U-value, which can be realized by the type of insulation material and the thickness of the insulation layer. The insulation material of exterior walls is a rock wool board in this paper, which is a kind of high efficiency insulation material with small thermal conductivity, light weight, low moisture absorption, and is widely used in China. The insulation thickness of the four basic models was set according to the U-value (Table 6) corresponding to the four climatic regions required by the national design standards. The optimization process is to reduce the U-value of external walls by increasing the thickness of the insulation layer in appropriate steps, to make it conform to the requirements of high-performance envelope in “Technical Guidelines for Passive Ultra-Low-Energy Green Buildings” (“Guidelines 2015”) [61].
The cooling, heating primary energy consumption of HVAC and total primary energy consumption with different U-value of external walls in four climatic regions are shown in Figure 5. The column diagram represents the primary heating or cooling energy consumption of HVAC, corresponding to the left axis label, and the green line graph represents total primary energy consumption, including the primary energy consumption of HVAC, lighting, and office equipment, and corresponds to the right axis data label. In Harbin, Tianjin, and Shanghai, there is a clear negative correlation between energy savings and the U-value of external walls. Furthermore, heating primary energy consumption is greatly reduced, and cooling primary energy consumption remains basically unchanged. It can be concluded that the impact of U-value of exterior walls mainly on heating energy consumption and the external walls with low U-value for SC, CC and HS/CW regions is an effective measure for building energy conservation. As can be seen in Figure 5, when the U-value of exterior wall in SC region is 0.129 W/(m2·K) it has, on the one hand, met the standard requirements of “Technical Guidelines for Passive Ultra-Low-Energy Green Buildings”; on the other hand, the rate of ECR has changed very little with the increase in U-value. For the same reason, the U-value of CC and HS/WC regions can be determined as 0.139, and 0.211 W/(m2·K), and in that condition, the ECR of exterior wall in SC, CC and HS/CW regions is 5.2%, 4.3%, and 0.6%, respectively. However, the low U-value of external walls in Guangzhou prevents heat dissipation in summer, causing the indoor temperature to be too high. The cooling and total energy consumption increase slightly with the decrease of U-value of external walls, which means this technology should be carefully chosen in HS/WW region, and this conclusion is also supported by [14].
The roof is another part of the building envelope, and the optimization analysis method is similar to the exterior walls. The insulation material of roof in the base case is EPS, which is also the most mature thermal insulation system in China. The energy consumption of different insulation thickness is shown in Figure 6. The energy savings increase when the performance of roof improves in Harbin, Tianjin, and Shanghai, showing that a roof with lower U-value is also a positive energy conservation choice for SC, CC, and HS/WC regions. Same as the method for determining the recommended parameters for external walls, when the U-value of roof in SC, CC, and HS/CW regions are 0.154, 0.174, and 0.211 W/(m2·K), they meet the standards of “Technical Guidelines for Passive Ultra-Low-Energy Green Buildings”, and the change rate of ECR is very small with the increase in U-value. In the HS/WW region, the energy-saving effect is reduced when the insulation of the roof is increased, so the conclusions of improving the thermal characteristics of roof in four climatic regions are similar to that of exterior walls.
Window performance parameters that affect the energy consumption of buildings mainly include the U-value of windows and solar heat gain coefficient (SHGC). The number of glass layers, the type of gas filled, and the thickness of glass are the key factors in the design of windows. Six common window glass configurations in China were studied in this paper, and the detailed structures and the thermal characters of windows are shown in Table 7. It can be seen in Table 7 that the U-value of windows decreases from GL1 to GL6, and SHGC also weakens except in the case of GL3.
The energy consumption of the six windows in four cities is shown in Figure 7. The ECR increases successively from GL1 to GL6 in Harbin and Tianjin. However, there is no apparent relationship between energy consumption, U-value, and SHGC in Shanghai and Guangzhou. It can be explained that low a U-value led to less heat transfer through windows, low SHGC results in poor solar radiation received, and the total energy savings of windows was realized under the joint action of these two mutually restricting factors. As can be seen in Figure 7, the energy savings are mainly realized by the heating energy consumption reduction for SC and CC regions, illustrating that the influence of U-value is larger than that of SHGC for SC and CC regions. Due to high outdoor temperature during the summer in HS/WW regions, windows with low U-value have a tendency for indoor heat accumulation. Although low SHGC reduces the solar radiation entering the room and plays a positive effect in reducing the energy consumption, it should be noted that the energy-saving effect of SHGC is not obvious compared with other types of buildings due to the summer vacation. Therefore, no remarkable energy savings emerge for any of the windows in the HS/WW region. In summary, GL6 is more recommended for SC, CC, and HS/CW regions. As for the HS/WW region, adopting the configuration is still suggested in the base case, which is designed in conformity with the existing national standard (GB 50189-2015).

3.1.2. Shading

Shading is a measure to be considered in passive design. Proper shading can help to sustain indoor illumination, avoid glare, improve thermal comfort and reduce the solar heat gains in summer [47]. The effect of shading on energy and thermal factors is influenced by various aspects, such as the climate, seasons, and building functions [48]. Building orientation is also a non-negligible factor. Weather Tool software is a subtool of Ecotect and was chosen to identify the best orientation for four cities. The results can be viewed in Figure 8. The yellow lines represent the best orientation in four cities. The results are east by south 82.5° in Harbin, east by south 50° in Tianjin, east by south 60° in Shanghai, and east by south 85° in Guangzhou. In China, northward windows are only exposed to the sun during a short time of sunrise and sunset in summer, and the received radiation is the scattered radiation from the sun with a small radiation value. Therefore, this paper mainly analyzed the energy savings of shading southward windows. Adjustable louvers were selected as the external shading device, which can be automatically adjusted according to the sun height angle and outdoor weather conditions. The specific schedule for effective shading varies in different regions due to geographic latitudes and comfort requirement. In order to analyze the effective time of taking shading measures, the Climate Consultant software [62] was used for analysis, which is a kind of chart analysis software based on enthalpy and humidity map, integrated with human thermal comfort and meteorological parameters. It can show the effectiveness of different passive design strategies. the ratio of effective shading operation time (h) to 8760 h is taken as the effectiveness evaluation index [54]. The California Energy Code Comfort Model was adopted in this paper as the thermal comfort judgment model. According to the monthly statistics, the monthly effective shading index is obtained, as shown in Figure 9. The month with the monthly effectiveness index above 10% is adopted as the operation month schedule of shading. It can be found that the effective time for shading in Harbin is from May to August, in Tianjin and Shanghai is from May to September, and in Guangzhou is from May to October. The obtained results were set in the shading operation schedule of DesignBuilder, and the energy-saving effect of shading measures can be obtained.
Figure 10 shows the energy consumption in shading case and base case in four cities. The ECR of shading in four cities was 0.40%, 0.80%, 3.2%, and 4.1%. Adjustable louvers combined with reasonable control measures ensures the increase of heating energy consumption within 0.4 kWh/(m2·a), and about 1.4%, 3.5%, 7.6%, and 6.8% cooling energy can be saved by shading in each of the four cities. It can be found in Figure 10 that the energy-saving effect gradually improves from SC region to HS/WW region, which is consistent with the change of solar radiation intensity [63]. Therefore, adjustable louver with reasonable shading control strategy can help to avoid the intensification of energy consumption of heating, which plays a significant role in highly efficient buildings.

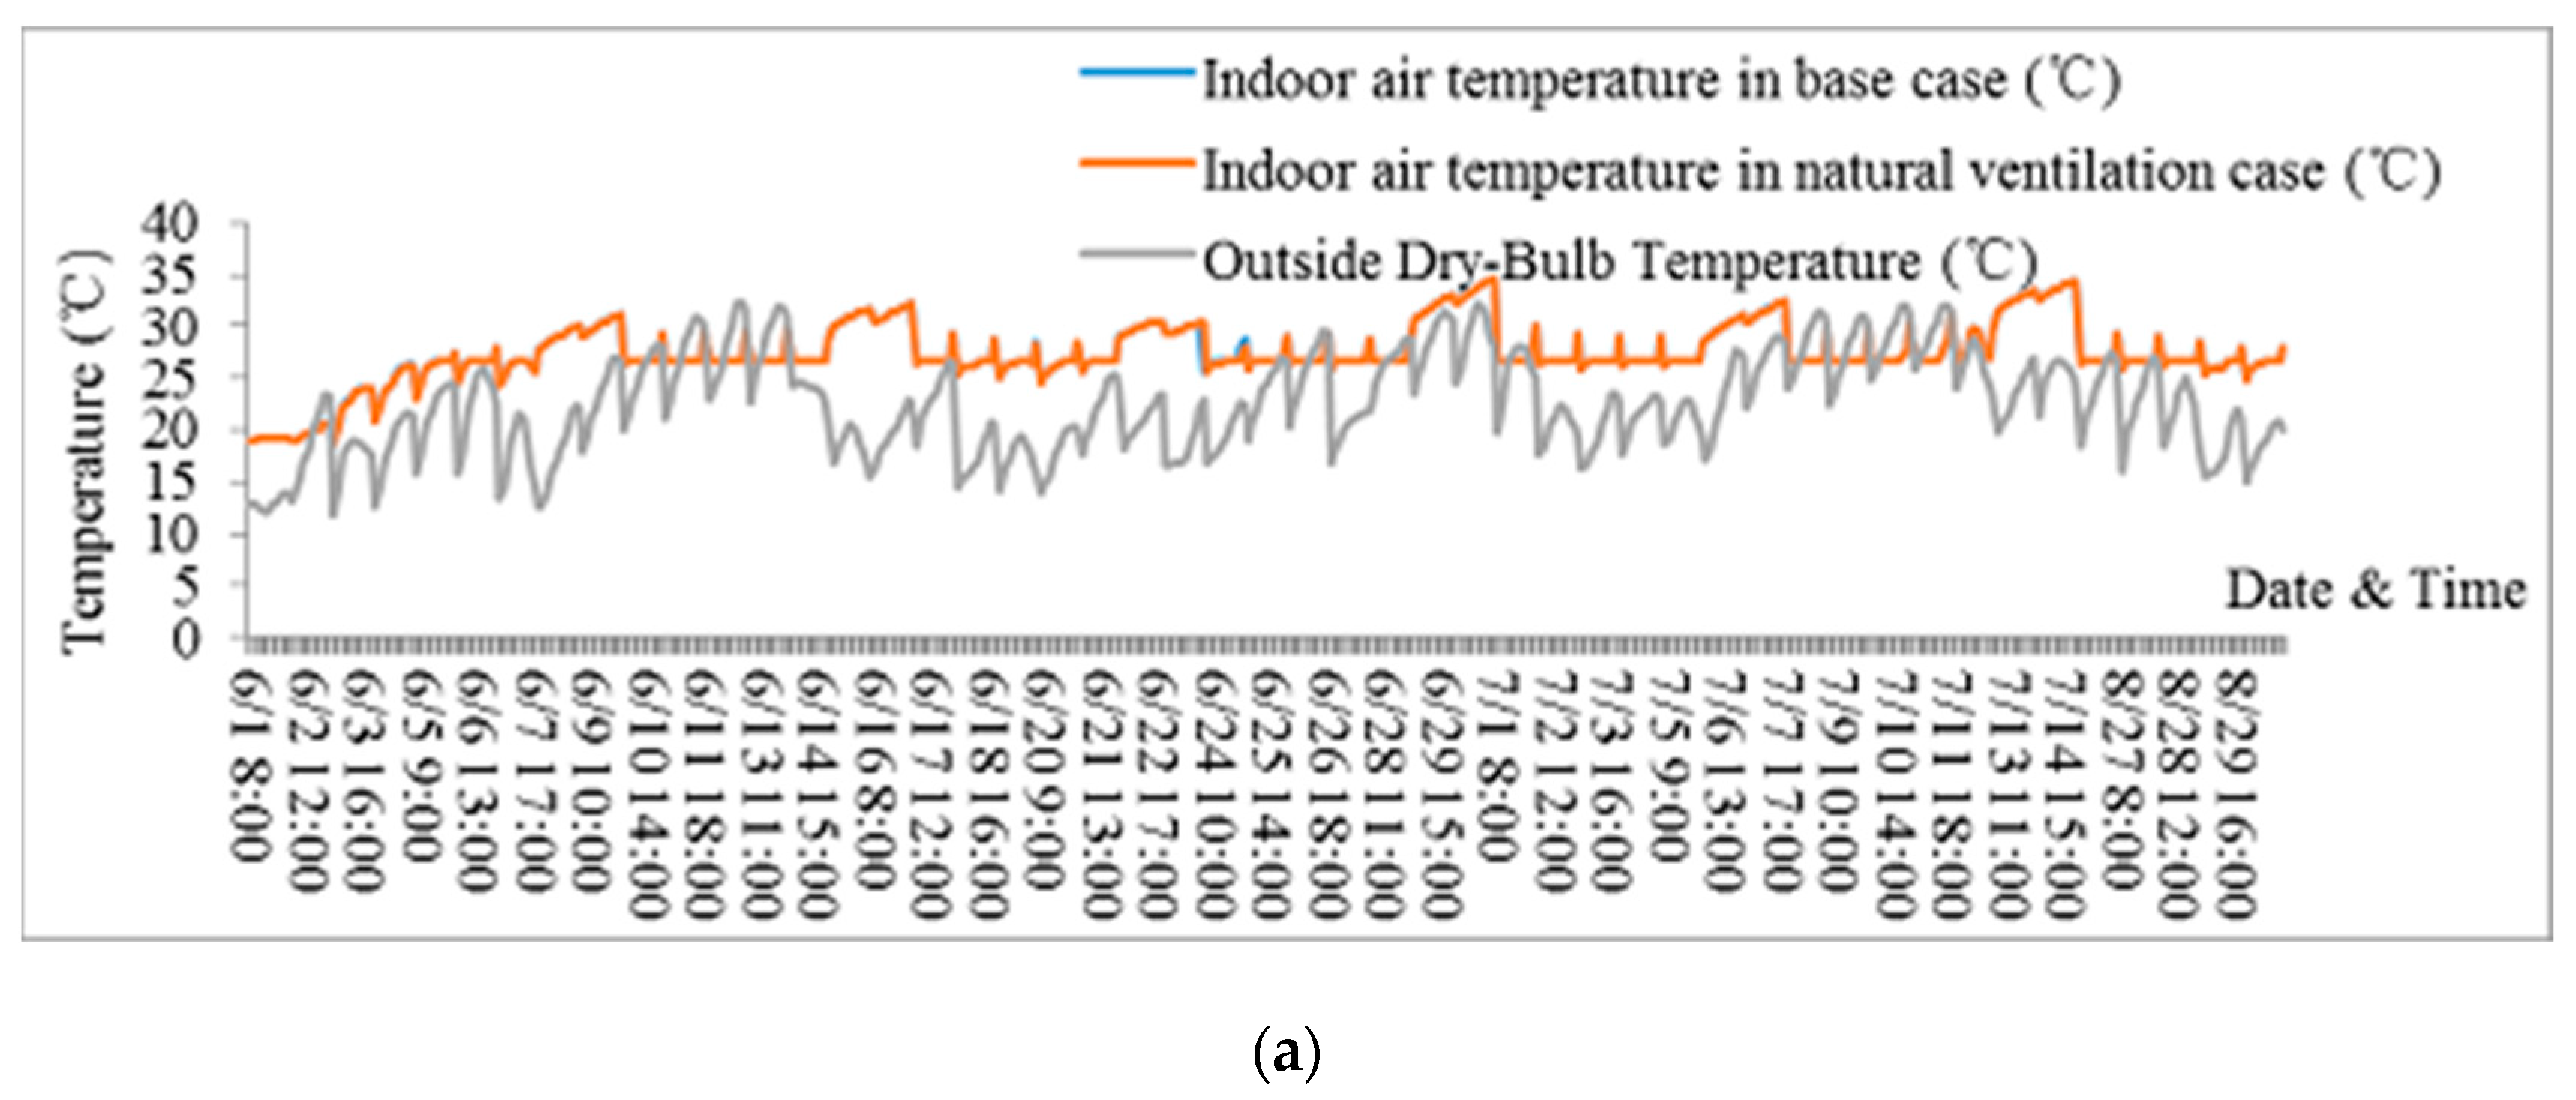
3.1.3. Natural Ventilation

The hall of the educational buildings creates a good condition for natural ventilation [64], which can be realized by taking advantage of the density difference caused by different indoor and outdoor temperatures. The effective schedule of natural ventilation mainly depends on the outdoor conditions, and the monthly effectiveness of natural ventilation was analyzed by Climate Consultant software, as shown in Figure 11. Like the shading effectiveness evaluation index, the ratio of the effective operation time (h) of monthly natural ventilation to 8760 h is taken as the effectiveness index of monthly natural ventilation. The month with the monthly effectiveness index above 10% is adopted as the operation month schedule of natural ventilation. The effective schedule of natural ventilation in Harbin and Tianjin is mainly in June, July, and August, whereas it is mainly in the transition season in Shanghai and Guangzhou, which is because the outdoor temperature during June, July, and August is much higher in the south than that in the north. The occupancy rate of the classroom is high during the day, and it is difficult to maintain a stable and satisfactory indoor environment only by natural ventilation during the day. Thus, this paper proposed a control strategy for natural ventilation. In transition season, natural ventilation turns on under the condition that indoor temperature is greater than outdoor temperature. To avoid overly low temperatures caused by natural ventilation, the temperature difference between indoor and outdoor is set to within 10 °C [65]. When the temperature difference between indoor and outdoor exceeds 10 °C, natural ventilation is closed. In summer, the air conditioning system operates during the daytime from 7:00 to 18:00 to guarantee the indoor temperature and thermal comfort, and natural ventilation is turned on from 19:00 to 6:00 to precool the building. In winter, natural ventilation is turned off. According to the monthly effective schedule of natural ventilation (Figure 11) and the operation schedule of air conditioning system (Table 6), the schedule of natural ventilation is set as shown in Table 8. In addition, the design standard requires the ventilation rate of comfort air condition shall not be less than 5 ac/h [66], Therefore, the natural ventilation rate is set to 5 ac/h in DesignBuilder.
The control strategy of natural ventilation proposed in this paper aims at utilizing outdoor air to cool buildings without affecting indoor comfort and achieving building energy conservation. Figure 12 compares the energy consumption in natural ventilation case with base case in four cities. About 12.5% ECR can be achieved by natural ventilation in Guangzhou, 10.6% in Shanghai, 5.9% in Tianjin, and 1.2% in Harbin. The energy-saving effect of natural ventilation in the south is superior to that in the north. It can be found that the actual operation schedule of natural ventilation is longer in the south than that in the north (Table 8), and the effective schedule of natural ventilation in the south and in the north is different (Figure 11). In addition, the running time of air conditioning in educational buildings is short in summer, so the trend of energy-saving potential increases from SC region to HS/WW region.
In this paper, natural ventilation mainly occurs at night in summer and in transition season. The influence of natural ventilation on indoor temperature in four cities is shown in Figure 13a–d. It can be observed that the fluctuation of indoor air temperature is smaller than that without natural ventilation, indicating better indoor temperature environment can be achieved by the control strategy of natural ventilation. Besides, natural ventilation can provide better cooling and ventilation effect in transition season for CC region. For HS/CW region, the indoor air temperature of natural ventilation in transition season is basically the same as the basic model, the reason for which is that the outdoor air relative humidity is too high and the cooling effect is below expectation. However, using natural ventilation in the transition season to provide a large amount of fresh air to the room ensures good air quality. During the air conditioning season, the indoor air temperature of natural ventilation in four cities can be maintained around the thermostat setpoint of 26 °C, which can meet the requirements of human thermal comfort.

3.2. Active Energy-Saving Technologies

3.2.1. Lighting Control Strategy

Architectural designers often lack consideration of the light environment in classrooms. When indoor lighting is poor during the day, they often rely on artificial lighting, therefore, excessive lighting is a common phenomenon in educational buildings [67], resulting in large lighting energy consumption. Therefore, proper intelligent lighting control system is a crucial measure to reduce lighting energy consumption. The lighting control strategy chosen in this paper is gradual change control, which adjusts the intensity of artificial lighting according to the real-time natural lighting illuminance to make up for the deficiency of natural lighting.
Ecotect Analysis software has advantage in illuminance analysis. Ecotect Analysis combined with Radiance software can simulate the illumination value of specific location and specific time. It can provide detailed results for natural lighting illuminance and is easy to operate, and was chosen in this paper to guide the lighting control strategy design. A typical classroom was selected to establish the Ecotect analysis model, as shown in Figure 14. The size of the classroom is 12 m × 7.8 m × 4.5 m, the size of the window is 2.25 m × 0.69 m and the height of the window sill is 0.9 m. The indoor natural light illuminance of the classroom should be above 450 lux according to the requirements of “Standard for Daylighting Design of Building (GB 50033-2013)” [68].
Hourly indoor natural lighting illuminance values and the proportion of the room illuminance meeting 450 lux were analyzed by Ecotect Analysis software and Radiance software, and then the hourly artificial lighting rate could be obtained. In the current design standard, the artificial hourly lighting rate is only given for one working day, and it is believed that the artificial hourly lighting rate is the same every working day. Considering the different solar radiation in different seasons and the workload of calculating the daily illumination value of natural lighting is tremendous and impractical. Therefore, four typical days representing four seasons in China—spring equinox, summer solstice, autumn equinox, and winter solstice—were chosen to analyze the indoor artificial hourly lighting rate. Table 9, Table 10, Table 11 and Table 12 show the results of the artificial hourly lighting rate of the working face (0.8 m from the ground) during 8:00 to 17:00 on four typical days in four cities. Then, the artificial hourly lighting rate of four season in DesignBuilder was set according to the artificial hourly lighting rate of corresponding typical daily, respectively. In those conditions, the annual energy consumption of lighting control strategy can be obtained.
The energy-saving effect of lighting control is realized under the interaction of cooling and lighting energy consumption reduction and heating energy consumption increase, which can be explained by the composition mechanism of cooling and heating load. However, the usage characteristics of educational building make the lighting control with greater energy-saving potential. As can be seen in Figure 15, the ECR of lighting control in four cities is 7.2%, 13.1%, 15.6%, and 10.3%, respectively, and between 13.0 kWh/(m2·a) to 15.6 kWh/(m2·a) lighting energy can be saved by lighting control in four cities.

3.2.2. Air-to-Air Heat Recovery Technology

An educational building is a densely populated place with large demands of fresh air, and the energy of fresh air treatment accounts for a large proportion of the total consumption. The air-to-air heat recovery system can reduce heating and cooling demands by recycling waste energy in exhausted air, thereby approaching nearly zero energy consumption [33]. Air-to-air heat recovery ventilation includes sensible heat recovery and total heat recovery [69]. At present, the heat recovery efficiency of general heat recovery devices in China is between 0.45 and 0.85, of which 0.45 is the exchange efficiency that the current products can basically achieve, 0.75 sensible heat recovery efficiency or 0.7 total heat recovery efficiency is the minimum requirement for ultra-low energy consumption buildings, and 0.85 is the upper limit of the exchange efficiency that common energy recovery devices can achieve [61]. Compared with sensible heat recovery, total heat recovery has more energy-saving effect and can reduce frosting risk. This paper further studied the energy savings of total heat recovery with 0.75 exchange efficiency in four cities, and the results can be seen in Figure 16. The ECR of air-to-air heat recovery system in four cities is 42.9%, 26.9%, 20.4%, and 23.1%, respectively. The energy-saving effect of air-to-air heat recovery system is greatly affected by outdoor meteorological conditions and operating schedule. In the SC and CC regions, long heating time and large indoor and outdoor enthalpy difference contribute to the considerable heat recovery in winter. For HS/CW and HS/WW regions, a large relative humidity of outdoor air is favorable for latent heat recovery.

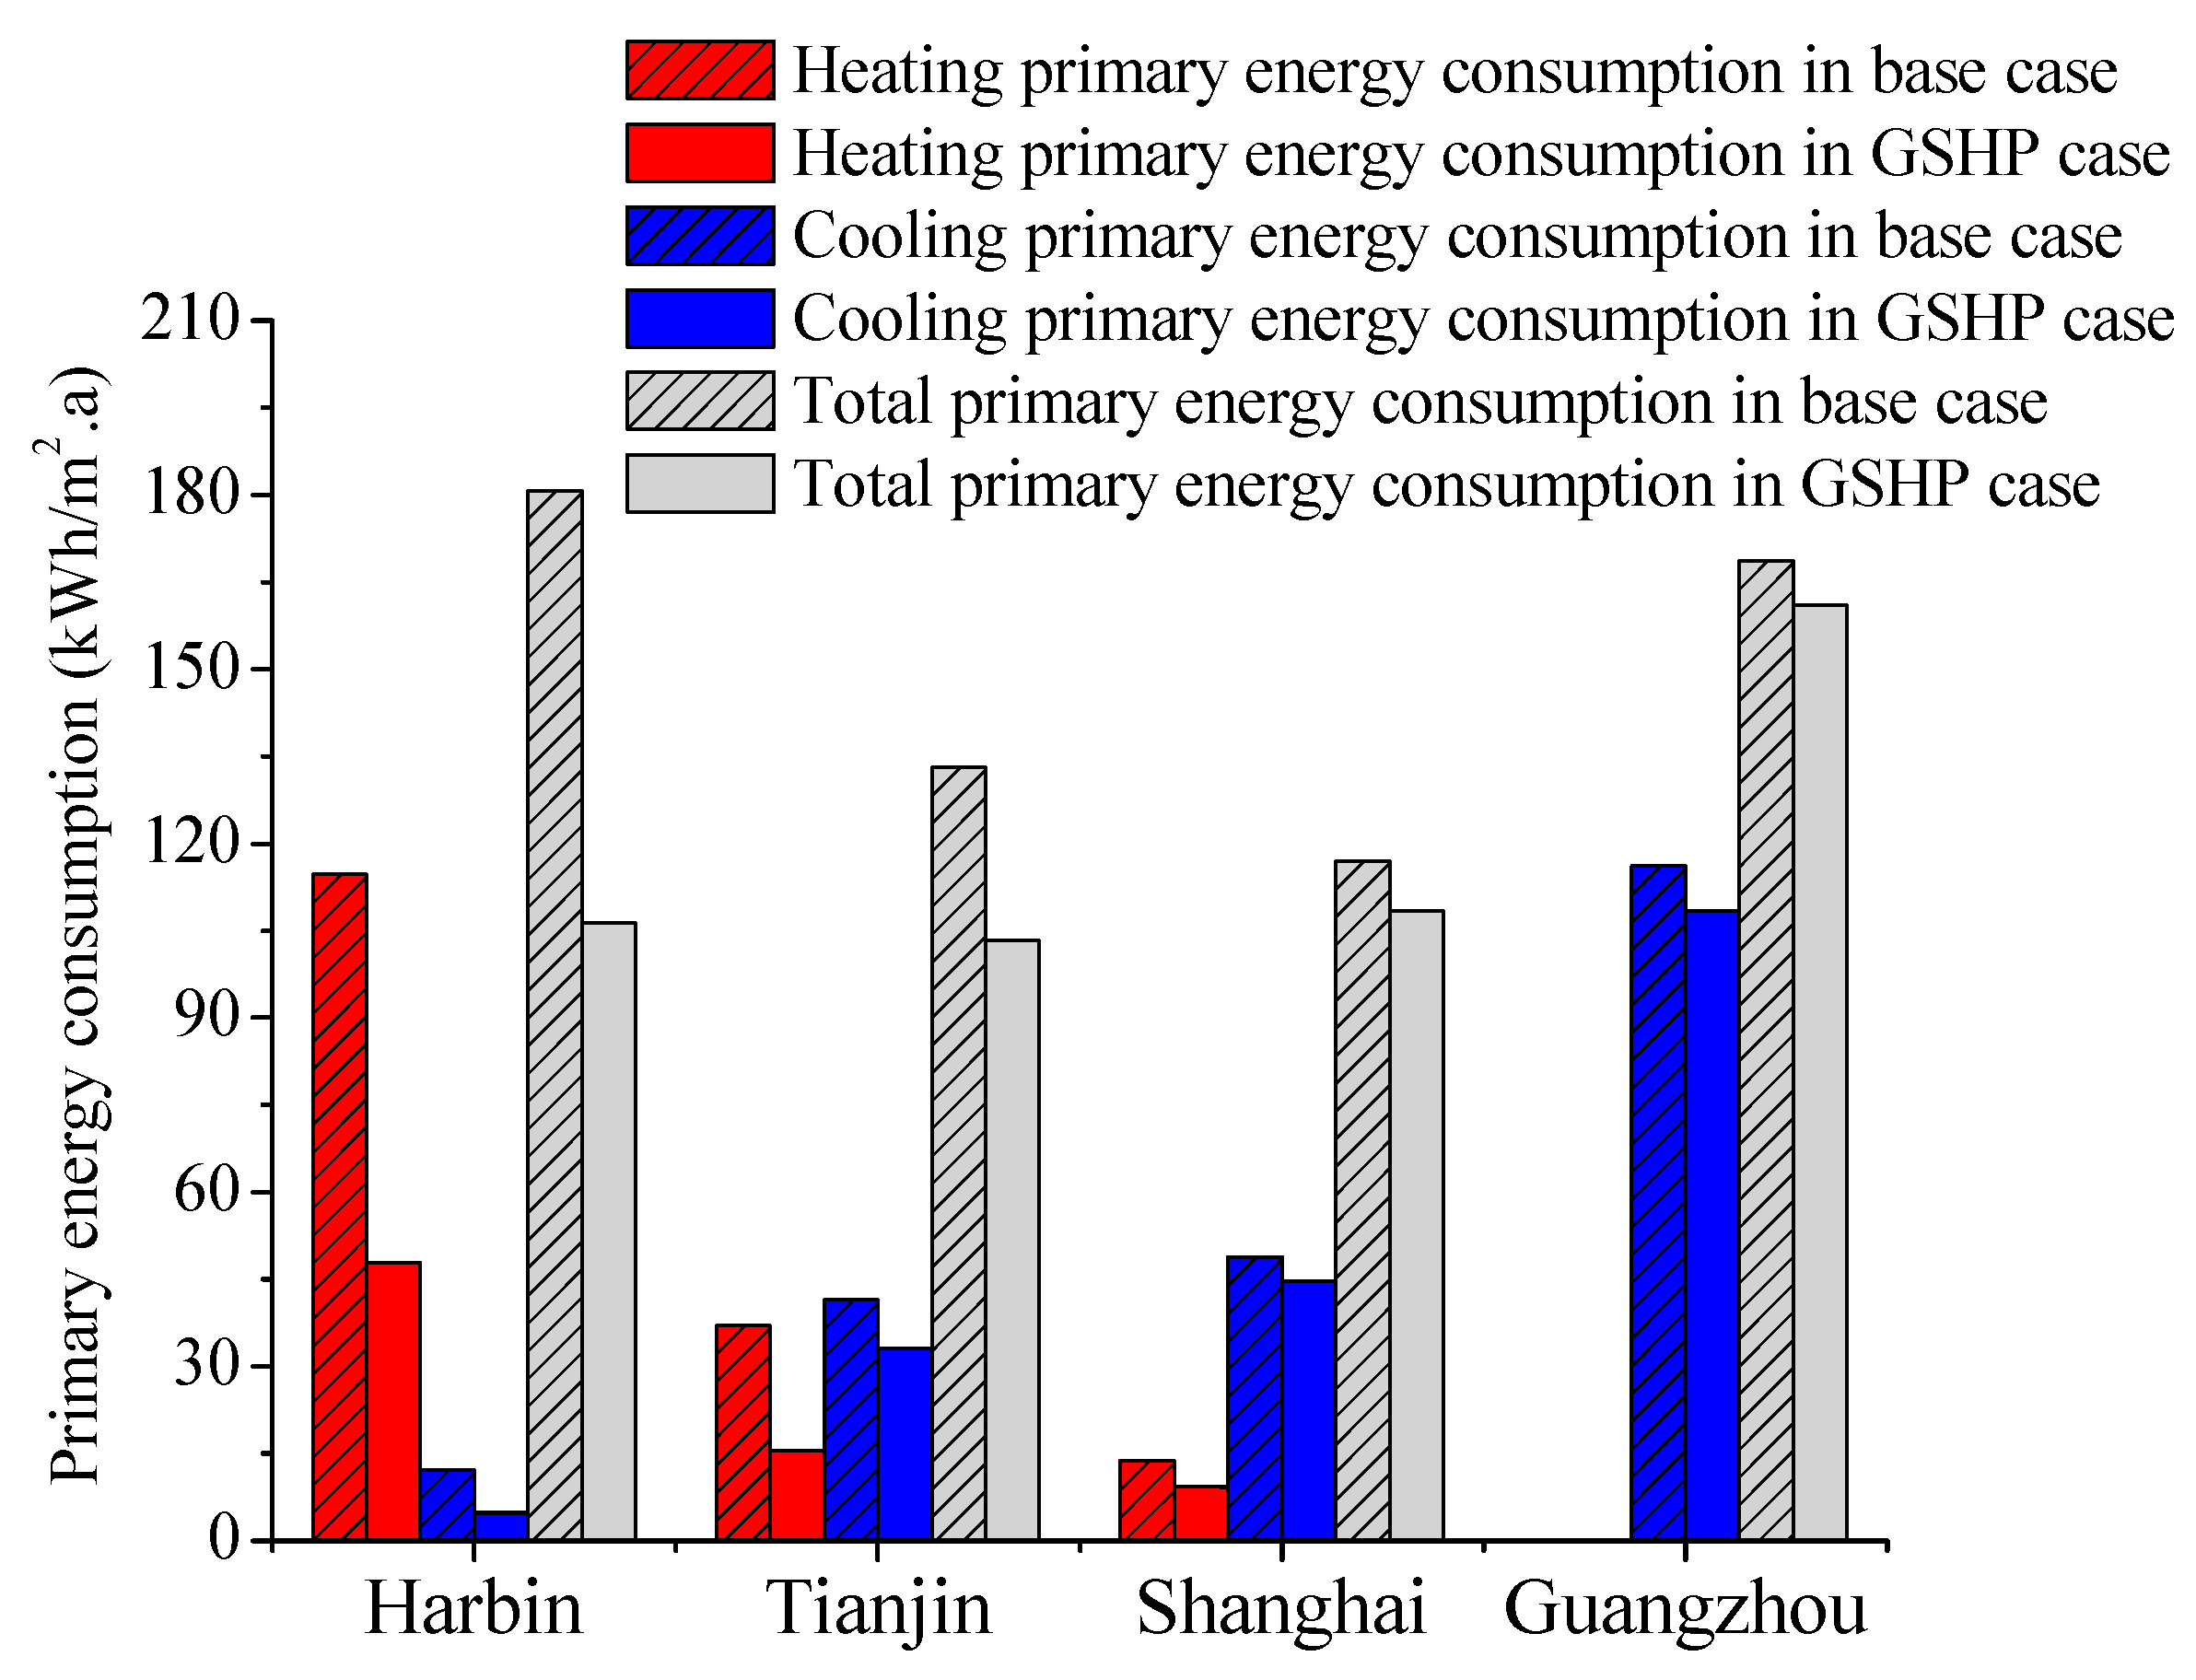
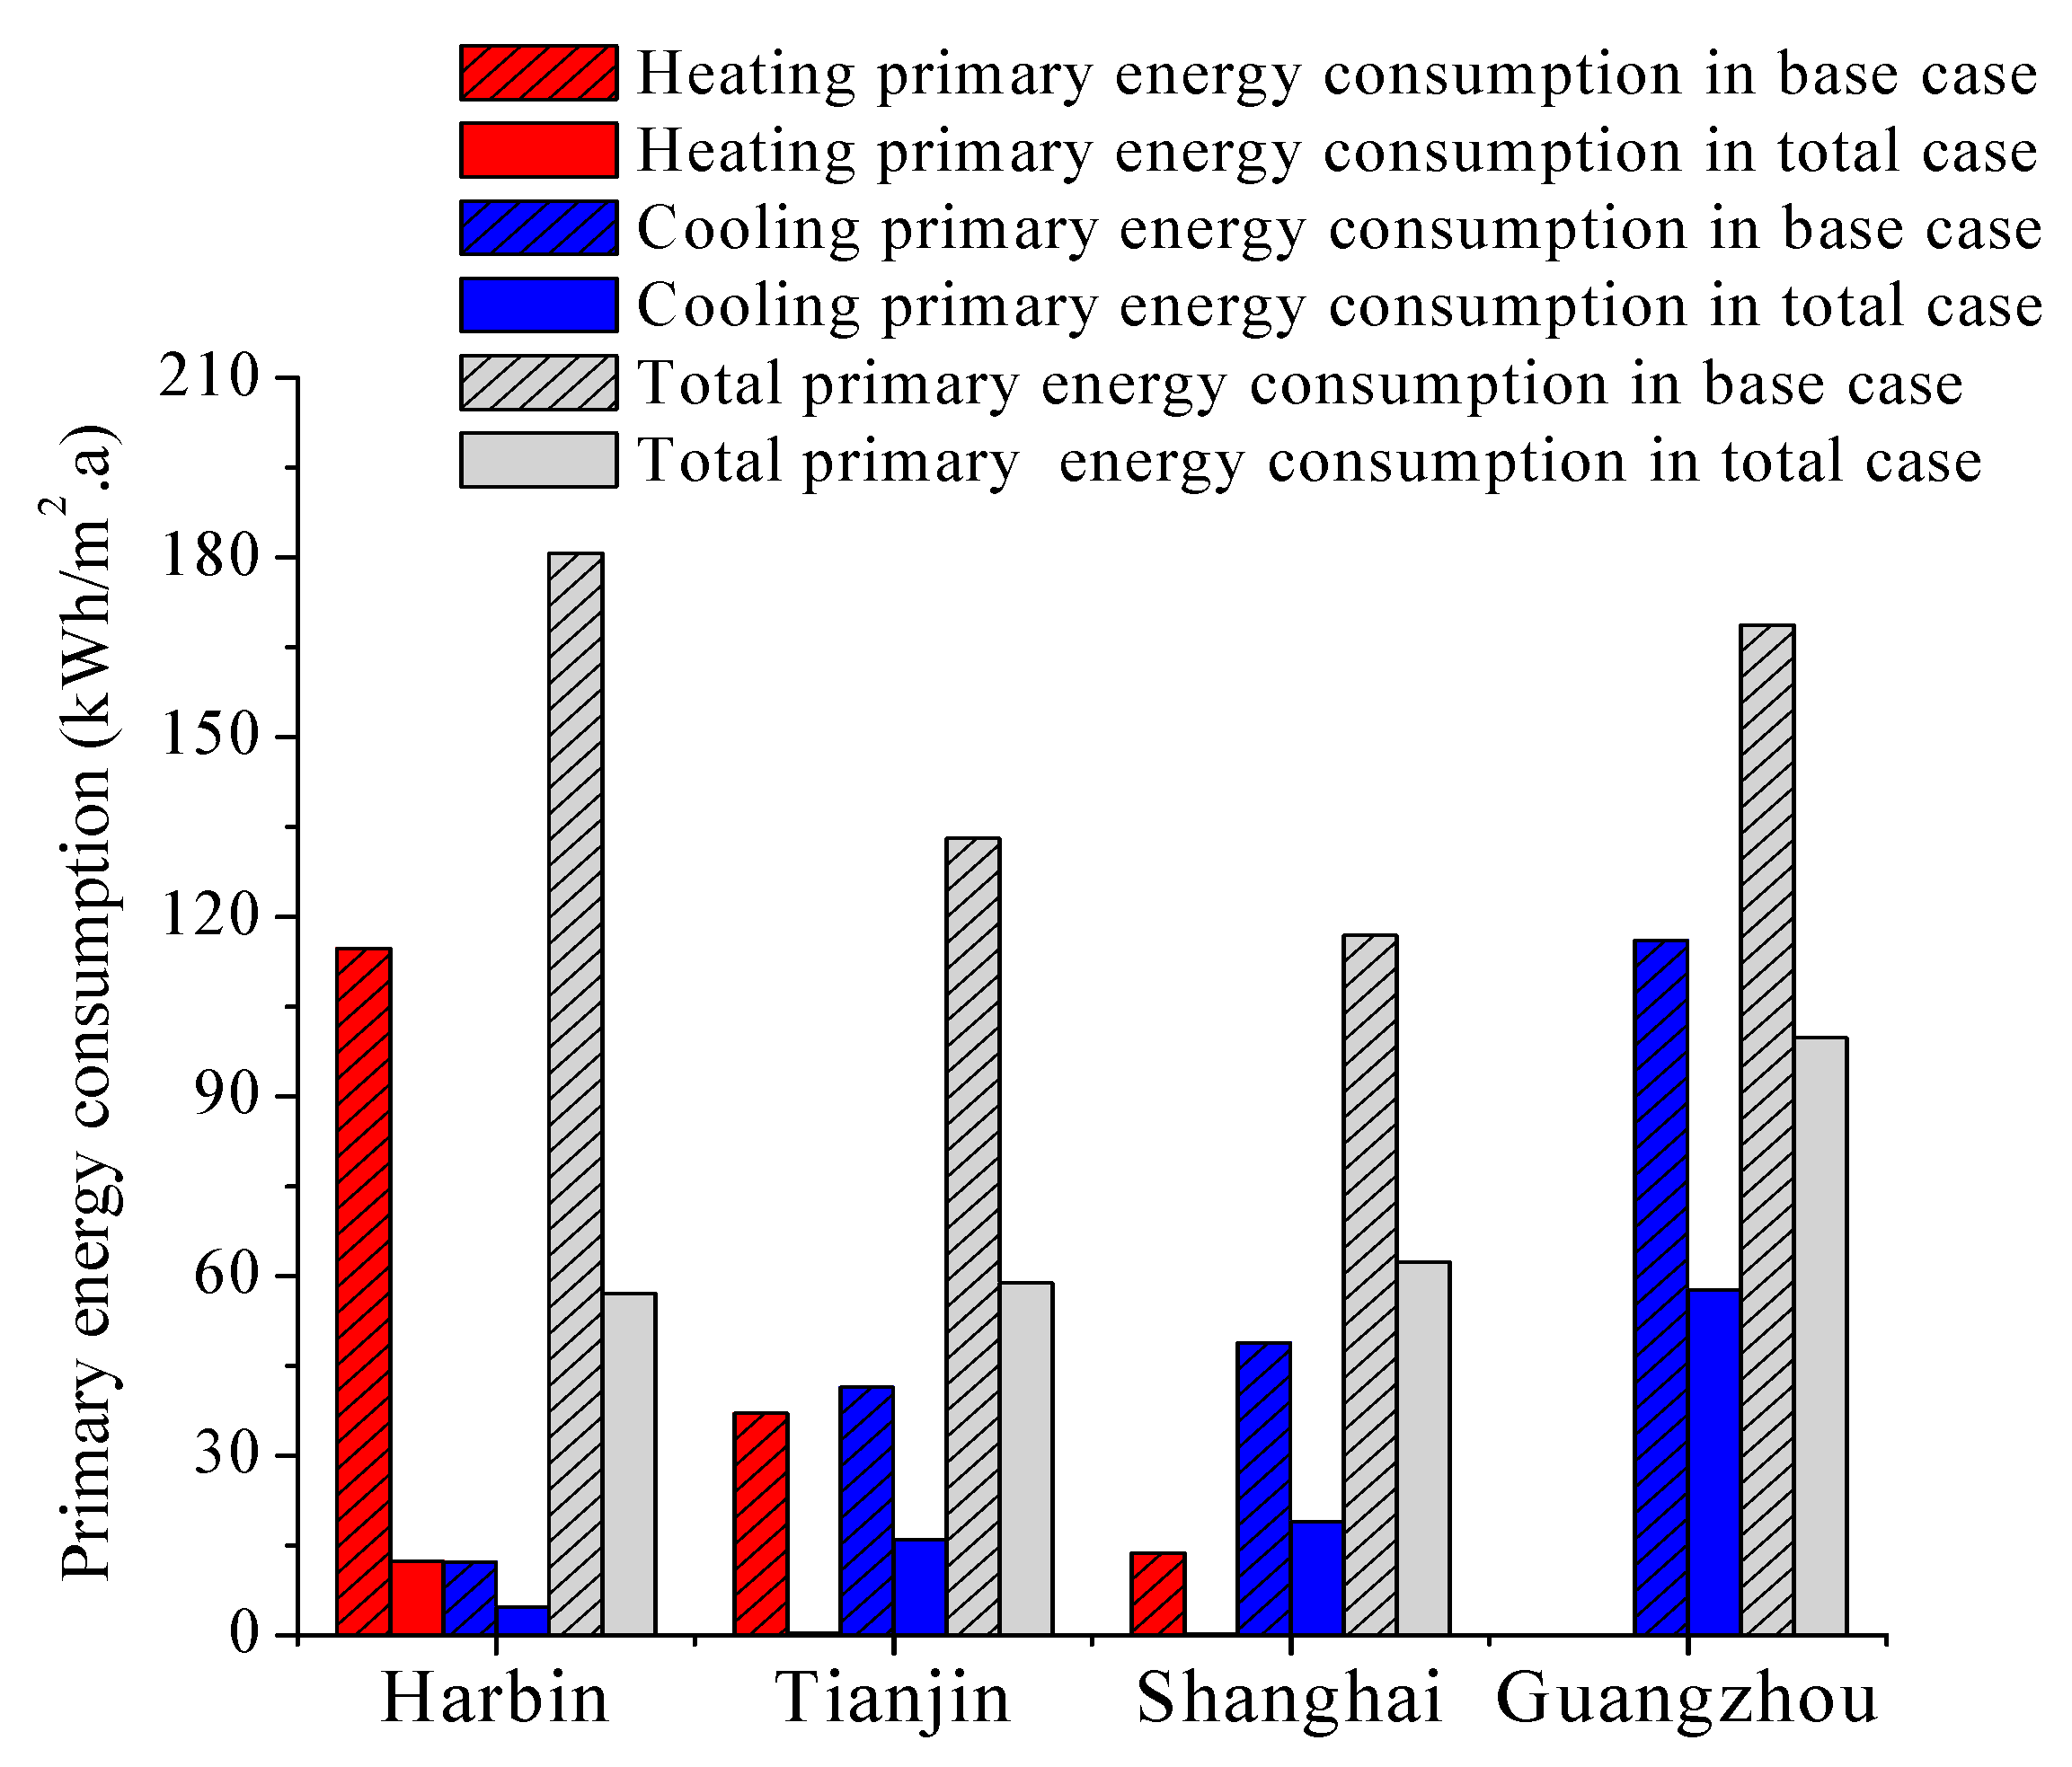
3.3. Renewable Energy

GSHP has become the most widely used renewable energy system in China’s low-energy buildings with the utilization rate reaching 73% [70]. The energy savings advantage of GSHP mainly lies in its high-performance coefficient. However, the determination of the coefficient of performance (COP) of equipment is influenced by many subjective factors, such as the number of device and product manufacturer selected during the design. Moreover, due to different cooling and heating equipment selection schemes, the system performance coefficient (SCOP) will also change greatly. At present, most of the energy-saving research of GSHP are based on the equipment selection under specific conditions to determine its performance coefficient, ignoring the influence of water pump and other factors. This method is often restricted by the actual building characteristics and is not universal. To address this limitation, this paper researched the minimum energy-saving potential of traditional cooling and heating source and GSHP from the perspective of system performance. Specific performance parameters setting of GSHP refer to the standards [53,55], and the setting of system performance efficiency of GSHP in DesignBuilder can be seen in Table 13.
Considerable energy can be saved by GSHP in four cities as shown in Figure 17. GSHP with a high SEER and SCOP has great energy-saving potential to reduce cooling and heating energy consumption, especially in the form of boiler heating in the north of China, 41.2%, and 22.4% primary energy can be saved by GSHP in Harbin and Tianjin. In Shanghai and Guangzhou, the ECR of GSHP is 7.3% and 4.6%, respectively. A high coefficient of performance means that more benefits can be obtained under the same energy input, so further improvement of the SCOP will lead to greater energy savings. However, further optimization of SCOP is not considered in this paper as the SCOP is the combined effect of many factors that are closely related to the actual project. The author believes that compared with only considering the improvement of the performance of heat pump equipment, a more feasible energy conservation scheme is to choose the appropriate efficient equipment in combination with the characteristics of the building, and in order to improve the operating efficiency under partial load ratio, a variable frequency heat pump unit can be selected. On the whole, high-efficiency GSHP is more strongly recommended for building energy conservation.

3.4. Establishment of the Recommended Technology Selection Systems

The ECR of each technology after optimization was obtained from the previous analysis results, as shown in Table 14. To compare and evaluate the efficiency of each technology in different climatic regions clearly, the ECR of each energy-saving technology is weighted based on Equation (4) as shown in Figure 18, respectively.
As can be seen in Figure 18, the priority order of energy-saving technologies in four climatic regions can be formed as follows.
(1)
SC region: Air-to-air heat recovery > GSHP > High-performance envelope > Lighting control > Natural ventilation > Shading.
(2)
CC region: Air-to-air heat recovery > GSHP > Lighting control > High-performance envelope > Natural ventilation > Shading.
(3)
HS/CW region: Air-to-air heat recovery > Lighting control > Natural ventilation > GSHP > Shading > High-performance envelope.
(4)
HS/WW region: Air-to-air heat recovery > Natural ventilation > Lighting control > GSHP > Shading > High-performance envelope.
It can be concluded that in SC and CC regions, the ranking of energy-saving technologies is almost the same, due to the fact that natural ventilation and shading are mainly used for cooling energy consumption reduction and the operation schedule of air conditioning system for educational buildings is shorter than for other types of buildings. Therefore, the energy-saving potential of natural ventilation and shading in heating energy consumption-dominated climatic regions is not obvious compared with other technologies. In HS/CW and HS/WW regions, the ranking is also almost identical. Natural ventilation has a decent energy-saving effect compared with in SC and CC regions, which is because the effective schedule of natural ventilation in the south is longer than that in the north. Nevertheless, high-performance envelope is an unfavorable factor for heat dissipation due to high outdoor temperatures during the summer in HS/CW and HS/WW regions. Hence, this technology plays little role or even causes opposite trends in energy savings in southern cities.
Building total energy saving is by no means the sum of energy conservation by every single technology. Therefore, an integrated solution was proposed to explore the total energy-saving potential. Considering that technical measures with low ECR will lead to poor economy, technologies with a weight of less than 1% of ECR will not be adopted. Therefore, shading is not considered in the SC region and high-performance envelope with counter action is not recommended in the HS/WW region, and the final combination of energy-saving technologies and indicators in the four basic cases are listed in Table 15. Compared with the reference model, the results of the integrated design scheme of technologies showed that the energy-saving effect is quite remarkable (Figure 19). A total energy-saving rate of 70.7% can be improved in SC region compared with GB 50189-2015, about 60.0% in CC region, 46.7% in HS/CW region, and 40.9% in HS/WW region. The required total energy-saving rate of public buildings in China is 60%–75% on the basis of the attainable standards in 2016, reaching the requirement of nZEB [5]. Therefore, recommended selection techniques for SC and CC regions in this paper can reach the level of nZEBs. However, for HS/CW and HS/WW regions, there is still a gap regarding the requirements of nZEBs. According to the design strategy for nZEBs, the remaining energy needs can be realized by using other renewable technologies [11,33]. Solar power has gained wider implementation in nZEB due to its accessibility and easy integration with existing building systems [34], while rooftop PV modules have great potential to become the primary way of harnessing solar energy, reducing the additional energy demand by generating electricity, which is clearly the biggest beneficiary [71], and generating electricity for educational buildings that can be used directly for the classroom and corridor lighting. Combined with this case study, a brief discussion on the possibility of realizing nZEB in HS/CW and HS/WW regions by combining PV technology is conducted. According to literature [64], the solar radiation in HS/CW and HS/WW regions is about 1400 kWh/m2, and it is supposed that the solar PV modules can convert 16% of solar radiation into electricity [33]. To achieve the total energy-saving rate of 60%, the required area of PV modules is 186 m2 for HS/CW region and 384 m2 for HS/WW region.
According to the above analysis, four recommended technology selection systems corresponding to four climatic regions, respectively, can be established for nZEEBs in China. In the SC region, the recommended technology selection system involves air-to-air heat recovery, GSHP, high-performance envelope, lighting control and natural ventilation. In the CC region, educational buildings with air-to-air heat recovery, GSHP, high-performance envelope, lighting control, natural ventilation, and shading will prove efficient enough for achieving the goal of being nZEEB. In HS/CW region, air-to-air heat recovery, lighting control, natural ventilation, GSHP, shading, high-performance envelope and PV should be considered. In SH/WW region, a combination of air-to-air heat recovery, lighting control, natural ventilation, GSHP, shading, and PV are the essential technologies of the system for achieving nZEEBs.

4. Discussion

The purpose of this paper is to further optimize various energy-saving technologies on the basis of the current national design standard. Therefore, the conclusions and methods of this study can provide a reference and guidance for the energy-saving reconstruction and design for high-performance educational buildings.
Apart from energy-saving efficiency, the performance of thermal comfort on nZEBs should be another crucial concern. The predicted mean vote (PMV) and predicted percentage dissatisfied (PPD) have been widely recognized as comfort evaluation indexes for indoor thermal comfort. There are two kinds of patterns widely adopted for dealing with indoor thermal comfort. One is considering the comfortable indoor environment as a precondition in energy efficient buildings, and the other is taking the indoor air quality as an influencing factor of building energy consumption and exploring the quantitative relationship [14]. In this paper, natural ventilation mainly occurs at night in summer or in transition season. The detailed analysis results of natural ventilation have been discussed in Section 3.1.3, in which it was demonstrated that natural ventilation ensures smaller indoor air temperature fluctuations and can meet the requirement of human thermal comfort. Moreover, the study of energy-saving technologies in this paper were in conformity with the first pattern, which takes comfortable indoor parameters as fixed values (Table 1). The setpoint of indoor temperature in the room is 26 °C in summer and 20 °C in winter, and can achieve the comfort indexes of PMV ≤ 0.5 and PPD ≤ 20% [14]. Therefore, energy savings of these technologies would not compromise thermal comfort.
In this paper, various energy-saving technologies for nZEEBs are mainly evaluated from the perspective of energy-saving performance, and economic benefits were not considered. Future work can consider the combination of energy-saving and economic factors, optimize various energy-saving technologies, and achieve the goal of nZEEBs under different climatic conditions in China.

5. Conclusions

This paper presents optimization research on various commonly used energy-saving technologies for educational buildings, including passive, active, and renewable technologies. An educational building was selected as a case study to optimize various design variables. An evaluation index of ECR was proposed to measure the energy-saving potential of each technology, and the combination schemes of high-efficient technologies were discussed. Finally, four recommended technology selection systems corresponding to four major climatic regions, respectively, are established for achieving nZEEB. The main findings of this study are summarized as follows.
After simulation, it can be concluded that for the SC region, the maximum energy-saving technology was air-to-air heat recovery, and the ECR can reach 42.9%, followed by GSHP technology with 41.2%, and the ECR of high-performance envelope and lighting control were 11.3% and 7.2%, respectively. The energy-saving effect of natural ventilation and shading were relatively low, only 1.2% and 0.4%, respectively. For CC region, the ECR of air-to-air heat recovery was 26.9%, GSHP was 22.4%, lighting control was 13.1%, high-performance envelope was 8.9%, natural ventilation was 5.9%, and shading was 0.8%. From the above, it can be concluded that the technical route of energy-saving in SC and CC regions is almost the same. For HS/CW region, the maximum ECR was 20.4% of air-to-air heat recovery, followed by lighting control at 15.6%, and the ECR of natural ventilation and shading were larger than that in SC and CC regions, which were 10.6% and 3.2% respectively. The lowest ECR was 1.8% of high-performance envelope, and for HS/WW region, the ECR of air-to-air heat recovery was 23.1%, natural ventilation was 12.5%, lighting control was 10.3%, GSHP was 4.6%, and shading was 4.1%. According to the ECR of various technologies in HS/CW and HS/WW regions, it can be concluded that the technical route of energy saving is also almost same in these two climate regions.
The priority order of energy-saving technologies in four climatic regions can be formed as follows.
(1)
SC region: Air-to-air heat recovery > GSHP > High-performance envelope > Lighting control > Natural ventilation > Shading.
(2)
CC region: Air-to-air heat recovery > GSHP > Lighting control > High-performance envelope > Natural ventilation > Shading.
(3)
HS/CW region: Air-to-air heat recovery > Lighting control > Natural ventilation > GSHP > Shading > High-performance envelope.
(4)
HS/WW region: Air-to-air heat recovery > Natural ventilation > Lighting control > GSHP > Shading > High-performance envelope.
Based on the case study, the ECR and priority of each technology in relation to the conditions in each climatic region were obtained, and recommended selection technologies with higher energy efficiency are applied together to base cases. The results showed that in SC region, the total energy-saving rate can increase by 70.7% compared to existing national standard (GB 50189-2015, etc.). In CC region, about 60.0% improvement in total energy-saving rate can be achieved by implementing the recommended technology selection system established for CC region. In HS/CW region as well as HS/WW region, the recommended combination of technologies augmented with PV technology could achieve 60% total energy-saving rate and reach nZEEB level.
According to the energy-saving requirements of nZEBs, the recommended technology selection system for each climatic region has been established. In SC region, the recommended technology selection system includes air-to-air heat recovery, GSHP, high-performance envelope, lighting control and natural ventilation. In CC region, educational buildings with air-to-air heat recovery, GSHP, high-performance envelope, lighting control, natural ventilation, and shading are efficient enough to realize nZEEB. In HS/CW region, air-to-air heat recovery, lighting control, natural ventilation, GSHP, shading, high-performance envelope and PV should be considered together. In HS/WW region, combining air-to-air heat recovery, lighting control, natural ventilation, GSHP, shading and PV are essential for achieving high-performance nZEEB.

Author Contributions

Methodology, J.Z.; Software, Y.D.; Validation, Y.D. Formal Analysis, J.Z.; Investigation, J.Z.; Resources, J.Z.; Writing—Original Draft Preparation, Y.D.; Writing—Review & Editing, Y.D.

Funding

The work is supported by the National Key R&D Program of China, Project No. 2016YFB0601700.

Conflicts of Interest

The authors declare no conflict of interest.

Abbreviations

EPBD energy performance of buildings directive
nZEBnearly zero energy building
PVphotovoltaic
nZEEBnearly zero energy educational building
GSHPground source heat pump
WWRwindow to wall ratio
Low-Elow emissivity
SCsevere cold
CCcold climate
HS/CWhot summer and cold winter
HS/WWhot summer and warm winter
MCmild climate
PMVpredicted mean vote
HVACheating, ventilation and air conditioning
ECRenergy-saving contribution rate
S/Vsurface to volume
EPSexpanded polystyrene board
NMBEnormalized mean bias error
CVRMSEroot mean square error
DBDesignBuilder
U-valueheat transfer coefficient
SHGCsolar heat gain coefficient
COPcoefficient of performance
SCOPsystem performance coefficient
SEERsystem energy efficiency ratio
PPDpredicted percentage dissatisfied
ASHPair source heat pump

References

  1. Crawley, D.; Pless, S.; Torcellini, P. Getting to net zero. ASHRAE 2009, 51, 18–25. [Google Scholar]
  2. Aste, N.; Adhikari, R.S.; Del Pero, C. Photovoltaic technology for renewable electricity production: Towards net zero energy buildings. In Proceedings of the International Conference on Clean Electrical Power (ICCEP), Ischia, Italy, 14–16 June 2011. [Google Scholar]
  3. China Building Efficiency Research Centre, Tsinghua University. Annual Report on China Building Energy Efficiency; China Architecture and Building Press: Beijing, China, 2008. [Google Scholar]
  4. DOE. Saving Energy and Money with Building Energy Codes in the United States. Available online: https://www.energycodes.gov/sites/default/files/documents/CodesFactSheet_12-28-16.pdf (accessed on 1 January 2016).
  5. Yang, X.Y.; Zhang, S.C.; Xu, W. Impact of zero energy buildings on medium-to-long term building energy consumption in China. Energy Pol. 2019, 129, 574–586. [Google Scholar] [CrossRef]
  6. EU Directive. 2010/31/EU of the European Parliament and of the Council of 19 May 2010 on the energy performance of buildings (recast). Off. J. Eur. Union 2010, 18, 13–35. [Google Scholar]
  7. Swedish Government Bill 2005/06:145, National Program for Energy Efficiency and Energy-Smart Construction. Available online: http://www.government.se/information-material/2006/05/national-programme-for-energy-efficiencyand-energy-smart-construction/ (accessed on 20 April 2009).
  8. Mlecnik, E. Defining nearly zero-energy housing in Belgium and The Netherlands. Energy Effic. 2012, 5, 411–431. [Google Scholar] [CrossRef] [Green Version]
  9. Deng, S.; Wang, R.Z.; Dai, Y.J. How to evaluate performance of net zero energy building—A literature research. Energy 2014, 71, 1–16. [Google Scholar] [CrossRef]
  10. European Commission. Energy Performance of Building Directive; European Commission: Brussels, Belgium, 2010. [Google Scholar]
  11. Li, D.H.W.; Liu, Y.; Lam, J.C. Zero energy buildings and sustainable development implications—A review. Energy 2013, 54, 1–10. [Google Scholar] [CrossRef]
  12. Attia, S.; Eleftheriou, P.; Xeni, F.; Morlot, R.; Ménézo, C.; Kostopoulos, V.; Betsi, M.; Kalaitzoglou, I.; Pagliano, L.; Cellura, M.; et al. Overview and future challenges of nearly zero energy buildings (nZEB) design in Southern Europe. Energy Build. 2017, 155, 439–458. [Google Scholar] [CrossRef]
  13. Ascione, F.; De Masi, R.F.; de Rossi, F.; Ruggiero, S.; Vanoli, G.P. Optimization of building envelope design for nZEBs in Mediterranean climate: Performance analysis of residential case study. Appl. Energy 2016, 183, 938–957. [Google Scholar] [CrossRef]
  14. Wang, Z.X.; Zhao, J. Optimization of passive envelop energy efficient measures for office buildings in different climate regions of China based on modified sensitivity analysis. Sustainabilty 2018, 10, 907. [Google Scholar] [CrossRef] [Green Version]
  15. Touloupaki, E.; Theodosiou, T. Optimization of external envelope insulation thickness: A parametric study. Energies 2017, 10, 3. [Google Scholar] [CrossRef] [Green Version]
  16. Sun, Y.Y.; Wilson, R.B.; Wu, Y.P. A Review of Transparent Insulation Material (TIM) for building energy saving and daylight comfort. Appl. Energy 2018, 226, 713–729. [Google Scholar] [CrossRef]
  17. Alam, M.J.; Islam, M.A. Effect of external shading and window glazing on energy consumption of buildings in Bangladesh. Advan. Build. Energy Res. 2017, 11, 180–192. [Google Scholar] [CrossRef]
  18. Hassouneh, K.; Alshboul, A.; Al-Salaymeh, A. Influence of windows on the energy balance of apartment buildings in Amman. Energy Conv. Manag. 2010, 51, 1583–1591. [Google Scholar] [CrossRef]
  19. Kirimtat, A.; Koyunbaba, B.K.; Chatzikonstantinou, I.; Sariyildiz, S. Review of simulation modeling for shading devices in buildings. Renew. Sustain. Energy Rev. 2016, 53, 23–49. [Google Scholar] [CrossRef]
  20. Jiang, Y. Ultra-Low Energy Consumption Building Technology and Application; China Building Industry Press: Beijing, China, 2005. [Google Scholar]
  21. Palmero-Marrero, A.I.; Oliveira, A.C. Effect of louver shading devices on building energy requirements. Appl. Energy 2010, 87, 2040–2049. [Google Scholar] [CrossRef]
  22. Liu, S.; Kwok, Y.T.; Lau, K.K.L.; Chan, P.W.; Ng, E. Investigating the energy saving potential of applying shading panels on opaque façades: A case study for residential buildings in Hong Kong. Energy Build. 2019, 195, 78–91. [Google Scholar] [CrossRef]
  23. Gago, E.J.; Muneer, T.; Knez, M.; Köster, H. Natural light controls and guides in buildings. Energy saving for electrical lighting, reduction of cooling load. Renew. Sustain. Energy Rev. 2015, 41, 1–13. [Google Scholar] [CrossRef]
  24. Boyano, A.; Hernandez, P.; Wolf, O. Energy demands and potential savings in European office buildings: Case studies based on EnergyPlus simulations. Energy Build. 2013, 65, 19–28. [Google Scholar] [CrossRef]
  25. El Fouih, Y.; Stabat, P.; Rivière, P.; Hoang, P.; Archambault, V. Adequacy of air-to-air heat recovery ventilation system applied in low energy buildings. Energy Build. 2012, 54, 29–39. [Google Scholar] [CrossRef]
  26. Roulet, C.A.; Heidt, F.D.; Foradini, F.; Pibiri, M.-C. Real heat recovery with air handling units. Energy Build. 2001, 33, 495–502. [Google Scholar] [CrossRef]
  27. Orme, M. Estimates of the energy impact of ventilation and associated financial expenditures. Energy Build. 2001, 33, 199–205. [Google Scholar] [CrossRef]
  28. Liddament, M.W.; Orme, M. Energy and ventilation. Appl. Therm. Eng. 1998, 18, 1101–1109. [Google Scholar] [CrossRef]
  29. Simonson, C. Energy consumption and ventilation performance of a naturally ventilated ecological house in a cold climate. Energy Build. 2005, 37, 23–35. [Google Scholar] [CrossRef]
  30. Zhong, K.; Kang, Y.M. Applicability of air-to-air heat recovery ventilators in China. Appl. Therm. Eng. 2009, 29, 830–840. [Google Scholar] [CrossRef]
  31. Kang, Y.M.; Wang, Y.J.; Zhong, K.; Liu, J.P. Temperature ranges of the application of air-to-air heat recovery ventilator in supermarkets in winter, China. Energy Build. 2010, 42, 2289–2295. [Google Scholar] [CrossRef]
  32. Dell’Osso, G.R.; Iannone, F.; Pierucci, A.; Rinaldi, A. Control strategies of the natural ventilation for passive cooling for an existing residential building in Mediterranean climate. In Proceedings of the 36th AIVC-5th TightVent-3rd Venticool Conference, Madrid, Spain, 23–24 September 2015; pp. 396–405. [Google Scholar]
  33. Liu, Z.J.; Liu, Y.W.; He, B.J.; Xu, W.; Jin, G.Y.; Zhang, X.T. Application and suitability analysis of the key technologies in nearly zero energy buildings in China. Renew. Sustain. Energy Rev. 2019, 101, 329–345. [Google Scholar] [CrossRef]
  34. Zhou, Z.H.; Feng, L.; Zhang, S.Z.; Wang, C.D.; Chen, G.Y.; Du, T.; Li, Y.S.; Zuo, J. The operational performance of “net zero energy building”: A study in China. Appl. Energy 2016, 177, 716–728. [Google Scholar] [CrossRef]
  35. Wilberforce, T.; Baroutaji, A.; El Hassan, Z.; Thompson, J.; Soudan, B.; Olabi, A.G. Prospects and challenges of concentrated solar photovoltaics and enhanced geothermal energy technologies. Sci. Total Env. 2018, 659, 851–961. [Google Scholar] [CrossRef] [Green Version]
  36. Good, C.; Andresen, I.; Hestnes, A.G. Solar energy for net zero energy buildings—A comparison between solar thermal, PV and photovoltaic–thermal (PV/T) systems. Sol. Energy 2015, 122, 986–996. [Google Scholar] [CrossRef] [Green Version]
  37. Wu, W.; Skye, H.M. Net-zero nation: HVAC and PV systems for residential net-zero energy buildings across the United States. Energy Convers. Manag. 2018, 177, 605–628. [Google Scholar] [CrossRef]
  38. Ascione, F.; D’Agostino, D.; Marino, C.; Minichiello, F. Earth-to-air heat exchanger for NZEB in Mediterranean climate. Renew. Energy 2016, 99, 553–563. [Google Scholar] [CrossRef]
  39. Raji, B.; Tenpierik, M.J.; van den Dobbelsteen, A. An assessment of energy-saving solutions for the envelope design of high-rise buildings in temperate climates: A case study in The Netherlands. Energy Build. 2016, 124, 210–221. [Google Scholar] [CrossRef]
  40. Pikas, E.; Thalfeldt, M.; Kurnitski, J. Cost optimal and nearly zero energy building solutions for office buildings. Energy Build. 2014, 74, 30–42. [Google Scholar] [CrossRef]
  41. Rey-Hernandez, J.M.; Velasco-Gomez, E.; San Jose-Alonso, J.F.; Tejero-Gonzalez, A.; Gonzalez-Gonzalez, S.L.; Rey-Martinez, F.J. Monitoring data study of the performance of renewable energy systems in a near zero energy building in Spain: A case study. Energies 2018, 11, 2979. [Google Scholar] [CrossRef] [Green Version]
  42. Rey-Hernandez, J.M.; Velasco-Gomez, E.; San Jose-Alonso, J.E.; Tejero-Gonzalez, A.; Rey-Martinez, F.J. Energy analysis at a near zero energy building, a case-study in Spain. Energies 2018, 11, 857. [Google Scholar] [CrossRef] [Green Version]
  43. Fernández Hernández, F.; Cejudo López, J.M.; Peña Suárez, J.M.; González Muriano, M.C.; Carrillo Rueda, S. Effects of louvers shading devices on visual comfort and energy demand of an office building. A case of study. Energy Procedia 2017, 140, 207–216. [Google Scholar] [CrossRef]
  44. Goia, F. Search for the optimal window-to-wall ratio in office buildings in different European climates and the implications on total energy saving potential. Sol. Energy 2016, 132, 467–492. [Google Scholar] [CrossRef]
  45. Rahman, M.M.; Rasul, M.G.; Khan, M.M.K. Energy conservation measures in an institutional building in sub-tropical climate in Australia. Appl. Energy 2010, 87, 2994–3004. [Google Scholar] [CrossRef]
  46. Irulegi, O.; Ruiz-Pardo, A.; Serra, A.; Salmeron, J.M.; Vega, R. Retrofit strategies towards Net Zero Energy Educational Buildings: A case study at the University of the Basque Country. Energy Build. 2017, 144, 387–400. [Google Scholar] [CrossRef]
  47. Freewan, A.A.Y. Impact of external shading devices on thermal and daylighting performance of offices in hot climate regions. Sol. Energy 2014, 102, 14–30. [Google Scholar] [CrossRef]
  48. Al-Masrani, S.M.; Al-Obaidi, K.M.; Zalin, N.A.; Isma, M.I.A. Design optimisation of solar shading systems for tropical office buildings: Challenges and future trends. Sol. Energy 2018, 170, 849–872. [Google Scholar] [CrossRef]
  49. Kamal, R.; Moloney, F.; Wickramaratne, C.; Narasimhan, A.; Goswami, D.Y. Strategic control and cost optimization of thermal energy storage in buildings using EnergyPlus. Appl. Energy 2019, 246, 77–90. [Google Scholar] [CrossRef]
  50. IPMVP. Concepts and Options for Determining Energy and Water Savings; International Performance Measurement & Verification Protocol Committee: Washington, DC, USA, 2002. [Google Scholar]
  51. Cetin, K.S.; Fathollahzadeh, M.H.; Kunwar, N.; Do, H.; Tabares-Velasco, P.C. Development and validation of an HVAC on/off controller in EnergyPlus for energy simulation of residential and small commercial buildings. Energy Build. 2019, 183, 467–483. [Google Scholar] [CrossRef]
  52. ASHRAE. Measurement of Energy and Demand Savings; ASHRAE Guideline 14-2014; American Society of Heating, Refrigerating and Air-Conditioning Engineers Inc.: Atlanta, GA, USA, 2014. [Google Scholar]
  53. Ministry of Housing and Urban-Rural Development of the People’s Republic of China (MOHURD). Design Standard for Energy Efficiency of Public Buildings (GB50189-2015); China Building Industry Press: Beijing, China, 2015.
  54. Ministry of Housing and Urban-Rural Development of the People’s Republic of China (MOHURD). Design Code for Heating Ventilation and Air Conditioning of Civil Buildings (GB 50736—2012); China Standard Press: Beijing, China, 2012.
  55. Ministry of Housing and Urban-Rural Development of the People’s Republic of China (MOHURD). Evaluation Standard for Application of Renewable Energy in Buildings (GB/T 50801-2013); China Standard Press: Beijing, China, 2012.
  56. Huang, L.; Song, B.; Deng, Q.Q.; Zheng, R.Y. Performance simulation and economic analysis of solar air conditioning system in hot summer and cold winter areas. Sol. Energy 2019, 1, 71–76. [Google Scholar]
  57. Eicker, U.; Pietruschka, D. Design and performance of solar powered absorption cooling system in office buildings. Energy Build. 2009, 41, 81–91. [Google Scholar] [CrossRef]
  58. Xu, W.; Sun, D.Y.; Lu, F.; Yu, Z.Y.; Wang, J. Research progress and reflection on the definition and technical index system of nearly zero-energy. Build. Sci. 2018, 34, 1–9. [Google Scholar]
  59. Sun, P.C.; Wu, J.S.; Ge, X.; Wang, Y. Research on net zero energy building energy consumption index system. Constr. Sci. Technol. 2019, 18, 31–34. [Google Scholar] [CrossRef]
  60. Liu, Y.; Lam, J.C.; Tsang, C.L. Energy performance of building envelopes in different climate zones in China. Appl. Energy 2008, 85, 800–817. [Google Scholar]
  61. Ministry of Housing and Urban-Rural Development of the People’s Republic of China (MOHURD). Technical Guidelines for Passive Ultra-Low-Energy Green Buildings (Trial) (Residential Buildings); Ministry of Housing and Urban-Rural Development: Beijing, China, 2015.
  62. Murray, M.; Robin, L.; Andrew, B.; Yasmin, B. Climate Consultant 4.0 Develops Design Guidelines for Each Unique Climate; American Solar Energy Society: Buffalo, NY, USA. Available online: http://www.energy-design-tools.aud.ucla.edu/papers/ASES09-Milne.pdf (accessed on 20 May 2009).
  63. Zhao, L.J. Analysis on College Building Design Strategies in Cold Northern Regions from the Perspective of Low Energy Consumption; Dalian University of Technology: Dalian, China, 2016. [Google Scholar]
  64. Sun, S. Research on the Design Strategy of the Office Buildings in the Cold Area Zero Energy Consumption; Hebei University of Technology: Hongqiao, China, 2017. [Google Scholar]
  65. Rinaldi, A.; Roccotelli, M.; Mangini, A.M.; Fanti, M.P.; Iannone, F. Natural ventilation for passive cooling by means of optimized control logics. Procedia Eng. 2017, 180, 841–850. [Google Scholar] [CrossRef]
  66. Ministry of Housing and Urban-Rural Development of the People’s Republic of China (MOHURD). Code for Design of Heating Ventilation and Air Conditioning (GB 50019—2003); China Standard Press: Beijing, China, 2003.
  67. Li, H.L. Analysis and Optimization of Indoor Light Environment in Typical Space of Universities; Qingdao University of Technology: Qingdao, China, 2018. [Google Scholar]
  68. Ministry of Housing and Urban-Rural Development of the People’s Republic of China (MOHURD). Standard for Daylighting Design of Building (GB 50033-2013); China Standard Press: Beijing, China, 2012.
  69. Dieckmanu, J.; Roth, K.W.; Brodrick, J. Air-to-air energy recovery heat exchangers. ASHRAE J. 2003, 45, 57–58. [Google Scholar]
  70. Liu, Y. Research on the Contribution Rate of Ground Source Heat Pump Used in Low Energy Building; China Academy of Building Sciences: Beijing, China, 2016. [Google Scholar]
  71. Wang, Y.; Wang, D.J.; Liu, Y.F. Study on comprehensive energy-saving of shading and photovoltaics of roof added PV module. In Proceedings of the 11th Nordic Symposium on Building Physics, Trondheim, Norway, 11–14 June 2017; Volume 132, pp. 598–603. [Google Scholar]
Figure 1. Appearance photo of the base case.
Energies 12 04734 g001
Figure 2. Case study model in DesignBuilder.
Energies 12 04734 g002
Figure 3. The difference between actual electricity energy consumption and simulated data from DesignBuilder (DB).
Energies 12 04734 g003
Figure 4. The primary energy consumption in base cases.
Energies 12 04734 g004aEnergies 12 04734 g004b
Figure 5. Influence of the U-value of exterior wall on primary energy consumption in four cities.
Energies 12 04734 g005
Figure 6. Influence of the U-value of roof on primary energy consumption in four cities.
Energies 12 04734 g006
Figure 7. The primary energy consumption of different window glass configurations.
Energies 12 04734 g007
Figure 8. The best orientation of the four cities. (a) The best orientation in Harbin; (b) The best orientation in Tianjin; (c) The best orientation in Shanghai; (d) The best orientation in Guangzhou.
Energies 12 04734 g008
Figure 9. Monthly effective shading index in four cities. (a) Monthly effective shading index in Harbin; (b) Monthly effective shading index in Tianjin; (c) Monthly effective shading index in Shanghai; (d) Monthly effective shading index in Guangzhou.
Energies 12 04734 g009aEnergies 12 04734 g009b
Figure 10. Primary energy consumption in shading case and base case in four cities.
Energies 12 04734 g010
Figure 11. Monthly effective natural ventilation index in four cities. (a) Monthly effective natural ventilation index in Harbin; (b) Monthly effective natural ventilation index in Tianjin; (c) Monthly effective natural ventilation index in Shanghai; (d) Monthly effective natural ventilation index in Guangzhou.
Energies 12 04734 g011
Figure 12. Primary energy consumption in natural ventilation case and base case in four cities.
Energies 12 04734 g012
Figure 13. The influence of natural ventilation on indoor temperature. (a) The influence of natural ventilation on indoor temperature in Harbin; (b) The influence of natural ventilation on indoor temperature in Tianjin; (c) The influence of natural ventilation on indoor temperature in Shanghai; (d) The influence of natural ventilation on indoor temperature in Guangzhou.
Energies 12 04734 g013aEnergies 12 04734 g013b
Figure 14. Ecotect analysis model.
Energies 12 04734 g014
Figure 15. Primary energy consumption in lighting control case and base case in four cities.
Energies 12 04734 g015
Figure 16. Primary energy consumption in air-to-air heat recovery case and base case in four cities.
Energies 12 04734 g016
Figure 17. The primary energy consumption in GSHP case and base case in four cities.
Energies 12 04734 g017
Figure 18. The weight of various technologies in four climatic regions. (a) The weight of various technologies in SC region; (b) The weight of various technologies in CC region; (c) The weight of various technologies in HS/CW region; (d) The weight of various technologies in HS/WW region.
Energies 12 04734 g018
Figure 19. Primary energy consumption of integrated design solution and base case in four cities.
Energies 12 04734 g019
Table 1. Small selection of case studies on nearly zero energy buildings (nZEBs).
Climate/Country/CityReference/TimeBuilding Type Energy-Saving Technologies
Mediterranean climate/four cities[13] (2016)ResidentialBuilding envelope, phase change materials, cool roof, several window-to-wall ratio (WWR), shading
Cold climate[29] (2005)ResidentialNatural ventilation
Mediterranean climate[38] (2016)MultipurposeEarth-to-air heat exchanger
Bangladesh[17] (2017)ResidentialShading and window glazing
Temperate climates[39] (2016)OfficeGlazing type, WWR, sun shading, and roof strategies
Cold Estonian climate[40] (2014)OfficeEnvelope, supply systems, fenestration, and energy sources
Mediterranean city[43] (2017)OfficeLouver shading devices
Oslo, Frankfurt, Rome, Athens[44] (2016)OfficeWWR
Subtropical climate[45] (2010)InstitutionalVariable air volume, high-performance chillers, photo electric dimming control system, double glazed low emittance windows, setpoint temperatures
Basque Country[46] (2017)EducationalNatural ventilation (summer), loss reduction (winter), solar gain increasing (winter), energy recovery (winter)
Hot climatic regions[47] (2014)OfficeShading devices
The tropical climate[48] (2018)OfficeSolar shading systems
China four climatic regions[14] (2018)OfficeExternal walls, roof, window and shading
Table 2. Indoor design parameters.
Indoor Temperature in Summer (°C)Indoor Relative Humidity in Summer (%)Indoor Temperature in Winter (°C)Indoor Relative Humidity in Winter (%)Design Fresh Air Volume (m3/person·h)
2655203524
Table 3. Components of the building.
ComponentDescription
Exterior wall190 mm thick aerated concrete block with 100 mm thick rock wool board
Heat transfer coefficient W/(m2·K)0.44
Roof100 mm thick reinforced concrete floor, 250 mm thick molded polystyrene board
Heat transfer coefficient W/(m2·K)0.15
Exterior windowBroken bridge aluminum 6 + 12 A + 6 Low-E insulating glass
Heat transfer coefficient W/(m2·K)2.17
SHGC0.53
Interior partition wall200 mm thick aerated concrete blocks with double face plastering
Heat transfer coefficient W/(m2·K)1.50
Table 4. Occupant, lighting, and indoor equipment information.
Room FunctionOccupant Density (people/m2)Lighting Density (W/m2)Indoor Equipment Power Density (W/m2)
General classroom0.794295
Ladder classroom0.665995
Corridor0.0250
Operation time7:00–18:00 on weekdays
Table 5. Climatic characteristics of the five climatic regions.
Climatic RegionsIndexRepresentative City
Leading IndexAuxiliary Index
SCAverage temperature of the coldest month: ≤−10 °CThe days of daily average temperature ≤5 °C: ≥145 dHarbin
CCAverage temperature of the coldest month: 0 to −10 °CThe days of daily average temperature ≤5 °C: 90–145 dTianjin
HS/CWAverage temperature of the coldest month: 0–10 °C
Average temperature of the hottest month: 25–30 °C
The days of daily average temperature ≤5 °C: 0–90 d
The days of daily average temperature ≥25 °C: 40–110 d
Shanghai
HS/WWAverage temperature of the coldest month: >10 °C
Average temperature of the hottest month: 25–29 °C
The days of daily average temperature ≥25 °C: 100–200 d
Guangzhou
MCAverage temperature of the coldest month: 0–13 °C
Average temperature of the hottest month: 18–25 °C
The days of daily average temperature ≤5 °C: 0–90 dNot considered
Table 6. The parameters in base case for four cities.
ParametersHarbinTianjinShanghaiGuangzhou
Indoor design parametersWinter design temperature (°C)202020---
Winter design relative humidity (%)353535---
Summer design temperature (°C)26262626
Summer design relative humidity (%)55555555
Design fresh air (m3/person·h)24242424
Envelope parametersExterior wall0.380.500.600.80
Heat transfer coefficient W/(m2·K)
Roof0.280.450.400.50
Heat transfer coefficient W/(m2·K)
Exterior window
Heat transfer coefficient W/(m2·K)2.202.402.603.00
SHGCSouth 0.48South 0.48South 0.40/North 0.44South 0.35/North 0.44
Air conditioning parametersHeating seasonNov. 1–Jan. 15Nov. 15–Jan. 15Dec. 1–Jan. 15---
Feb. 25–Mar. 31Feb. 25–Mar. 31------
Cooling seasonJun. 1–Jul. 15Jun. 1–Jul. 15Jun. 1–Jul. 15Apr. 1–Jul. 15
Aug. 25–Sep. 30Aug. 25–Sep. 30Aug. 25–Sep. 30Aug. 25–Nov. 1
Heating source
Heating system efficiency
or COP
Gas boiler Gas BoilerAir handing unit---
0.90.9------
------1.8---
Cooling sourceChillerChillerAir handing unitChiller
Cooling system COP4.04.02.82.8
Table 7. The structures and the thermal characters of exterior window.
NO.ConfigurationHeat Transfer Coefficient W/(m2·K)SHGC
GL15 Low-E + 9A + 5 + 9A + 5 three layers of insulating glass1.4610.380
GL25 Low-E + 12A + 5 + 12A + 5 three layers of insulating glass1.3110.339
GL35 Low- E + 12Ar + 5 + 12Ar + 5 three-layer argon-filled glass1.2160.373
GL45 Double-silver Low-E + 9Ar + 5 + 9Ar + 5 three-layer argon-filled glass1.1280.277
GL55 Three-silver Low-E + 12Ar + 5 + 12A + 5 three-layer argon-filled glass1.0230.267
GL65 Three-silver Low-E + 12A + 5 three-silver Low-E + 12A + 5 three-layer insulating glass0.8990.211
Table 8. The operation schedule of natural ventilation in four cities.
CityHarbinTianjinShanghaiGuangzhou
Transition season---May. 1–May. 30May. 1–May. 30---
Cooling seasonJun. 1–Jul. 15 Jun. 1–Jul. 15Jun. 1–Jul. 15Apr. 1–Jul. 15
Aug. 25–Sep. 30Aug. 25–Sep. 30Aug. 25–Sep. 30Aug. 25–Nov. 1
Table 9. Artificial hourly lighting rate of the working face on four typical days in Harbin (%).
Typical Days8:009:0010:0011:0012:0013:0014:0015:0016:0017:00
Spring equinox33.877.121.320.290.422.7713.5937.7462.0997.27
Summer solstice2.730.480.000.000.000.001.6416.8536.4152.31
Autumn equinox26.294.230.880.410.824.2619.5843.7168.28100.00
Winter solstice100.0083.1074.9171.4271.4274.9183.10100.00100.00100.00
Table 10. Artificial hourly lighting rate of the working face on four typical days in Tianjin (%).
Typical Days8:009:0010:0011:0012:0013:0014:0015:0016:0017:00
Spring equinox22.672.030.621.738.7626.3137.3747.6460.5880.45
Summer solstice15.719.8526.2946.662.2666.0061.6457.0958.6667.48
Autumn equinox11.693.710.083.7511.4131.7040.3858.6165.1187.56
Winter solstice100.0082.8973.3468.8367.0467.5871.0379.60100.00100.00
Table 11. Artificial hourly lighting rate of the working face on four typical days in Shanghai (%).
Typical Days8:009:0010:0011:0012:0013:0014:0015:0016:0017:00
Spring equinox17.582.221.966.6124.0431.1336.8044.9157.1680.77
Summer solstice0.600.220.040.000.002.229.9121.6736.7352.81
Autumn equinox9.021.963.3014.4826.9033.4538.4347.2961.5189.11
Winter solstice84.5070.7462.5858.8057.2859.6064.5273.1290.97100.00
Table 12. Artificial hourly lighting rate of the working face on four typical days in Guangzhou (%).
Typical Days8:009:0010:0011:0012:0013:0014:0015:0016:0017:00
Spring equinox55.5231.0521.5828.0637.2138.3533.8230.3038.3957.33
Summer solstice40.6524.1710.143.250.130.104.0612.4227.7045.59
Autumn equinox47.9328.7323.4029.9539.2539.1732.9130.0742.0263.02
Winter solstice87.1169.9460.5254.9652.2352.6255.5661.7272.2693.82
Table 13. System performance efficiency of ground source heat pump (GSHP).
GSHPHarbinTianjinShanghaiGuangzhou
SCOP6.06.02.62.6
SEER (system energy efficiency ratio)5.05.03.03.0
Table 14. The energy-saving contribution rate (ECR) of each technology after optimization in four cities (%).
TechnologySCCCHS/CWHS/WW
Passive technologyEnvelope11.38.91.8---
Shading0.40.83.24.1
Natural ventilation1.25.910.612.5
Active technologyLighting control7.213.115.610.3
Air-to-air heat recovery42.926.920.423.1
Renewable energyGSHP41.222.47.34.6
Table 15. The technologies and indicators in four climatic regions.
TechnologiesSC RegionCC RegionHS/CW RegionHS/WW Region
Exterior walls0.129 W/(m2·K)0.139 W/(m2·K)0.211 W/(m2·K)0.800 W/(m2·K)
Roof0.154 W/(m2·K)0.174 W/(m2·K)0.211 W/(m2·K)0.500 W/(m2·K)
WindowGL6GL6GL6Base case
Shading Not recommendedAdjustable louverAdjustable louverAdjustable louver
Schedule---May to SeptemberMay to SeptemberMay to October
VentilationSchedule control strategySchedule control strategySchedule control strategySchedule control strategy
Lighting controlGradual change controlGradual change controlGradual change controlGradual change control
Heat recoveryTotal heat recoveryTotal heat recoveryTotal heat recoveryTotal heat recovery
Efficiency75%75%75%75%
SCOP of GSHP6.06.02.62.6
SEER of GSHP5.05.03.03.0

