An Innovative Operation Strategy of ESS for Capacity Expansion of Renewable Energy and Customer Load with Electric Vehicle Chargers in Low Voltage Distribution Systems

 ,
,  ,
,
Abstract
1. Introduction
2. An Innovative Operation Strategy of Power Control ESS for Capacity Expansion
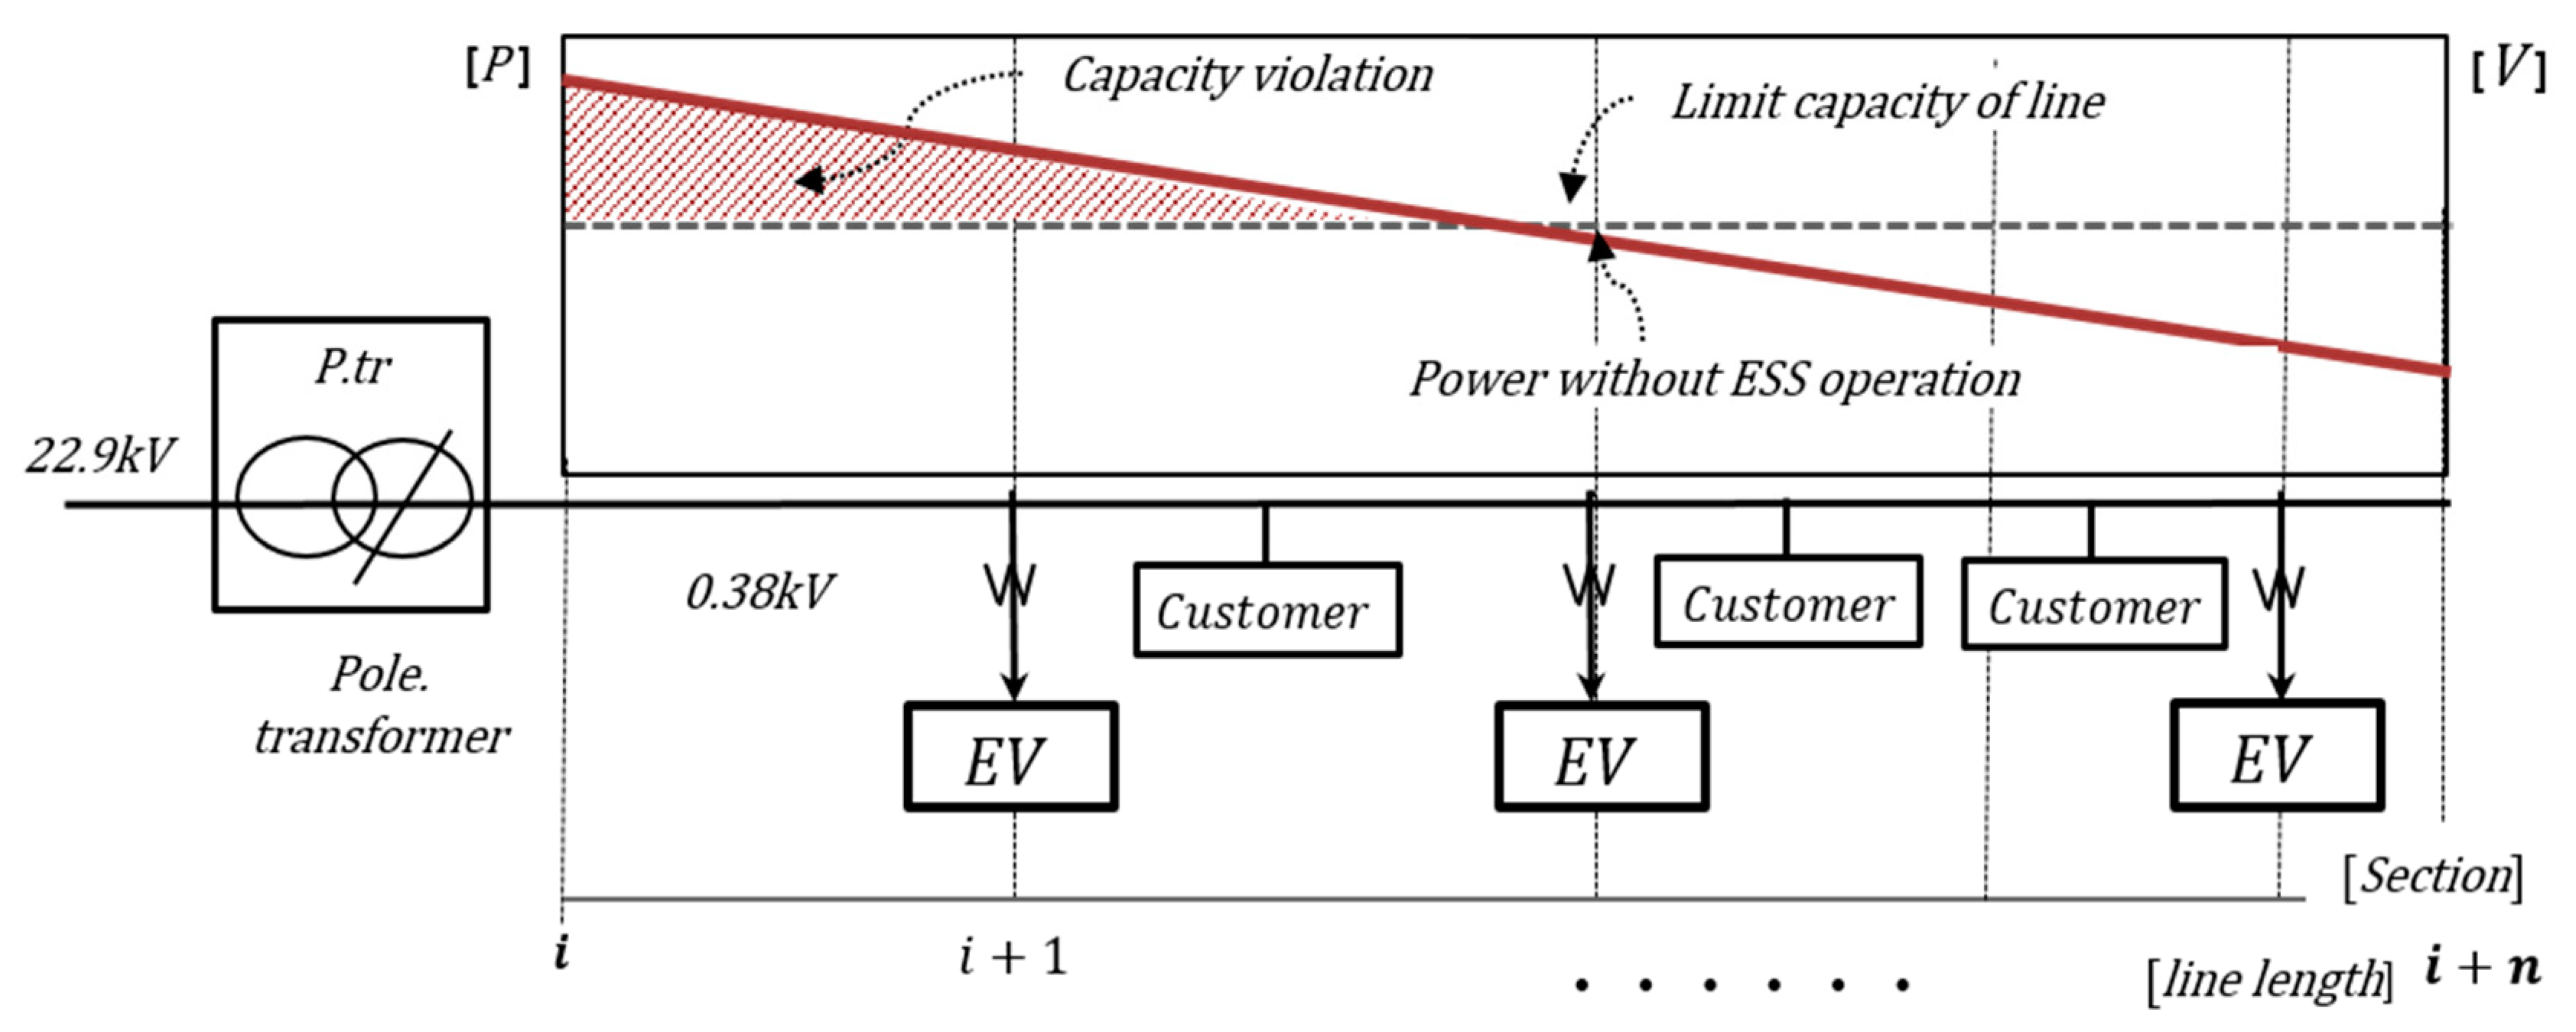
2.1. Necessity of Introducing Power Control ESS for Capacity Expansion of EV and RES
2.2. Power Control ESS for Capacity Expansion
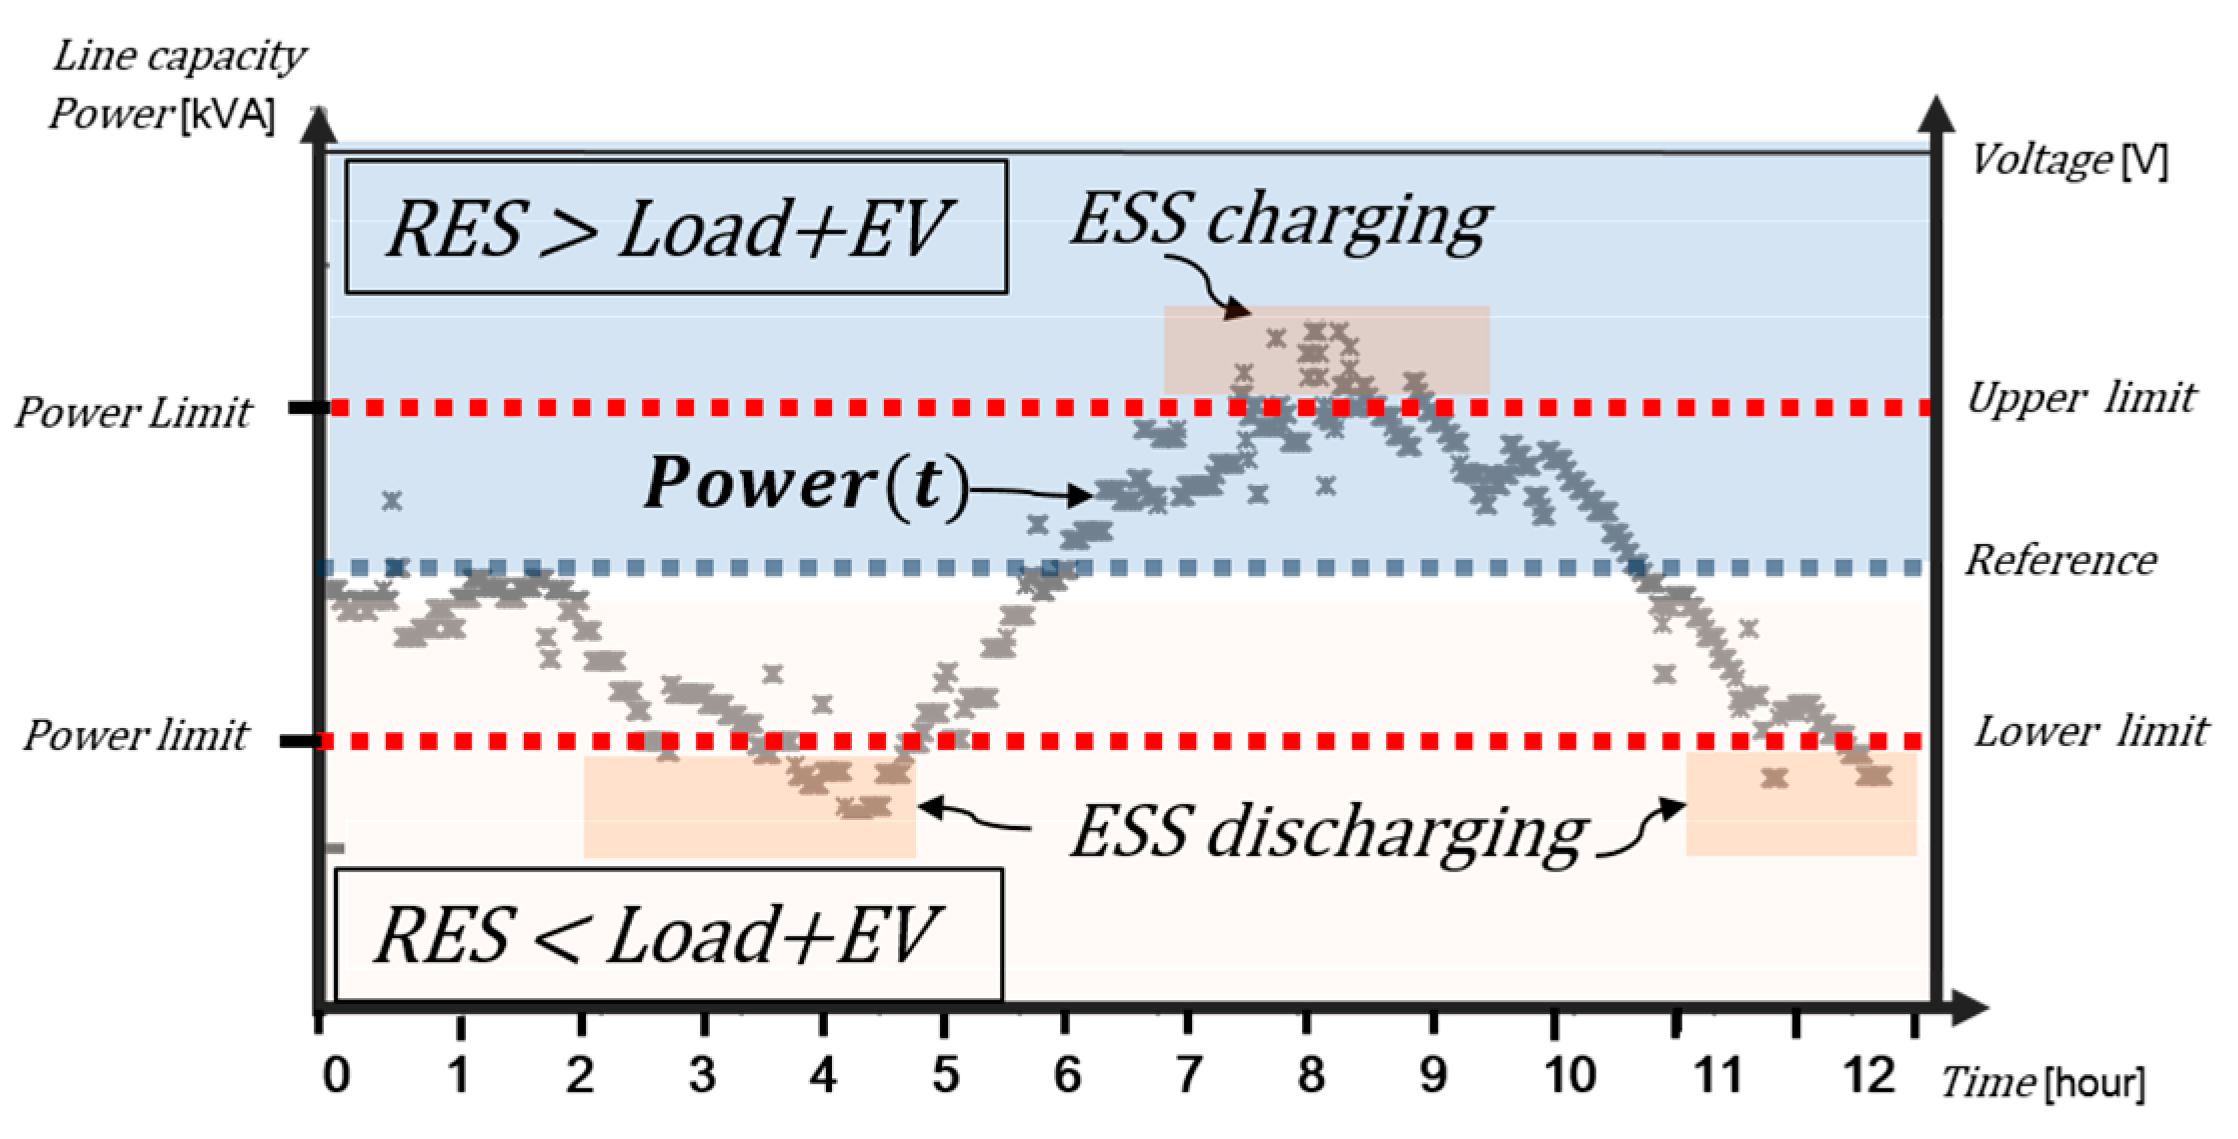
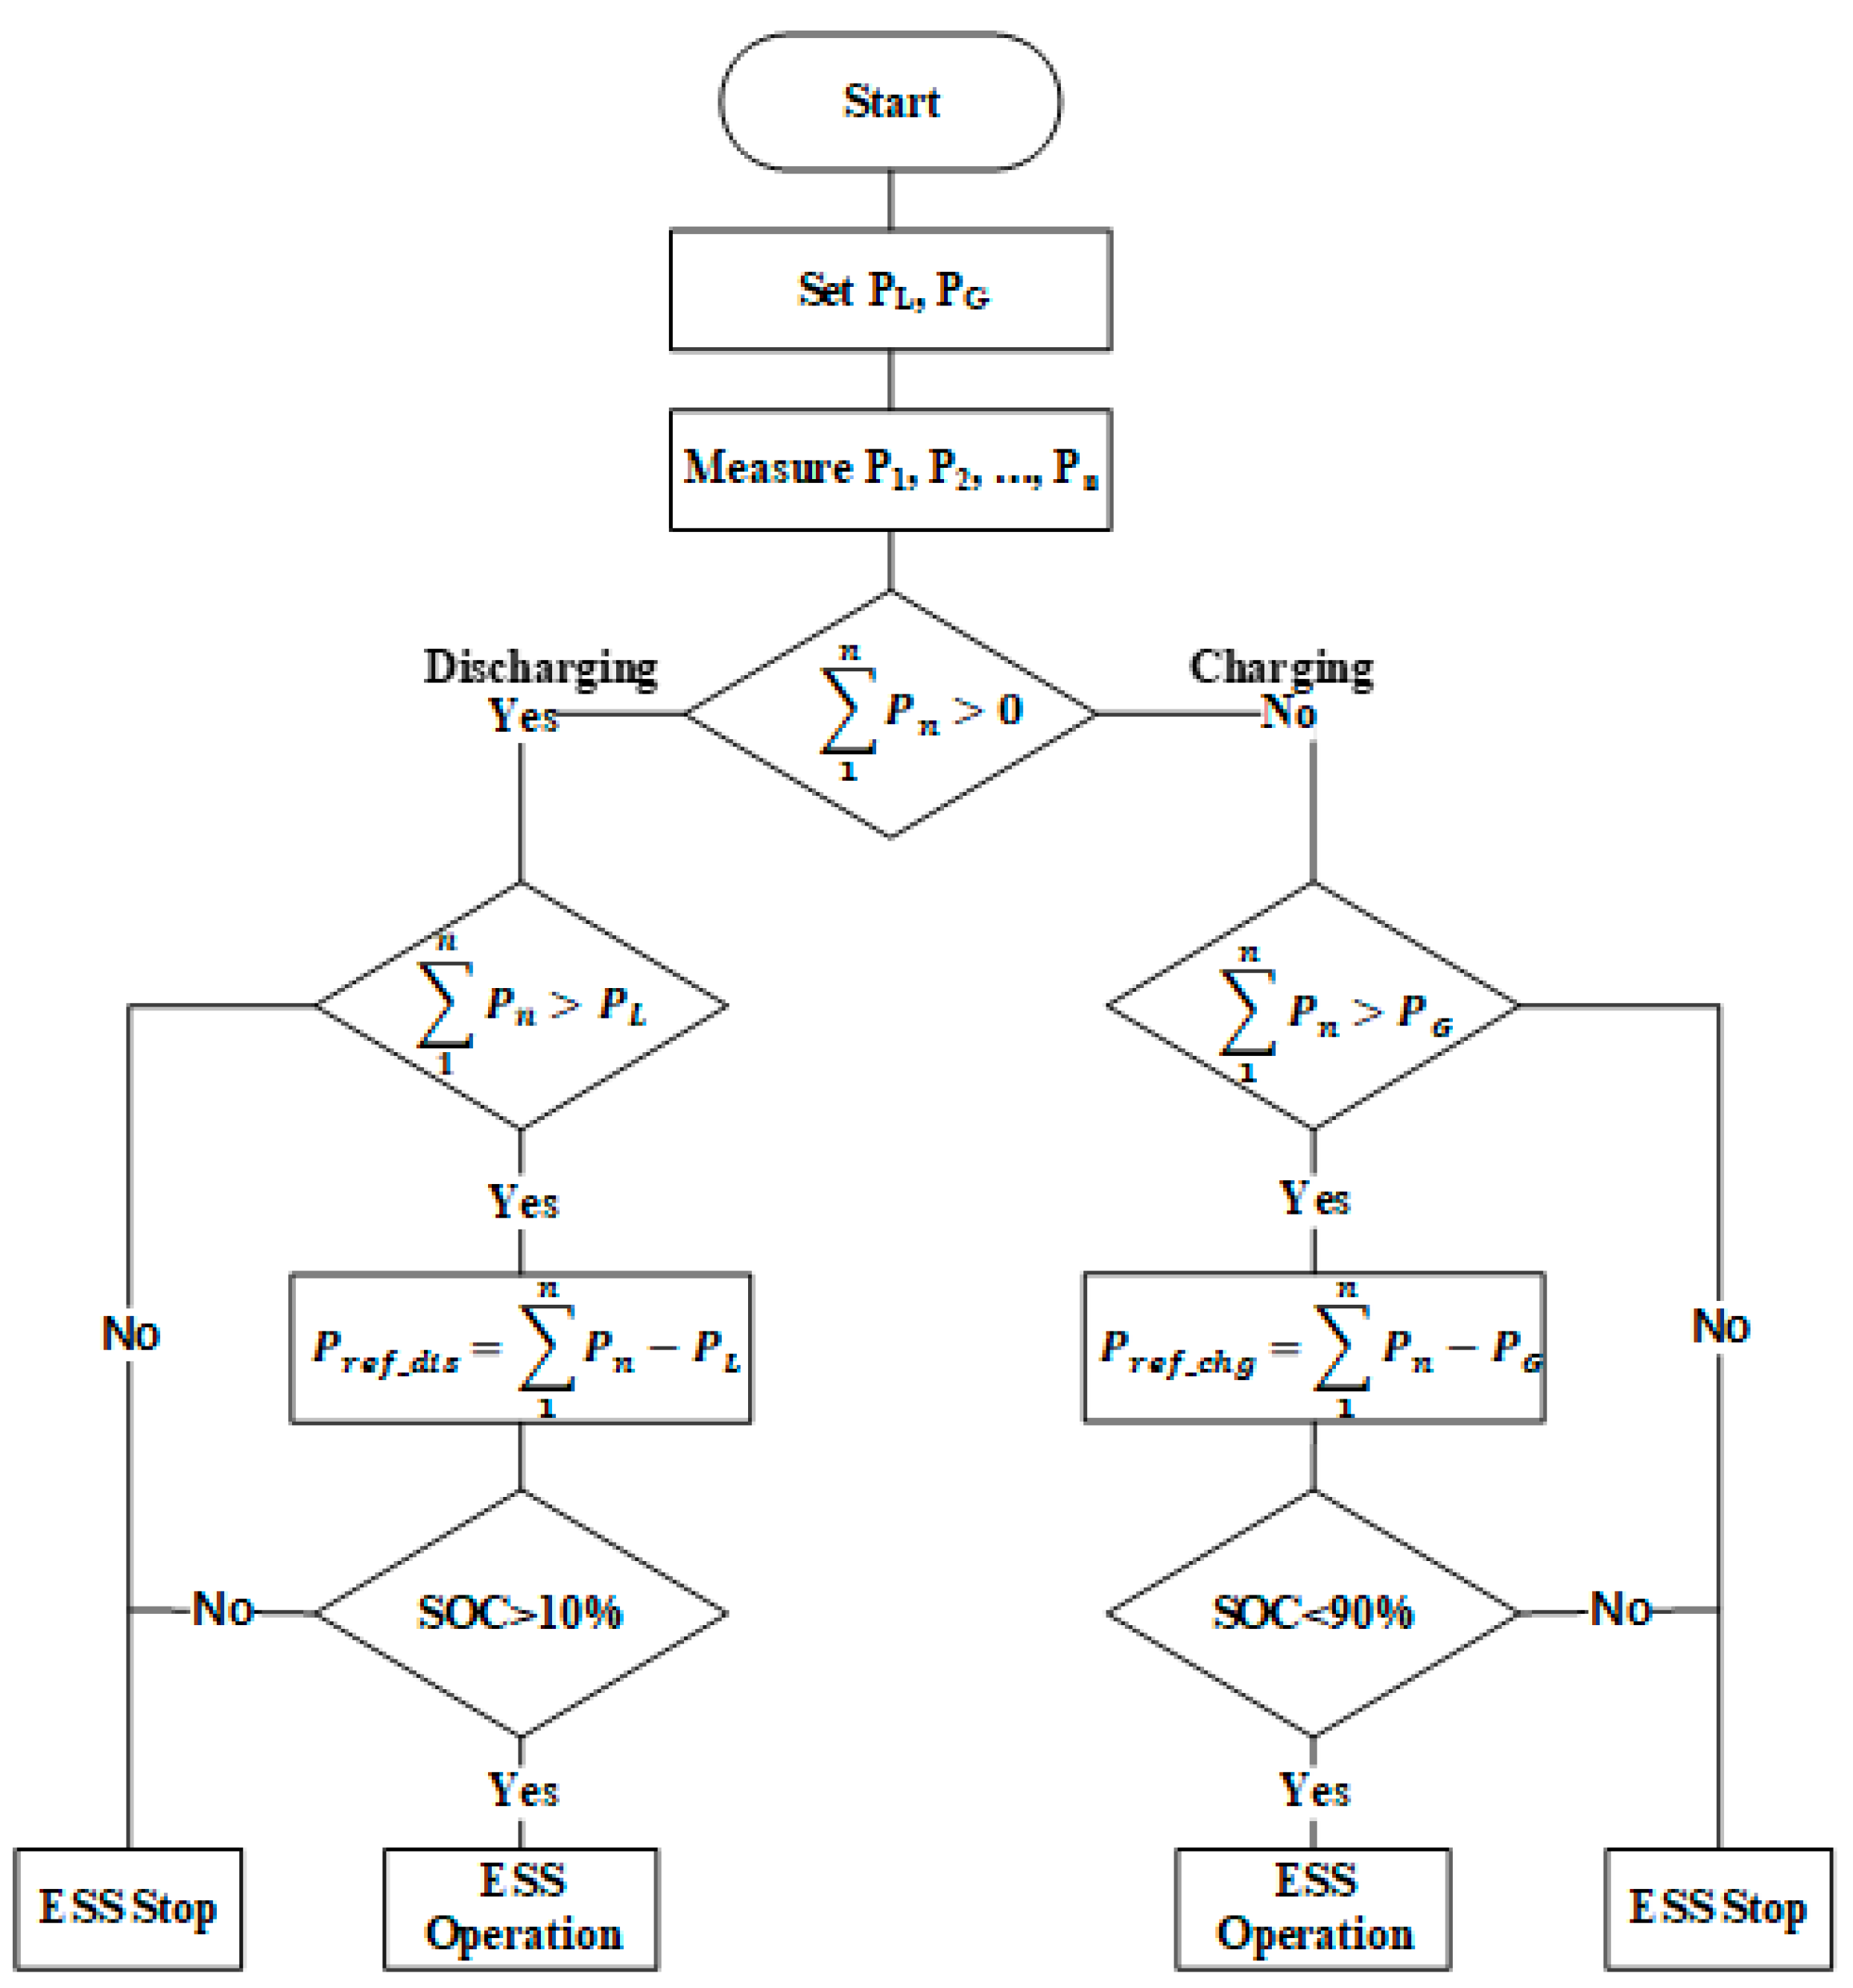
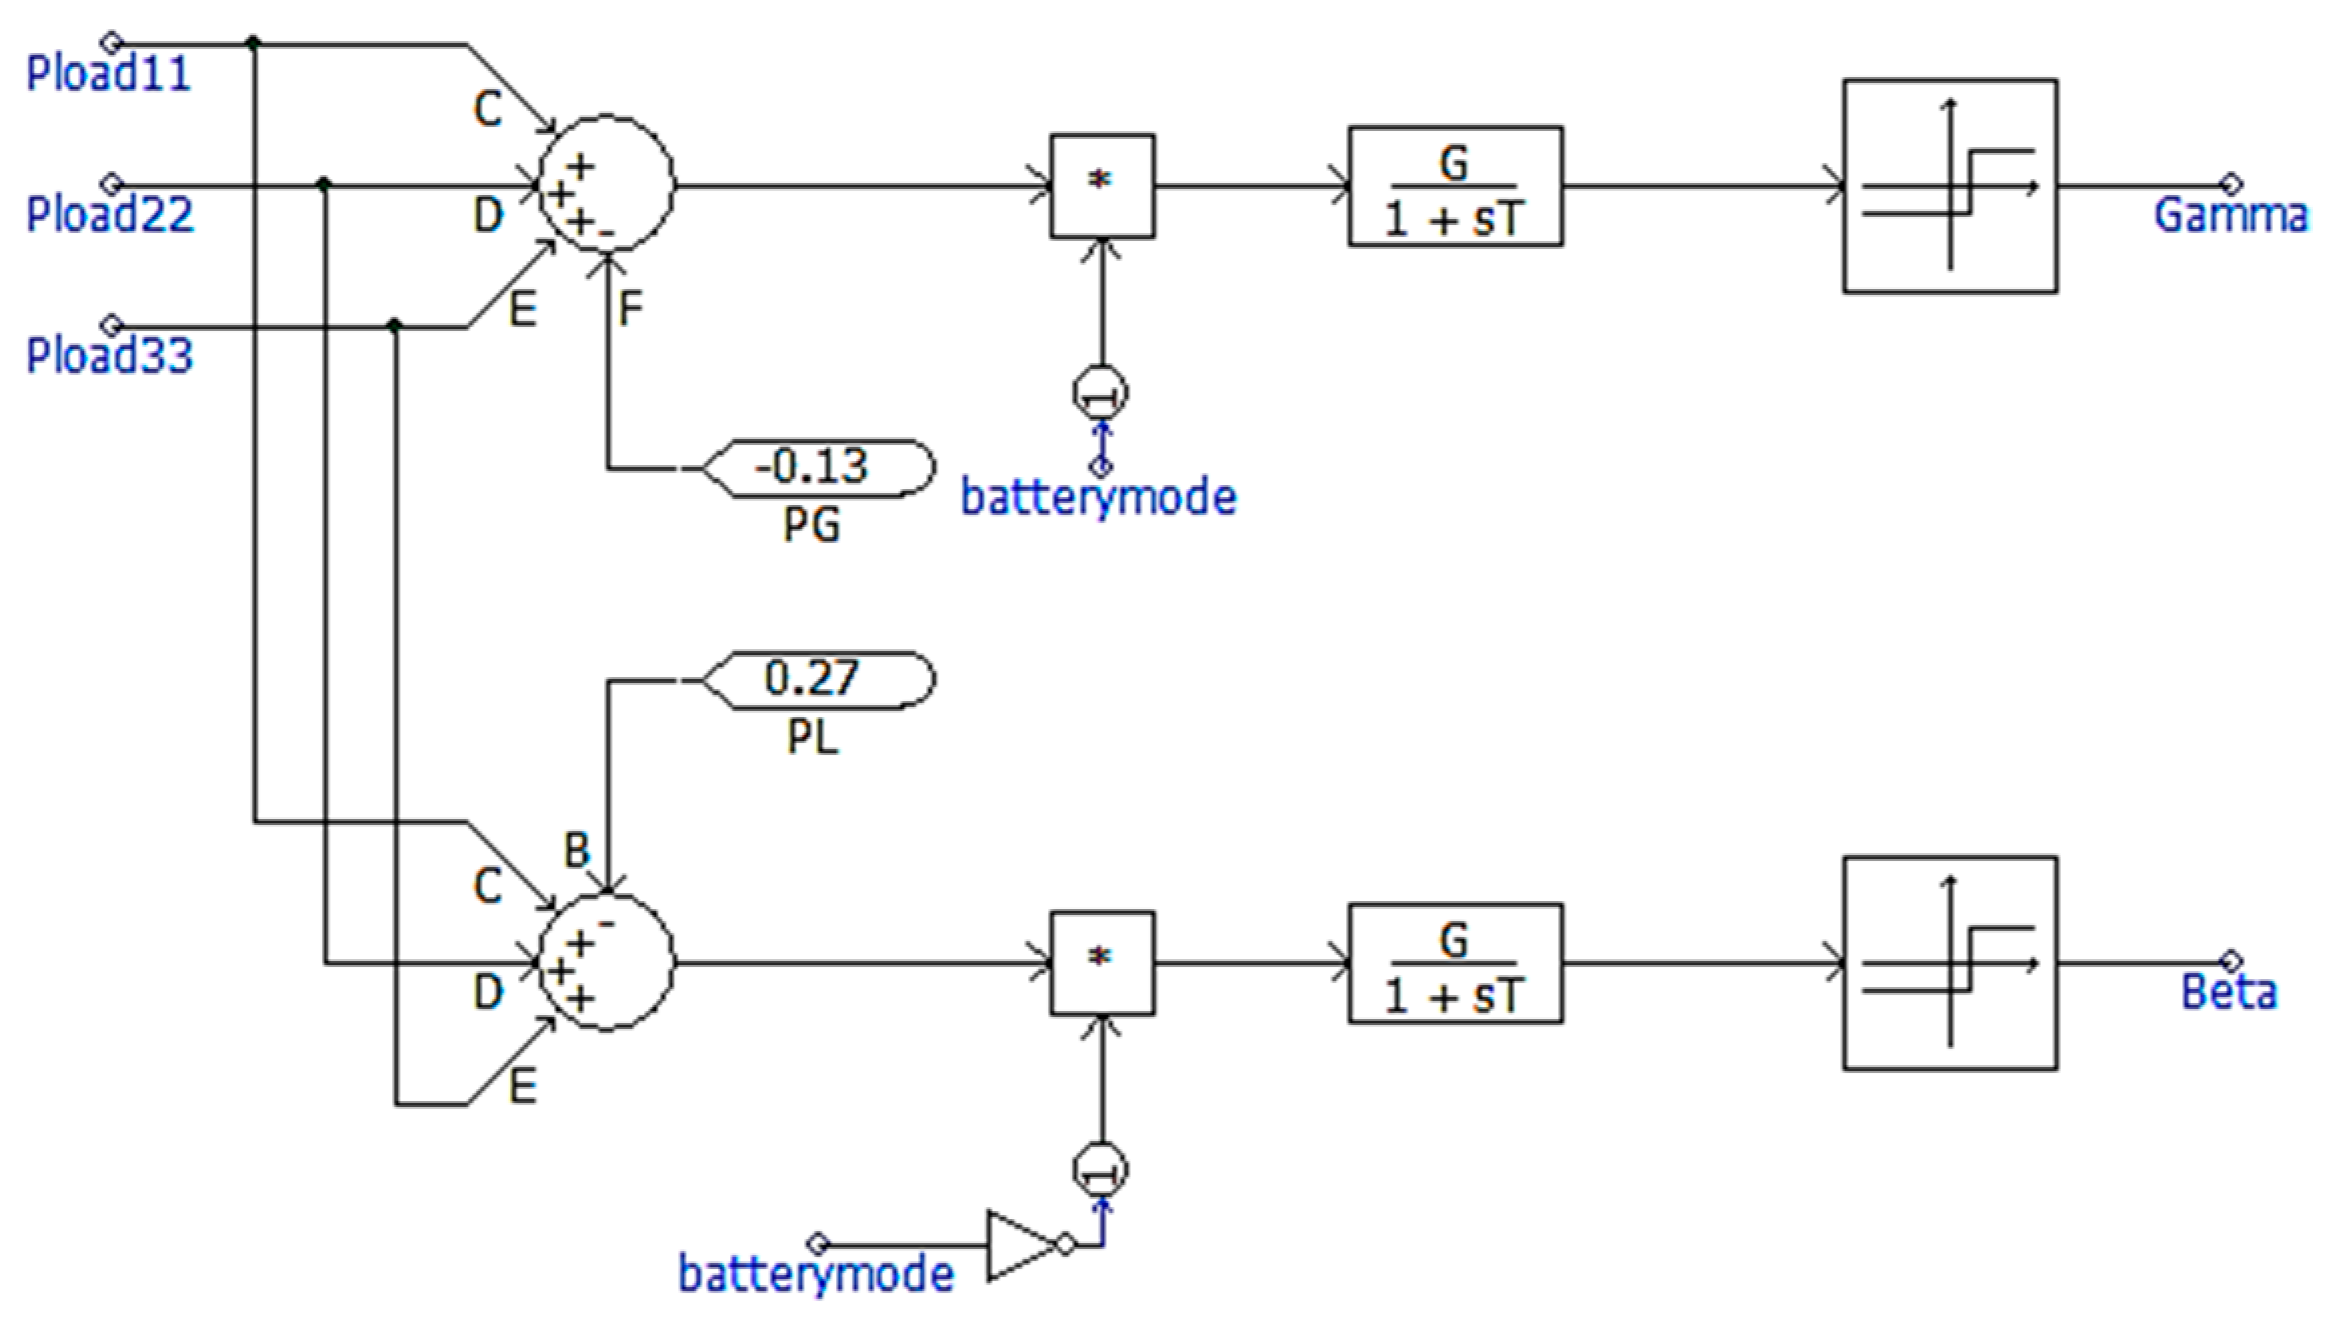
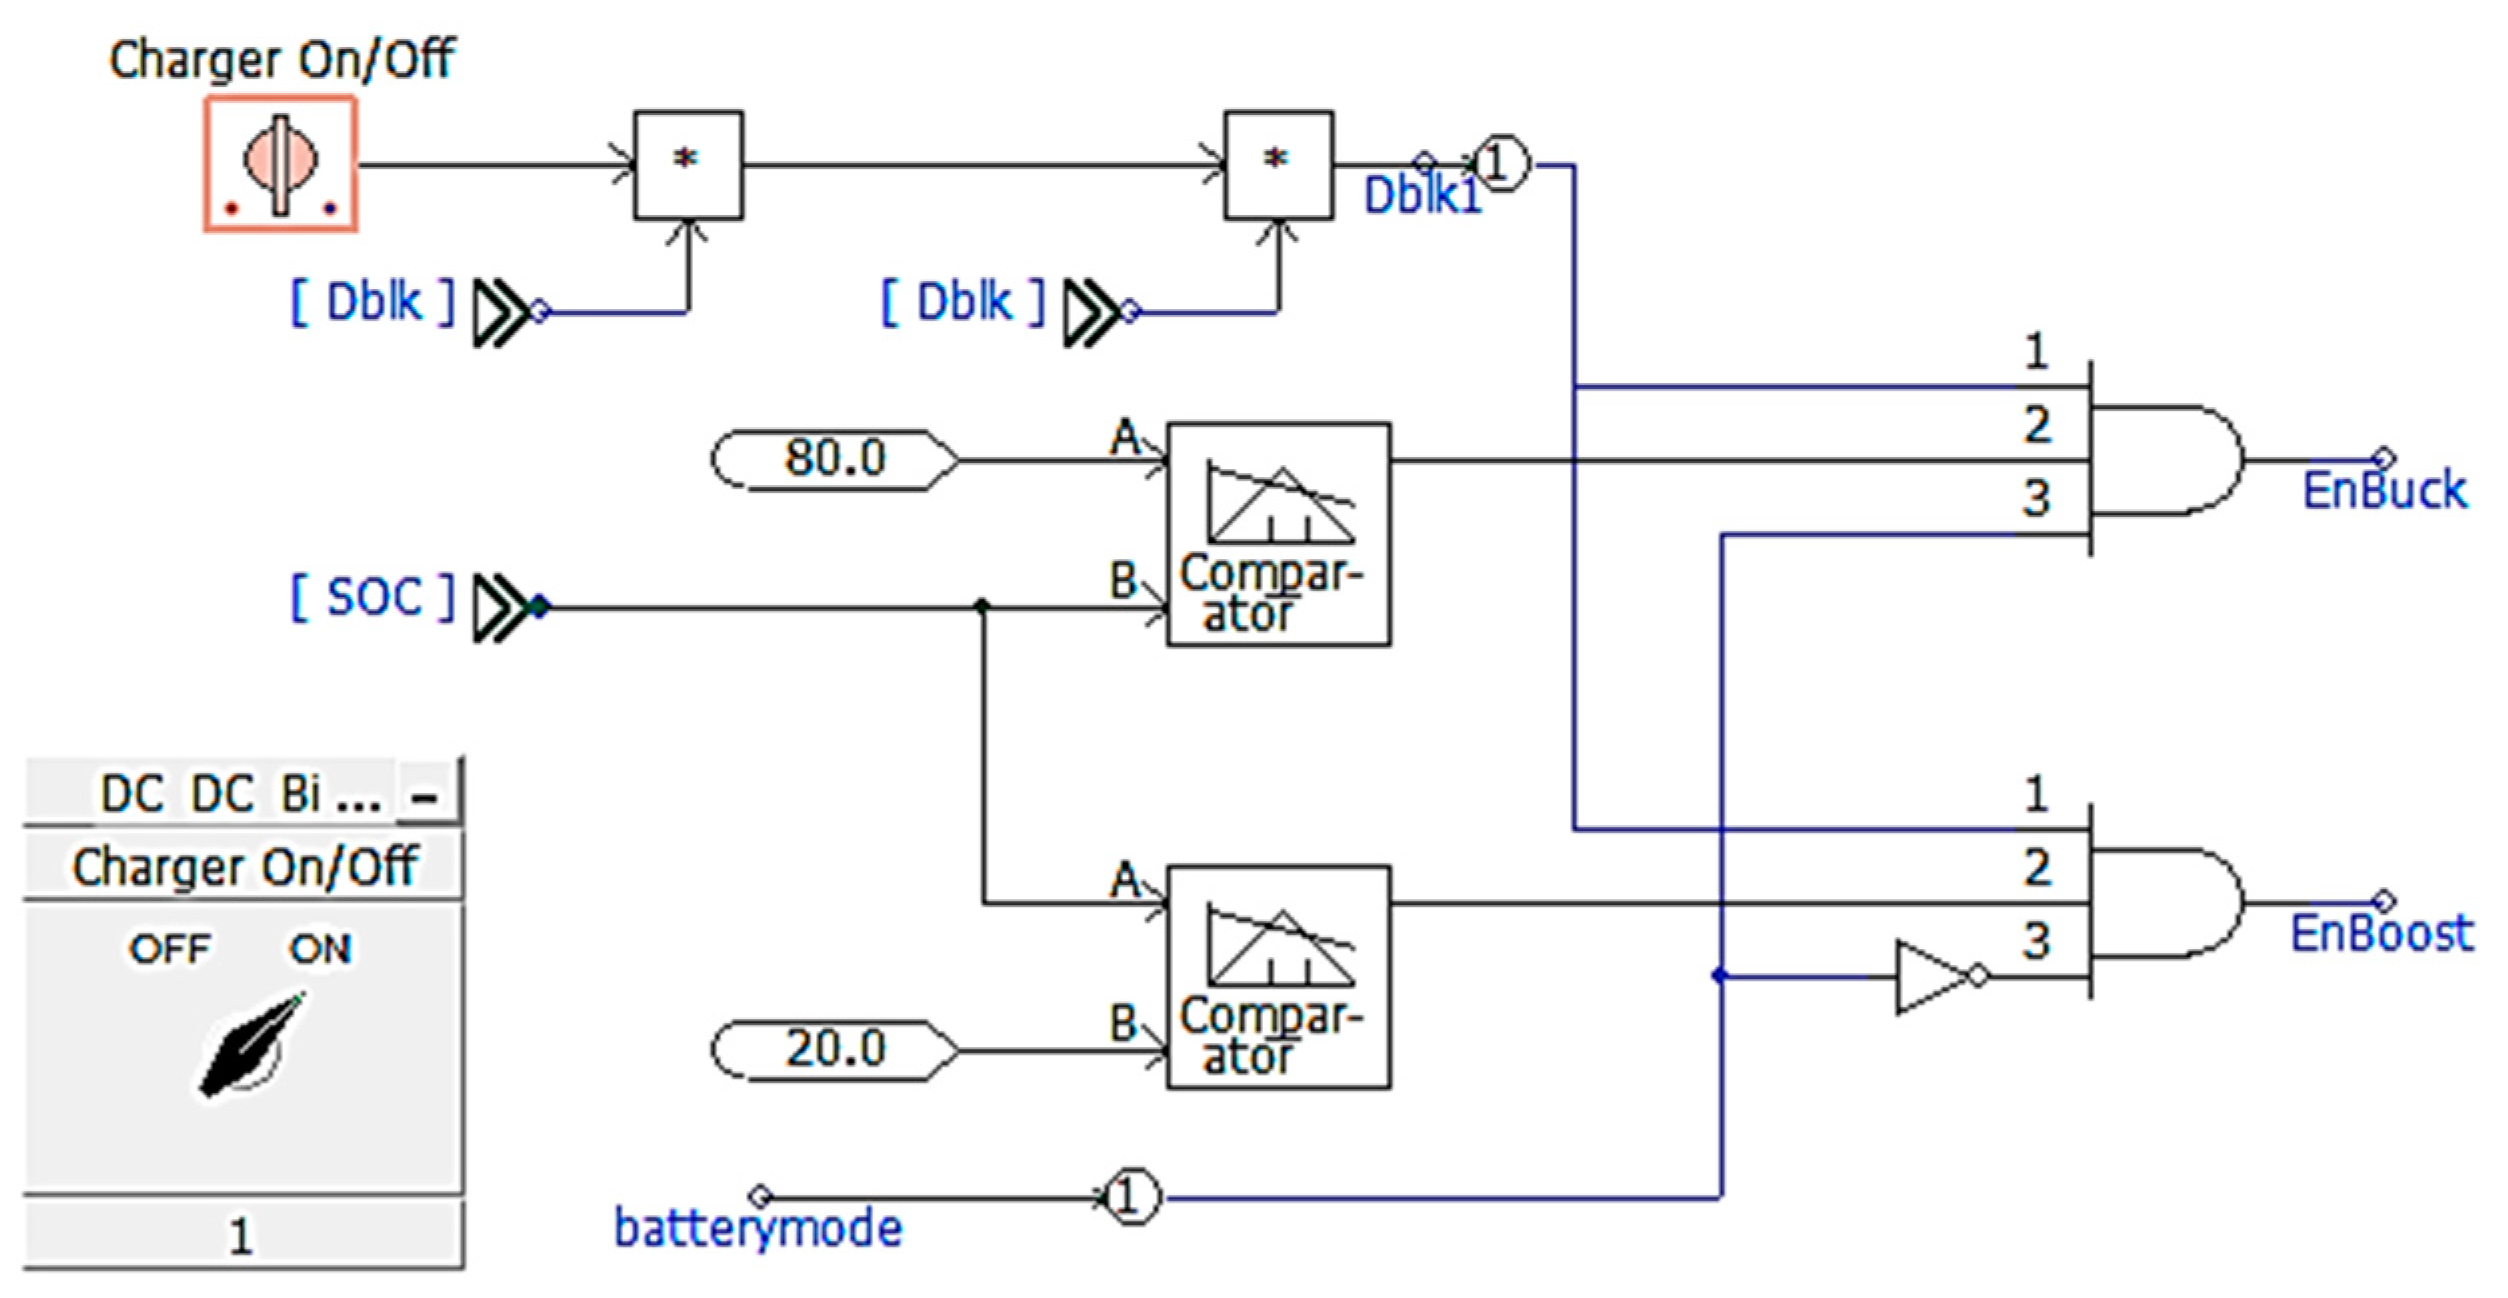
2.3. Operation Algorithm of Power Control ESS
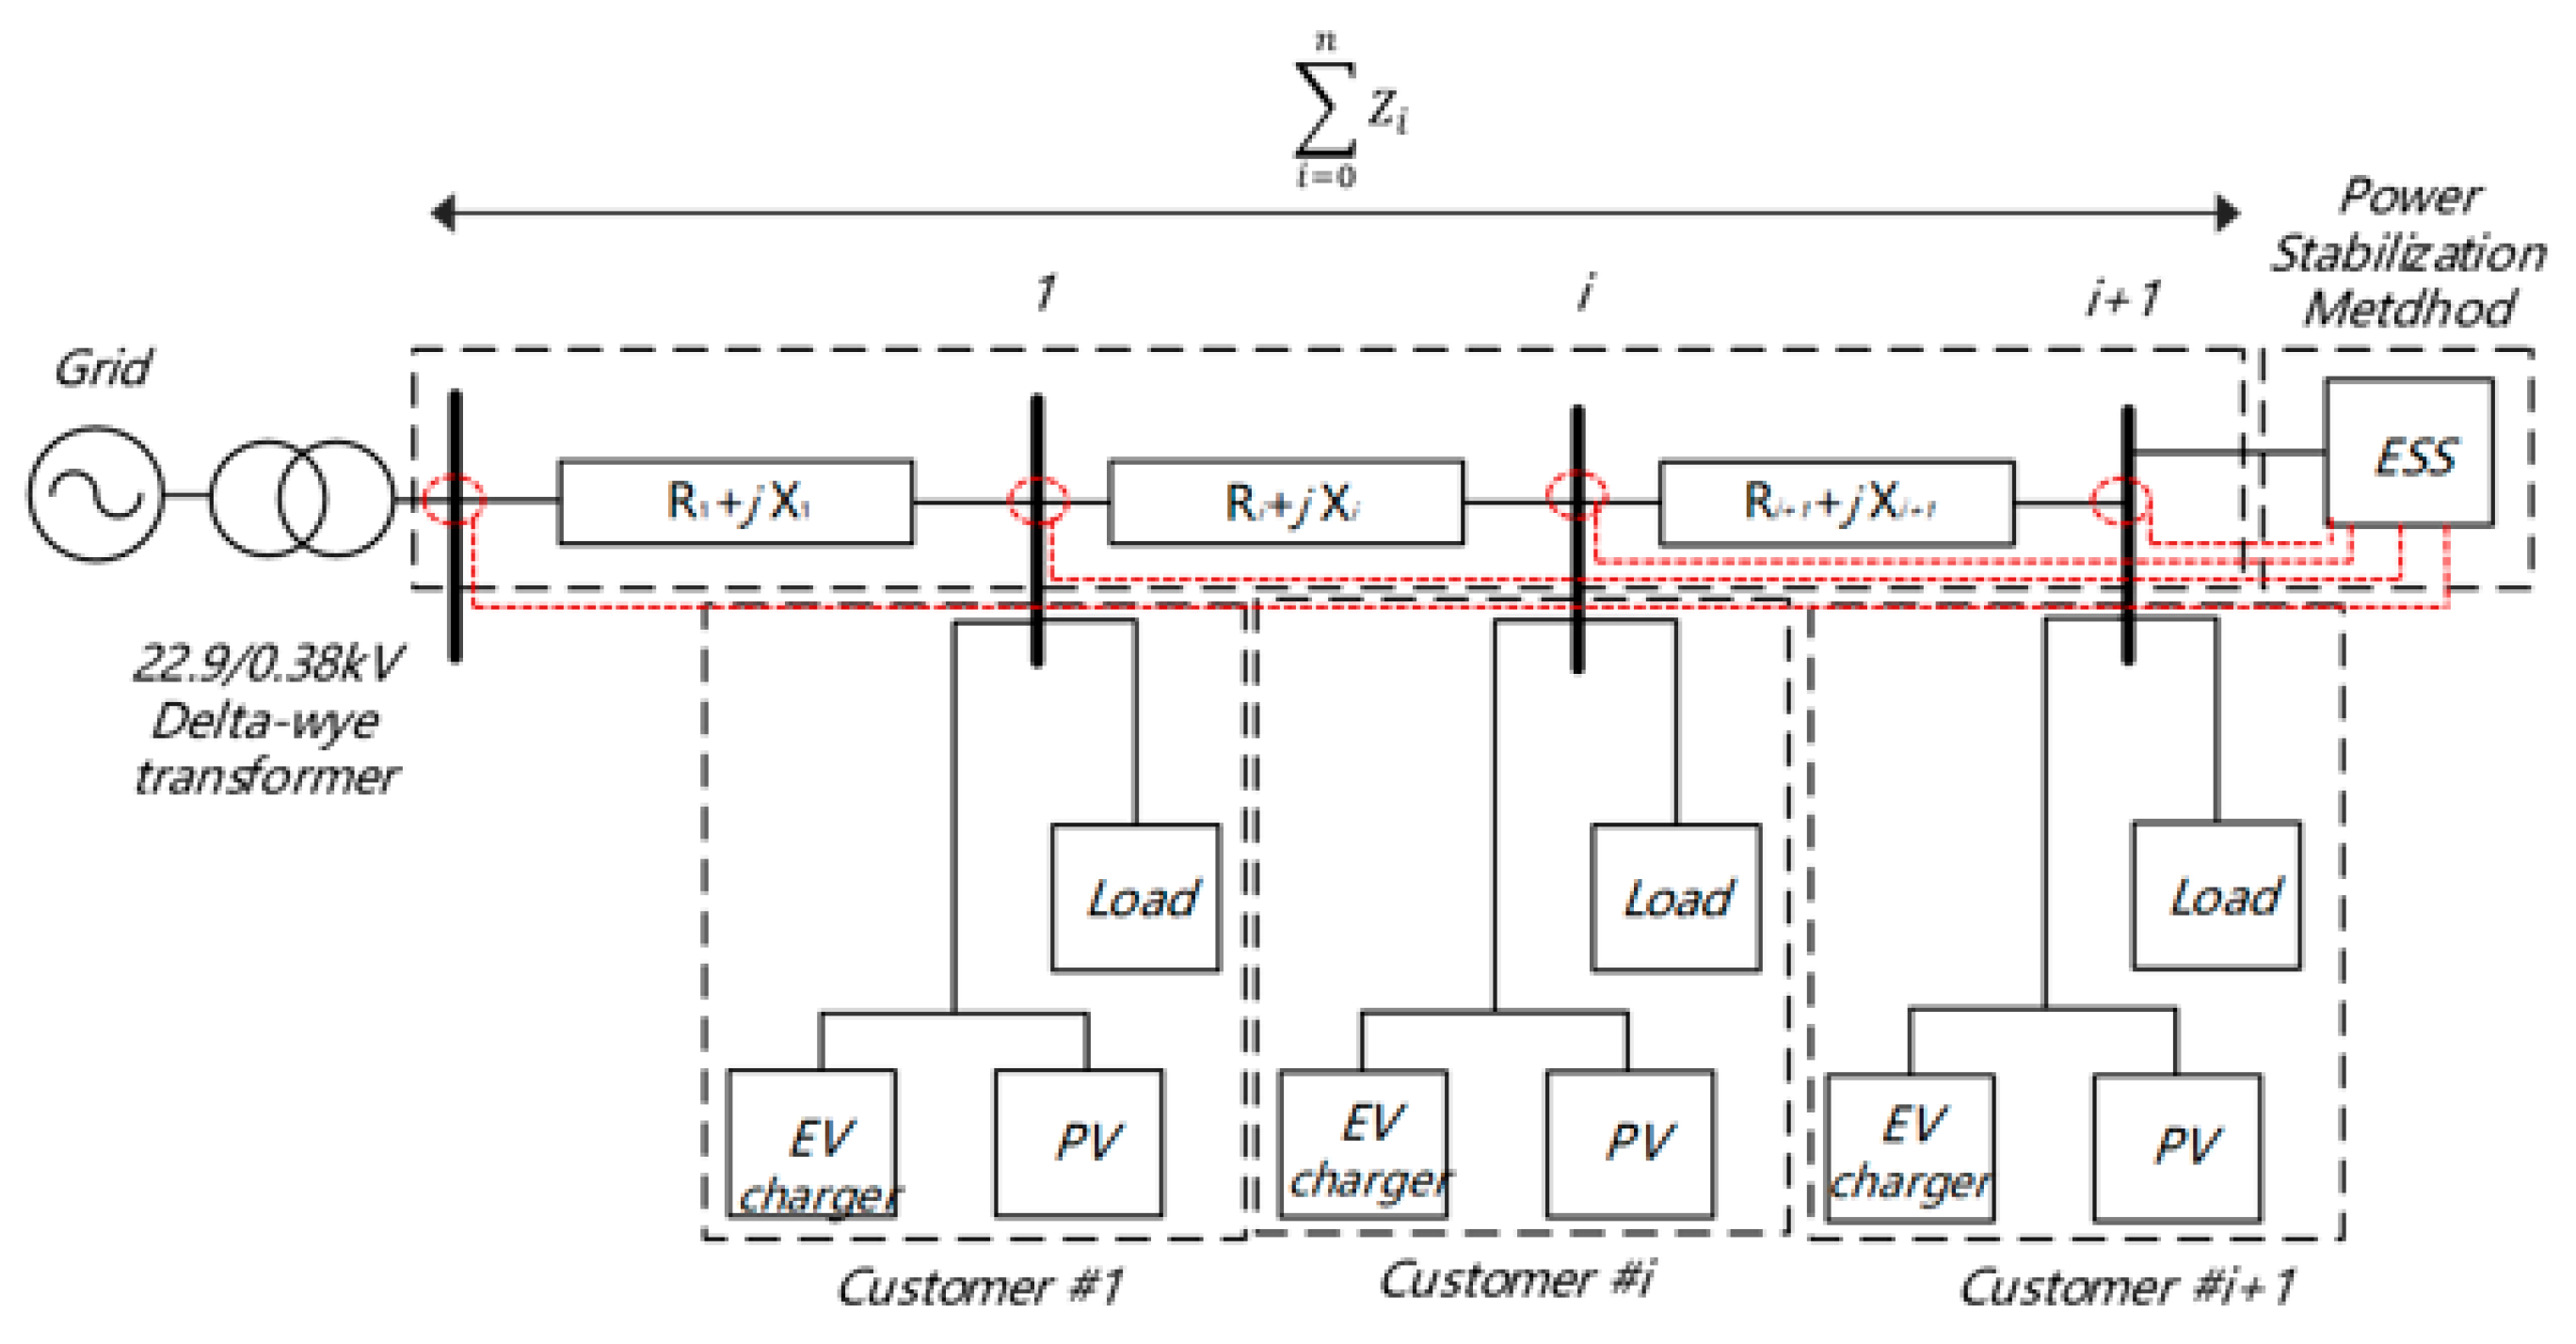
3. Modeling of the LVDS with ESS and RES
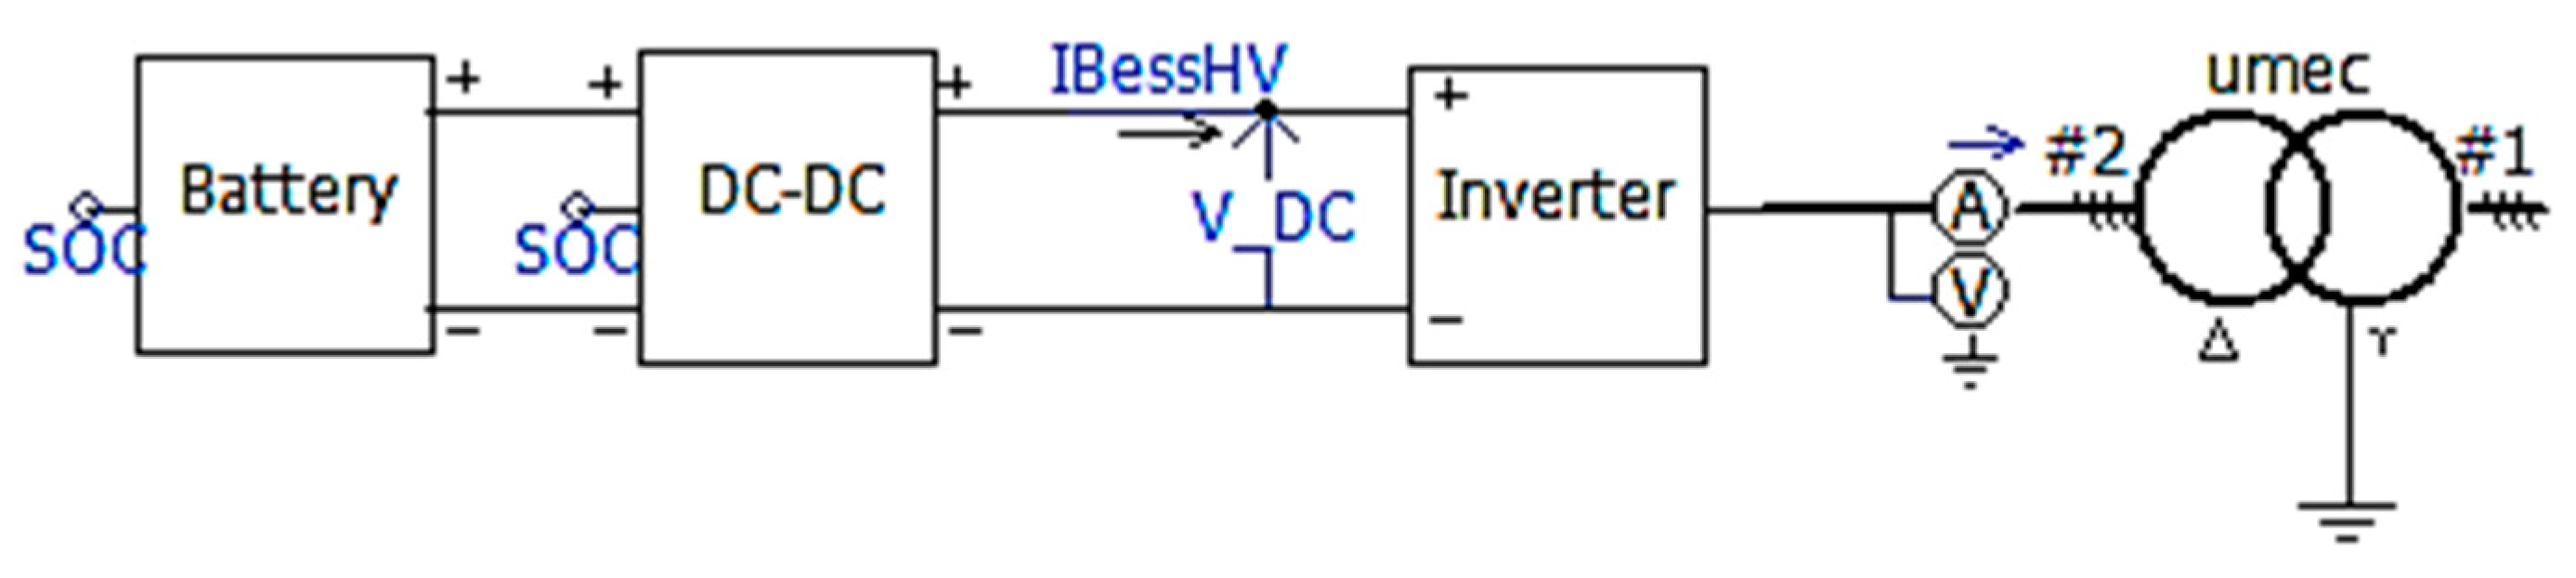
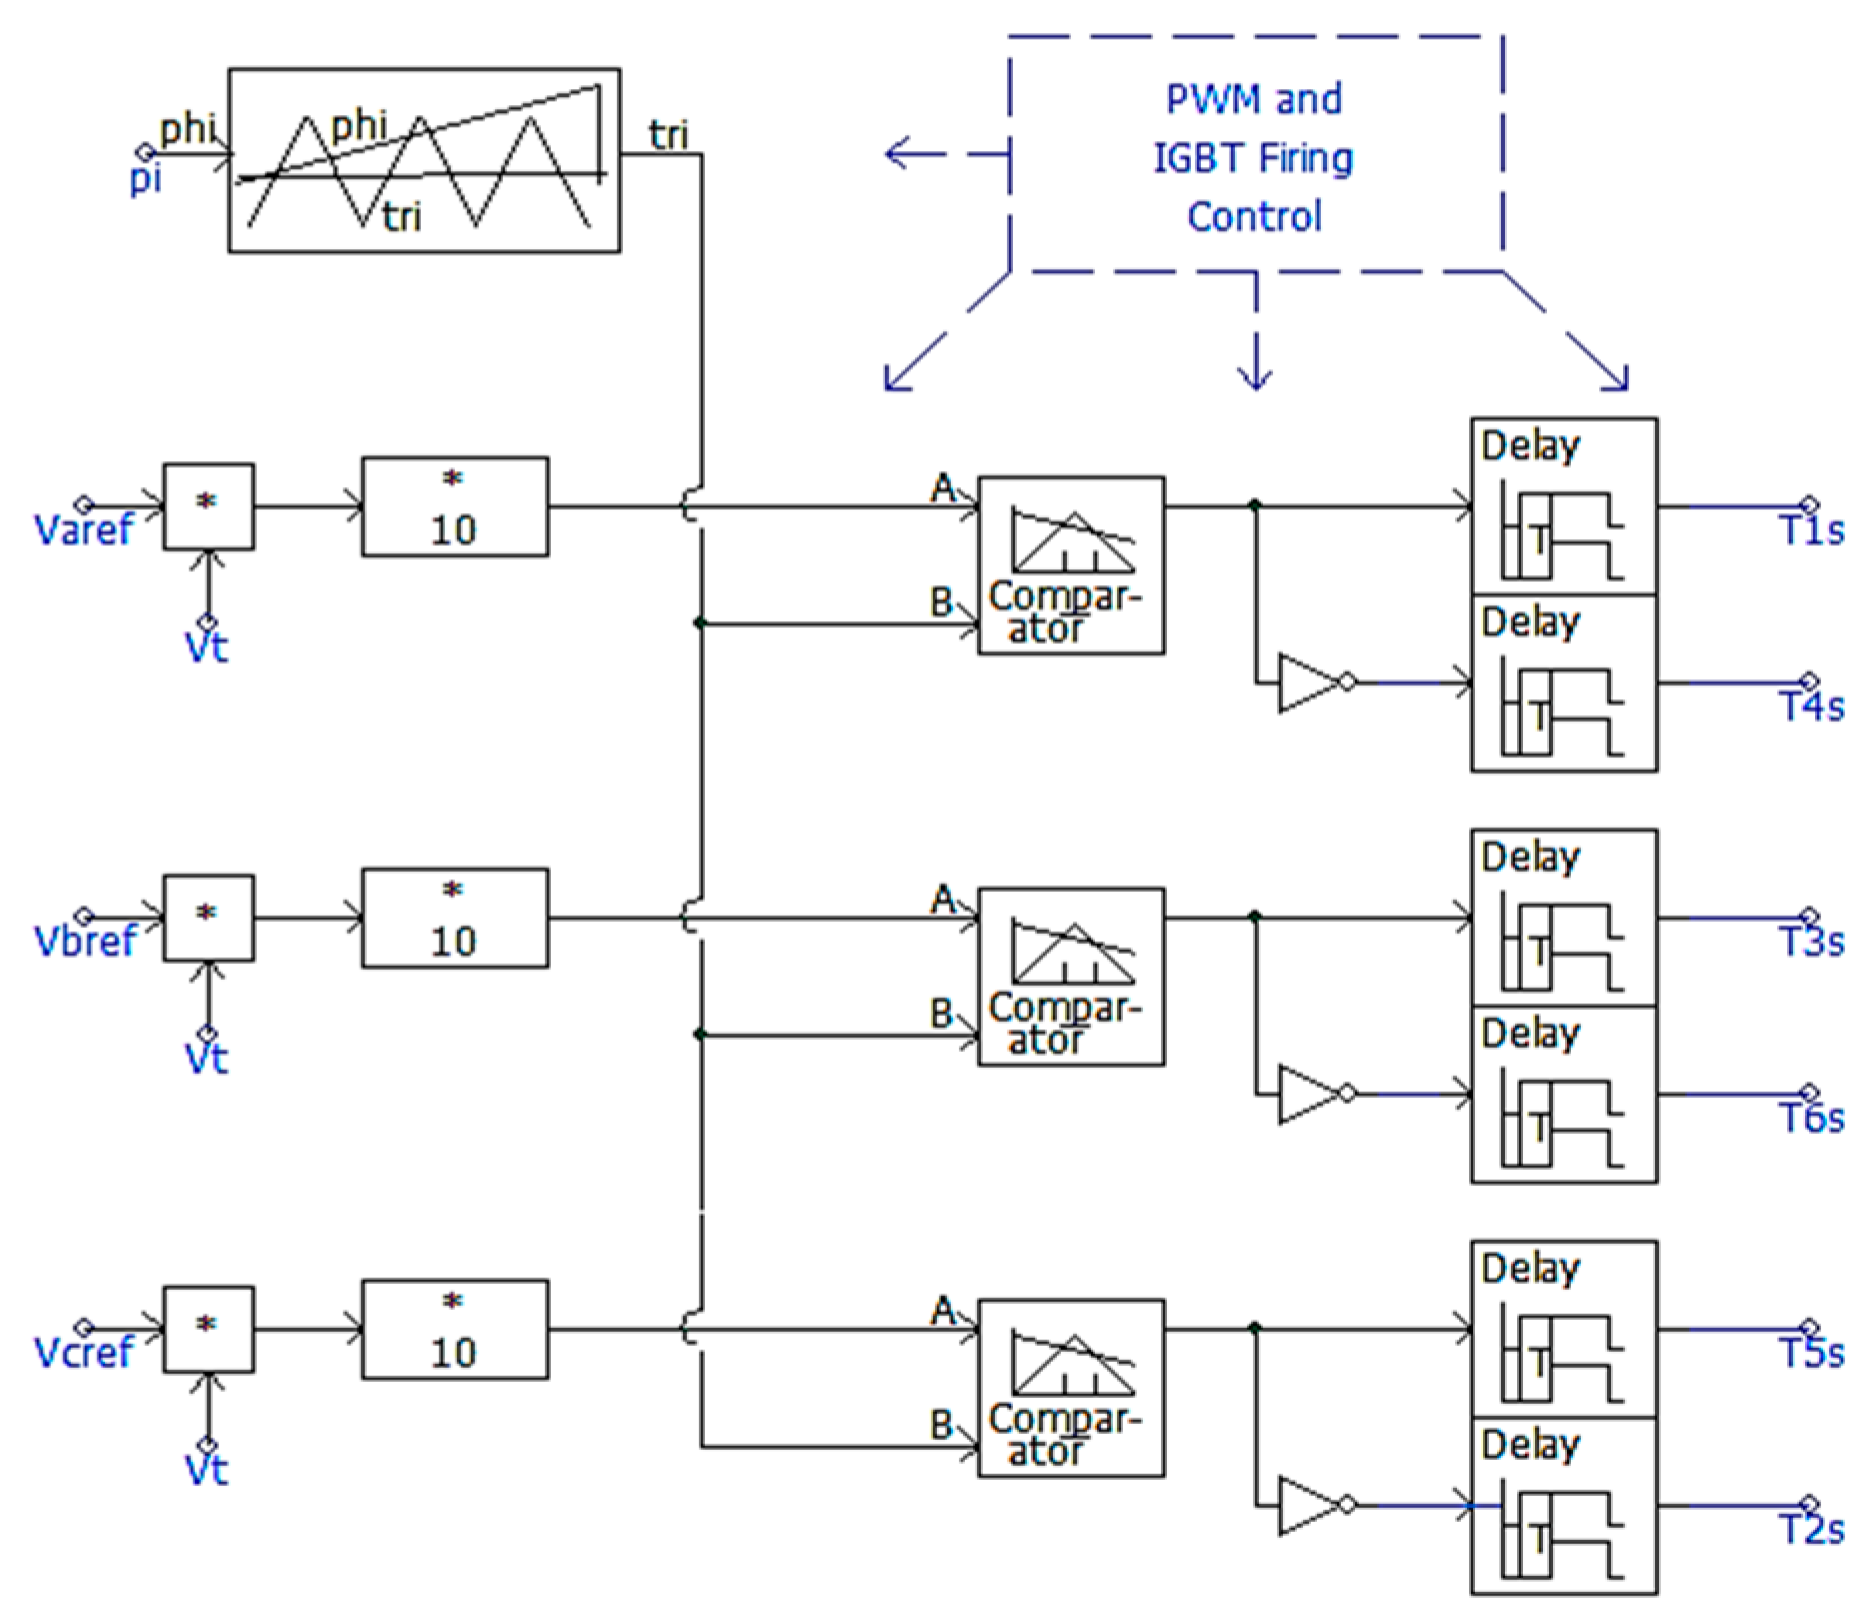
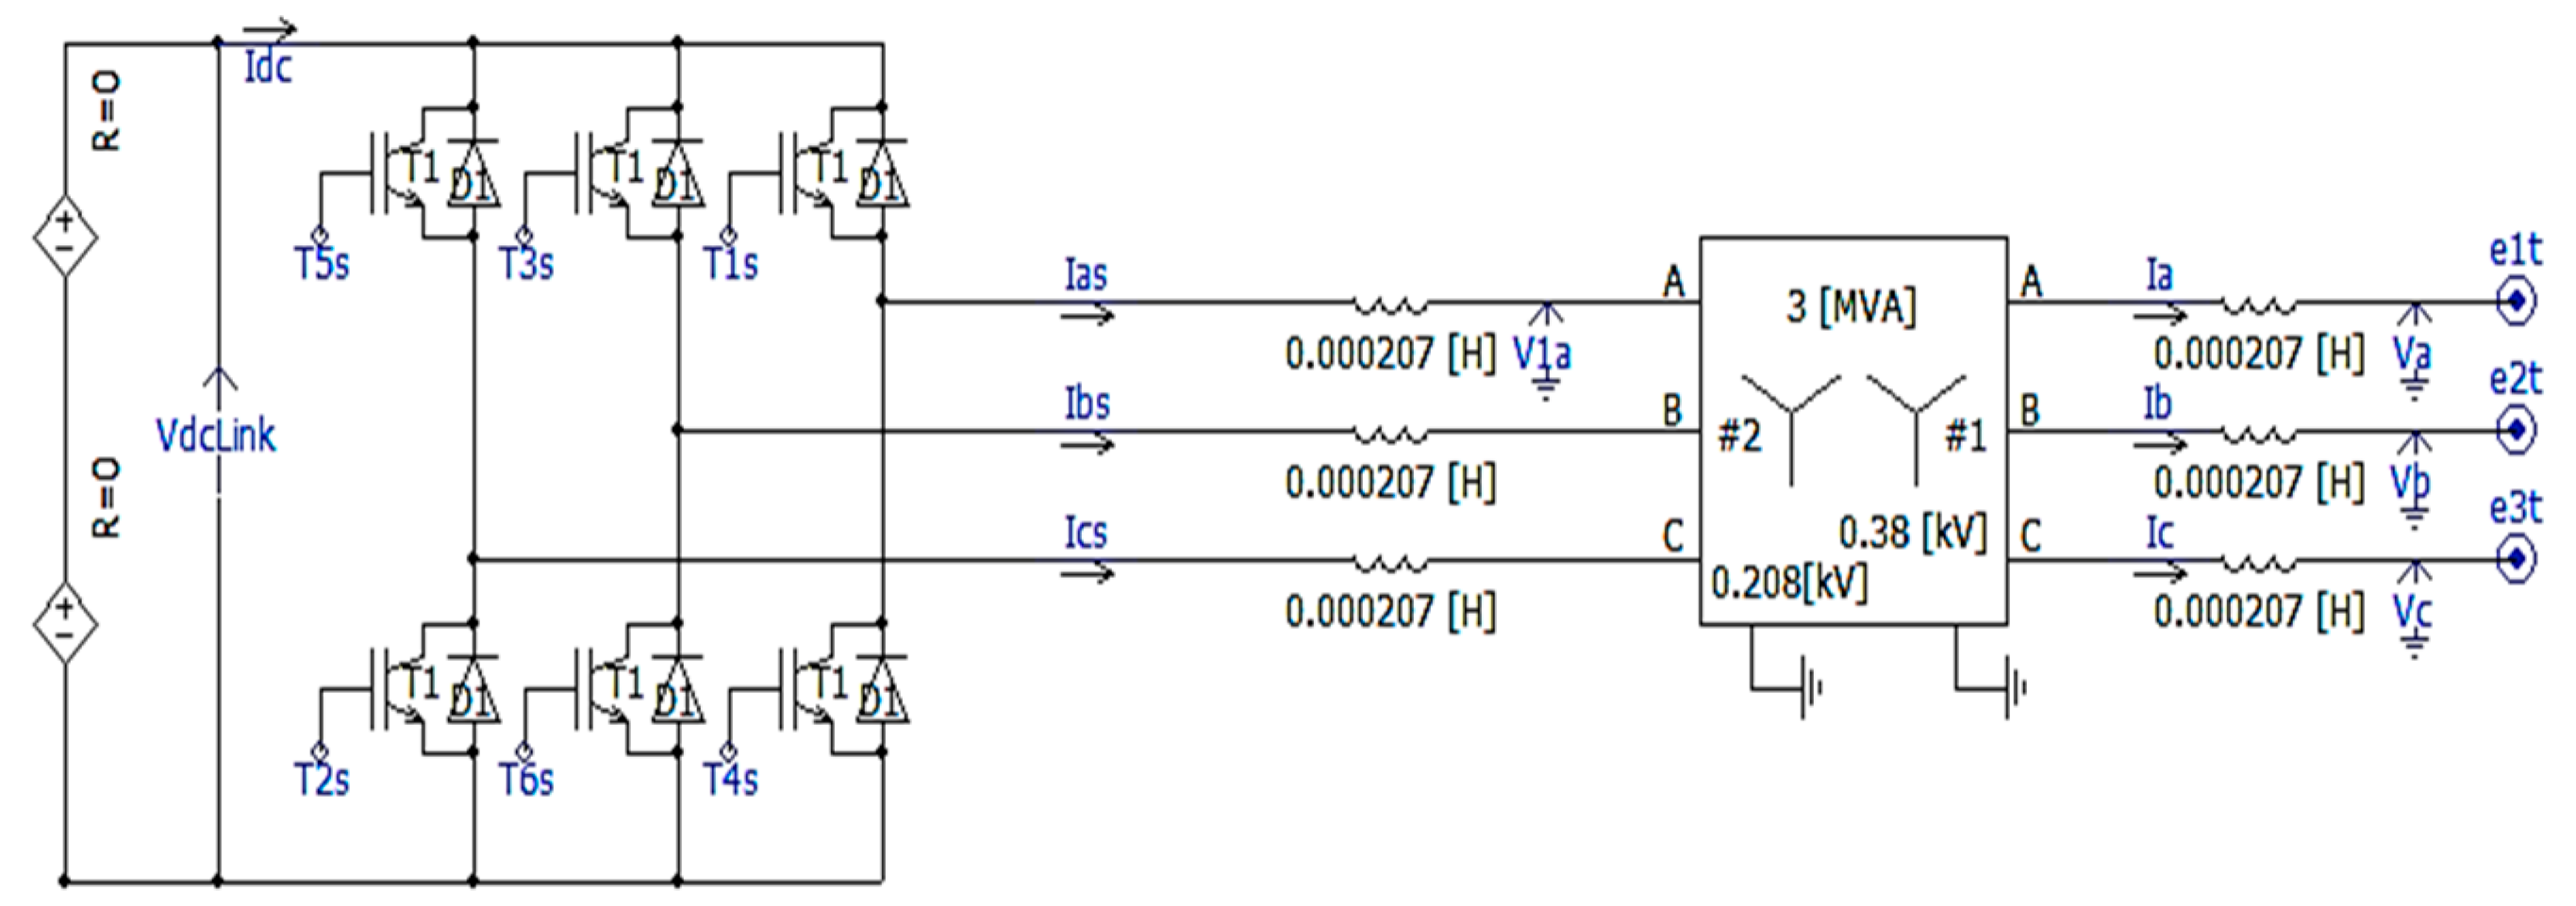
3.1. Modeling of ESS
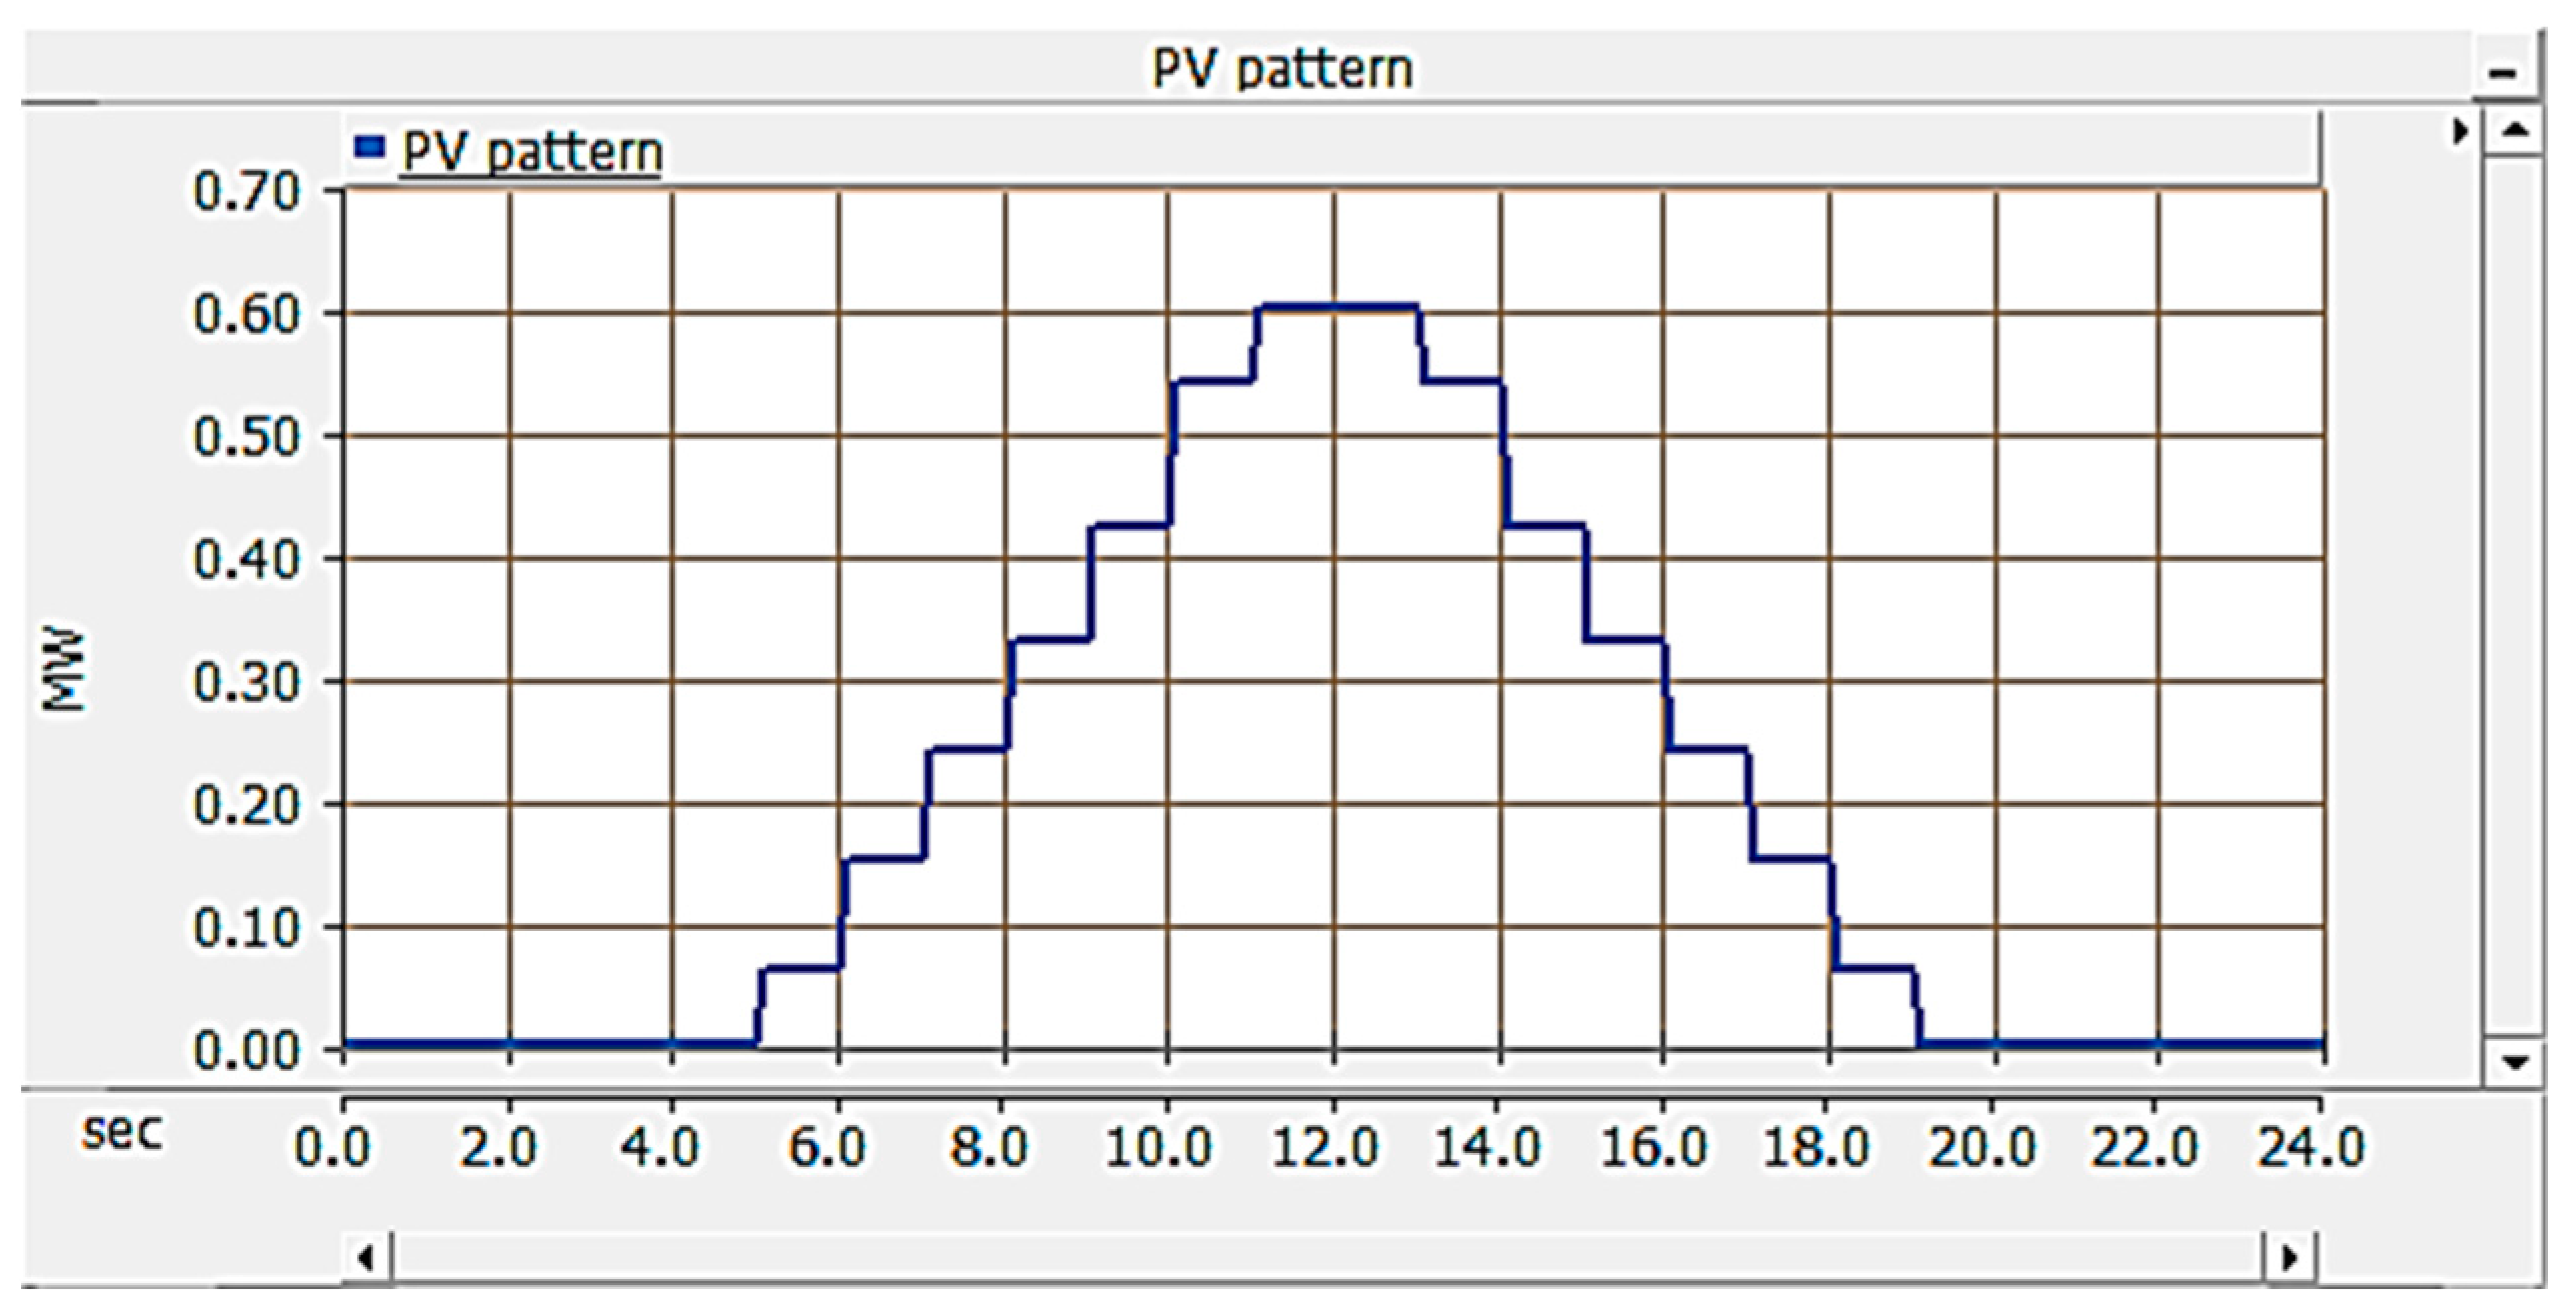
3.2. Modeling of PV
3.3. Modeling of the Operation Algorithm of the ESS
4. Case Studies
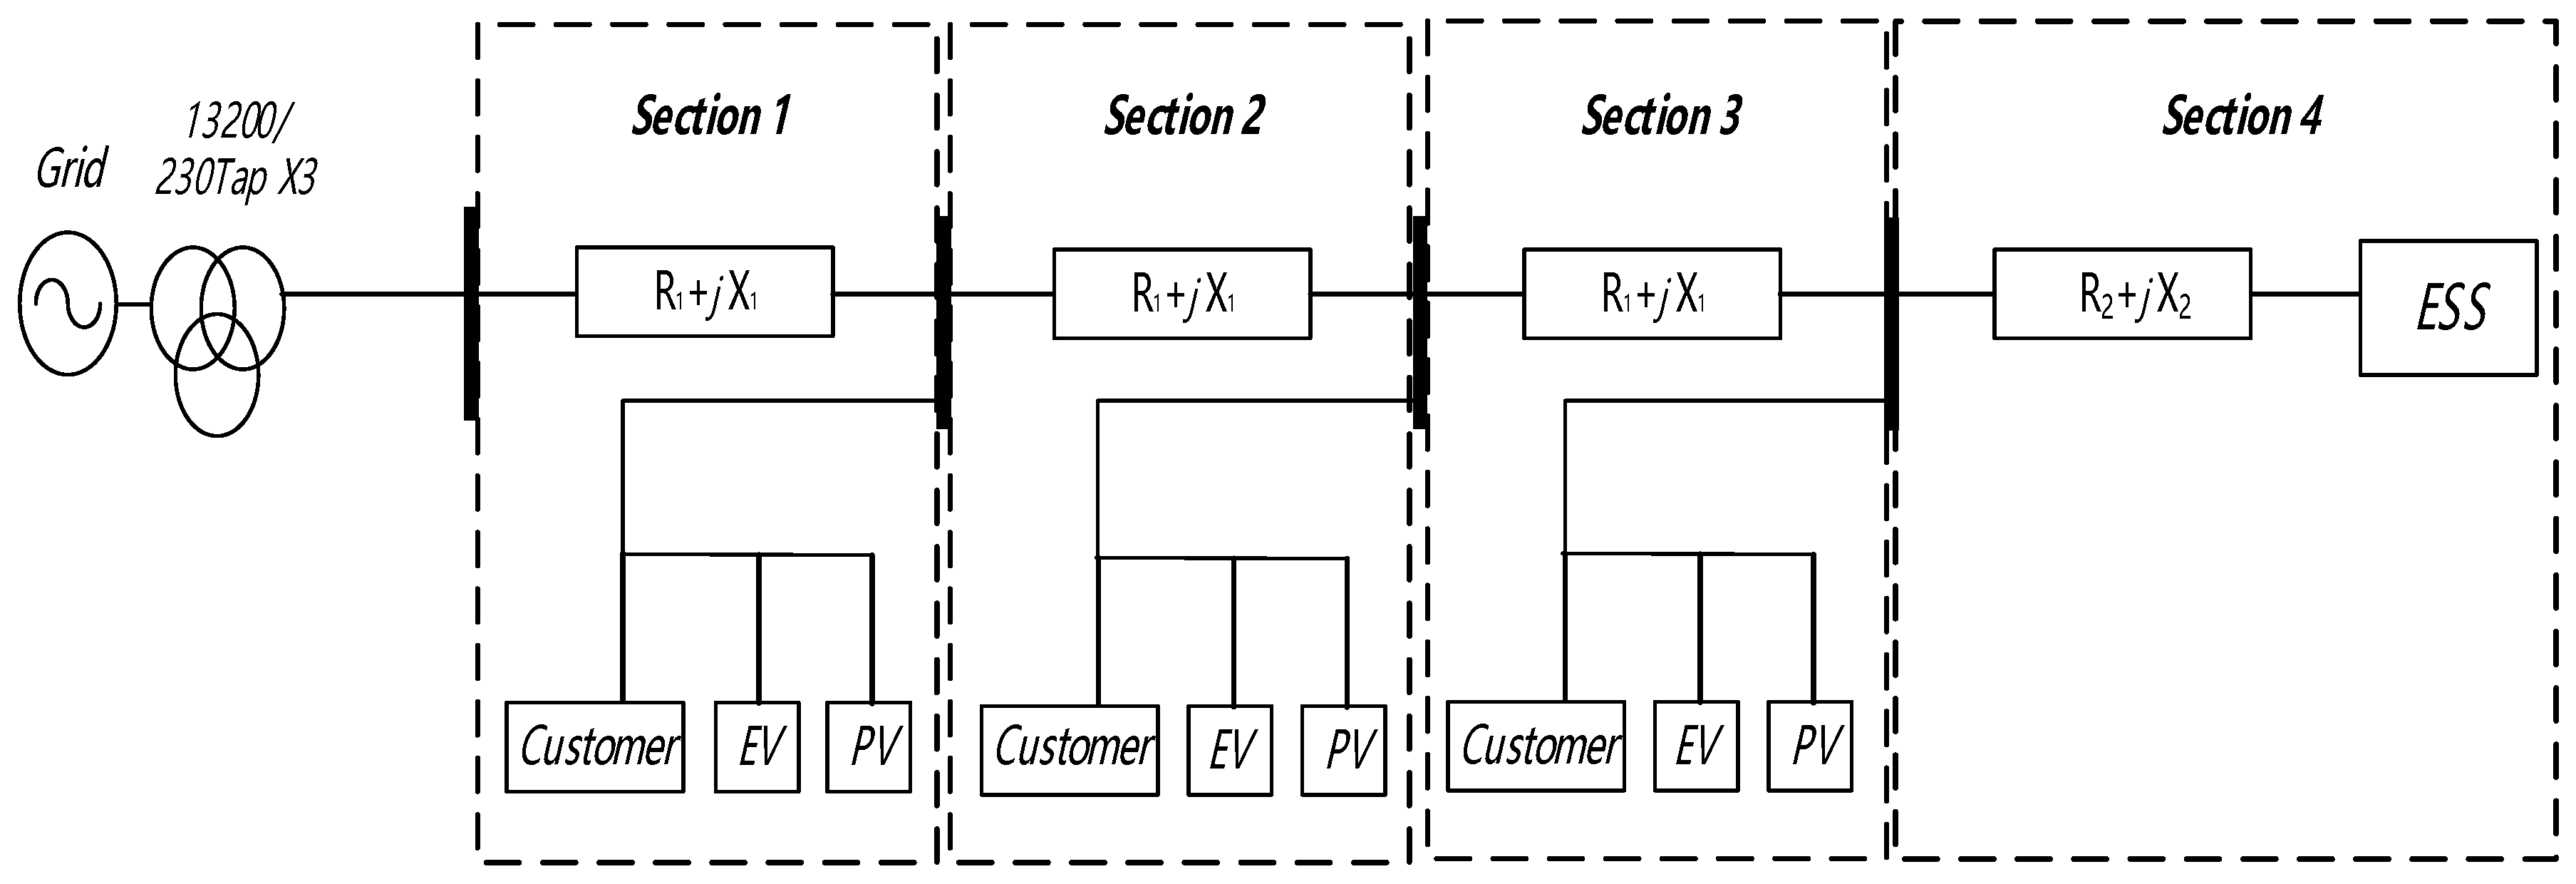
4.1. Simulation Model
- -
- The sum of power in all sections have a constraint condition that is assumed from 0 to 600 kW when the maximum demand time of the load and EV charging time proceed at the same time.
- -
- All PV systems are outputted from 0 to 600 kW per hour.
- -
- The ESS introduced at the end section is only operated when either the sum of each load or the sum of each PV generation power is exceeded over the reference value (PL, PG).
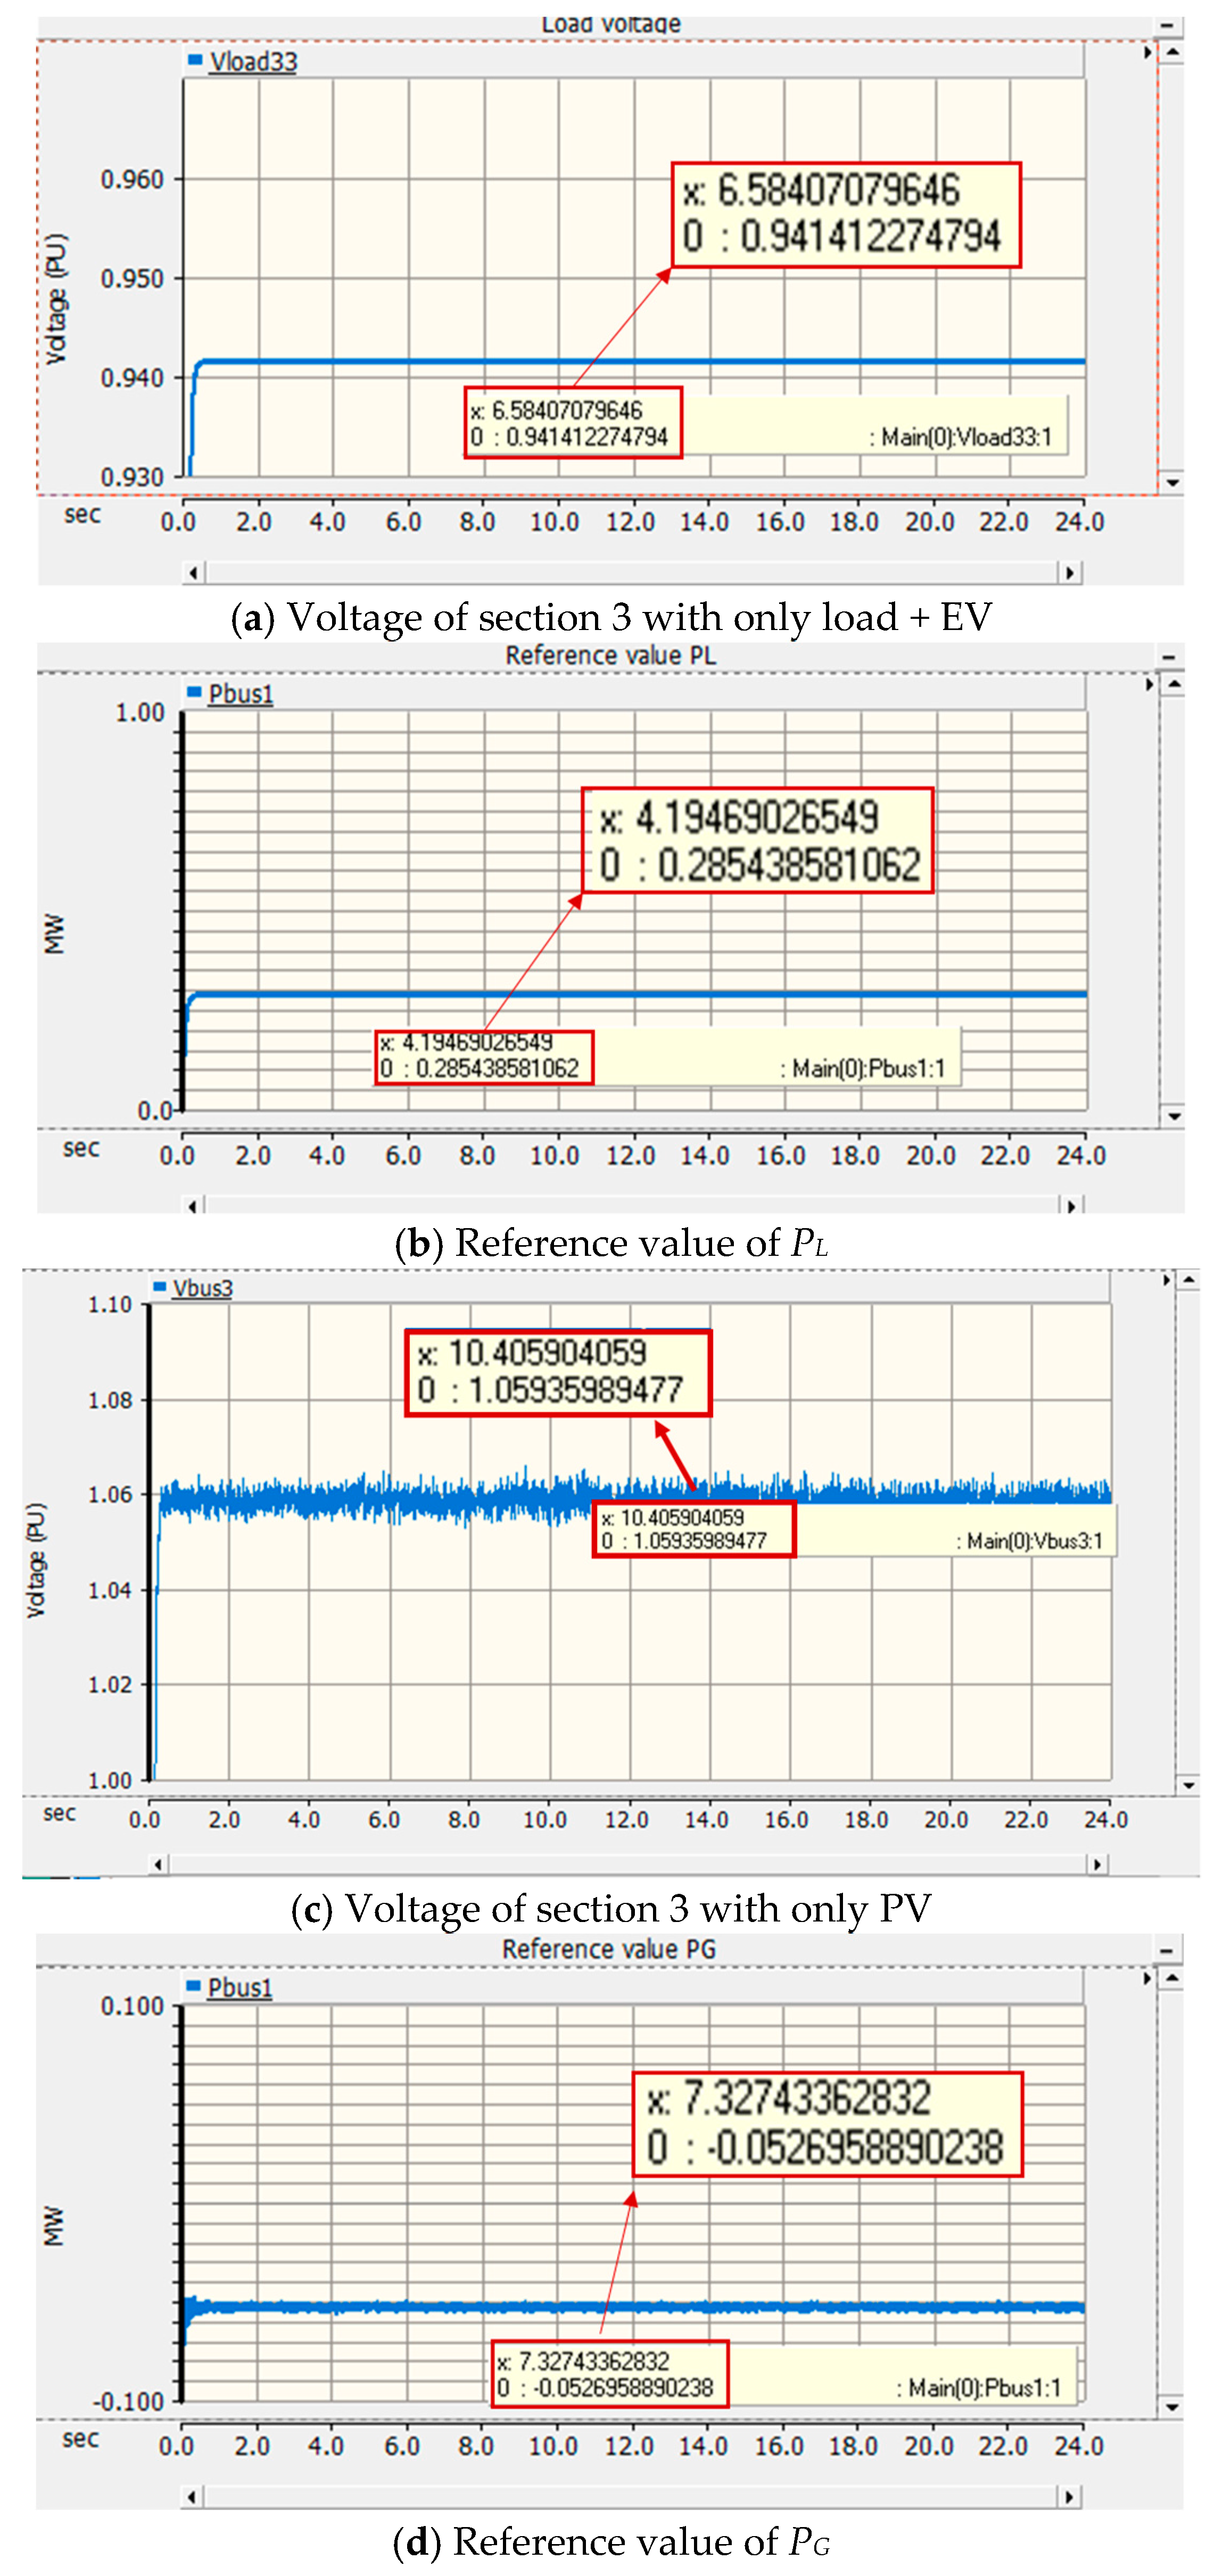
4.2. Determination of the Reference Values (PL, PG)
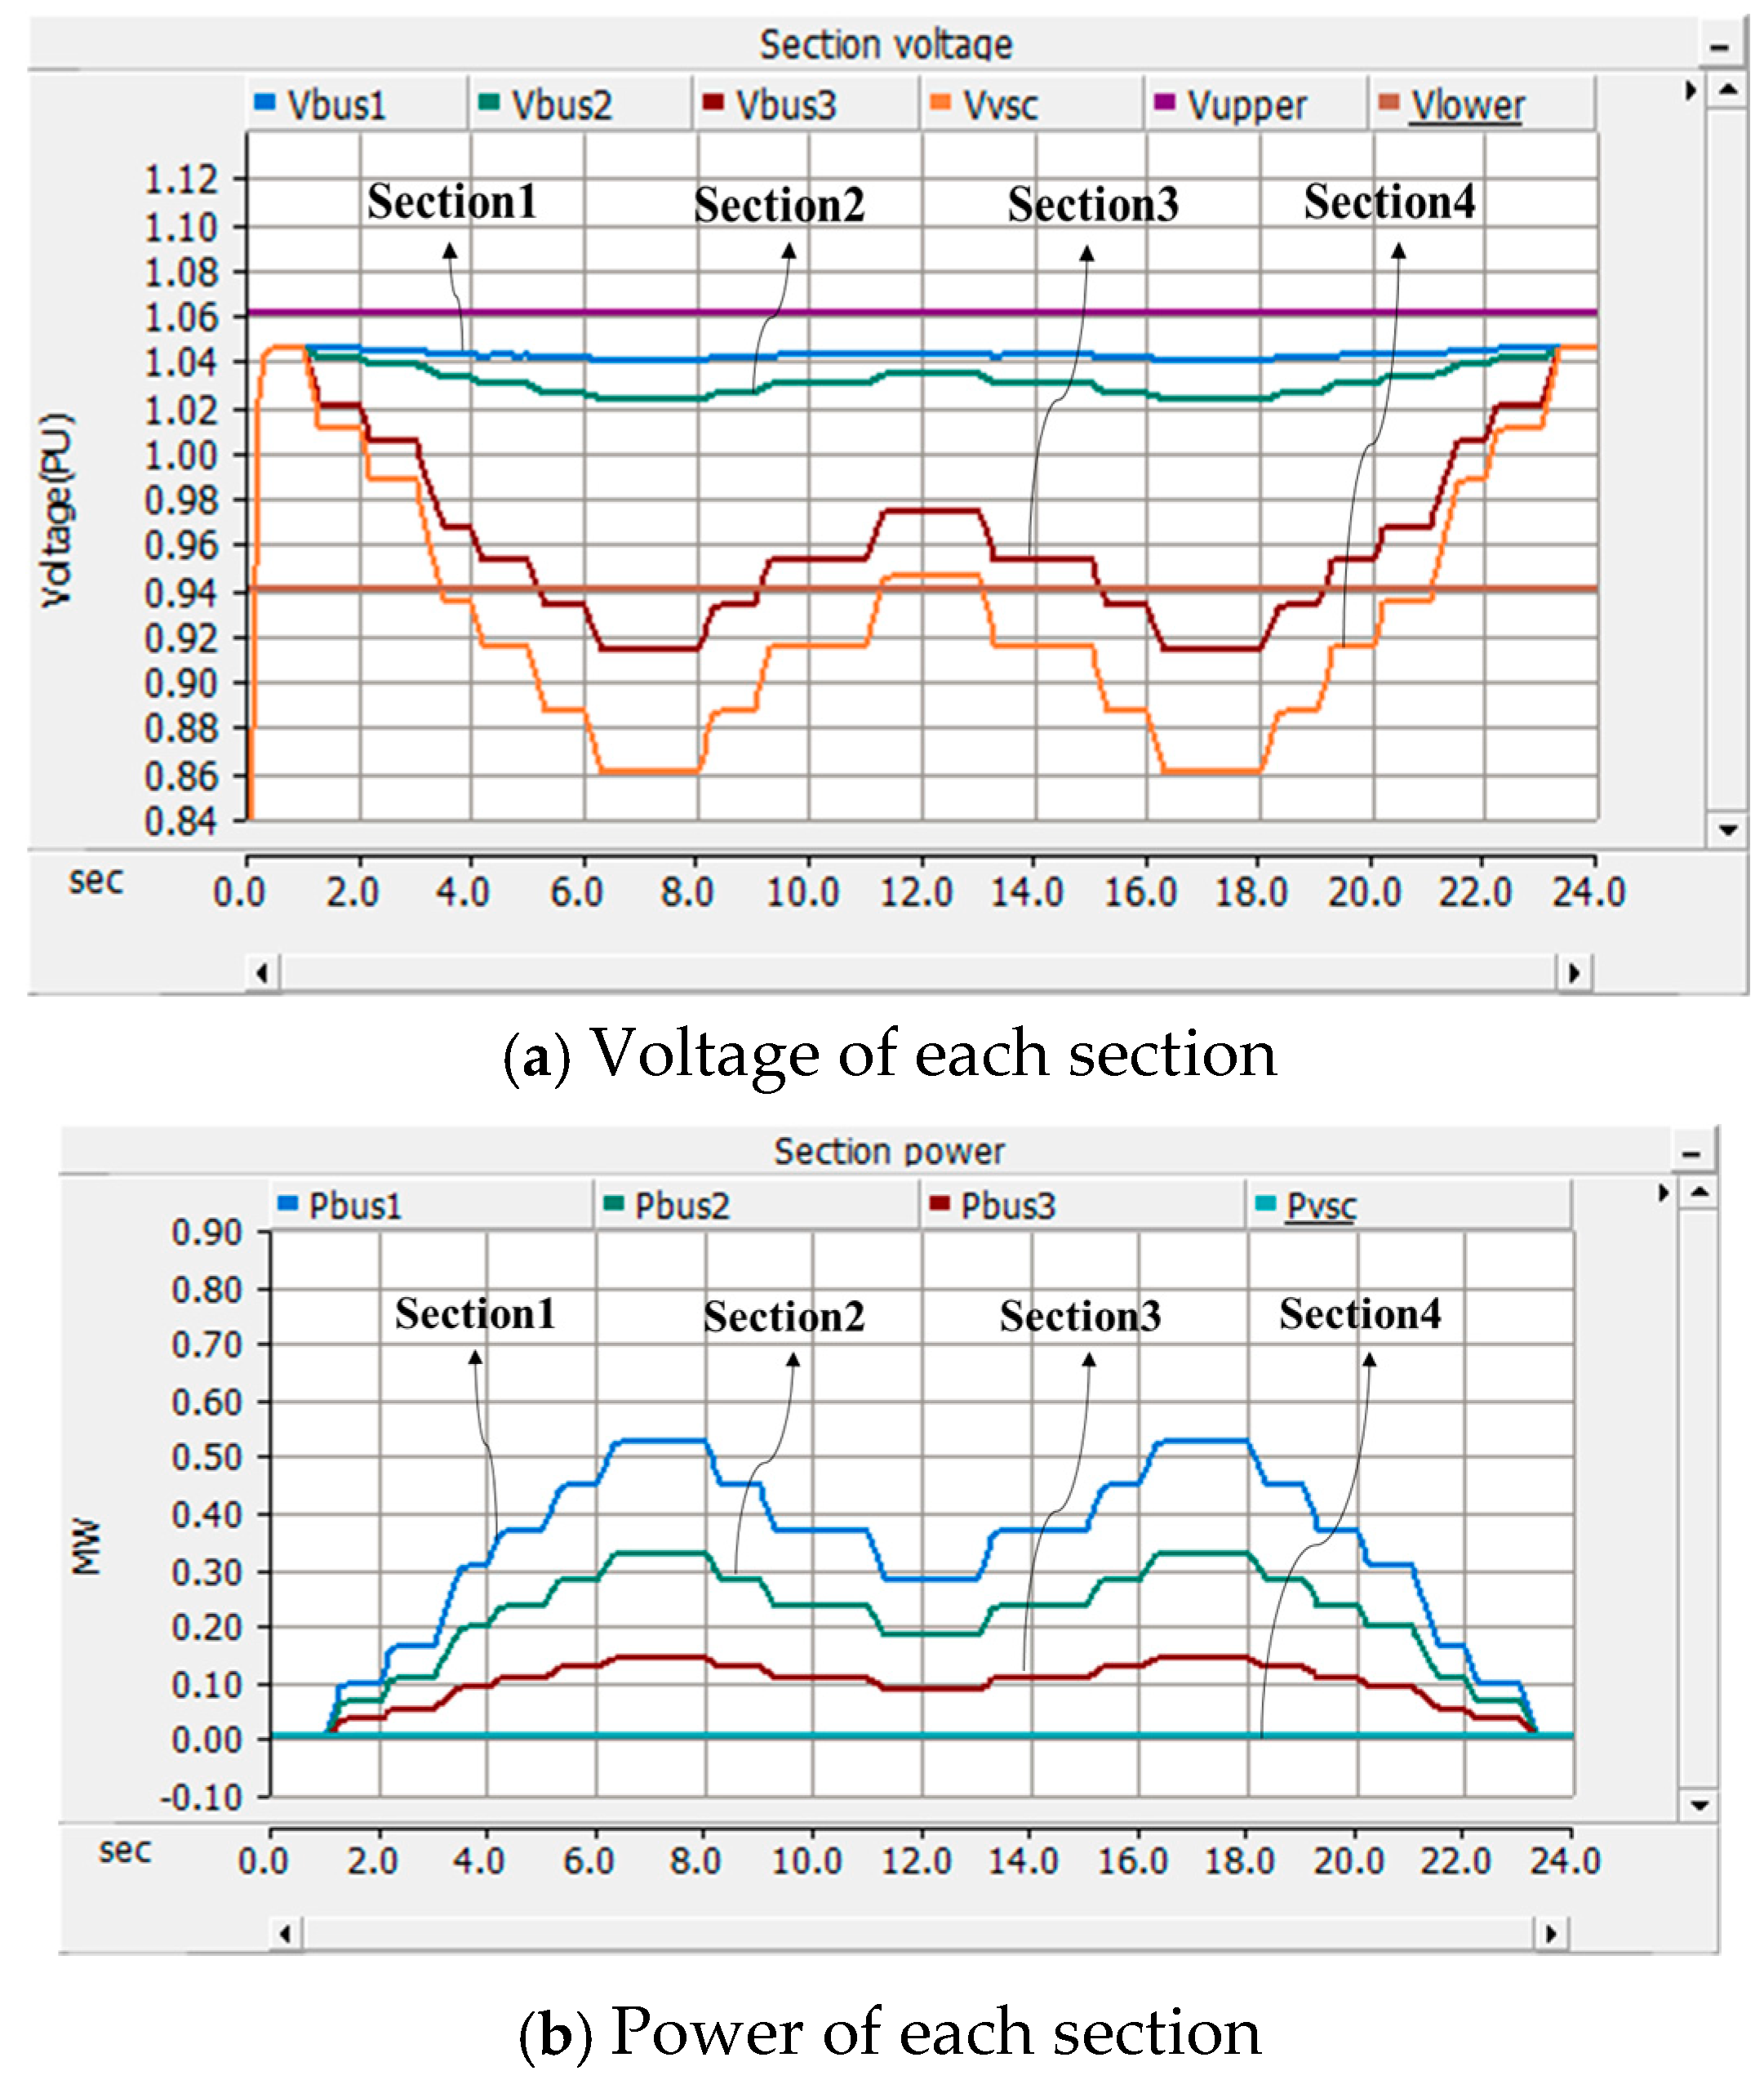
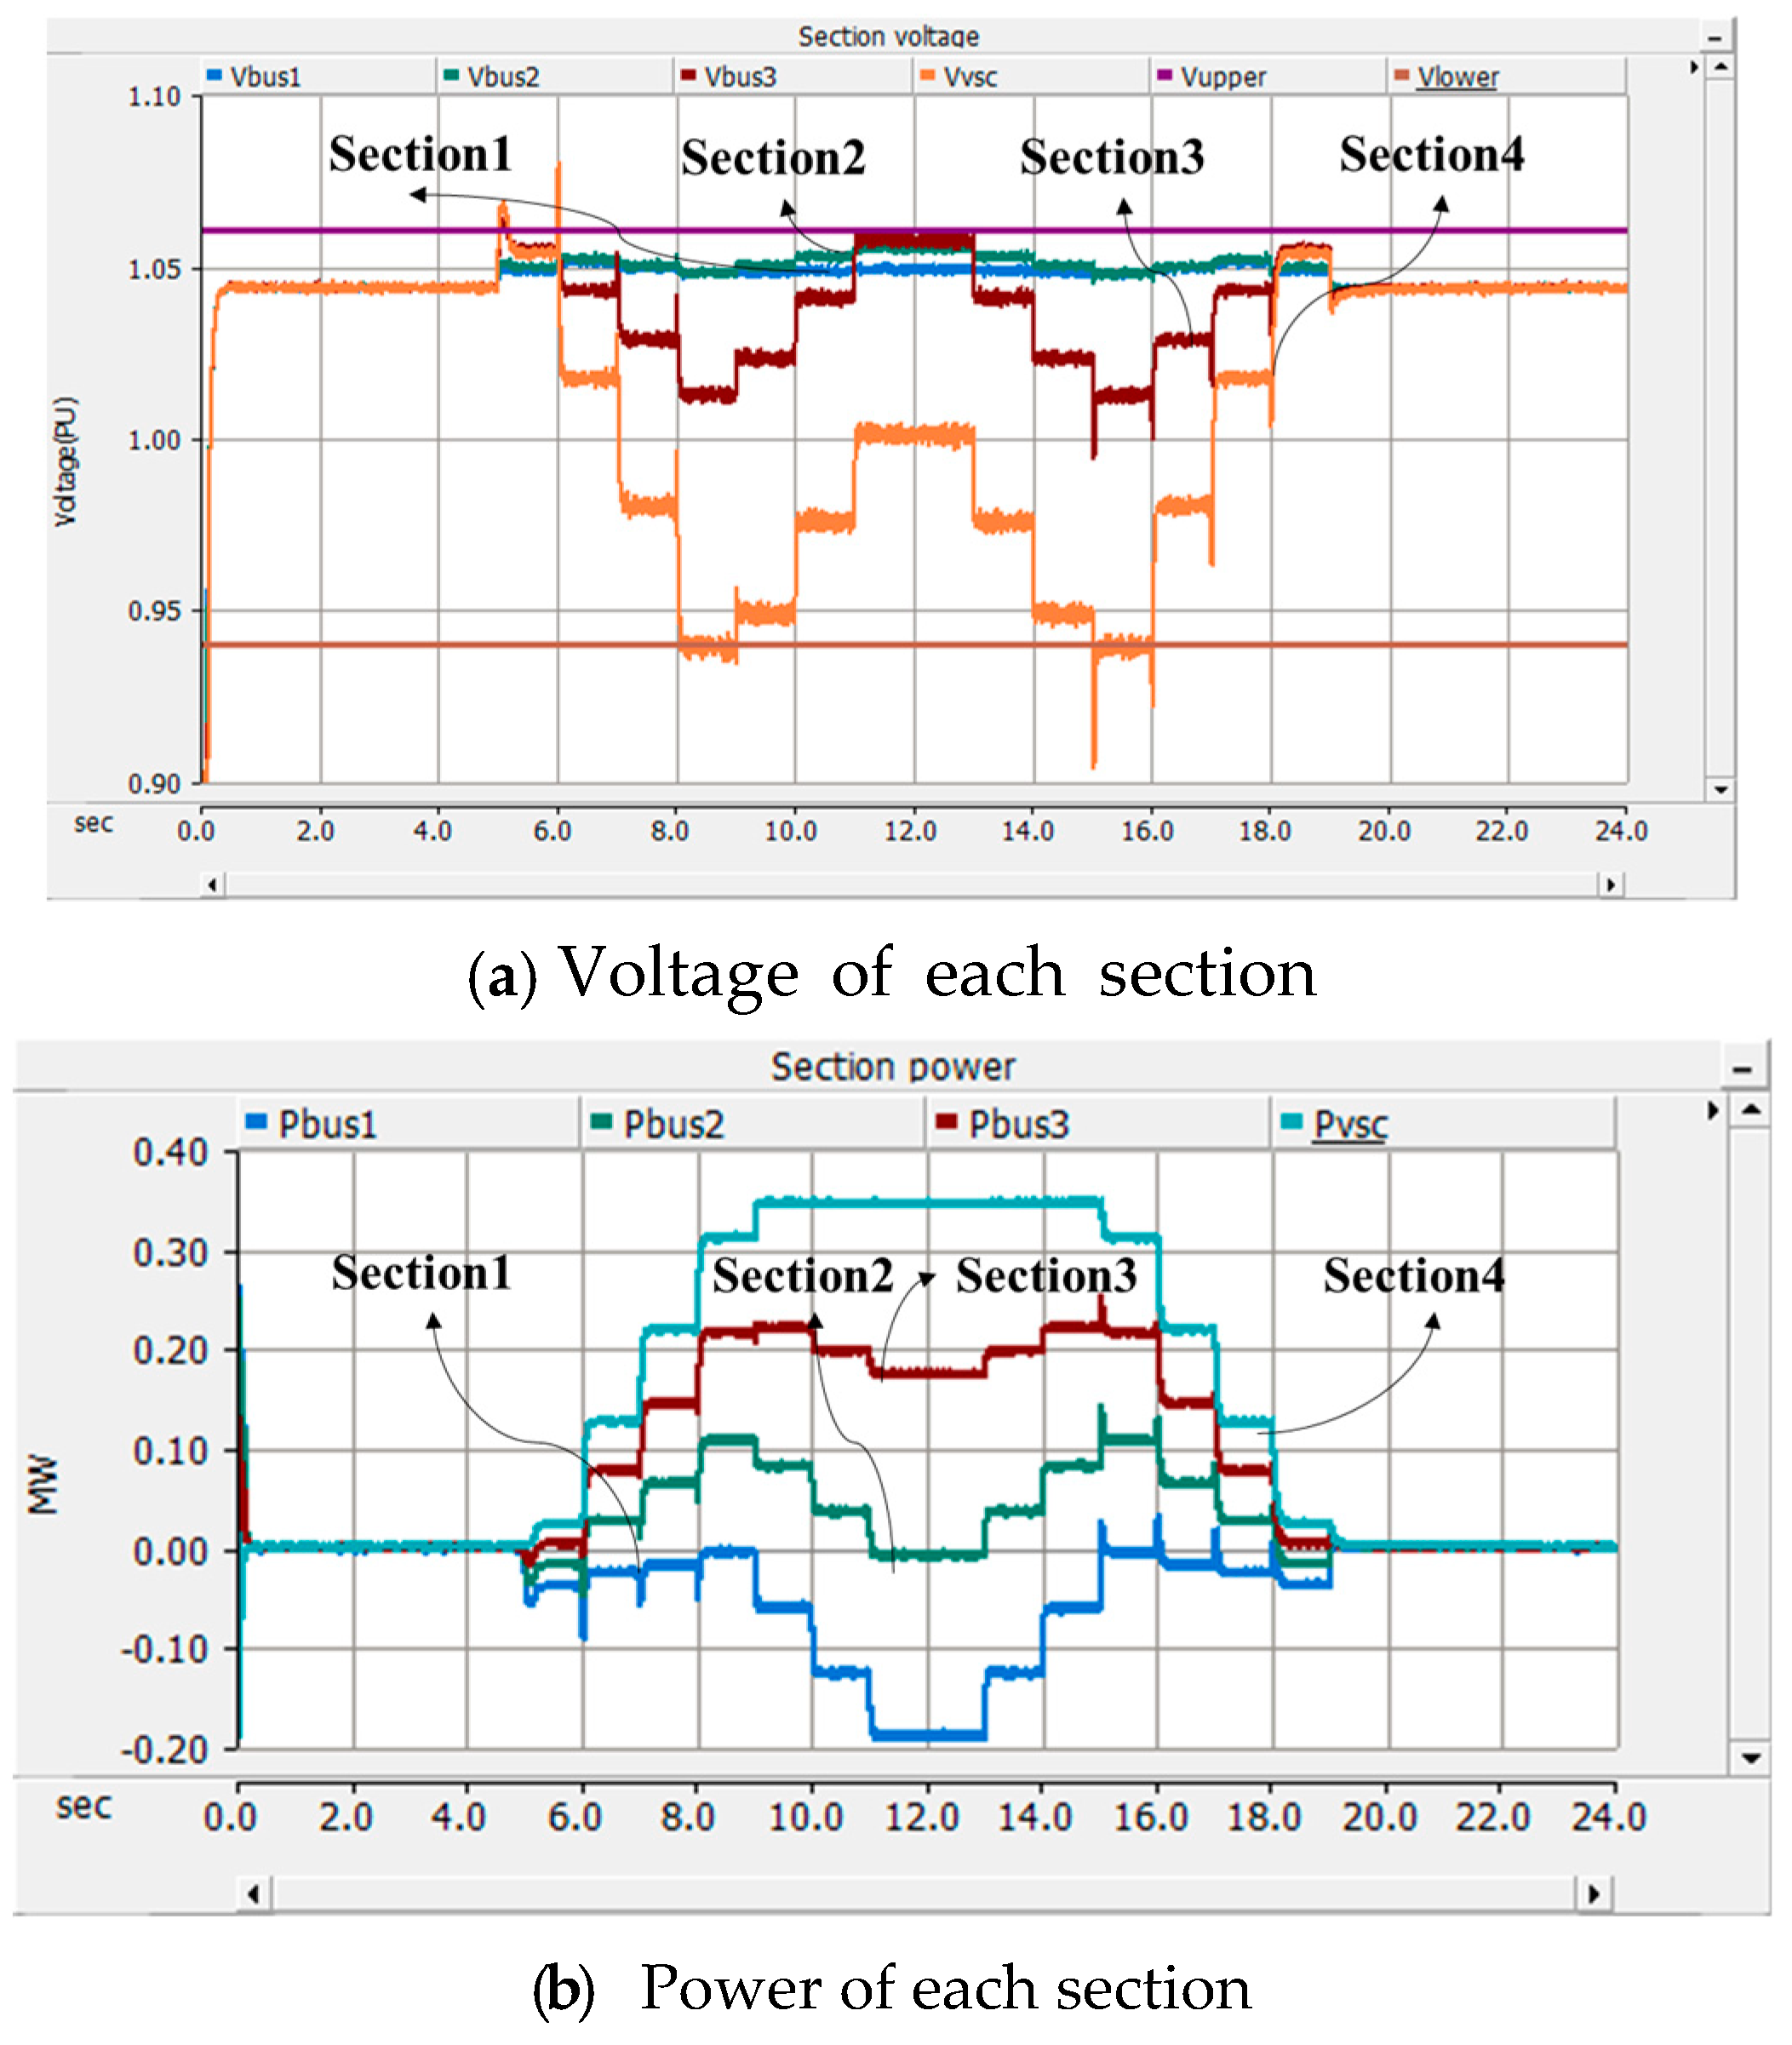
4.3. Power Characteristics of Distribution Systems with EV Chargers and an ESS
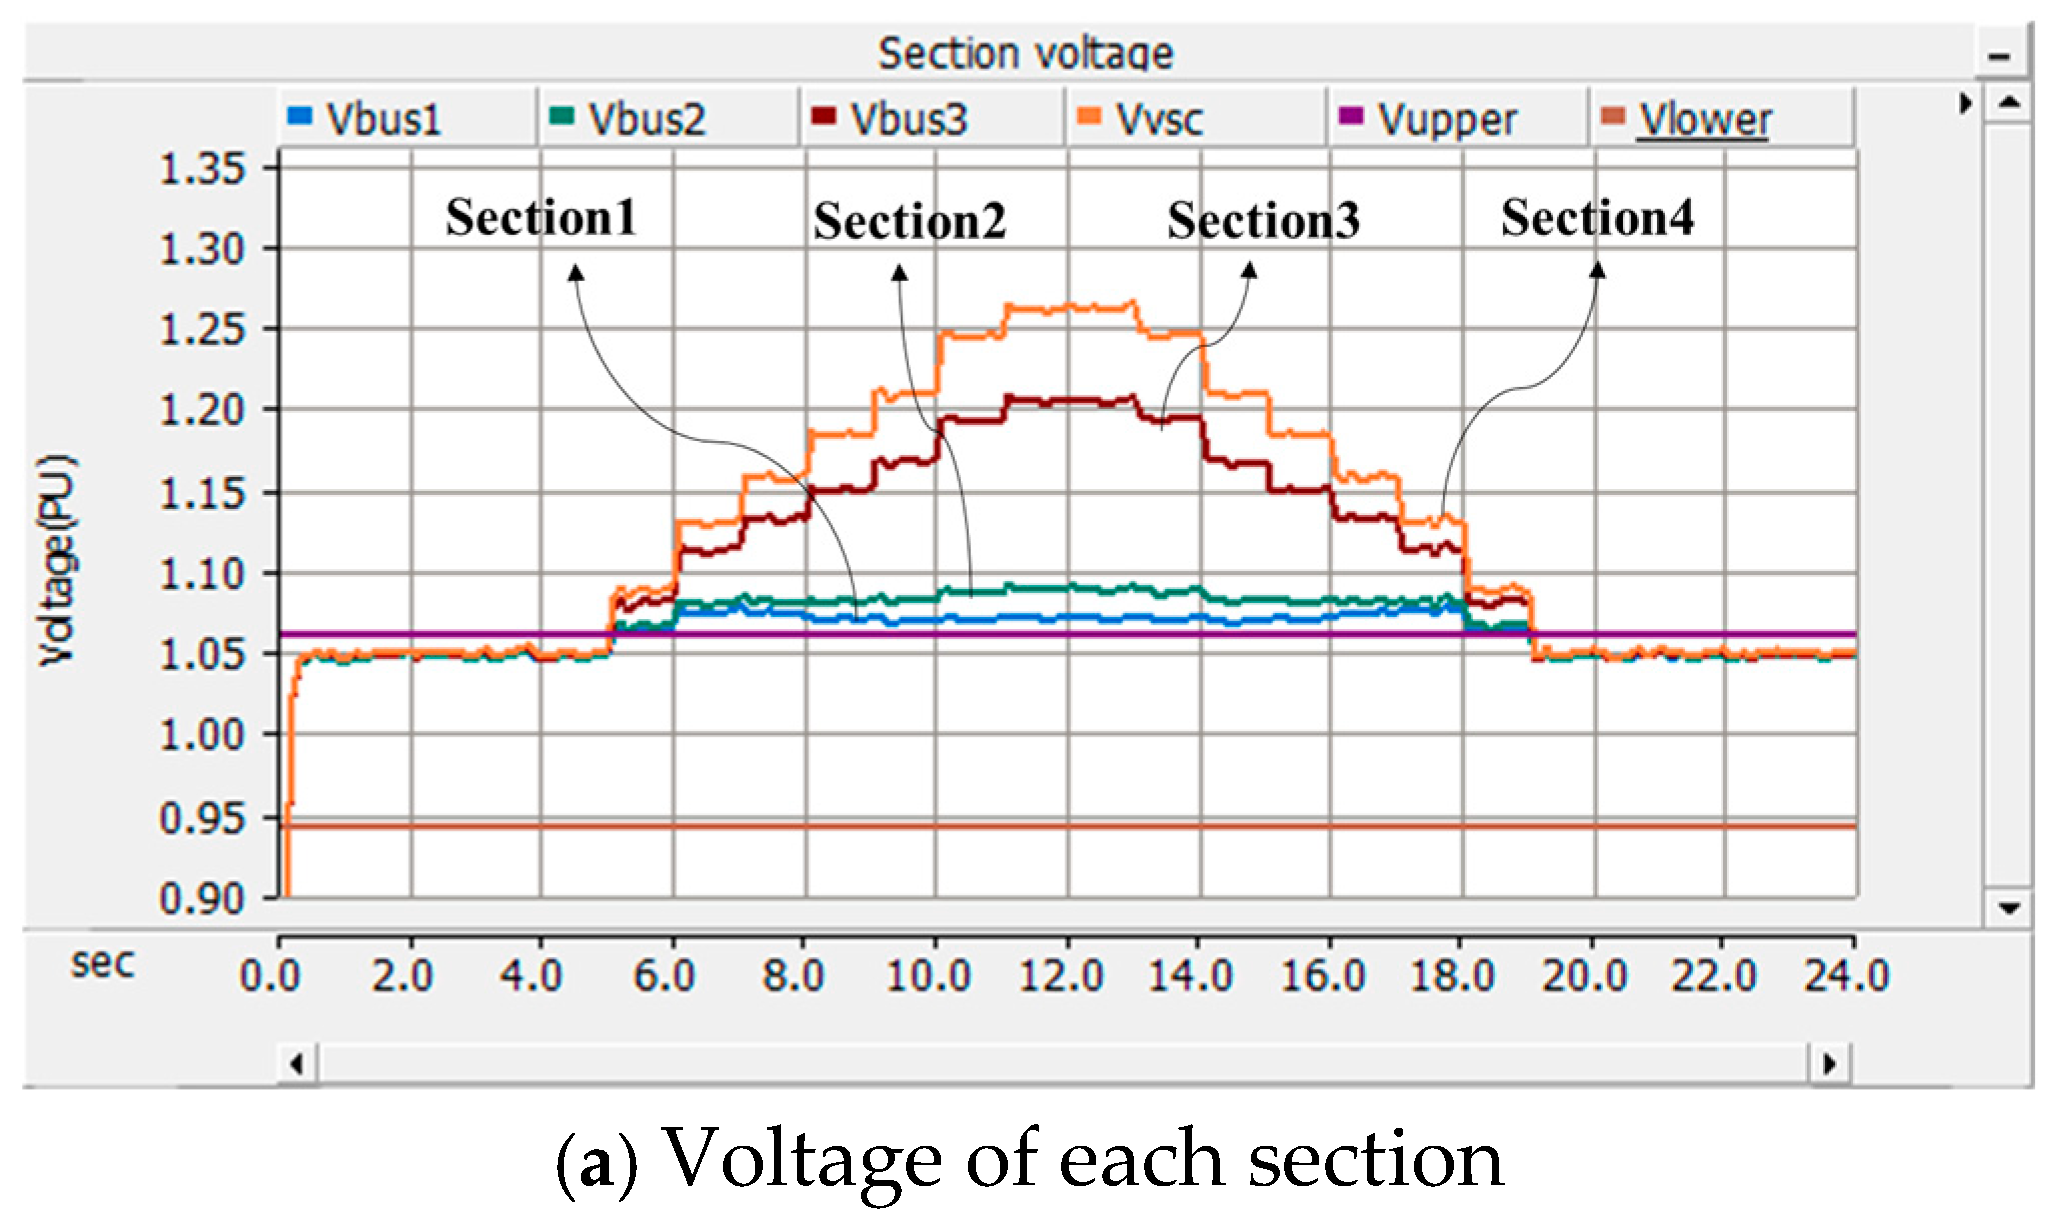
4.4. Power Characteristic of Distribution Systems with EV Chargers, PV Systems, and ESS
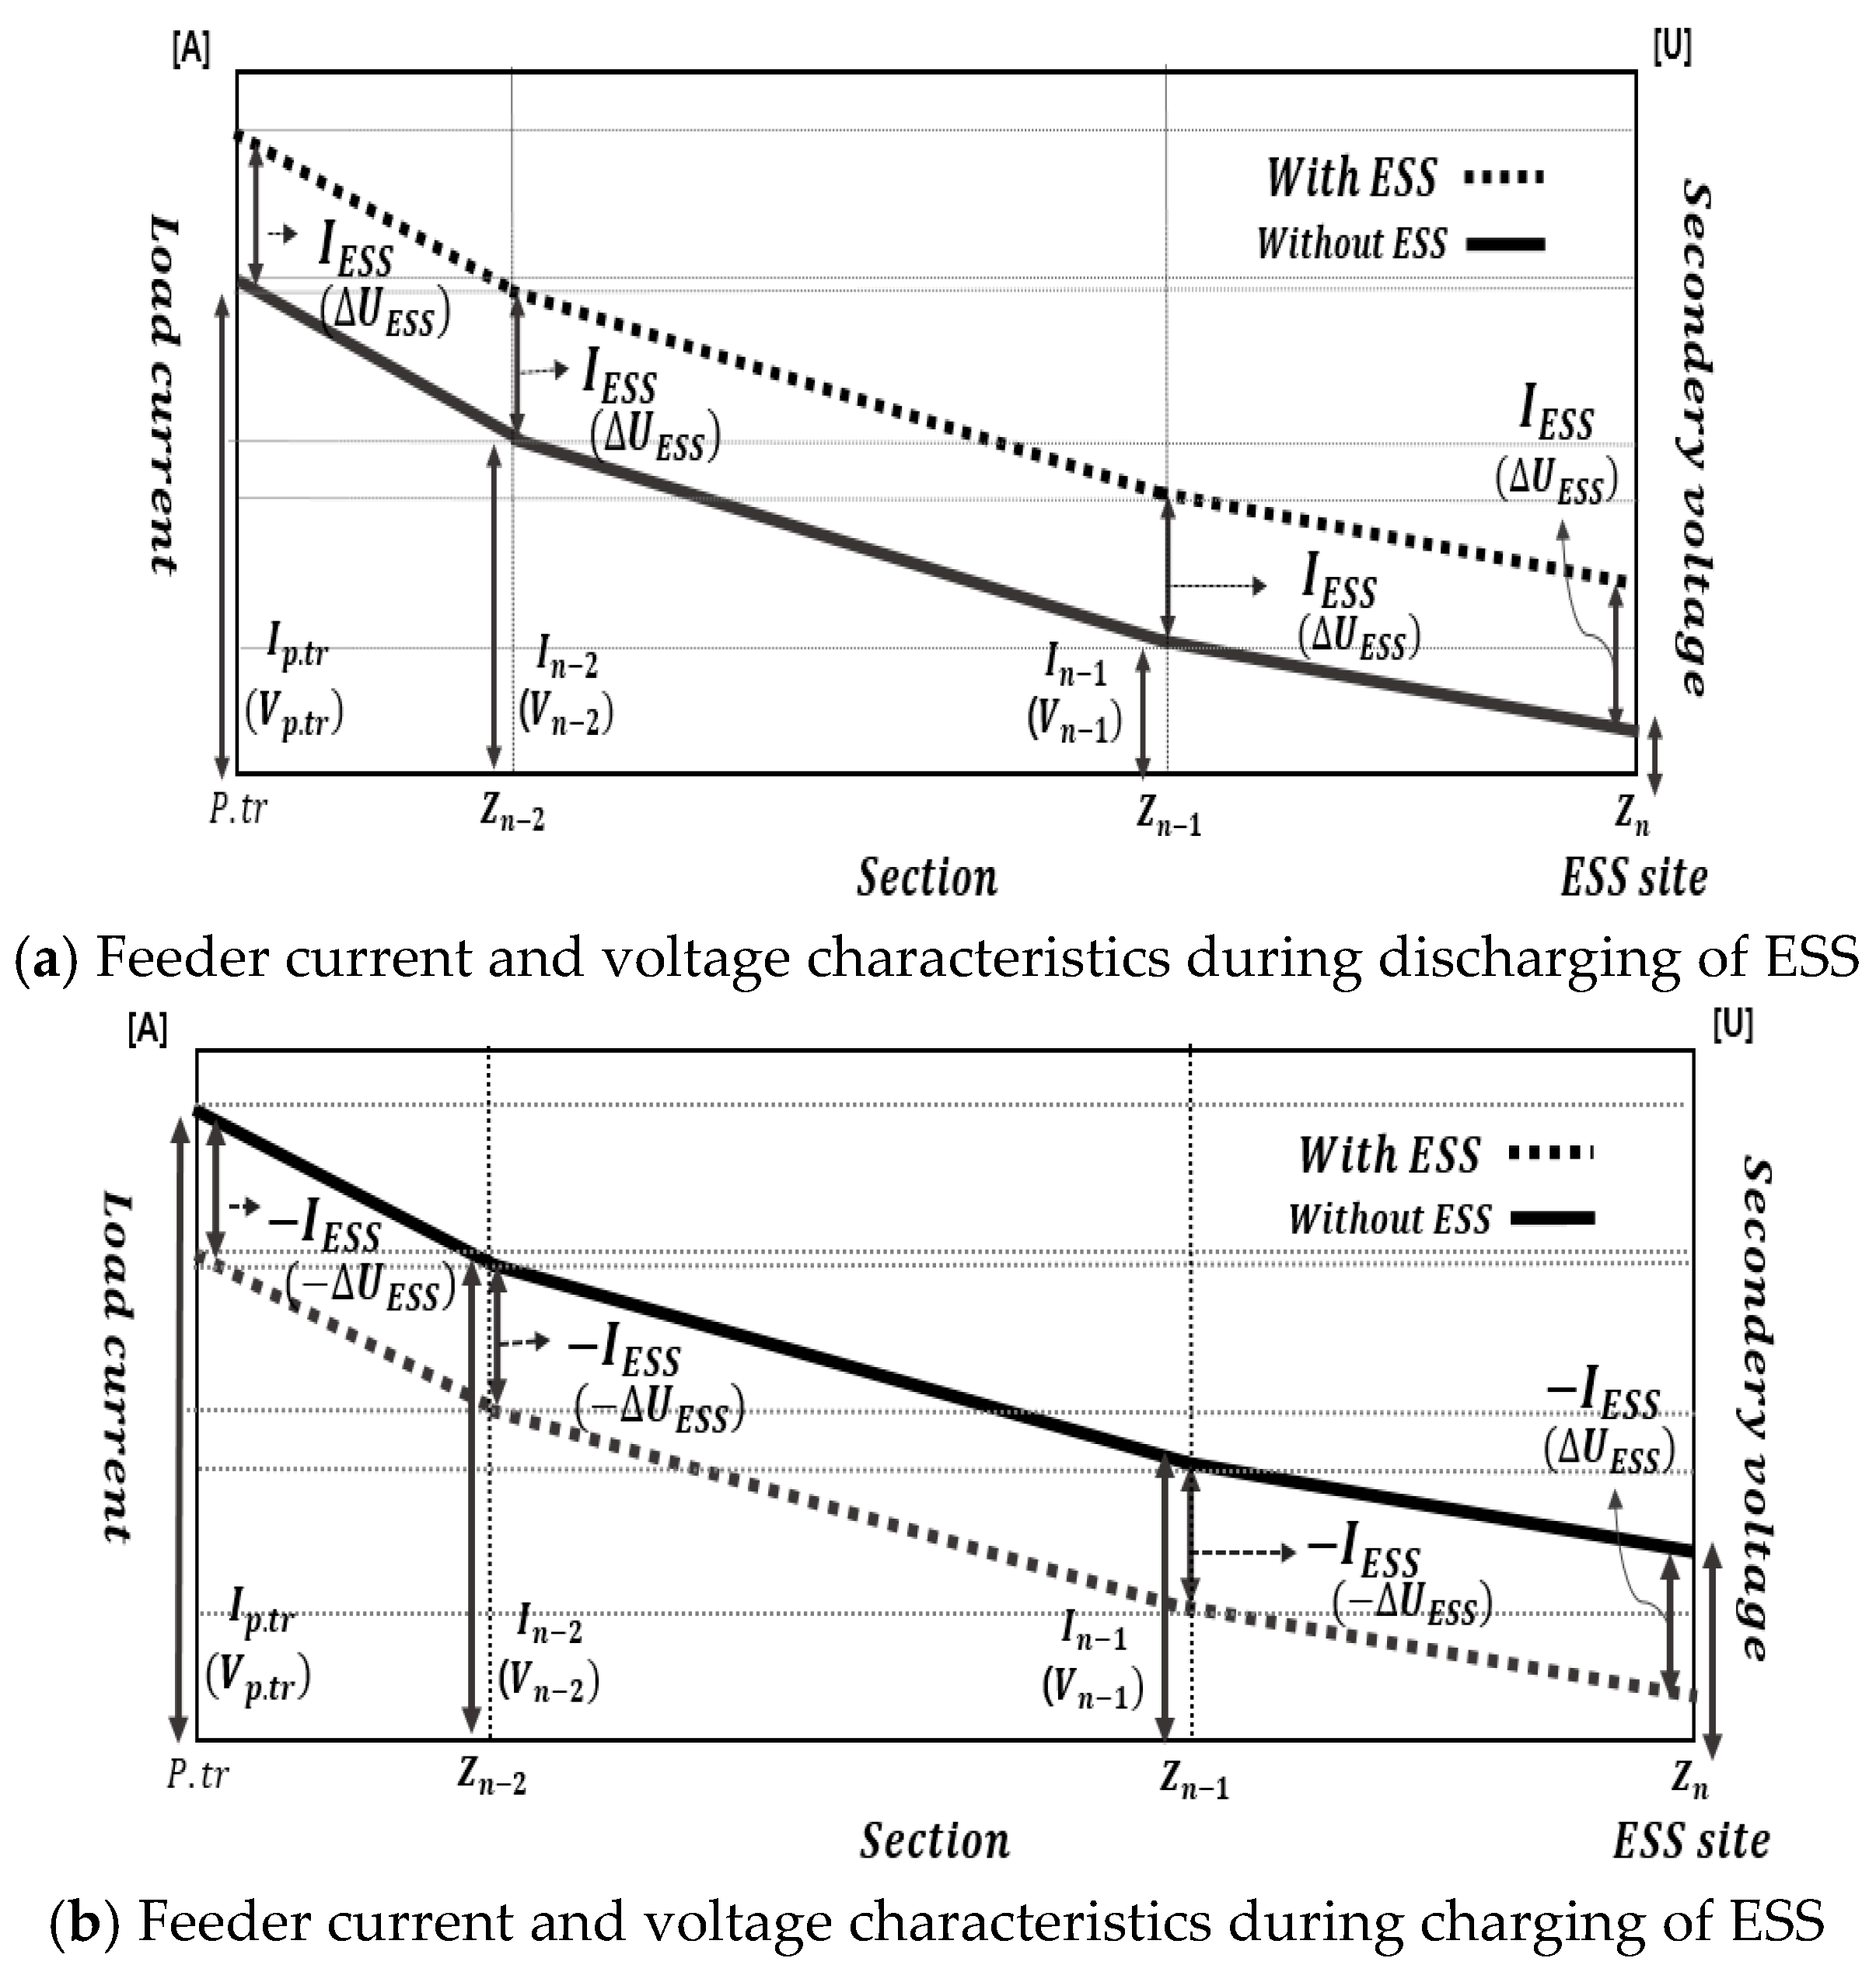
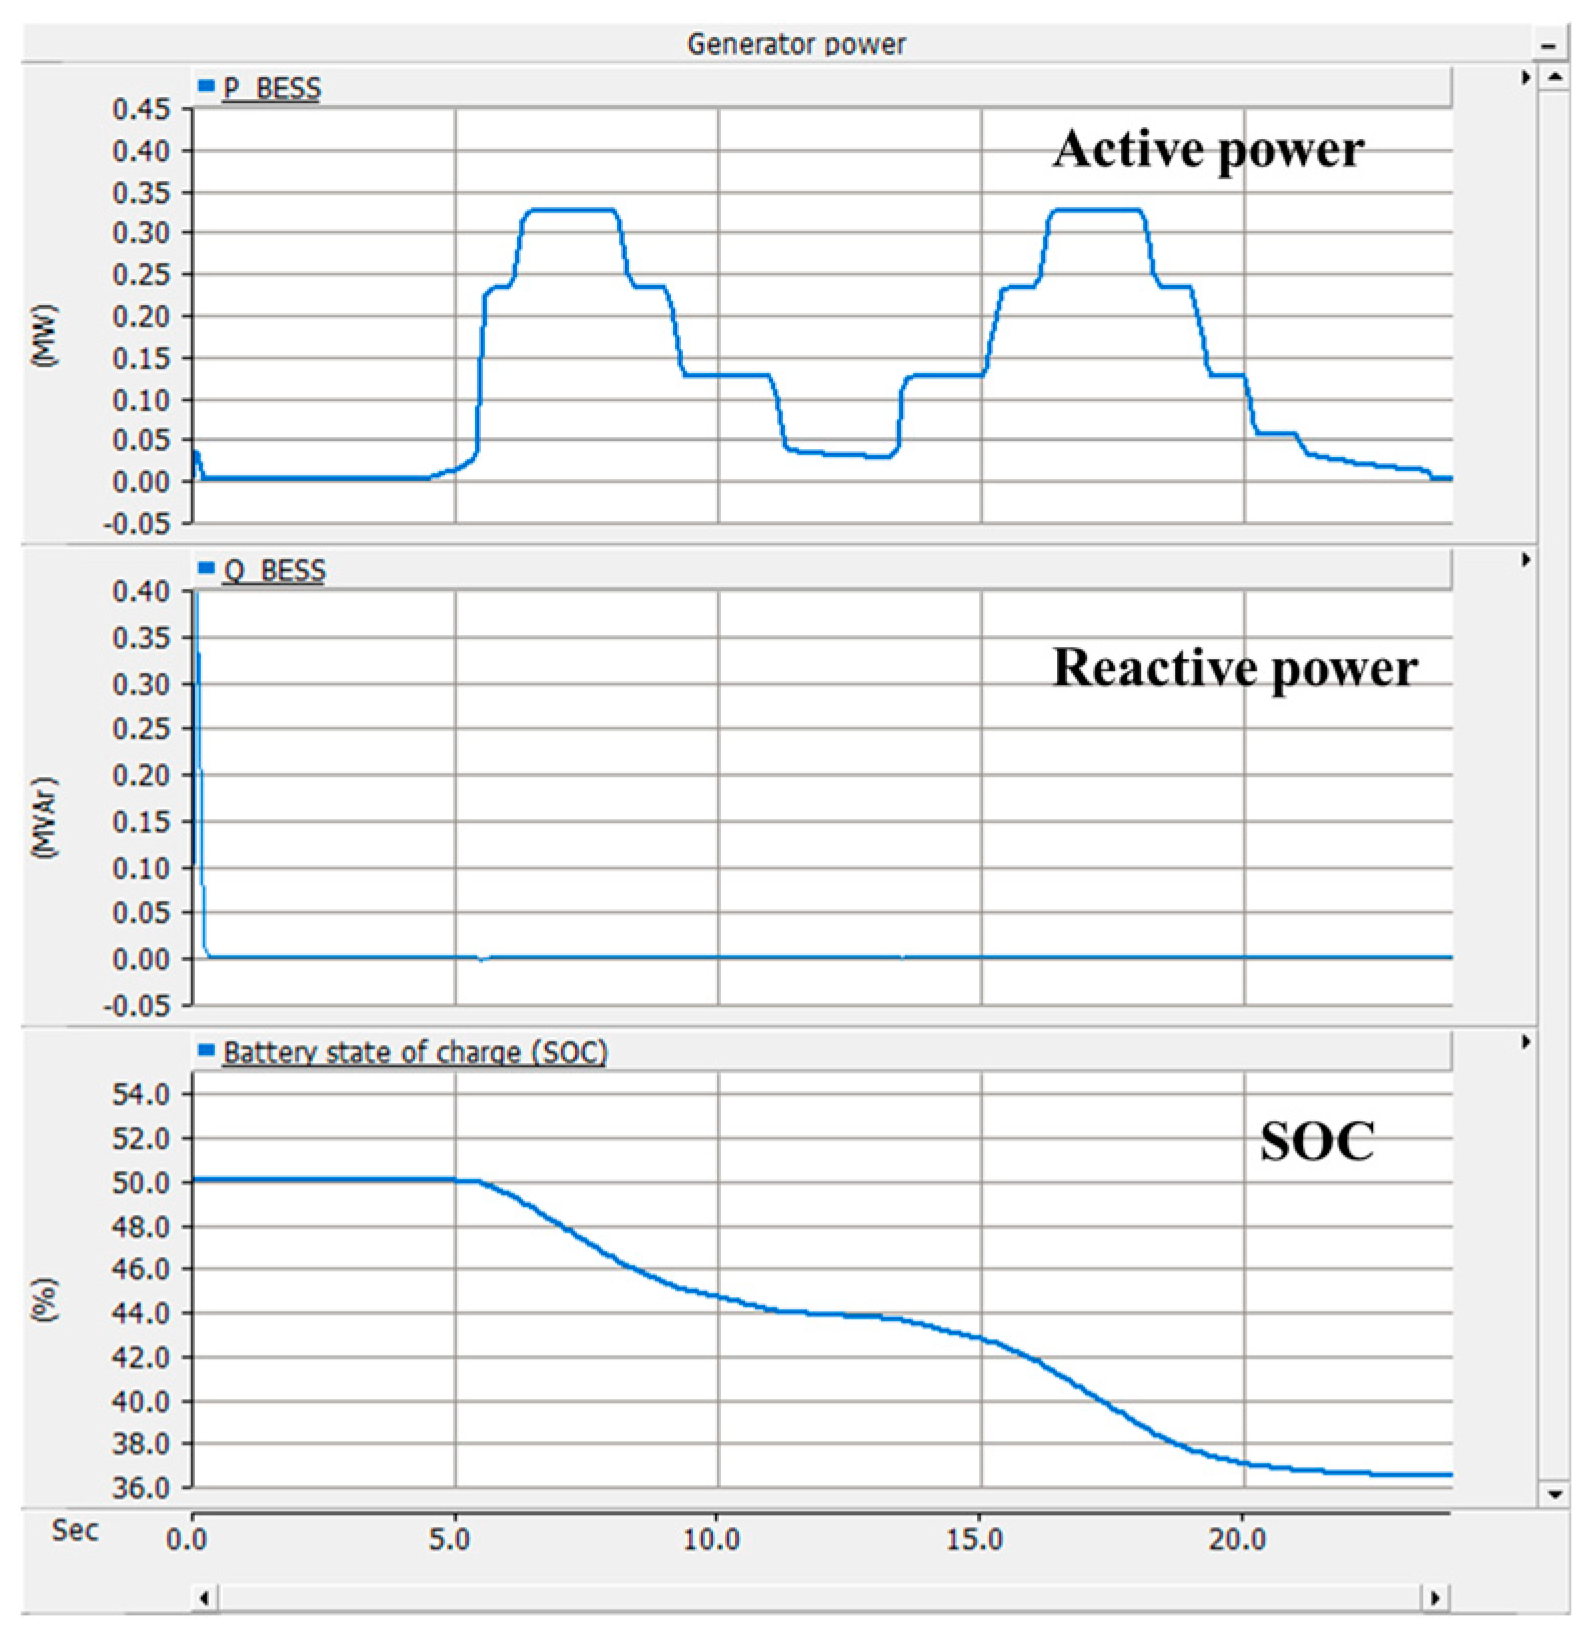
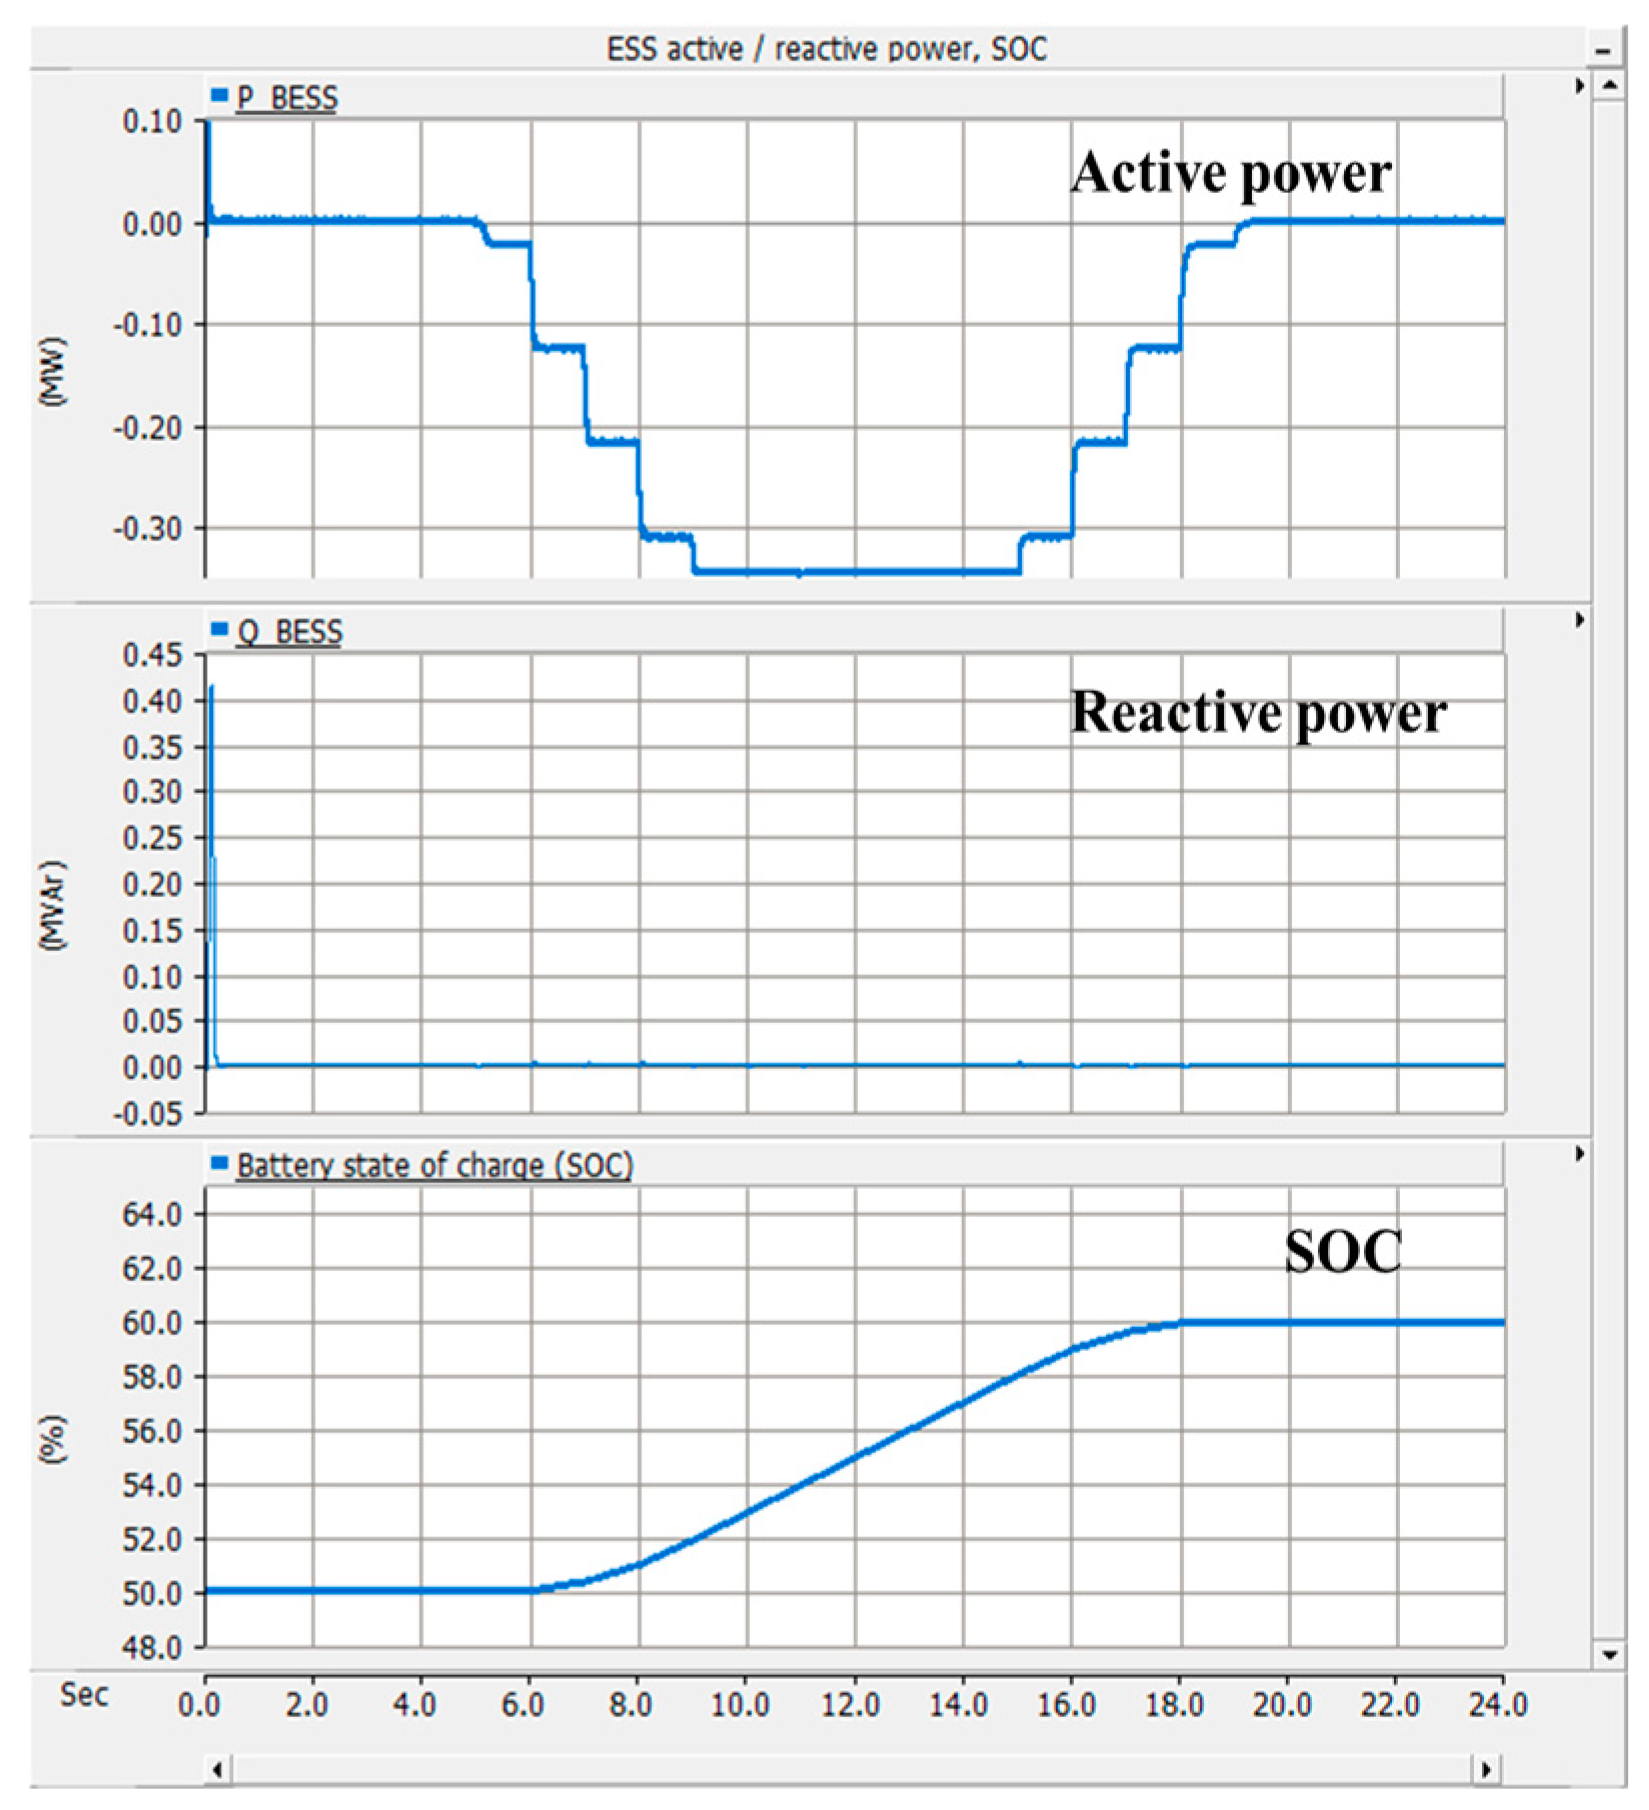
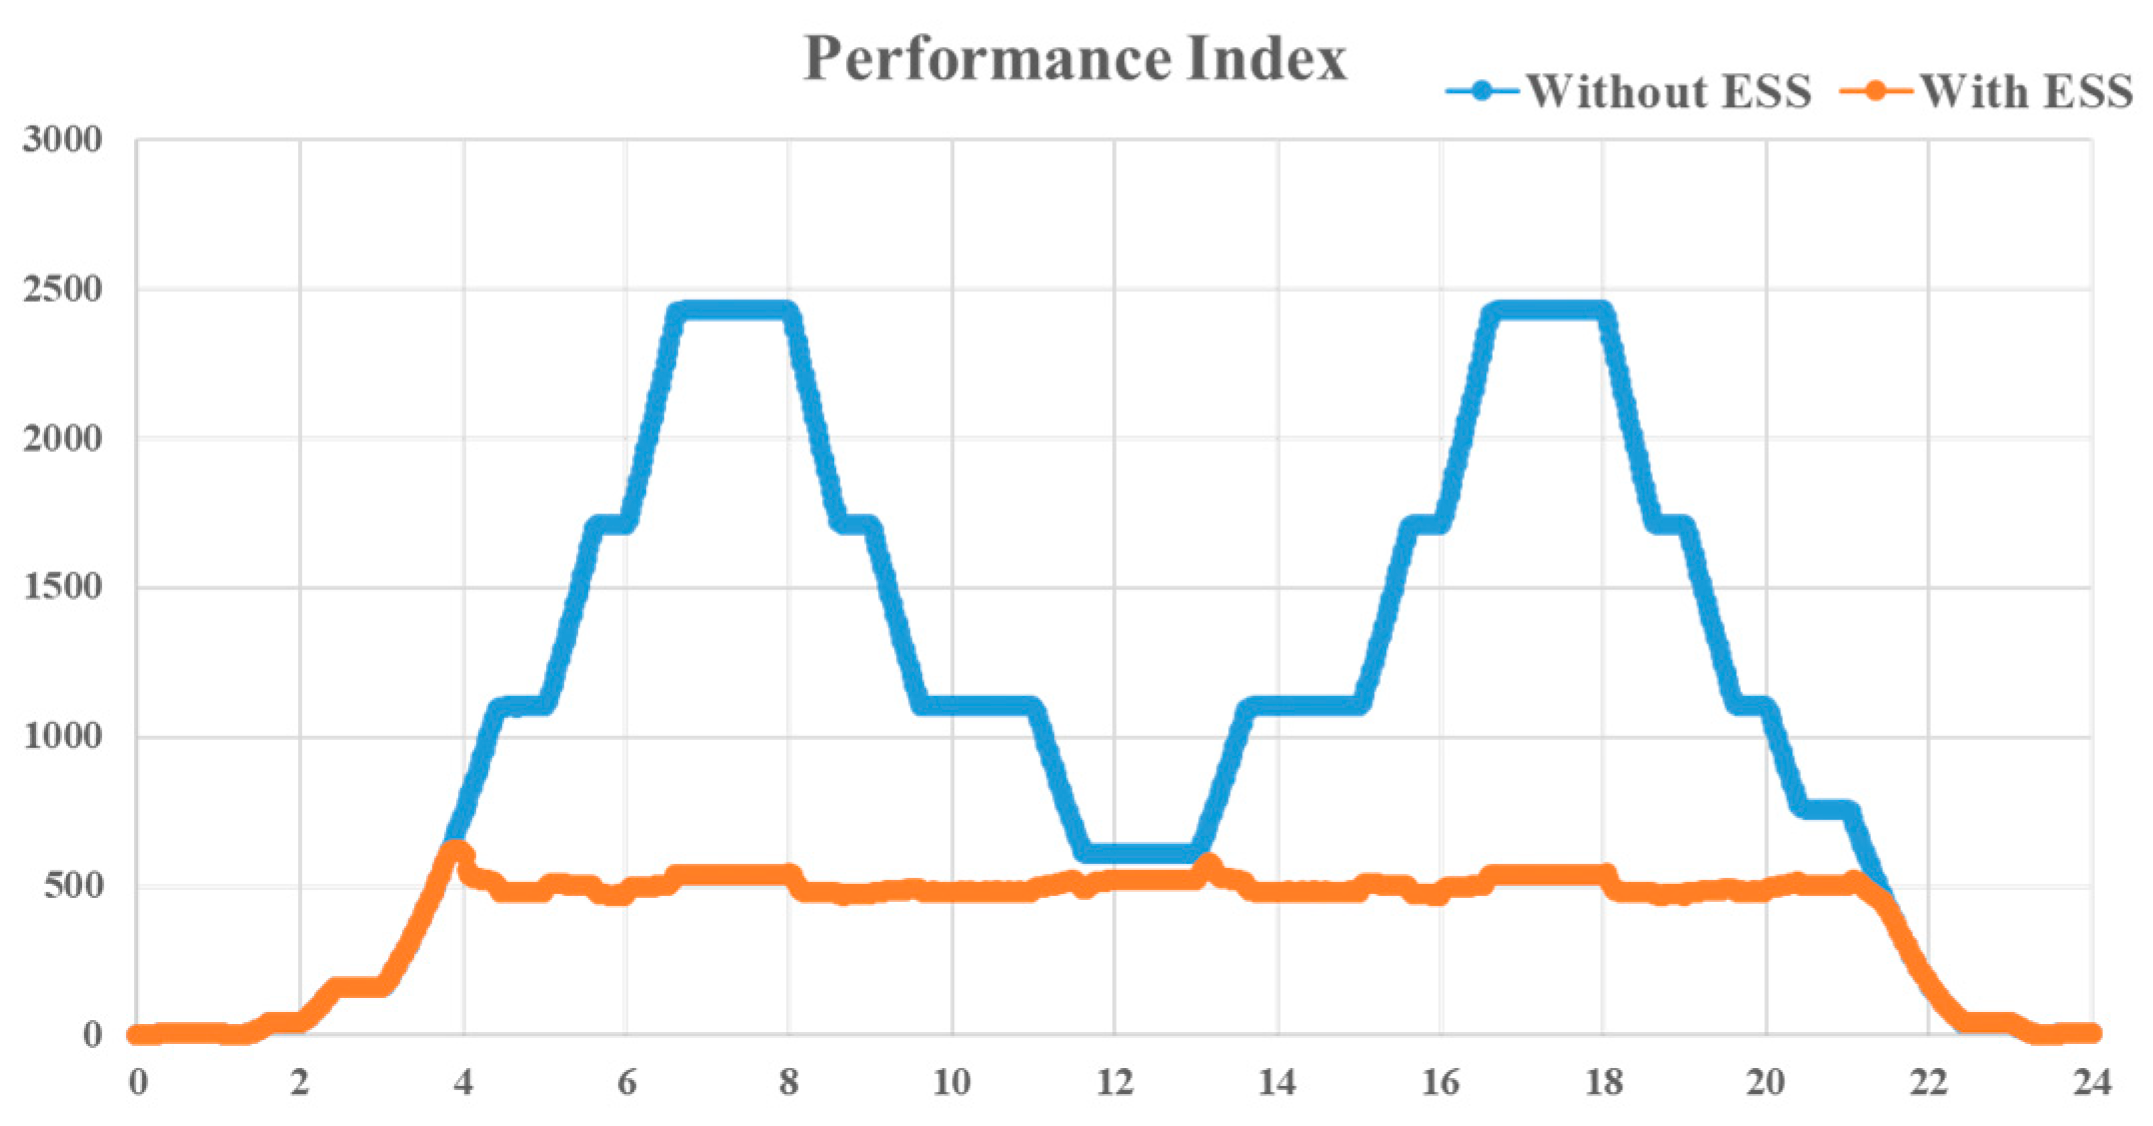
4.5. Analysis of ESS Operation Characteristics
5. Discussion
6. Conclusions
- (1)
- The innovative operation algorithm of the ESS was proposed to increase the capacity of EV and RES connected to the LVDS up to twice the capacity of pole transformer and to solve the voltage and feeder capacity problems that may occur at this time.
- (2)
- Modeling of a low voltage distribution system consisting of an ESS, PV, EV and load using PSCAD/EMTDC was presented. Additionally, through the simulation results, it was confirmed that the voltage and power of each section can be controlled to satisfy the allowable limit by discharging the ESS when the EV + load is twice the capacity of the pole transformer.
- (3)
- In addition, it was confirmed that the voltage and power of each section can be controlled to satisfy the allowable limit by charging mode of the ESS when the PV generation is twice the capacity of the pole transformer.
Author Contributions
Funding
Acknowledgments
Conflicts of Interest
Acronyms
| ESS | Energy Storage System |
| EVC | Electric Vehicle Charger |
| EV | Electric Vehicle |
| LVDS | Low Voltage Distribution System |
| PI | Performance Index |
| PV | Photovoltaic |
| SOC | State Of Charge |
| RES | Renewable Energy Resource |
| RMSE | Root Mean Square Error |
References
- Park, M.S.; Barrett, M.; Cassarino, T.G. Assessment of future renewable energy scenarios in South Korea based on costs, emissions and weather-driven hourly simulation. Renew. Energy 2019, 143, 1388–1396. [Google Scholar] [CrossRef]
- Park, Y.C.; Kim, D.S.; Huh, J.C.; Kim, Y.G. New and Renewable Energy Policies of Jeju Island in Korea. In Proceedings of the World Renewable Energy Congress-Sweden, Linköping, Sweden, 8–13 May 2011; pp. 2446–2453. [Google Scholar]
- Lavrijssen, S.; Anna, M.; Ana, T. The Changing World of the DSO in a Smart Energy System Environment: Key Issues and Policy Recommendations; TILEC Discussion Paper No. 2018-015; Elsevier: Amsterdam, Nederland, 2016; pp. 1–98. [Google Scholar]
- Behzad, H.; Majid, S.; Payam, T. Stochastic-based optimal charging strategy for plug-in electric vehicles aggregator under incentive and regulatory policies of DSO. IEEE Trans. Veh. Technol. 2019, 68, 3234–3245. [Google Scholar]
- Reza, H.; Hedayat, S. Emergence of hybrid energy storage systems in renewable energy and transport applications—A review. Renew. Sustain. Energy Rev. 2016, 65, 11–23. [Google Scholar]
- Matiha, Z.; Pavlos, S.; Niko, D.H.; Tomislav, C.; Davor, S. Review of energy storage allocation in power distribution networks: Applications, methods and future research. IET Gener. Transm. Distrib. 2016, 10, 645–652. [Google Scholar]
- Ko, Y.S. A study on the application cases analysis of ESS (Energy Storage System) to electric power system. J. KIECS 2016, 11, 53–58. [Google Scholar]
- Shim, J.W.; Cho, Y.; Kim, S.; Min, S.W.; Hur, K. Synergistic control of SMES and battery energy storage for enabling dispatchability of renewable energy sources. IEEE Trans. Appl. Supercond. 2013, 23, 5701205. [Google Scholar] [CrossRef]
- Wang, Y.; Tan, K.T.; Peng, X.Y.; So, P.L. Coordinated control of distributed energy-storage systems for voltage regulation in distribution networks. IEEE Trans. Power Deliv. 2016, 31, 1132–1141. [Google Scholar] [CrossRef]
- Marra, F.; Yang, G.; Træholt, C.; Østergaard, J.; Larsen, E.A. Decentralized Storage Strategy for Residential Feeders with Photovoltaics. IEEE Trans. Smart Grid 2014, 5, 974–981. [Google Scholar] [CrossRef]
- Erdinc, O.; Tascikaraoglu, A.; Paterakis, N.G.; Dursun, I.; Sinim, M.C.J.; Catalão, P.S. Optimal sizing and siting of distributed generation and EV charging stations in distribution systems. In Proceedings of the IEEE PES ISGT-Europe, Torino, Italy, 26–29 September 2017; pp. 1–6. [Google Scholar]
- Chaudhari, K.; Ukil, A.; Kumar, K.N.; Manandhar, U.; Kollimalla, S.K. Hybrid optimization for economic deployment of ESS in PV-integrated EV charging stations. IEEE Trans. Ind. Inform. 2018, 14, 106–116. [Google Scholar] [CrossRef]
- Rho, D.S.; Kook, K.S.; Wang, Y.P. Optimal algorithms for voltage management in distribution systems interconnected with new dispersed sources. J. Electr. Eng. Technol. 2011, 6, 192–201. [Google Scholar] [CrossRef][Green Version]
- Kim, B.K.; Nam, Y.H.; Ko, H.S.; Park, C.H.; Kim, H.C.; Ryu, K.S.; Kim, D.J. Novel voltage control method of the primary feeder by the energy storage system and step voltage regulator. Energies 2019, 12, 3357. [Google Scholar] [CrossRef]
- Falvo, M.C.; Grasselli, U.; Manganelli, M.A. Modesto. Small scale ESS for LV prosumers: An economic feasibility and sensitivity analysis. In Proceedings of the IEEE 15th International Conference on Environment and Electrical Engineering (EEEIC), Rome, Italy, 10–13 June 2015; pp. 950–955. [Google Scholar]
- Muyeen, S.M.; Ali, M.H.; Takahashi, R.; Murata, T.; Tamura, J. Wind generator output power smoothing and terminal voltage regulation by using STATCOM/ESS. In Proceedings of the IEEE Lausanne Power Tech, Lausanne, Switzerland, 1–5 July 2007; pp. 1232–1237. [Google Scholar]
- Elham, S.; Shahram, J. Cost reduction and peak shaving through domestic load shifting and DERs. Energy 2017, 124, 146–159. [Google Scholar]
- Mamandur, K.R.C.; Chenoweth, R.D. Optimal control of reactive power flow for improvements in voltage profiles and for real power loss minimization. IEEE Trans. Power Appar. Syst. 1981, 100, 3185–3194. [Google Scholar] [CrossRef]
- PSCAD/EMTDC. Three-Phase Battery Energy Storage System, Reversion 1; Powered by Manitoba Hydro. International Ltd.: Winnipeg, MB, USA; Available online: https://hvdc.ca/engineering/ (accessed on 29 August 2019).
- Tremblay, O.; Dessaint, L.A.; Dekkiche, A.I. A generic battery model for the dynamic simulation of hybrid electric vehicles. In Proceedings of the IEEE Vehicle Power and Propulsion Conference, Arlington, TX, USA, 9–12 September 2007; pp. 284–289. [Google Scholar]
- Kim, B.K.; Ryu, K.S.; Kim, C.H.; Rho, D.S. A study on the customer voltage characteristic of distribution system with large scale PV. Trans. Korean Inst. Electr. Eng. 2013, 62, 29–36. [Google Scholar] [CrossRef]


| Ref. | Contents |
|---|---|
| [9,10] | Voltage control in LVDS with high photovoltaic using ESS |
| [11] | Optimization Model for Sizing and Siting of Distributed Generation Units, EV Charging Stations, and ESS |
| [12] | Economic effect of ESS in LVDS |
| Classification | α | β | γ | δ | η |
|---|---|---|---|---|---|
| Charging mode | 1 | - | - | - | - |
| Discharging Mode | 0 | 1 | - | - | - |
| ESS SOC Charging Operation | 1 | - | 1 | - | - |
| ESS SOC Discharging Operation | 0 | 1 | - | - | - |
| Charging Mode SOC > 90% | - | - | - | 1 | - |
| Discharging Mode SOC < 10% | - | - | - | - | 1 |
| Category | Contents |
|---|---|
| Pole Transformer | 300 [KVA], 13,200/230 [V] |
| Rated Voltage | 220 [V] |
| PF | 1 |
| Line Impedance 1 (R1 + jX1) | XLPE/PVC-95 [mm2] Z = 0.248 + j0.0852 [ohm/km] |
| Line Impedance 2 (R2 + jX2) | XLPE/PVC-185 [mm2] Z = 0.129 + j0.0860 [ohm/km] |
| Load (customer, EV) | 50 [kW]–600 [kW] |
| PV | 0 [kW]–600 [kW] |
| ESS Capacity | 400 [kWh] |
| Classification | Before operating ESS | After operating ESS |
|---|---|---|
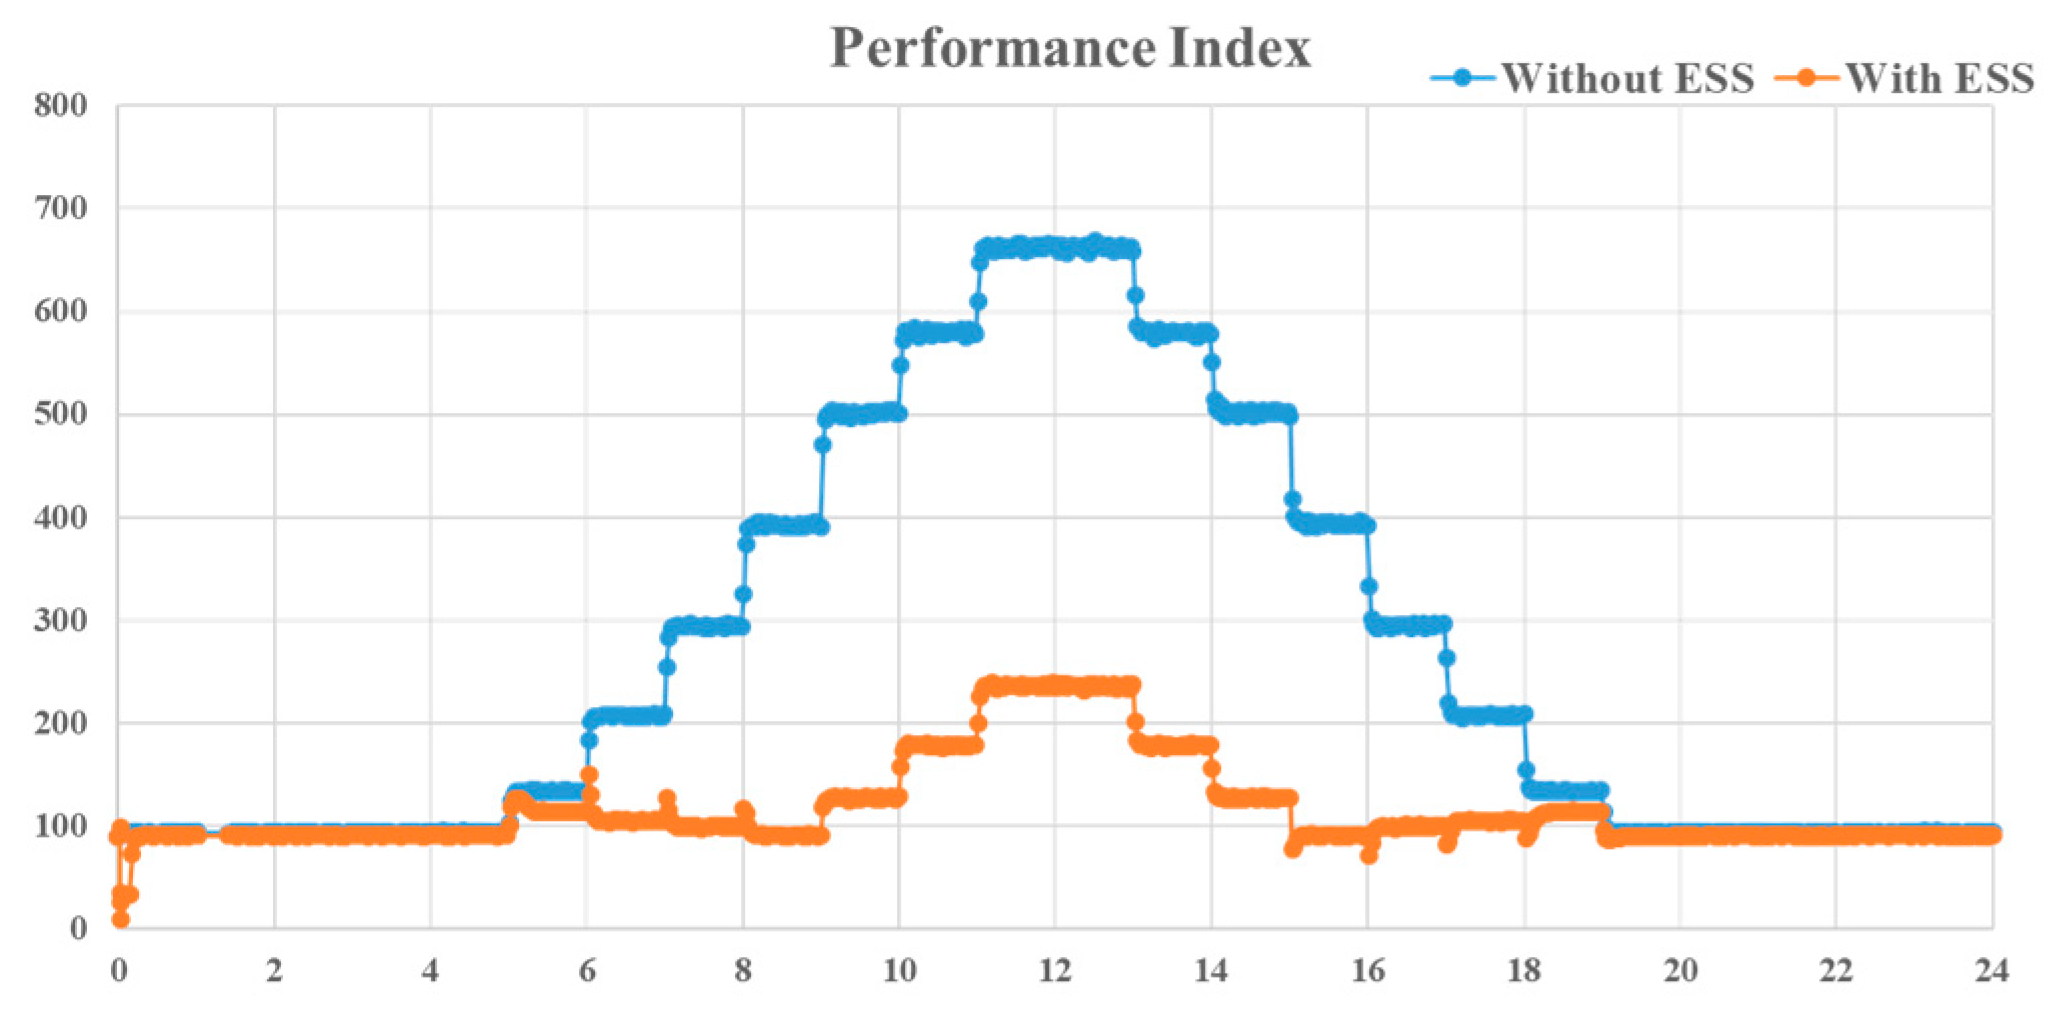
| Performance index value | 16.41 | 10.78 |
| Classification | Before operating ESS | After operating ESS |
|---|---|---|
| Performance index value | 32.98 | 19.95 |
© 2019 by the authors. Licensee MDPI, Basel, Switzerland. This article is an open access article distributed under the terms and conditions of the Creative Commons Attribution (CC BY) license (http://creativecommons.org/licenses/by/4.0/).
Share and Cite
Ryu, K.-S.; Kim, D.-J.; Nam, Y.-H.; Ko, H.; Kim, B.; Kim, H.-C. An Innovative Operation Strategy of ESS for Capacity Expansion of Renewable Energy and Customer Load with Electric Vehicle Chargers in Low Voltage Distribution Systems. Energies 2019, 12, 4668. https://doi.org/10.3390/en12244668
Ryu K-S, Kim D-J, Nam Y-H, Ko H, Kim B, Kim H-C. An Innovative Operation Strategy of ESS for Capacity Expansion of Renewable Energy and Customer Load with Electric Vehicle Chargers in Low Voltage Distribution Systems. Energies. 2019; 12(24):4668. https://doi.org/10.3390/en12244668
Chicago/Turabian StyleRyu, Kyung-Sang, Dae-Jin Kim, Yang-Hyun Nam, Heesang Ko, Byungki Kim, and Ho-Chan Kim. 2019. "An Innovative Operation Strategy of ESS for Capacity Expansion of Renewable Energy and Customer Load with Electric Vehicle Chargers in Low Voltage Distribution Systems" Energies 12, no. 24: 4668. https://doi.org/10.3390/en12244668
APA StyleRyu, K.-S., Kim, D.-J., Nam, Y.-H., Ko, H., Kim, B., & Kim, H.-C. (2019). An Innovative Operation Strategy of ESS for Capacity Expansion of Renewable Energy and Customer Load with Electric Vehicle Chargers in Low Voltage Distribution Systems. Energies, 12(24), 4668. https://doi.org/10.3390/en12244668