Using Artificial Intelligence to Predict Wind Speed for Energy Application in Saudi Arabia


Abstract

1. Introduction
2. Related Work
2.1. Physical Methods
2.2. Statistical Methods
2.3. Hybrid Methods
2.4. Artificial Intelligence Methods
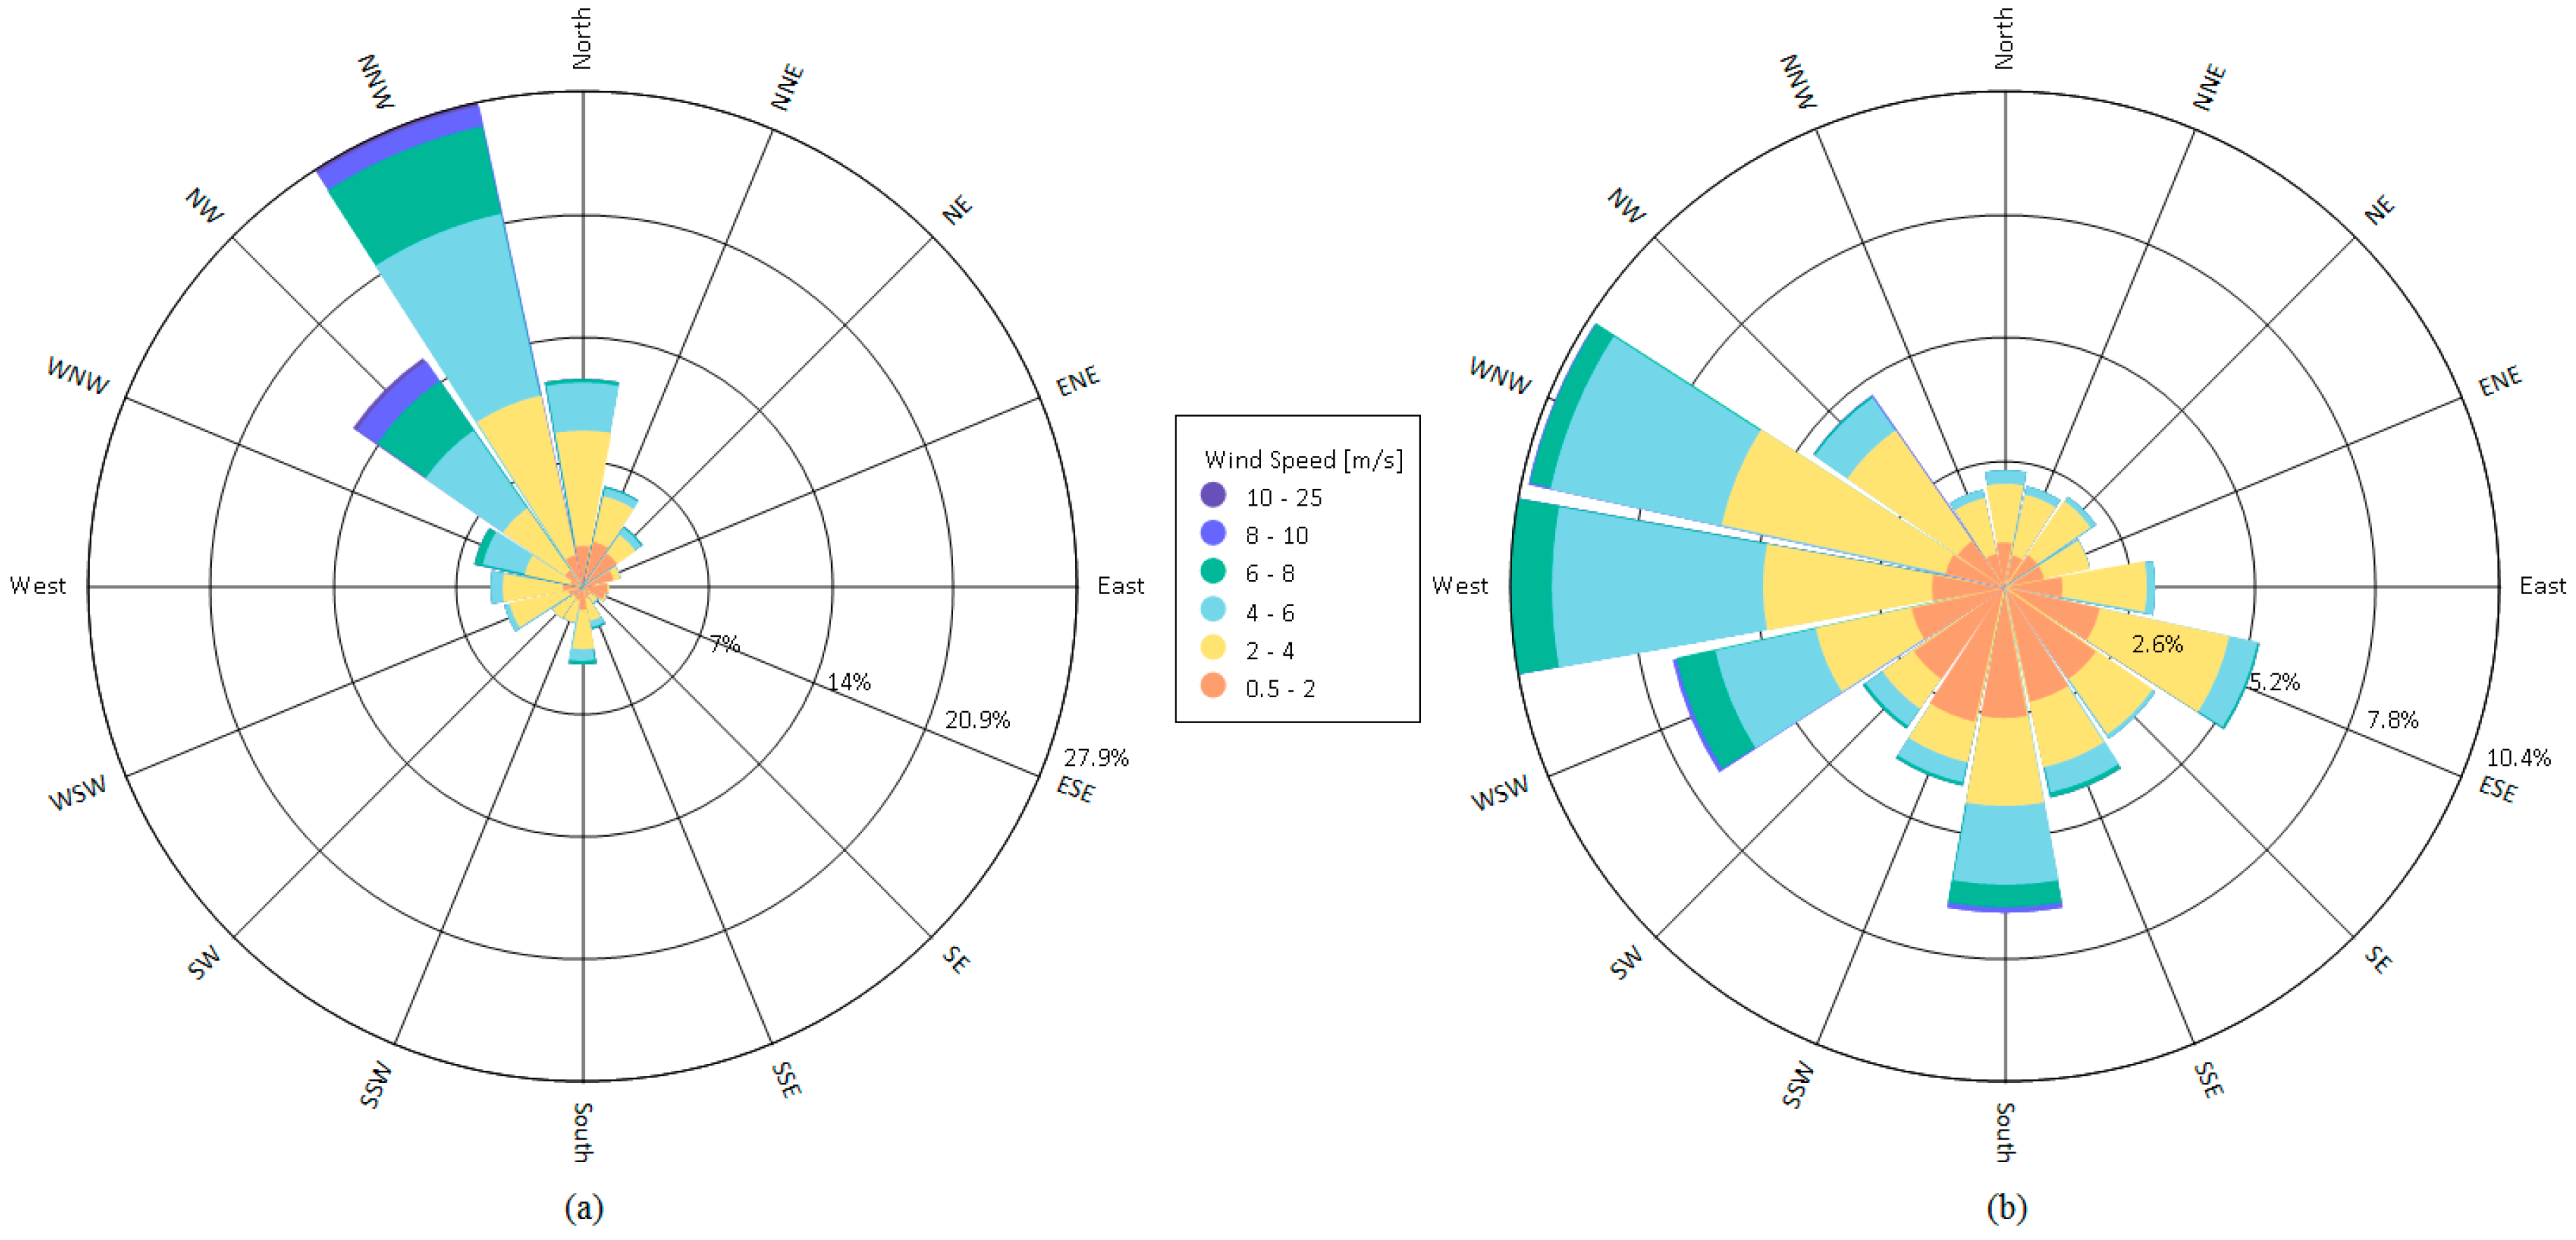
3. Wind Data Collection
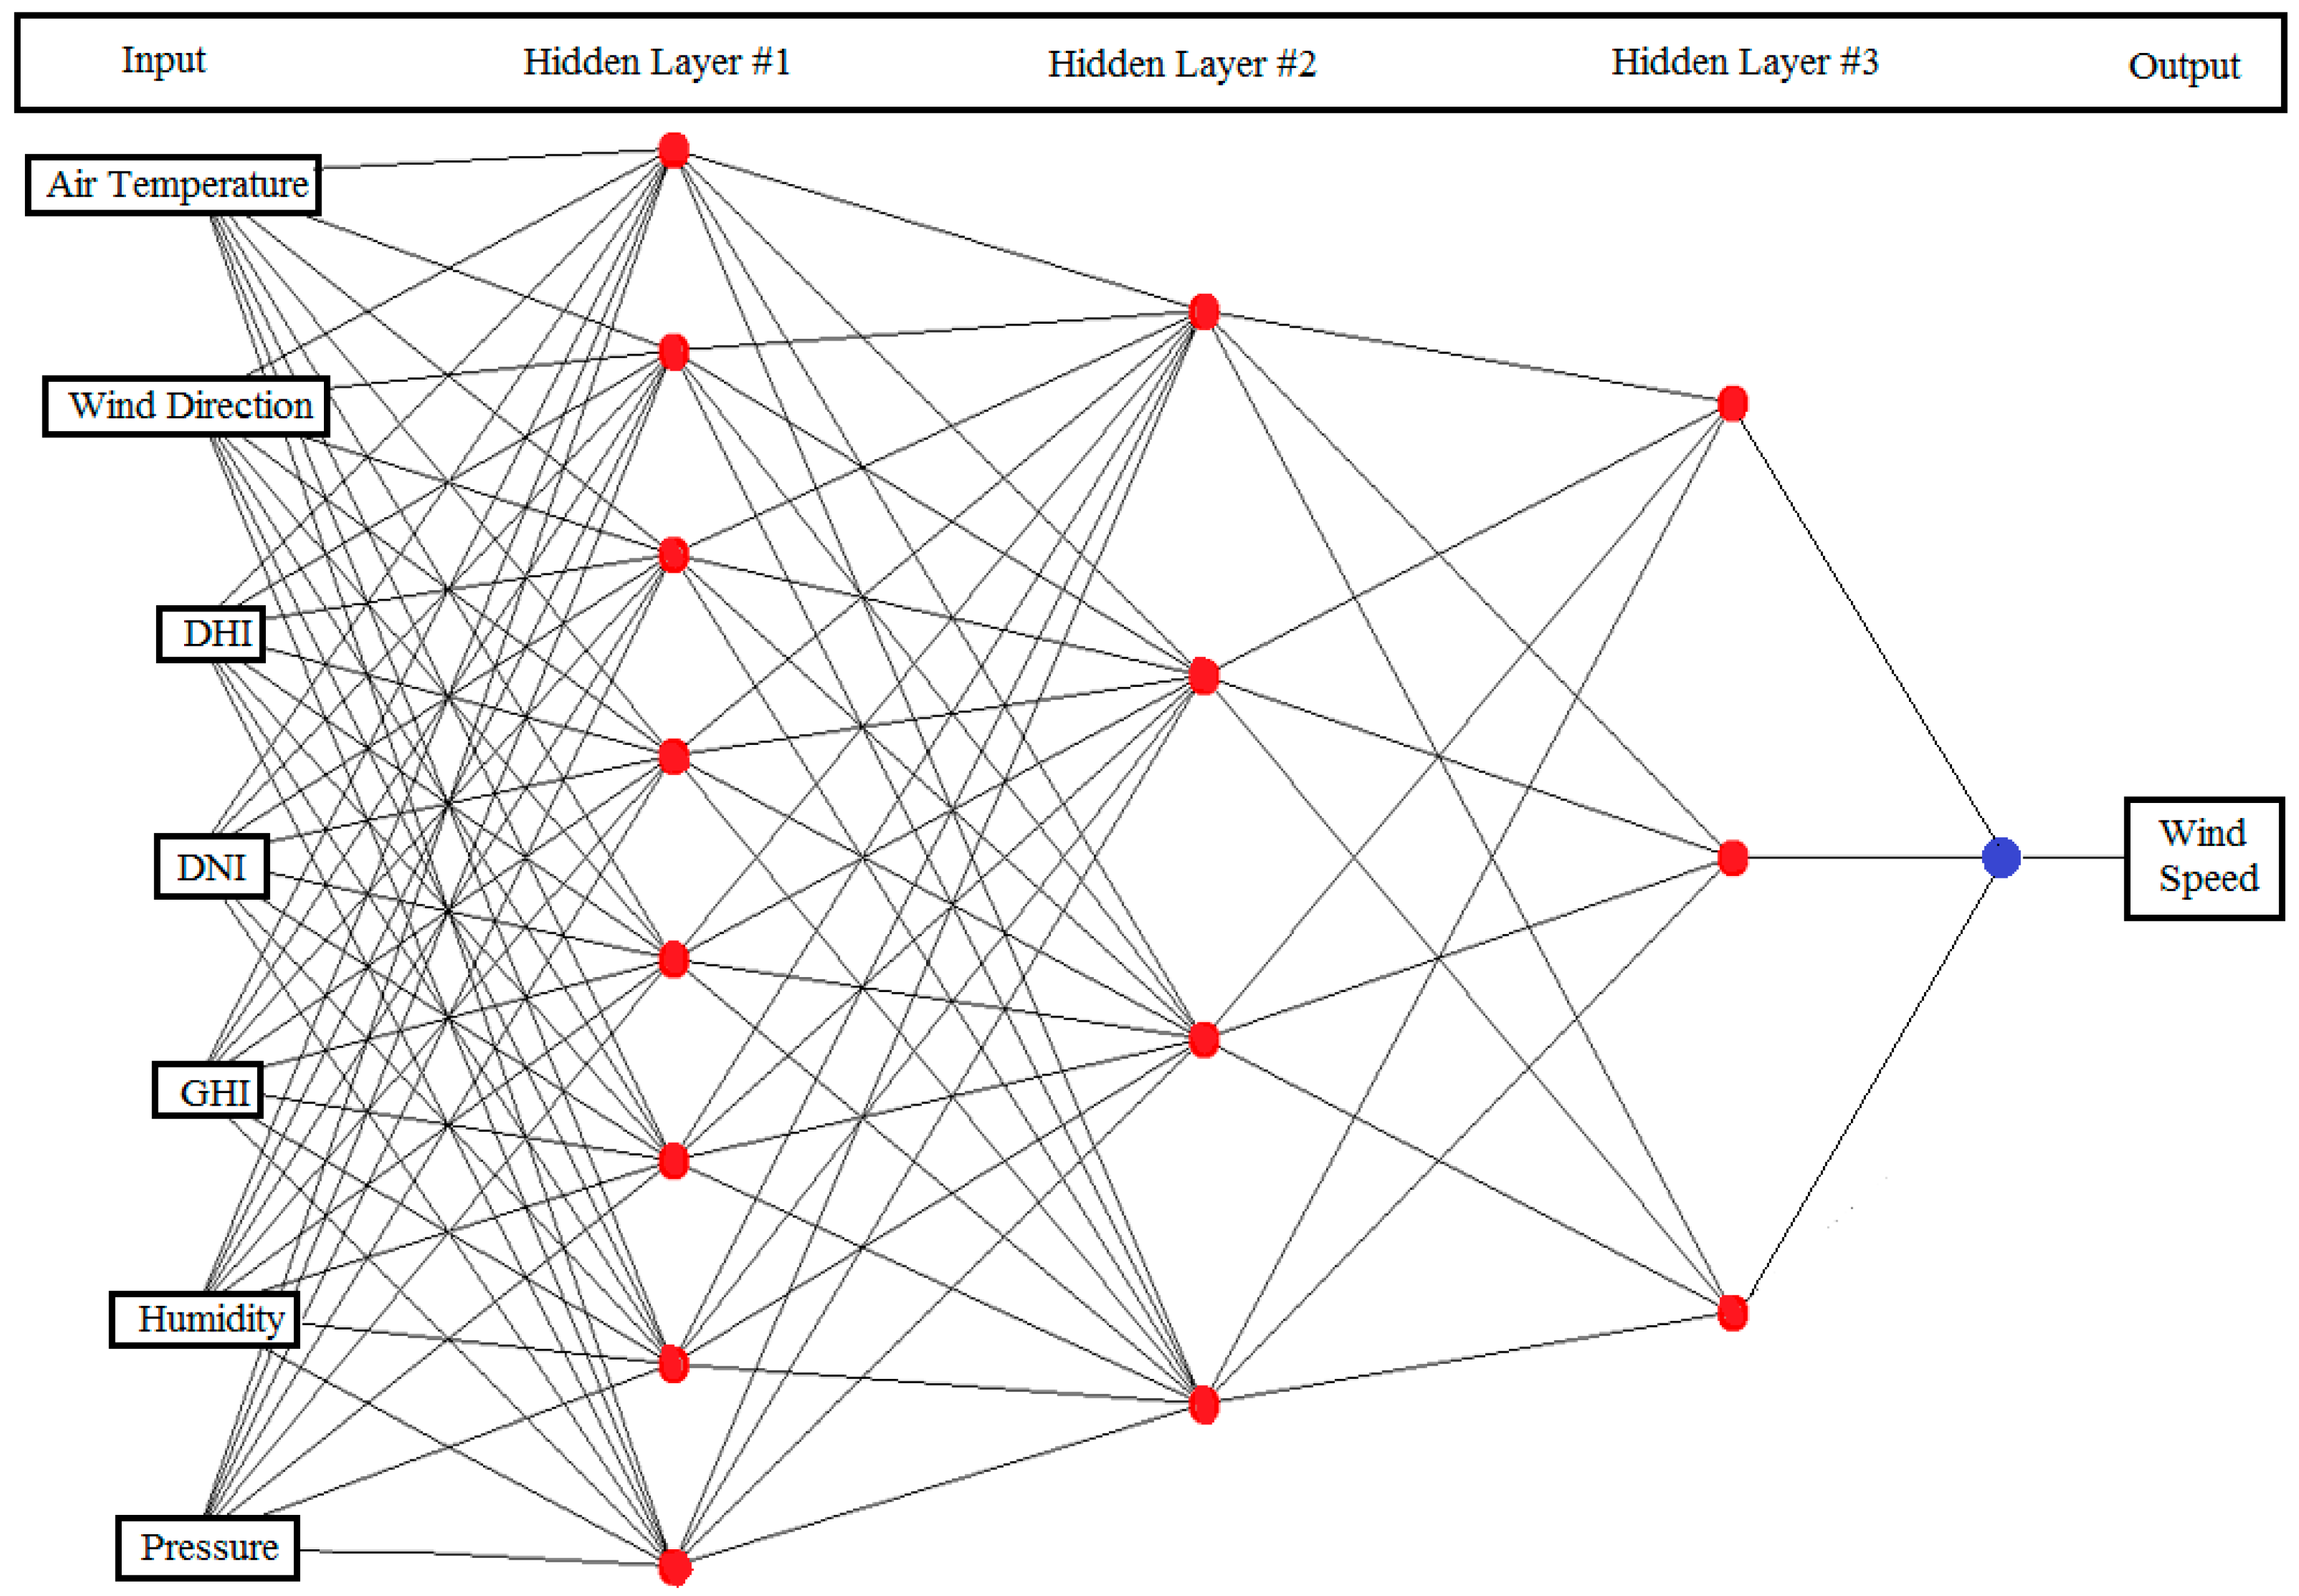
4. Artificial Neural Network Modeling
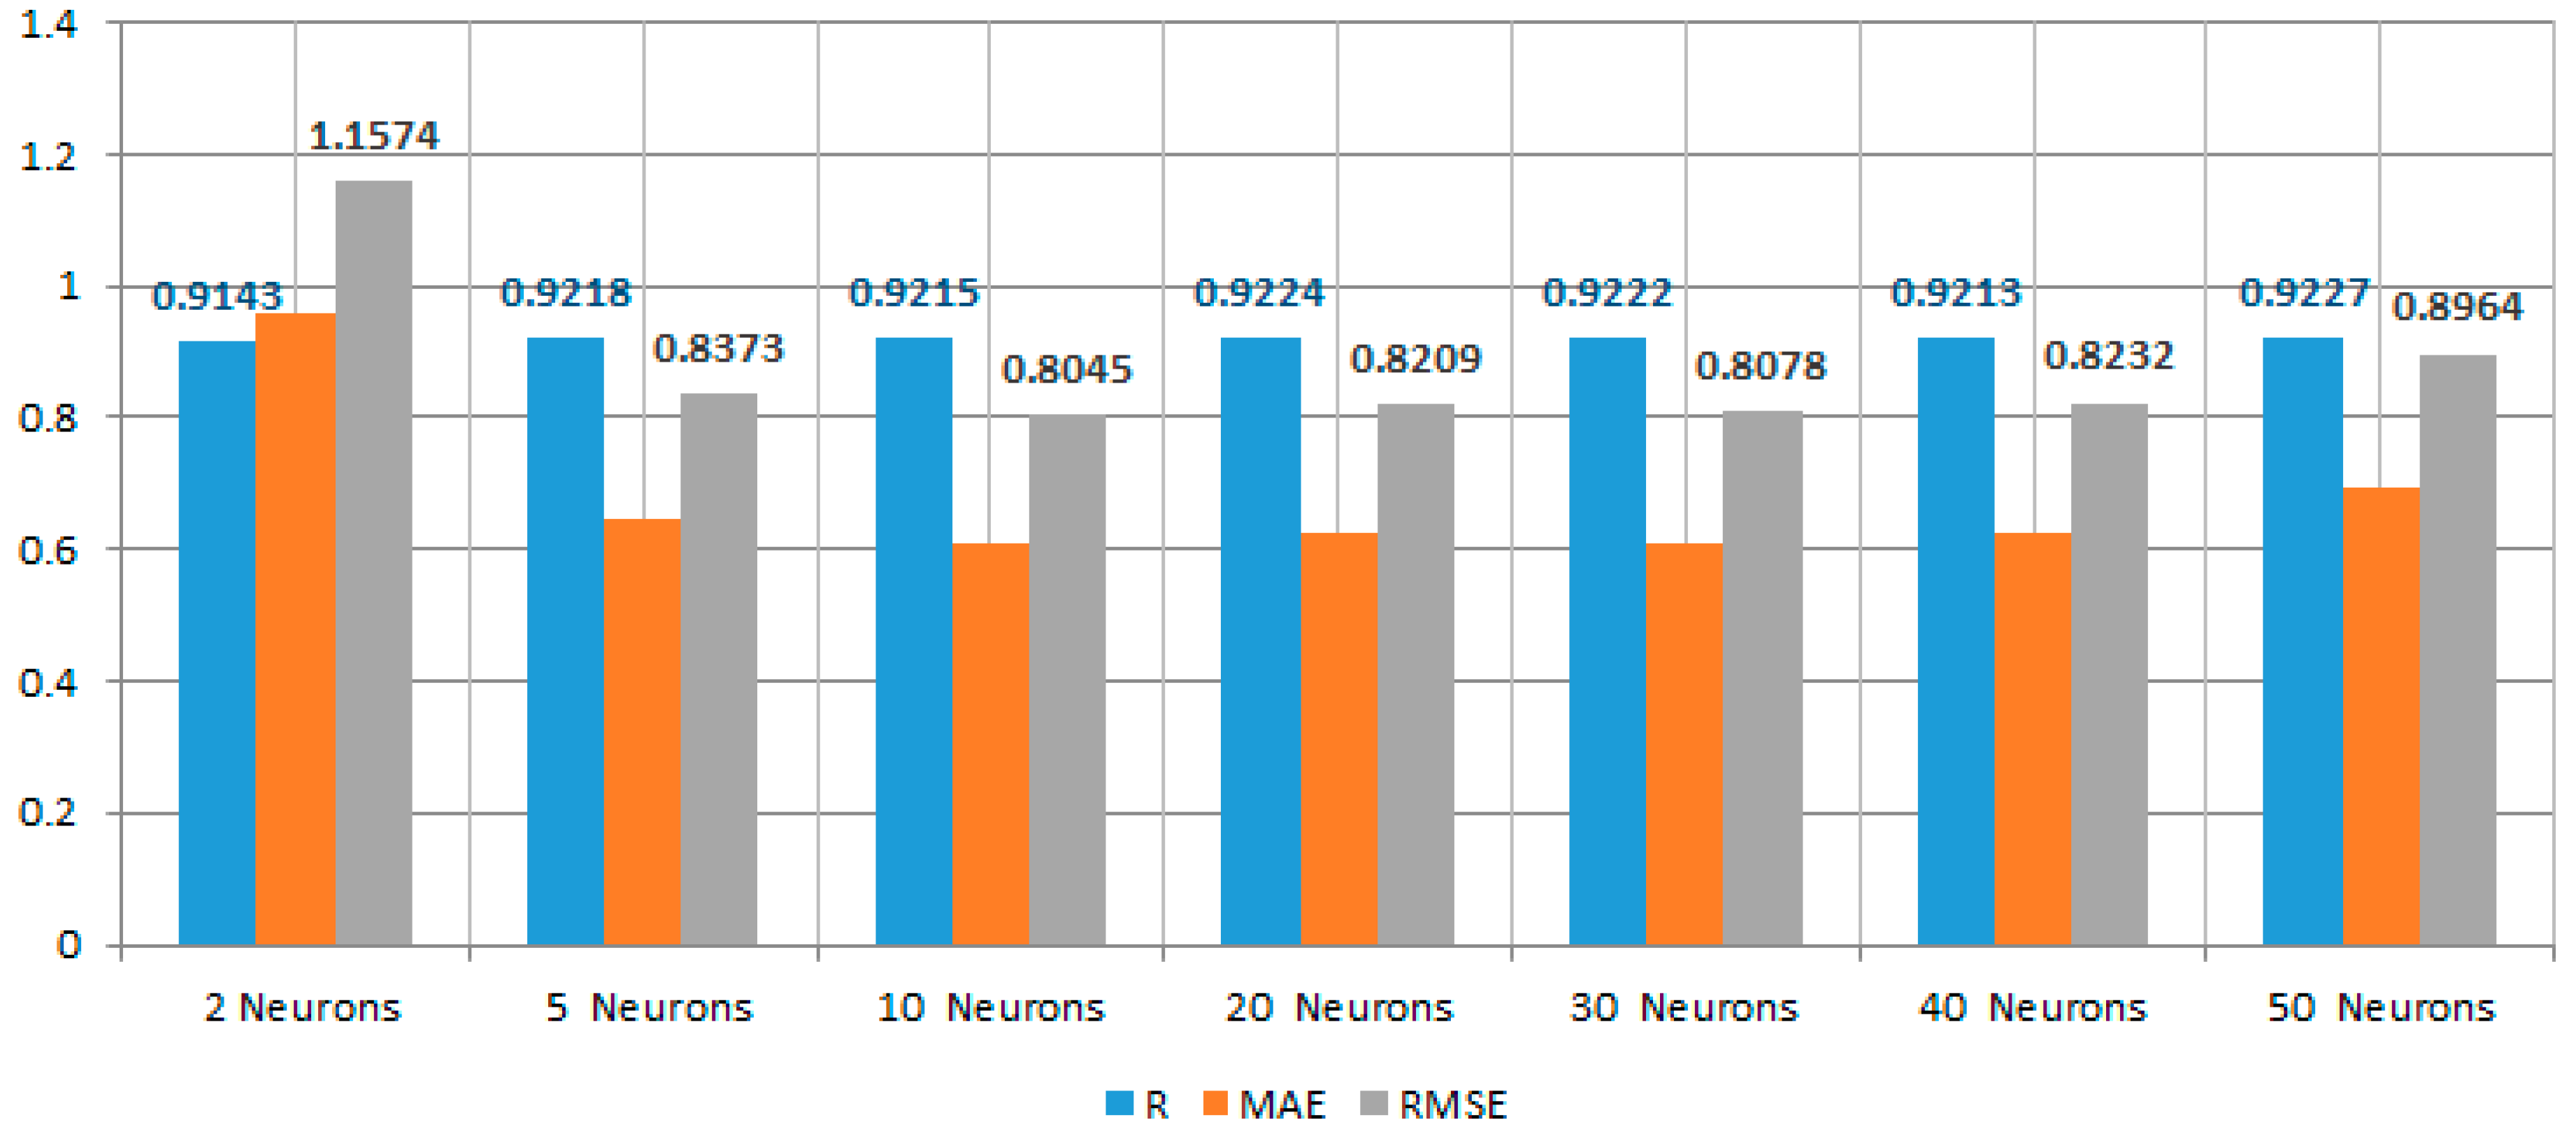
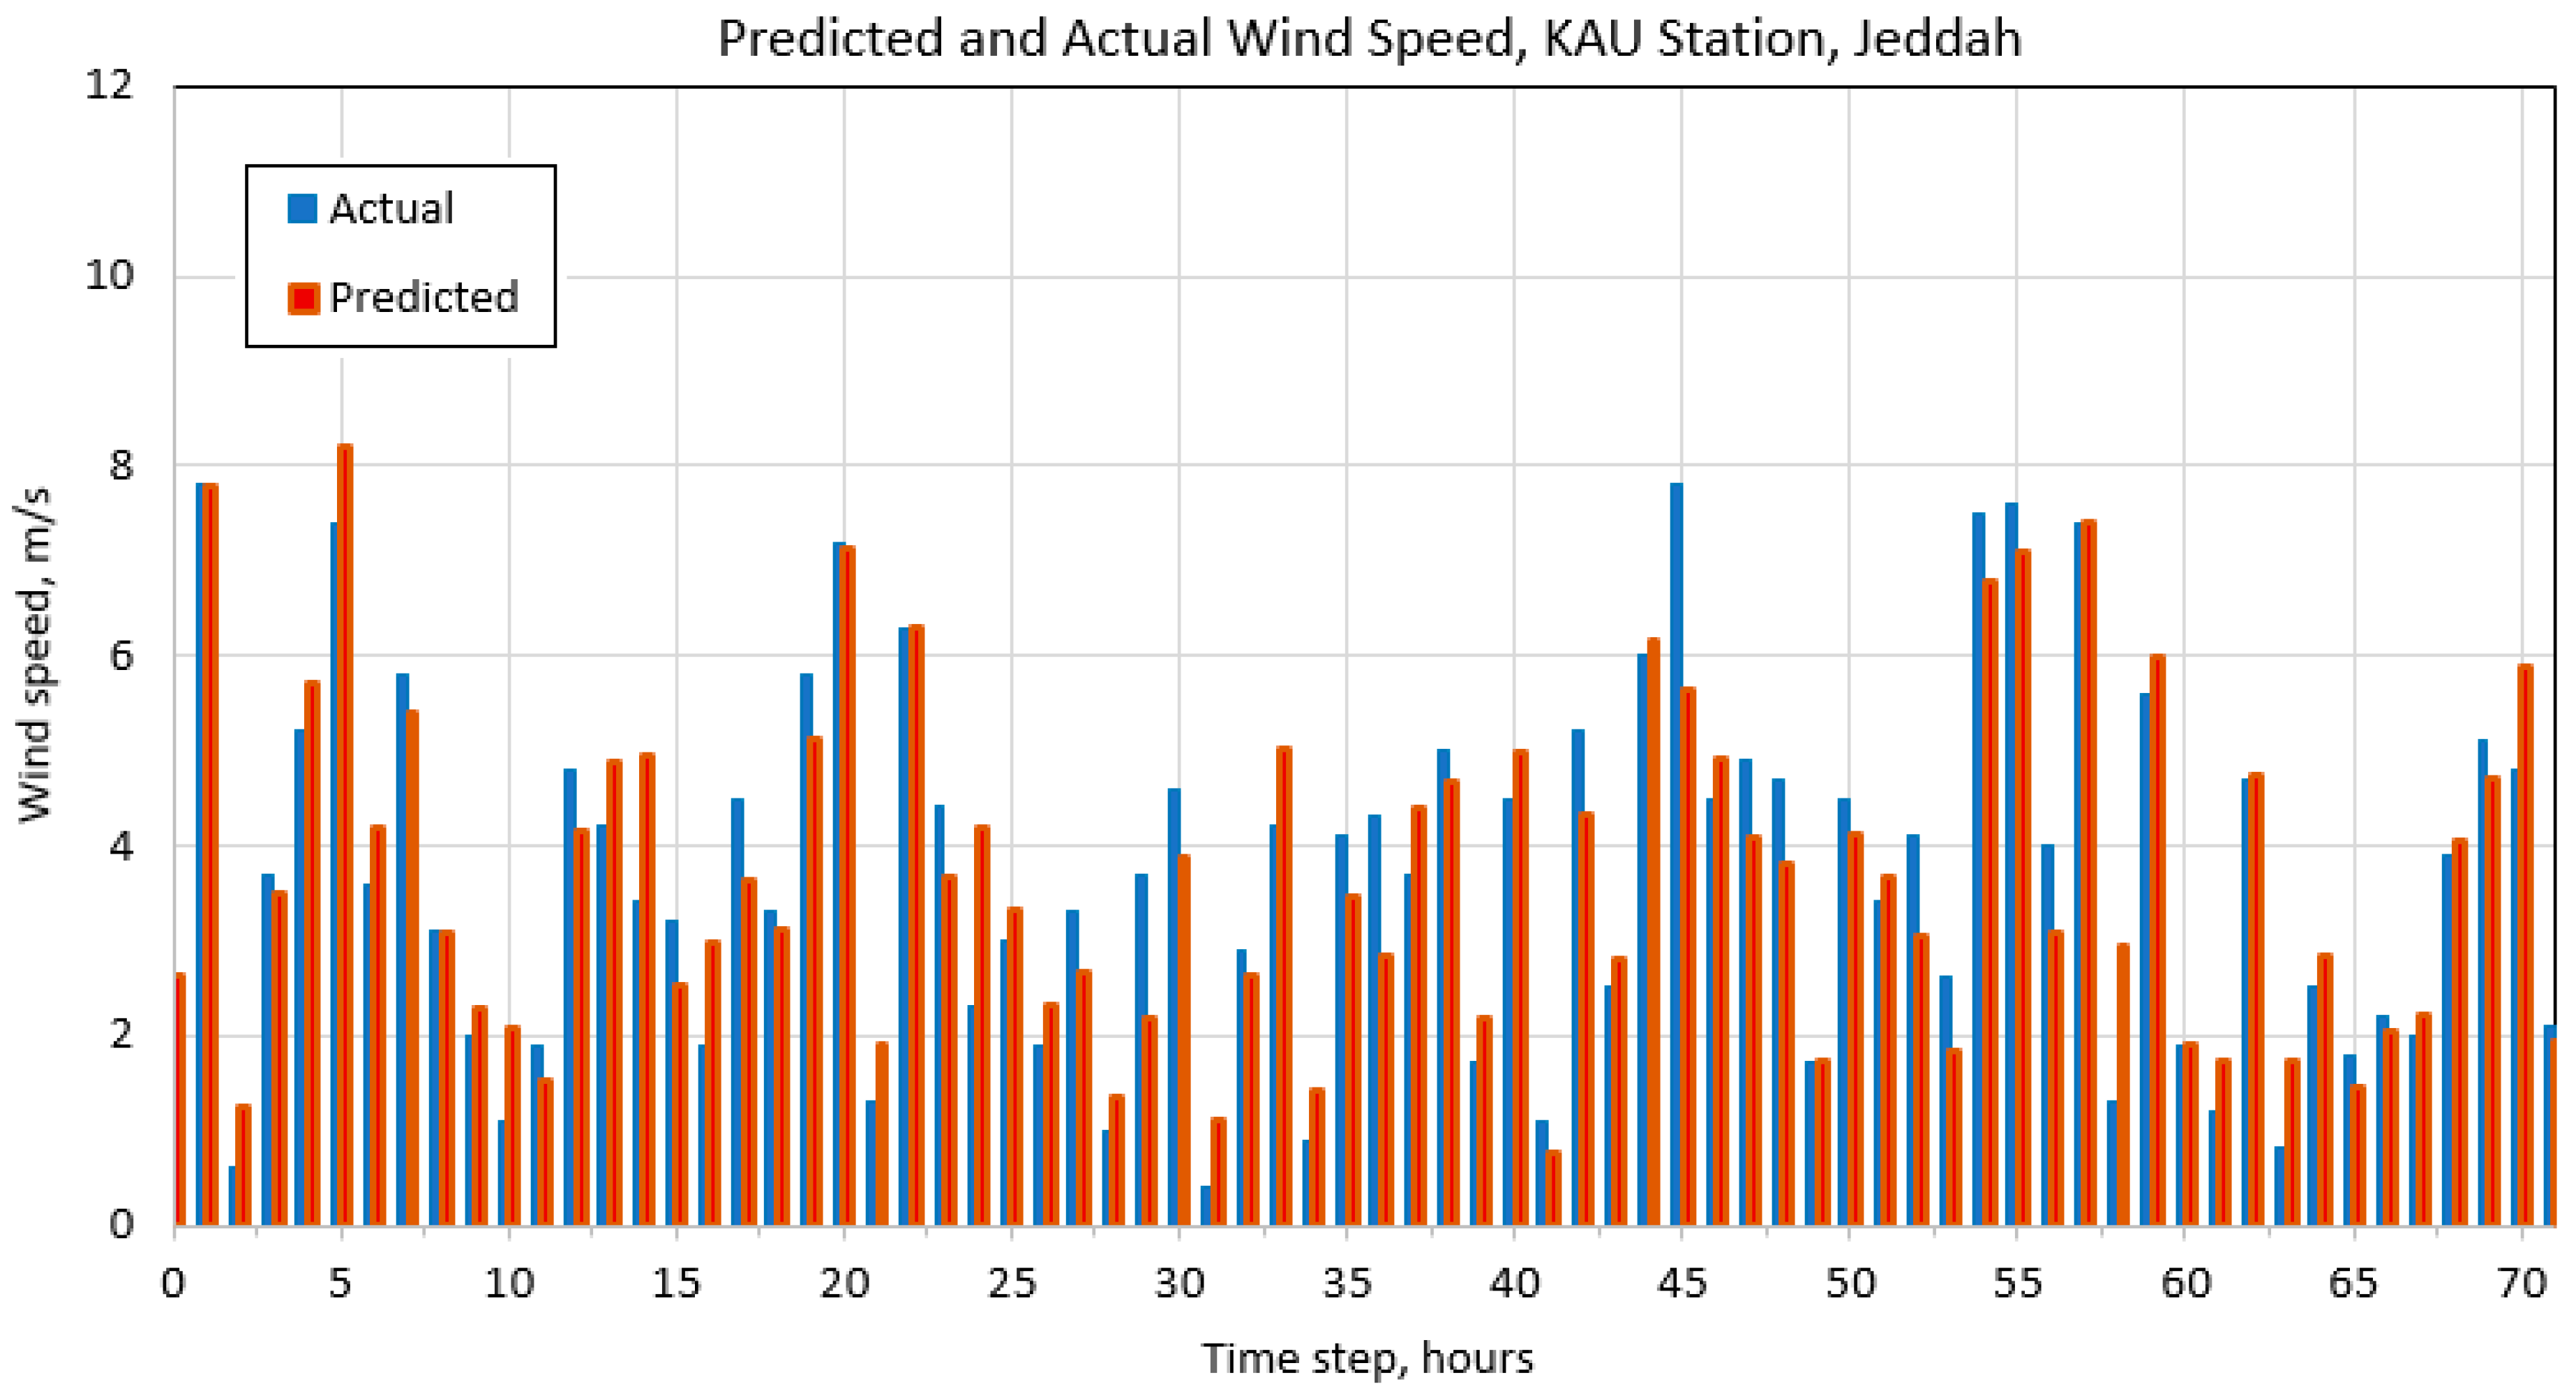
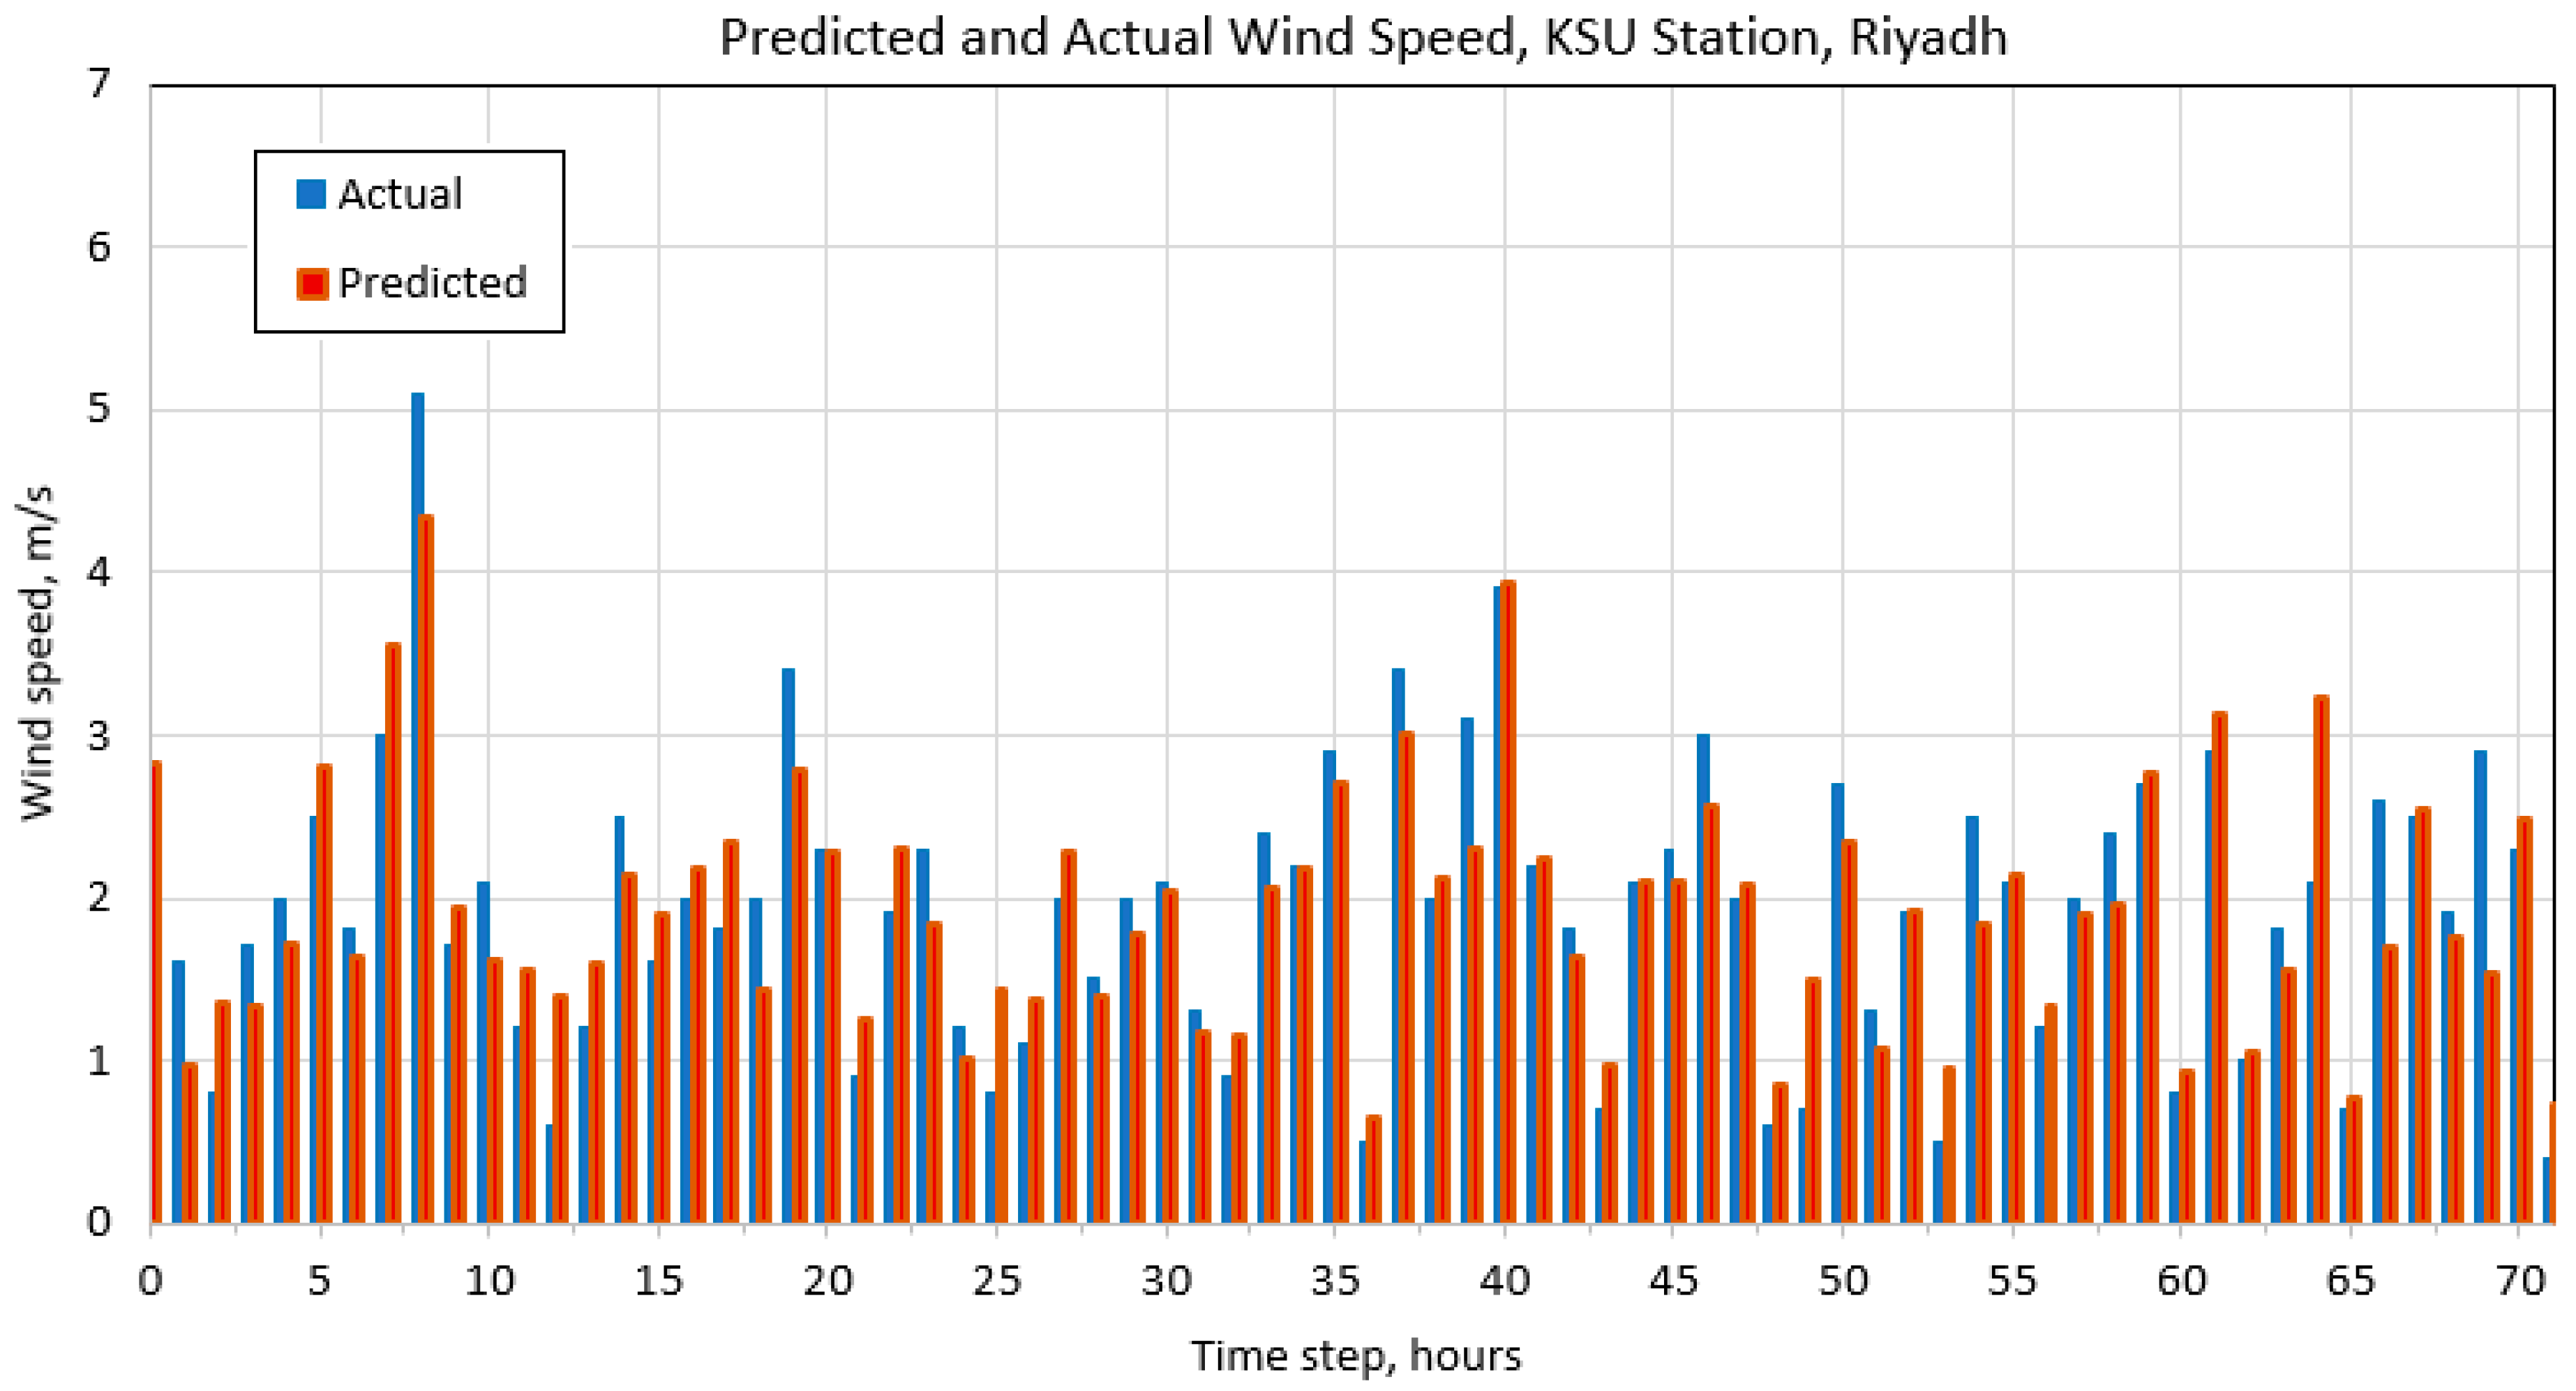
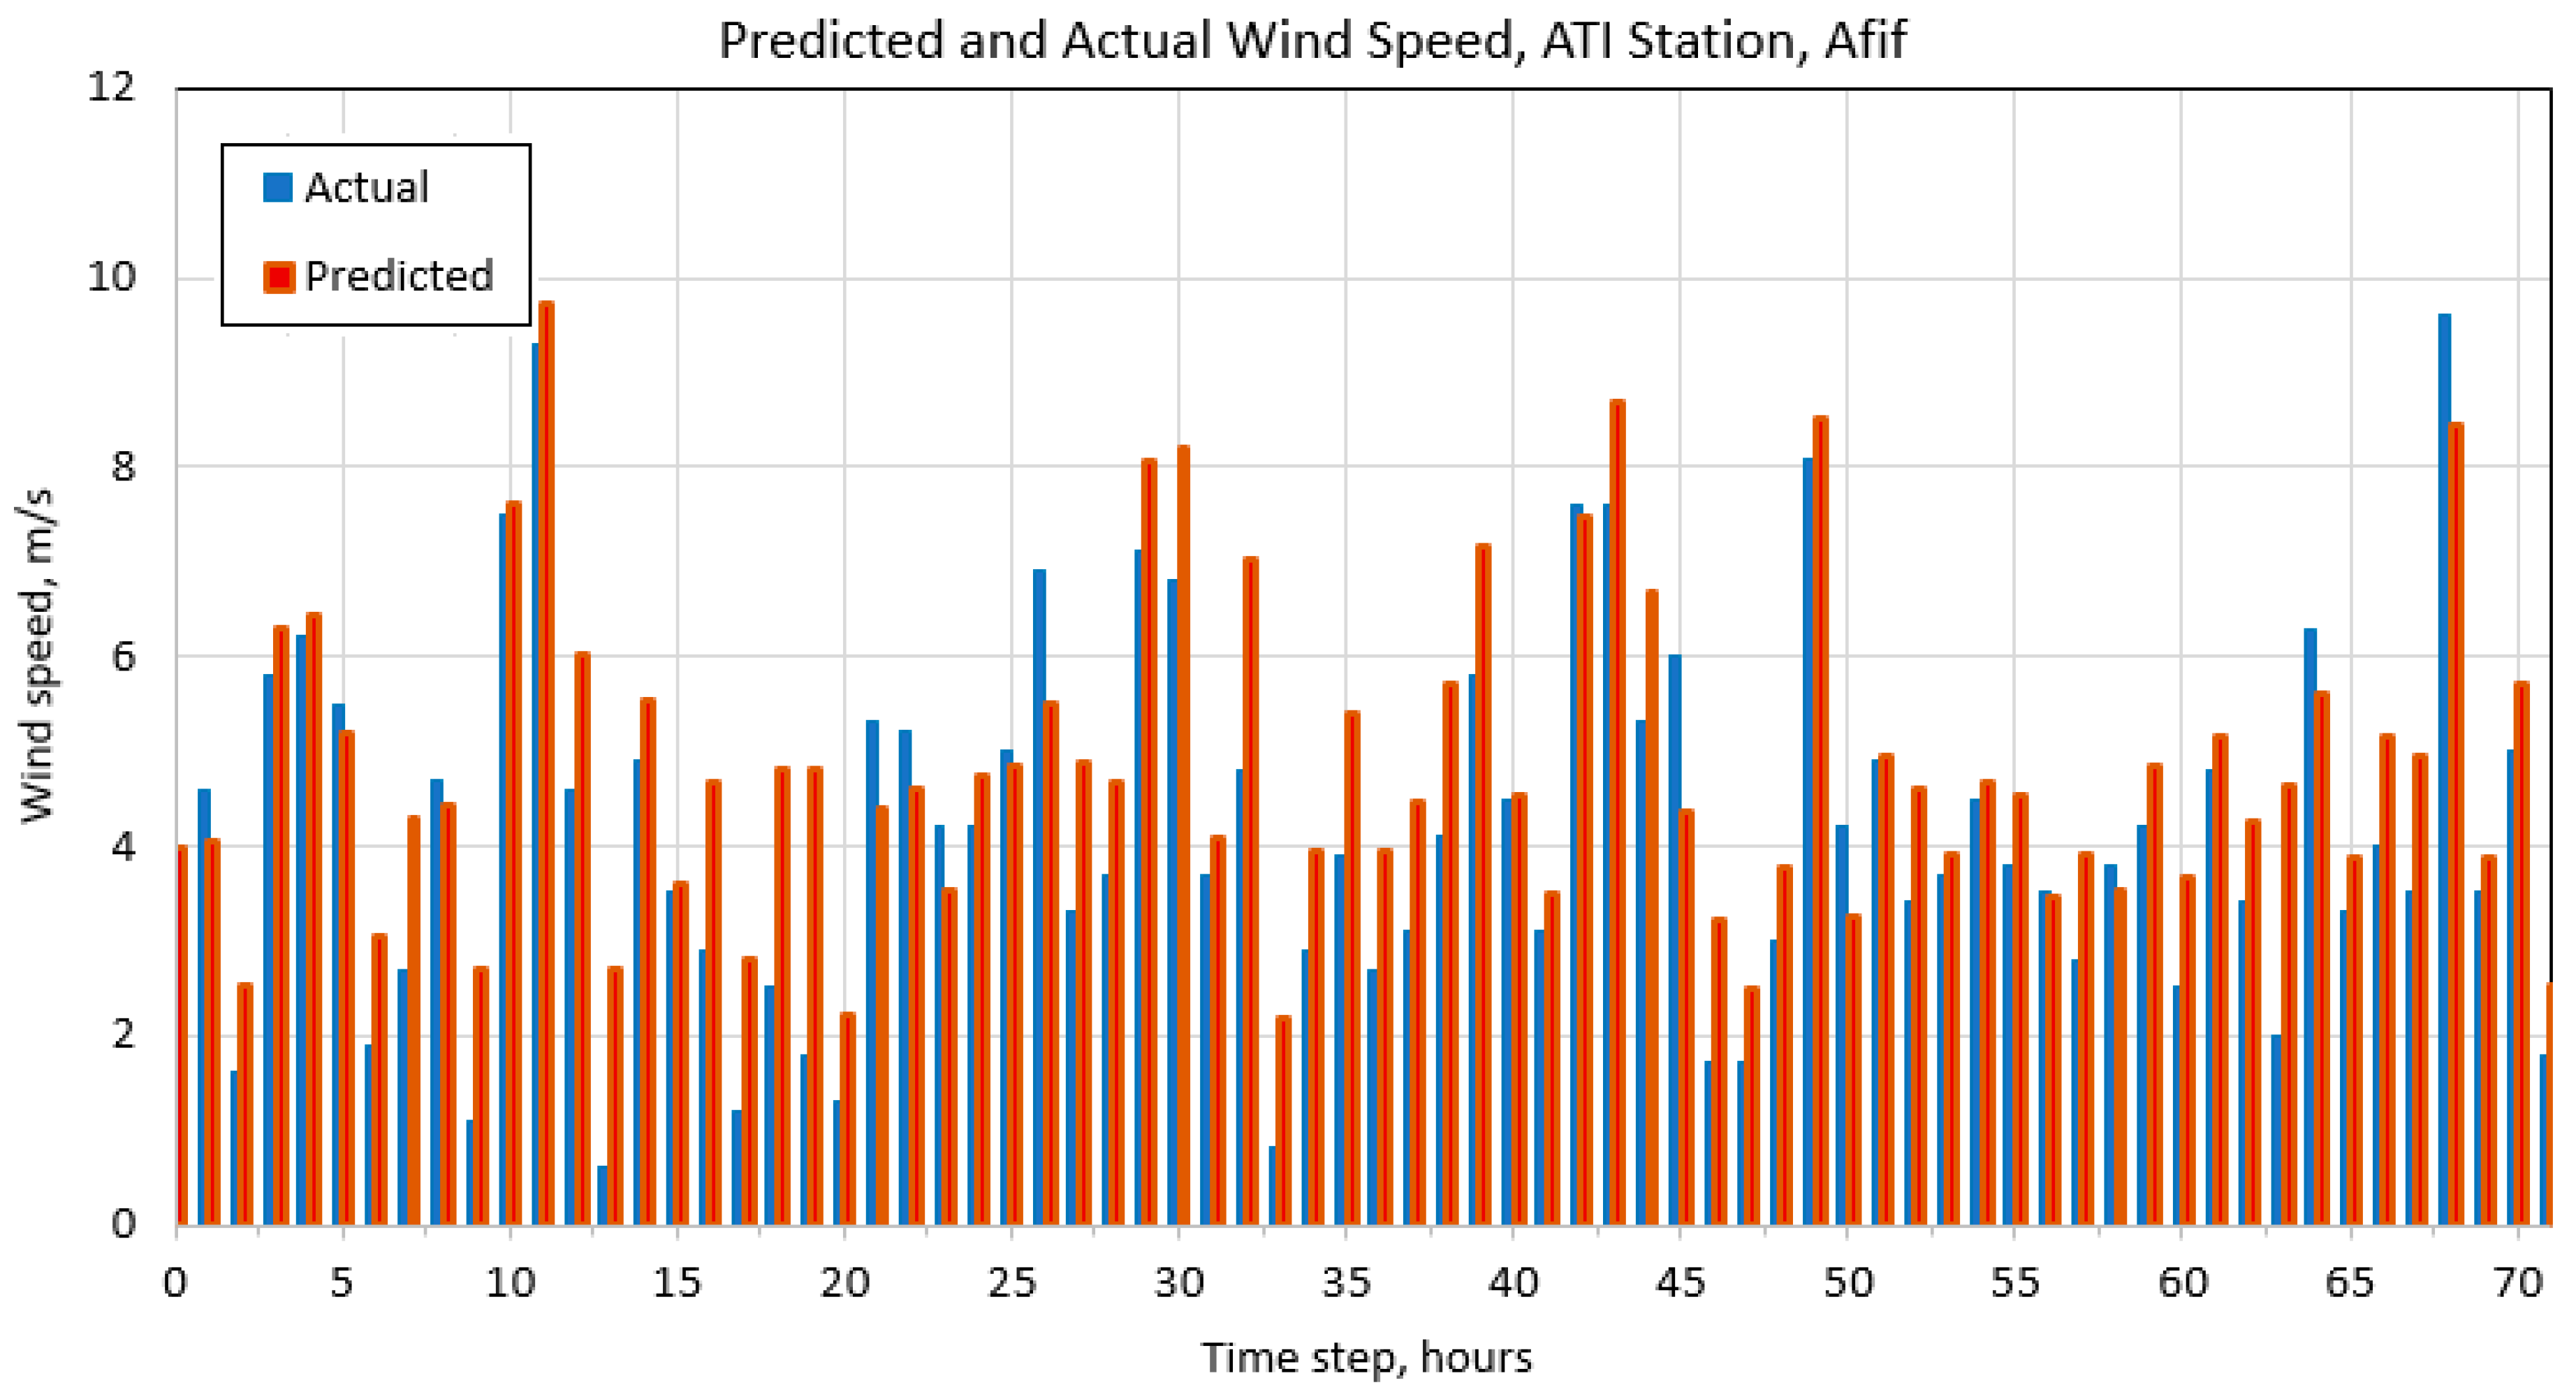
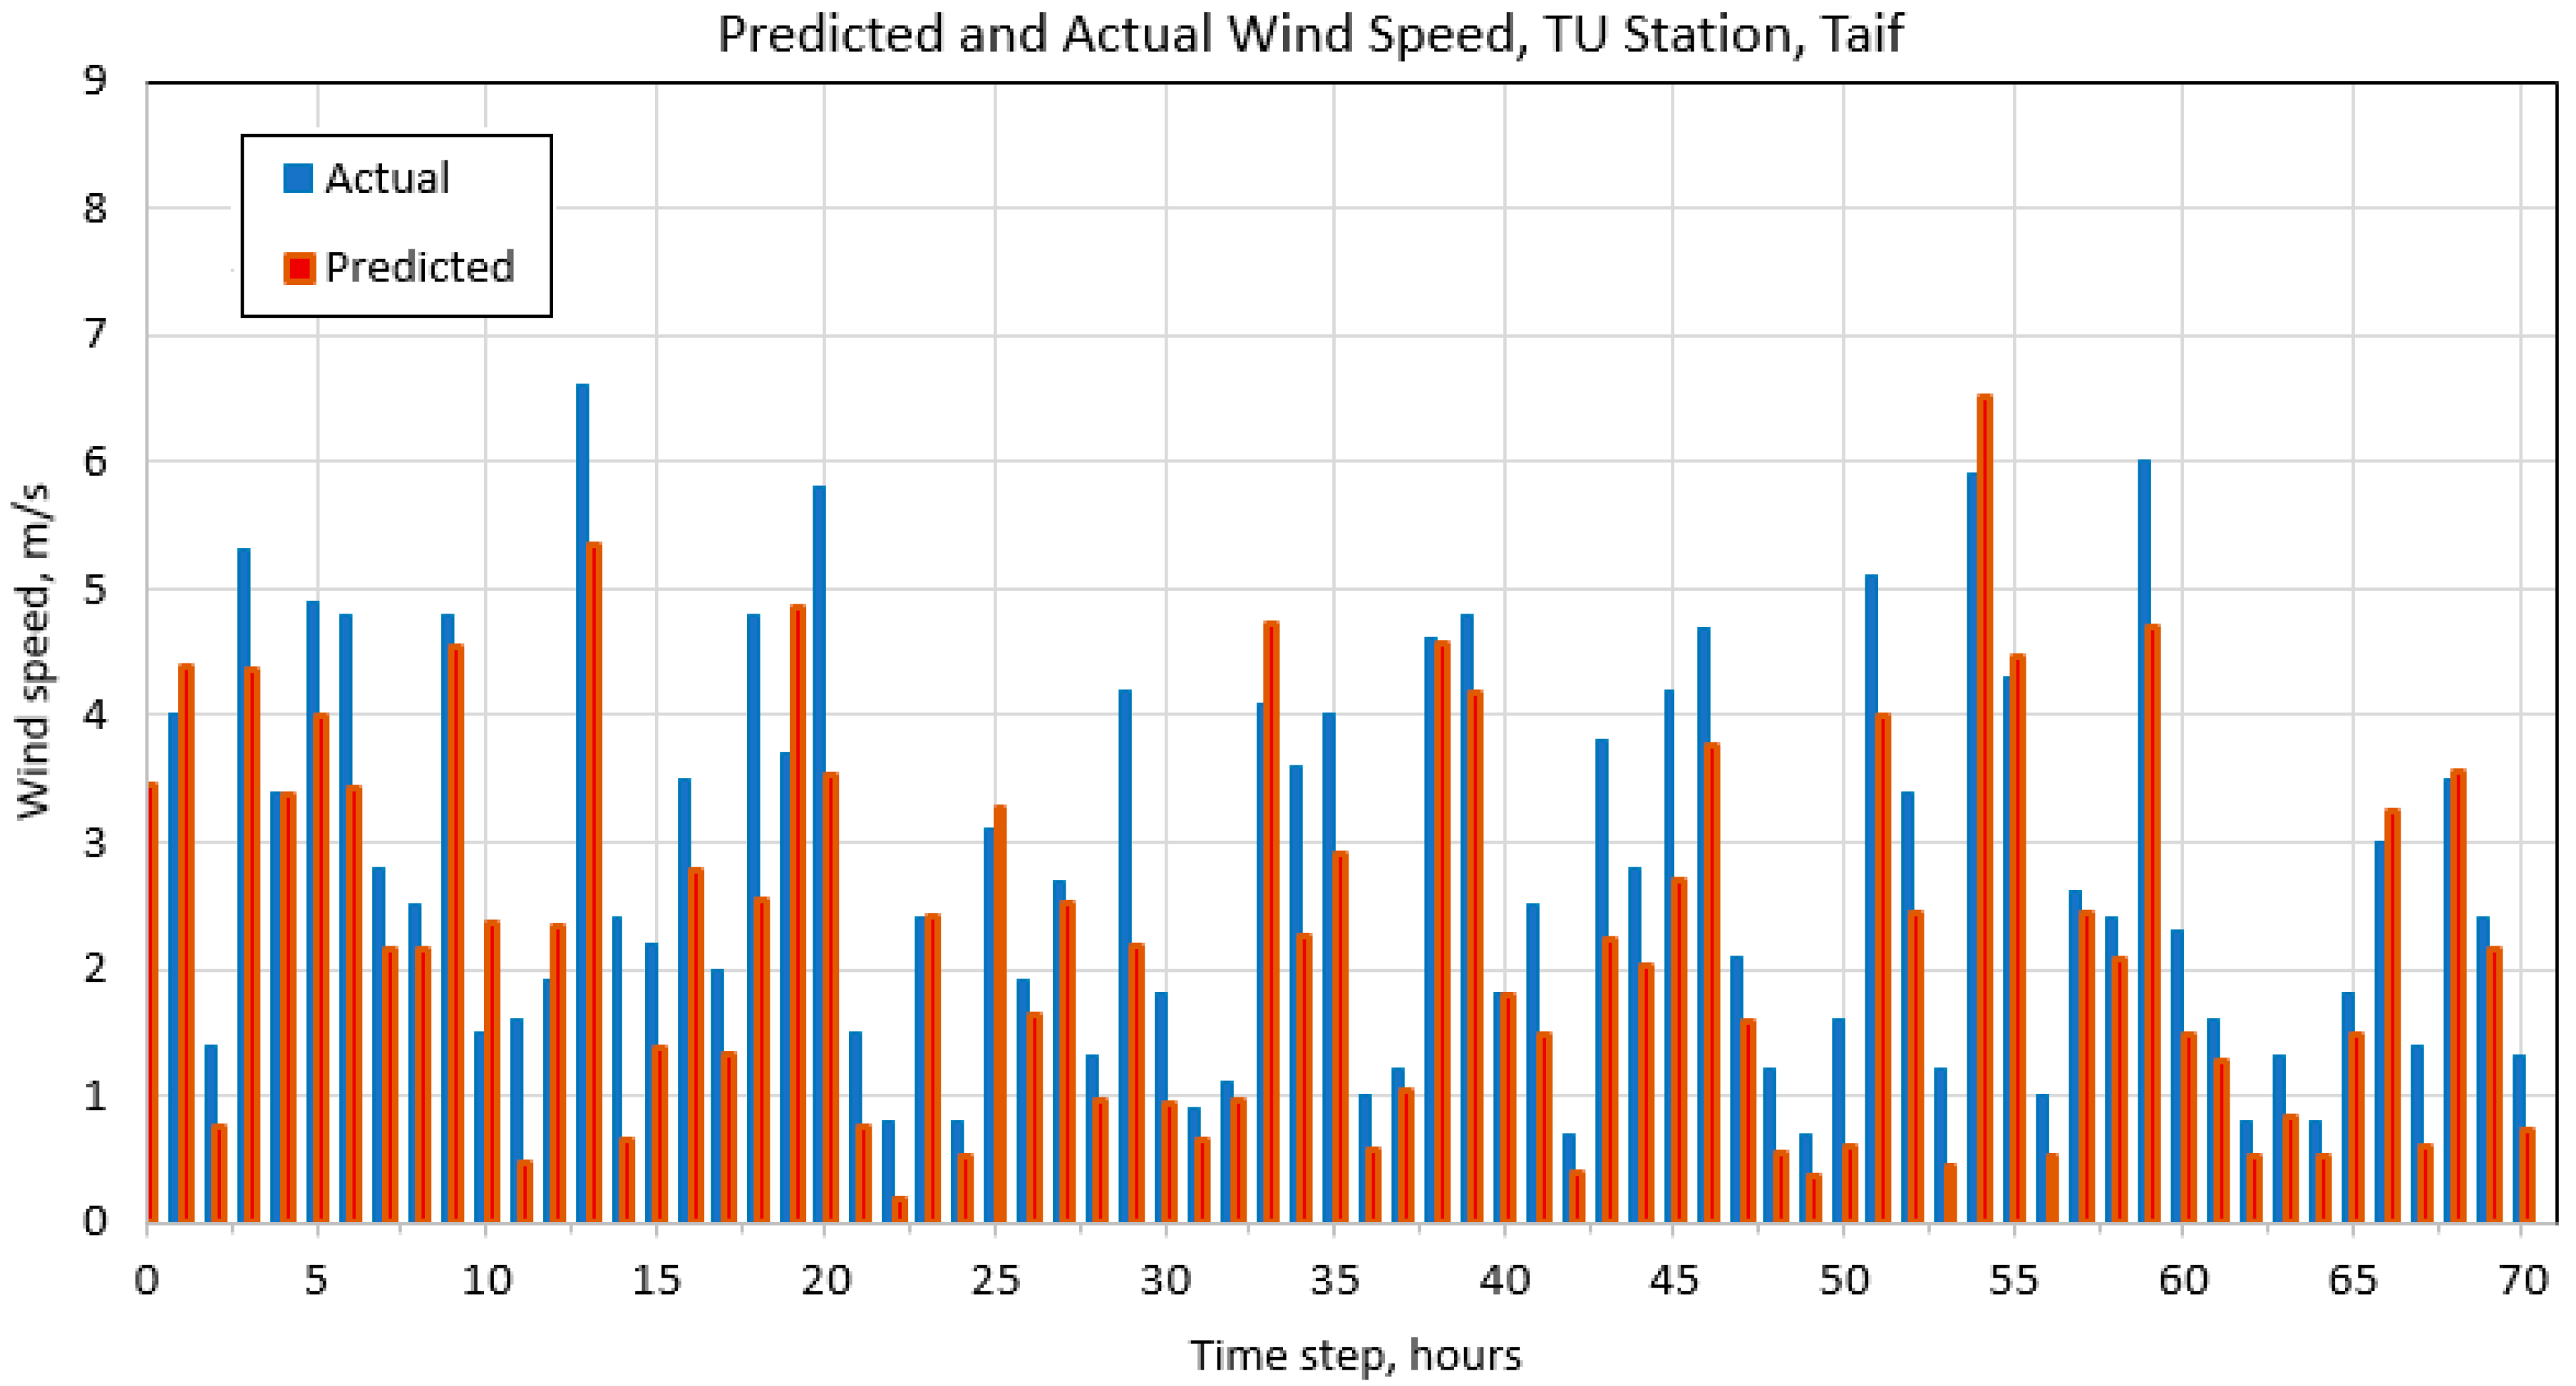
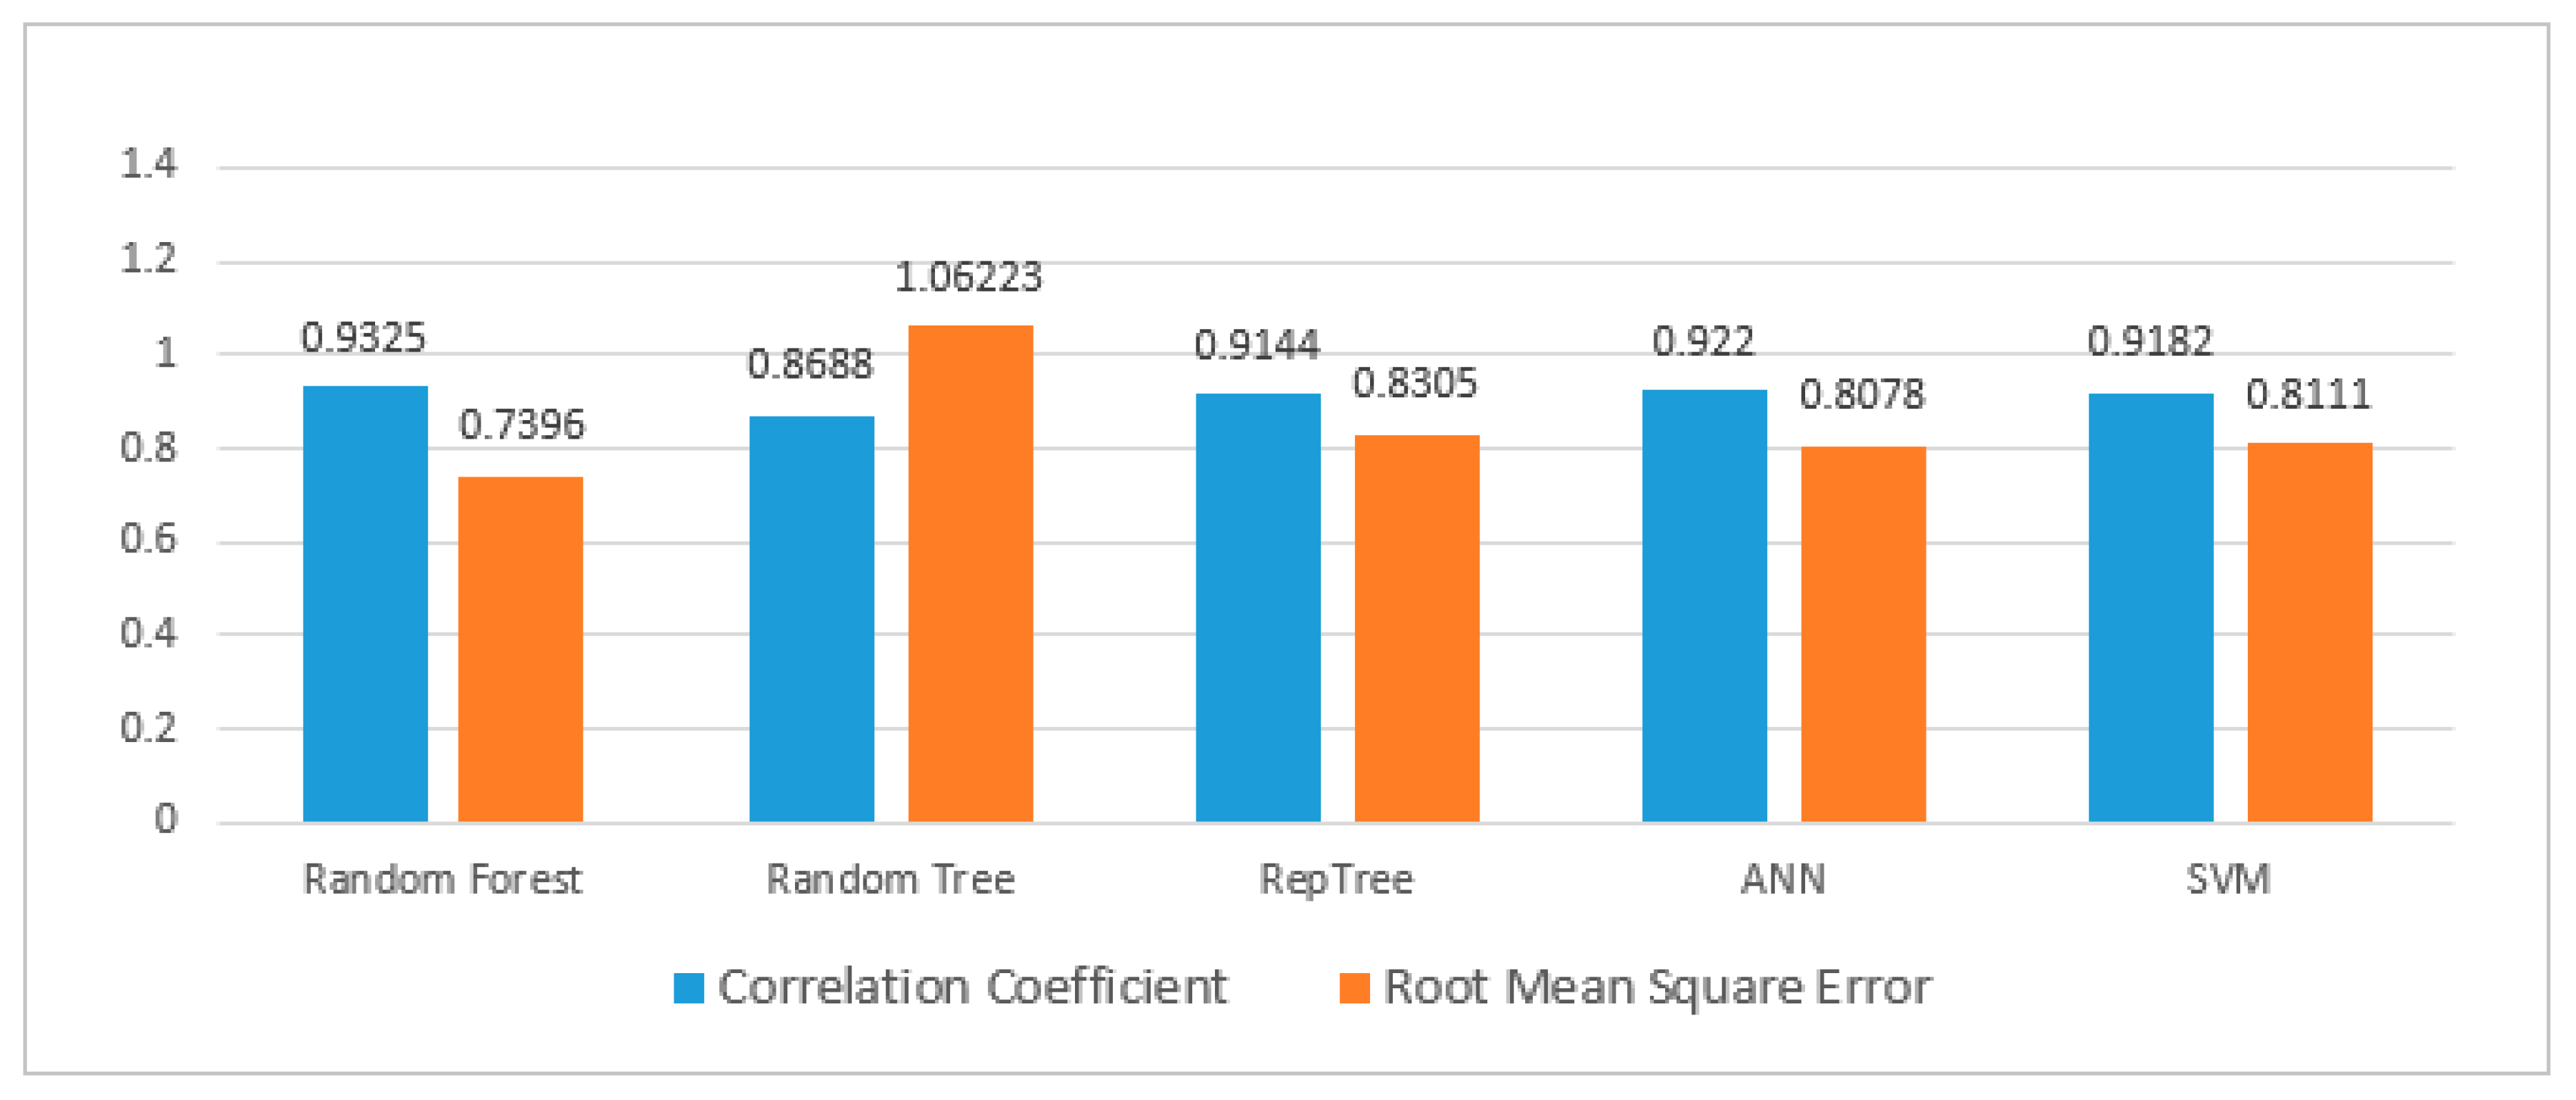
5. Results and Discussion
6. Conclusions
Author Contributions
Funding
Conflicts of Interest
References
- REN21, Global Status Report, Renewables 2018, Renewable Energy Policiy Network for the 21st Century. Available online: http://www.ren21.net/wp-content/uploads/2018/06/17-8652_GSR2018_FullReport_web_final_.pdf (accessed on 11 October 2019).
- GWEC, Global Wind Report 2017-files.gwec.net. (n.d.). Available online: http://files.gwec.net/files/GWR2017.pdf (accessed on 11 October 2019).
- GWEC, Global Wind Report 2018. Available online: https://gwec.net/global-wind-report-2018/ (accessed on 11 October 2019).
- Tardieu, P. Wind Energy in Europe: Scenarios for 2030; Wind Europe: Brussels, Belgium, 2017; Available online: https://windeurope.org/about-wind/reports/wind-energy-in-europe-scenarios-for-2030/ (accessed on 15 September 2019).
- Lashin, A.; Al Arifi, N.; Chandrasekharam, D.; Al Bassam, A.; Rehman, S.; Pipan, M. Geothermal energy resources of Saudi Arabia: Country update. In Proceedings of the World Geothermal Congress, Melbourne, Australia, 19–24 April 2015; p. 15. [Google Scholar]
- IEA, International Energy Agency (IEA). Saudi Arabia: Balances. Retrieved December 2018. Available online: http://www.iea.org/statistics/statisticssearch/report/?product=Indicators&country=SAUDIARABI (accessed on 18 September 2019).
- KAPSARC Data Portal. 2017. Available online: https://datasource.kapsarc.org/explore/dataset/electricity-consumption-per-capita/table/?flg=ar&sort=year (accessed on 18 September 2019).
- Alshahrani, J.; Boait, P. Reducing High Energy Demand Associated with Air-Conditioning Needs in Saudi Arabia. Energies 2018, 12, 87. [Google Scholar] [CrossRef]
- Krane, J. Energy Policy-Making in a Cross-National Comparison: Energy Resources, Policy Processes and Law; Geoffron, P., Greening, L.A., Heffron, R., Eds.; Springer: New York, NY, USA, 2019. [Google Scholar]
- KSA, Kingdom of Saudi Arabia. National Transformation Program. 2017. Available online: http://vision2030.gov.sa/sites/default/files/NTP_En.pdf (accessed on 10 September 2019).
- KSA, Kingdom of Saudi Arabia. Vision 2030. 2017. Available online: http://vision2030.gov.sa/enKSA-NTP (accessed on 10 September, 2019).
- MEIM, Ministry of Energy, Industry and Mineral Resources (MEIM). Embarking on Round Two of Saudi Arabia’s National Renewable Energy Program. Available online: https://www.powersaudiarabia.com.sa/web/attach/news/Press-Release-080719-REPDO-Round2RFQ-EN.pdf (accessed on 10 October 2019).
- K.A.CARE. Renewable Resource Atlas, King Abdullah City for Atomic and Renewable Energy; K.A.CARE: Riyadh, Saudi Arabia, 2017. Available online: https://rratlas.kacare.gov.sa (accessed on 18 September 2019).
- United Nations Environment Programme. The Emissions Gap. Available online: https://www.un-ilibrary.org/environment-and-climate-change/emissions-gap-report-2018_6c56e68a-en (accessed on 10 January 2019).
- Bensenouci, A. LMI-Based State-Feedback Control Design for a Wind Generating Power Plant. J. Electr. Eng. 2009, 9, 23–30. [Google Scholar]
- Brahimi, M.T.; Paraschivoiu, I. Darrieus Rotor Aerodynamics in Turbulent Wind. J. Sol. Energy Eng. 1995, 117, 128–136. [Google Scholar] [CrossRef]
- Mosavi, A.; Salimi, M.; Ardabili, S.F.; Rabczuk, T.; Shamshirband, S.; Varkonyi-Koczy, A. State of the Art of Machine Learning Models in Energy Systems, a Systematic Review. Energies 2019, 12, 1301. [Google Scholar] [CrossRef]
- Ramaswamy, S. Forecasting of Power in Wind Energy Based on Back Propagation Algorithm in Neural Networks. In Proceedings of the 2019 Amity International Conference on Artificial Intelligence (AICAI), Dubai, UAE, 4–6 February 2019. [Google Scholar] [CrossRef]
- Alencar, D.B.D.; Affonso, C.D.M.; Oliveira, R.L.D.; Rodríguez, J.M.; Leite, J.; Filho, J.R. Different Models for Forecasting Wind Power Generation: Case Study. Energies 2017, 10, 1976. [Google Scholar] [CrossRef]
- Kariniotakis, G. Renewable Energy Forecasting: From Models to Applications; Woodhead Publishing: Cambridge, UK, 2017. [Google Scholar]
- Cheng, Y. Forecast on Short-Term Wind Speed and Wind Farm Power Generation. In Proceedings of the 2015 4th National Conference on Electrical, Electronics and Computer Engineering, Xi’an, China, 12–13 December 2015. [Google Scholar] [CrossRef]
- Singh, S.N.; Mohapatra, A. Repeated Wavelet Transform Based ARIMA Model for Very Short-Term Wind Speed Forecasting. Renew. Energy 2019, 136, 758–768. [Google Scholar]
- Colak, I.; Sagiroglu, S.; Yesilbudak, M.; Kabalci, E.; Bulbul, H.I. Multi-Time Series and-Time Scale Modeling for Wind Speed and Wind Power Forecasting Part I: Statistical Methods, Very Short-Term and Short-Term Applications. In Proceedings of the 2015 International Conference on Renewable Energy Research and Applications (ICRERA), Palermo, Italy, 22–25 November 2015; pp. 209–214. [Google Scholar]
- Houimli, R.; Zmami, M.; Ben-Salha, O. Short-Term Electric Load Forecasting in Tunisia Using Artificial Neural Networks. Energy Syst. 2019. [Google Scholar] [CrossRef]
- Sahay, K.B.; Shwetank, S. Short-Term Wind Speed Forecasting of Lelystad Wind Farm by Using ANN Algorithms. In Proceedings of the 2018 International Electrical Engineering Congress (IEECON), Krabi, Thailand, 7–9 March 2018. [Google Scholar] [CrossRef]
- Ambach, D.; Croonenbroeck, C. Space-Time Short- to Medium-Term Wind Speed Forecasting. Stat. Methods Appl. 2015, 25, 5–20. [Google Scholar] [CrossRef]
- Dhivya, S.; Ulagammai, M.; Devi, R.K. Performance Evaluation of Different ANN Models for Medium Term Wind Speed Forecasting. Wind Eng. 2011, 35, 433–444. [Google Scholar] [CrossRef]
- Aghbalou, N.; Charki, A.; Elazzouzi, S.R.; Reklaoui, K. Long Term Forecasting of Wind Speed for Wind Energy Application. In Proceedings of the 2018 6th International Renewable and Sustainable Energy Conference (IRSEC), Rabat, Morocco, 5–8 December 2018; pp. 1–7. [Google Scholar]
- Panapakidis, I.P.; Michailides, C.; Angelides, D.C. A Data-Driven Short-Term Forecasting Model for Offshore Wind Speed Prediction Based on Computational Intelligence. Electronics 2019, 8, 420. [Google Scholar] [CrossRef]
- Agarwal, P.; Shukla, P.; Sahay, K.B. A Review on Different Methods of Wind Power Forecasting. In Proceedings of the 2018 International Electrical Engineering Congress (IEECON), Krabi, Thailand, 7–9 March 2018; pp. 1–4. [Google Scholar]
- Manero, J.; Béjar, J.; Cortés, U. Wind Energy Forecasting with Neural Networks: A Literature Review. Comput. Sist. 2018, 22. [Google Scholar] [CrossRef]
- Marsland, S. Machine Learning: An Algorithmic Perspective; CRC Press: Boca Raton, FL, USA, 2015. [Google Scholar]
- Samet, H.; Reisi, M.; Marzbani, F. Evaluation of Neural Network-Based Methodologies for Wind Speed Forecasting. Comput. Electr. Eng. 2019, 78, 356–372. [Google Scholar] [CrossRef]
- Sun, G.; Jiang, C.; Cheng, P.; Liu, Y.; Wang, X.; Fu, Y.; He, Y. Short-term wind power forecasts by a synthetical similar time series data mining method. Renew. Energy 2018, 115, 575–584. [Google Scholar] [CrossRef]
- Heppelmann, T.; Steiner, A.; Vogt, S. Application of Numerical Weather Prediction in Wind Power Forecasting: Assessment of the Diurnal Cycle. Meteorol. Z. 2017, 26, 319–331. [Google Scholar] [CrossRef]
- Ferreira, M.; Santos, A.; Lucio, P. Short-Term Forecast of Wind Speed through Mathematical Models. 2018. Energy Rep. 2019, 5, 1172–1184. [Google Scholar] [CrossRef]
- Al-Yahyai, S.; Charabi, Y.; Gastli, A. Review of the Use of Numerical Weather Prediction (NWP) Models for Wind Energy Assessment. Renew. Sustain. Energy Rev. 2010, 14, 3192–3198. [Google Scholar] [CrossRef]
- Potter, C.; Negnevitsky, M. Very Short-Term Wind Forecasting for Tasmanian Power Generation. In Proceedings of the 2006 IEEE Power Engineering Society General Meeting, Montreal, QC, Canada, 18–22 June 2006. [Google Scholar] [CrossRef]
- Pearre, N.S.; Swan, L.G. Statistical Approach for Improved Wind Speed Forecasting for Wind Power Production. Sustain. Energy Technol. Assess. 2018, 27, 180–191. [Google Scholar] [CrossRef]
- Chang, W.-Y. A Literature Review of Wind Forecasting Methods. J. Power Energy Eng. 2014, 2, 161–168. [Google Scholar] [CrossRef]
- Ernesta, G.; Butkevičiūtė, E. Short-Term Wind Speed Forecasting Using ARIMA Model. Energetika 2016, 62. [Google Scholar] [CrossRef]
- Dumitru, C.-D.; Adrian, G. Daily Average Wind Energy Forecasting Using Artificial Neural Networks. Procedia Eng. 2017, 181, 829–836. [Google Scholar] [CrossRef]
- Gangwar, S.; Bali, V.; Kumar, A. Comparative Analysis of Wind Speed Forecasting Using LSTM and SVM. EAI. Available online: https://eudl.eu/doi/10.4108/eai.13-7-2018.159407 (accessed on 10 October 2019). [CrossRef]
- Yang, X.; Tang, F. Wind Speed Forecast Based on Support Vector Machine. In Proceedings of the 2016 5th International Conference on Civil, Architectural and Hydraulic Engineering (ICCAHE 2016), Zhuhai, China, 30–31 July 2016. [Google Scholar] [CrossRef]
- Naba, A. Fuzzy Logic Principles for Wind Speed Estimation in Wind Energy Conversion Systems. In Proceedings of the 2014 6th International Conference on Information Technology and Electrical Engineering (ICITEE), Yogyakarta, Indonesia, 7–8 October 2014. [Google Scholar] [CrossRef]
- Khosravi, A.; Koury, R.N.N.; Machado, L.; Pabon, J.J.G. Prediction of Wind Speed and Wind Direction Using Artificial Neural Network, Support Vector Regression and Adaptive Neuro-Fuzzy Inference System. Sustain. Energy Technol. Assess. 2018, 25, 146–160. [Google Scholar] [CrossRef]
- Ko, Y.H. Wind Speed Prediction by Adaptive Neuro-Fuzzy Inference System and FCM Clustering. Int. J. Hybrid Inf. Technol. 2016, 9, 95–108. [Google Scholar] [CrossRef]
- Burlando, M.; Meissner, C. Evaluation of Two ANN Approaches for the Wind Power Forecast in a Mountainous Site. Int. J. Renew. Energy Res. 2017, 7, 1629–1638. [Google Scholar]
- Bermejo, J.F.; Fernández, J.F.G.; Polo, F.O.; Márquez, A.C. A Review of the Use of Artificial Neural Network Models for Energy and Reliability Prediction. A Study of the Solar PV, Hydraulic and Wind Energy Sources. Appl. Sci. 2019, 9, 1844. [Google Scholar] [CrossRef]
- Ernst, B.; Oakleaf, B.; Ahlstrom, M.L.; Lange, M.; M€ohrlen, C.; Lange, B.; Focken, U.; Rohrig, K. Predicting the wind. IEEE Power Energy Mag. 2007, 5, 78–89. [Google Scholar] [CrossRef]
- Marugán, A.P.; Márquez, F.P.G.; Perez, J.M.P.; Ruiz-Hernández, D. A survey of artificial neural networks in wind energy systems. Appl. Energy 2018, 228, 1822–1836. [Google Scholar] [CrossRef]
- Costa, A.; Crespo, A.; Navarro, J.; Lizcano, G.; Madsen, H.; Feitosa, E. A review on the young history of the wind power short-term prediction. Renew. Sustain. Energy Rev. 2007, 12, 1725–1744. [Google Scholar] [CrossRef]
- Giebel, G.; Kariniotakis, G. Best Practice in the Use of Short-Term Forecasting. A Users Guide. Project Report for the POW’WOW Project. 2008, p. 6. Available online: https://www.researchgate.net/publication/47398578_Best_Practice_in_short-term_Forecasting_A_users_Guide (accessed on 29 September 2019).
- Mujeeb, S.; Alghamdi, T.A.; Ullah, S.; Fatima, A.; Javaid, N.; Saba, T. Exploiting Deep Learning for Wind Power Forecasting Based on Big Data Analytics. Appl. Sci. 2019, 9, 4417. [Google Scholar] [CrossRef]
- Manwell, J.F.; McGowan, J.G.; Rogers, A.L. Wind Energy Explained: Theory, Design and Application; John Wiley & Sons, Ltd.: Chichester, UK, 2011. [Google Scholar]
- Mohandes, M.A.; Rehman, S. Short term wind speed estimation in Saudi Arabia. J. Wind Eng. Ind. Aerodyn. 2014, 128, 37–53. [Google Scholar] [CrossRef]
- Al-Abbadi, N.M. Wind energy resource assessment for five locations in Saudi Arabia. Renew. Energy 2005, 30, 1489–1499. [Google Scholar] [CrossRef]
- Azorin-Molina, C.; Rehman, S.; Guijarro, J.A.; Mcvicar, T.R.; Minola, L.; Chen, D.; Vicente-Serrano, S.M. Recent trends in wind speed across Saudi Arabia, 1978–2013: A break in the stilling. Int. J. Climatol. 2018, 38. [Google Scholar] [CrossRef]
- Amin, M.I.; El-Samanoudy, M. Feasibility study of wind energy utilization in Saudi Arabia. J. Wind Eng. Ind. Aerodyn. 1985, 18, 153–163. [Google Scholar] [CrossRef]
- Petersen, E.L.; Mortensen, N.G.; Landberg, L.; Højstrup, J.; Frank, H.P. Wind power meteorology. Part I: Climate and turbulence. Wind Energy 1998, 1, 25–45. [Google Scholar] [CrossRef]
- Zoumakis, N.M.T. The dependence of the power-law exponent on surface roughness and stability in a neutrally and stably stratified surface boundary layer. Atmosfera 1993, 6, 79–83. [Google Scholar]
- Giudici, P.; Figini, S. Applied Data Mining: Statistical Methods for Business and Industry, 2nd ed.; John Wiley & Sons: Hoboken, NJ, USA, 2009. [Google Scholar]
- Simon, H. Neural Networks: A Comprehensive Foundation; Prentice-Hall of India: New Delhi, India, 2008. [Google Scholar]
- Witten, I.H.; Frank, E.; Hall, M.A.; Pal, C.J. Data Mining: Practical Machine Learning Tools and Techniques; Morgan Kaufmann: Amsterdam, The Netherlands, 2017. [Google Scholar]
- Türkan, Y.S.; Aydoğmuş, H.Y.; Erdal, H. The prediction of the wind speed at different heights by machine learning methods. Int. J. Optim. Control: Theor. Appl. 2016, 6, 179. [Google Scholar] [CrossRef]
- Sheela, K.G.; Deepa, S.N. Review on Methods to Fix Number of Hidden Neurons in Neural Networks. Math. Probl. Eng. 2013, 2013, 1–11. [Google Scholar] [CrossRef]
- Akinci, T.Ç.; Noğay, H.S. Application of Decision Tree Methods for Wind Speed Estimation. Eur. J. Technol. 2019, 9, 74–83. [Google Scholar] [CrossRef]


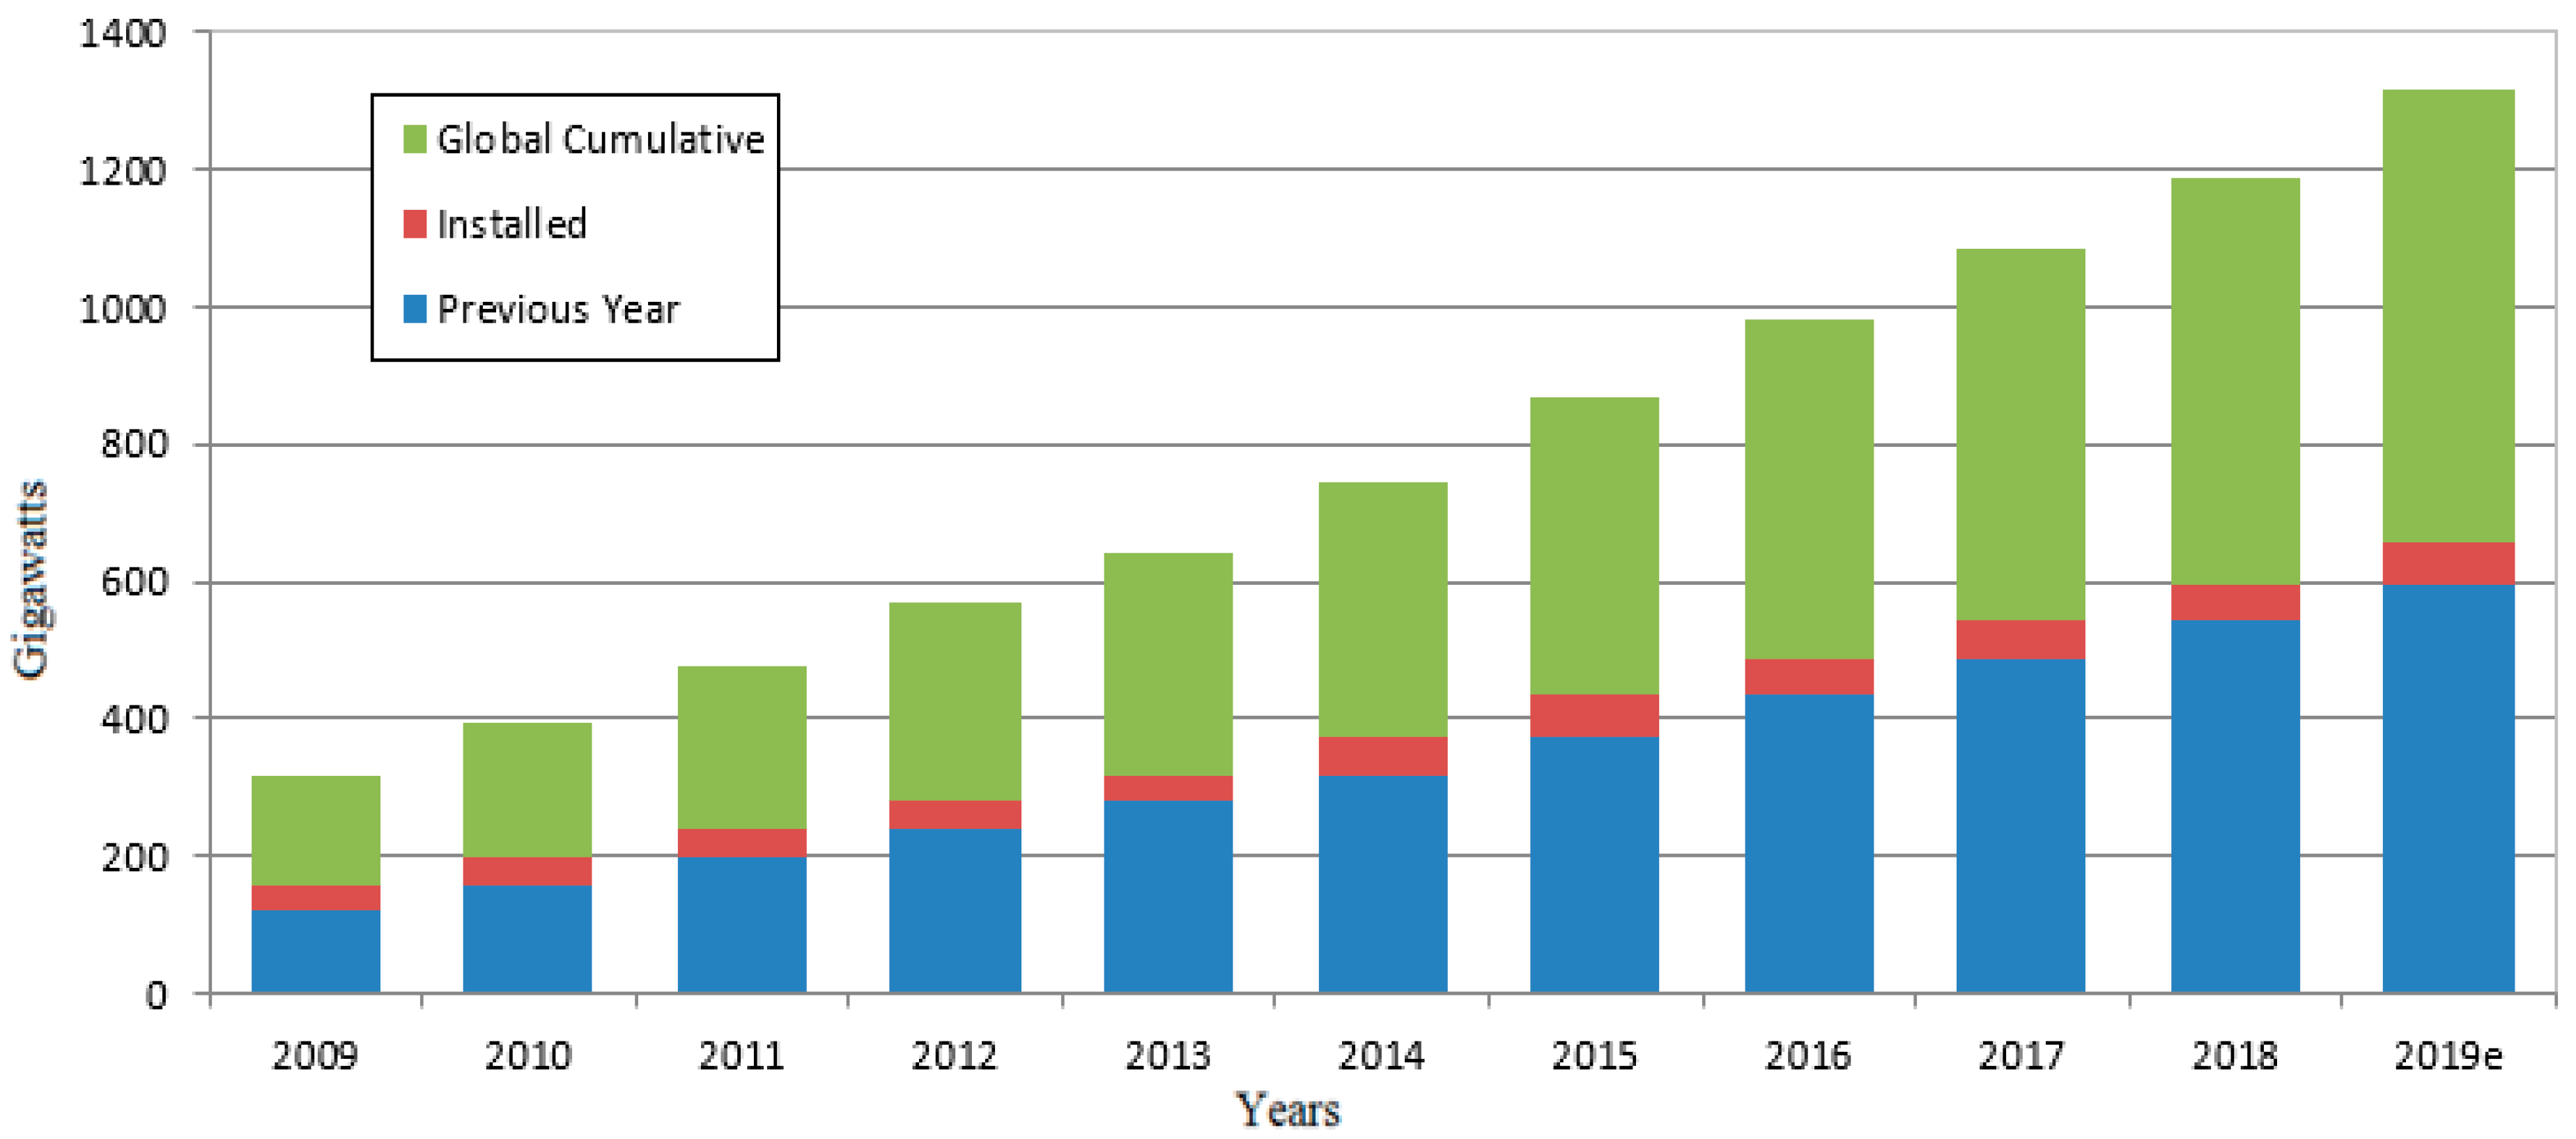
| Year | Previous Year’s Capacity (GW) | Annual Addition (GW) | Global Cumulative (GW) |
|---|---|---|---|
| 2009 | 120.696 | 38.475 | 159.171 |
| 2010 | 159.052 | 39.062 | 198.114 |
| 2011 | 198.114 | 40.635 | 238.749 |
| 2012 | 238.749 | 45.030 | 283.779 |
| 2013 | 283.779 | 36.023 | 319.802 |
| 2014 | 319.802 | 51.675 | 371.477 |
| 2015 | 371.477 | 63.533 | 435.010 |
| 2016 | 435.01 | 54.642 | 489.652 |
| 2017 | 489.652 | 52.492 | 542.144 |
| 2018 | 542.144 | 51.316 | 593.460 |
| 2019e | 593.46 | 65.400 | 658.660 |
| Time Zone | Range | Application | References |
|---|---|---|---|
| Very short-term | Few seconds to 30 min | Forecasting wind speed and power for electricity market clearing, regulatory actions, and operational aspects | [22,23] |
| Short-term | 30 min to 6 h | Dispatching the generated power of the WECS to meet customer need within a short time | [24,25] |
| Medium-term | 6 h to 1 day | Operational security, safety, and electricity market | [26,27] |
| Long-term | 1 day to 1 week or above | Unit commitment decisions, maintenance scheduling, and operational management | [28,29] |
| Layers | R | MAE | RMSE | RAE |
|---|---|---|---|---|
| 2 | 0.9143 | 0.9564 | 1.1574 | 57.72% |
| 5 | 0.9218 | 0.6467 | 0.8373 | 39.03% |
| 10 | 0.9216 | 0.6056 | 0.8020 | 36.55% |
| 20 | 0.9224 | 0.6265 | 0.8209 | 37.81% |
| 30 | 0.9222 | 0.6109 | 0.8078 | 36.87% |
| 40 | 0.9213 | 0.6244 | 0.8232 | 37.69% |
| 50 | 0.9227 | 0.6944 | 0.8964 | 41.91% |
| Station | Longitude | Latitude | R | RMSE |
|---|---|---|---|---|
| Jeddah (KAU) | 21.49604 | 39.24492 | 0.9222 | 08078 |
| Riyadh (KSU) | 24.72359 | 46.61639 | 0.8655 | 0.5388 |
| Taif University (TU) | 21.43278 | 40.49173 | 0.9039 | 0.8580 |
| Afif Technical Inst. (ATI) | 23.92118 | 42.94815 | 0.8957 | 1.1195 |
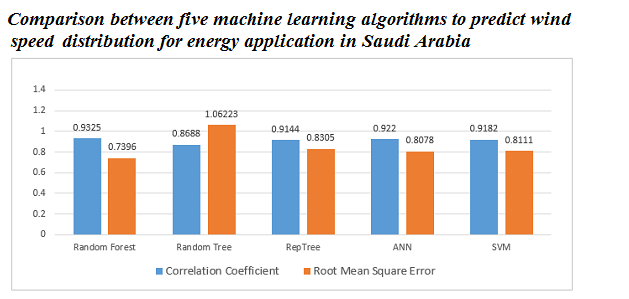
| Machine Learning Algorithm | Correlation Coefficient | Mean Absolute Error | Root Mean Square Error |
|---|---|---|---|
| Random Forest | 0.9325 | 0.5543 | 0.7396 |
| Random Tree | 0.8688 | 0.8054 | 1.06223 |
| RepTree | 0.9144 | 0.6274 | 0.8305 |
| ANN | 0.9222 | 0.6109 | 0.8078 |
| SVM | 0.9182 | 0.6111 | 0.8111 |
© 2019 by the author. Licensee MDPI, Basel, Switzerland. This article is an open access article distributed under the terms and conditions of the Creative Commons Attribution (CC BY) license (http://creativecommons.org/licenses/by/4.0/).
Share and Cite
Brahimi, T. Using Artificial Intelligence to Predict Wind Speed for Energy Application in Saudi Arabia. Energies 2019, 12, 4669. https://doi.org/10.3390/en12244669
Brahimi T. Using Artificial Intelligence to Predict Wind Speed for Energy Application in Saudi Arabia. Energies. 2019; 12(24):4669. https://doi.org/10.3390/en12244669
Chicago/Turabian StyleBrahimi, Tayeb. 2019. "Using Artificial Intelligence to Predict Wind Speed for Energy Application in Saudi Arabia" Energies 12, no. 24: 4669. https://doi.org/10.3390/en12244669
APA StyleBrahimi, T. (2019). Using Artificial Intelligence to Predict Wind Speed for Energy Application in Saudi Arabia. Energies, 12(24), 4669. https://doi.org/10.3390/en12244669