New Protection Scheme Based on Coordination with Tie Switch in an Open-Loop Microgrid


Abstract
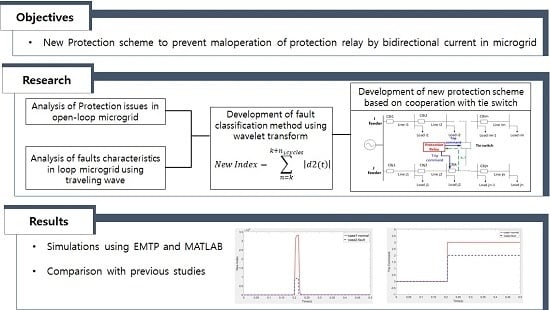
1. Introduction
- (1)
- Considerations for the protection in the loop MG are analyzed.
- (2)
- The fault characteristics according to the tie switch operation in the loop MG are analyzed using traveling wave.
- (3)
- This paper proposes a new index that can distinguish the fault at another feeder, the normal load current supply to another feeder, and the fault at the original feeder using WT.
- (4)
- We propose a new protection scheme based on the coordination with a tie switch using a new index.
- (5)
- We model the MG using the electromagnetic transients program (EMTP) and implement the proposed protection method using MATLAB. From the simulation results, we prove the superiority of the proposed scheme by comparing it with previous studies.
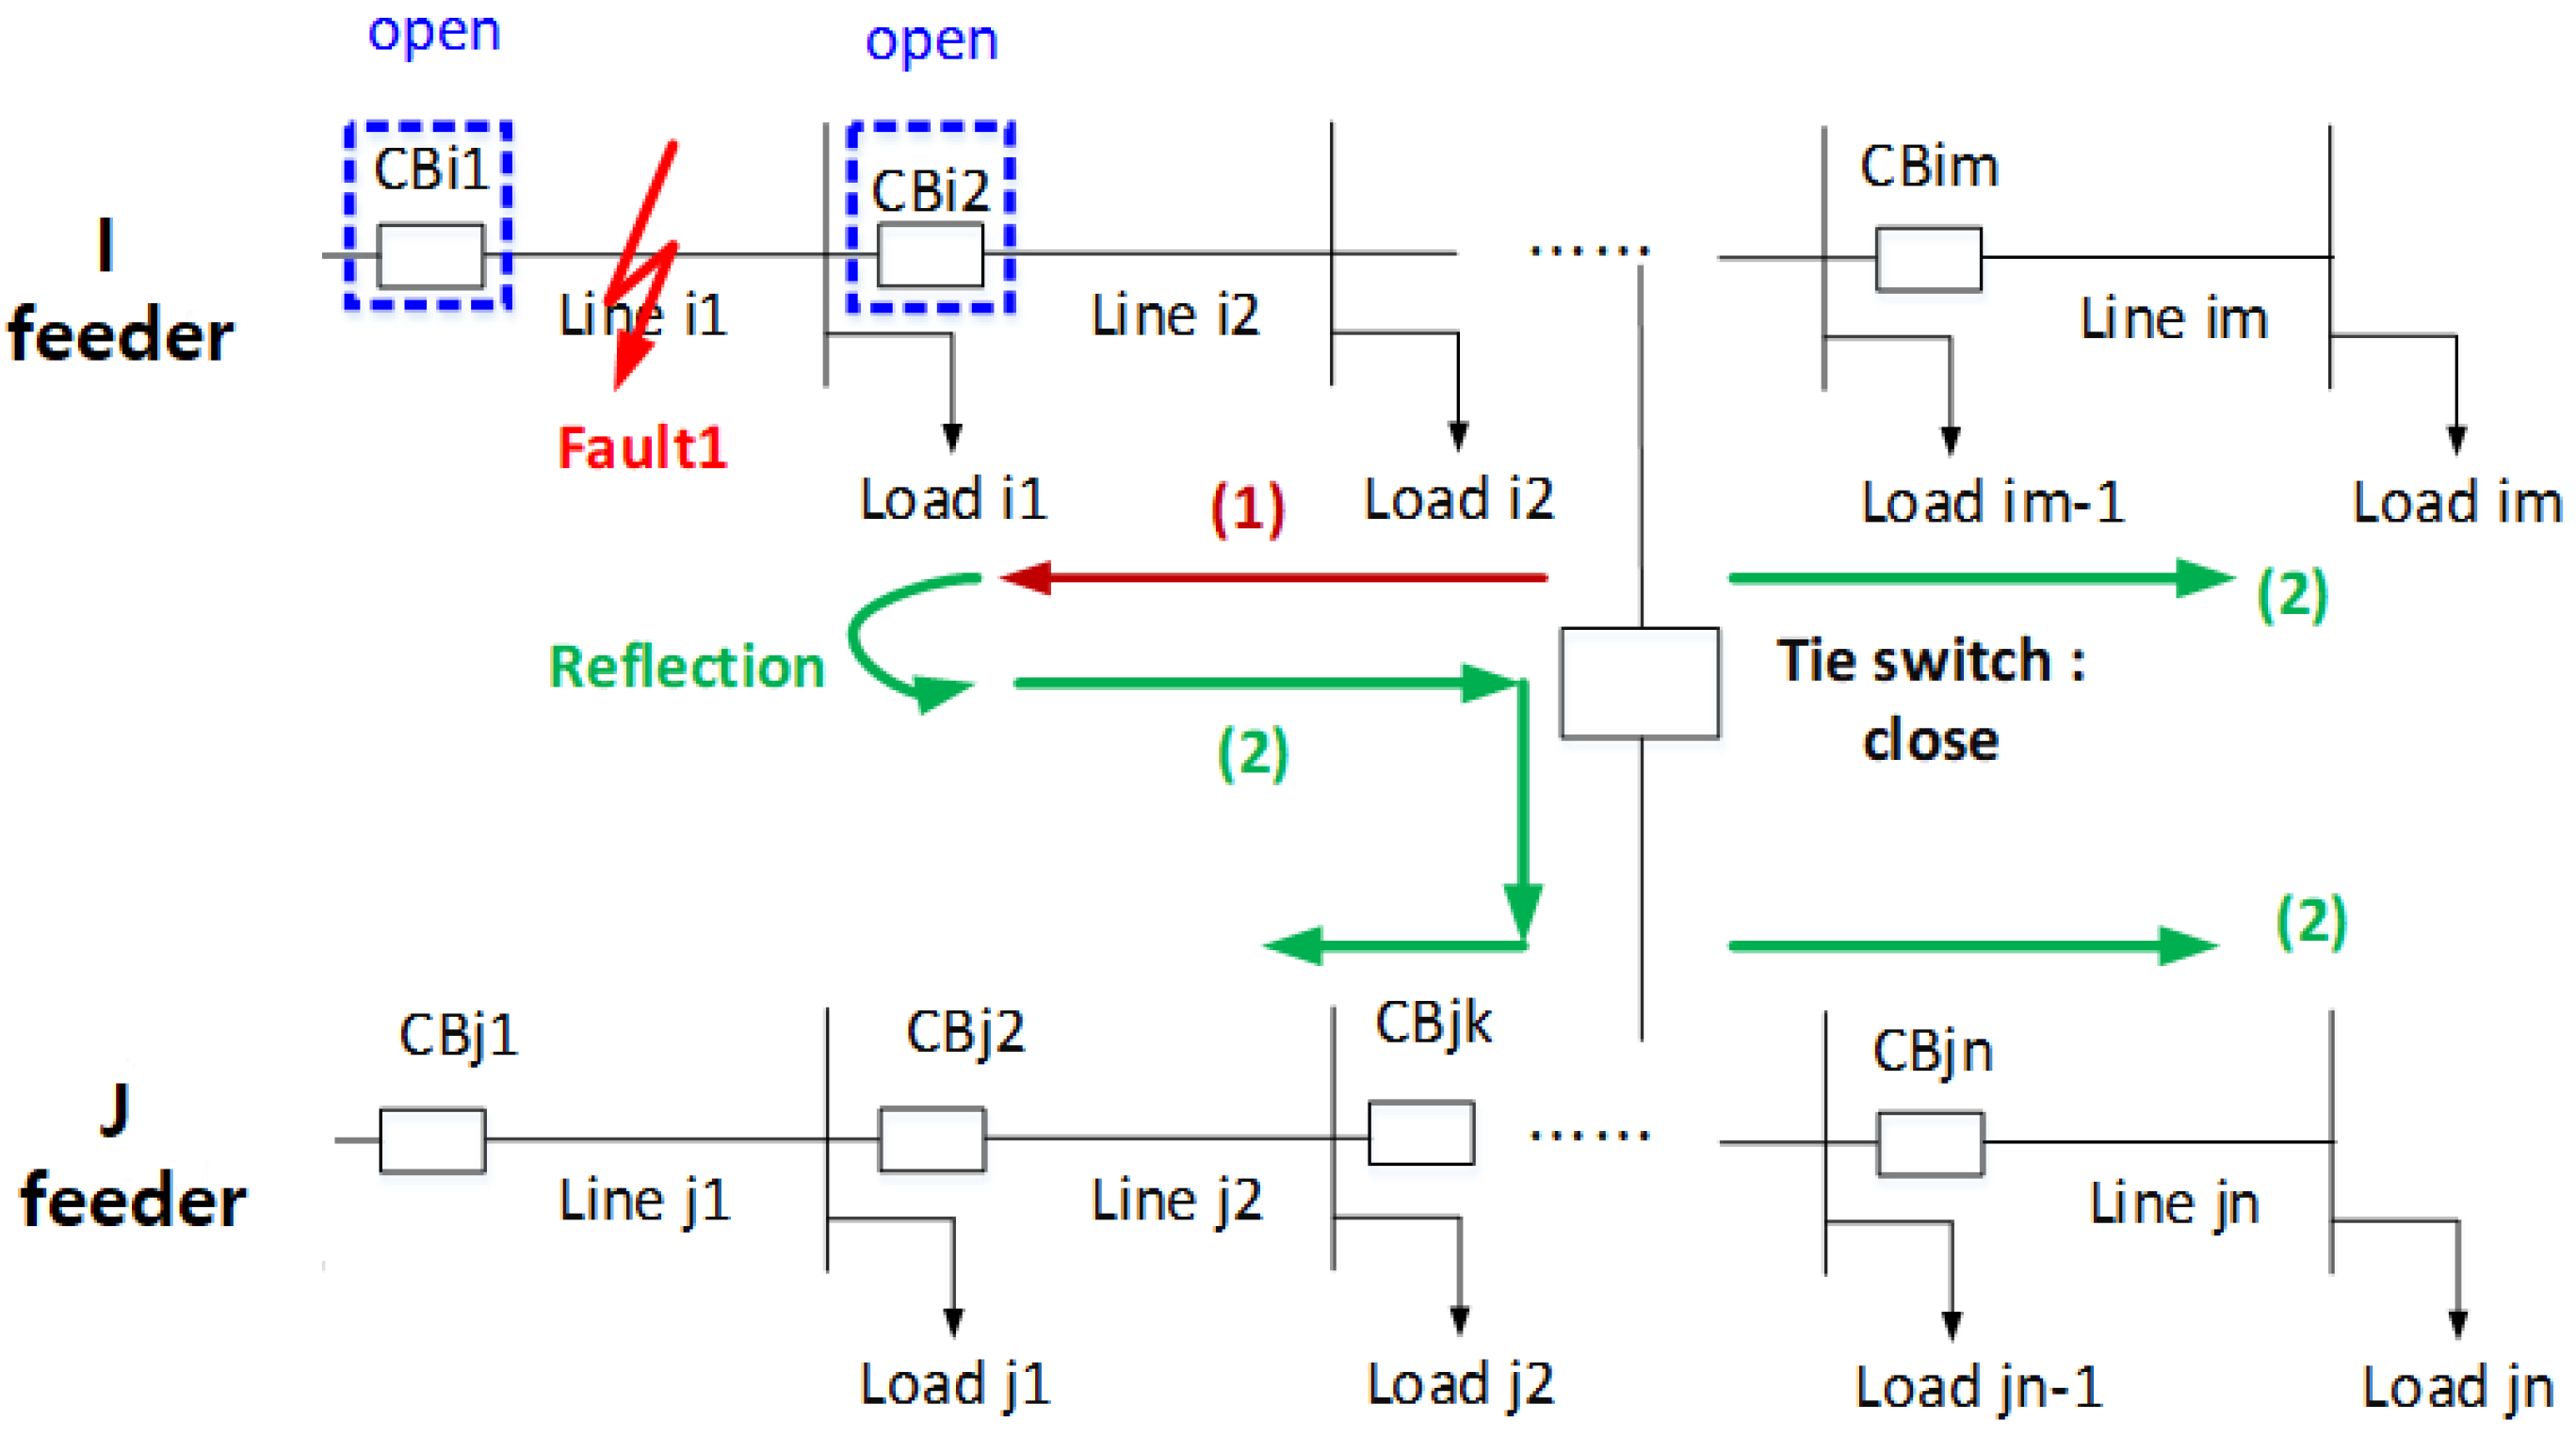
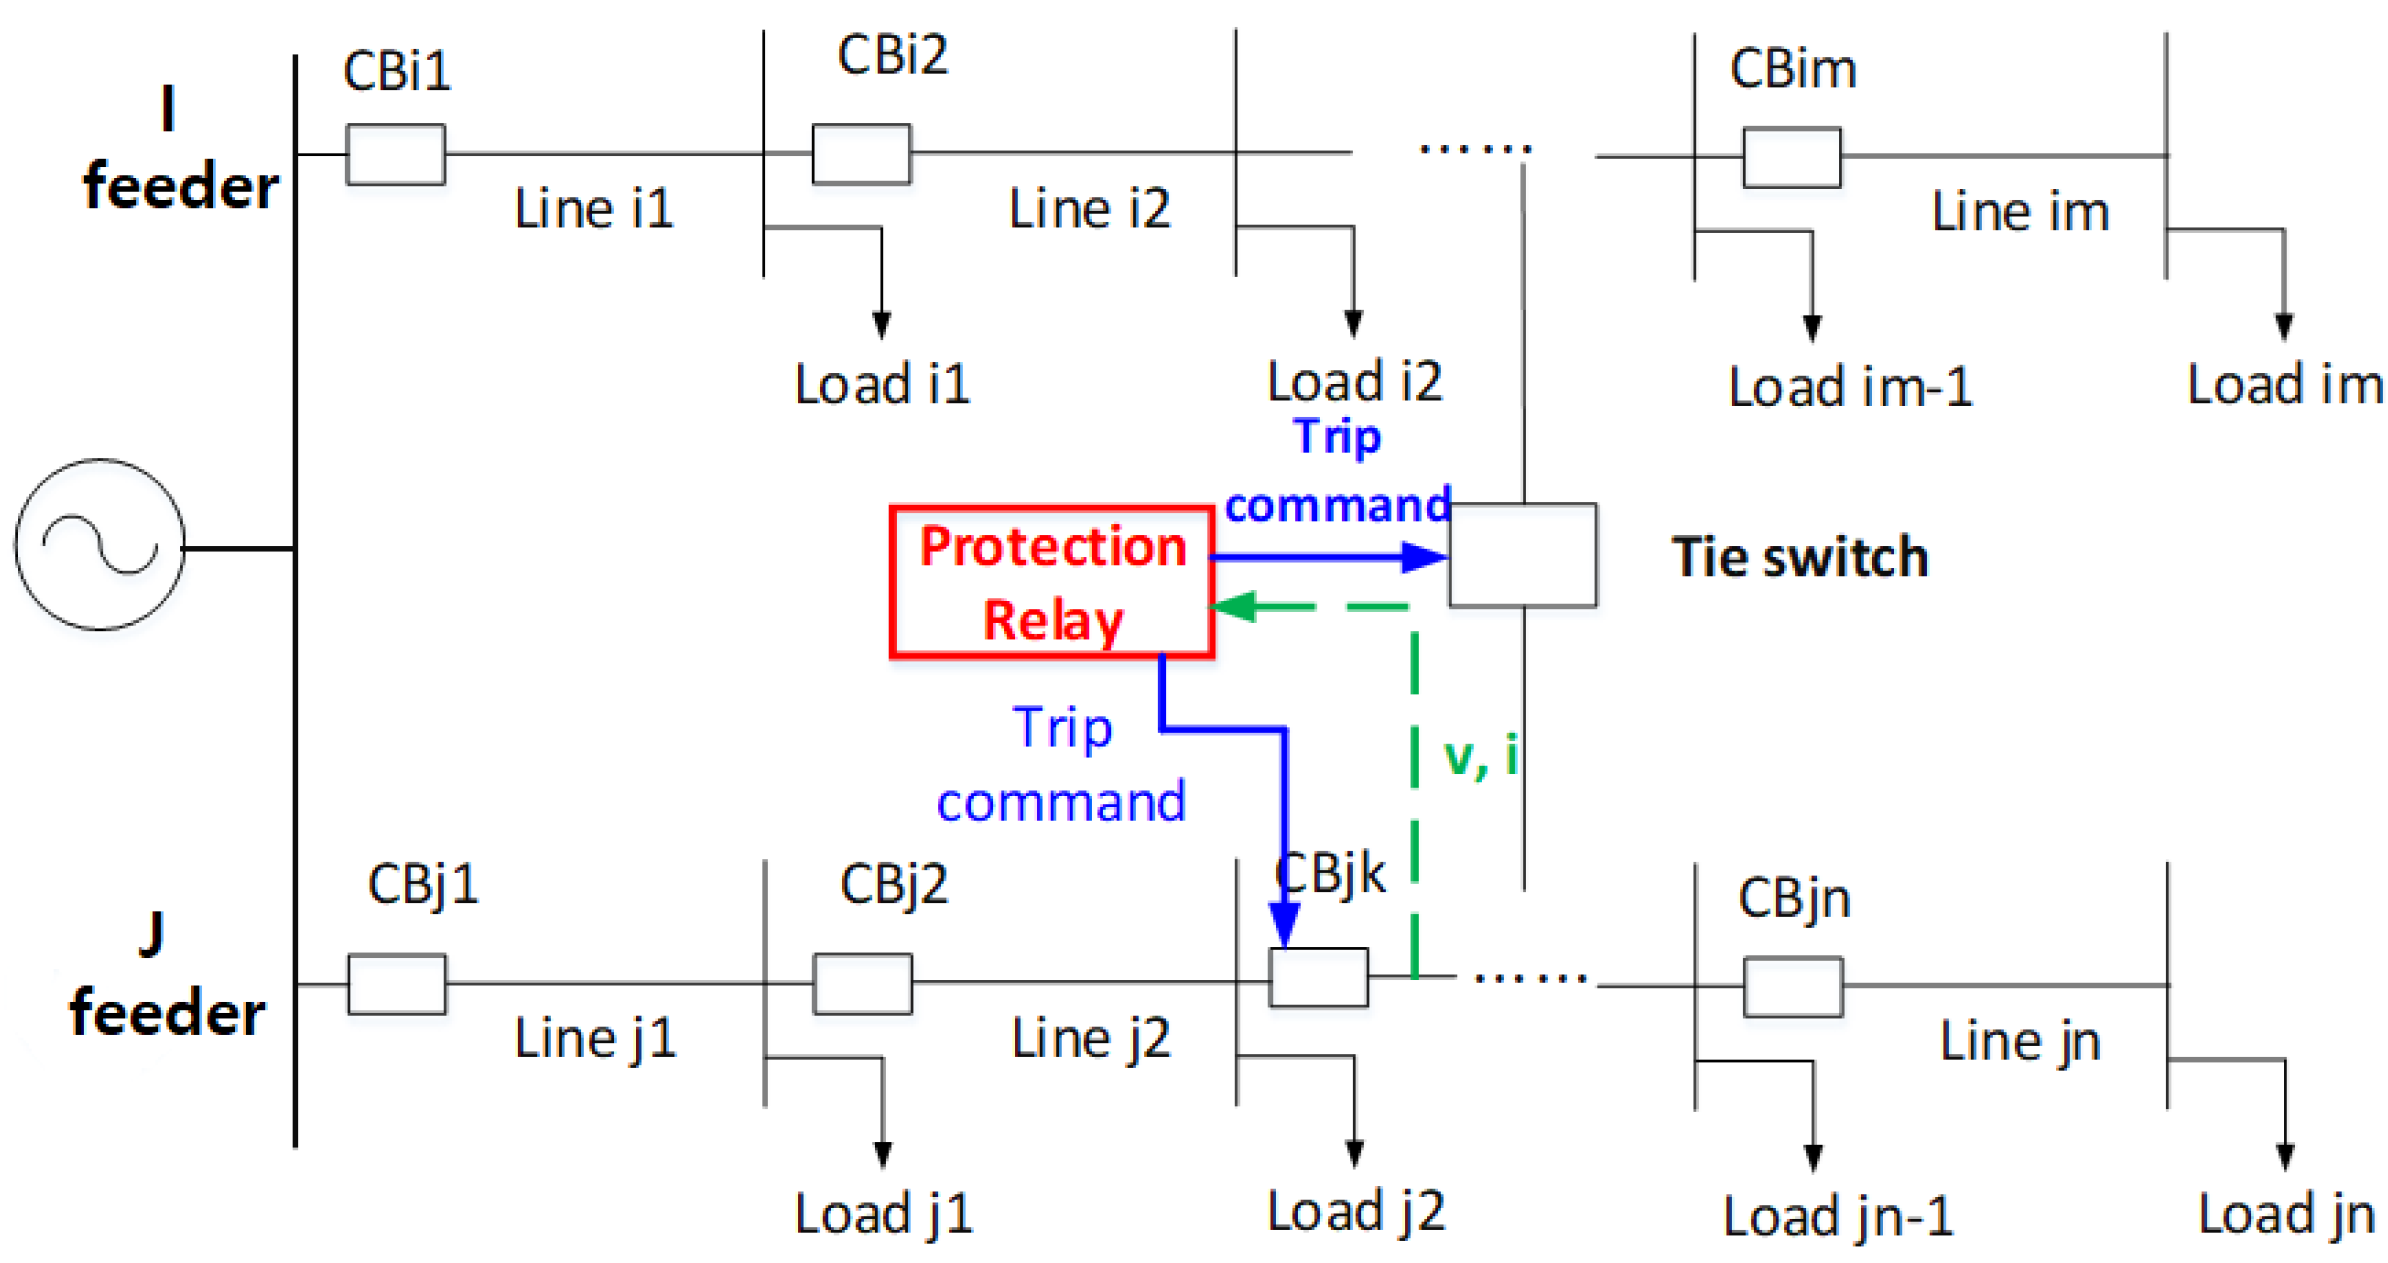
2. Considerations on Protection Issues in an Open-Loop MG
- (1)
- If the fault Section is typically disconnected, the protective relay should not operate because the normal load current is supplied from the J feeder to the I feeder.
- (2)
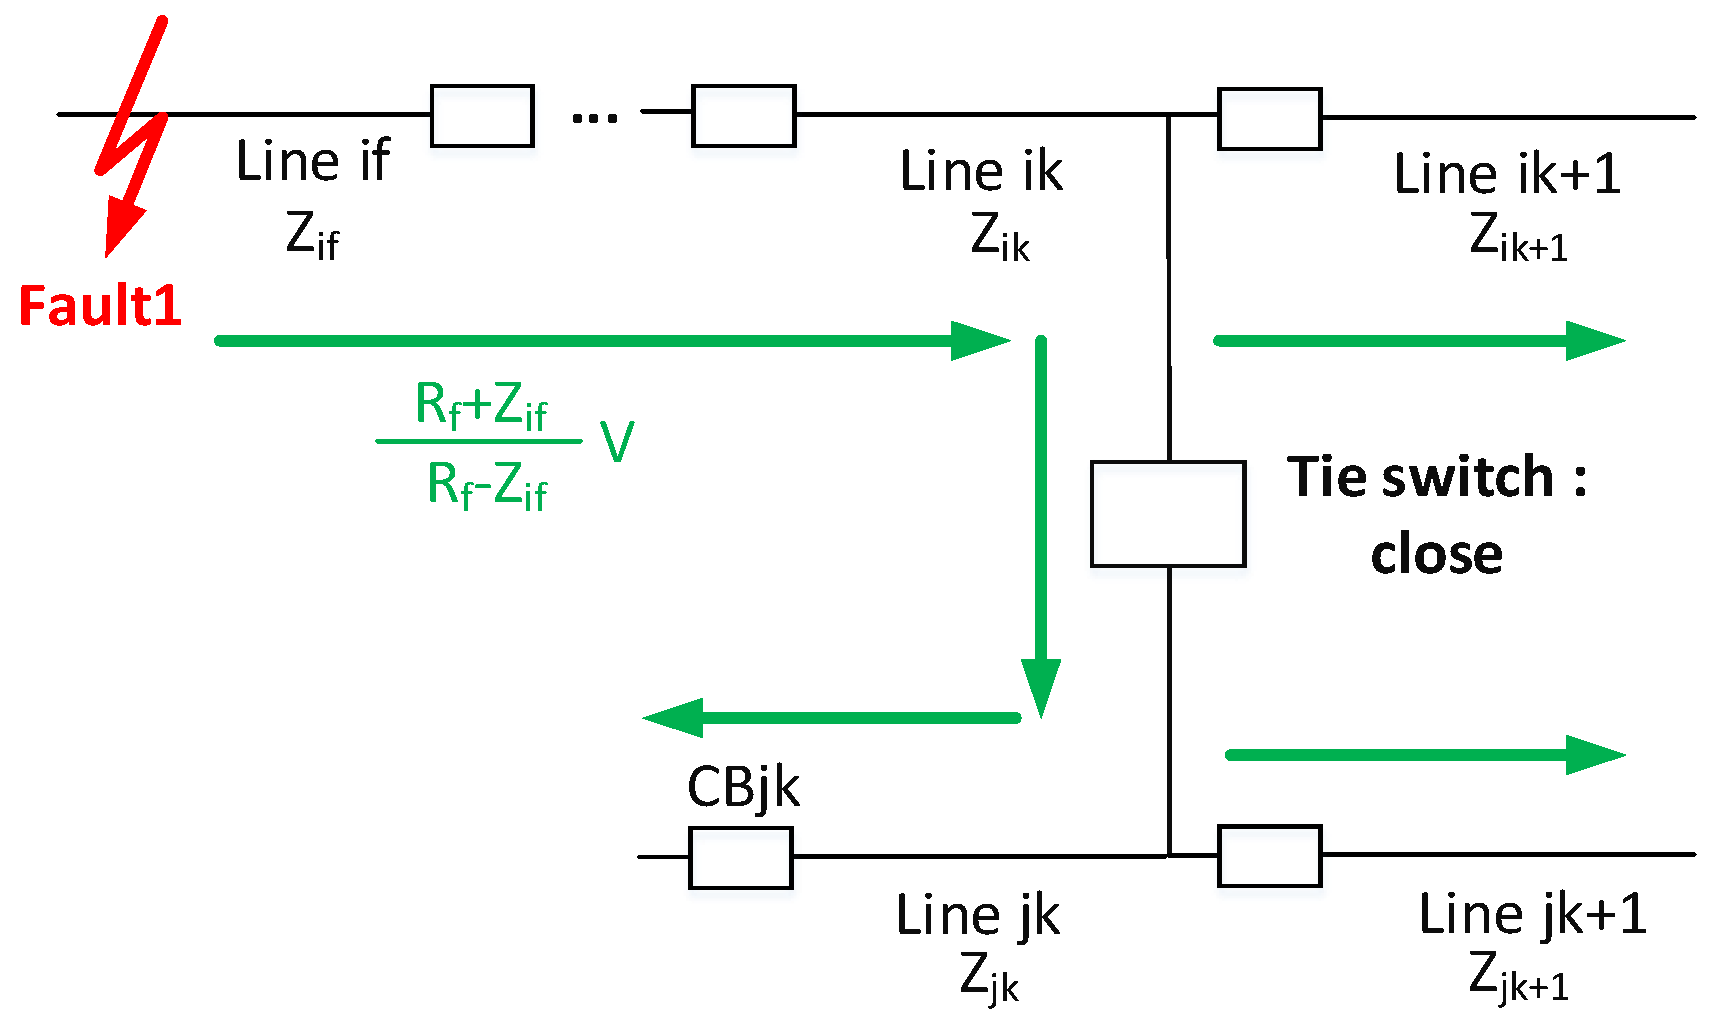
- If the separation of the fault Section fails and the tie switch is closed, the fault current can be injected from the J feeder. In this case, the tie switch must be opened again.
- (3)
- If the fault occurs in the latter part of the tie switch in the J feeder, the protection relay should operate normally.
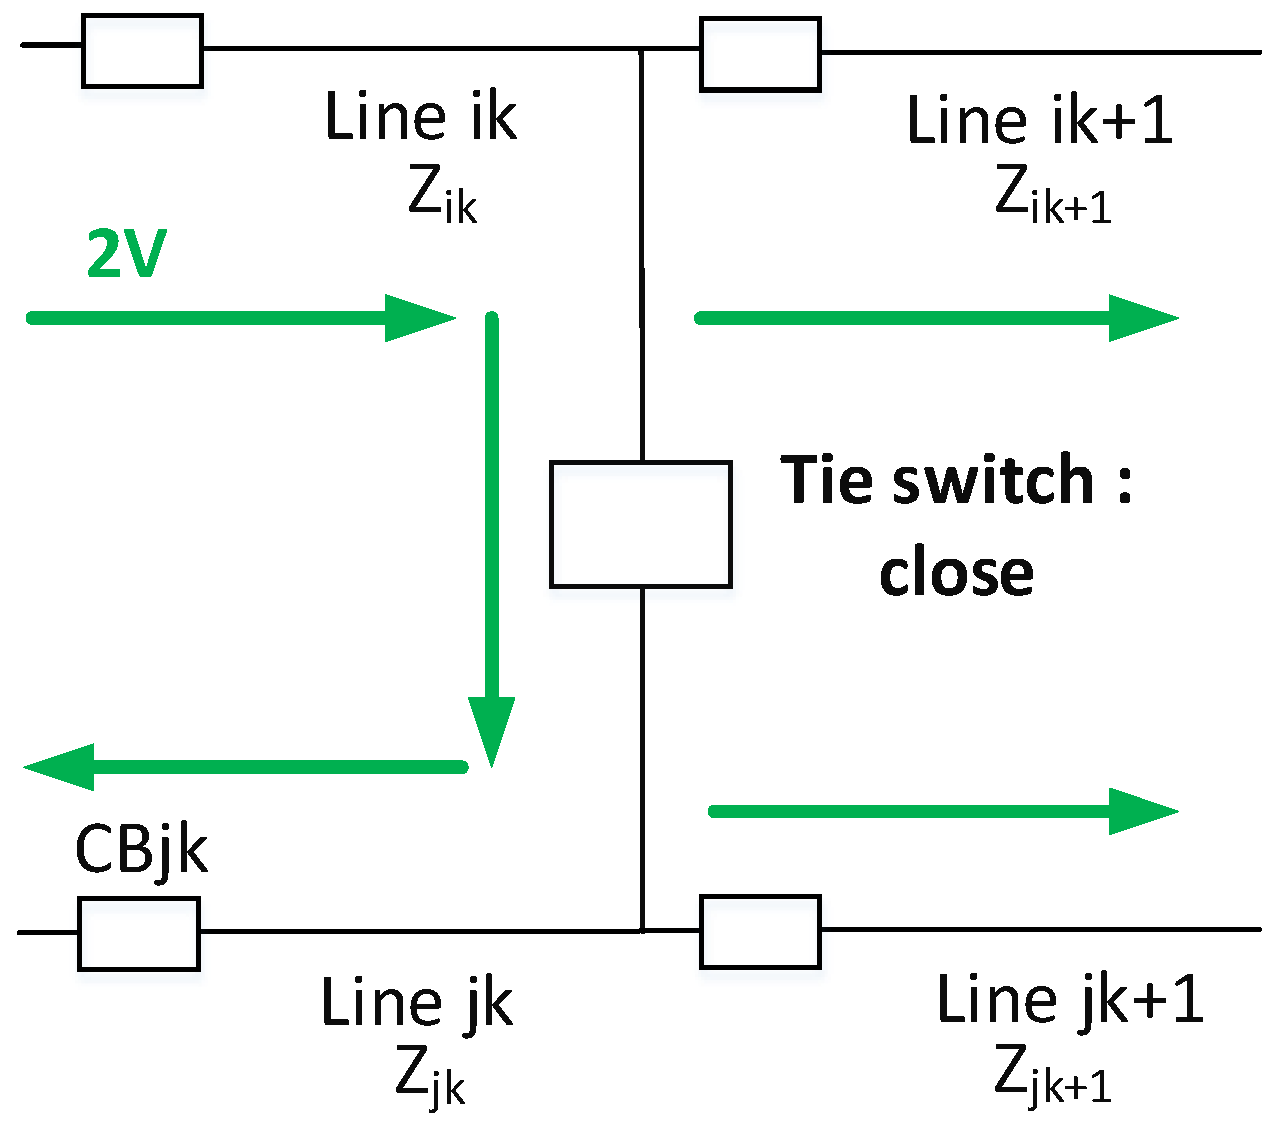
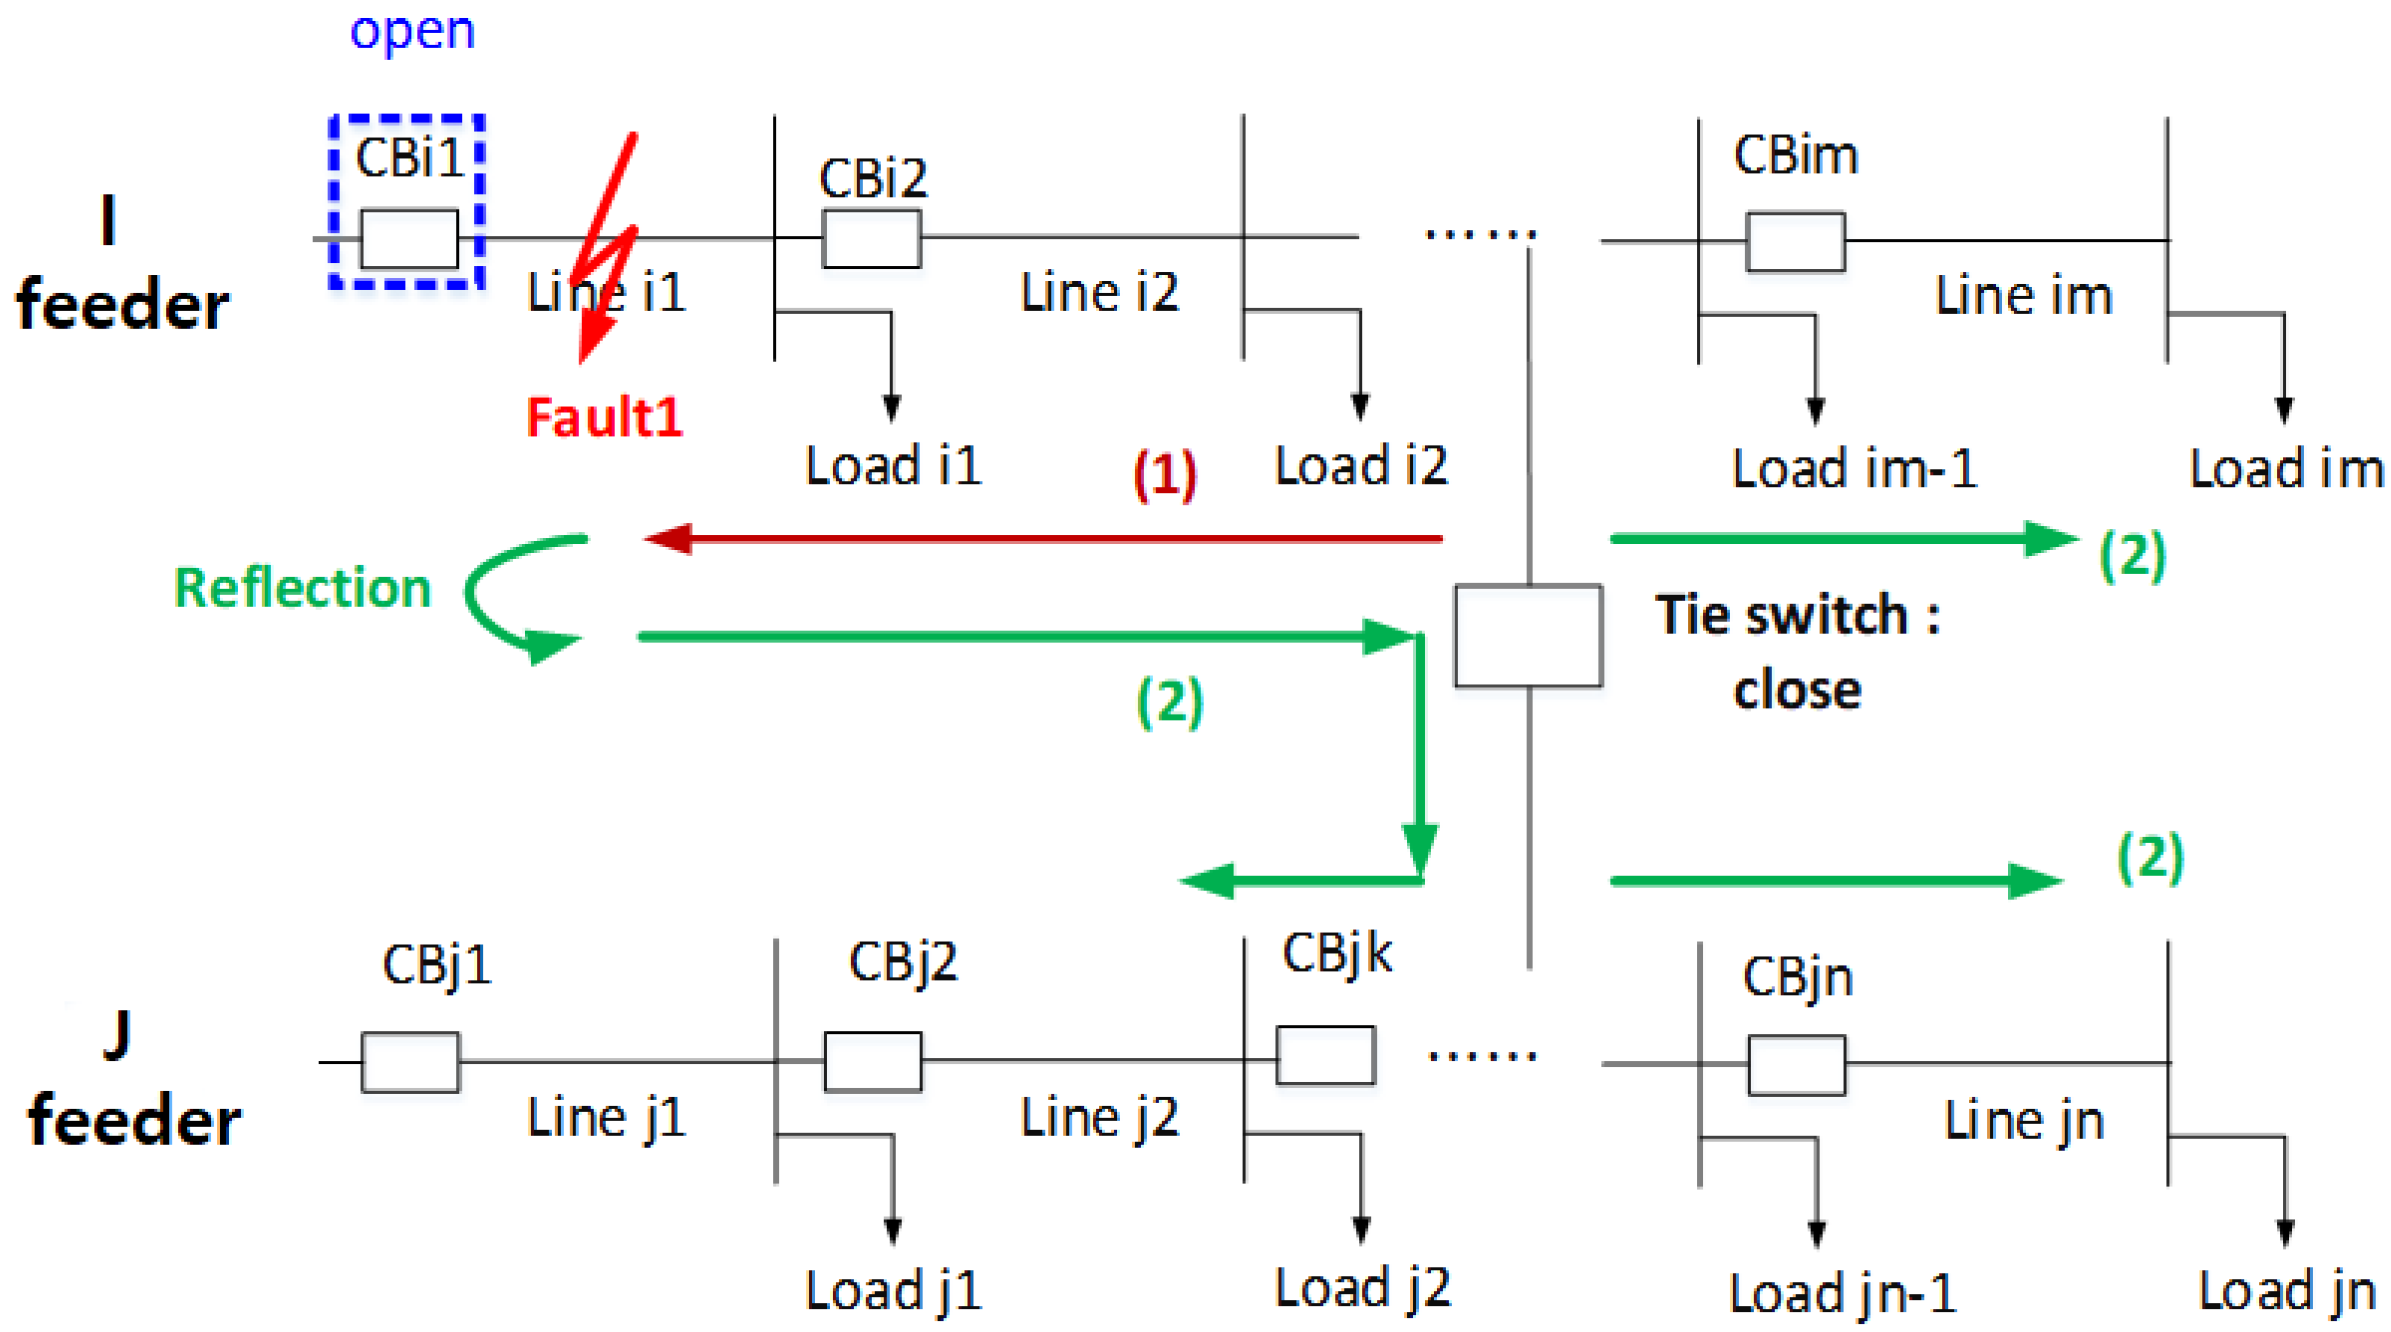
3. Characteristics of Faults in the Loop MG
3.1. Case of Success of Fault Section Separation (Normal Load Current Supply from J feeder)
3.2. Case of Failure of Fault Section Separation (Fault Current Injection from J feeder)
3.3. Case of Fault in the J Feeder (Faults in the Original Feeder)
3.4. Comparison of Each Case
- (1)
- When a fault Section separation fails, the smallest surge waveform will appear in CBjk. The other two cases will be determined by the fault resistance.
- (2)
- In the case of a normal load current supply, the switching surge duration is the longest. The other two cases are similar.
4. Fault Classification Using Wavelet Transform
4.1. Fault Classification Using Wavelet Transform
4.2. Selection of Mother Wavelet
5. New Protection Scheme Based on Coordination with Tie Switch in an Open-Loop MG
6. Simulations
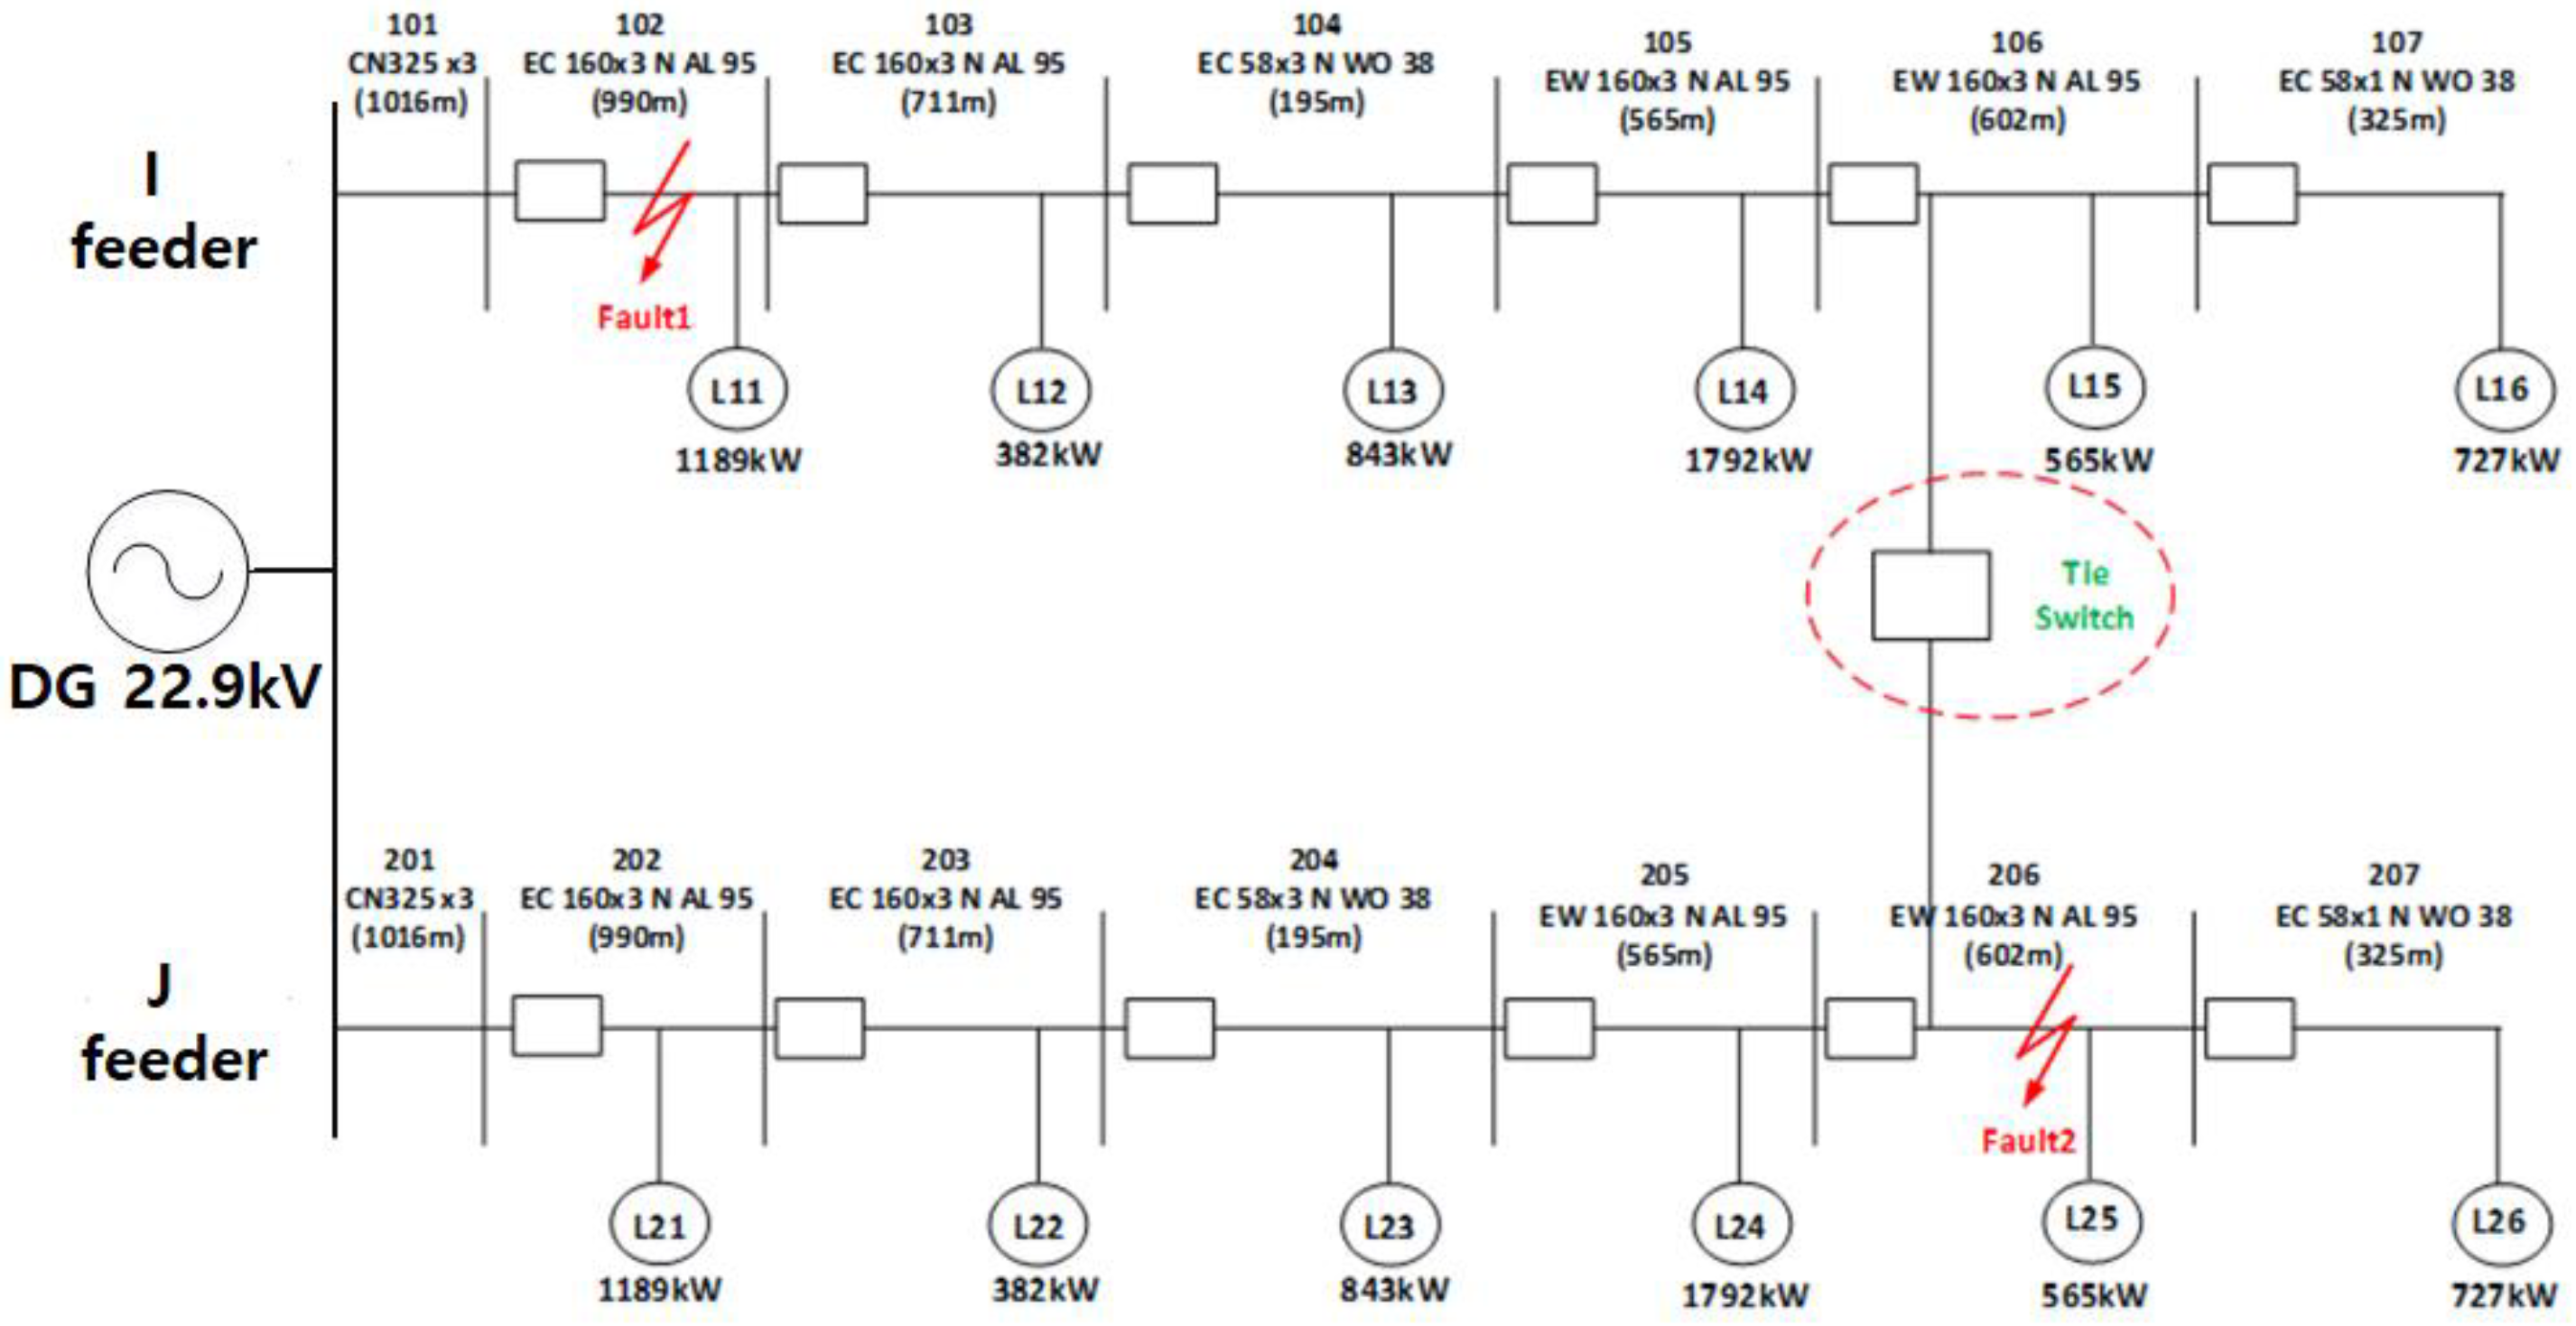
6.1. System Model and Simulation Condition
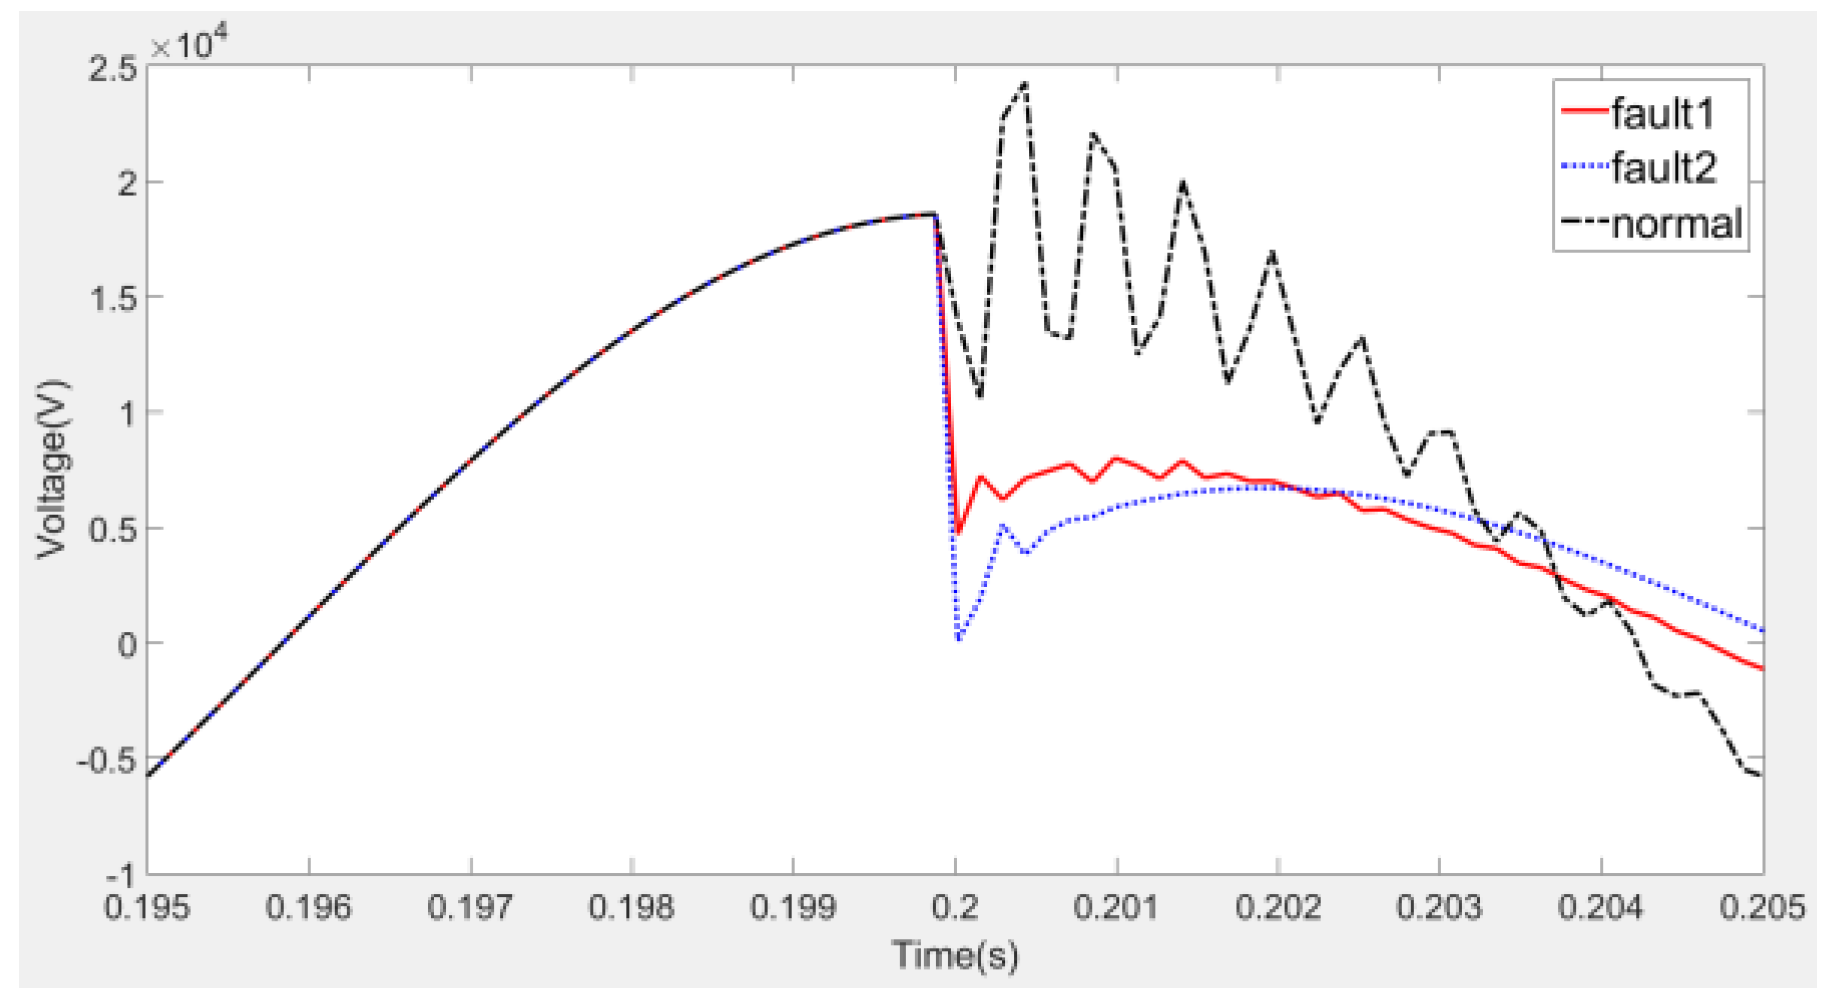
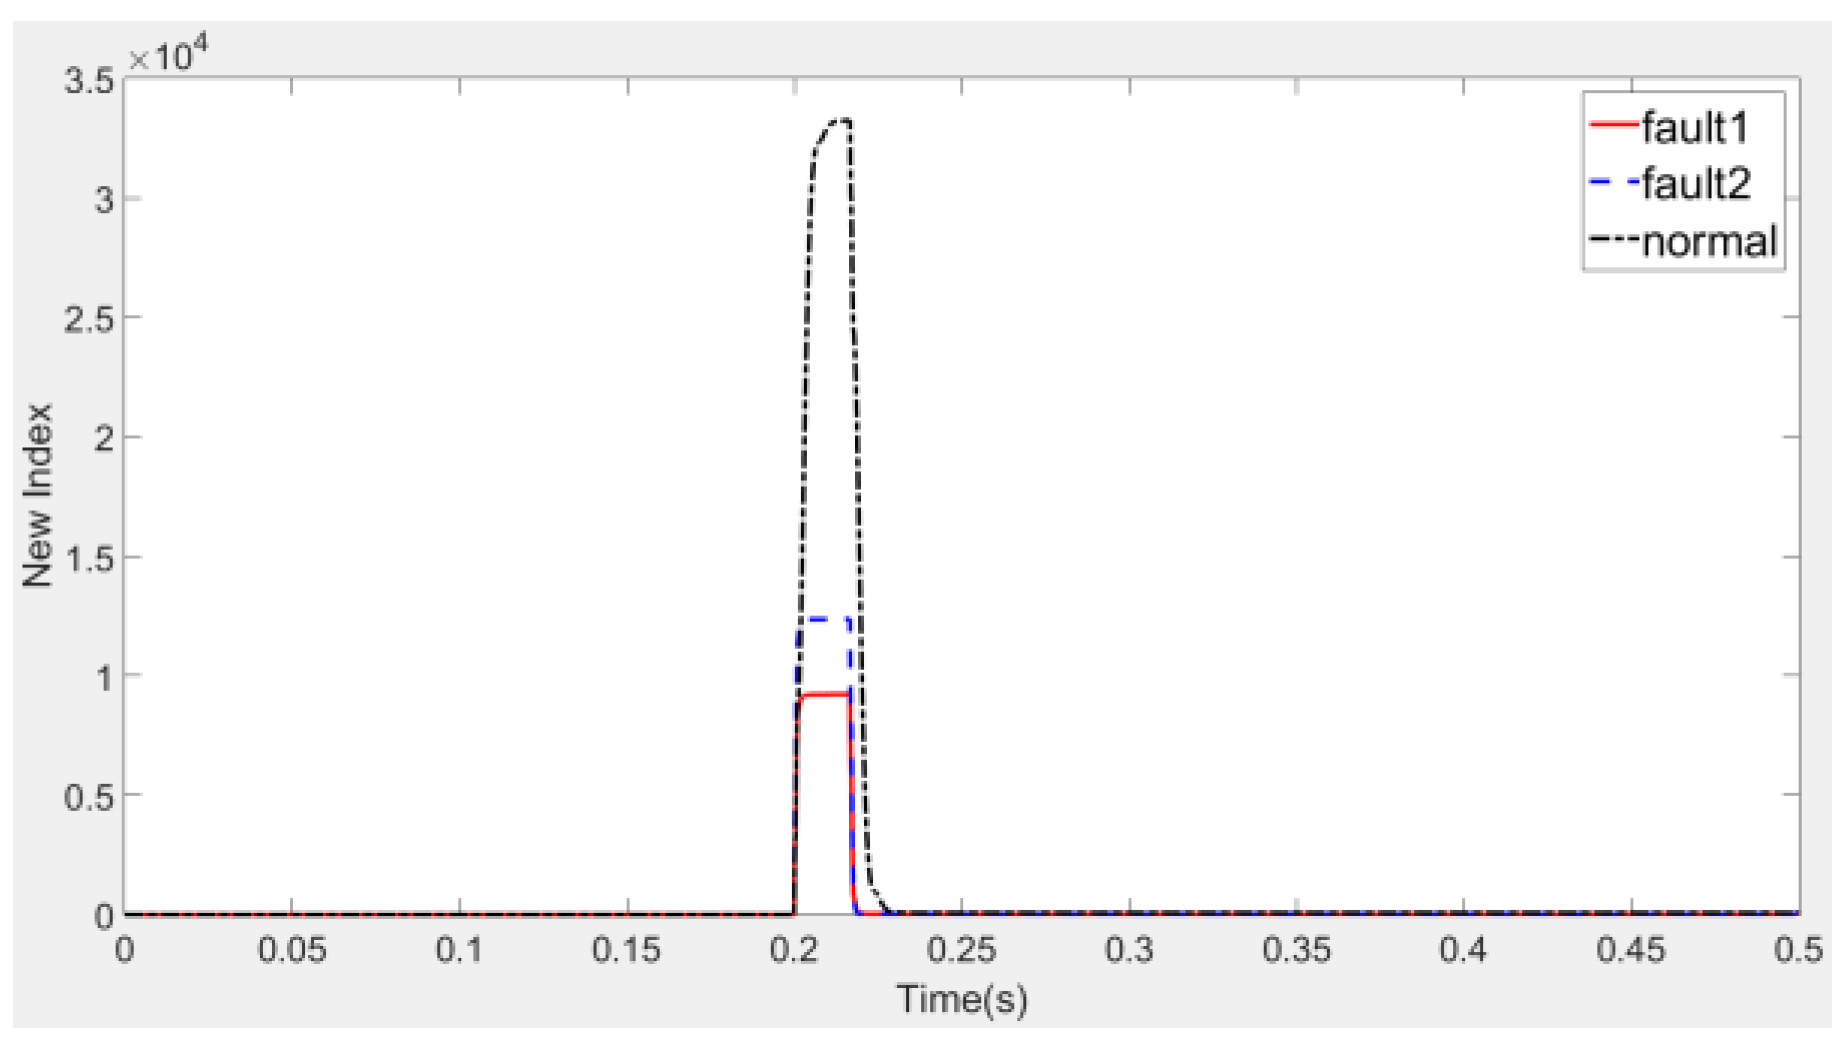
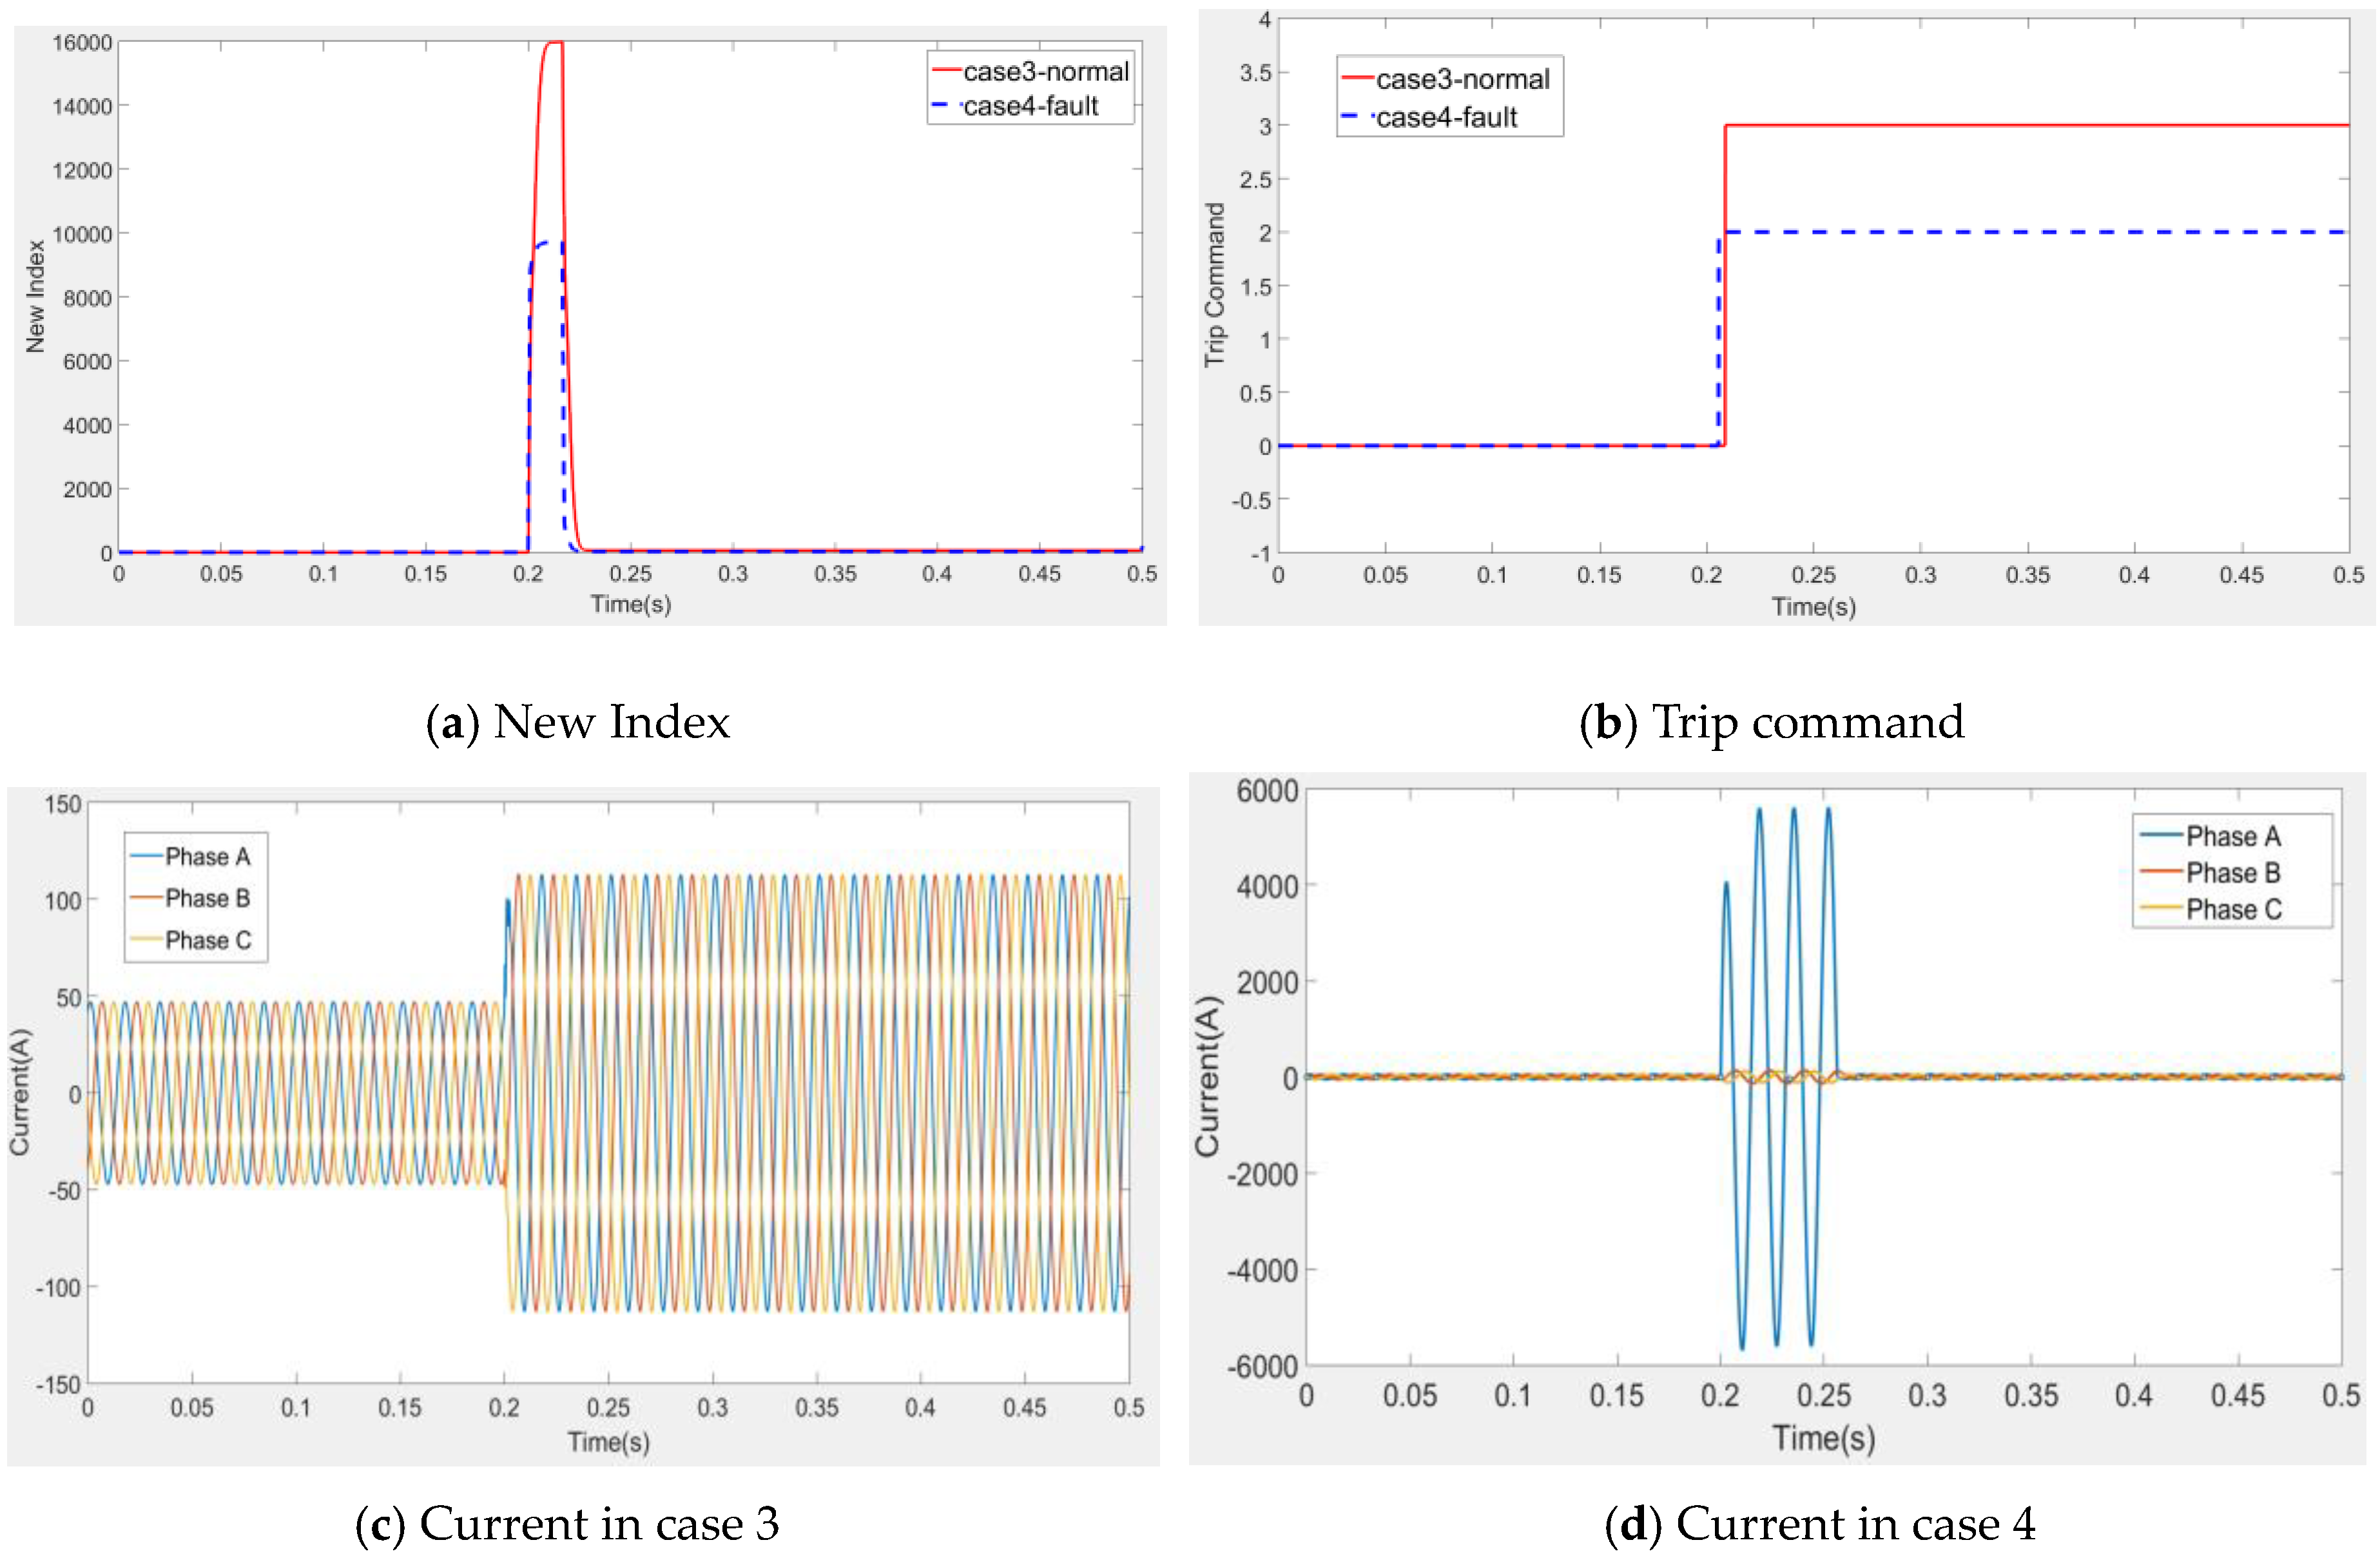
6.2. Simulation Results
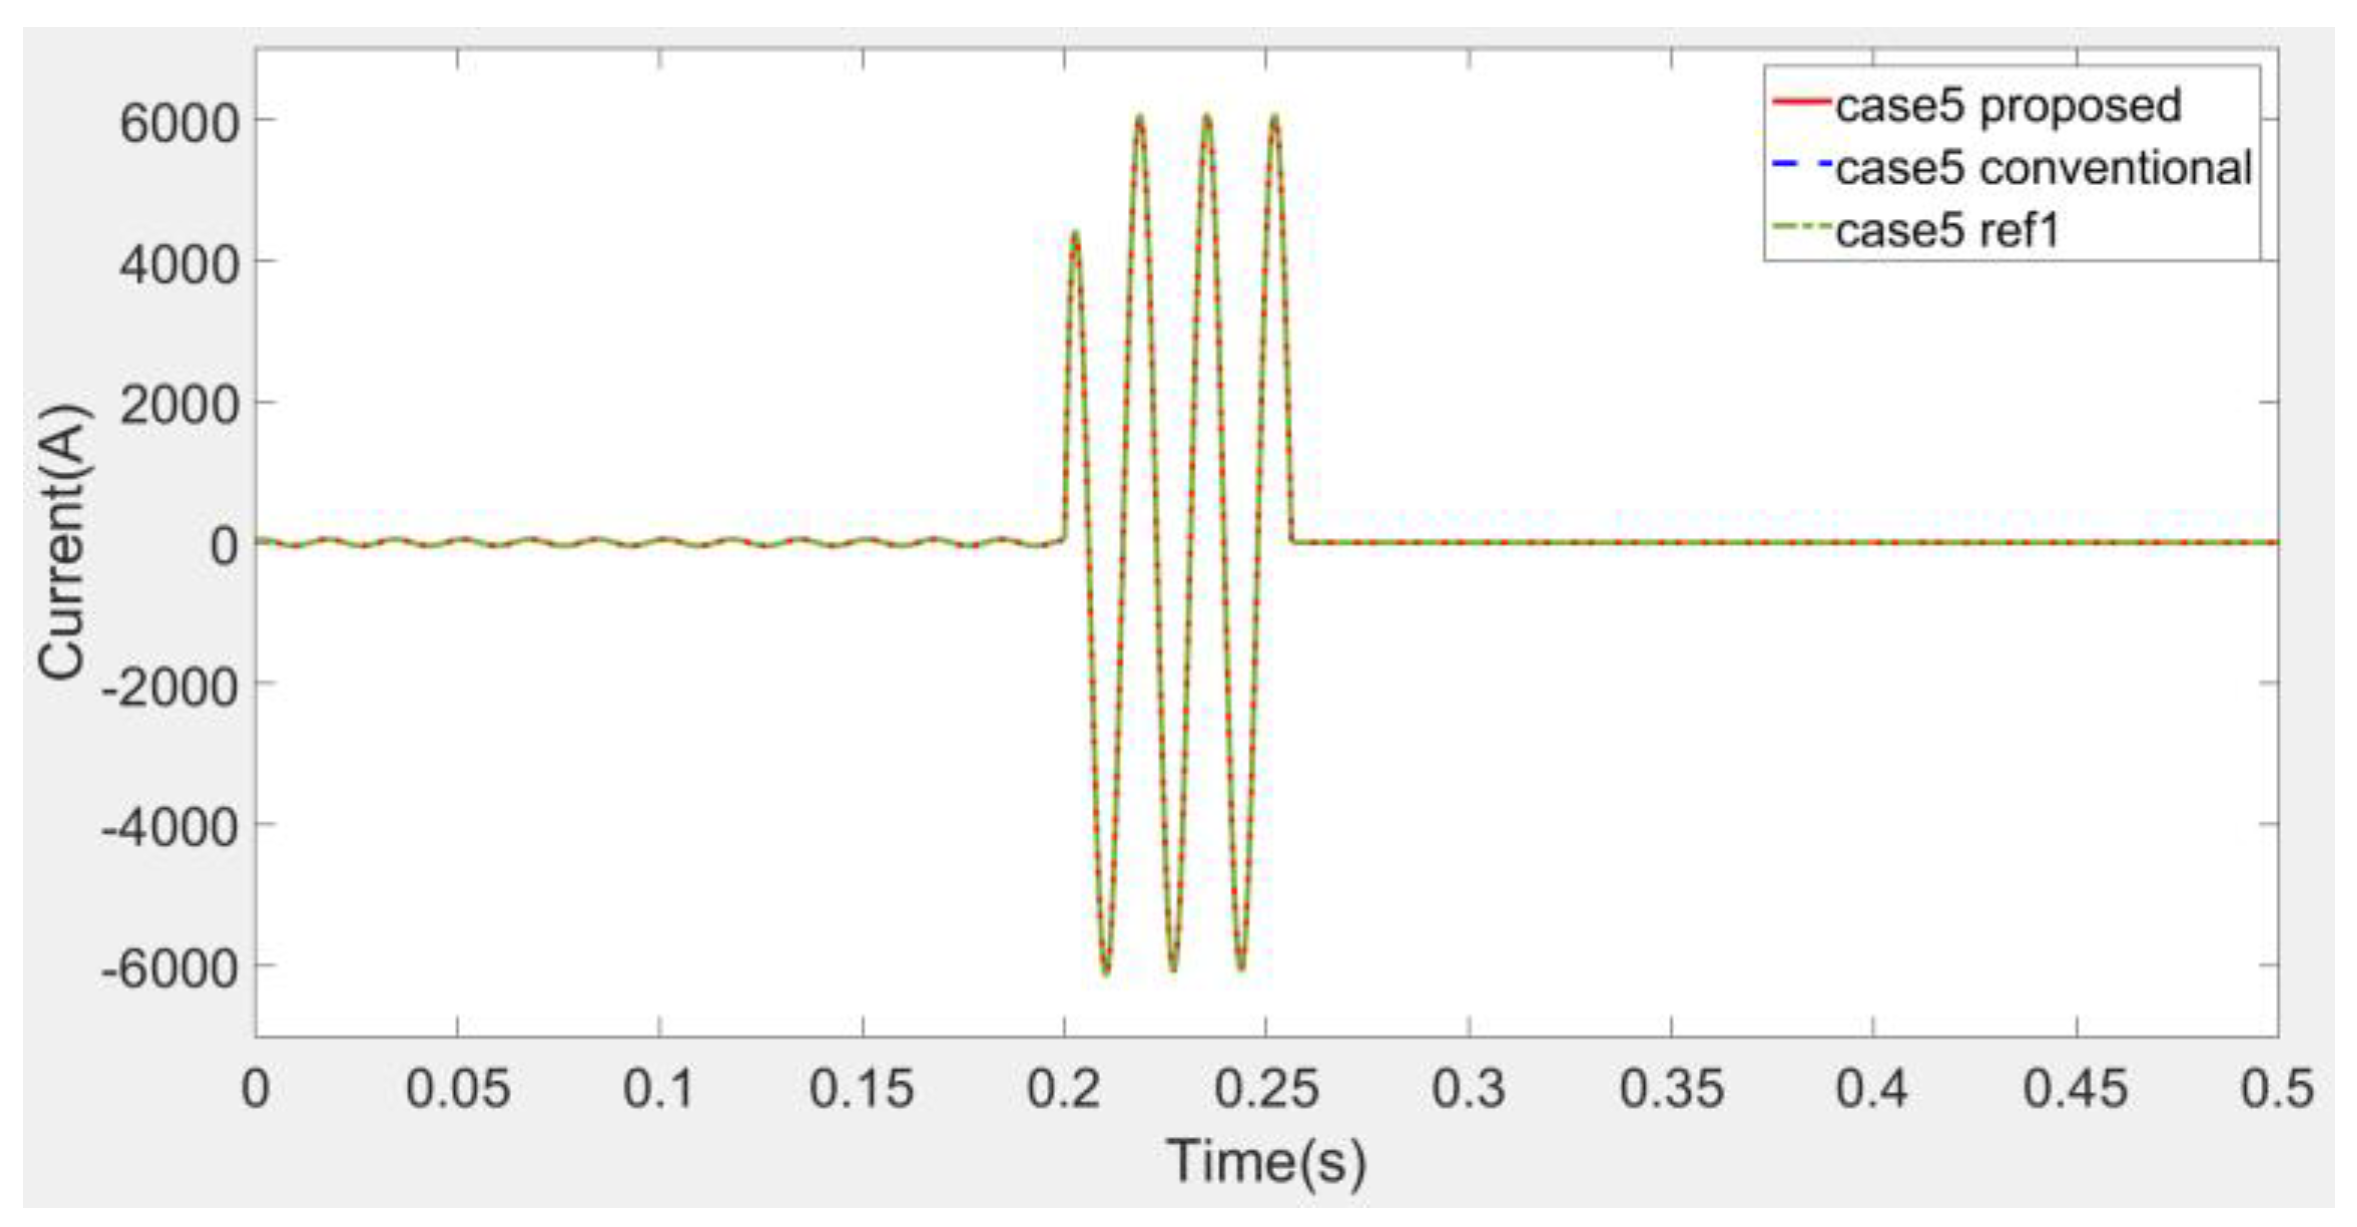
6.3. Comparison with Previous Works
6.4. Discussions
7. Conclusions
Funding
Conflicts of Interest
References
- Seo, H.C. Novel Protection Scheme considering Tie Switch Operation in Open Loop Distribution System using Wavelet Transform. Energies 2019, 12, 1725. [Google Scholar] [CrossRef]
- Teng, J.H. Unsymmetrical Short-Circuit Fault Analysis for Weakly Meshed Distribution Systems. IEEE Trans. Power Deliv. 2010, 25, 96–105. [Google Scholar] [CrossRef]
- Hooshyar, H.; Baran, M.E. Fault Analysis on Distribution Feeders with High Penetration of PV Systems. IEEE Trans. Power Deliv. 2013, 28, 2890–2896. [Google Scholar] [CrossRef]
- Chou, C.J.; Liu, C.W. Assessment of Risks From Ground Fault Transfer on Closed-Loop HV Underground Distribution Systems With Cables Running in a Common Route. IEEE Trans. Power Deliv. 2013, 28, 1015–1023. [Google Scholar] [CrossRef]
- Yu, P.; Venkatesh, B.; Yazdani, A.; Singh, B.N. Optimal Location and Sizing of Fault Current Limiters in Mesh Networks Using Iterative Mixed Integer Nonlinear Programming. IEEE Trans. Power Syst. 2016, 31, 4776–4783. [Google Scholar] [CrossRef]
- Deng, X.; Yuan, R.; Xiao, Z.; Li, T.; Wang, K.L.L. Fault location in loop distribution network using SVM technology. Int. J. Electr. Power Energy Syst. 2018, 65, 254–261. [Google Scholar] [CrossRef]
- Zhang, Z.H.; Xu, B.Y.; Crossley, P.; Li, L. Positive-sequence-fault-component-based blocking pilot protection for closed-loop distribution network with underground cable. Int. J. Electr. Power Energy Syst. 2018, 94, 57–66. [Google Scholar] [CrossRef]
- Mahmoud, M.M.A.S. Detection of high impedance faults in M.V. mesh distribution network. In Proceedings of the Modern Electric Power Systems (MEPS), Wroclaw, Poland, 6–9 July 2015. [Google Scholar]
- Borgnino, A.; Castillo, M. Comparison of the Performance of Different Directional Polarizing Methods in Cross Country Fault Protection of a MV Loop. In Proceedings of the Power Systems Computation Conference (PSCC), Dublin, Ireland, 11–15 June 2018. [Google Scholar]
- Lin, W.M.; Lin, C.H.; Sun, Z.C. Adaptive multiple fault detection and alarm processing for loop system with probabilistic network. IEEE Trans. Power Deliv. 2004, 19, 64–69. [Google Scholar] [CrossRef]
- Che, L.; Khodayar, M.E.; Shahidehpour, M. Adaptive Protection System for Microgrids: Protection practices of a functional microgrid system. IEEE Electrif. Mag. 2014, 2, 66–80. [Google Scholar] [CrossRef]
- Liu, X.; Shahidehpour, M.; Li, Z.; Liu, X.; Cao, Y.; Tian, W. Protection Scheme for Loop-Based Microgrids. IEEE Trans. Smart Grid 2017, 8, 1340–1349. [Google Scholar] [CrossRef]
- Wadood, A.; Gholami Farkoush, S.; Khurshaid, T.; Kim, C.H.; Yu, J.; Geem, Z.; Rhee, S.B. An Optimized Protection Coordination Scheme for the Optimal Coordination of Overcurrent Relays Using a Nature-Inspired Root Tree Algorithm. Appl. Sci. 2018, 8, 1664. [Google Scholar] [CrossRef]
- Khurshaid, T.; Wadood, A.; Farkoush, S.G.; Kim, C.H.; Cho, N.; Rhee, S.B. Modified Particle Swarm Optimizer as Optimization of Time Dial Settings for Coordination of Directional Overcurrent Relay. J. Electr. Eng. Technol. 2019, 14, 55–68. [Google Scholar] [CrossRef]
- Lestari, D.S.; Pujiantara, M.; Purnomo, M.H.; Rahmatullah, D. Adaptive DOCR coordination in loop distribution system with distributed generation using firefly algorithm-artificial neural network. In Proceedings of the International Conference on Information and Communications Technology, Yogyakarta, Indonesia, 6–7 March 2018. [Google Scholar]
- Dy, D.M.; Ilarde, J.F.; Navarrete, H.G.; Valeros, D.X.; Bersano, R.F.; Pacis, M.C.; Santiago, R.V.M. Optimal Overcurrent Relay Coordination of a Multi-Loop Distribution Network with Distributed Generation Using Dual Simplex Algorithm. In Proceedings of the IEEE Region Ten Symposium (Tensymp), Sydney, Australia, 4–6 July 2018. [Google Scholar]
- Park, J.H.; Seo, H.C.; Kim, C.H.; Rhee, S.B. Development of adaptive reclosing scheme using wavelet transform of neutral line current in distribution system. Electr. Power Compon. Syst. 2016, 44, 426–433. [Google Scholar] [CrossRef]
- Seo, H.C.; Rhee, S.B. Novel adaptive reclosing scheme using wavelet transform in distribution system with battery energy storage system. Int. J. Electr. Power Energy Syst. 2018, 97, 186–200. [Google Scholar] [CrossRef]
- Costa, F.B.; Monti, A.; Paiva, S.C. Overcurrent Protection in Distribution Systems with Distributed Generation Based on the Real-Time Boundary Wavelet Transform. IEEE Trans. Power Deliv. 2017, 32, 462–473. [Google Scholar] [CrossRef]
- Dehghani, M.; Khooban, M.H.; Niknam, T. Fast fault detection and classification based on a combination of wavelet singular entropy theory and fuzzy logic in distribution lines in the presence of distributed generations. Int. J. Electr. Power Energy Syst. 2016, 78, 455–462. [Google Scholar] [CrossRef]
- Mishra, D.P.; Samantaray, S.R.; Joos, G. A combined wavelet and data-mining based intelligent protection scheme for microgrid. IEEE Trans. Smart Grid 2016, 7, 2295–2304. [Google Scholar] [CrossRef]
- Leal, M.M.; Costa, F.B.; Campos, J.T.L.S. Improved traditional directional protection by using the stationary wavelet transform. Int. J. Electr. Power Energy Syst. 2019, 105, 59–69. [Google Scholar] [CrossRef]
- Oh, Y.S.; Han, J.; Gwon, G.H.; Kim, D.U.; Kim, C.H. Development of Fault Detector for Series Arc Fault in Low Voltage DC Distribution System using Wavelet Singular Value Decomposition and State Diagram. J. Electr. Eng. Technol. 2015, 10, 766–776. [Google Scholar] [CrossRef]
- Oh, Y.S.; Kim, C.H.; Gwon, G.H.; Noh, C.H.; Bukhari, S.B.A.; Haider, R.; Gush, T. Fault detection scheme based on mathematical morphology in last mile radial low voltage DC distribution networks. Int. J. Electr. Power Energy Syst. 2019, 106, 520–527. [Google Scholar] [CrossRef]
- Seo, H.C. New adaptive reclosing technique using second-order difference of THD in distribution system with BESS used as uninterruptible power supply. Int. J. Electr. Power Energy Syst. 2017, 90, 315–322. [Google Scholar] [CrossRef]
- Seo, H.C. New configuration and novel reclosing procedure of distribution system for utilization of BESS as UPS in smart grid. Sustainablity 2017, 9, 507. [Google Scholar] [CrossRef]
- Kim, J.H.; Go, H.S.; Kim, D.U.; Seo, H.C.; Kim, C.H.; Kim, E.S. Modeling of battery for electric vehicle using EMTP/MODELS. In Proceedings of the IEEE Vehicle Power and Propulsion Conference, Seoul, Korea, 9–12 October 2012. [Google Scholar]


| Case | Fault 1 | Fault 2 | Normal | |
|---|---|---|---|---|
| MW | ||||
| Haar | Maximum value | 35,000 | 40,000 | 127,000 |
| Time | 0.0165 | 0.0165 | 0.0165 | |
| Db4 | Maximum value | 9200 | 12,300 | 33,000 |
| Time | 0.0022 | 0.004 | 0.015 | |
| Sym5 | Maximum value | 12,900 | 20,300 | 68,200 |
| Time | 0.0025 | 0.004 | 0.015 |
| Case | Fault Section | Success/Failure of Fault Section Separation |
|---|---|---|
| Case1 | 102 | Success |
| Case2 | 102 | Failure |
| Case3 | 105 | Success |
| Case4 | 105 | Failure |
| Case 5 | 206 | - |
© 2019 by the author. Licensee MDPI, Basel, Switzerland. This article is an open access article distributed under the terms and conditions of the Creative Commons Attribution (CC BY) license (http://creativecommons.org/licenses/by/4.0/).
Share and Cite
Seo, H.-C. New Protection Scheme Based on Coordination with Tie Switch in an Open-Loop Microgrid. Energies 2019, 12, 4756. https://doi.org/10.3390/en12244756
Seo H-C. New Protection Scheme Based on Coordination with Tie Switch in an Open-Loop Microgrid. Energies. 2019; 12(24):4756. https://doi.org/10.3390/en12244756
Chicago/Turabian StyleSeo, Hun-Chul. 2019. "New Protection Scheme Based on Coordination with Tie Switch in an Open-Loop Microgrid" Energies 12, no. 24: 4756. https://doi.org/10.3390/en12244756
APA StyleSeo, H.-C. (2019). New Protection Scheme Based on Coordination with Tie Switch in an Open-Loop Microgrid. Energies, 12(24), 4756. https://doi.org/10.3390/en12244756