Article

Parametric Optimization and Thermodynamic Performance Comparison of Organic Trans-Critical Cycle, Steam Flash Cycle, and Steam Dual-Pressure Cycle for Waste Heat Recovery

MOE Key Laboratory of Efficient Utilization of Low and Medium Grade Energy, School of Mechanical Engineering, Tianjin University, Tianjin 300072, China
*
Author to whom correspondence should be addressed.
Energies 2019, 12(24), 4623; https://doi.org/10.3390/en12244623
Submission received: 7 November 2019 / Revised: 29 November 2019 / Accepted: 4 December 2019 / Published: 5 December 2019
(This article belongs to the Special Issue Energy Complex System Simulation, Design, and Optimisation)

Abstract

:
Compared with the basic organic and steam Rankine cycles, the organic trans-critical cycle (OTC), steam flash cycle (SFC) and steam dual-pressure cycle (SDC) can be regarded as the improved cycle configurations for the waste heat power recovery since they can achieve better temperature matching between the heat source and working fluid in the heat addition process. This study investigates and compares the thermodynamic performance of the OTC, SFC, and SDC based on the waste heat source from the cement kiln with an initial temperature of 320 °C and mass flow rate of 86.2 kg/s. The effects of the main parameters on the cycle performance are analyzed and the parameter optimization is performed with net power output as the objective function. Results indicate that the maximum net power output of SDC is slightly higher than that of SFC and the OTC using n-pentane provides a 19.74% increase in net power output over the SDC since it can achieve the higher use of waste heat and higher turbine efficiency. However, the turbine inlet temperature of the OTC is limited by the thermal stability of the organic working fluid, hence the SDC outputs more power than that of the OTC when the initial temperature of the exhaust gas exceeds 415 °C.

1. Introduction

A great deal of waste heat energy with exhaust gas as the carrying medium is available in the industrial processes. To generate electricity based on waste heat can reduce the consumption of fossil energy and alleviate the strain on the environment caused by the burning of fossil fuels. The power cycle system is the most common technology to realize the conversion of the heat into electricity. Selecting the proper cycle configuration, working fluid, and operating parameters based on the heat source condition is crucial for the economic profitability of the power system [1].
Rankine cycle (RC) is a classic option for the power system [2]. However, RC cannot match with the waste heat source well from the perspective of thermodynamics. The temperature of exhaust gas decreases along with its exothermic process, while the temperature of working fluid remains constant during the evaporation process in RC (for non-azeotropic mixtures, there is a temperature glide in the evaporation process). This leads to an inherent heat transfer temperature difference between the exhaust gas and working fluid, which has a significant impact on the thermodynamic perfection of the cycle and the use of the waste heat.
The conventional working fluid of RC is water [3,4,5]. Water is a typical wet fluid, hence a large superheat is needed for the initial state of the expansion process, to alleviate the liquid eroding on the turbine blades and to ensure the efficiency of the turbine. Therefore, under the given initial temperature of the waste heat source, the evaporating temperature of steam Rankine cycle (SRC) is restricted, which will affect the cycle’s thermal and exergy efficiencies. The latent heat of evaporation of water is much larger than its liquid and vapor sensible heat, which makes the temperature curve of the SRC’s heat addition process more non-smooth. In short, the thermophysical properties of water aggravate the thermodynamic deficiencies of the RC mentioned above. Also, an expensive multi-stage turbine is required for the SRC system owing to water’s large specific enthalpy drop and volume ratio in the adiabatic expansion process, and the steam turbine’s efficiency is reduced obviously under the low temperature and small capacity condition [6,7].
Many organic compounds are dry fluids (positive slope of saturation vapor curve) and isentropic fluids (vertical saturation vapor curve). The latent heat of evaporation of the organic compound is much smaller than that of water. Therefore, the temperature matching between the exhaust gas and working fluid in the organic Rankine cycle (ORC) is better than the SRC. Moreover, the positive-displacement expansion engines such as reciprocal piston expander, screw expander, and scroll expander can be used in the ORC system owing to the small volume ratio and enthalpy drop in the expansion process of organic working fluids with the lower critical temperature [8]. The cost of positive-displacement expanders is relatively low, and the expander’s efficiency can be guaranteed under small capacity. Therefore, it is generally acknowledged that the ORC system is suitable for low-moderate temperature and low-moderate capacity sources while the SRC system is more preferred for high temperatures and large capacity sources [9,10].
Performance improvement can be achieved by the modification of the cycle configuration. If the endothermic pressure of the working fluid is raised above the critical temperature, the isothermal evaporation process in RC will no longer exist and the cycle is named trans-critical cycle (TC). The TC shows a better temperature matching between exhaust gas and working fluid hence the heat source can be cooled down to a lower temperature. Although the high pressure ratio is detrimental to the turbine efficiency, organic trans-critical cycle (OTC) still outperforms ORC considering the detrimental effect [11]. Multiple evaporation pressure and flash are other possible options to improve the temperature match between exhaust gas and working fluid, so as to achieve better use of the available heat and smaller exergy loss in the heat absorption process [12,13]. The thermodynamic performance benefits of the modified cycles to the basic RC have been investigated in many studies. However, the comparative research between the modified cycles is rather scarce, especially between the water and organic working fluids.
Wang et al. [14] performed the parameter optimization and exergy analysis of four cycles including steam flash cycle, steam dual-pressure cycle, ORC and Kalina cycle for recovering waste heat from the preheater exhaust and clinker cooler exhaust gases in cement plant. The result showed that the ORC has the lowest exergy efficiency and net power output. Pradeep Varma et al. [15] studied five plants (SRC, steam flash cycle, ORC, organic flash cycle, Kalina cycle) to select the best one that maximizes the power production from the exhaust gas. The organic flash cycle is recommended when the initial temperature of the heat source is 125 °C, while the Kalina cycle is recommended when the source temperature is 360 °C. Andreasen et al. [16] presented a design and off-design performance comparison between the steam dual-pressure cycle and ORC based on two diesel engine waste heat recovery cases. Results indicated that the steam dual-pressure cycle reaches higher net power outputs at high engine loads, while the ORC reaches higher performance at low engine loads when the two cycles are compared based on the same turbine efficiency.
According to the authors’ knowledge, a clear performance comparison among steam flash cycle (SFC), steam dual-pressure cycle (SDC) and OTC have not been reported in the literature. The purpose of this study is to investigate and compare the thermodynamic performance of the SFC, SDC, and OTC based on the exhaust gas waste heat source from the cement industry with a medium temperature and capacity. The effect of parameters on the performance of the cycle is analyzed and the parameter optimization is performed by means of genetic algorithm to maximize the net power output. A three-stage axial turbine is considered for the OTC system and its efficiency is determined by the size parameter of the turbine and the volume ratio of the working fluid [17]. As mentioned above, organic working fluid exhibits the lower specific enthalpy drop than water in the expansion process. Therefore, the organic turbine can be designed with a reduced number of stages and higher efficiency compared with the steam turbine. The steam turbine’s efficiency is evaluated with the correlations described in Ref. [18].

2. Description of the System

2.1. Heat Source Condition

Typical exhaust gas condition from the clinker cooler for a cement kiln line of 5000 t/d capacity is considered in this study [14]. The waste heat is in the form of hot air, and the initial temperature and mass flow rate are 320 °C and 86.2 kg/s. The outlet temperature of the exhaust gas is without restriction since there is no danger of acid dew corrosion.

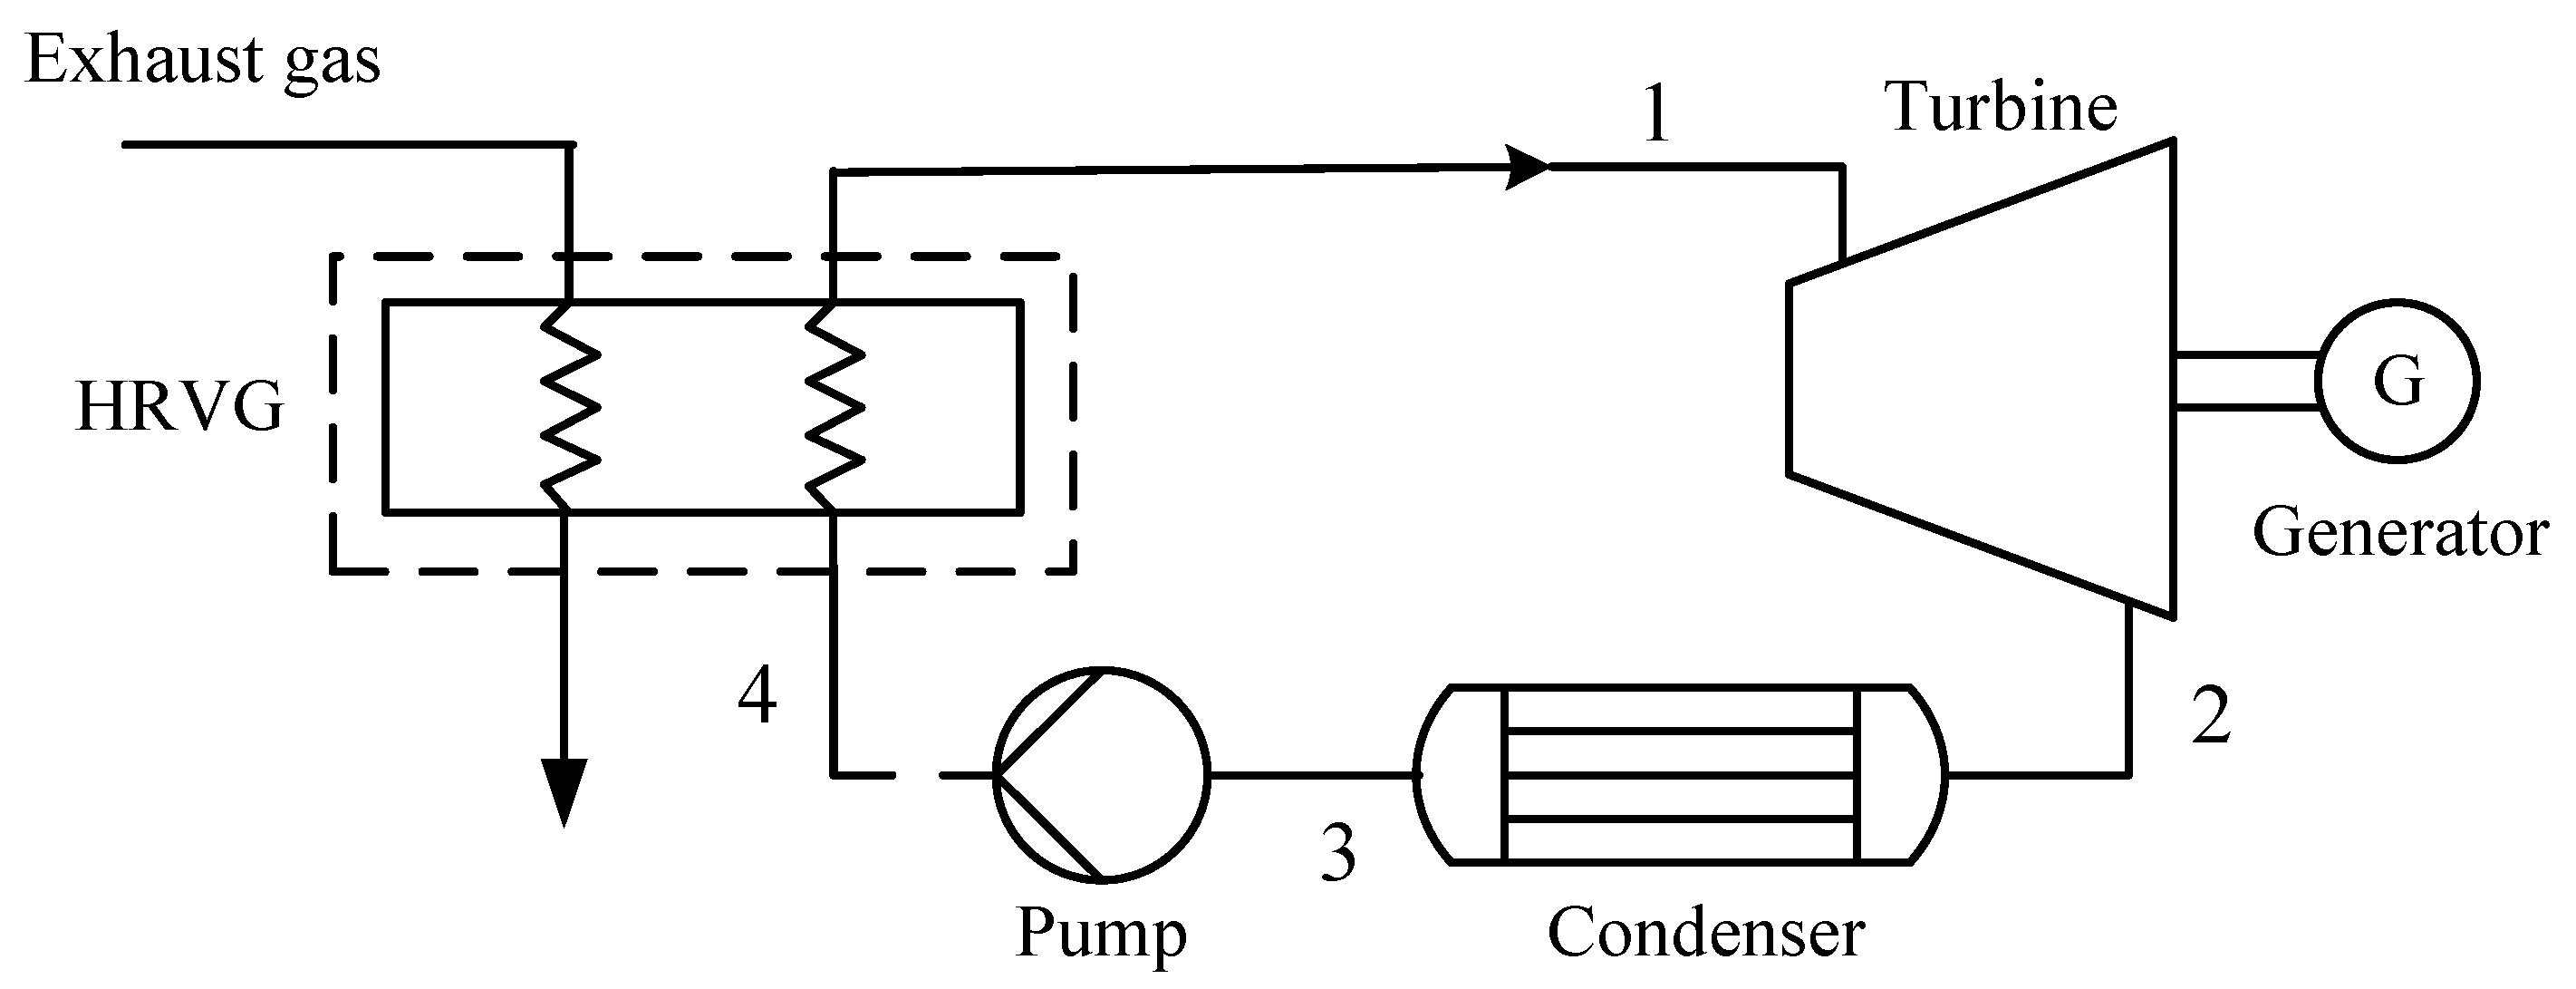
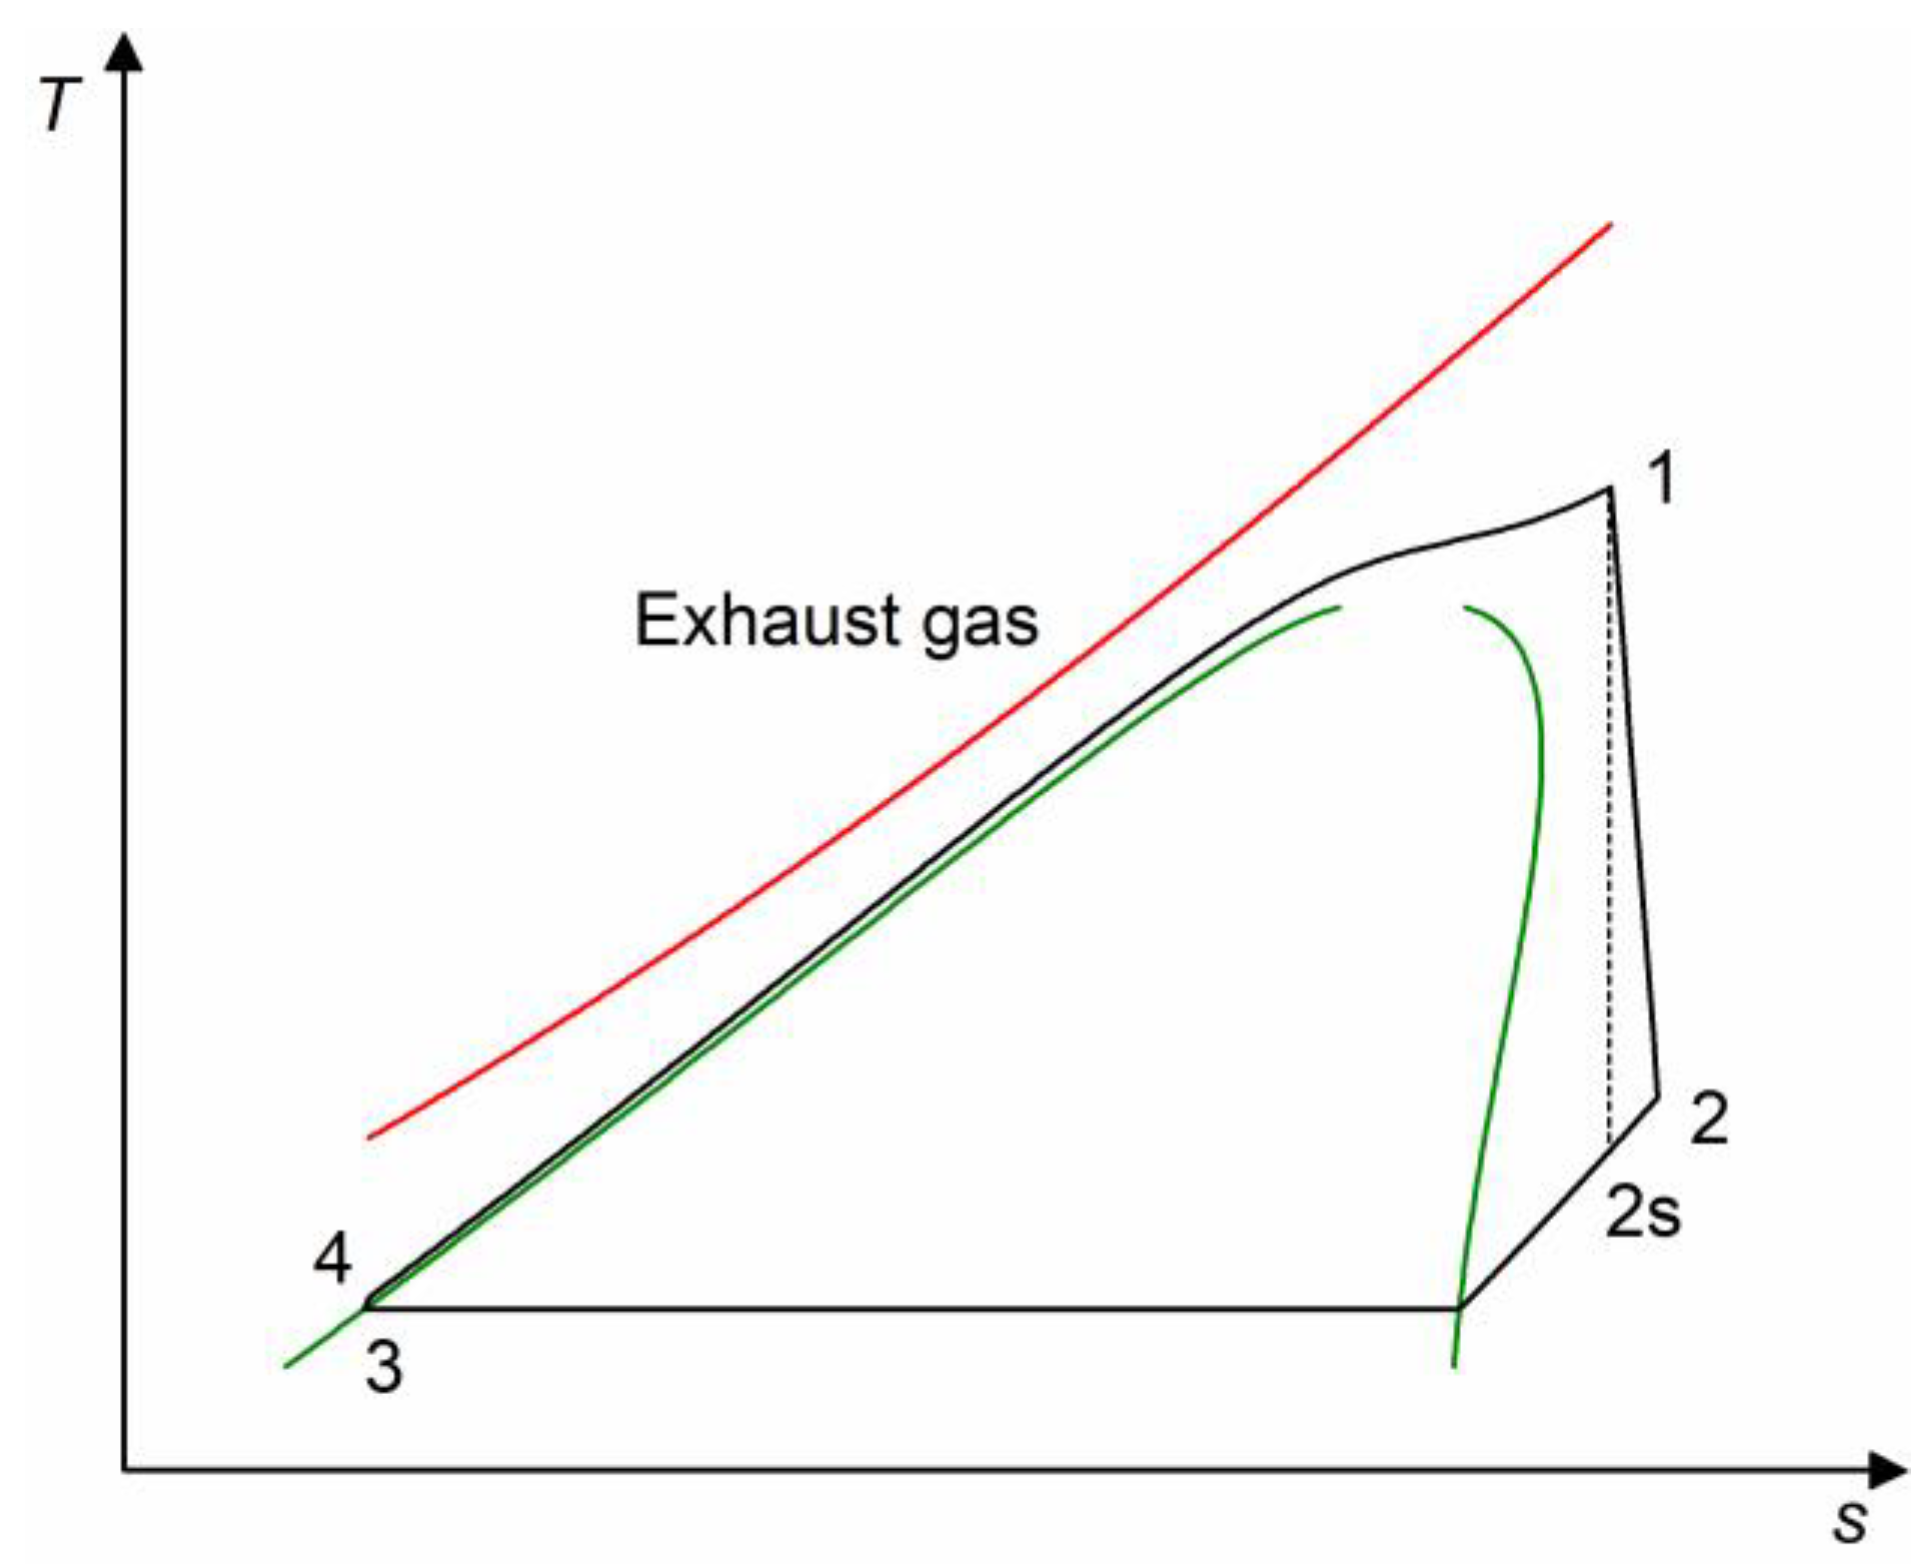
2.2. Organic Trans-Critical Cycle

The schematic diagram of the OTC is shown in Figure 1 and the T-s diagram of the OTC is given in Figure 2. The generated high-pressure and high-temperature vapor in heat recovery vapor generator (HRVG) expands through the turbine to output the power (1–2), and the shaft power is converted into electricity by the generator. The low-pressure vapor exhausted from the turbine is condensed to the saturated liquid by the cooling loop in the condenser (2–3). The saturated liquid at the condenser outlet is pressurized above the critical pressure of the working fluid by the pump (3–4) and then flows into the HRVG to absorb the heat from exhaust gas (4–1) and a new cycle begins.

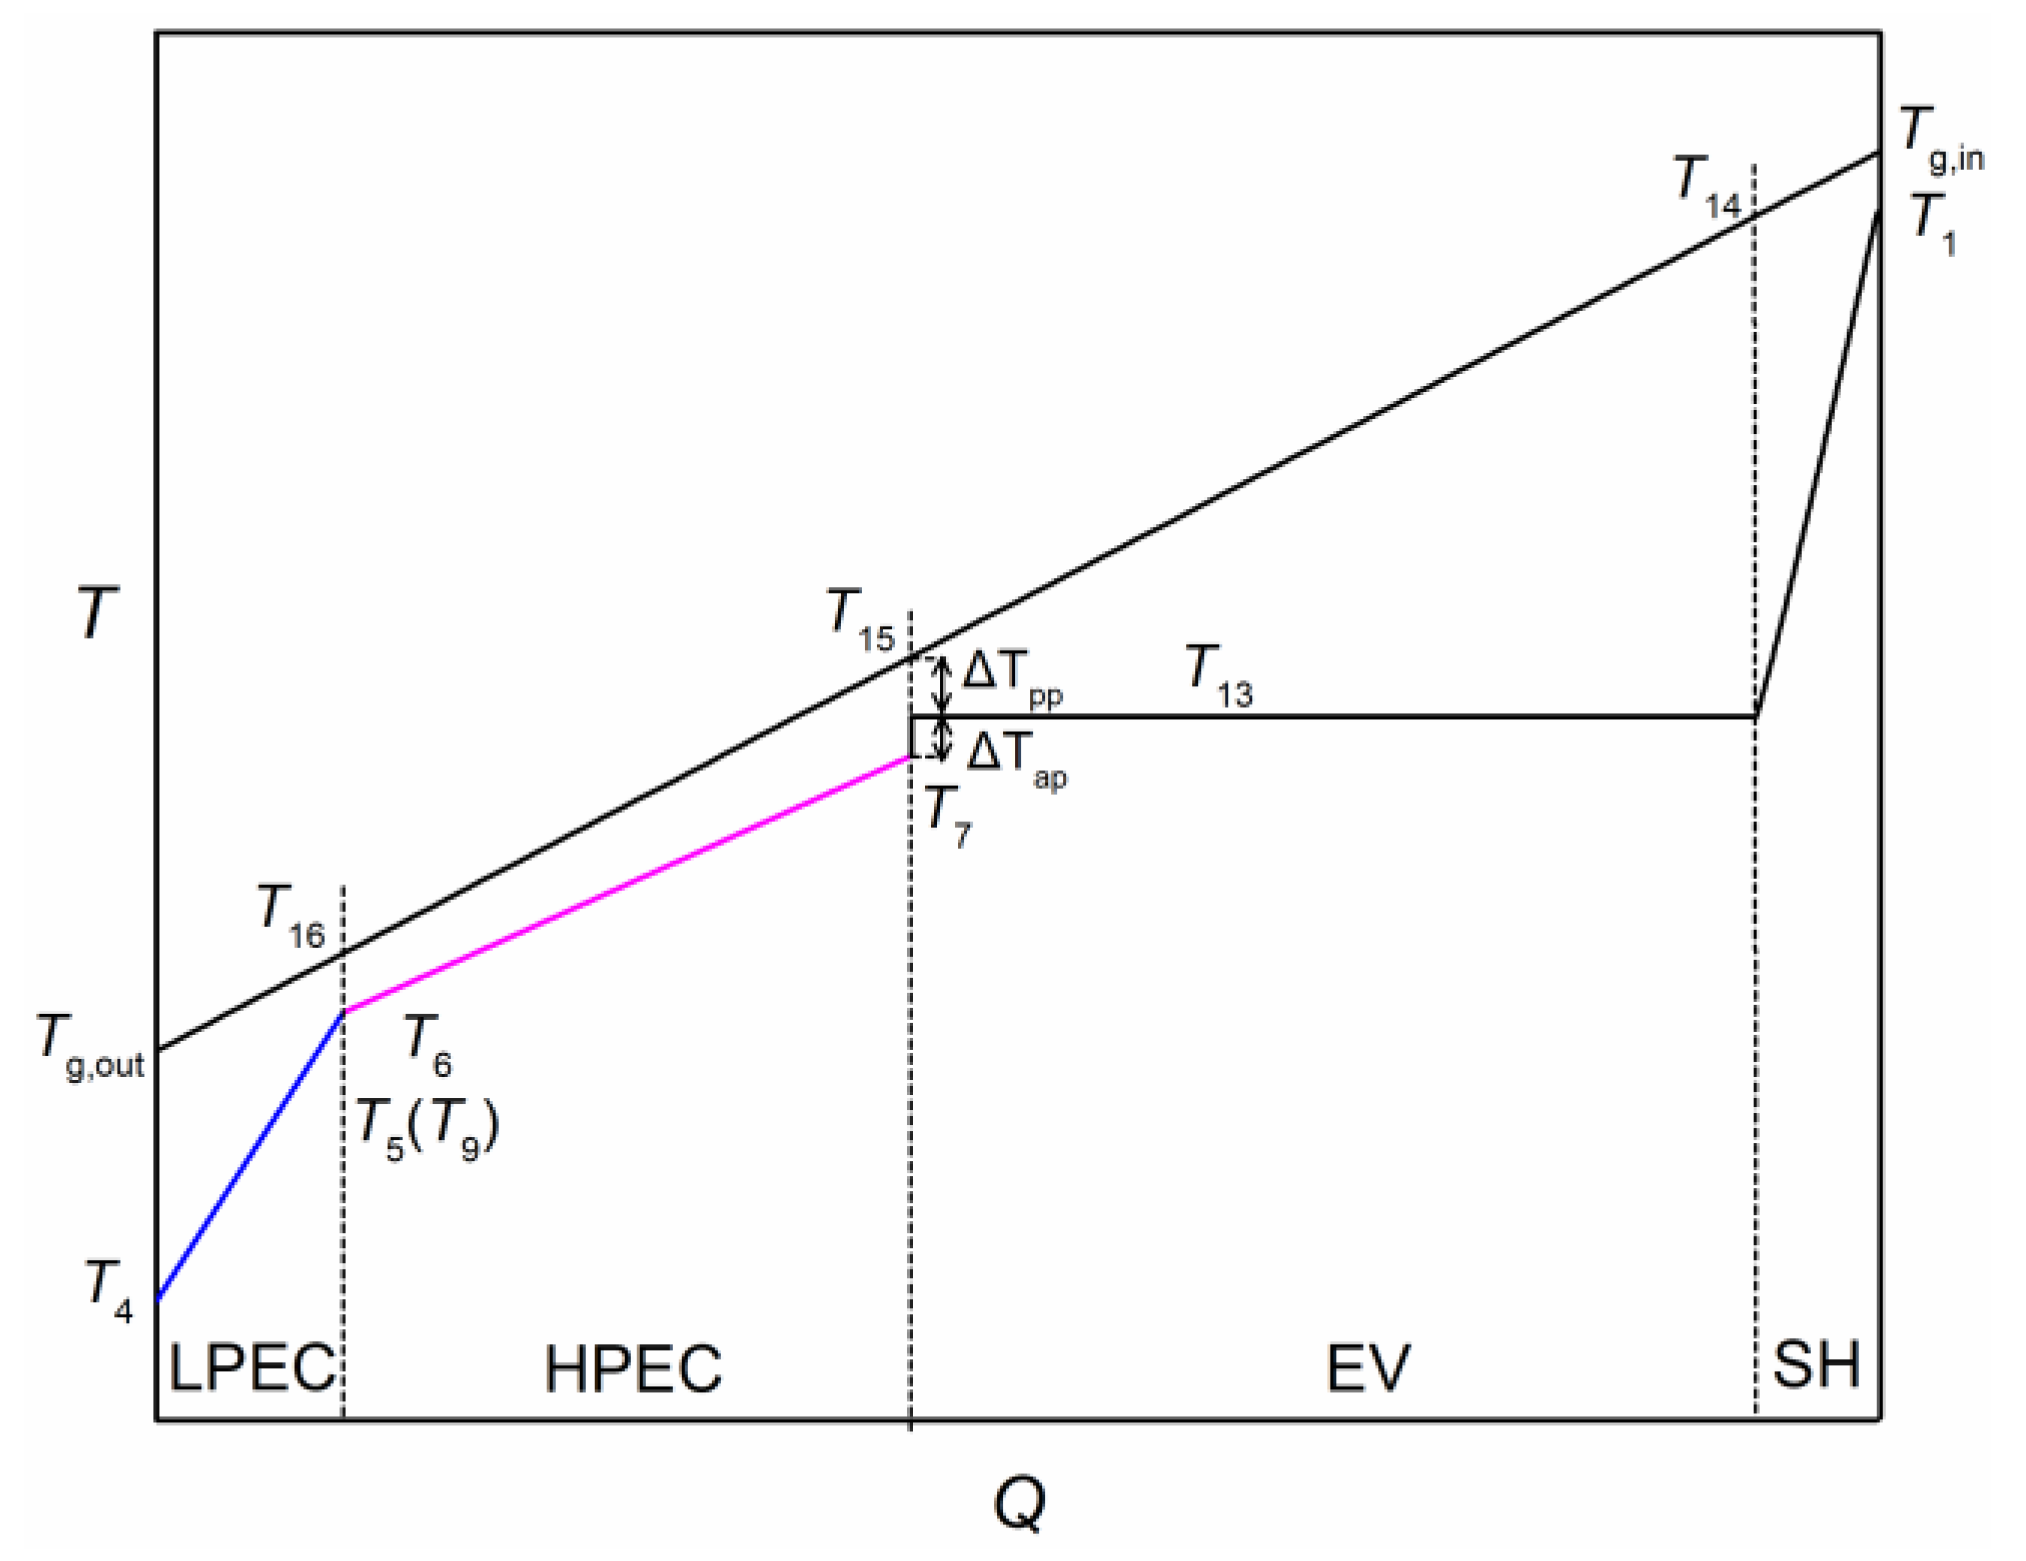
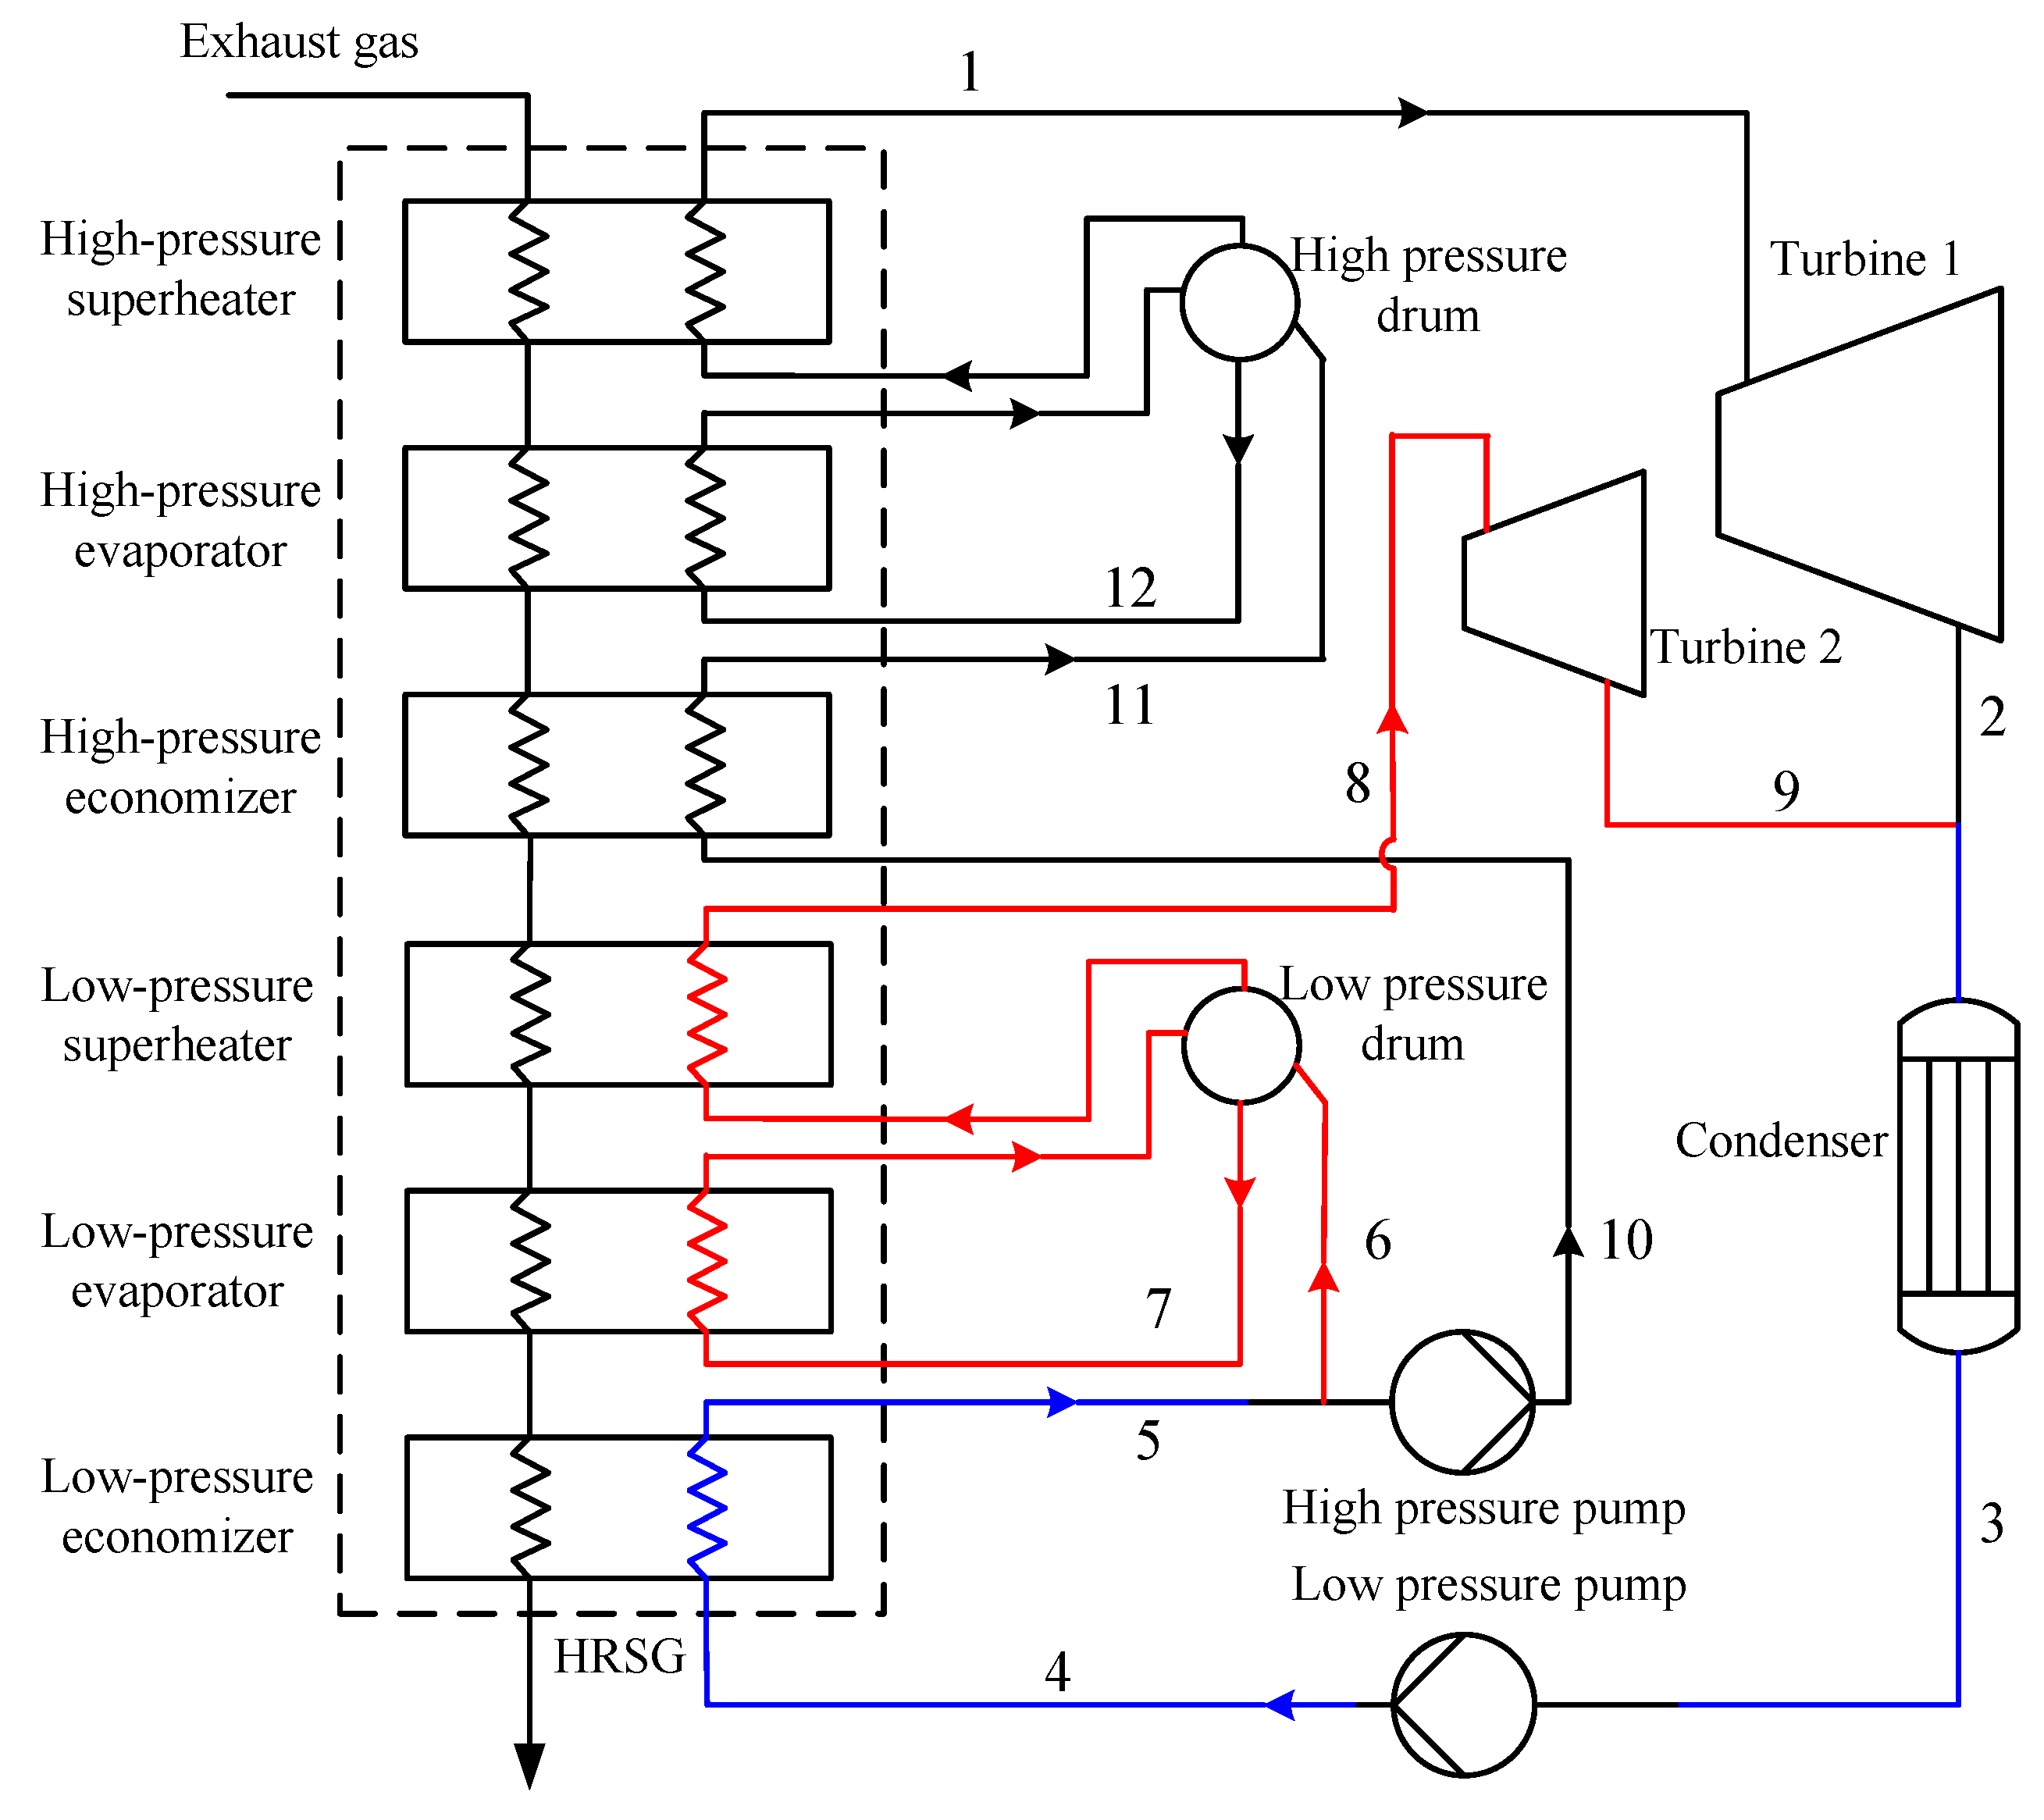
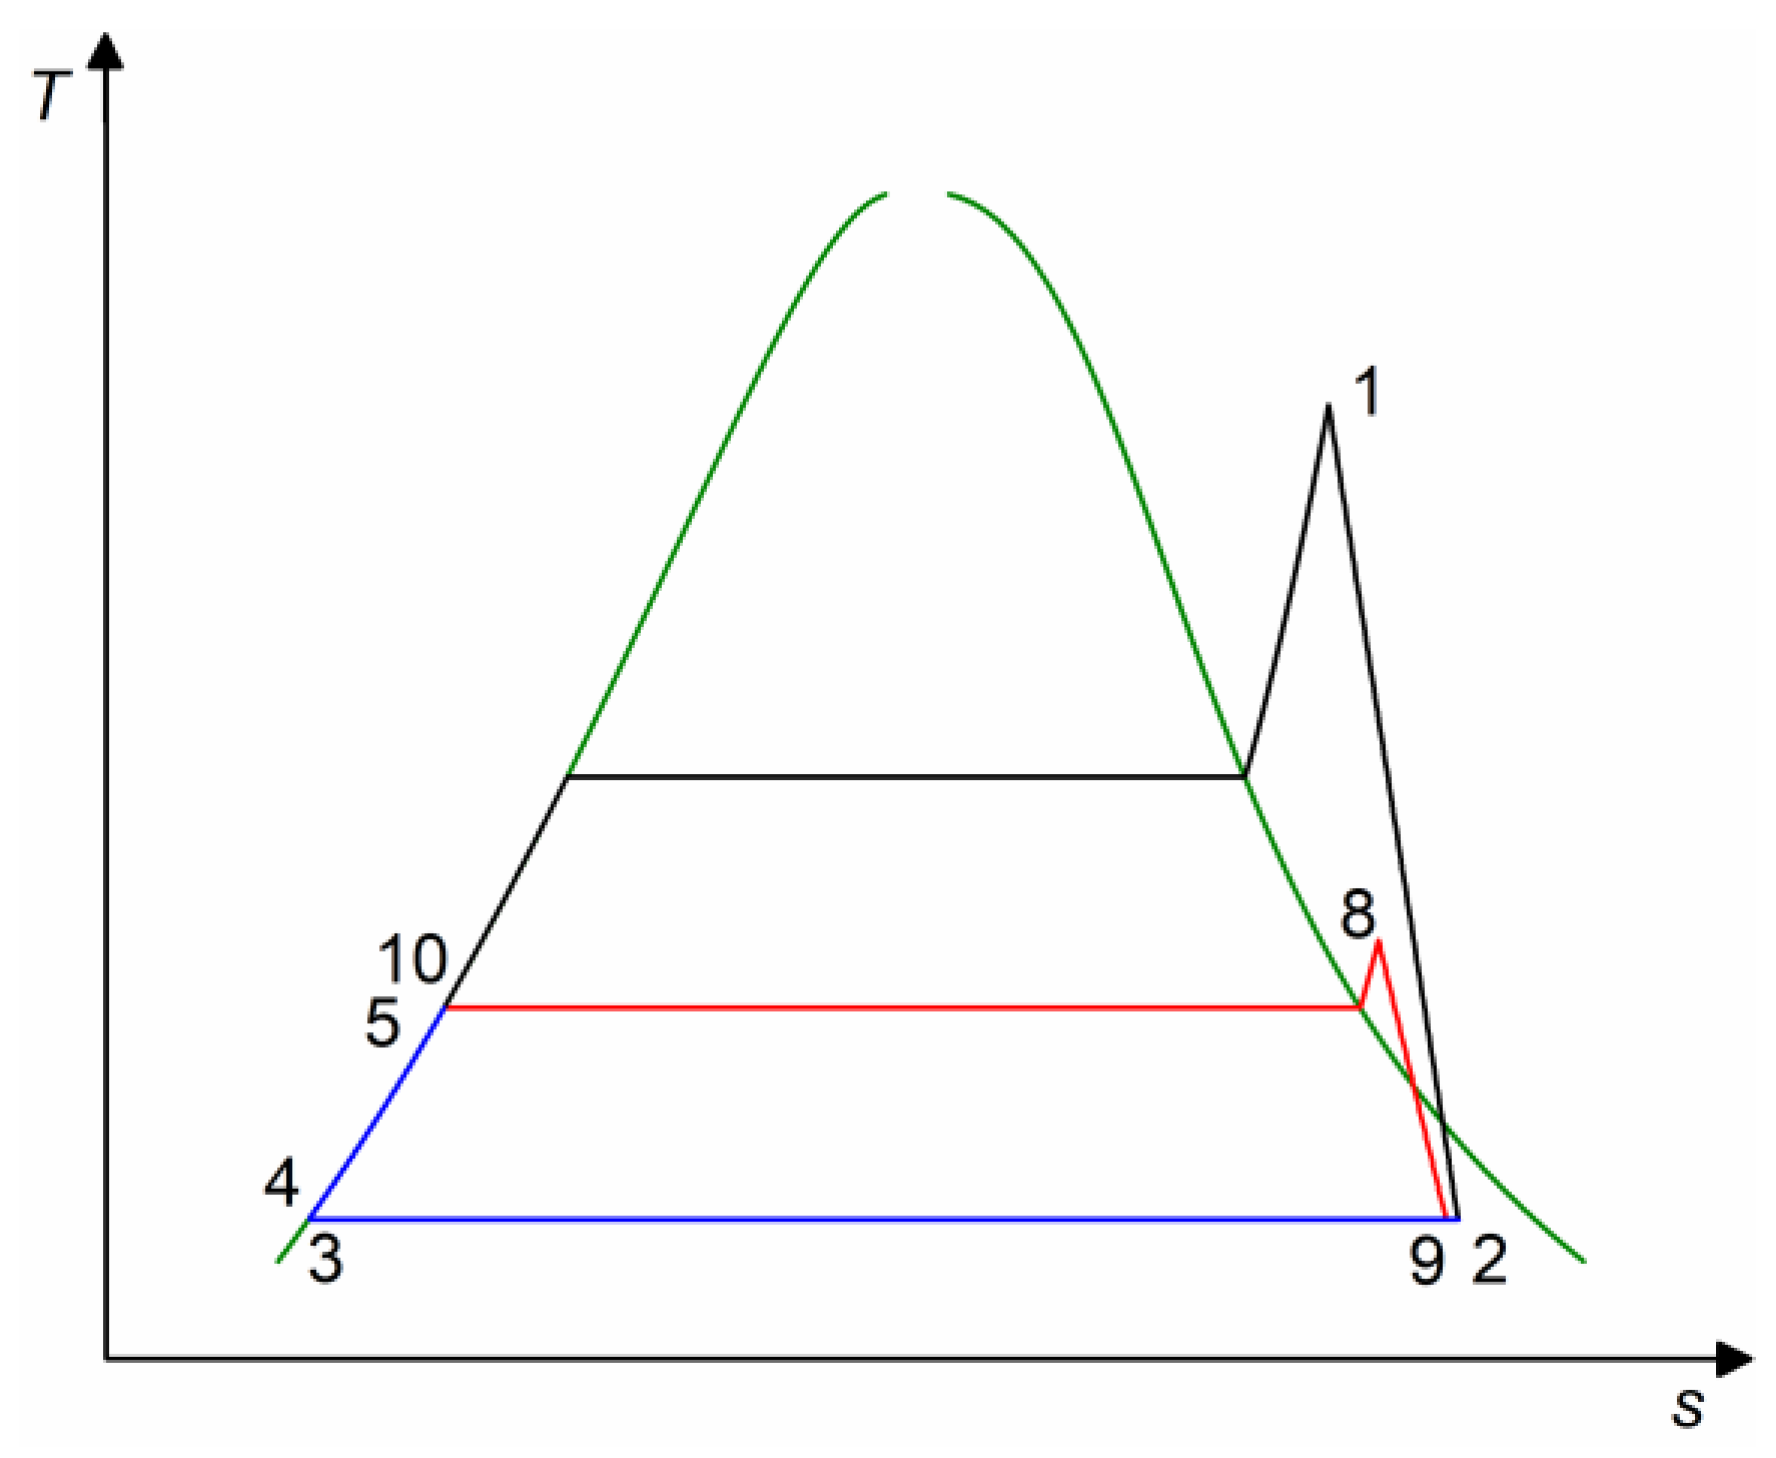
2.3. Steam Flash Cycle

Figure 3 and Figure 4 show the schematic diagram and T-s diagram of the steam flash cycle. In contrast to the basic SRC, A portion of saturated water from the high-pressure economizer expands in the flasher (7–8) into saturated vapor (10) and liquid (9) of lower pressure. The vapor is sent to the turbine 2 to generate power (10–11) and the liquid is mixed with water from low-pressure economizer and reenter the high-pressure economizer (6–7) after being pressurized by the high-pressure pump (5,9–6). The rest of the saturated water from the high-pressure economizer is heated to the superheated vapor by the exhaust gas (12–1) and flows into the turbine 1 to generate power (1–2). The turbine exhausts are condensed in the condenser (2,11–3) and pressurized to the flash pressure by the low-pressure pump (3–4), and then flows through the low-pressure economizer to absorb heat to the state of saturated liquid (4–5) and a new cycle begins.
Figure 5 reveals the T-Q diagram of exhaust gas and working fluid in the heat recovery steam generator (HRSG) of the SFC. To avoid the vapor generation in the high-pressure economizer, the temperature of the fluid at the outlet of the economizer is lower than the evaporation temperature, and the temperature difference is named approach temperature difference. The minimum temperature difference in the process of heat exchange between the exhaust gas and working fluid is called the pinch point temperature difference, which usually occurs at the saturated liquid point of working fluid.

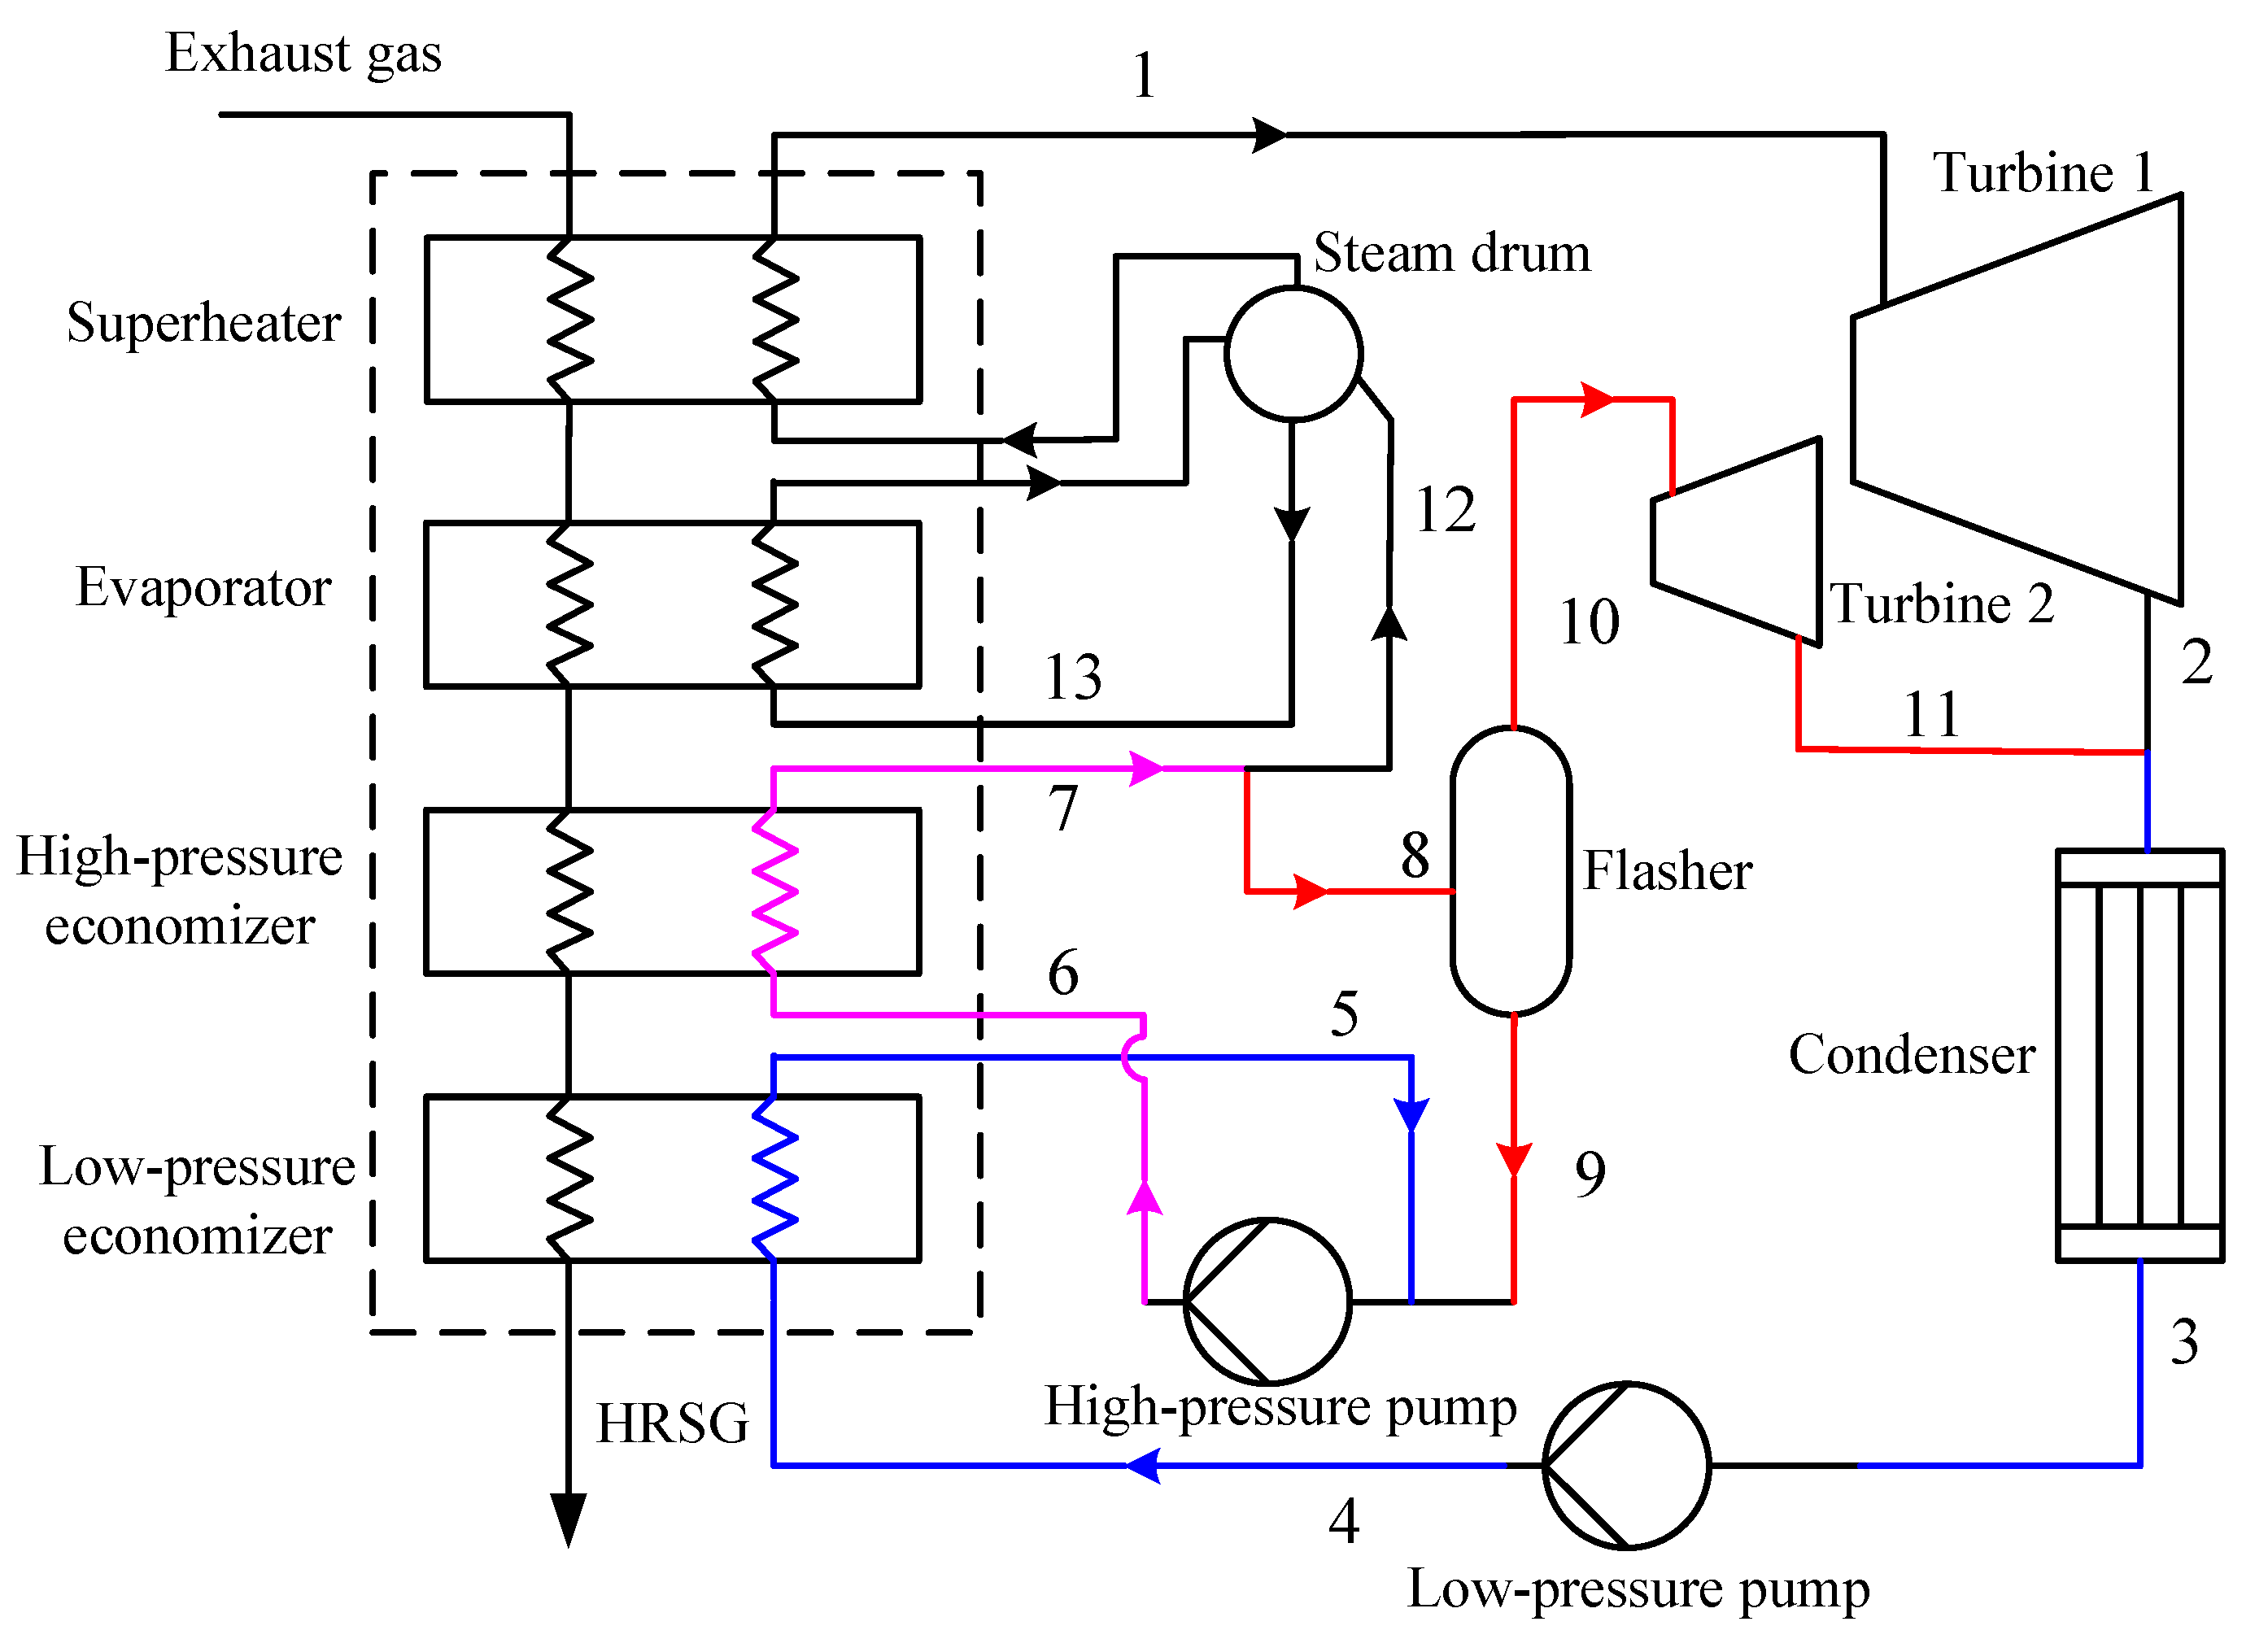
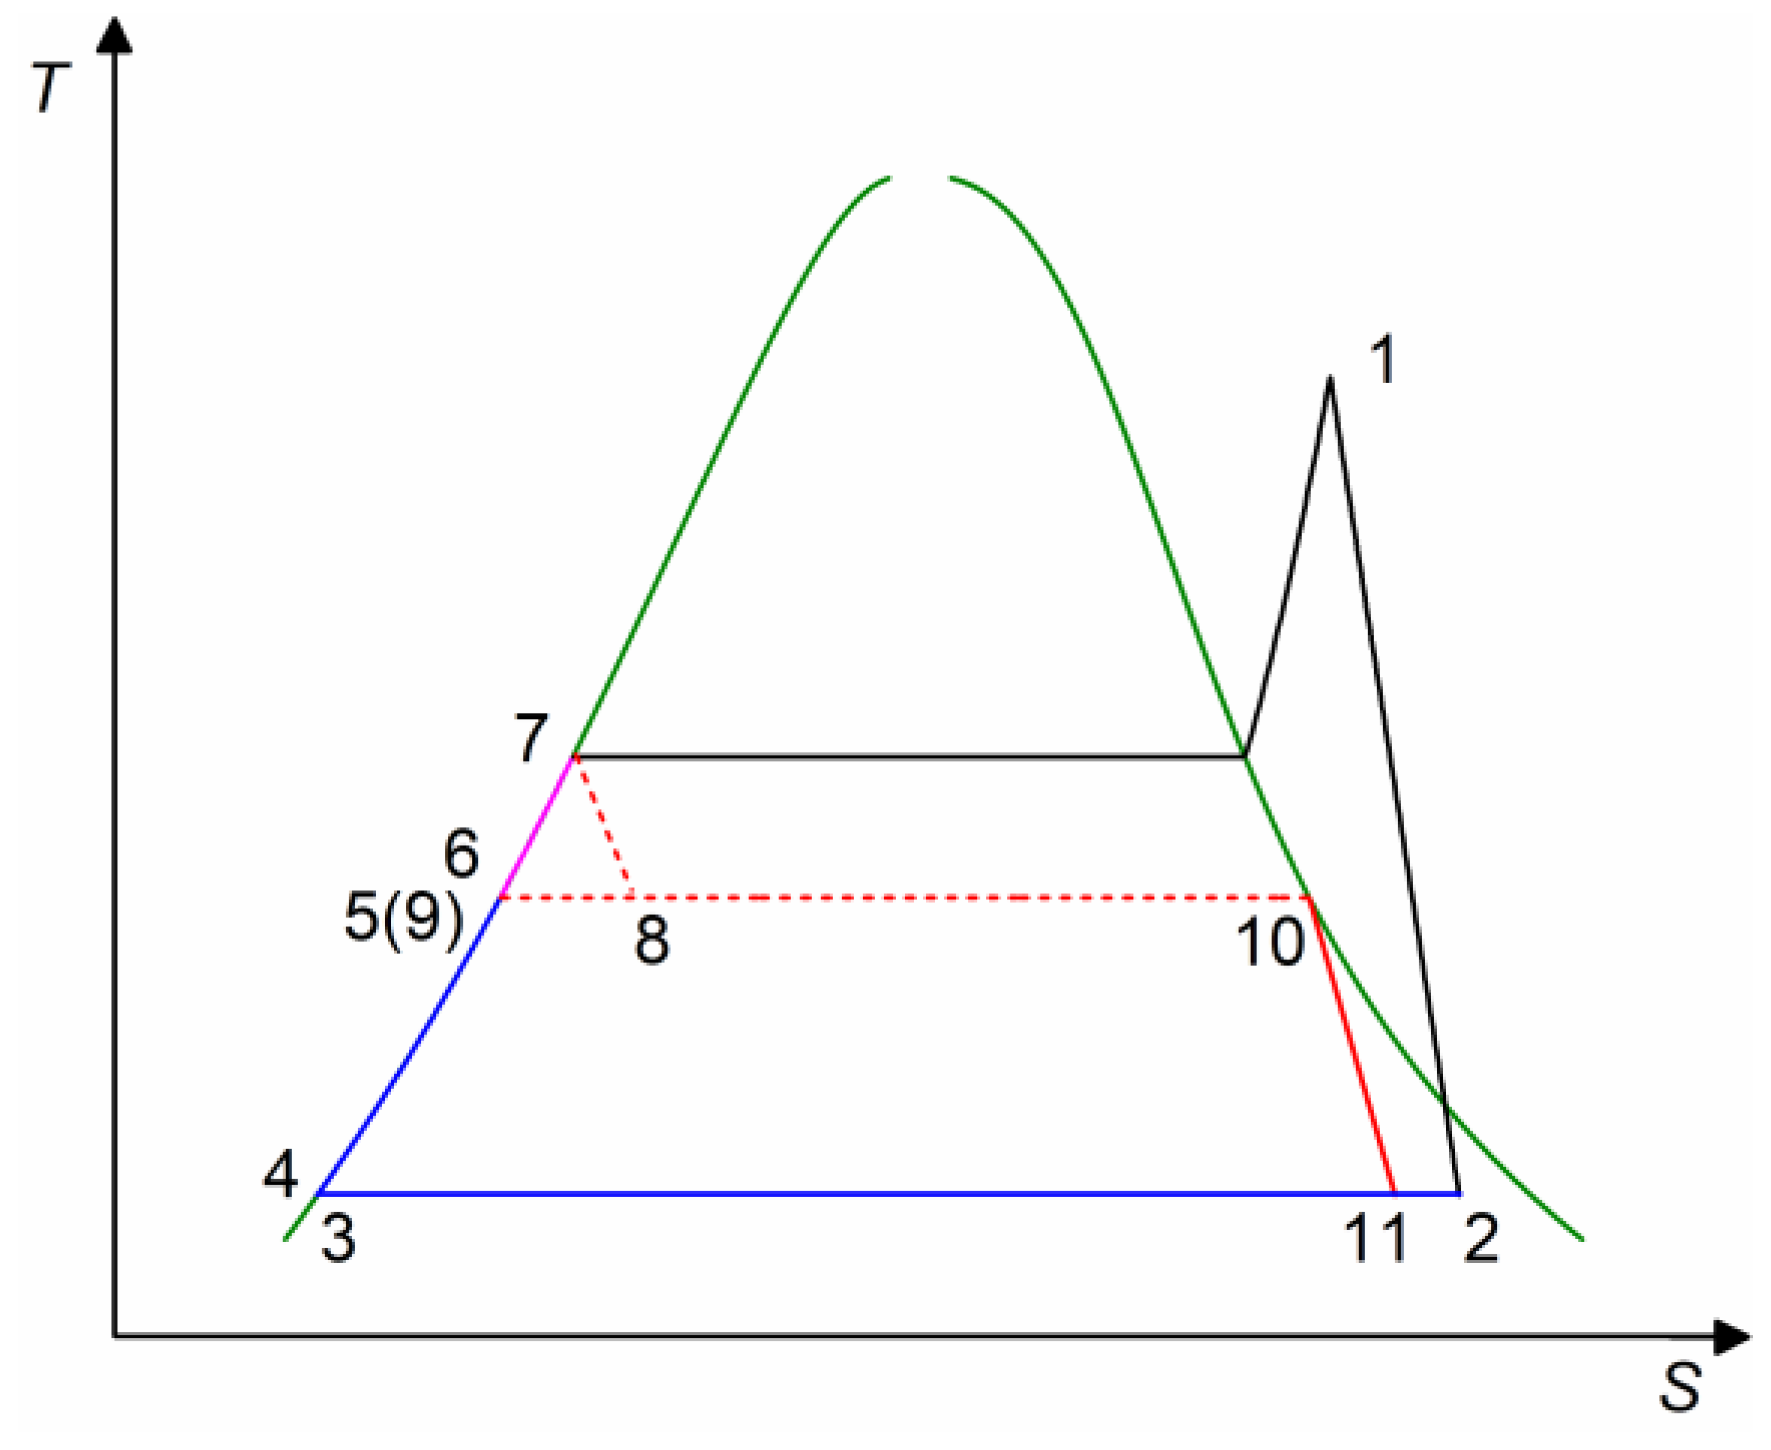
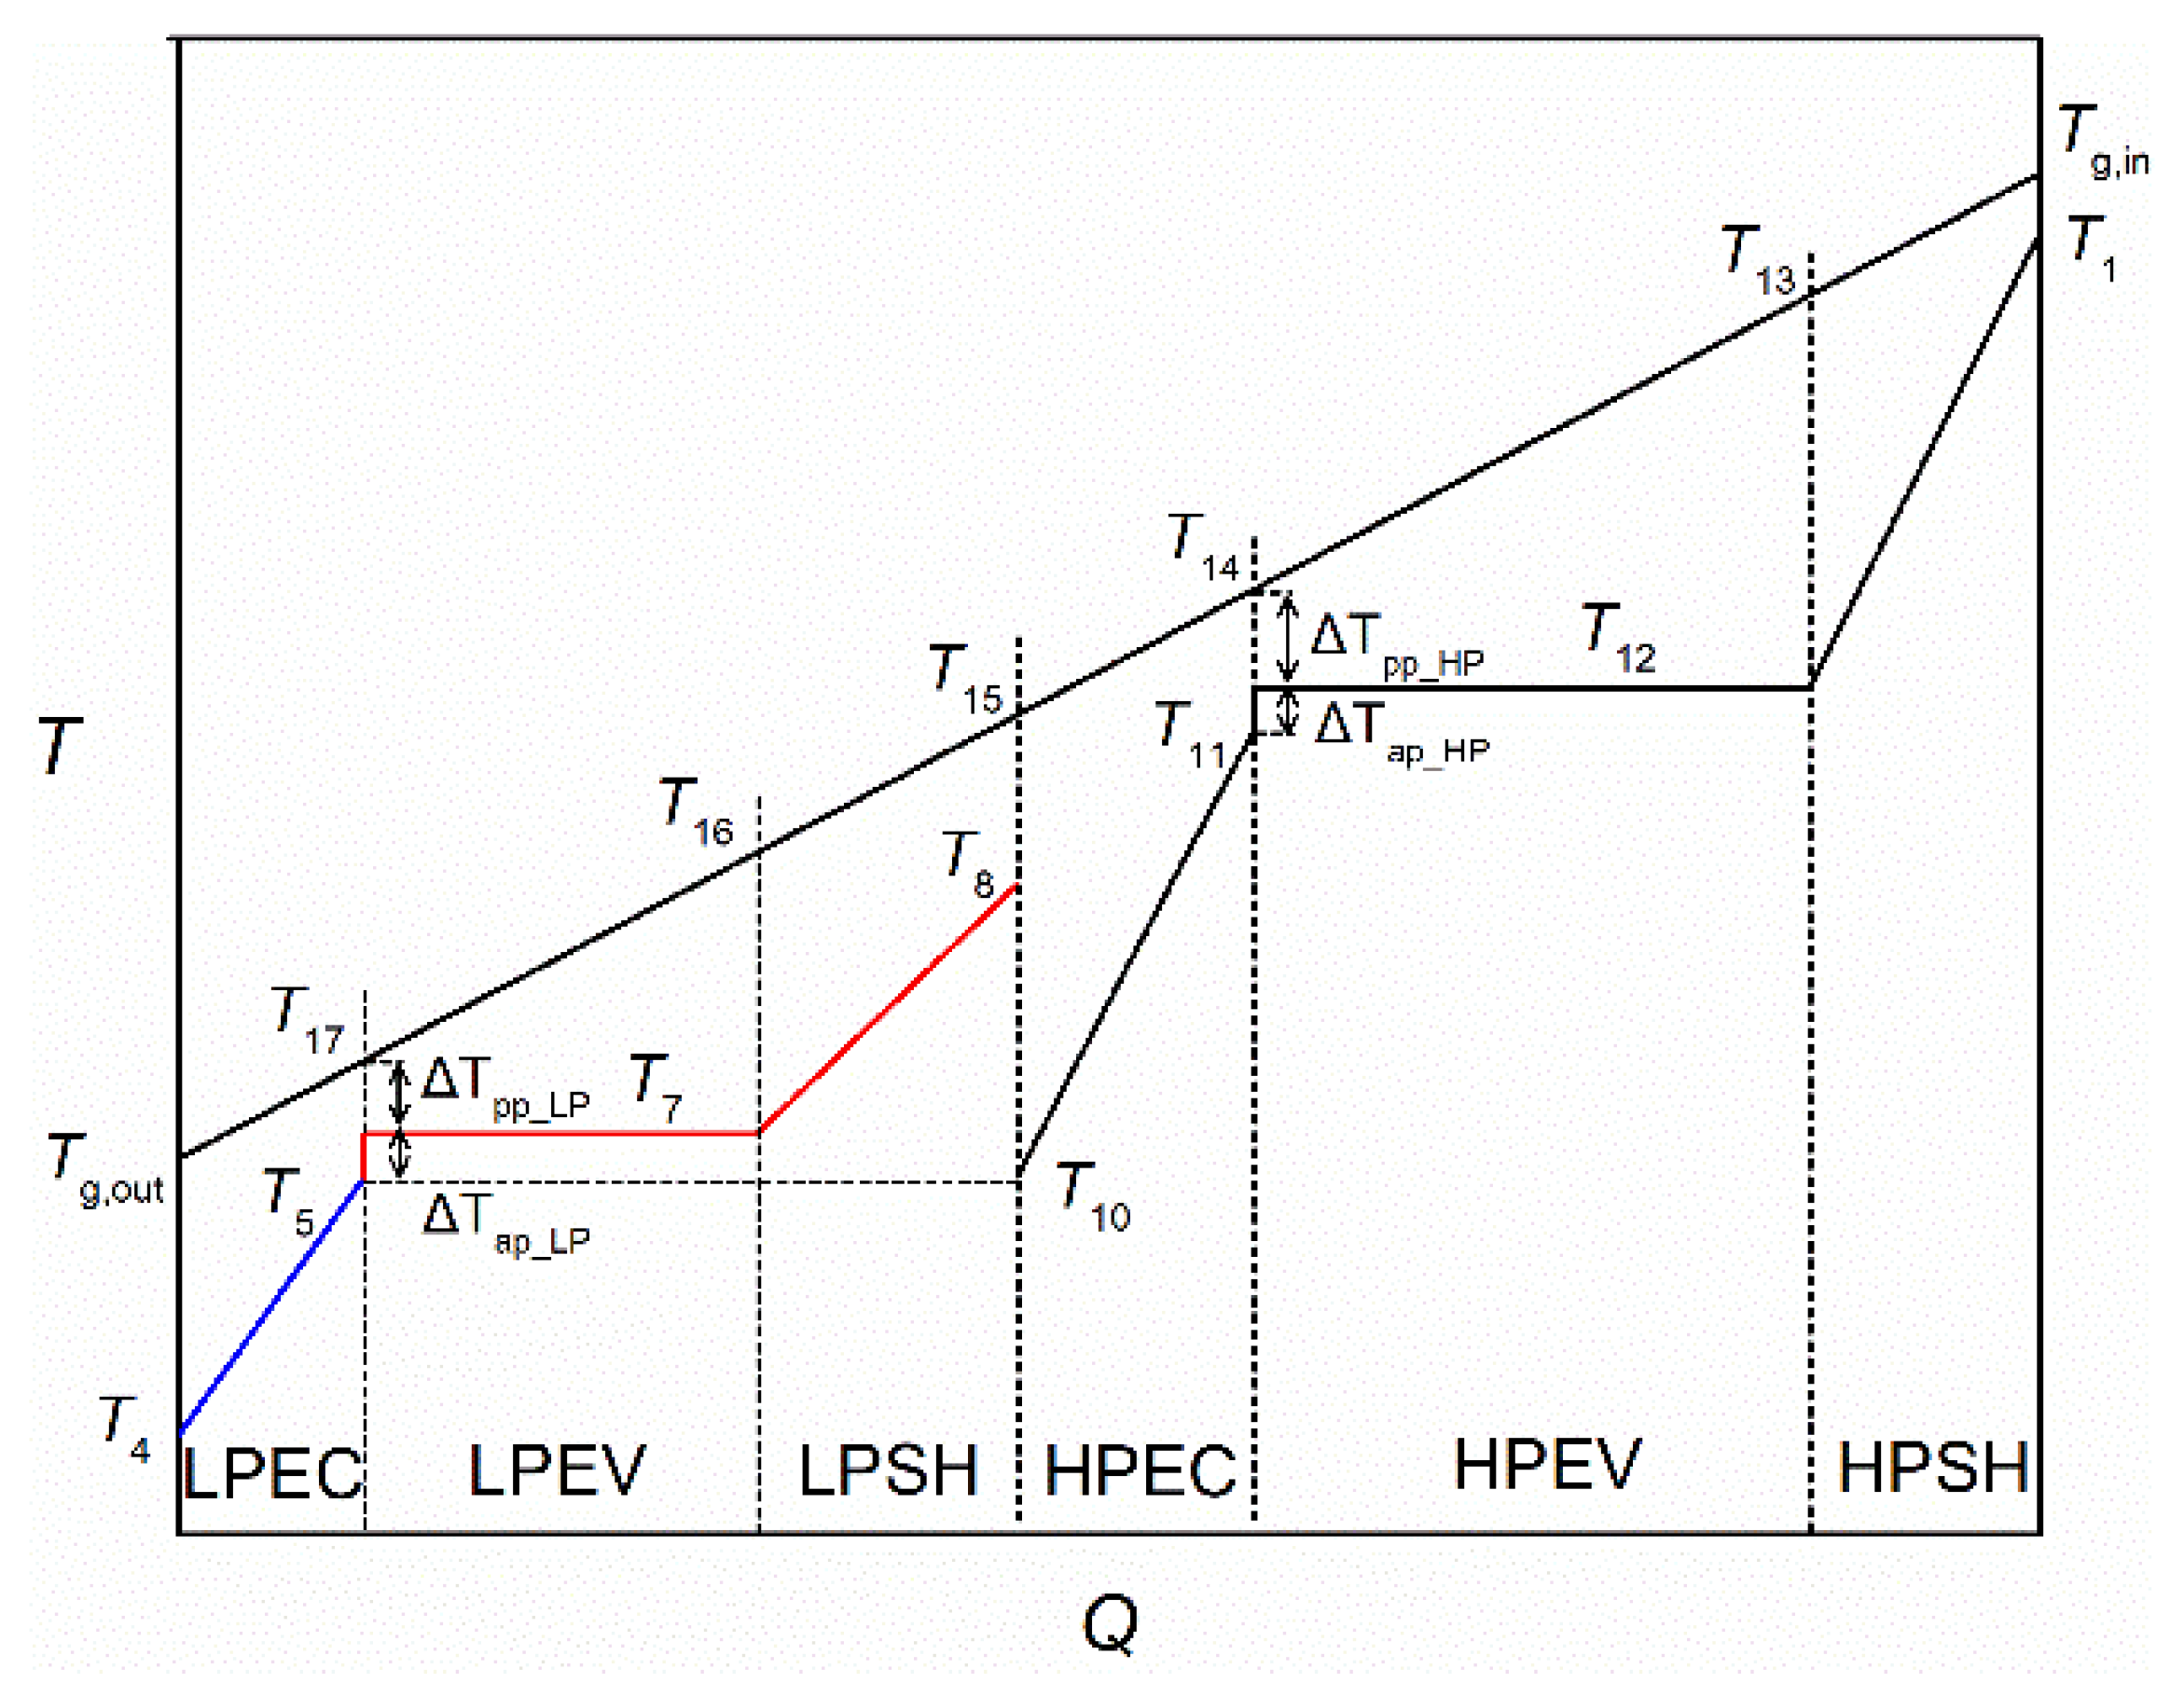
2.4. Steam Dual-Pressure Cycle

Figure 6 and Figure 7 are the schematic diagram and T-s diagram of the steam dual-pressure cycle. The T-Q diagram of exhaust gas and working fluid in the HRSG is shown in Figure 8. The layout of the heat exchangers has significant effects in the performance of the HRSG [19]. In view of maximizing the amount of waste heat recovered from the exhaust gas, the layout considered in this study is as depicted in Figure 6. Water leaving the low-pressure economizer is divided into two streams. One stream enters the low-pressure drum (5–6), and another stream is pumped to the high-pressure economizer (5–10). High-pressure stream and low-pressure stream successively absorb the heat of exhaust gas (10–1, 6–8), and the generated high-pressure vapor and low-pressure vapor enter the steam turbine 1 and turbine 2 respectively (1–2, 8–9). The turbine exhausts enter the condenser together to release heat (2,9–3). The water in the saturated liquid state at the outlet of the condenser is pumped by the low-pressure pump (3–4) and sent to the low-pressure economizer (4–5) to complete the cycle.

3. Methodology

3.1. Thermodynamic Modeling

In the present study, the parameters are optimized with the objective of maximizing the net power output of the system, and the exergy analysis is also performed since it can tell us in which process the available energy is dissipated and show the direction for the enhancement of system performance. The energy and exergy analysis are based on the first and second laws of thermodynamics, respectively. For simplicity, the system is considered in a steady state. The heat loss and pressure drop in the heat exchangers and pipes are ignored, and the variation of the kinetic and potential energy of working fluid in each component can also be ignored.
The energy equation in each component can be described as:
Q ˙ = m ˙ i n h i n m ˙ o u t h o u t + W ˙
where m ˙ and h are the mass flow rate and enthalpy of the streams; the subscript in and out refer to streams entering and leaving the component; i n and o u t refer to the heat addition capacity and work output of the process. Q ˙ and W ˙ refer to the heat addition capacity and work output of the process.
The exergy of the steady flow stream is the maximum amount of useful work that can be obtained in the process of stream changing from the given state to the environmental equilibrium state in a reversible way. The specific exergy of a stream can be given as:
e x = h h 0 T 0 ( s s 0 )
where h and s are the enthalpy and entropy of the stream; T0 refers to the ambient temperature; h 0 and s 0 are the enthalpy and entropy of the stream under ambient condition.
The exergy loss in each component can be calculated as:
I ˙ = m ˙ i n e x , i n m ˙ o u t e x , o u t W ˙
For the waste heat recovery system, the exergy balance equation is:
E ˙ x , g = I ˙ t o t + W ˙ n e t
where I ˙ t o t is the total exergy loss of all components in the system; W ˙ n e t is the net power output of the system. E ˙ x , g refers to the exergy contained in the heat released from the exhaust gas to the system, which can be calculated as follows:
E ˙ x , g = m ˙ g [ h g , i n h g , o u t T 0 ( s g , i n s g , o u t ) ]
where m ˙ g is the mass flow rate of the exhaust gas; h g , i n and h g , o u t are the enthalpy of exhaust gas entering and leaving the HRVG/HRSG; s g , i n and s g , o u t are the entropy of exhaust gas entering and leaving the HRVG/HRSG.
The exhaust gas is directly discharged to the environment at a temperature higher than the ambient temperature after releasing heat to the system, and the exergy loss caused by this process is as follows:
I ˙ g a s = m ˙ g [ h g , o u t h g , 0 T 0 ( s g , o u t s g , 0 ) ]
The thermal efficiency and exergy efficiency of the system are defined as:
η t h = W ˙ n e t m ˙ g ( h g , i n h g , o u t )
η e = W ˙ n e t E ˙ x , g
The mass and energy balance equations and exergy loss in each component of OTC, SFC, and SDC systems are listed in Table 1. The number subscript corresponds to the state point in Figure 1 and Figure 2 for the OTC, Figure 3, Figure 4 and Figure 5 for the SFC and Figure 6, Figure 7 and Figure 8 for the SDC.

3.2. Organic Working Fluid Selection

Li et al. [20] indicated that working fluids with critical temperatures slightly lower (40–60 °C) than the initial temperature of the heat source will achieve higher net power output for the OTC driven by waste heat. The conclusion is based on the assumption that the isentropic expansion efficiency of all working fluids is 0.8, whereas the fact is that the fluid with the high critical temperature usually shows low condensing pressure and high volume ratio, which will result in a sharp efficiency drop of the turbine [17,21]. In addition to the thermodynamic performance, some other characteristics of the working fluid such as environmental characteristics, toxicity, corrosiveness, and thermal stability should also be evaluated. Four pure organic fluids, R245fa, n-pentane, cyclopentane, and hexamethyldisiloxane (MM), which have been widely used in commercial ORC installations [22], are selected as the working fluid for OTC in the present study. All the studied fluids are dry or isentropic fluids, and they are hydrofluorocarbon (HFC), alkane, hydrocarbon, and siloxane, respectively. Table 2 lists the major thermophysical properties of the fluids.

3.3. Optimization Variables and Specified Parameters

The turbine inlet pressure and temperature are selected as the optimization variables for the OTC. The turbine inlet pressure and temperature, flash pressure and the mass flow ratio of the flash stream to the main stream are optimized for the SFC. The variables chosen for optimizing the SDC are the turbine inlet pressure and temperature of the main steam, turbine inlet pressure, and temperature of the low-pressure steam. The boundaries of each variable for OTC, SFC, and SDC are listed in Table 3. The system may become unsteady near the critical region since the small fluctuations of temperature result in a greater pressure variation. Hence the lower limit of turbine inlet pressure for OTC and the upper limit of turbine inlet pressure for SFC and SDC are set as 1.1Pc and 0.9Pc, respectively. For the OTC, the expansion process cannot pass through the two-phase region; for the SFC and SDC, the vapor quality of the steam exiting turbine should be higher than the minimum allowable value to alleviate the cavitation of turbine blades, which is set as 0.88 in the present study.
Table 4 details the specified parameters of the OTC, SFC, and SDC systems. The turbine efficiency is computed based on the operation parameters by using the correlations presented in Ref. [17,18]. For the organic axial turbine, the isentropic efficiency is determined by the size parameter (SP), volume ratio (Vr), specific speed (Ns) and the number of stages.
S P = V o u t , i s 0.5 Δ h i s 0.25 V r = V o u t , i s V i n N s = R P M 60 V o u t , i s 0.5 Δ h i s 0.75
Higher SP and smaller Vr are beneficial to reduce the leakage and secondary losses and the Mach number in the nozzle, thus making the turbine more efficient. In operation, the specific speed can be optimized by adjusting the turbine’s revolutions per minute (RPM). Considering the turbine efficiency and the equipment complexity, a three-stage axial turbine is adopted for the OTC system.
For the steam turbine, the isentropic efficiency is the function of the turbine rating and rated speed, and the steam inlet superheat and pressure. The steam turbine with the higher rating, the lower rated speed, the lower steam inlet pressure, and the greater steam inlet superheat will achieve higher efficiency.

3.4. Optimization Strategy

The parameter optimization is performed based on the MATLAB platform by employing the genetic algorithm (GA). The thermodynamic properties of the working fluids and the exhaust gas are calculated based on REFPROP NIST 9.0 [27]. The GA is a stochastic global search method that simulates natural biological evolution, and it is suitable for the highly nonlinear or discrete problem since it involves a search for many individuals distributed within the domain rather than a single point. The GA is a conventional optimization algorithm and its specific operations such as initialization of population, calculation of fitness, crossover, and mutation will not be described here. For improving the computational efficiency, the population is divided into several subpopulations. The individual migration between the subpopulations can accelerate the convergence process since the different subpopulations may have different evolutionary trends. The control parameters in GA are shown in Table 5, which can reach a good trade-off between algorithm accuracy and computational time.

4. Results and Discussion

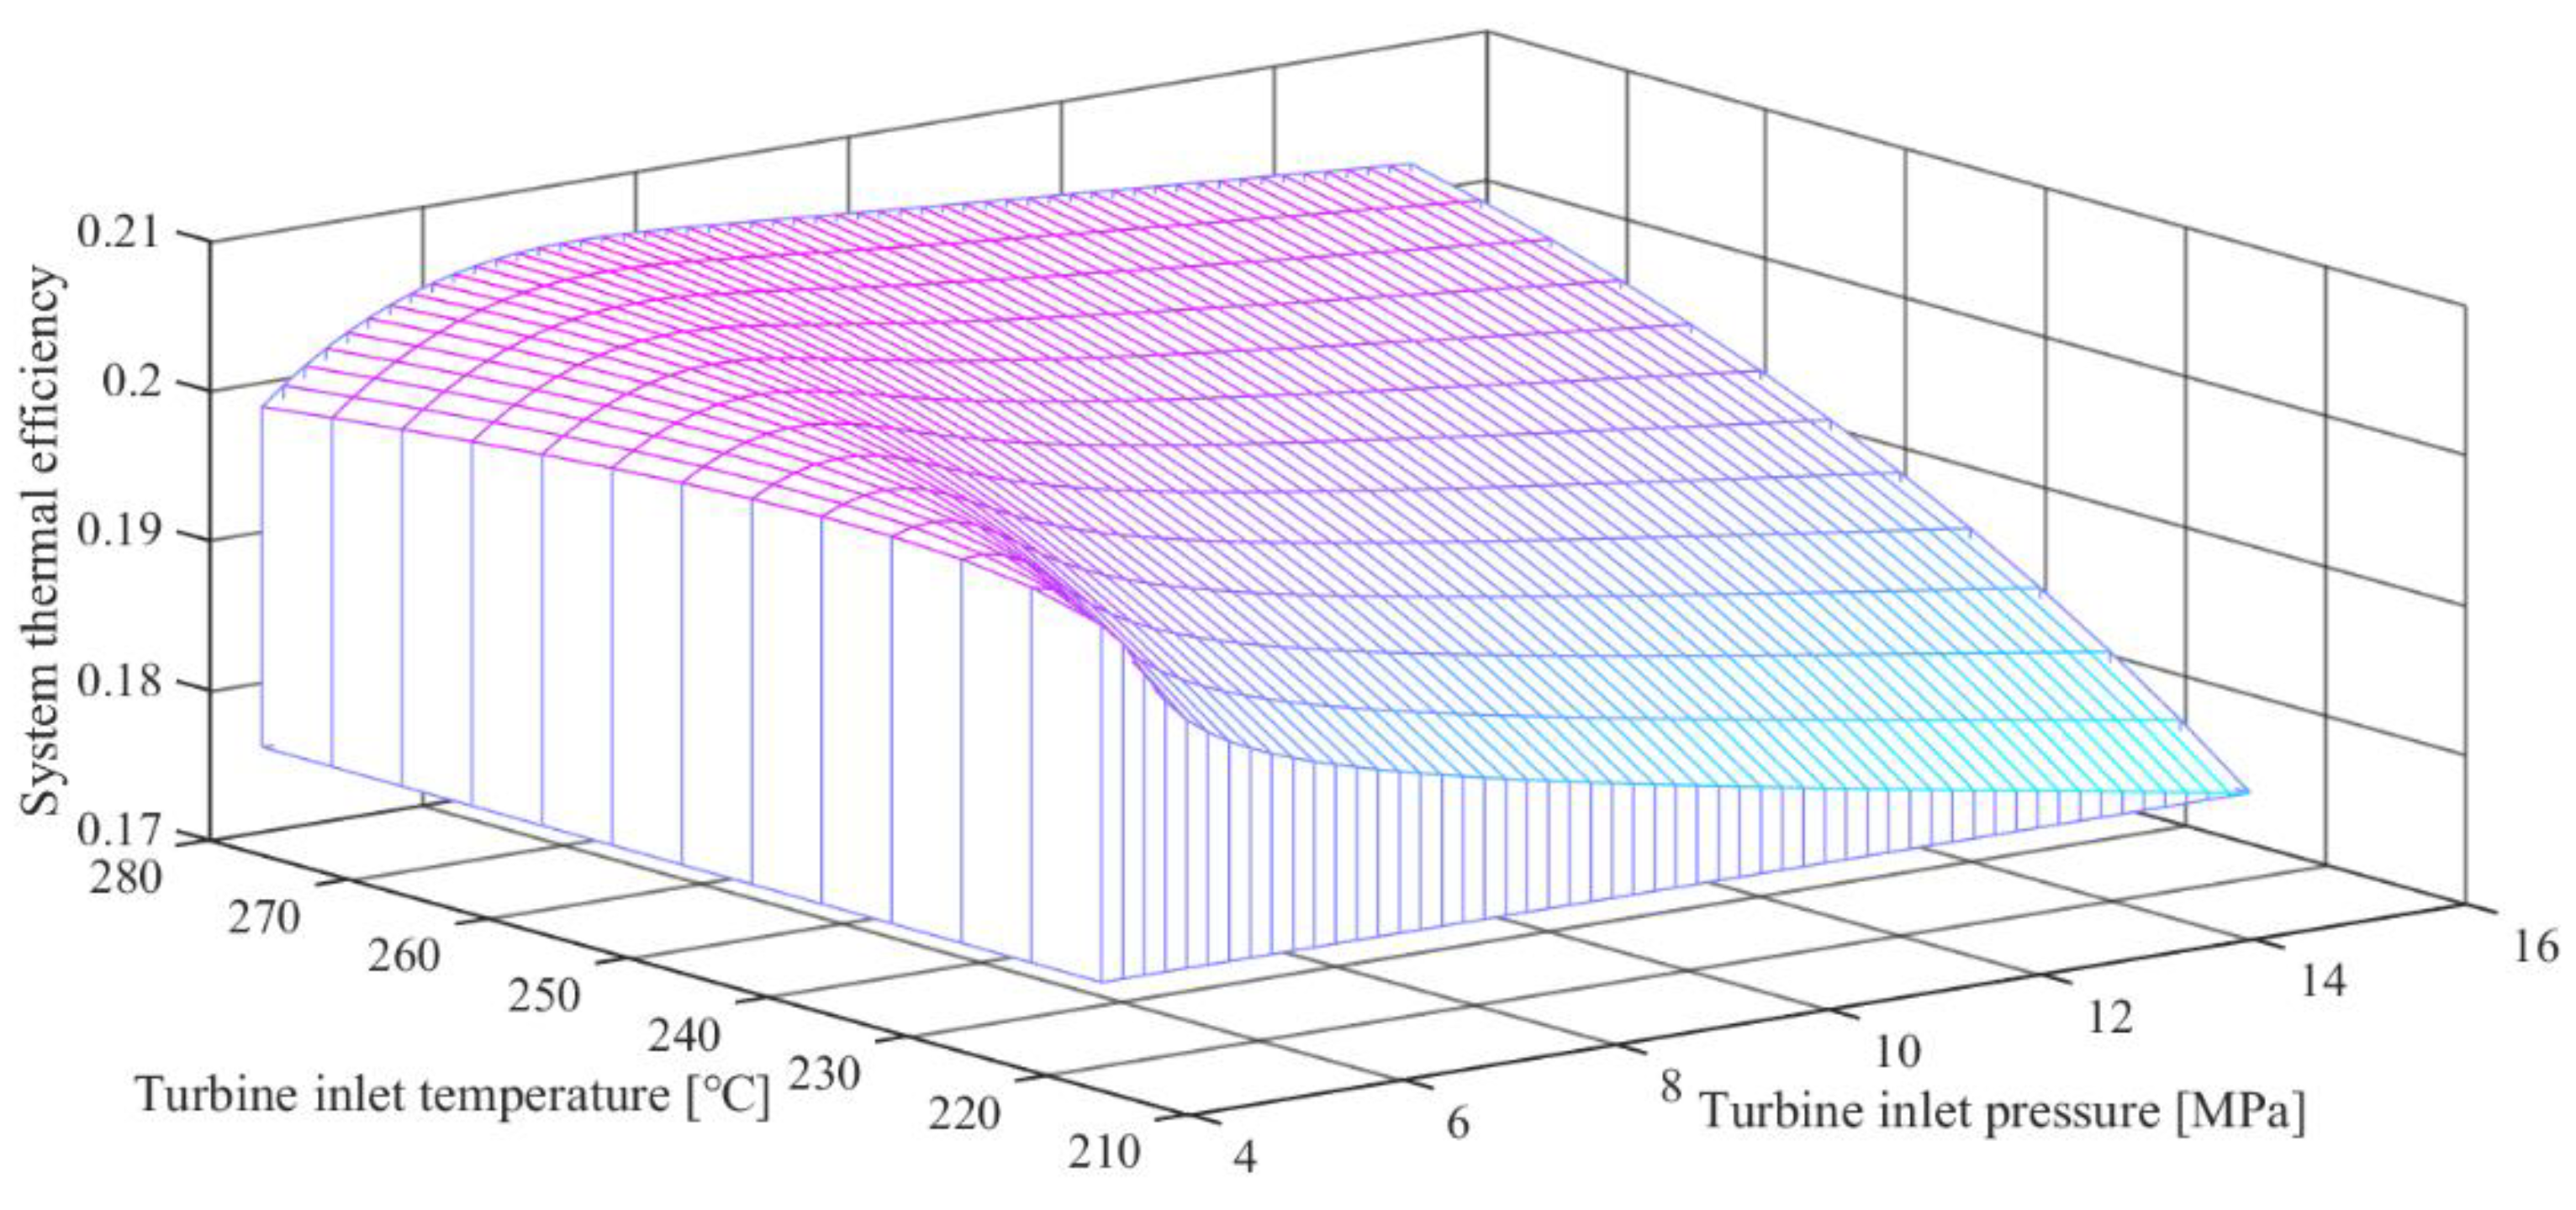
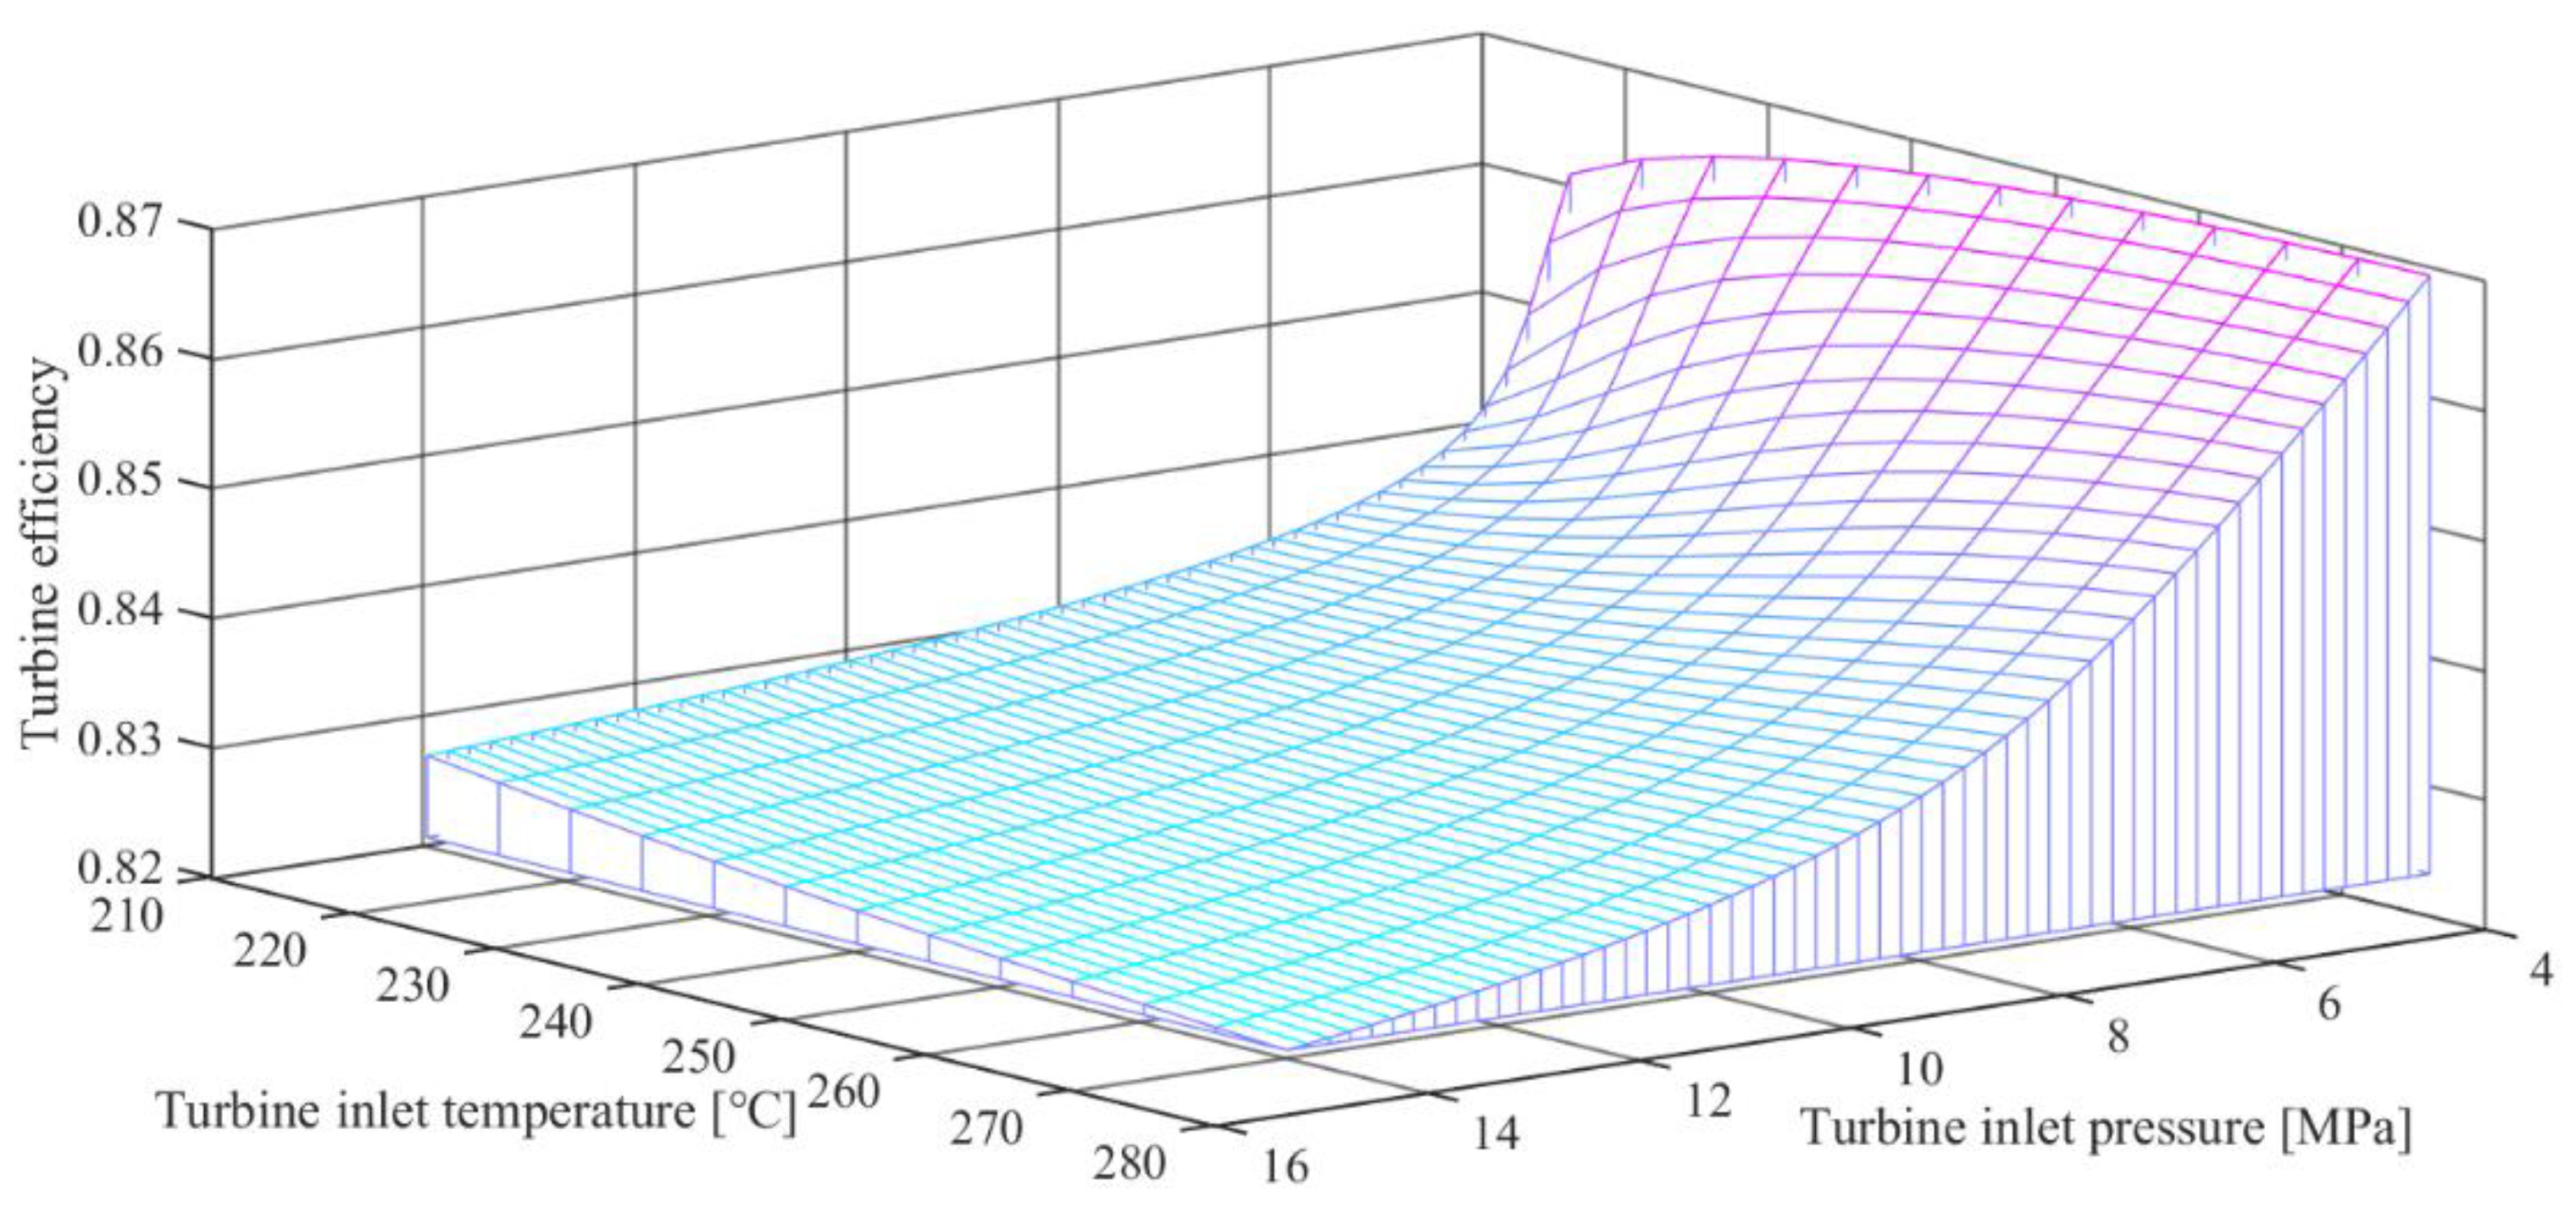
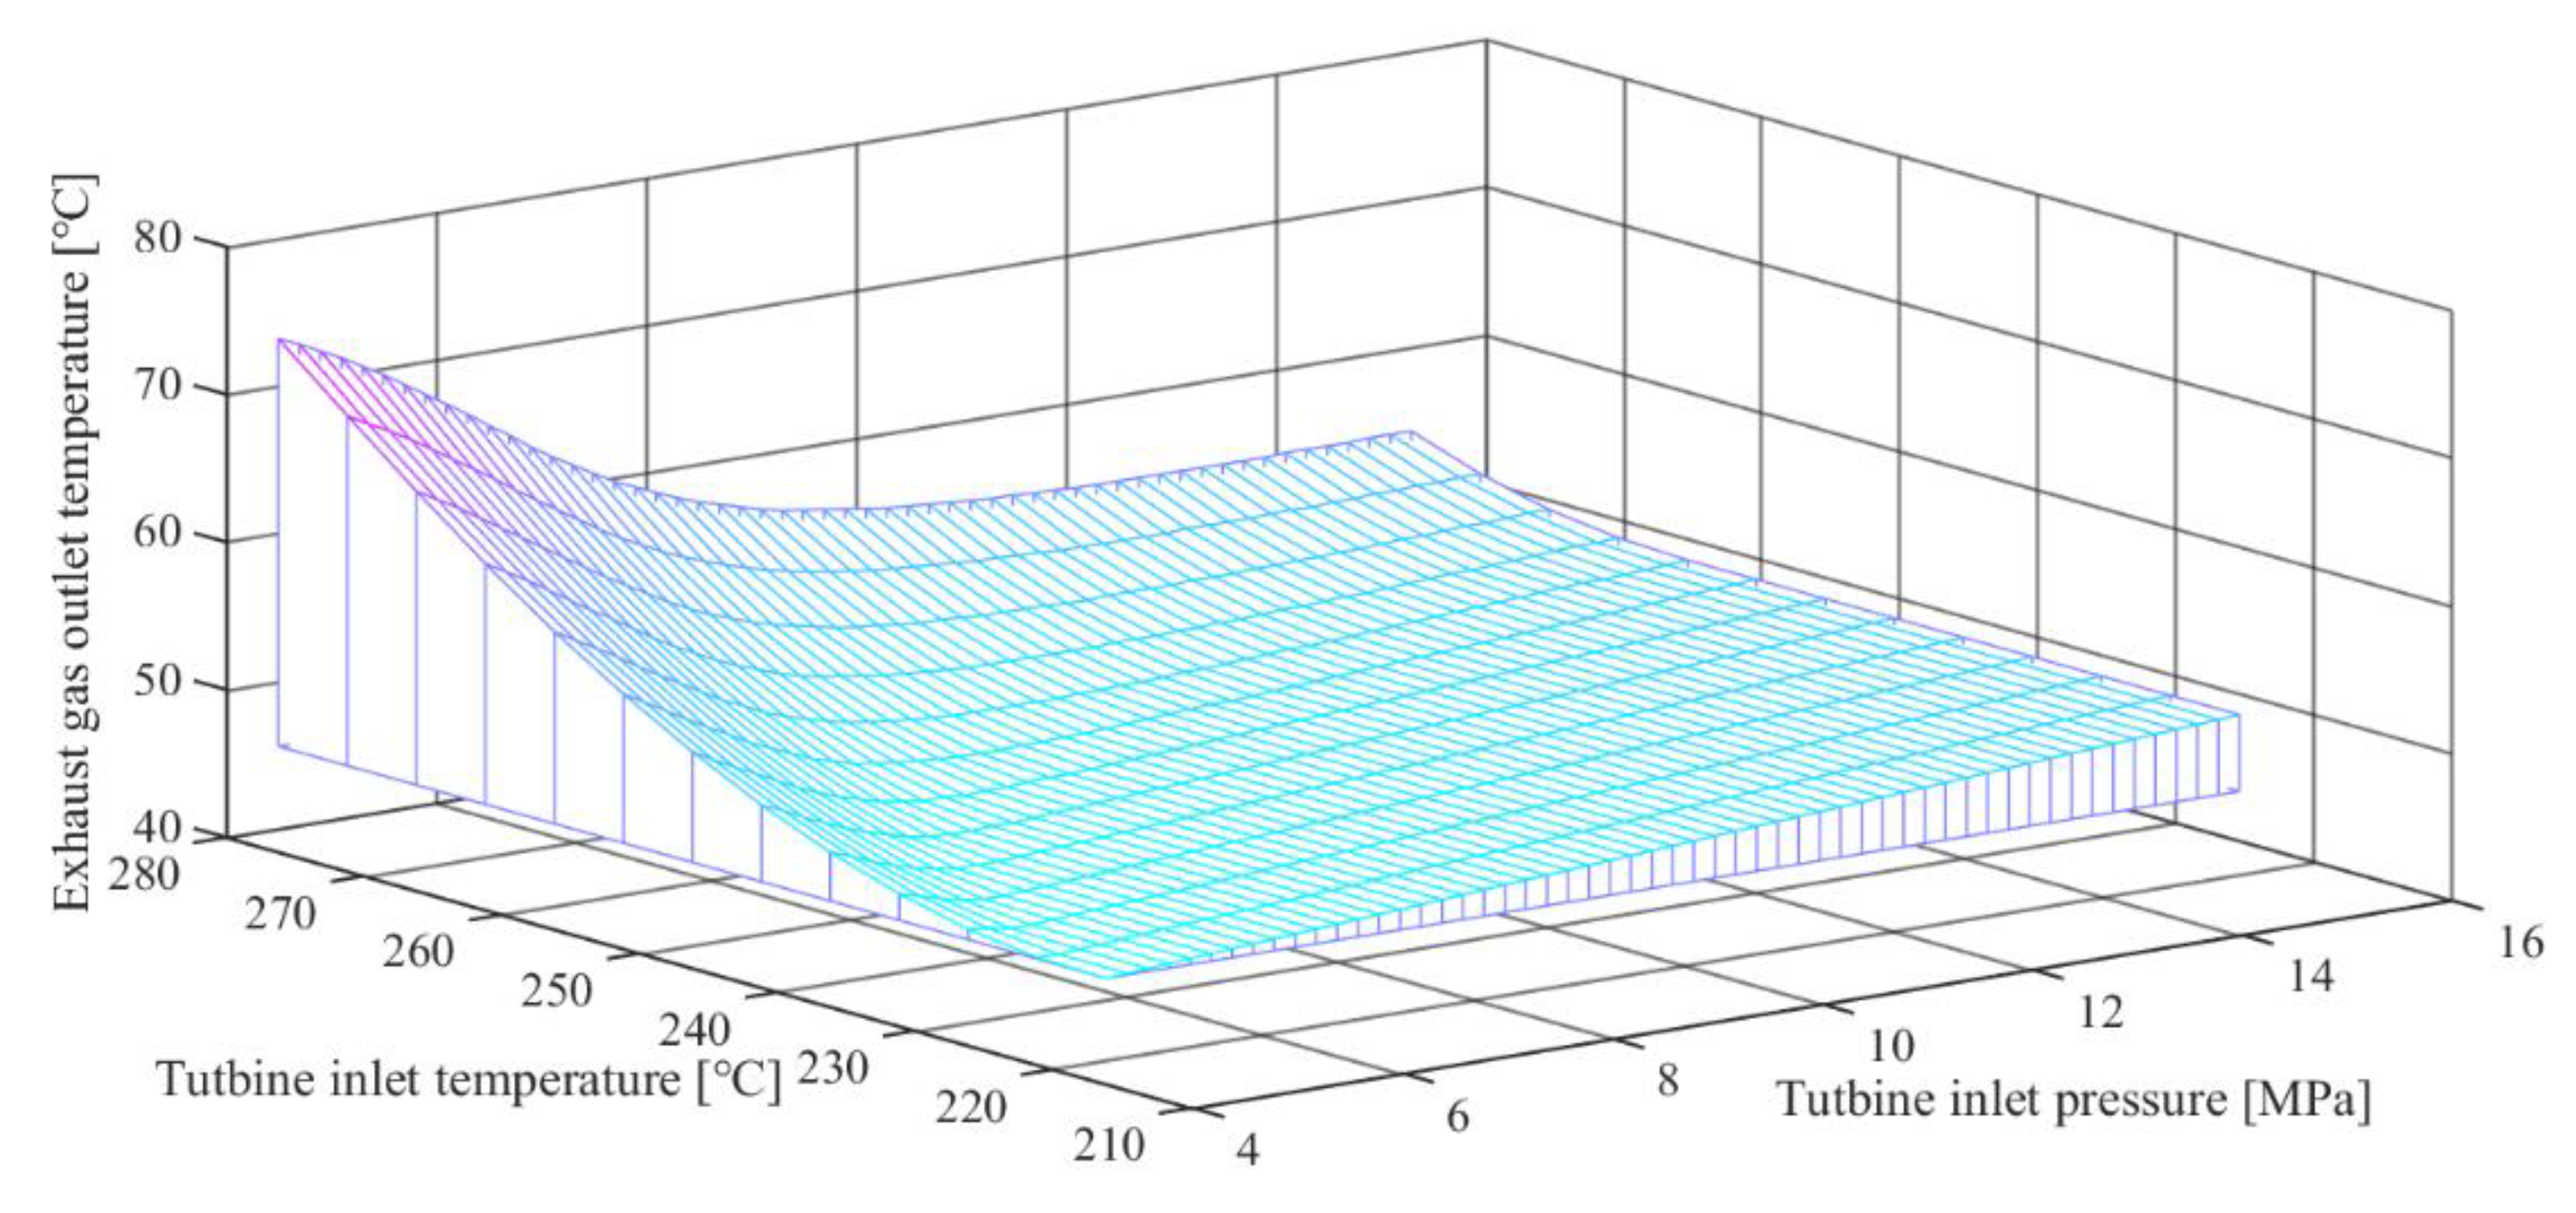
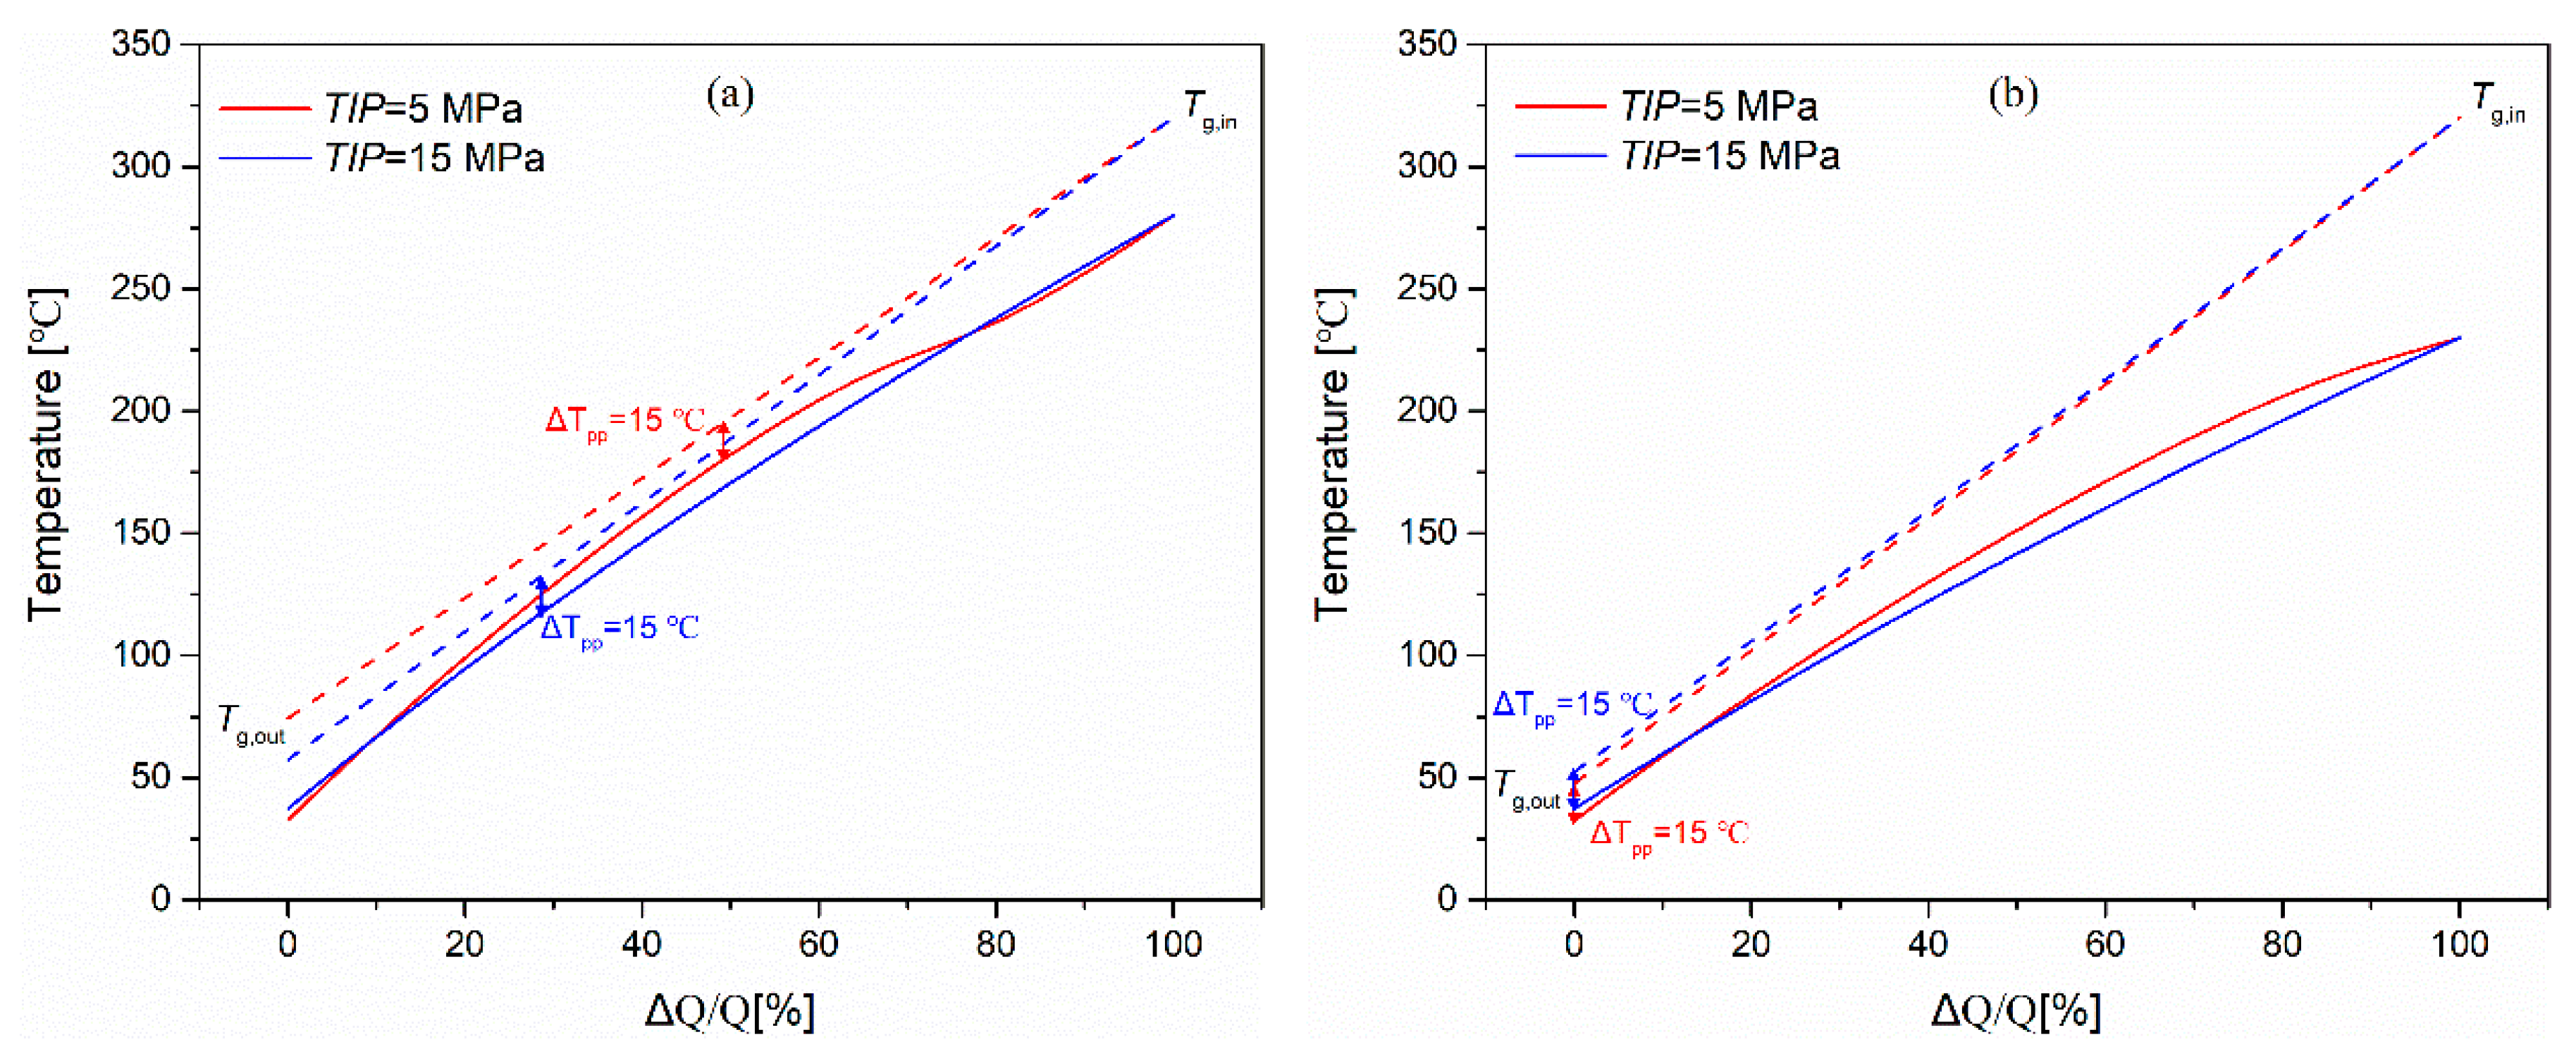
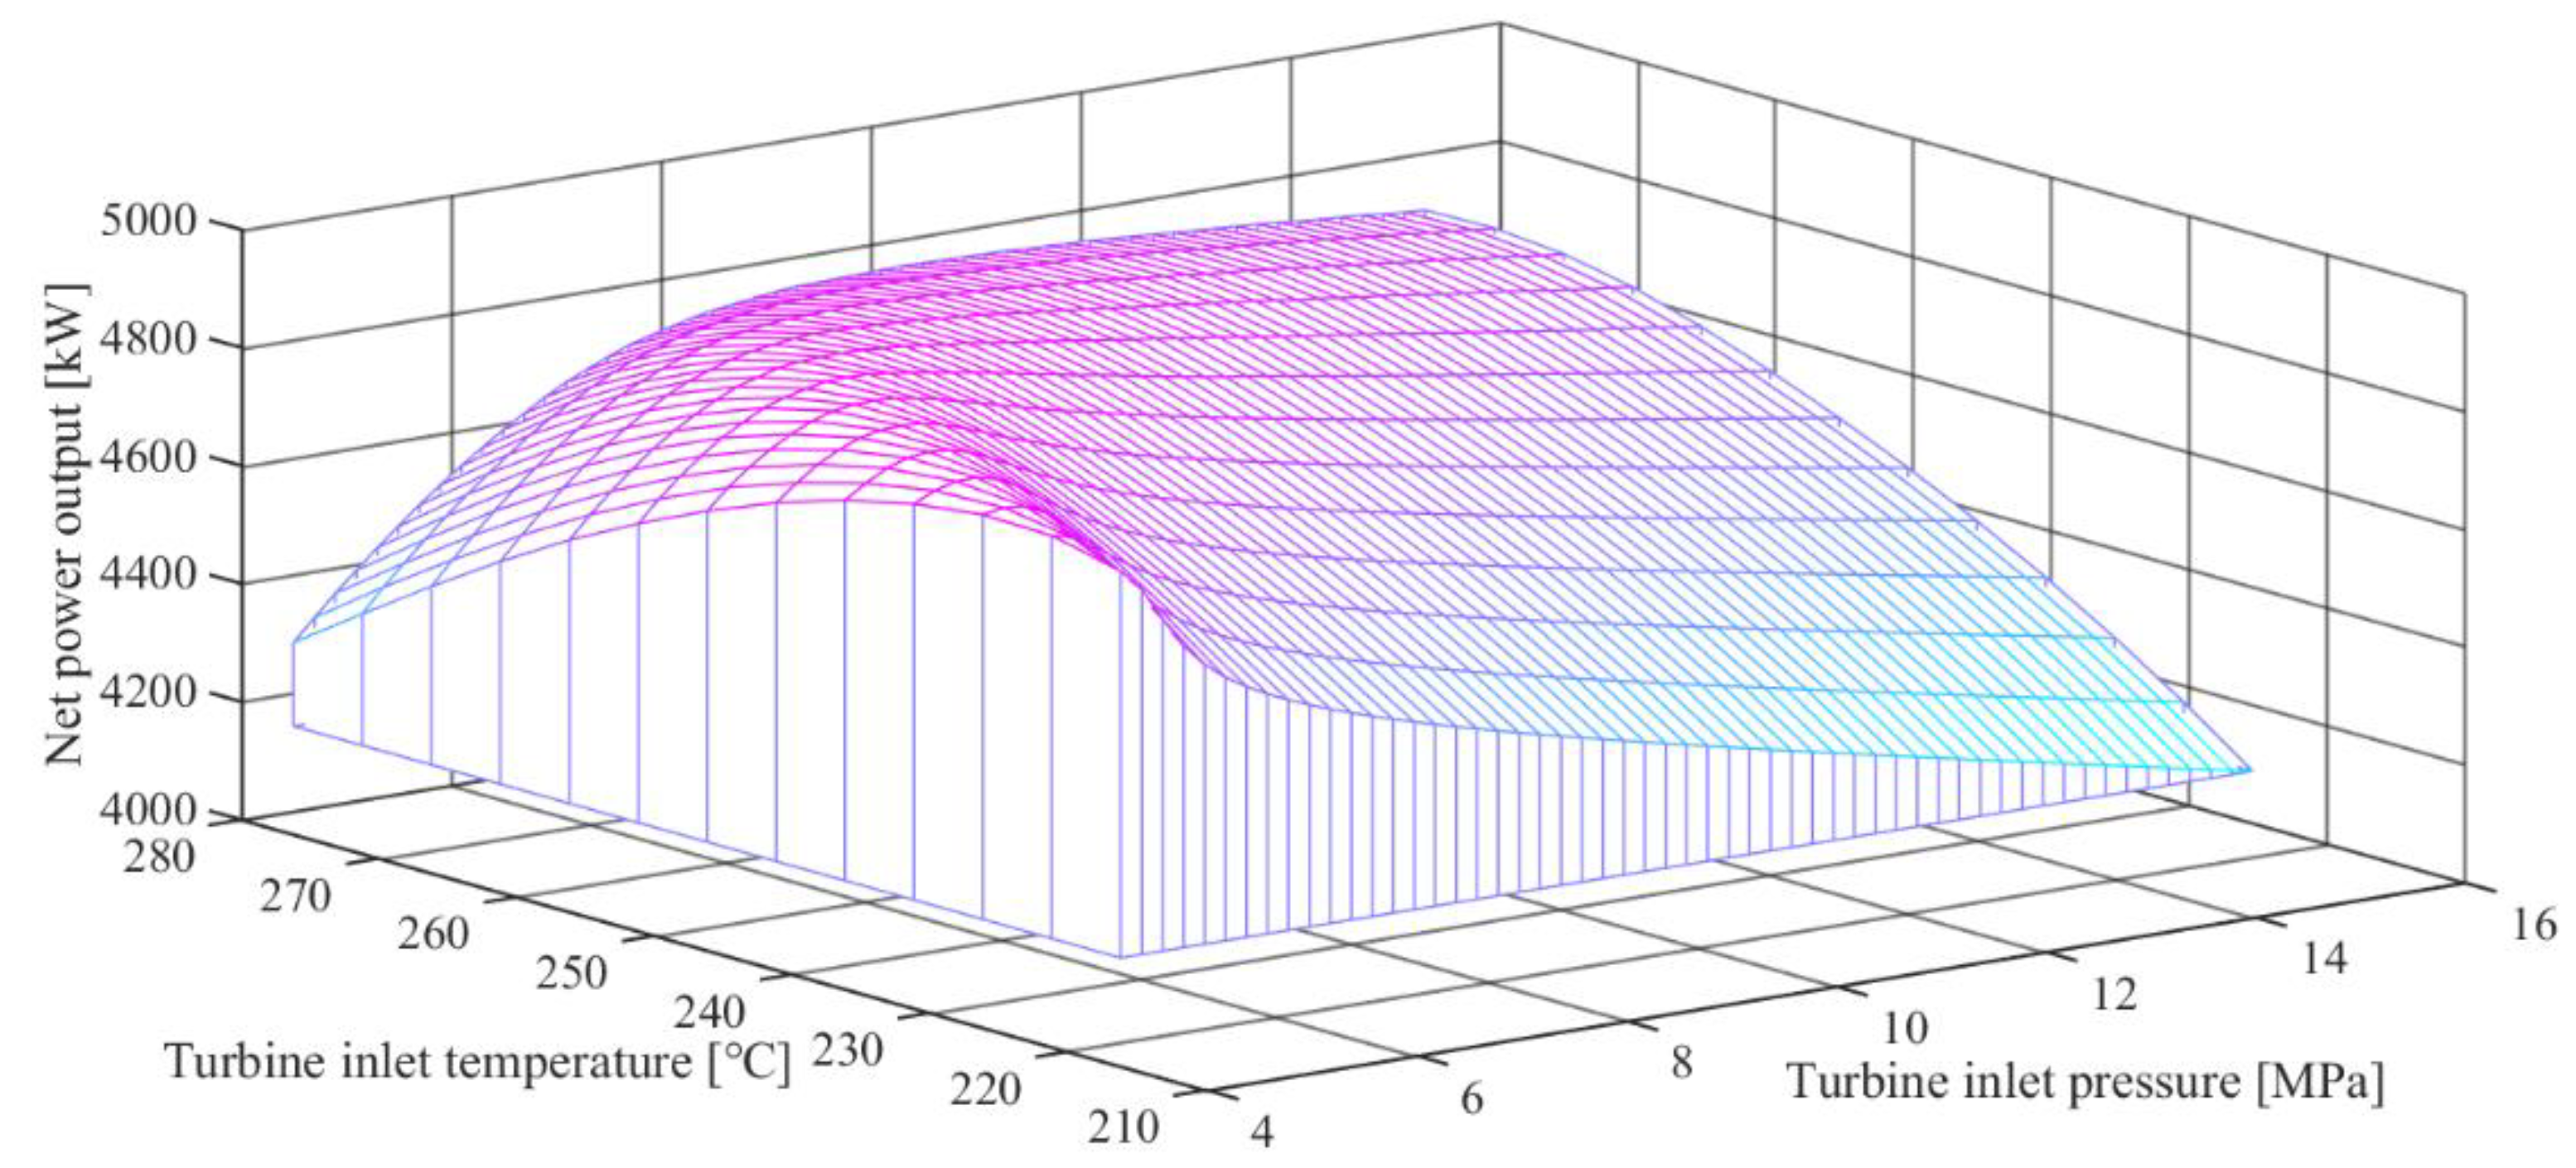
4.1. Performance Analysis of the OTC

The variation of the performance of the OTC with the turbine inlet pressure and temperature will be detailed in this section. For different working fluids, the variation is similar and n-pentane is taken as an example to introduce the variation.
Figure 9 shows the effect of the turbine inlet pressure and temperature on the thermal efficiency of the cycle. Given the turbine inlet pressure, the average heat absorption temperature and heat release temperature of the cycle increase with the increase of the turbine inlet temperature. The variation of the thermal efficiency is a combined action of the average heat absorption temperature and average heat release temperature. When the turbine inlet pressure is low, the system efficiency increases first and then decrease as the turbine inlet temperature increases; when the turbine inlet pressure is high, the variation of average heat absorption temperature has a stronger effect on the system thermal efficiency than the variation of the average heat release temperature, hence the system thermal efficiency tends to increase with the increase of the turbine inlet temperature.
Given the turbine inlet temperature, the thermal efficiency of the cycle first increases and then decreases as the turbine inlet pressure increases, which is mainly due to the decrease of the average heat release temperature and the decrease of the turbine efficiency. The variation of the turbine efficiency under different turbine inlet pressure and temperature is shown in Figure 10. It can be seen that the increase of the turbine inlet pressure will result in a sharp reduction of the turbine efficiency. The effect of the turbine inlet temperature on the turbine efficiency is weak than that of the turbine inlet pressure.
Figure 11 illustrates the effects of the turbine inlet pressure and temperature on the exhaust gas outlet temperature. The pinch point temperature difference between the exhaust gas and working fluid occurs during the heat exchange process when the turbine inlet temperature is high, as shown in Figure 12a, and the higher turbine inlet pressure can achieve better thermal matching and the lower outlet temperature of the exhaust gas than that of the lower turbine inlet pressure. However, when the turbine inlet temperature is low, the pinch point temperature difference occurs at the inlet of the working fluid, as shown in Figure 12b. Therefore, a higher turbine inlet pressure results in a higher inlet temperature of the working fluid, which will further cause a higher outlet temperature of the exhaust gas.
The net power output of the cycle is equal to the thermal efficiency multiplied by the heat absorption capacity. Figure 13 shows the effects of the turbine inlet pressure and temperature on the net power output. There exists an optimal turbine inlet pressure to maximize the net power output for a given turbine inlet temperature, and the optimal turbine inlet pressure increases as the turbine inlet temperature increases. Similarly, the optimal turbine inlet temperature increases with the increase of the turbine inlet pressure, but its increment decreases when the turbine inlet pressure is higher than 10 MPa.
Table 6 lists the optimization results for the four working fluids. n-pentane achieves the maximum power output, and the MM shows the worst performance from the perspective of thermal efficiency and net power output. Due to the large Vr in the expansion process of cyclopentane and MM (223 and 454, respectively), their turbine efficiency is lower than that of n-pentane and R245fa. MM is ‘too dry’, resulting in a higher temperature of the fluid exiting the turbine, which is detrimental to the thermal efficiency of the cycle.

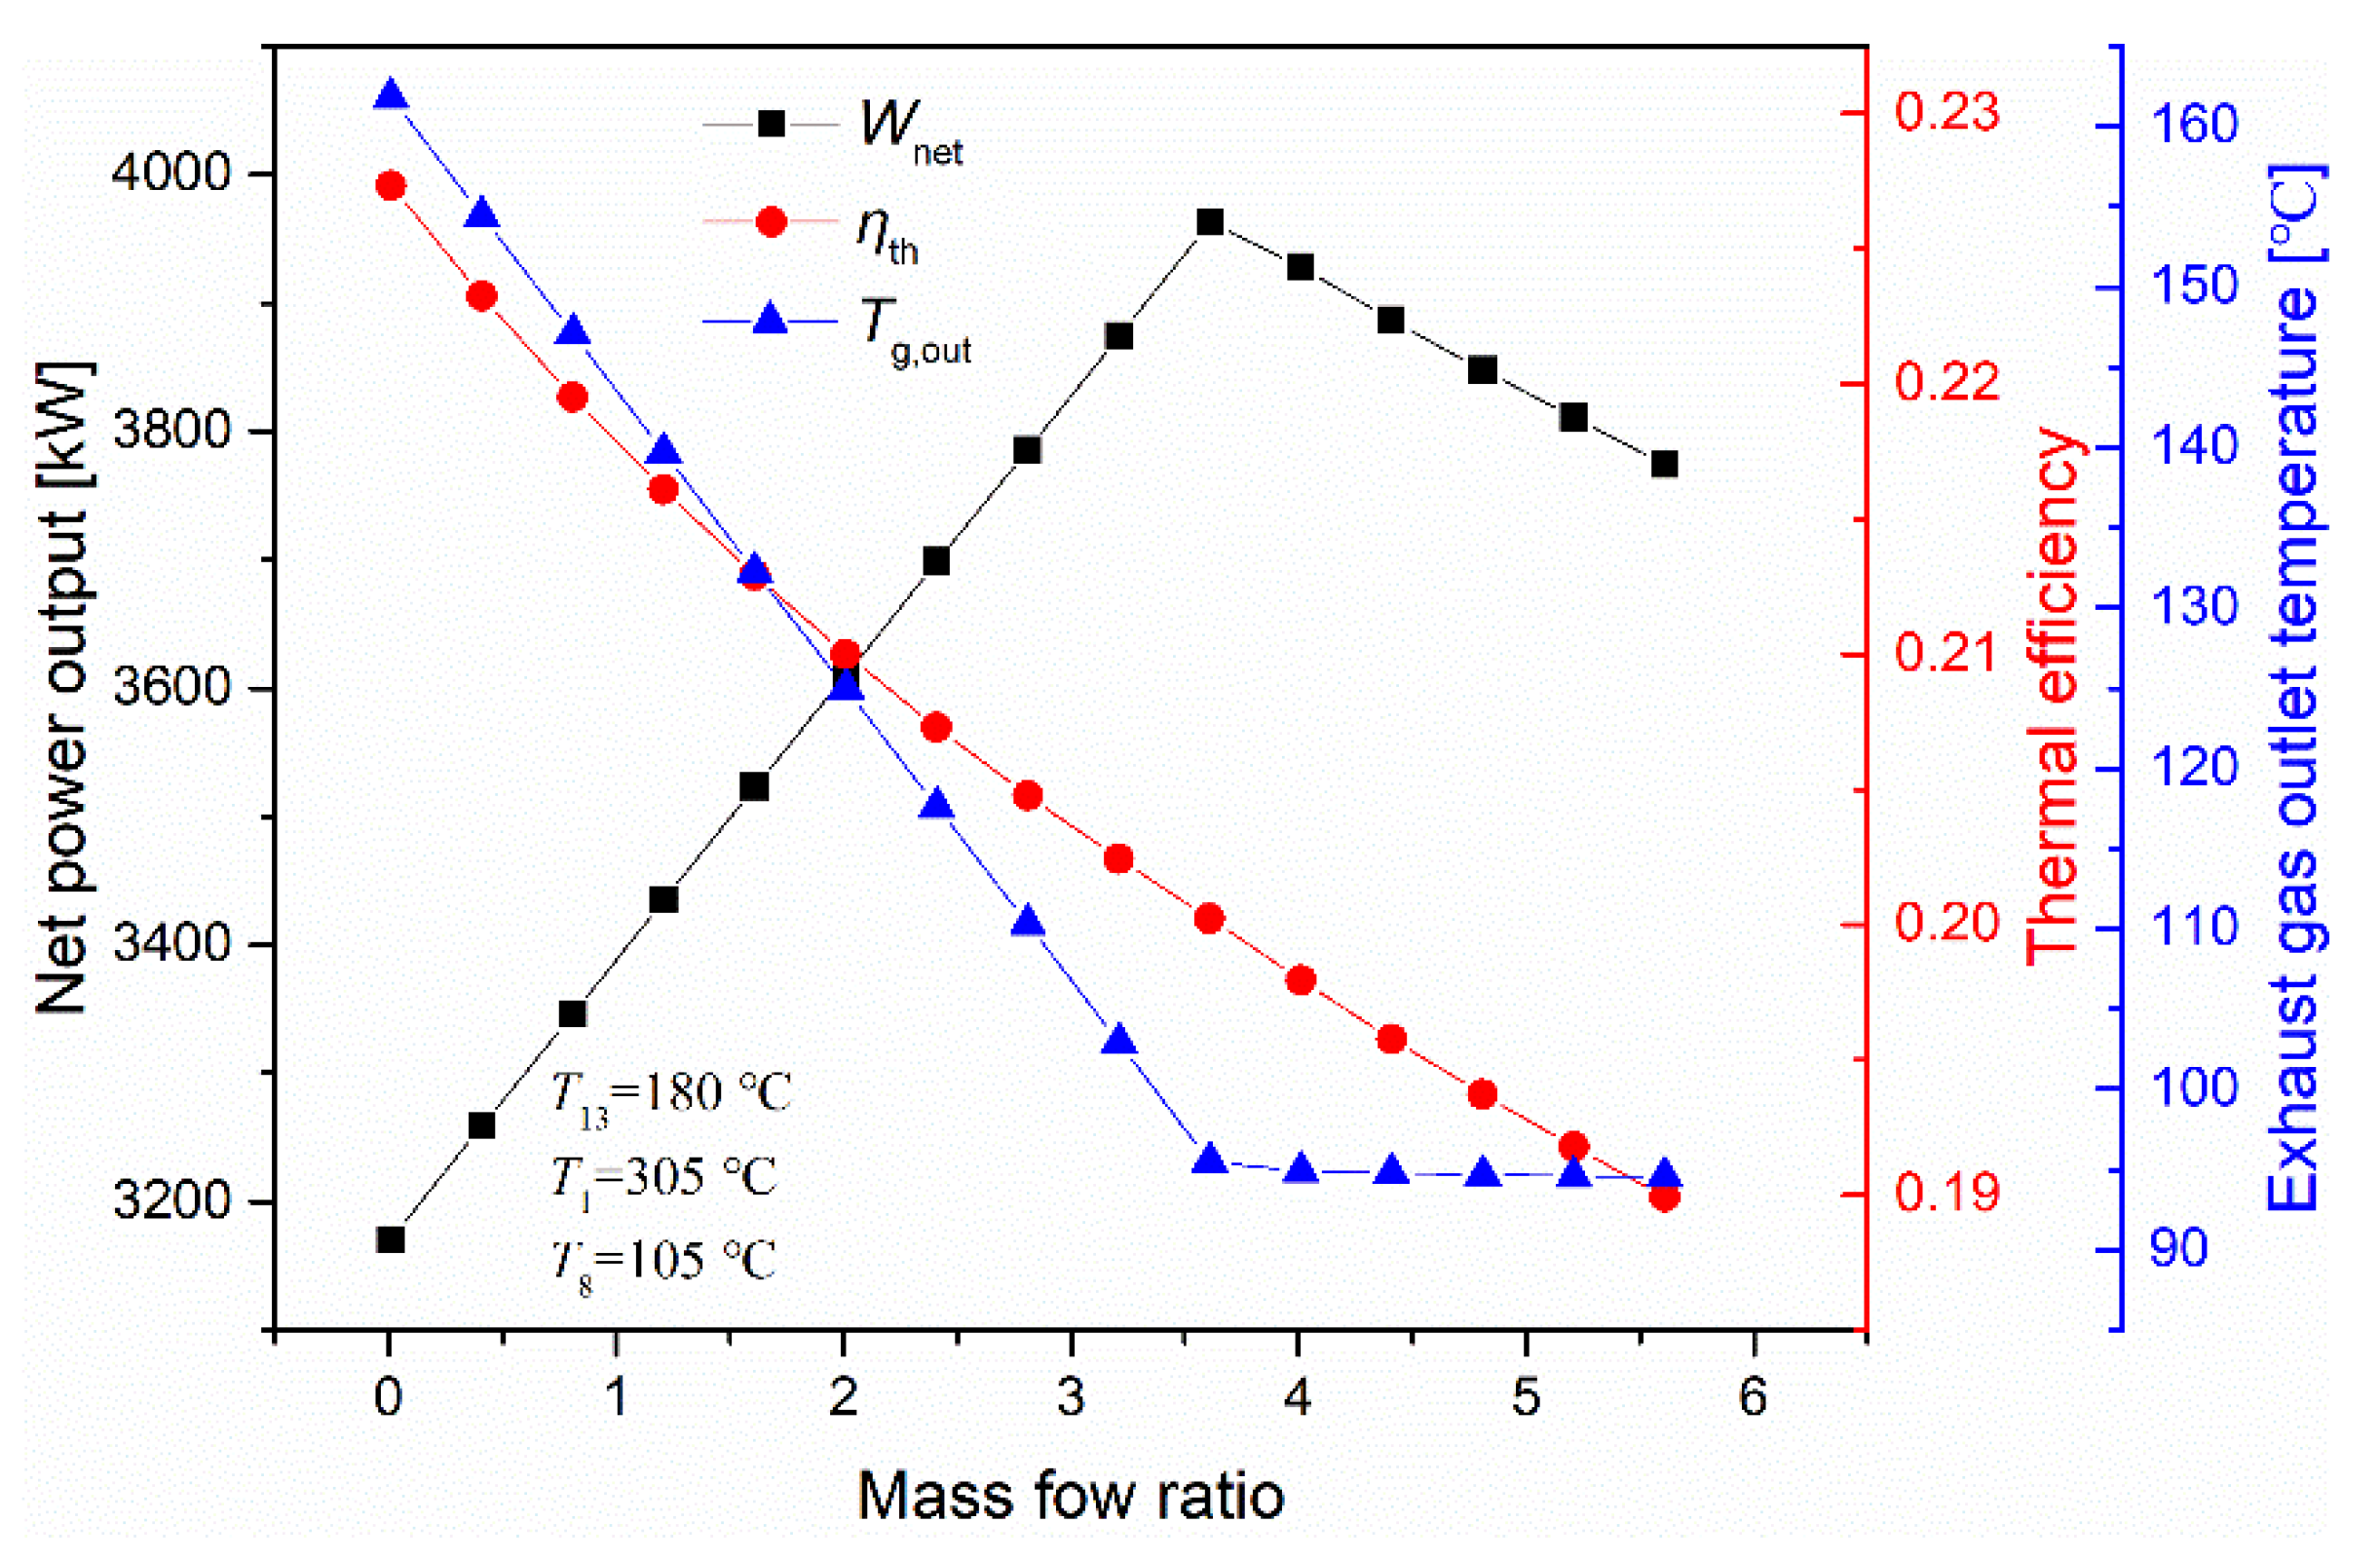
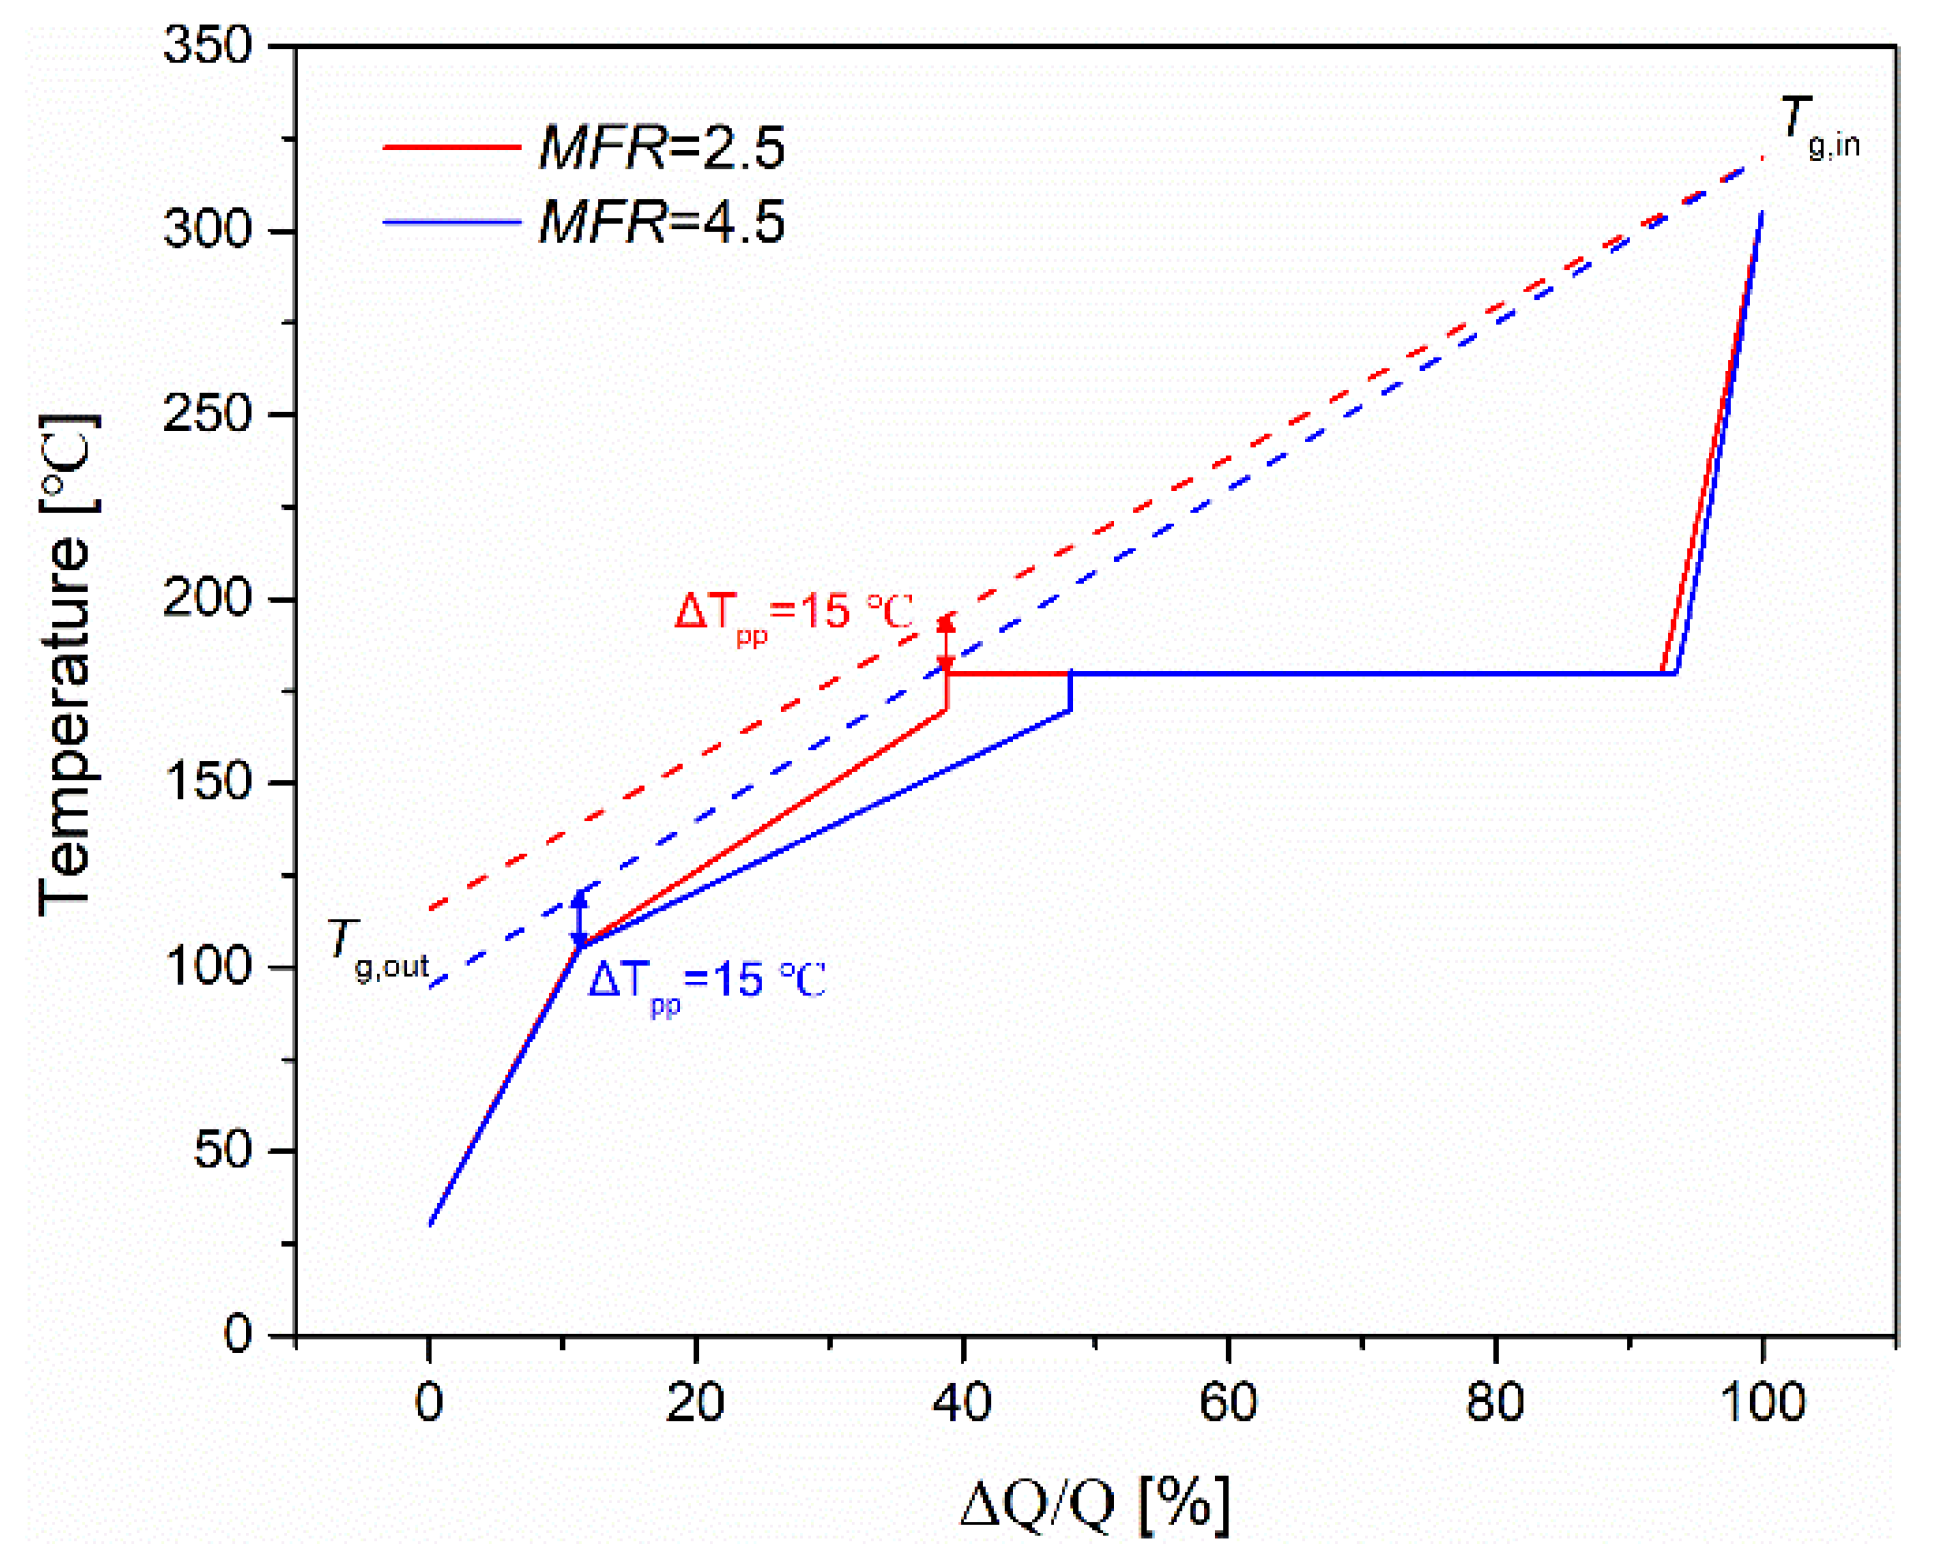
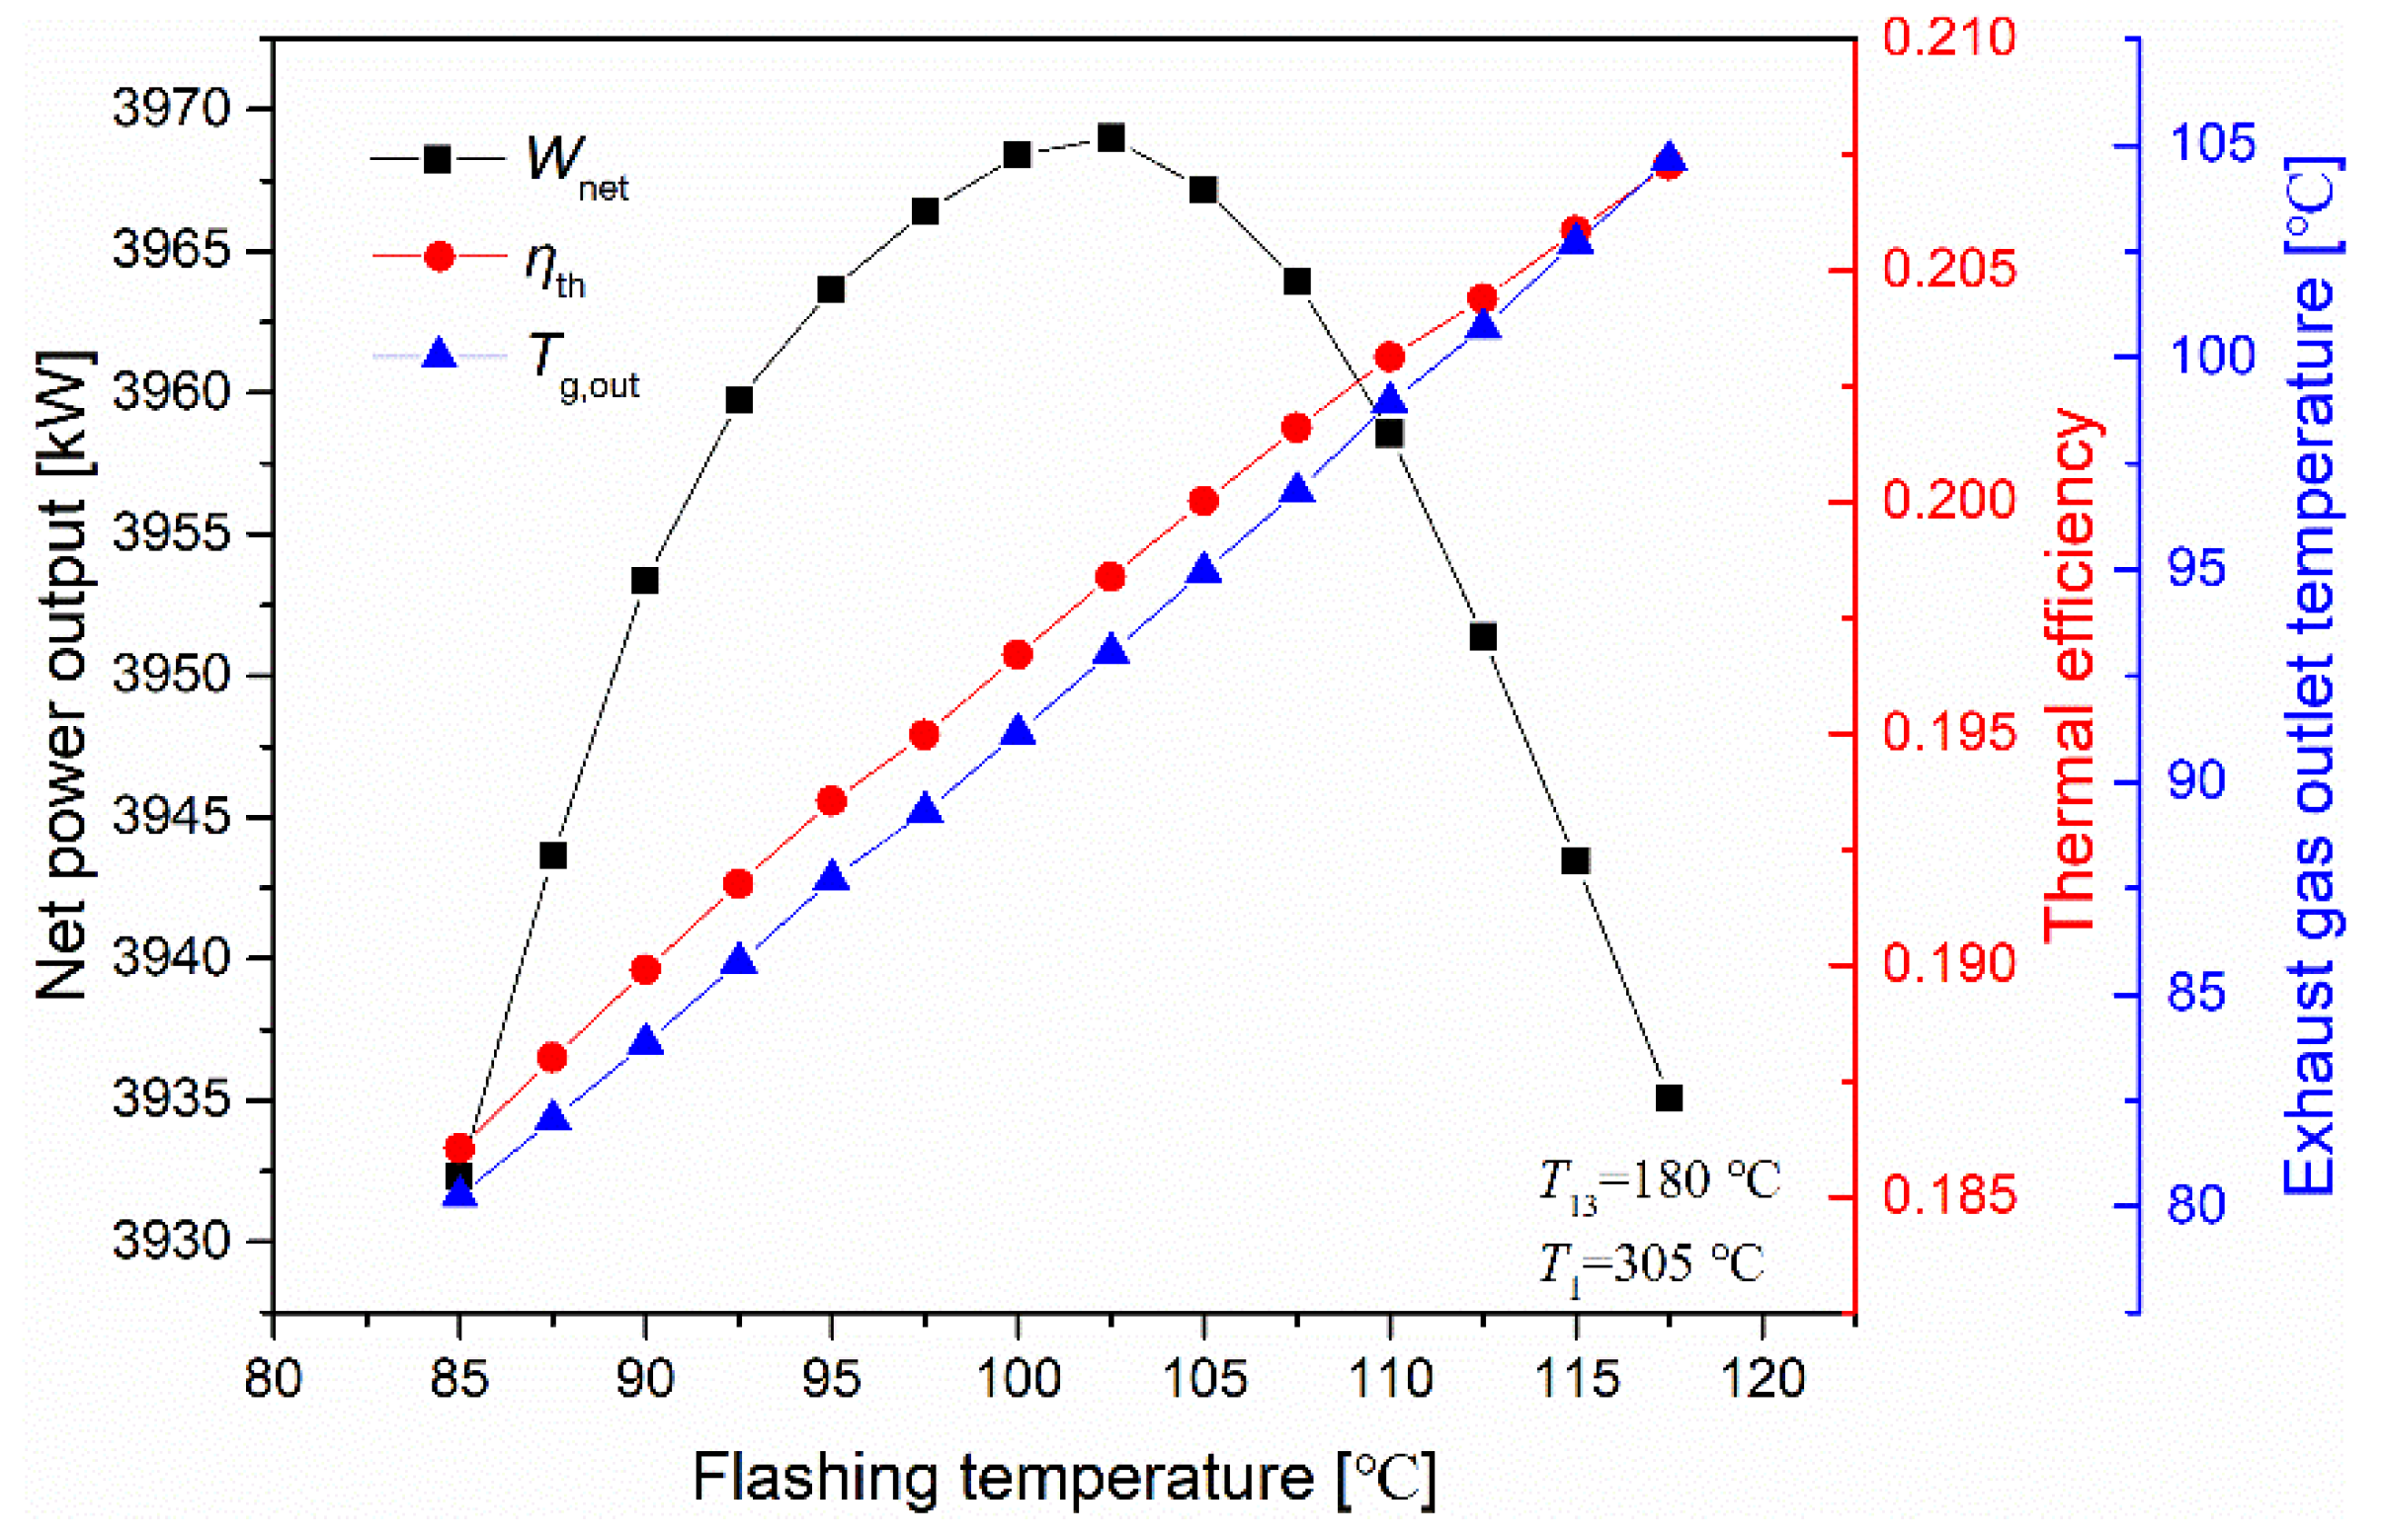
4.2. Performance Analysis of the SFC

For the basic SRC driven by the waste heat, the pinch point temperature difference between working fluid and heat source usually occurs at the bubble point of the working fluid. The smaller heat absorption of the liquid water in the economizer results in a larger outlet temperature of the heat source. Aims to improving the use of the waste heat, in the SFC, a portion of the saturated water which is supposed to enter the evaporator is directly flashed into the saturated liquid and saturated gas, and the saturated liquid will further absorb heat from the waste heat source in the high-pressure economizer.
Figure 14 presents the variation of the SFC’s performance with the mass flow ratio of the flash stream to the main stream. When the mass flow ratio is 0, the SFC becomes the basic SRC. The flashing temperature is lower than the evaporating temperature, thus the average heat absorption temperature of the working fluid decreases with the increase of the mass flow ratio of the flash stream to the main stream, which leads to the reduction in the system thermal efficiency. Accordingly, the exhaust gas outlet temperature will decrease as the mass flow ratio increases since more heat of the exhaust gas is released in the high-pressure economizer.
However, when the mass flow ratio reaches a certain value, the position of the pinch point temperature difference between the working fluid and exhaust gas is transferred from the bubble point of the main stream to the inlet of the high-pressure economizer. If the mass flow ratio is further increased, the outlet temperature of the exhaust gas will remain almost unchanged. Figure 15 reveals the T-Q diagram of the heat source and working fluid with the mass flow ratio of 2.5 and 4.5. Due to the combined effect of the system thermal efficiency and heat absorption capacity, the net power output of the system increases first and then decreases with the increase of the mass flow ratio.
Figure 16 shows the effect of flashing temperature on the system performance. Please note that the corresponding mass flow ratio for each flashing temperature is taken as the optimal value to maximize the system’s net power output. The average heat absorption temperature of the working fluid and the outlet temperature of the exhaust gas increase as the flash temperature increases. The maximum net power output is obtained after a comprehensive consideration of the heat input and thermal efficiency variation. The optimal parameters and the system performance are shown in Table 7.

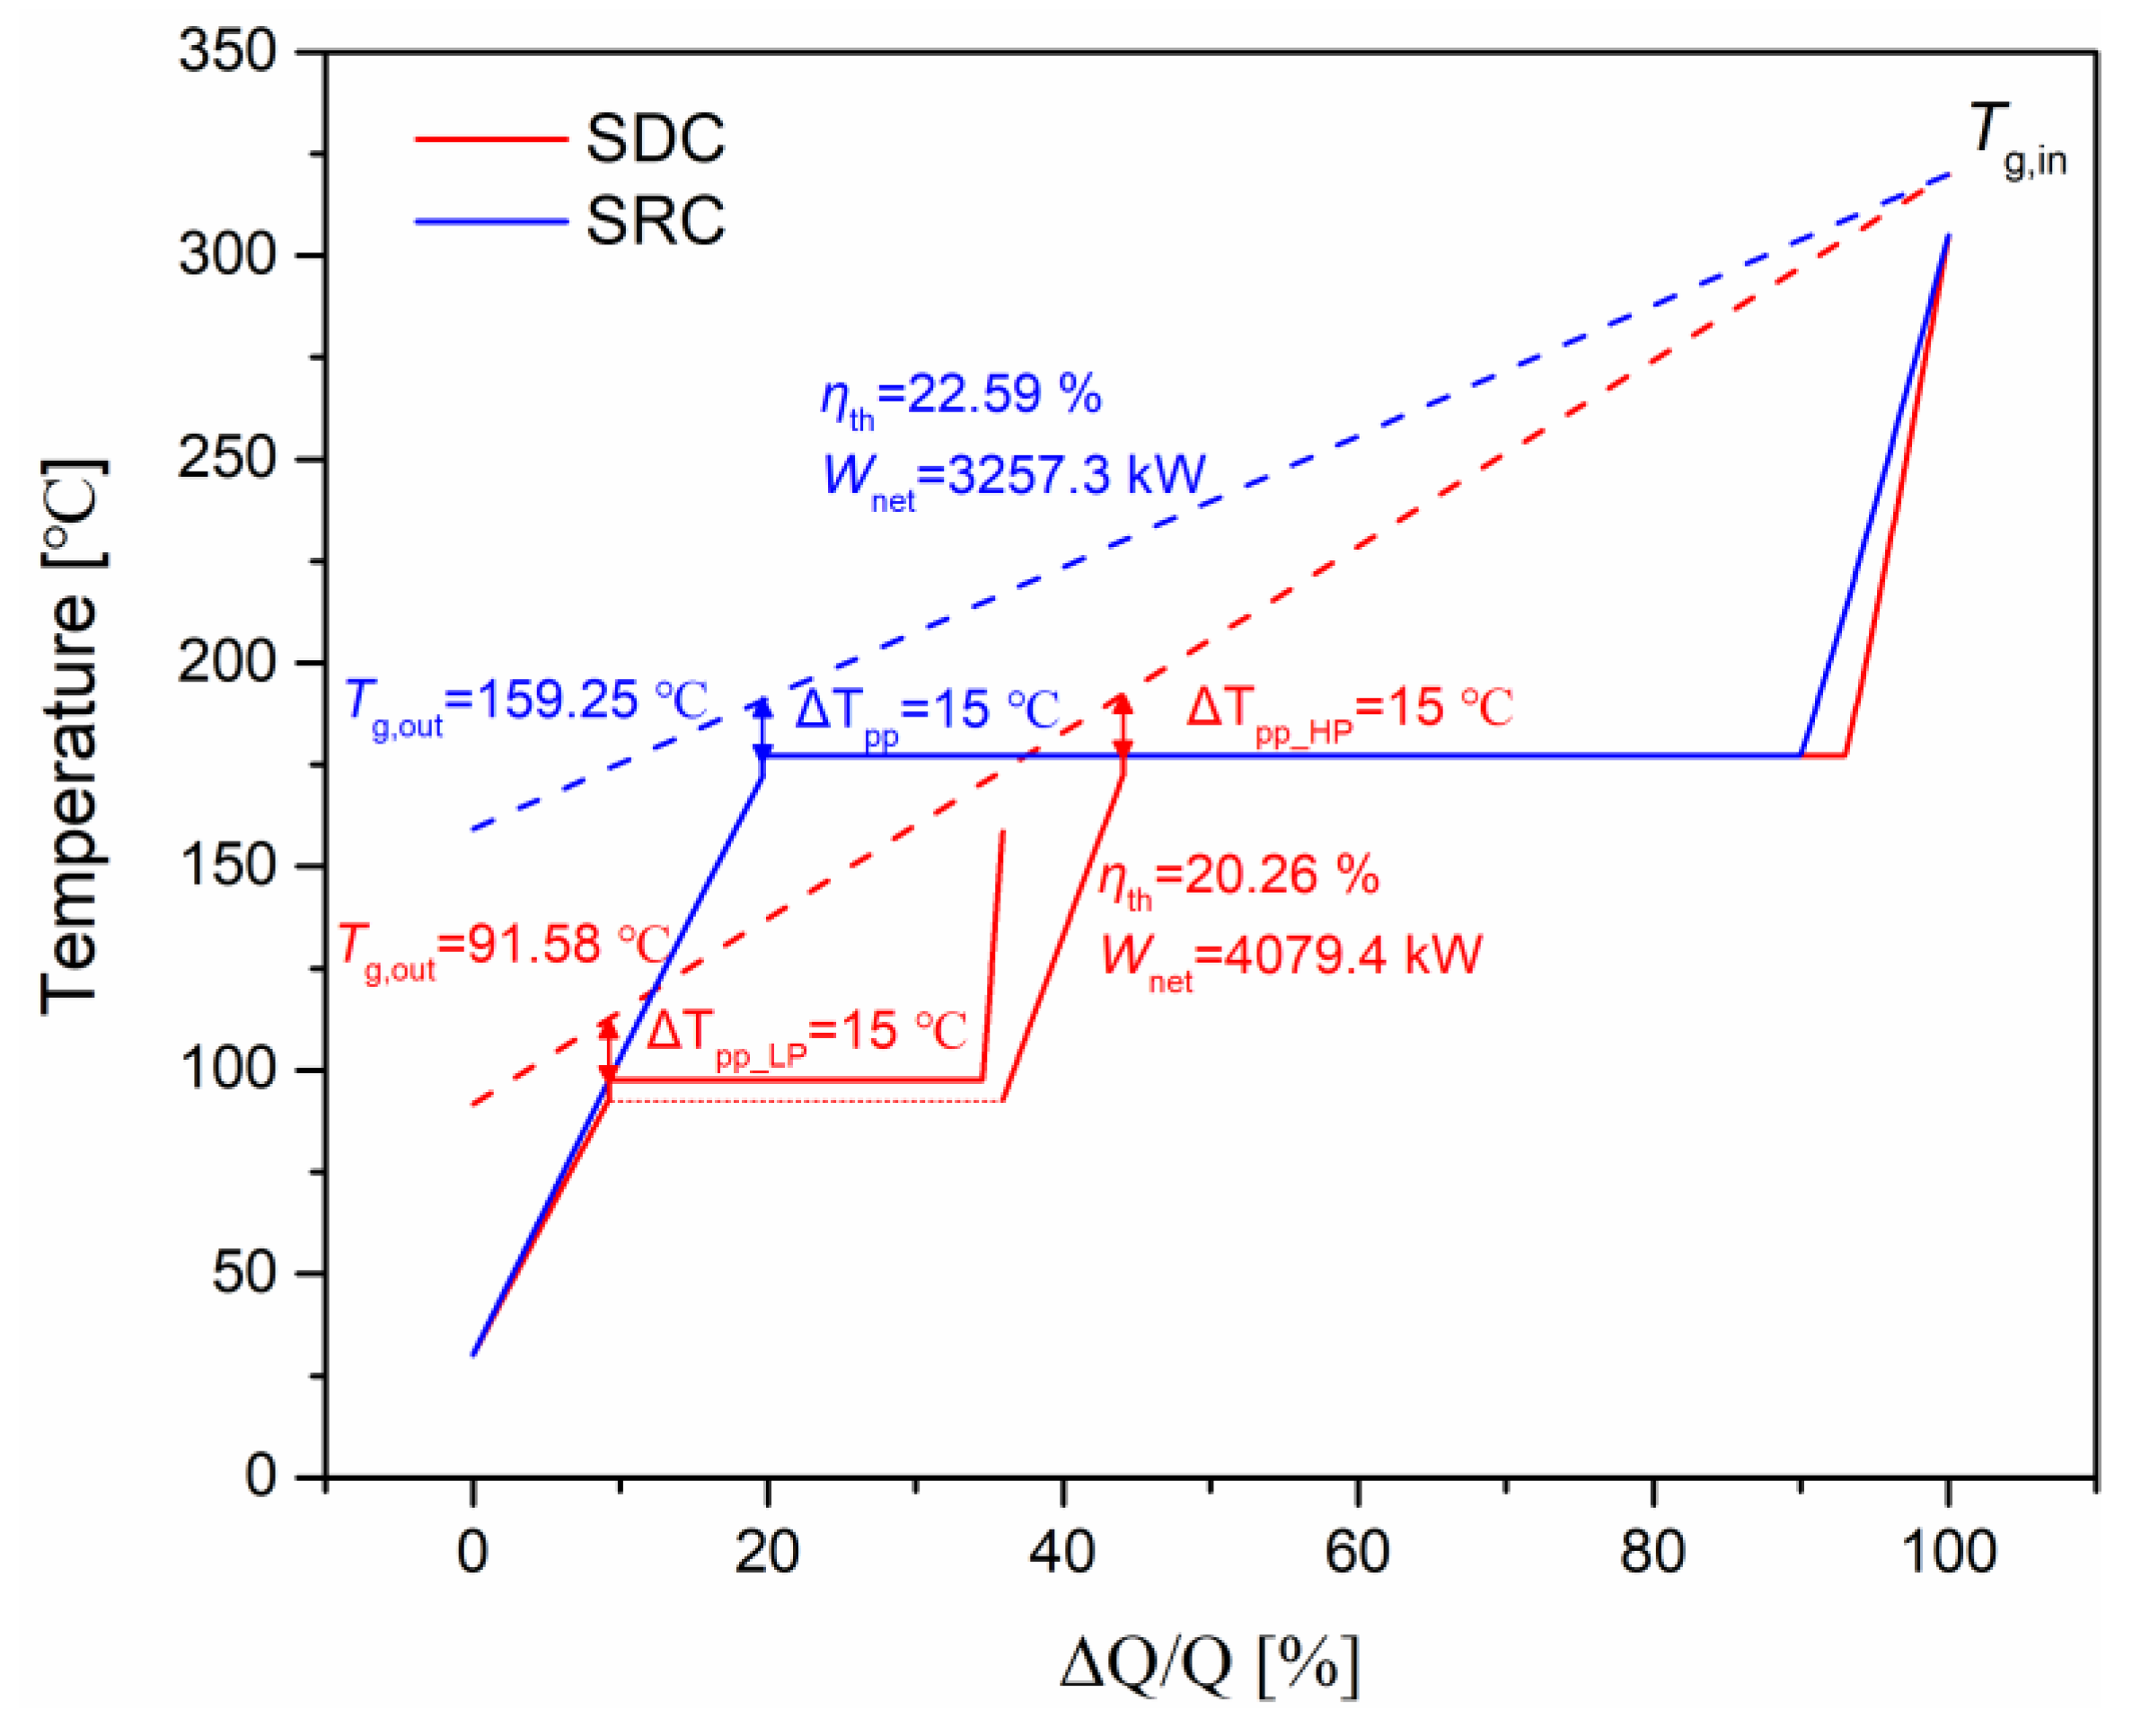
4.3. Performance Analysis of the SDC

In contrast to the SFC, the way of SDC to improve the use of the waste heat is to add a complete low-temperature circuit which includes the low-temperature preheating, evaporating and superheating. Same as the SFC, the increase of heat absorption of SDC is at the expense of the decrease of the thermal efficiency.
Figure 17 shows the T-Q diagrams of exhaust gas and working fluid under the condition that the SDC system outputs the maximum power, as well as the condition that the basic SRC operates with the same main evaporating temperature and turbine inlet temperature as the SDC. Compared with the basic SRC, the SDC produces 25.24% more power with a lower thermal efficiency and a higher heat absorption. The optimal parameters and the system performance of the SDC are shown in Table 8.

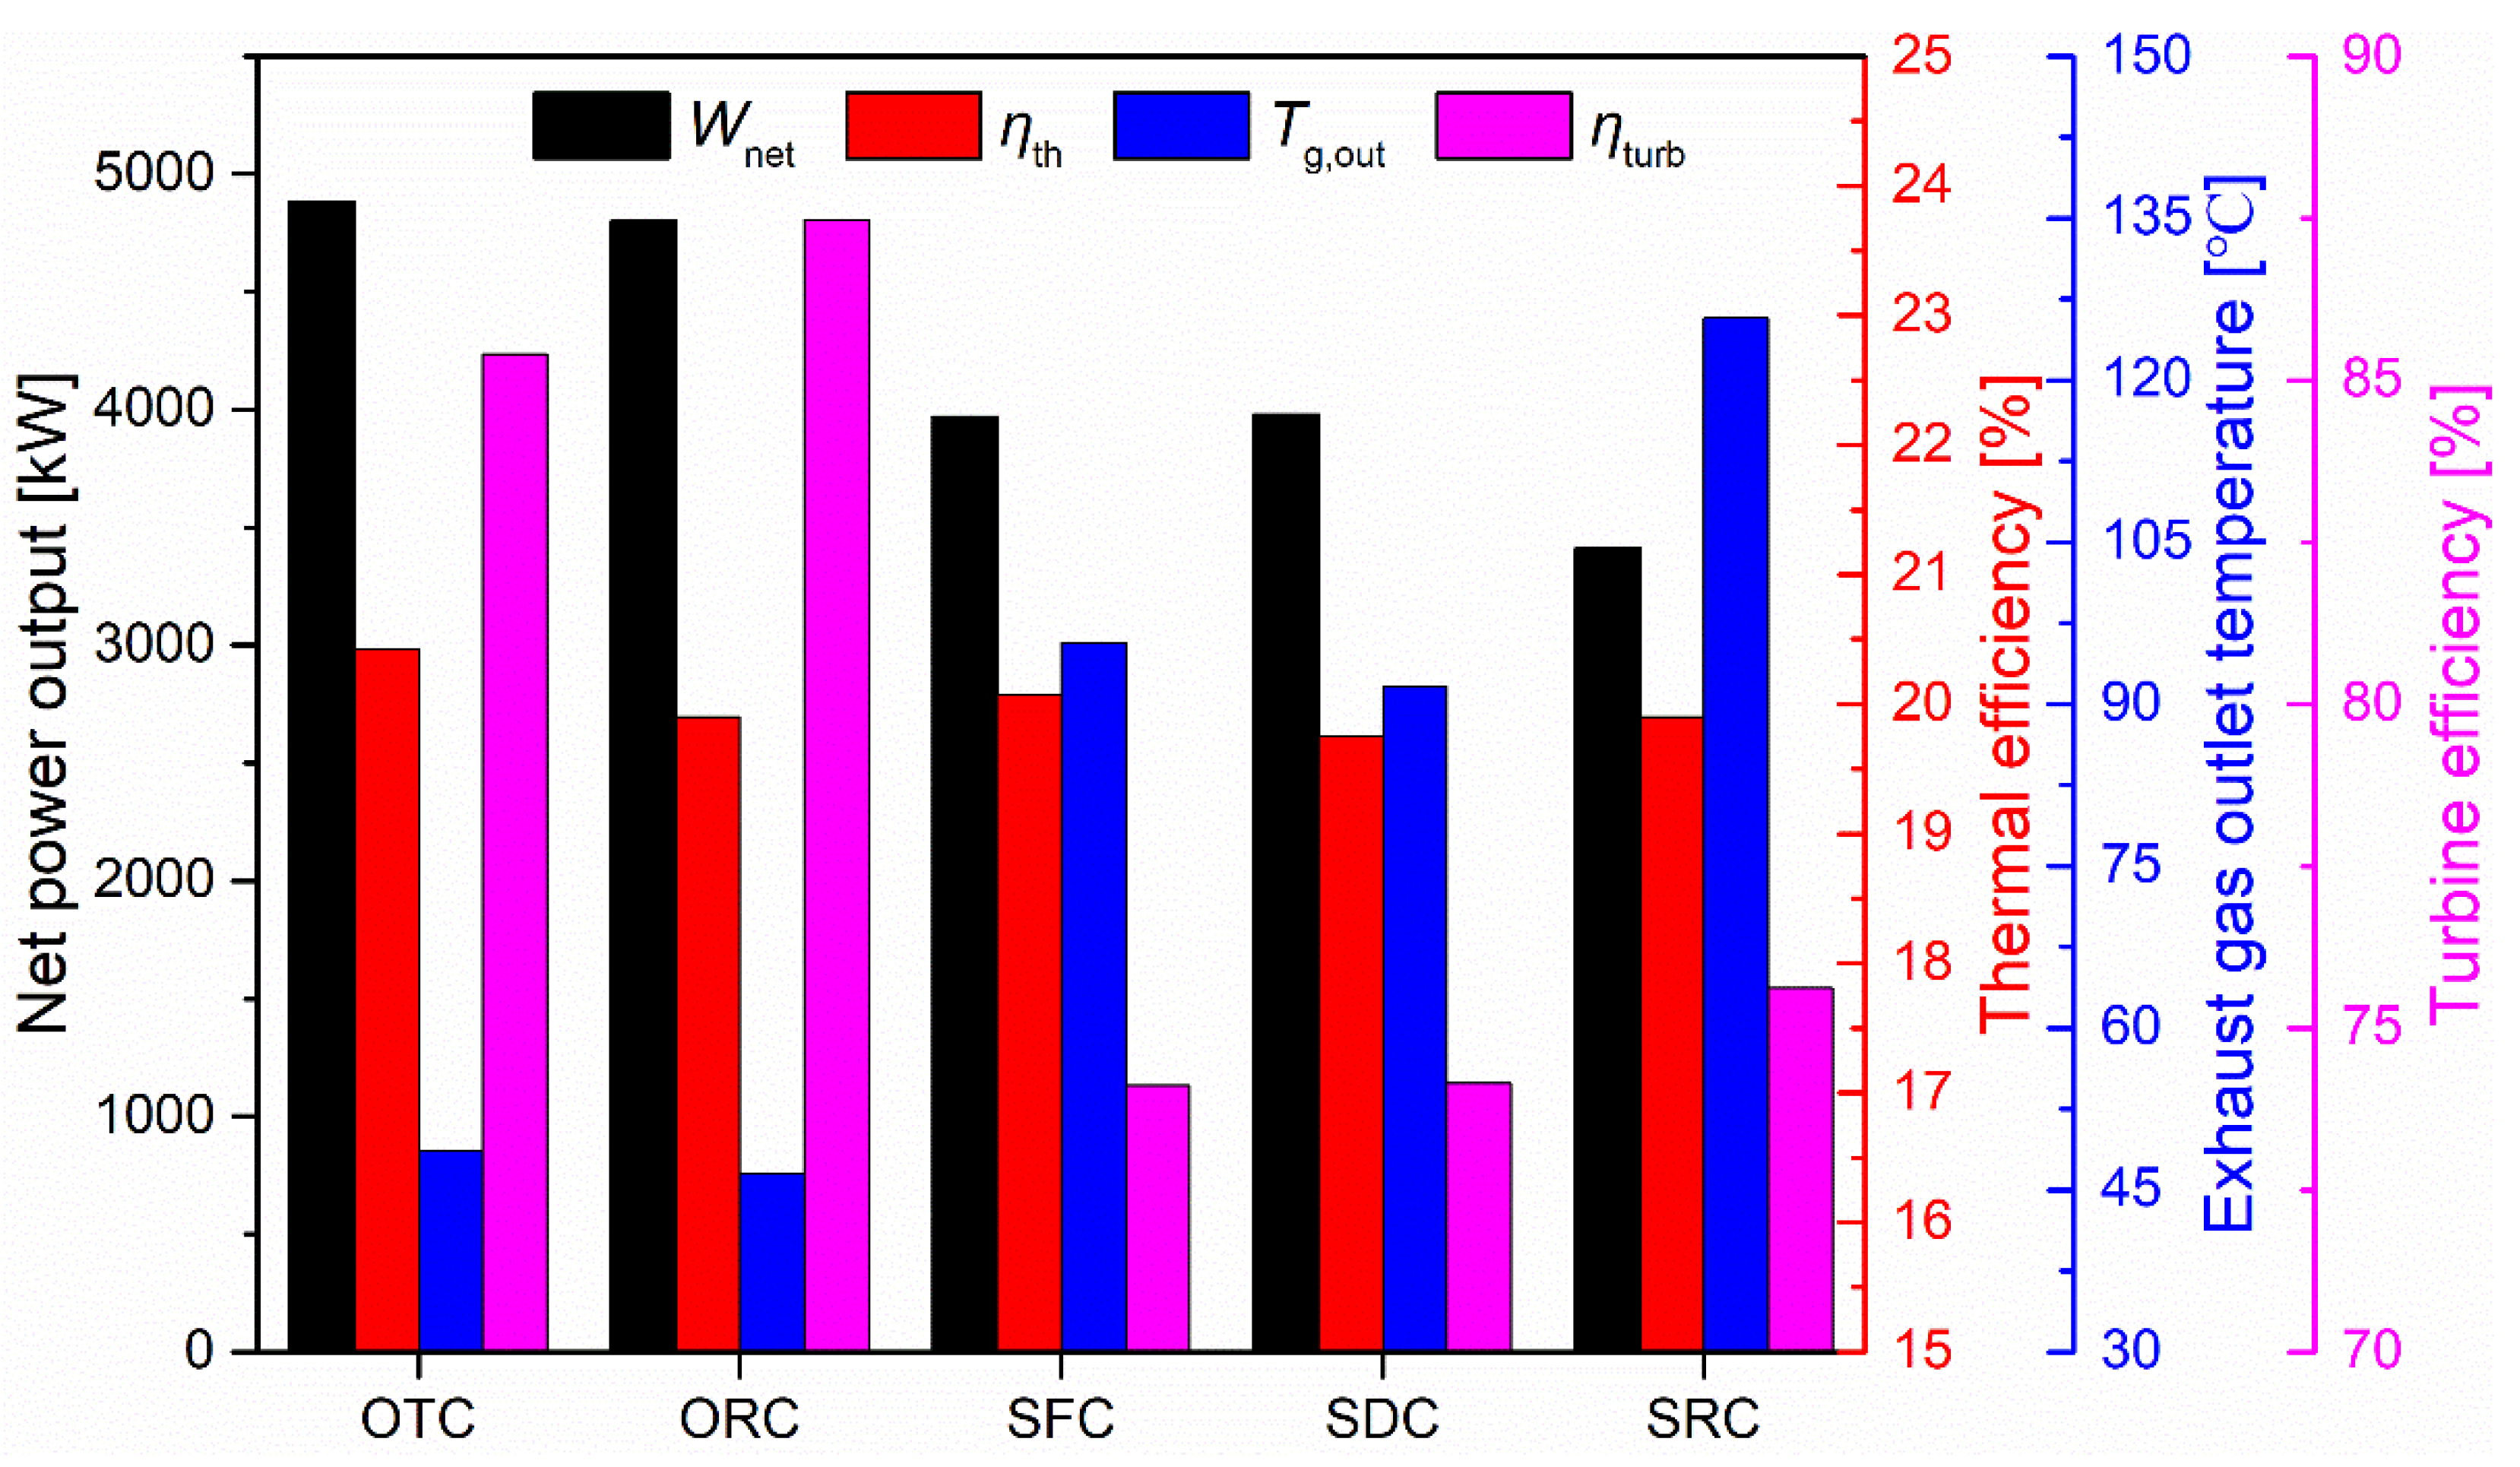
4.4. Performance Comparison of OTC, SFC, and SDC

The comparison of the net power output of OTC using n-pentane, SFC, SDC, the basic ORC with n-pentane as the working fluid and SRC is shown in Figure 18. The corresponding thermal efficiency, exhaust gas outlet temperature and turbine efficiency of each cycle are also given in the figure. For the organic working fluid, when the endothermic pressure is increased from subcritical to supercritical, the turbine efficiency is reduced, but the thermal efficiency and net power output of the system are improved. Compared with the basic SRC, SFC, and SDC enhance the net power output by improving the use of the waste heat. The thermal efficiency of the OTC, SFC, and SDC is almost equal and the maximum net power output of SDC is slightly higher than that of SFC. Owing to the organic working fluid giving much better temperature matching with exhaust gas in the heat addition process and higher turbine efficiency than water, the maximum net power output of OTC is 19.74% higher than that of SDC.

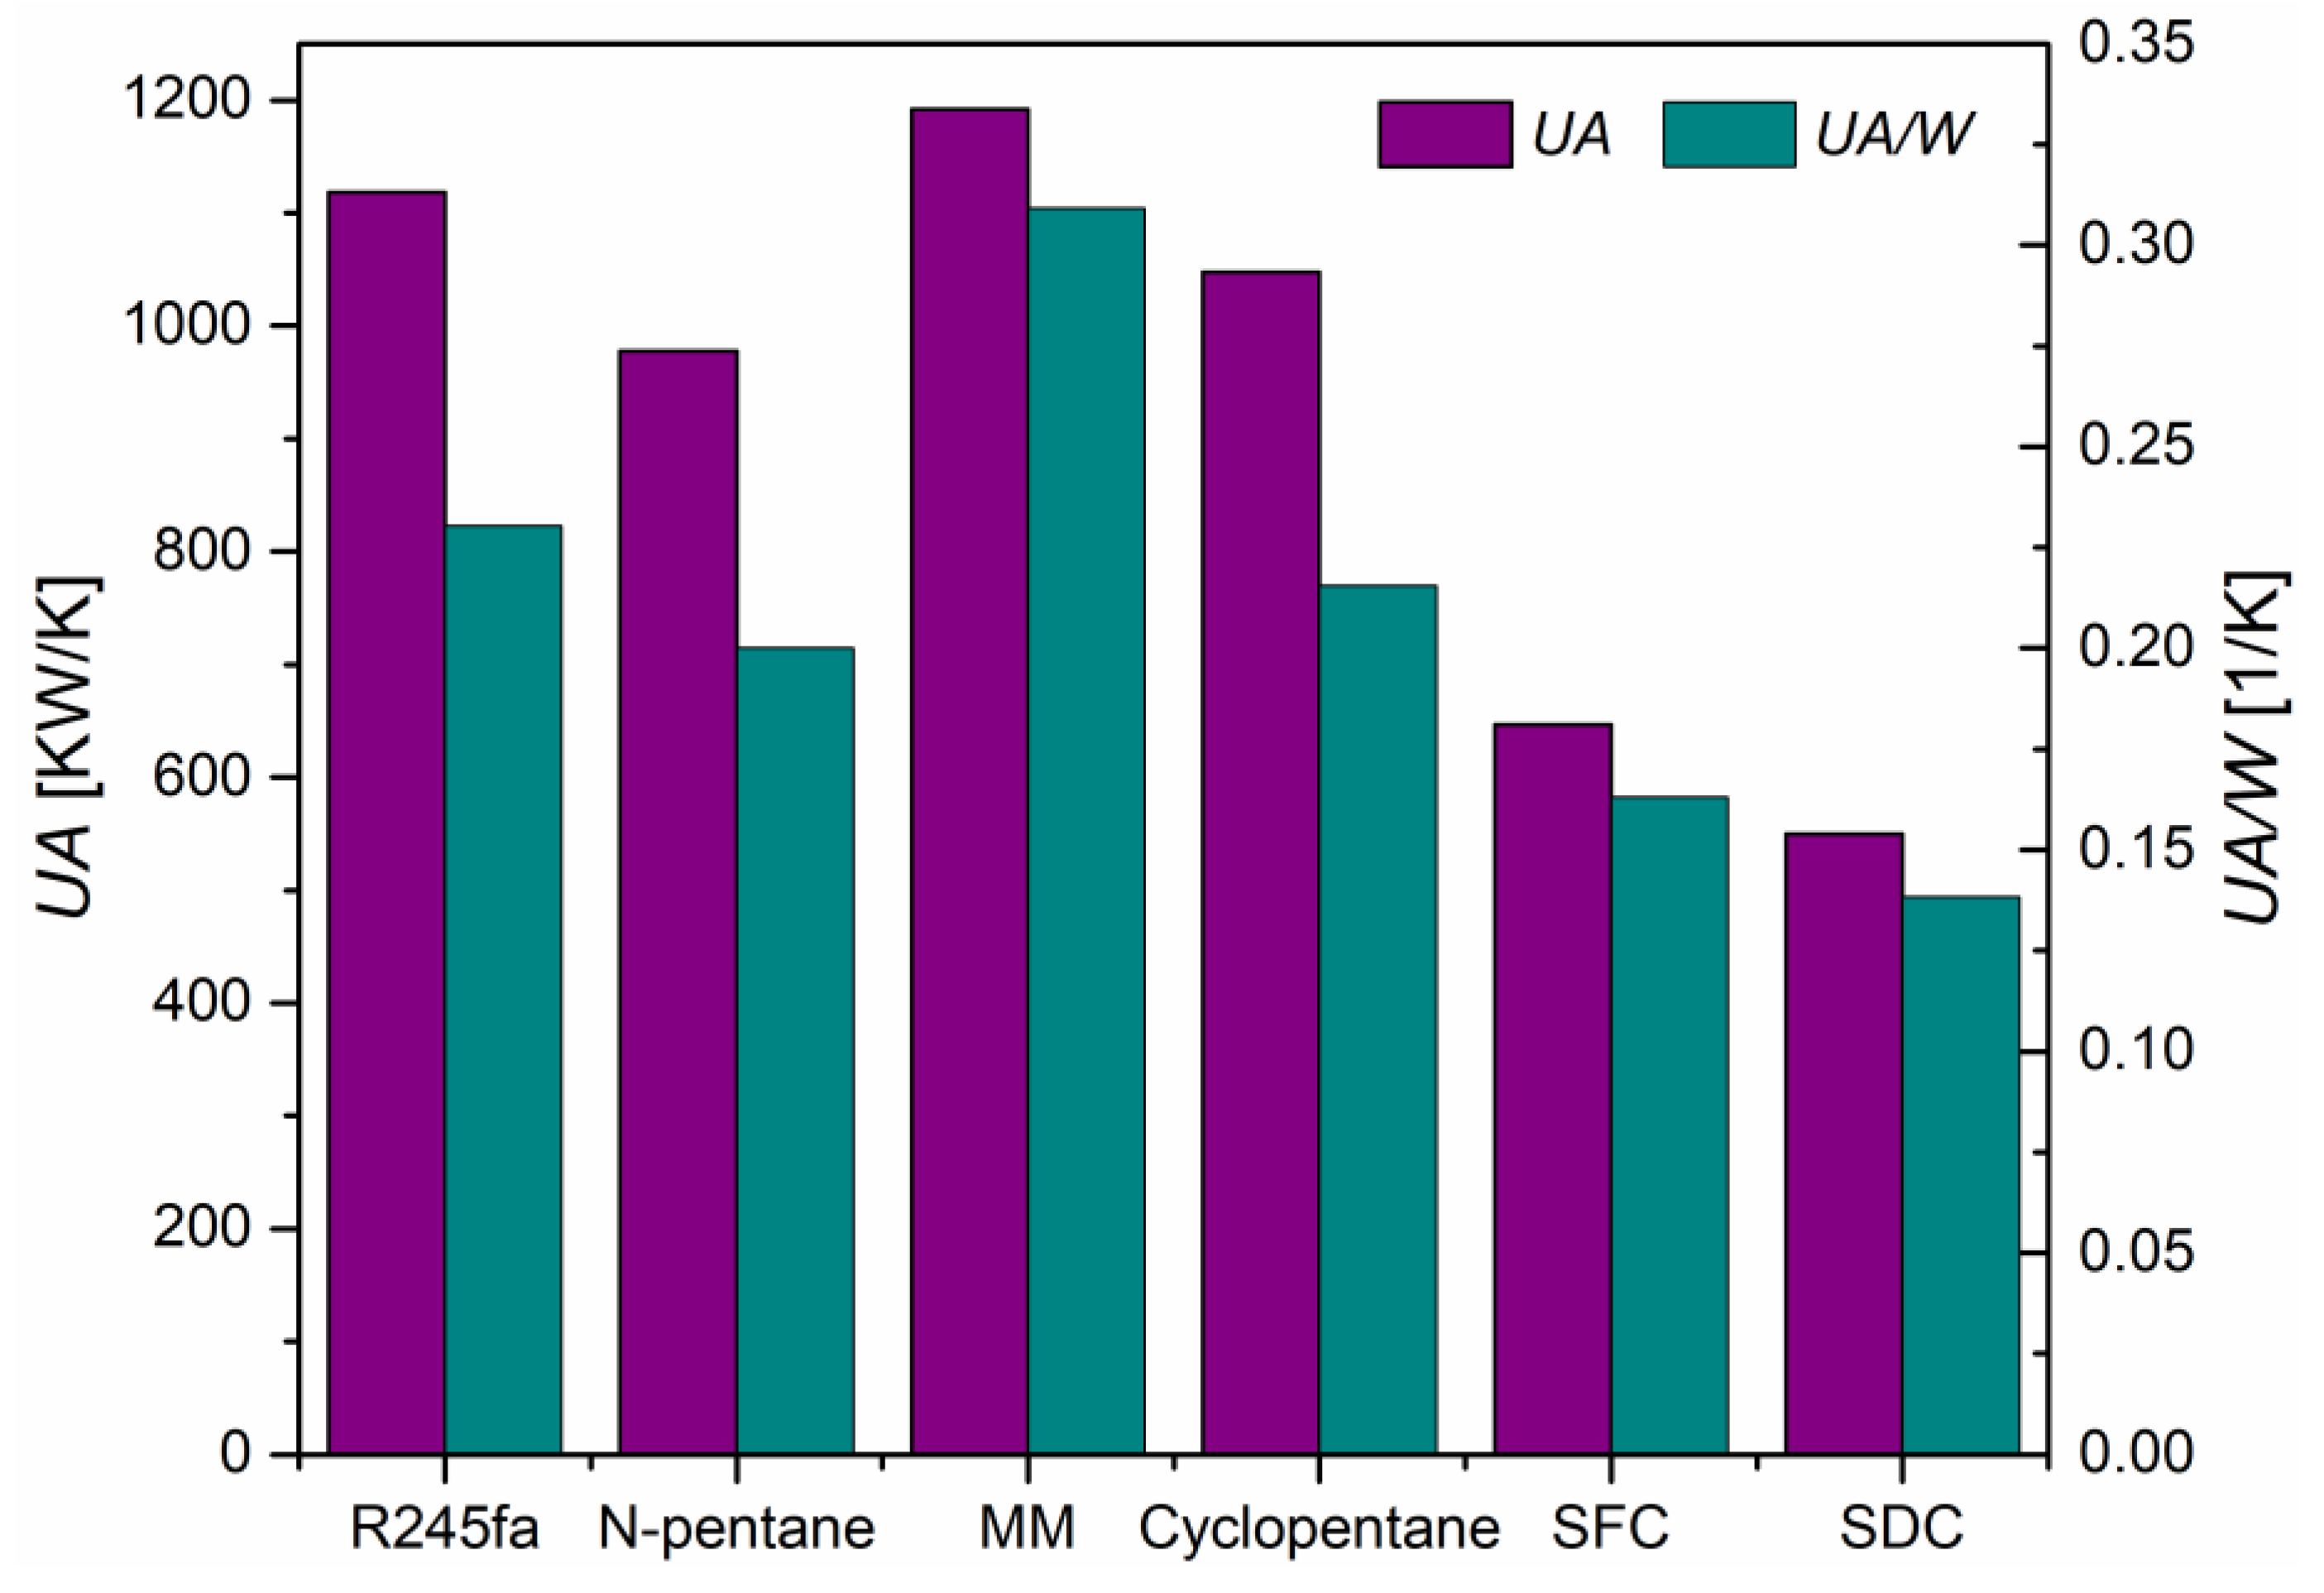
4.5. Cost Analysis of OTC, SFC, and SDC

The cost of HRSG mainly depends on its heat transfer area, and the cost of HRSG accounts for a large proportion of the total cost of the system. In the heat transfer process of the exhaust gas and working fluid, the thermal resistance of the exhaust gas is much higher than that of the working fluid, hence the over-all heat transfer coefficient U of different working fluid has little difference. Therefore, the heat transfer requirement UA of the HRSG can approximately reflect its heat transfer area, and the UA can be evaluated by the following equation:
U A = Q ˙ i Δ T m , i
The heat transfer process between the exhaust gas and working fluid is divided into 100 segments subjected to identical heat flow. The Q ˙ i and Δ T m , i refer to the heat rate and logarithmic mean temperature difference between exhaust gas and working fluid in each segment.
Figure 19 shows the UA of the HRSG when the cycles output the maximum power. It is not surprising that the UA of OTC is higher than that of SFC and SDC since the better temperature matching between the exhaust gas and working fluid means the higher heat absorption and smaller heat transfer temperature difference. The UA/W is further calculated, which means the UA per unit net power output. It can be seen that SDC achieves the minimum UA/W, followed by the SFC. However, we cannot conclude that the SFC and SDC are more economical than OTC, because the cost of other components in the system is not reflected in this indicator. SDC and SFC systems are more complex than the OTC system, and the number of stages of the steam turbine is more than that of the organic turbine, which entails the higher cost of the component.

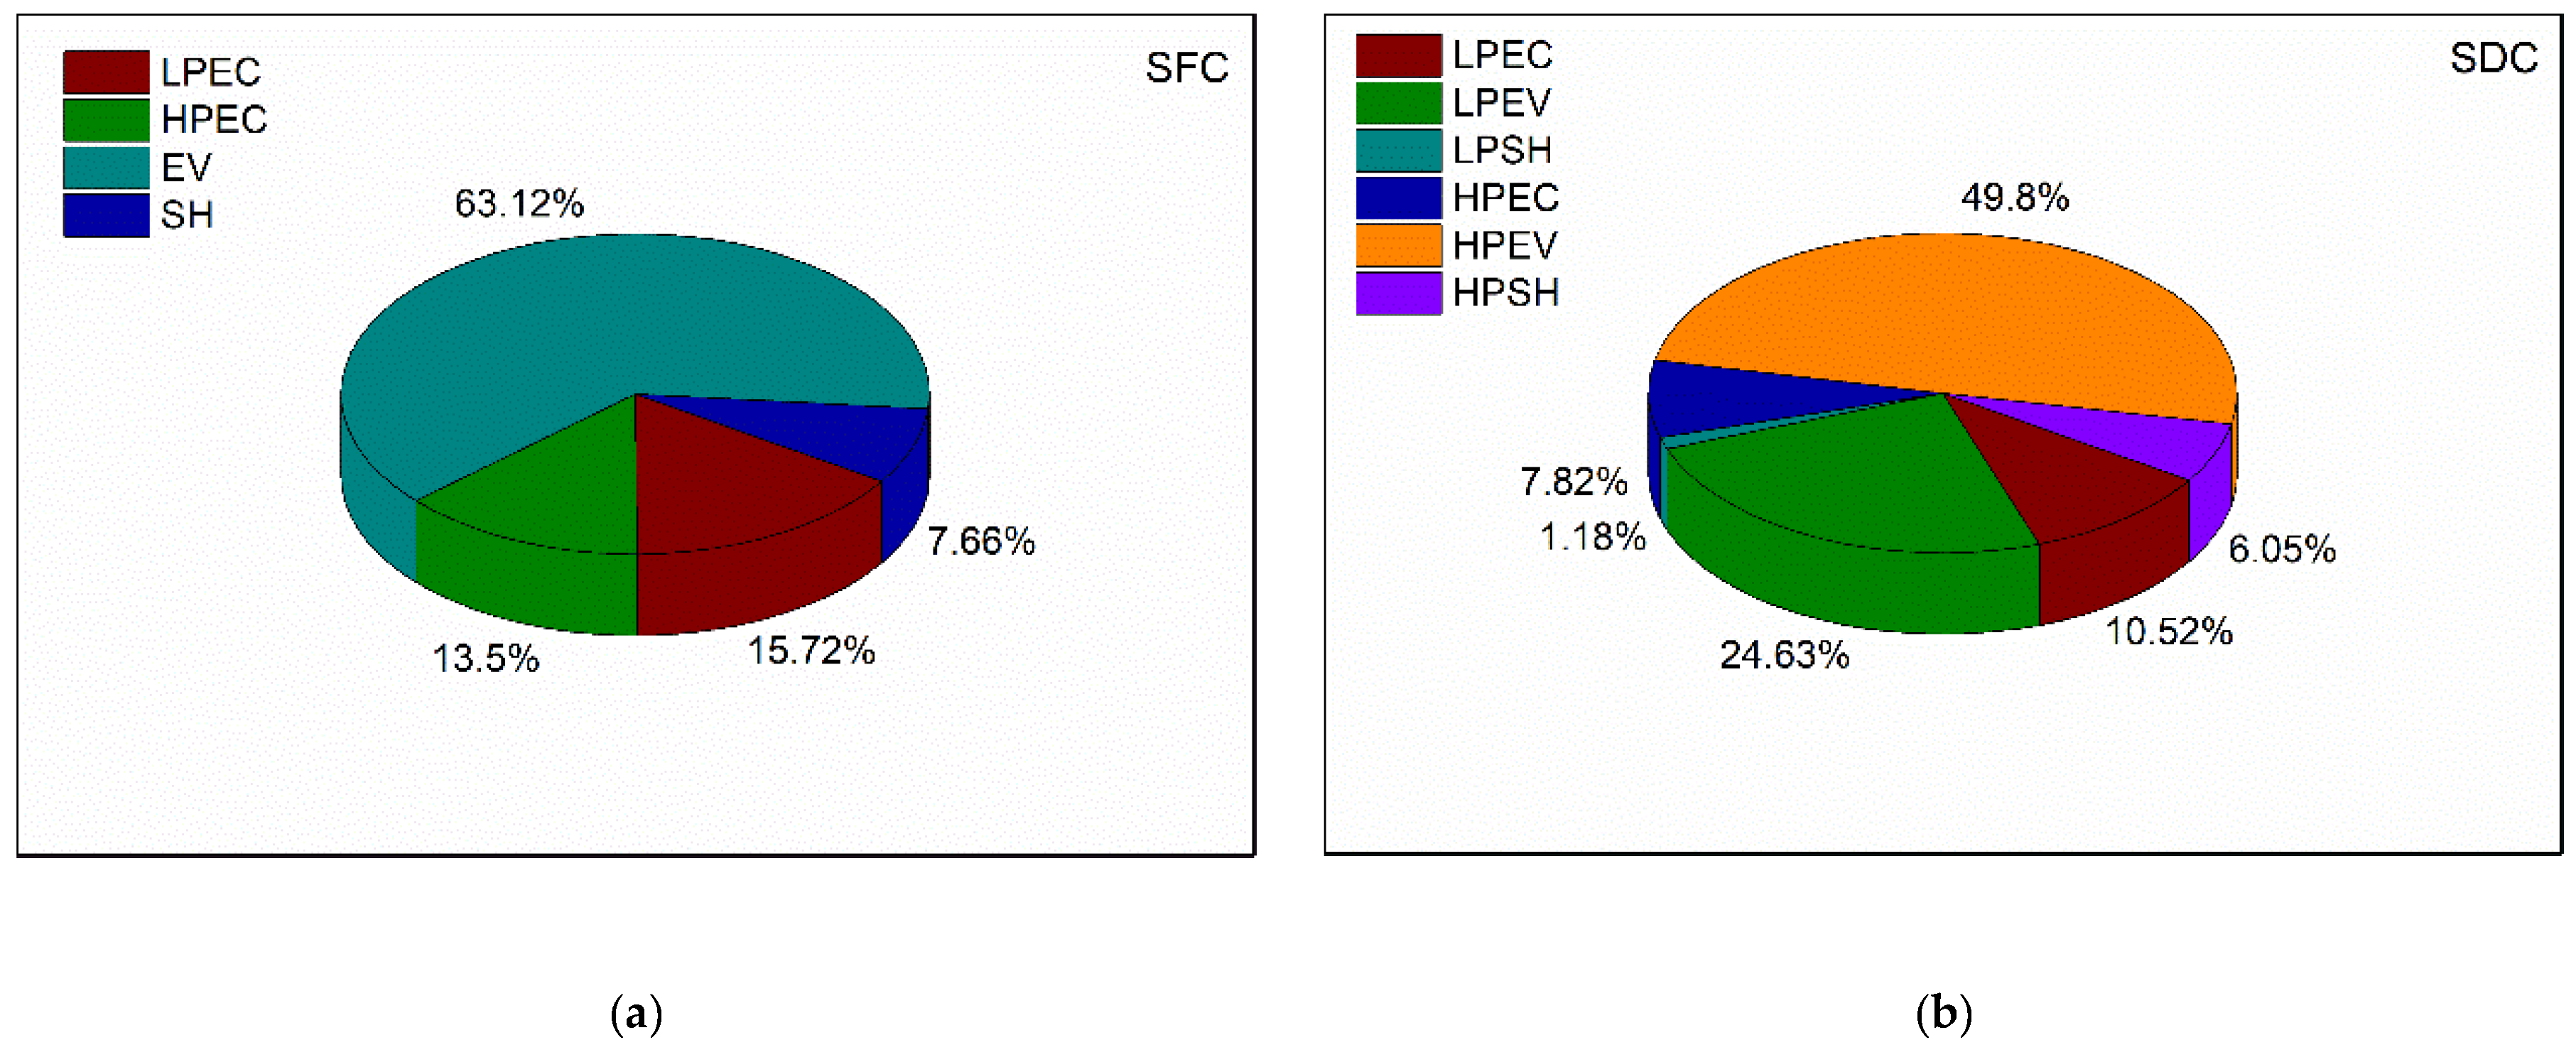
4.6. Exergy Analysis of OTC, SFC, and SDC

The exergy analysis of OTC using n-pentane, SFC, and SDC is shown in Table 9. The exergy input of the system plus the exergy loss in the outlet gas is the total exergy of the exhaust gas heat source. The exergy input of OTC is higher than that of SFC and SDC due to its lower outlet temperature of exhaust gas. The net power output plus the total exergy loss in each component is equal to the exergy input of the system, and the exergy efficiency of OTC, SFC, and SDC is 60.58%, 53.23%, and 52.85%, respectively.
The biggest exergy loss occurs in the condenser for OTC since the temperature of the fluid exiting turbine (121.5 °C) is much higher than the ambient temperature. The exergy loss in HRSG of SFC and SDC is higher than that of OTC, because the temperature matching between exhaust gas and working fluid of SFC and SDC is not as good as that of OTC, resulting in a large heat transfer temperature difference. The turbine efficiency of SFC and SDC is lower than that of OTC (74.12%, 74.15% vs 85.41%), which makes the higher exergy loss in the steam turbine.
Figure 20 shows the partition of the exergy loss in the HRSG of SFC and SDC. For the SFC, the biggest exergy loss occurs in the evaporator; for the SDC, the high-pressure evaporator amounts for the largest exergy loss, followed by the low-pressure evaporator. This tells us that the isothermal evaporating is the main cause of exergy destruction in the heating process.

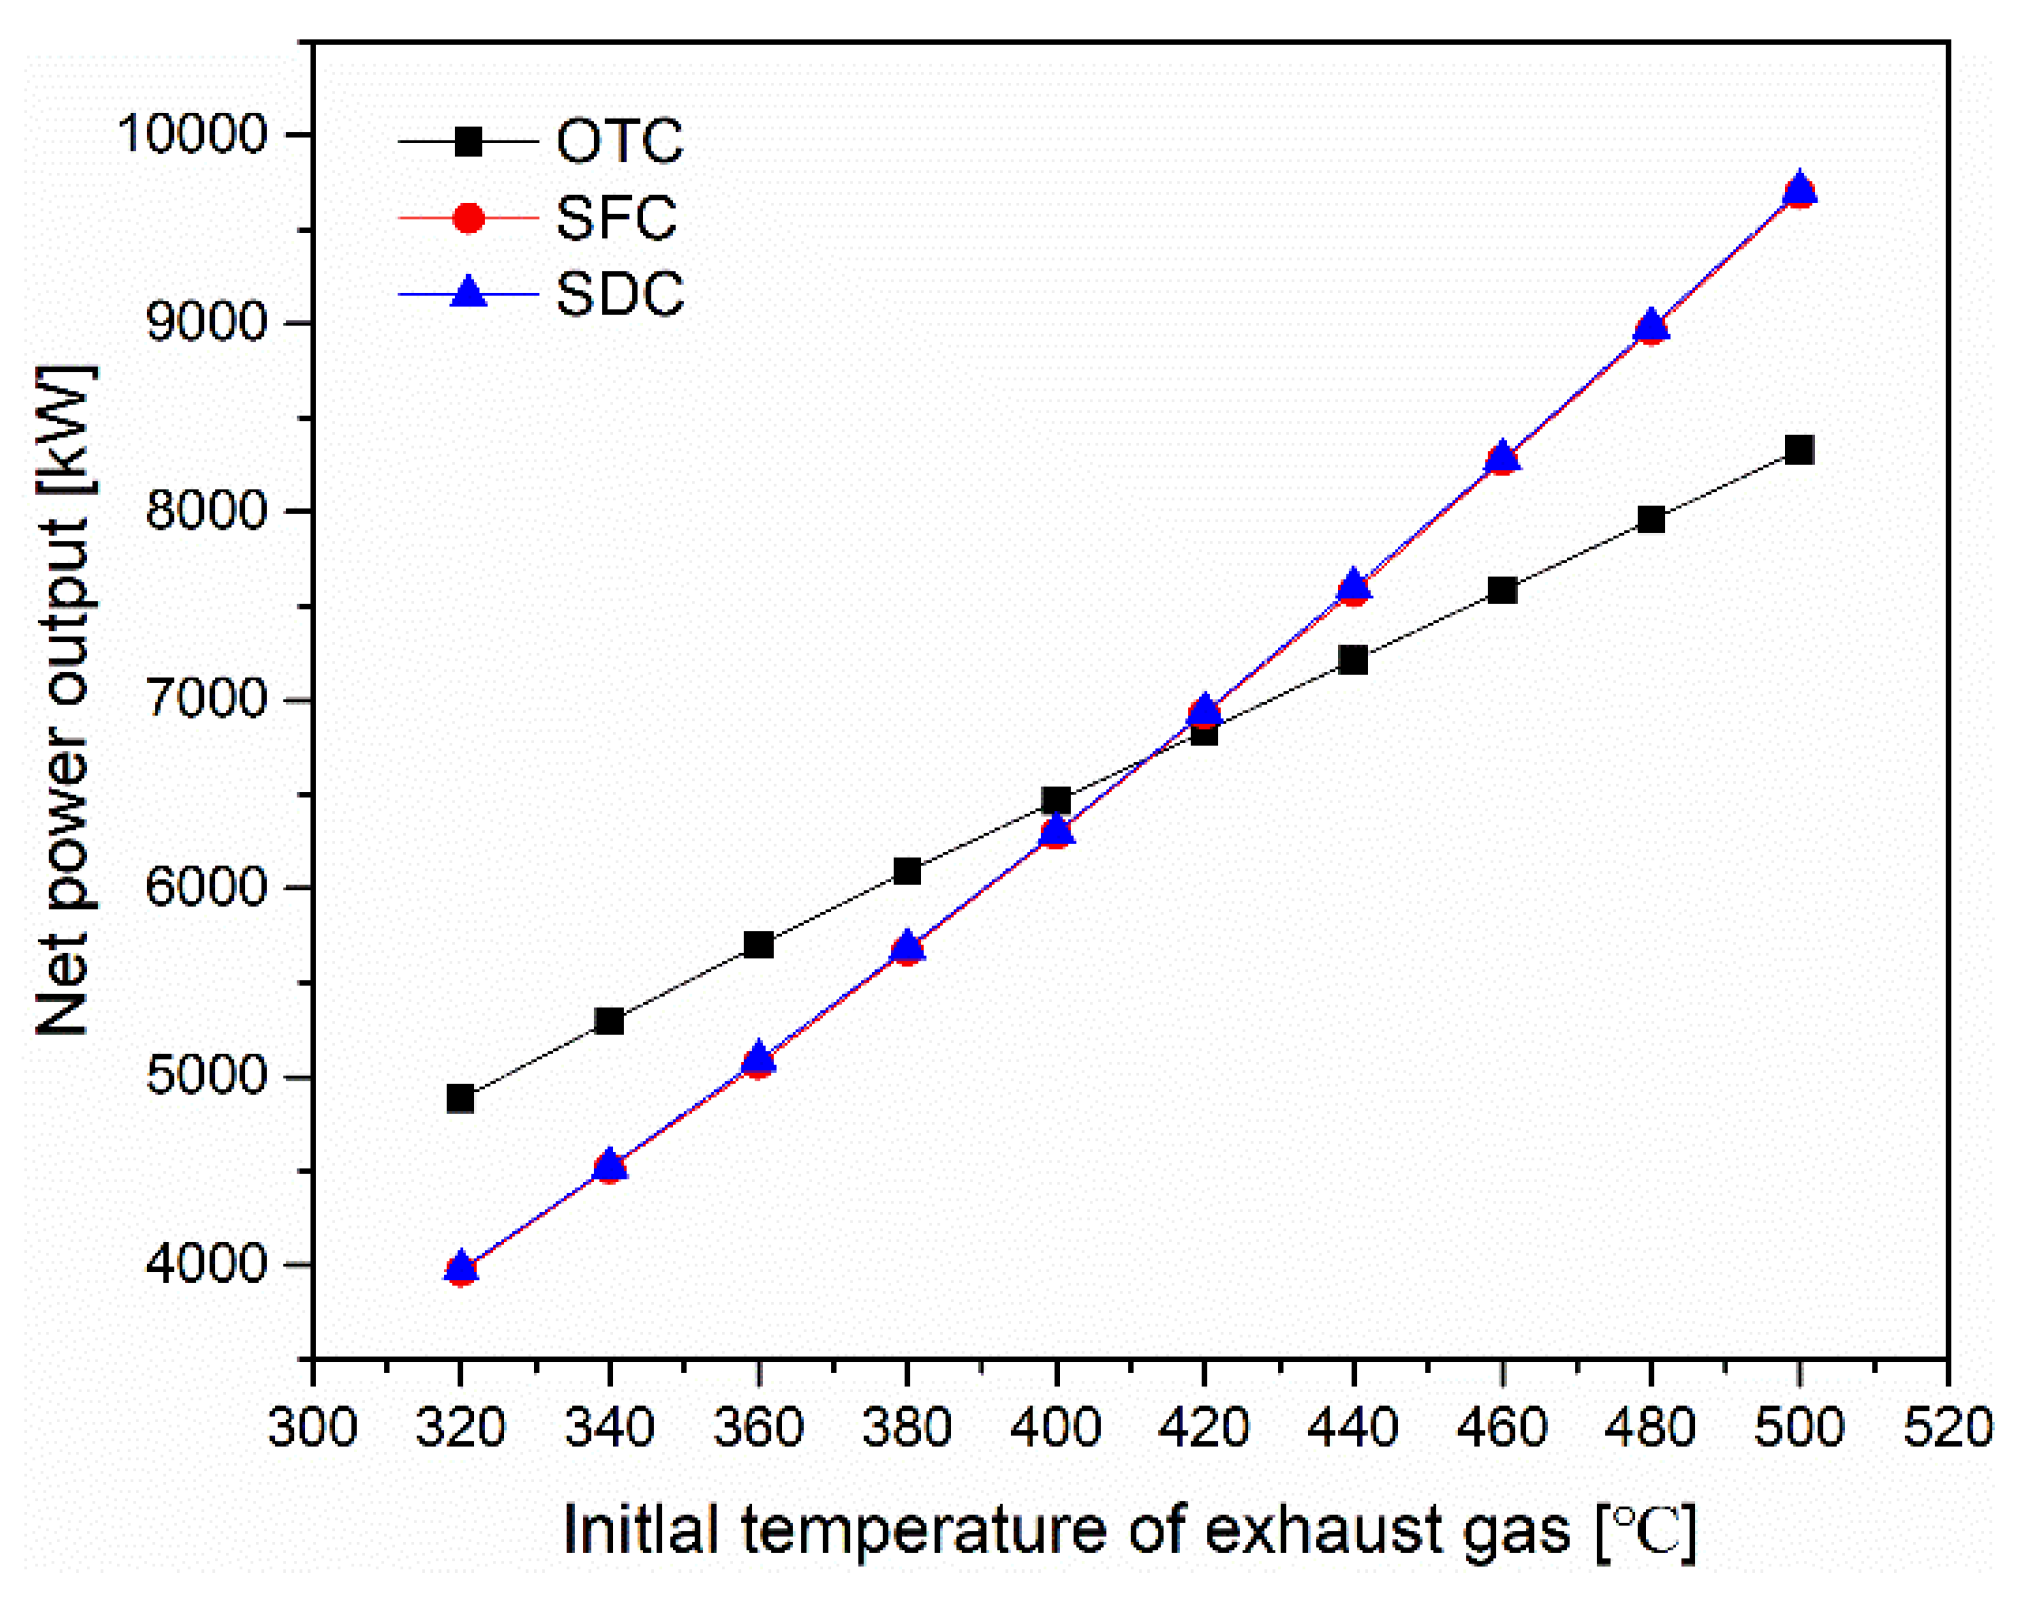
4.7. Performance Comparison under Higher Heat Source Temperature

The above results are based on the given waste heat source with an initial temperature of 320 °C and a mass flow rate of 86.2 kg/s. If the initial temperature of the exhaust gas is further increased, the optimal turbine inlet temperature to maximize the net power output of the cycle will also be increased accordingly. However, the turbine inlet temperature of the OTC is limited by the thermal stable temperature of the organic fluid, which will result in greater exergy destruction in the heating process. Figure 21 presents the maximum net power output of OTC using n-pentane, SFC, and SDC under various initial temperatures of exhaust gas. It can be seen that the maximum net power output of SDC is always slightly higher than that of SFC. When the initial temperature of exhaust gas exceeds 415 °C, the SDC can achieve more power output than the OTC.

5. Conclusions

The OTC, SFC, and SDC systems can be used to recover the waste heat available in the industrial processes. This study focuses on the thermodynamic performance of OTC, SFC, and SDC based on the exhaust gas of an initial temperature of 320 °C and a mass flow rate of 86.2 kg/s which is from the clinker cooler for a cement kiln line of 5000 t/d capacity. Four organic fluids, including R245fa, n-pentane, cyclo-pentane and MM, are selected as working fluids for the OTC, and the optimized thermodynamic performance of the OTC, SFC, and SDC systems are compared. Main conclusions are summarized as follows:
The thermal efficiency of the three cycles is almost equal. The maximum net power output of SDC is slightly higher than that of SFC, while the OTC provides a 19.74% more net power output than the SDC since an improved temperature matching between the exhaust gas and the working fluid in the heat addition process and a higher turbine efficiency are achieved in OTC.
For the OTC, the biggest exergy loss occurs in the condenser due to the higher turbine exiting temperature of the working fluid. For the SFC and SDC, the isothermal evaporating is the main cause of the exergy destruction in the heat addition process.
SDC gives higher net power outputs than OTC does at the initial temperatures of exhaust gas exceeding 415 °C, since the turbine inlet temperature of OTC is limited by the thermal stability of the organic working fluid.

Author Contributions

Conceptualization, H.W.; Data curation, L.R.; Formal analysis, L.R.; Funding acquisition, H.W.; Investigation, L.R.; Methodology, L.R.; Project administration, H.W.; Software, L.R.; Writing—original draft, L.R.; Writing—review & editing, H.W.

Funding

This research was funded by the National Natural Science Foundation of China (No. 51376134).

Conflicts of Interest

The authors declare no conflict of interest.

Nomenclature

eexergy (J/kg)
henthalpy (J/kg)
I ˙ exergy loss (W)
m ˙ mass flow rate (kg/s)
Ppressure (kPa)
Q ˙ heat transfer rate (W)
sentropy (J/kg/K)
SPsize parameter (m)
Ttemperature (°C)
Vrvolume ratio
W ˙ power (W)
xquality of vapor-liquid mixture
Greek letters
η efficiency
Δdifference
Subscript
apapproach point
evaevaporator
ccritical
concondenser
ggas
ininlet
outoutlet
pppinch point
ththermal
turbturbine
wfworking fluid
Abbreviations
ECeconomizer
EVevaporator
HPhigh pressure
HRVGheat recovery vapor generator
HRSGheat recovery steam generator
LPlow pressure
OTCorganic trans-critical cycle
RPMrevolutions per minute
SDCsteam dual-pressure cycle
SFCsteam flash cycle
SHsuperheater
SRCsteam Rankine cycle

References

  1. Toffolo, A.; Lazzaretto, A.; Manente, G.; Paci, M. A multi-criteria approach for the optimal selection of working fluid and design parameters in Organic Rankine Cycle systems. Appl. Eng. 2014, 121, 219–232. [Google Scholar] [CrossRef]
  2. Wang, T.; Zhang, Y.; Peng, Z.; Shu, G. A review of researches on thermal exhaust heat recovery with Rankine cycle. Renew. Sustain. Energy Rev. 2011, 15, 2862–2871. [Google Scholar] [CrossRef]
  3. Tona, P.; Peralez, J.; Sciarretta, A. Supervision and Control Prototyping for an Engine Exhaust Gas Heat Recovery System based on a Steam Rankine Cycle. In Proceedings of the 2012 IEEE/ASME International Conference on Advanced Intelligent Mechatronics (AIM), Kaohsiung, Taiwan, 11–14 July 2012; pp. 695–701. [Google Scholar]
  4. Fu, J.; Liu, J.; Ren, C.; Wang, L.; Deng, B.; Xu, Z. An open steam power cycle used for IC engine exhaust gas energy recovery. Energy 2012, 44, 544–554. [Google Scholar] [CrossRef]
  5. Karellas, S.; Leontaritis, A.-D.; Panousis, G.; Bellos, E.; Kakaras, E. Energetic and exergetic analysis of waste heat recovery systems in the cement industry. Energy 2013, 58, 147–156. [Google Scholar] [CrossRef]
  6. Darrow, K.; Tidball, R.; Wang, J.; Hampson, A. Technology Characterization-Steam Turbines; Environmental Protection Agency Combined Heat and Power Partnership: Washington, DC, USA, 2015. [Google Scholar]
  7. Vankeirsbilck, I.; Vanslambrouck, B.; Gusev, S.; De Paepe, M. Organic Rankine cycle as efficient alternative to steam cycle for small scale power generation. In Proceedings of the 8th international conference on heat transfer fluid mechanics and thermodynamics, Mauritius, 11–13 July 2011. [Google Scholar]
  8. Bao, J.; Zhao, L. A review of working fluid and expander selections for organic Rankine cycle. Renew. Sustain. Energy Rev. 2013, 24, 325–342. [Google Scholar] [CrossRef]
  9. Altosole, M.; Benvenuto, G.; Campora, U.; Laviola, M.; Trucco, A. Waste heat recovery from marine gas turbines and diesel engines. Energies 2017, 10, 718. [Google Scholar] [CrossRef] [Green Version]
  10. Verschoor, M.J.E.; Brouwer, E.P. Description of the SMR cycle, which combines fluid elements of steam and organic Rankine cycles. Energy 1995, 20, 295–303. [Google Scholar] [CrossRef]
  11. Manente, G.; Da Lio, L.; Lazzaretto, A. Influence of axial turbine efficiency maps on the performance of subcritical and supercritical Organic Rankine Cycle systems. Energy 2016, 107, 761–772. [Google Scholar] [CrossRef]
  12. Lia, J.; Ge, Z.; Duan, Y.; Yang, Z.; Liu, Q. Parametric optimization and thermodynamic performance comparison of single-pressure and dual-pressure evaporation organic Rankine cycles. Appl. Eng. 2018, 217, 409–421. [Google Scholar] [CrossRef]
  13. Mondal, S.; De, S. Power by waste heat recovery from low temperature industrial flue gas by Organic Flash Cycle (OFC) and transcritical-CO2 power cycle: A comparative study through combined thermodynamic and economic analysis. Energy 2017, 121, 832–840. [Google Scholar] [CrossRef]
  14. Wang, J.; Yan, Z.; Wang, M.; Ma, S.; Dai, Y. Thermodynamic analysis and optimization of an (organic Rankine cycle) ORC using low grade heat source. Energy 2013, 49, 356–365. [Google Scholar] [CrossRef]
  15. Pradeep Varma, G.V.; Srinivas, T. Comparative study on steam flash, organic flash and Kalina for enhanced power generation from waste heat recovery. J. Power Technol. 2016, 96, 81–91. [Google Scholar]
  16. Andreasen, J.; Meroni, A.; Haglind, F. A comparison of organic and steam Rankine cycle power systems for waste heat recovery on large ships. Energies 2017, 10, 547. [Google Scholar] [CrossRef] [Green Version]
  17. Macchi, E.; Astolfi, M. Organic Rankine Cycle (ORC) Power Systems-Axial Flow Turbines for Organic Rankine Cycle Applications; Woodhead publishing, Politecnico di Milano: Milan, Italy, 2017; Volume 9, pp. 299–319. [Google Scholar]
  18. Bahadori, A.; Vuthaluru, H.B. Estimation of performance of steam turbines using a simple predictive tool. Appl. Therm. Eng. 2010, 30, 1832–1838. [Google Scholar] [CrossRef]
  19. Feng, H.; Zhong, W.; Wu, Y.; Tong, S. Thermodynamic performance analysis and algorithm model of multi-pressure heat recovery steam generators (HRSG) based on heat exchangers layout. Energy Convers. Manag. 2014, 81, 282–289. [Google Scholar] [CrossRef]
  20. Li, C.; Wang, H. Power cycles for waste heat recovery from medium to high temperature flue gas sources-from a view of thermodynamic optimization. Appl. Eng. 2016, 180, 707–721. [Google Scholar] [CrossRef]
  21. Astolfi, M.; Romano, M.C.; Bombarda, P.; Macchi, E. Binary ORC (Organic Rankine Cycles) power plants for the exploitation of medium-low temperature geothermal sourcese Part B: Techno-economic optimization. Energy 2014, 66, 435–446. [Google Scholar] [CrossRef]
  22. Colonna, P.; Casati, E.; Trapp, C.; Mathijssen, T.; Larjola, J.; Turunen-Saaresti, T.; Unsitalo, A. Organic Rankine cycle power systems: From the concept to current technology, applications, and an outlook to the future. J. Eng. Gas Turbine Power 2015, 137, 1–19. [Google Scholar] [CrossRef] [Green Version]
  23. Angelino, G.; Invernizzi, C. Experimental investigation on the thermal stability of some new zero ODP refrigerants. Int. J. Refrig. 2003, 26, 51–58. [Google Scholar] [CrossRef]
  24. Dai, X.; Shi, L.; An, Q.; Qian, W. Chemical kinetics method for evaluating the thermal stability of Organic Rankine Cycle working fluids. Appl. Therm. Eng. 2016, 100, 708–713. [Google Scholar] [CrossRef]
  25. Pasetti, M.; Invernizzi, C.M.; Iora, P. Thermal stability of working fluids for organic Rankine cycles: An improved survey method and experimental results for cyclopentane, isopentane and n-butane. Appl. Therm. Eng. 2014, 73, 764–774. [Google Scholar] [CrossRef]
  26. Preißinger, M.; Brüggemann, M. Thermal stability of MM for high temperature applications. In Proceedings of the 3rd International Seminar on ORC Power Systems, Brussels, Belgium, 12–14 October 2015. [Google Scholar]
  27. Lemmon, E.W.; Huber, M.L.; McLinden, M.O. Reference Fluid Thermodynamic and Transport Properties–REFPROP, Version 9.0; National Institute of Standards and Technology: Gaithersburg, MD, USA, 2013. [Google Scholar]
Figure 1. Schematic diagram of the organic trans-critical cycle.
Energies 12 04623 g001
Figure 2. T-s diagram of the organic trans-critical cycle.
Energies 12 04623 g002
Figure 3. Schematic diagram of the steam flash cycle.
Energies 12 04623 g003
Figure 4. T-s diagram of the steam flash cycle.
Energies 12 04623 g004
Figure 5. T-Q diagram of flue gas and working fluid in the HRSG of steam flash cycle.
Energies 12 04623 g005
Figure 6. Schematic diagram of the steam dual-pressure cycle.
Energies 12 04623 g006
Figure 7. T-s diagram of the steam dual-pressure cycle.
Energies 12 04623 g007
Figure 8. T-Q diagram of flue gas and working fluid in the HRSG of SDC.
Energies 12 04623 g008
Figure 9. Effects of the turbine inlet pressure and temperature on the system thermal efficiency.
Energies 12 04623 g009
Figure 10. Effects of the turbine inlet pressure and temperature on the turbine efficiency.
Energies 12 04623 g010
Figure 11. Effects of the turbine inlet pressure and temperature on the exhaust gas outlet temperature.
Energies 12 04623 g011
Figure 12. Temperature matching between the heat source and working fluid for the OTC: (a) Turbine inlet temperature = 280 °C; (b) Turbine inlet temperature = 230 °C.
Energies 12 04623 g012
Figure 13. Effects of turbine inlet pressure and temperature on the system net power output.
Energies 12 04623 g013
Figure 14. Effect of mass flow ratio on the system performance of SFC.
Energies 12 04623 g014
Figure 15. Thermal matching between the heat source and working fluid for the SFC.
Energies 12 04623 g015
Figure 16. Effect of flashing temperature on the system performance of SFC.
Energies 12 04623 g016
Figure 17. T-Q diagram of the heat source and working fluid for the SDC and basic SRC.
Energies 12 04623 g017
Figure 18. Performance comparison of OTC, SFC, and SDC.
Energies 12 04623 g018
Figure 19. The UA and UA/W of HRSG for the OTC, SFC, and SDC.
Energies 12 04623 g019
Figure 20. Distribution of the exergy loss in HRSG. (a) SFC; (b) SDC.
Energies 12 04623 g020
Figure 21. The maximum net power output of OTC, SFC, and SDC under the various initial temperature of exhaust gas.
Energies 12 04623 g021
Table 1. Mass and energy balance equations, and exergy loss in each component.
ComponentEquations
OTC
HRVG Q ˙ = m ˙ g ( h g , i n h g , i n ) = m ˙ w f ( h 1 h 4 ) I ˙ = T 0 [ m ˙ w f ( s 1 s 4 ) m ˙ g ( s g , i n s g , o u t ) ]
Turbine W ˙ t u r b = m ˙ w f ( h 1 h 2 ) = m ˙ w f ( h 1 h 2 s ) η t u r b I ˙ = T 0 m ˙ w f ( s 2 s 1 )
Condenser Q ˙ = m ˙ w f ( h 2 h 3 ) I ˙ = m ˙ w f [ h 2 h 3 T 0 ( s 2 s 3 ) ]
Pump W ˙ p u m p = m ˙ w f ( h 4 h 3 ) = m ˙ w f ( h 4 s h 3 ) / η p u m p I ˙ = T 0 m ˙ w f ( s 4 s 3 )
Net power output W ˙ net = W ˙ t u r b W ˙ p u m p
SFC
HRSG Q ˙ = m ˙ g ( h g , i n h g , i n ) = m ˙ w f , 4 ( h 5 h 4 ) + m ˙ w f , 6 ( h 7 h 6 ) + m ˙ w f , 1 ( h 1 h 7 ) m ˙ w f , 4 = m ˙ w f , 1 + m ˙ w f , 10 m ˙ w f , 6 = m ˙ w f , 5 + m ˙ w f , 9 = m ˙ w f , 1 + m ˙ w f , 8 I ˙ = T 0 [ m ˙ w f , 4 ( s 5 s 4 ) + m ˙ w f , 6 ( s 7 s 6 ) + m ˙ w f , 1 ( s 1 s 7 ) m ˙ g ( s g , i n s g , o u t ) ]
Turbine 1 W ˙ t u r b , 1 = m ˙ w f , 1 ( h 1 h 2 ) I ˙ = T 0 m ˙ w f , 1 ( s 2 s 1 )
Turbine 2 W ˙ t u r b , 2 = m ˙ w f , 10 ( h 10 h 11 ) I ˙ = T 0 m ˙ w f , 10 ( s 11 s 10 )
Condenser Q ˙ = m ˙ w f , 1 ( h 2 h 3 ) + m ˙ w f , 10 ( h 11 h 3 ) I ˙ = m ˙ w f , 1 [ h 2 h 3 T 0 ( s 2 s 3 ) ] + m ˙ w f , 10 [ h 11 h 3 T 0 ( s 11 s 3 ) ]
Low-pressure Pump W ˙ p u m p , L P = m ˙ w f , 4 ( h 4 h 3 ) I ˙ = T 0 m ˙ w f , 4 ( s 4 s 3 )
High-pressure Pump W ˙ p u m p , H P = m ˙ w f , 6 ( h 6 h 5 ) I ˙ = T 0 m ˙ w f , 6 ( s 6 s 5 )
Flasher h w f , 8 = h w f , 7 m ˙ w f , 10 = m ˙ w f , 8 x w f , 8 m ˙ w f , 9 = m ˙ w f , 8 ( 1 x w f , 8 ) I ˙ = T 0 m ˙ w f , 8 ( s 8 s 7 )
Net power output W ˙ net = W ˙ t u r b , 1 + W ˙ t u r b , 2 W ˙ p u m p , L P W ˙ p u m p , H P
SDC
HRSG Q ˙ = m ˙ g ( h g , i n h g , i n ) = m ˙ w f , 5 ( h 5 h 4 ) + m ˙ w f , 6 ( h 8 h 6 ) + m ˙ w f , 1 ( h 1 h 10 ) m ˙ w f , 5 = m ˙ w f , 6 + m ˙ w f , 1 I ˙ = T 0 [ m ˙ w f , 5 ( s 5 s 4 ) + m ˙ w f , 6 ( s 8 s 6 ) + m ˙ w f , 1 ( s 1 s 10 ) m ˙ g ( s g , i n s g , o u t ) ]
Turbine 1 W ˙ t u r b , 1 = m ˙ w f , 1 ( h 1 h 2 ) I ˙ = T 0 m ˙ w f , 1 ( s 2 s 1 )
Turbine 2 W ˙ t u r b , 2 = m ˙ w f , 6 ( h 8 h 9 ) I ˙ = T 0 m ˙ w f , 6 ( s 9 s 8 )
Condenser Q ˙ = m ˙ w f , 1 ( h 2 h 3 ) + m ˙ w f , 6 ( h 9 h 3 ) I ˙ = m ˙ w f , 1 [ h 2 h 3 T 0 ( s 2 s 3 ) ] + m ˙ w f , 6 [ h 9 h 3 T 0 ( s 9 s 3 ) ]
Low-pressure Pump W ˙ p u m p , L P = m ˙ w f , 5 ( h 4 h 3 ) I ˙ = T 0 m ˙ w f , 5 ( s 4 s 3 )
High-pressure Pump W ˙ p u m p , H P = m ˙ w f , 1 ( h 10 h 5 ) I ˙ = T 0 m ˙ w f , 1 ( s 10 s 5 )
Net power output W ˙ net = W ˙ t u r b , 1 + W ˙ t u r b , 2 W ˙ p u m p , L P W ˙ p u m p , H P
Table 2. Thermophysical properties of the four considered fluids.
FluidTboil [°C]Tcrit [°C]Pcrit [MPa]ODPGWPThermal Stability Limit [°C]
R245fa15.14154.013.6501030300 [23]
n-pentane36.06196.553.370 4 ± 2 280 [24]
Cyclopentane49.25238.544.520< 25275 [25]
MM100.25245.551.9400300 [26]
Table 3. Boundaries of the optimized parameters for the OTC, SFC, and SDC.
Optimized parametersLower limitUpper limit
OTC
Turbine inlet pressure (TIP), p 1 1.1pc15 MPa
Turbine inlet temperature (TIT), T 1 No liquid formation during expansion process T stable ,   limit
SFC
Turbine inlet pressure, p 1 Pcon + 100 kPa0.9pc
Turbine inlet temperature, T 1 Vapor quality at turbine outlet higher than 0.88 T g , i n Δ T p p
Mass flow ratio, MFR06
Flash pressure, p 10 Pcon + 50 kPaMin { p 1 − 50 kPa, Vapor quality at turbine outlet higher than 0.88}
SDC
Turbine 1 inlet pressure, p 1 Pcon + 100 kPa0.9pc
Turbine 1 inlet temperature, T 1 Vapor quality at turbine outlet higher than 0.88 T g , i n Δ T p p
Turbine 2 inlet pressure, p 8 Pcon + 50 kPa p 1 − 50 kPa
Turbine 2 inlet temperature, T 8 Vapor quality at turbine outlet higher than 0.88 T g , i n Δ T p p
Table 4. Specified parameters of the OTC, SFC, and SDC system.
ParameterValue
Exhaust gas initial temperature, T g , i n 320 °C
Exhaust gas mass flow rate, m ˙ g 86.2 kg/s
Exhaust gas pressure, p g 101.325 kPa
Ambient temperature, T 0 20 °C
Condensing temperature, T 3 30 °C
Pinch point temperature difference in HRVG/HRSG, Δ T p p 15 °C
Approach temperature difference in HRSG, Δ T a p 5 °C
Working fluid pump efficiency, η p u m p 0.8
Table 5. Control parameters in GA.
Tuning ParametersValueTuning ParametersValue
Number of individuals100Generation interval for migration20
Number of subpopulations5Fraction of subpopulation for migration0.2
The probability of crossover0.7Minimum number of generation limit150
The probability for mutation0.1Objective function tolerance0.01
Table 6. Optimized variables and the system performance of the OTC.
FluidTIP [MPa]TIT [°C]Tg,out [°C] η turb   [ % ] η th   [ % ] W ˙ n e t   [ kW ]
R245fa14.56275.4752.8185.3920.614851.76
n-pentane5.14240.5548.6685.4120.424884.73
Cyclopentane6.31266.5464.6682.2721.594860.20
MM2.13265.5554.9180.0116.513855.92
Table 7. Optimized variables and the system performance of the SFC.
Teva [°C]TIT [°C]Tflash [°C]MFRTg,out [°C] η turb   [ % ] η th   [ % ] W ˙ n e t   [ kW ]
177.83305105.933.5995.6874.1220.073967.9
Table 8. Optimized variables and the system performance of the SDC.
Teva,main [°C]TITmain [°C]Teva, LP [°C]TITLP [°C]Tg,out [°C] η turb   [ % ] η th   [ % ] W ˙ n e t   [ kW ]
177.1930597.57158.6191.5874.1519.753977.8
Table 9. The exergy inputs, outputs, and losses in components for OTC, SFC, and SDC.
OTCSFCSDC
Exergy input of system [kW] 8063.67454.97526.5
Exergy loss in outlet gas [kW] 107.9716.7645.1
Net power output [kW] 4884.73967.93977.8
Exergy loss in component [kW]HRVG1084.11343.41720.7
Turbine677.91352.71347.3
Condenser1347.1469.3479.7
Pump69.8
LP pressure 0.2060.152
HP pressure 3.720.852
Flasher 317.7

