Article

Evaluation of Hydrogen Sulfide Scrubbing Systems for Anaerobic Digesters on Two U.S. Dairy Farms

1
Department of Environmental Science and Technology, University of Maryland, College Park, MD 20742, USA
2
Department of Biological and Environmental Engineering, Cornell University, Ithaca, NY 14853, USA
*
Author to whom correspondence should be addressed.
Energies 2019, 12(24), 4605; https://doi.org/10.3390/en12244605
Submission received: 5 November 2019 / Revised: 29 November 2019 / Accepted: 2 December 2019 / Published: 4 December 2019
(This article belongs to the Special Issue Biogas for Rural Areas)

Abstract

:
Hydrogen sulfide (H2S) is a corrosive trace gas present in biogas produced from anaerobic digestion systems that should be removed to reduce engine-generator set maintenance costs. This study was conducted to provide a more complete understanding of two H2S scrubbers in terms of efficiency, operational and maintenance parameters, capital and operational costs, and the effect of scrubber management on sustained H2S reduction potential. For this work, biogas H2S, CO2, O2, and CH4 concentrations were quantified for two existing H2S scrubbing systems (iron-oxide scrubber, and biological oxidation using air injection) located on two rural dairy farms. In the micro-aerated digester, the variability in biogas H2S concentration (average: 1938 ± 65 ppm) correlated with the O2 concentration (average: 0.030 ± 0.004%). For the iron-oxide scrubber, there was no significant difference in the H2S concentrations in the pre-scrubbed (450 ± 42 ppm) and post-scrubbed (430 ± 41 ppm) biogas due to the use of scrap iron and steel wool instead of proprietary iron oxide-based adsorbents often used for biogas desulfurization. Even though the capital and operating costs for the two scrubbing systems were low (<$1500/year), the lack of dedicated operators led to inefficient performance for the two scrubbing systems.

Graphical Abstract

1. Introduction:

Hydrogen sulfide (H2S) is a corrosive gas that can corrode and damage, even in trace quantities, engine-generator sets (EGS) utilizing biogas from anaerobic digestion (AD) for electricity production. The produced H2S can react with water vapor present in the biogas producing hydrosulfuric acid that can be further oxidized to sulfuric acid, which can cause corrosion. Hydrogen sulfide is also toxic to living organisms under certain concentrations and can result in range of adverse health effects. The US Occupational Safety and Health Administration (OSHA) lists the acceptable ceiling concentration for human exposure to H2S to be 20 ppm for an 8-h duration [1]. In some industrial sectors, the total weighted average exposure limit is 10 ppm over 8 h. The acceptable peak concentration above the ceiling concentration is 50 ppm, but for a maximum time limit of 10 min. Concentrations exceeding 500 ppm in a closed environment can lead to death within 30–60 min, while concentrations exceeding 1000 ppm is instantly fatal [2]. Combustion of H2S also leads to SOx emissions, which has harmful environmental effects. Anaerobic digesters, used in conjunction with H2S scrubbers, are effective at controlling odor problems, which is often perceived as an environmental issue by residents living close to dairy farms [3]. For digestion systems with EGS to operate effectively, it is important to remove H2S from biogas before utilization.
Corrosion from H2S has led to interrupted operation of farm-based EGS, resulting in increased maintenance costs and decreased revenues [4]. Biogas is a saturated (4% to 5% moisture content) mixture of 50% to 70% methane (CH4) and 30% to 50% carbon dioxide (CO2), with traces of H2S (100–10,000 ppm; 0.01% to 1%). The variability of H2S in biogas production and different efficiencies of scrubbers in reducing H2S in the biogas over time can also affect EGS downtimes and overall lifetime [5,6]. The recommended upper limits of H2S concentration for energy conversion technologies that use biogas are outlined in Table 1.
The two H2S scrubbing techniques discussed in this study include: (1) biological desulfurization (BDS) of H2S using sulfur-oxidizing bacteria (SOB) to oxidize H2S to elemental sulfur and sulfates, which can occur in a separate bio-trickling filter (BTF) or with air injection into the digester headspace, and (2) physical-chemical adsorption and oxidation using iron oxides.
Biological conversion of H2S results from microbial oxidation in an oxygenated environment. Small concentrations of air (or oxygen) are injected into a biological scrubbing system, such as a BTF, or into the digester headspace [9]. The oxygen is used by SOB, which use H2S, sulfur, and thiosulfate as their primary energy sources. Schieder et al. (2003) showed 90% reduction in H2S concentrations (up to 5000 ppm) using BTF-based biogas scrubbers (BIO-Sulfex® biofilter modules (Promis Company, Warsaw, Poland), with inlet biogas flow rates ranging from 10 to 350 m3/h [10]. A simpler method of BDS of biogas is the controlled addition of oxygen or air directly into the digester headspace, which creates a micro-aerobic environment for H2S oxidation. However, air injection needs to be carefully controlled in order to prevent accidental formation of explosive gas mixtures of CH4 and O2 [3]. With differences based on the temperature, residence time, and the percentage of injected air, there have been full-scale digesters with micro-aeration that have observed reductions as high as 80% to 99%, reducing H2S in the biogas from approximately 500 ppm to 20–100 ppm [2].
Iron oxide pellets or wood chips impregnated with iron oxide (also known as ‘iron sponge’) can also be used for biogas desulfurization [11]. The iron oxide in the media reacts with the H2S and is converted into iron sulfide. Iron sponge is the most recognized iron oxide adsorbent in the industry with H2S reductions >99.9% (3600 ppm to 1 ppm after scrubbing) reported in the literature [2]. The iron sponge adsorbent can also operate in conjunction with a small air flow into the system, along with the biogas input, to promote continuous regeneration. Sulfide removal rates up to 2.5 kg H2S/kg Fe2O3 have been observed in continuously regenerated systems with <1% oxygen input [12]. Studies have shown that proprietary iron oxide-based scrubbing systems, such as SOXSIA® (Gastreatment Services, Bergambacht, Netherlands), can remove up to 2000 ppm of H2S at 40 °C, with biogas flow rates of 1000 Nm3/h in full-scale anaerobic digestion (AD) systems, resulting in 2 Nm3 of H2S removed per hour (2.9 kg H2S/h) [8].
A previous study investigated the performance and economic benefits of two BTF systems on NY farms and found that the total annual cost to own and operate the scrubbers may not justify the capital and maintenance costs of the scrubber systems compared to increasing the frequency of oil changes [4]. It was suggested that longer monitoring periods may be necessary to understand the benefits of H2S scrubbing on major generator overhauls. The study also highlighted the importance of a dedicated operator for keeping the systems functioning at peak efficiency. A report published on biomethane production in California estimated the cost of an H2S scrubbing system to be around 10% of the total capital costs [3]. It was also suggested that the use of H2S scrubbers was dependent on the end-use of the biogas, as more frequent oil changes (every 300 h instead of 600 h) could be sufficient for maintaining EGS health. Even though several H2S scrubbing technologies exist, there is only limited field-scale data on long-term H2S removal efficiency, and the costs associated with operating and maintaining a scrubbing system, especially on rural dairy farms in the United States [2].
The objective of this study was to quantify the efficacy and costs associated with H2S scrubber systems using units on dairy farms with AD systems. Two different H2S scrubber systems on rural US dairy farms were evaluated through quantification of scrubbing efficiency, capital costs, maintenance costs, and maintenance practices to determine how scrubber management affected the performance of these systems. The results can be used to understand the costs, maintenance requirements, and variations over time for these two H2S scrubbing systems.

2. Methods

2.1. Farm and H2S Scrubber Information

The iron oxide scrubber (IOS) on Farm 1 (SIOS) treated biogas from an ambient temperature anaerobic digester. The 2574 m3 AD system received a combination of food waste and the liquid fraction of dairy manure after solid-liquid separator. The unheated digester was exposed to ambient temperatures, which resulted in lower biogas production during winter months. In addition, there was no mixing of the substrate inside the digester. The farm (750 cows) operated a 110-kW EGS for electricity production, with the produced energy used on-farm.
The vessel for the H2S scrubber was a 208 L plastic drum. PVC piping was used for the connection from the digester to the scrubber and then to the EGS. The iron oxide scrubber was filled with rusted scrap iron and steel scrapings (approximately 50% volume of the scrubber system). Additional rusted scrap iron (approximately 25% of the scrubber volume) was added by the farmer after 45 days of monitoring (without cleaning out used media in the vessel) to increase the efficiency of the scrubbing unit. After 105 days, the old media was removed and changed to fresh grade 000 steel wool (252 pads, 4.4 kg) (Homax, Bellingham, WA, USA) to determine if the increased surface area of this material would affect scrubber performance. The scrubber media covered three-quarter of the entire volume (156 L) of the scrubbing unit in order to enhance the contact time between the untreated biogas and the steel wool.
Biogas flow rate from the digester was measured before the biogas passed through the scrubber. There were no condensation traps before the scrubber to collect condensed water from water vapor present in the produced biogas. The biogas exited the digester and entered the bottom of the scrubber, flowing through the barrel over the scrubbing media before exiting from the top of the scrubber vessel. A regenerative blower (Gast Regenair Model—R5325R-50, Benton Harbor, MI, USA) installed at the outlet of the scrubber was used to pull the biogas through the scrubber and directed the biogas to the generator. The generator was operated only during the farm operational hours, which averaged 12 h per day.
The air injection pump for BDS (SBDS) inside the digester headspace on Farm 2 was connected to a commercially designed, mixed anaerobic digester. Raw unseparated dairy manure (650 cows) was mixed with solid food waste (discarded produce) and fed into 1817 m3 capacity digester. Electricity was generated using a 140-kW generator. The digester was heated to 35 °C using the waste heat from the EGS, with electricity sold to the grid. The generator was operated continuously, with breaks in operation for maintenance and repairs only.
The H2S scrubber system consisted of an air pump that pumped air into the headspace of the digester. The pump (SST10 Aquatic Ecosystems Inc, Pentair, Apopka, FL, USA) was rated at 223 W, 51 Nm3/h, and single phase (115/230 V). The air pump was set to inject air at a consistent rate of 2.86 m3/h. A rotameter attached to the air pump, installed by the farmer, was used to measure the flowrate. The installed air pump did not have an automatic air flow regulator to change the airflow according to the amount of H2S in the biogas. The pipe from the air pump to the digester headspace required regular maintenance to prevent clogs.

2.2. Performance Monitoring and Cost Information

The CH4, and H2S concentrations were logged for 179 and 73 days for SIOS and SBDS, respectively. The scrubber system capital costs were confirmed, and the scrubber maintenance costs were collected for at least one year from each farm. Untreated and treated biogas were analyzed to detect daily and seasonal differences using two portable continuous biogas testing and monitoring systems (Siemens Model #7MB2337-3CR13-5DR1, Siemens AG, Munich, Germany) for CH4 (0% to 100%), CO2 (0% to 100%), O2 (0% to 100%), and H2S (0–5000 ppm), with a Campbell Scientific CR1000 data logger and acquisition system, and gas meters (Model #9500, Thermal Instrument Co, Trevose, PA, USA; Model #FT2, Fox Thermal, Marina, CA, USA) and assembled as described in Shelford et al. 2019 [4]. The monitoring system were moved and installed at each farm for the study period (73 and 179 days). The Ultramat 23 was capable of an auto-calibration with air every eight hours, with regular monitoring and calibration of the units were conducted according to manufacturer’s standards to maintain the accuracy of the H2S sensors. The monitoring systems collected data for 15 min for each biogas stream (pre- and post-H2S scrubbing). Operation and maintenance records of the AD and scrubbing systems was undertaken by the farmers, with records on the time and costs spent on their AD and scrubber system, including oil change costs, generator repair costs, and electrical energy generated over 12 months, if available.
At the end of December 2016, the gas analyzer system installed for project purposes on Farm 2 (SBDS) started malfunctioning and the system had to be removed for repairs, likely due to H2S corrosion. The on-farm biogas was then field tested using a Landtec handheld gas meter (Biogas 5000, Landtec, Dexter, MI, USA) during farm visits.

2.3. H2S Removal Calculations

Hydrogen sulfide percent removal (η) was calculated using the formula:
η = ( C i n     C o u t ) C i n × 100 %
where Cin and Cout (ppm) are the scrubber inlet and outlet H2S concentrations. The daily mass (grams/d) of sulfur removed (w) was calculated using the formula:
w =   ( C i n     C o u t ) ×   1.43   ×   F 1000
where Cin and Cout (ppm) are the scrubber inlet and outlet H2S concentrations, 1.43 kg/m3 is the gas density at NTP (20 °C, 1 atm), and F is the biogas flow rate (m3/d).

2.4. Statistical Analysis

Significant differences in pre- and post-scrubbed CH4 and H2S concentrations over time within each farm was determined using t-tests using SAS® statistical analysis software (version 9.4, SAS Institute Inc., Cary, NC, USA), with an alpha value set at 0.05. All values are presented as mean ± standard error.

3. Results and Discussion

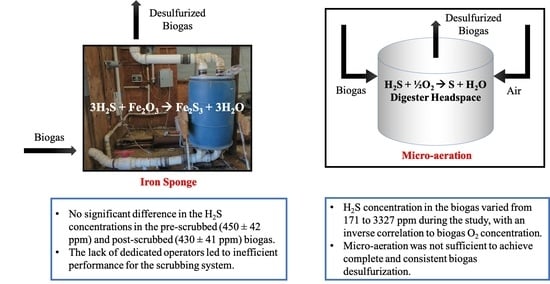
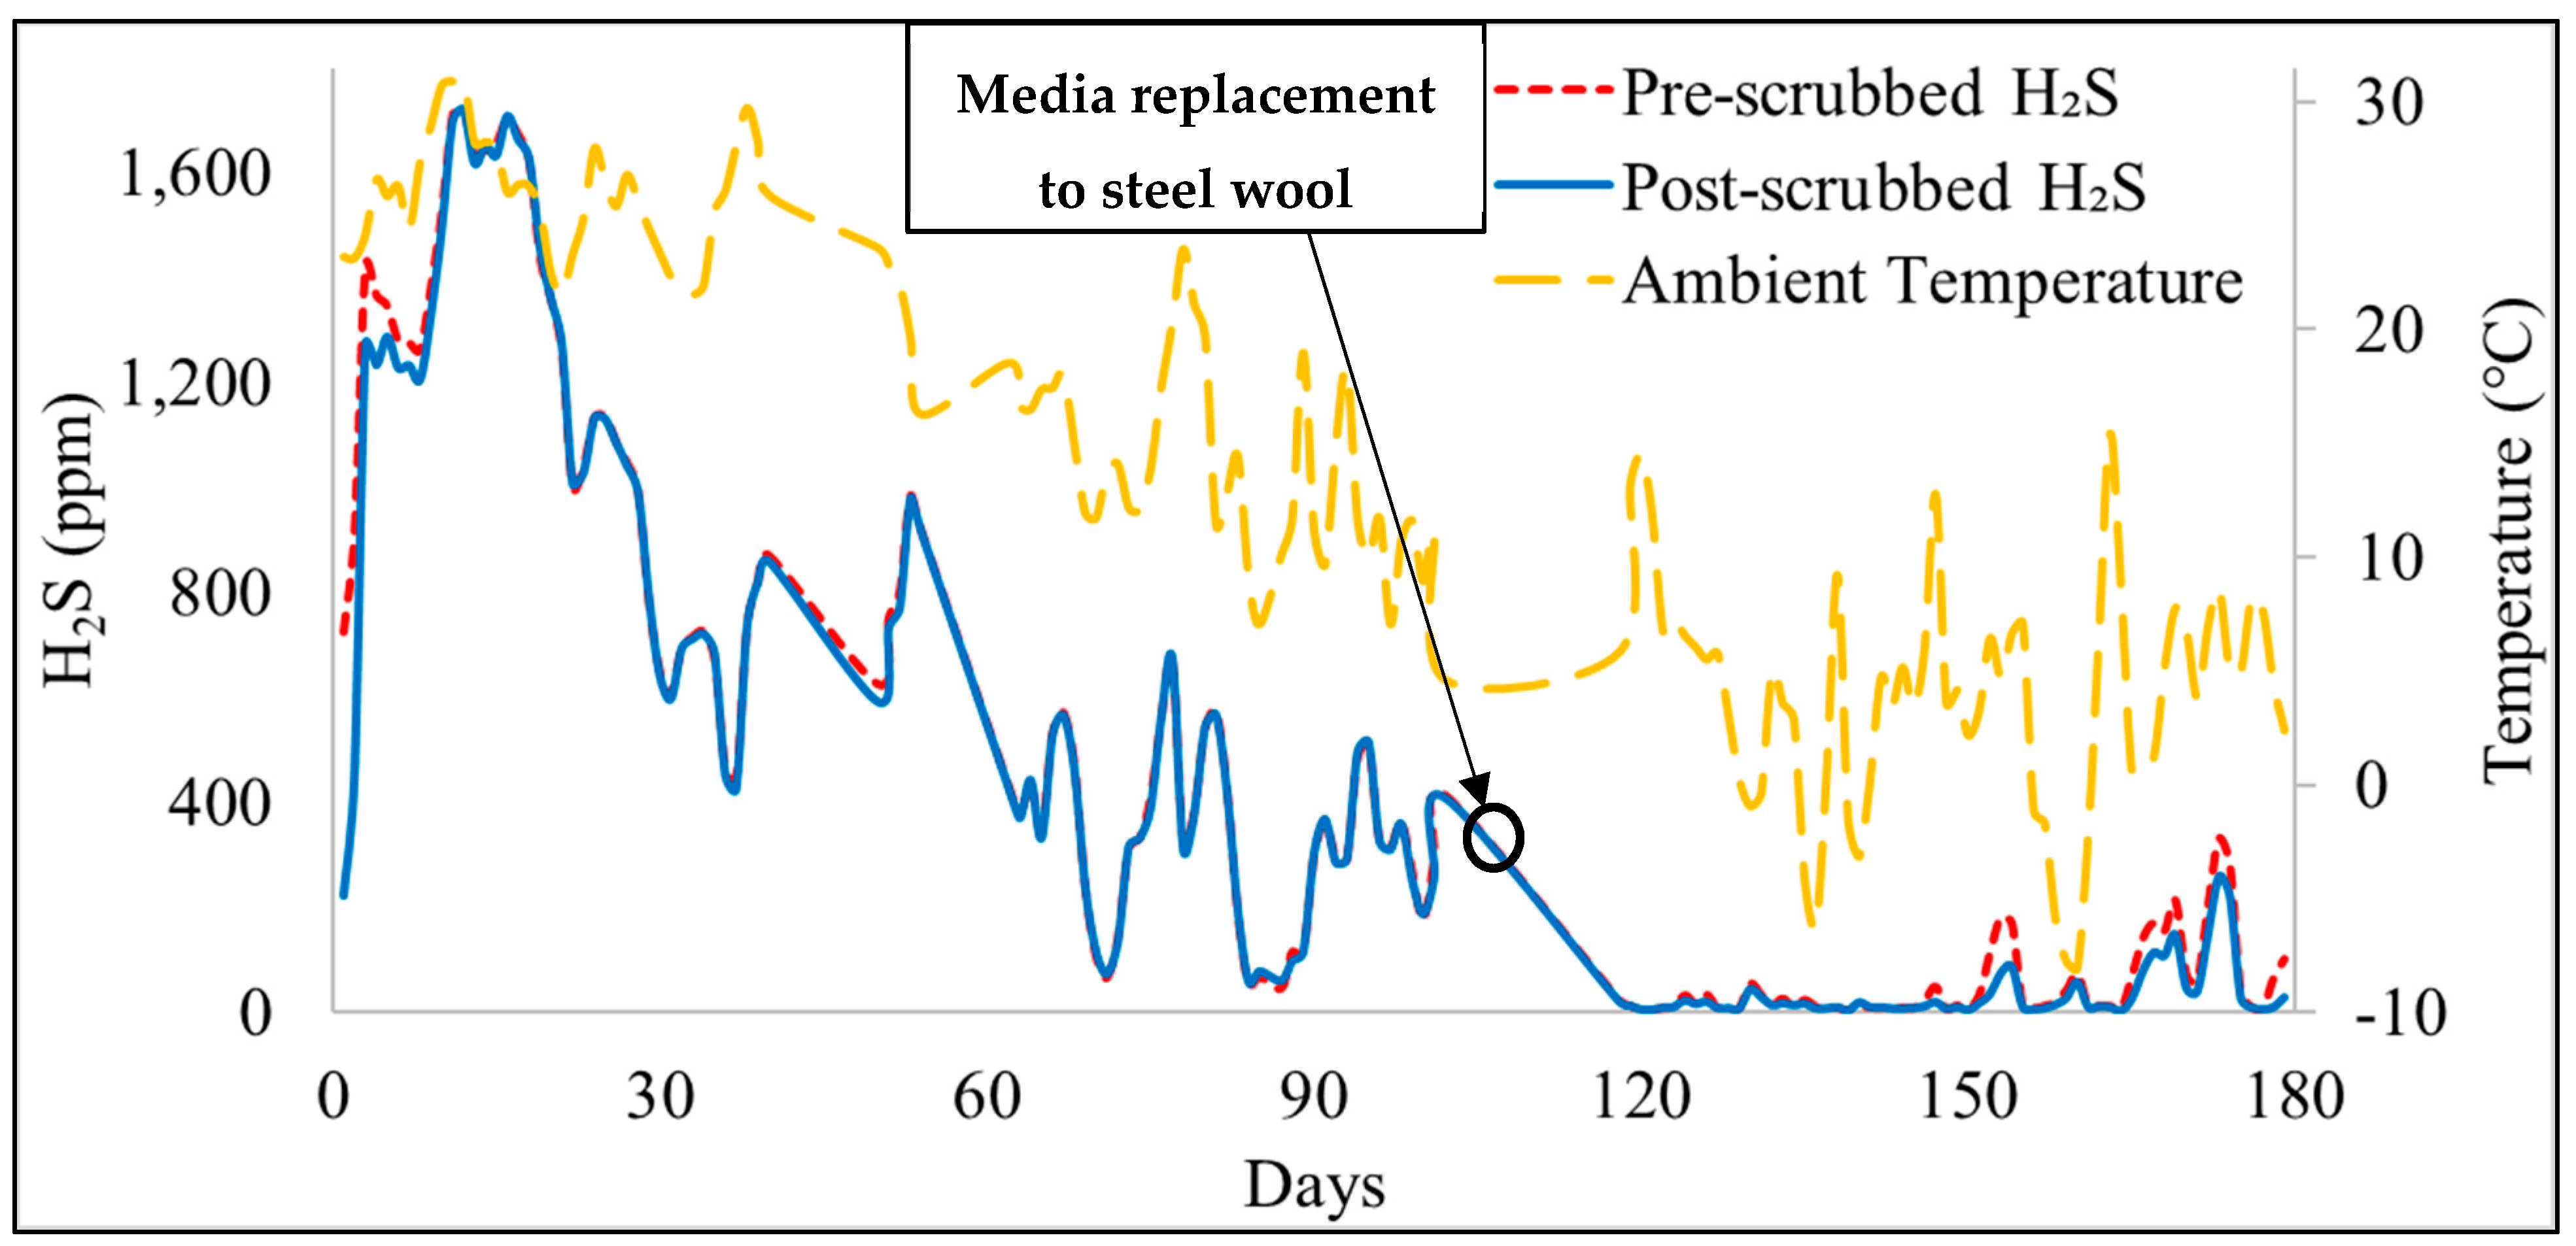
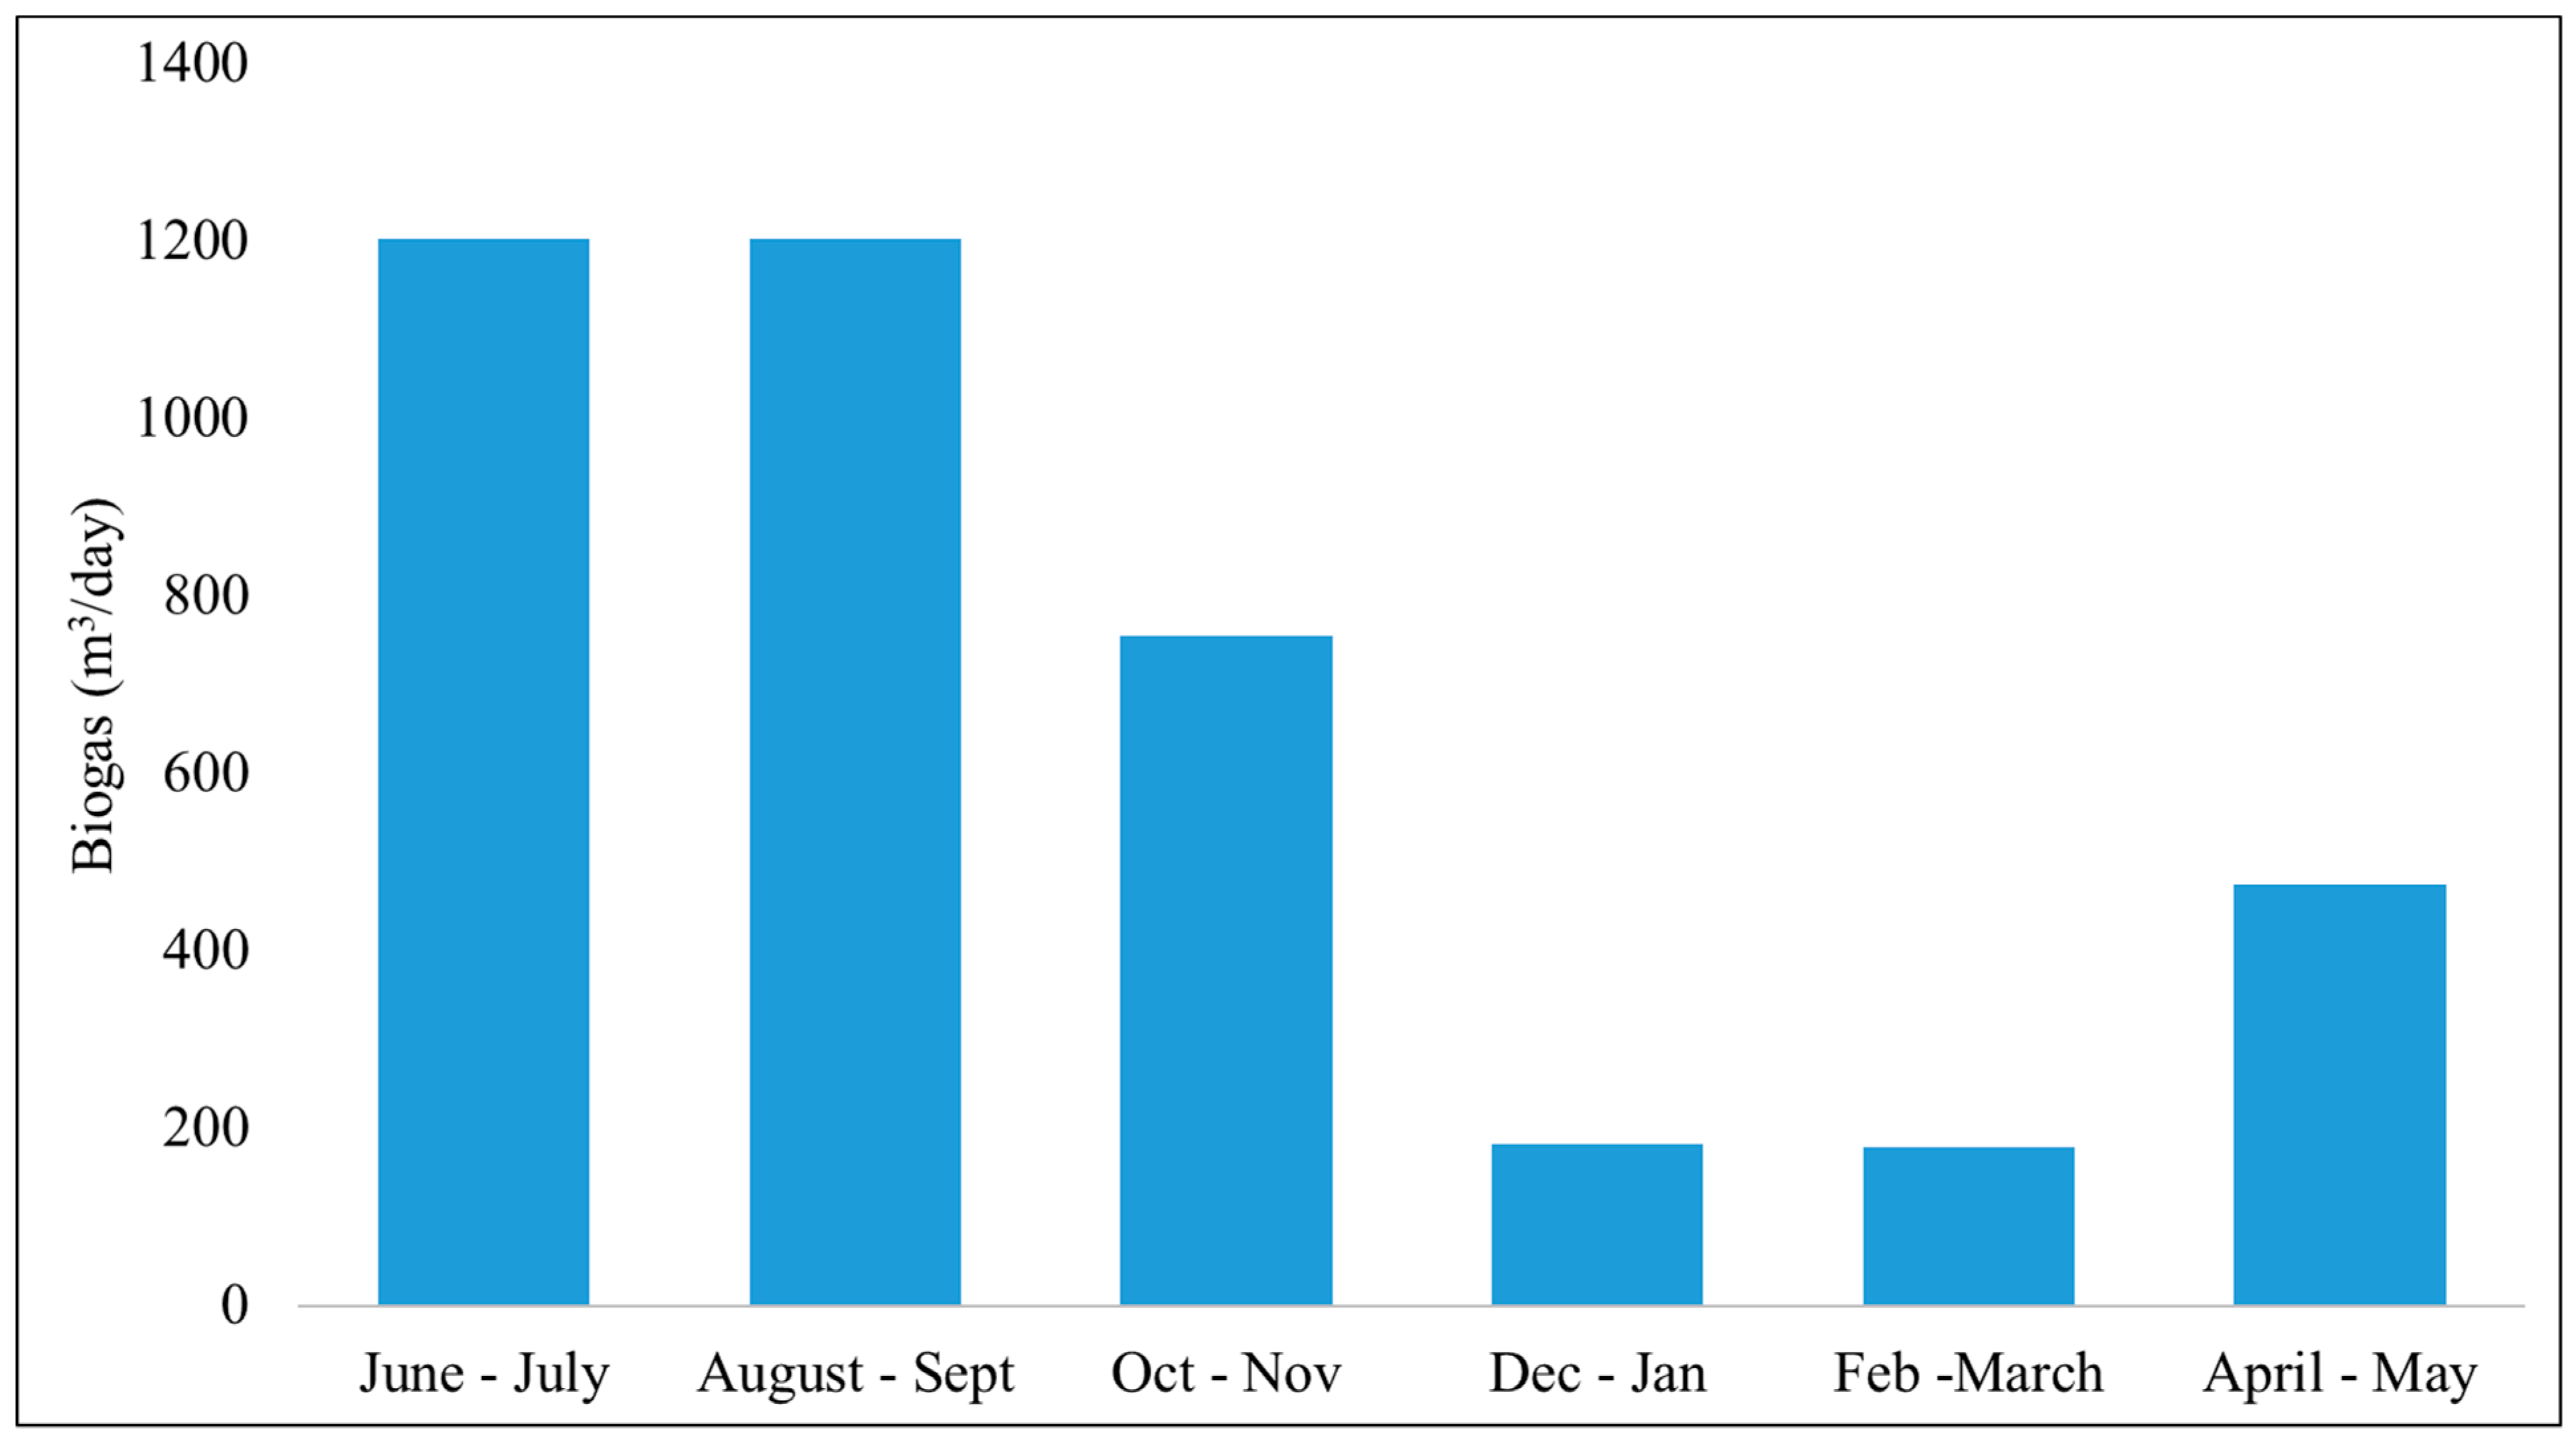
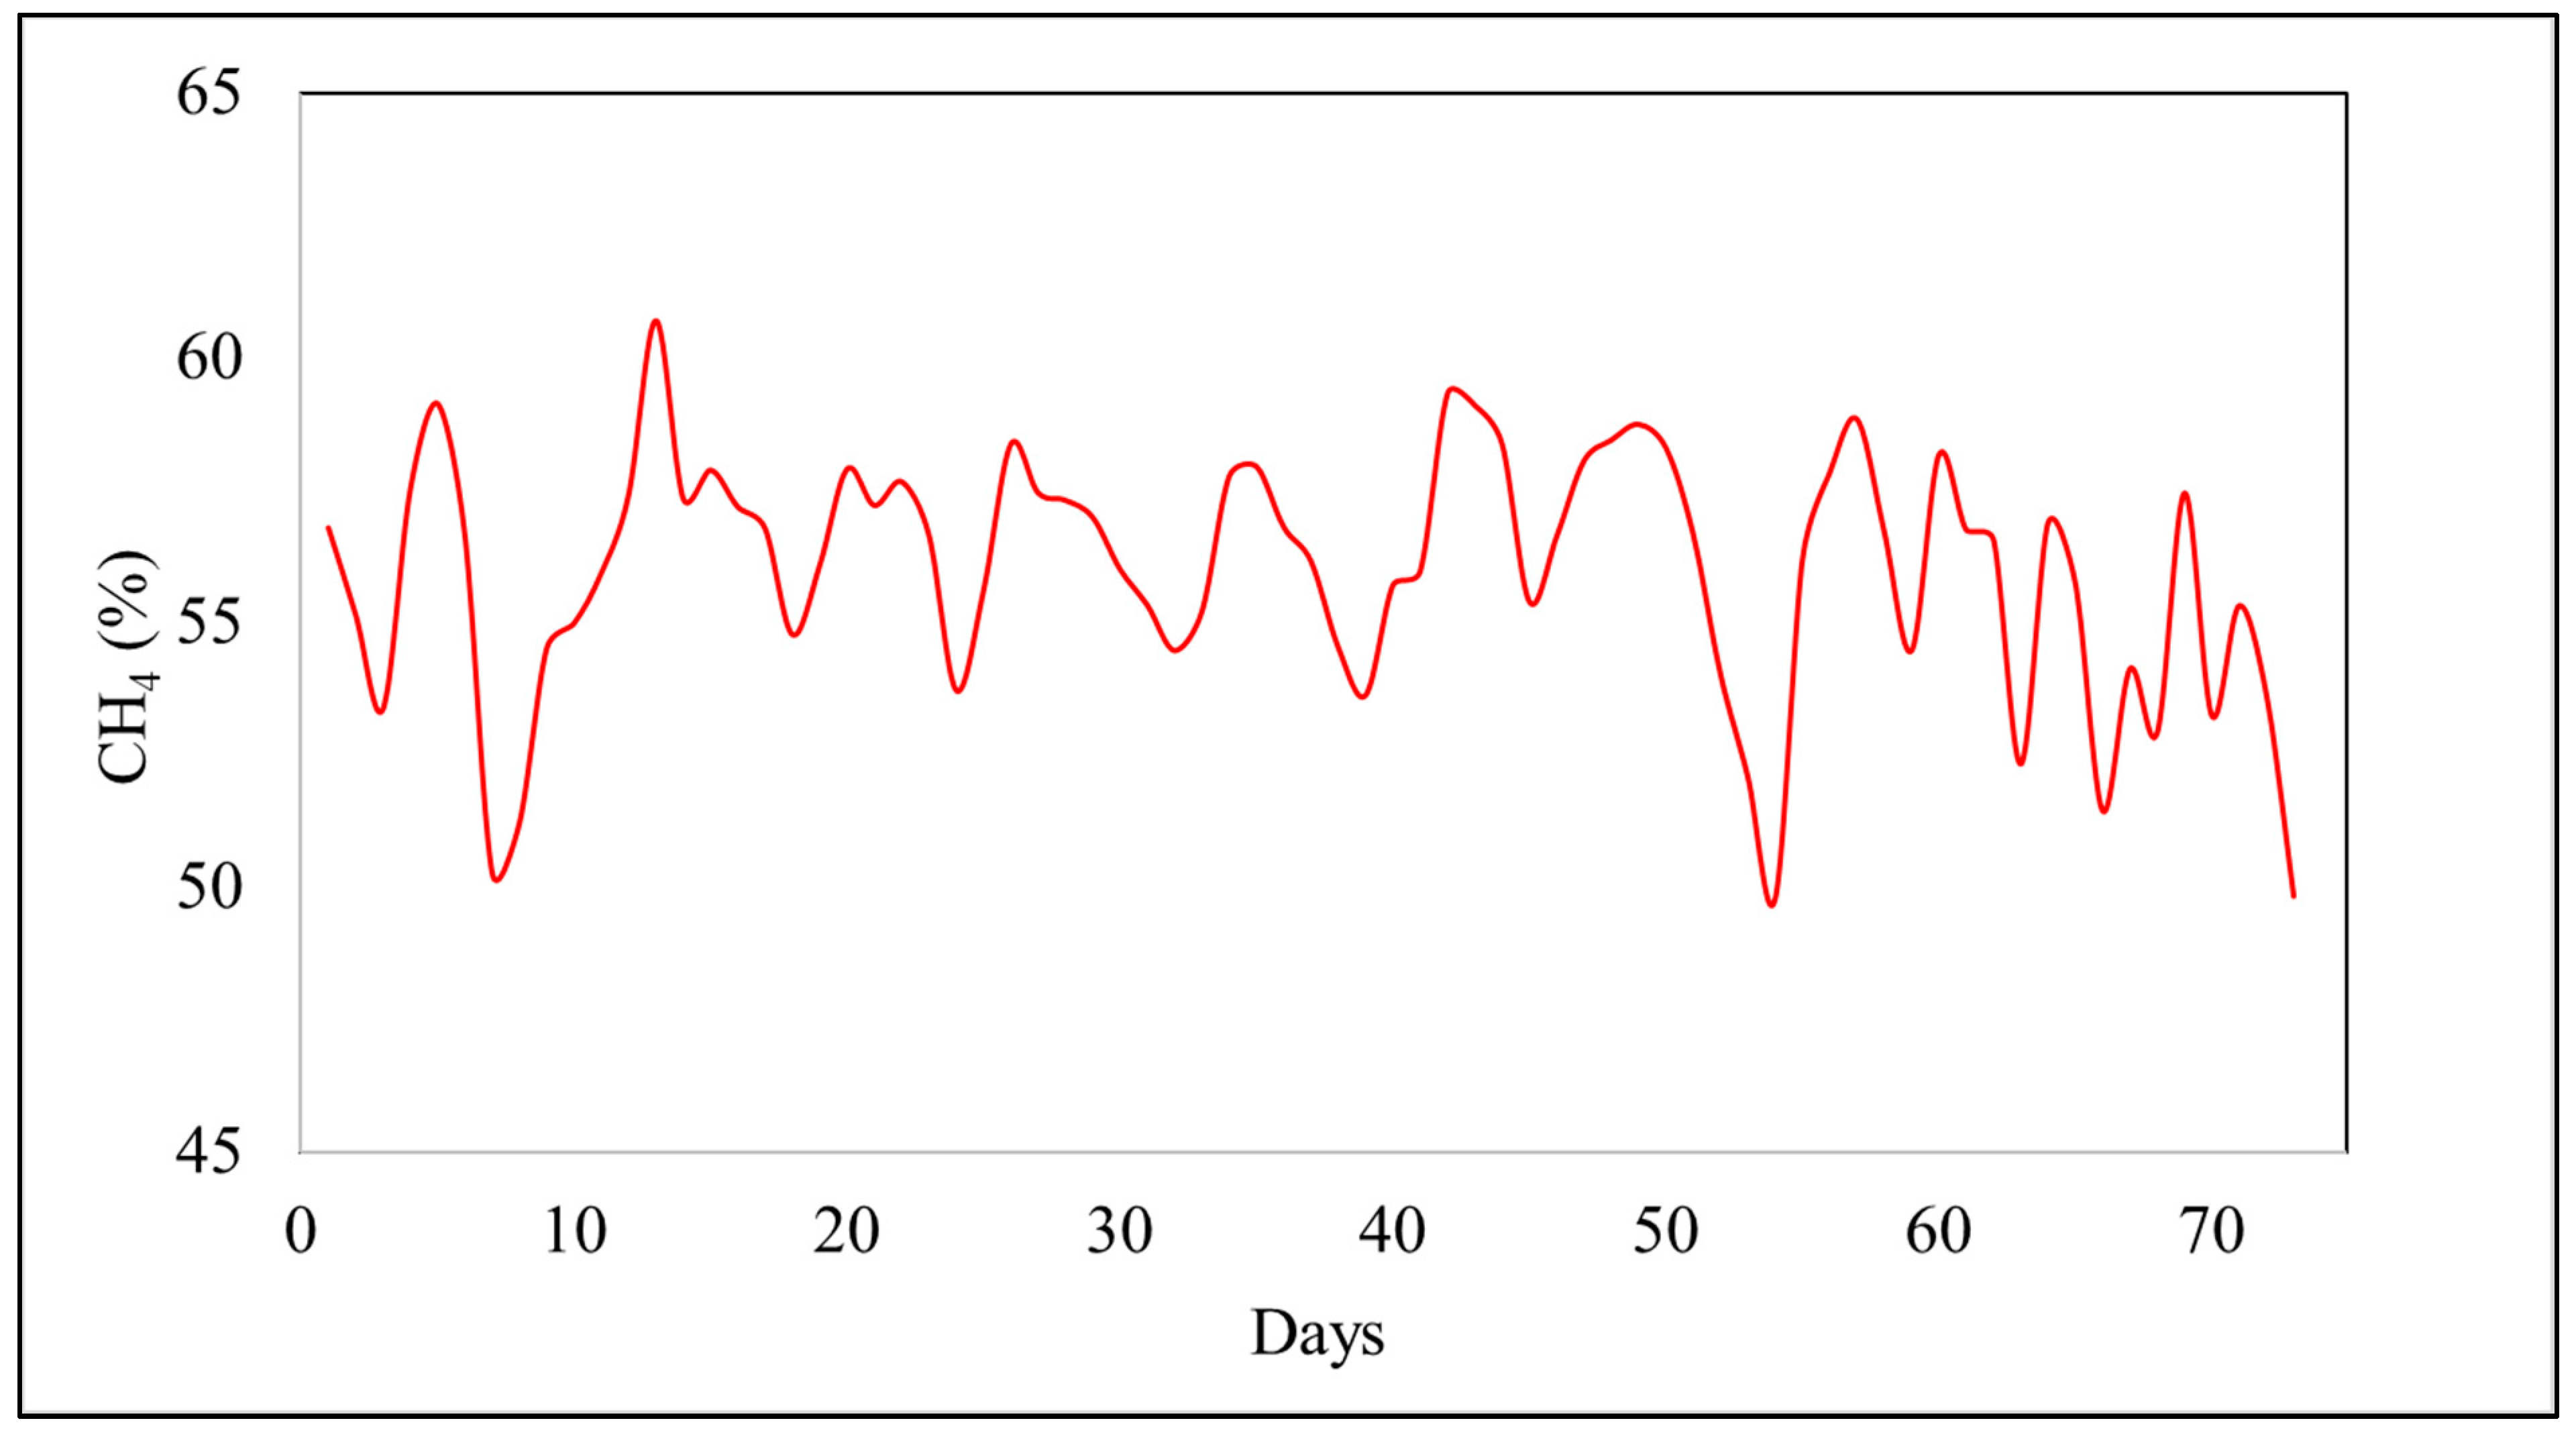
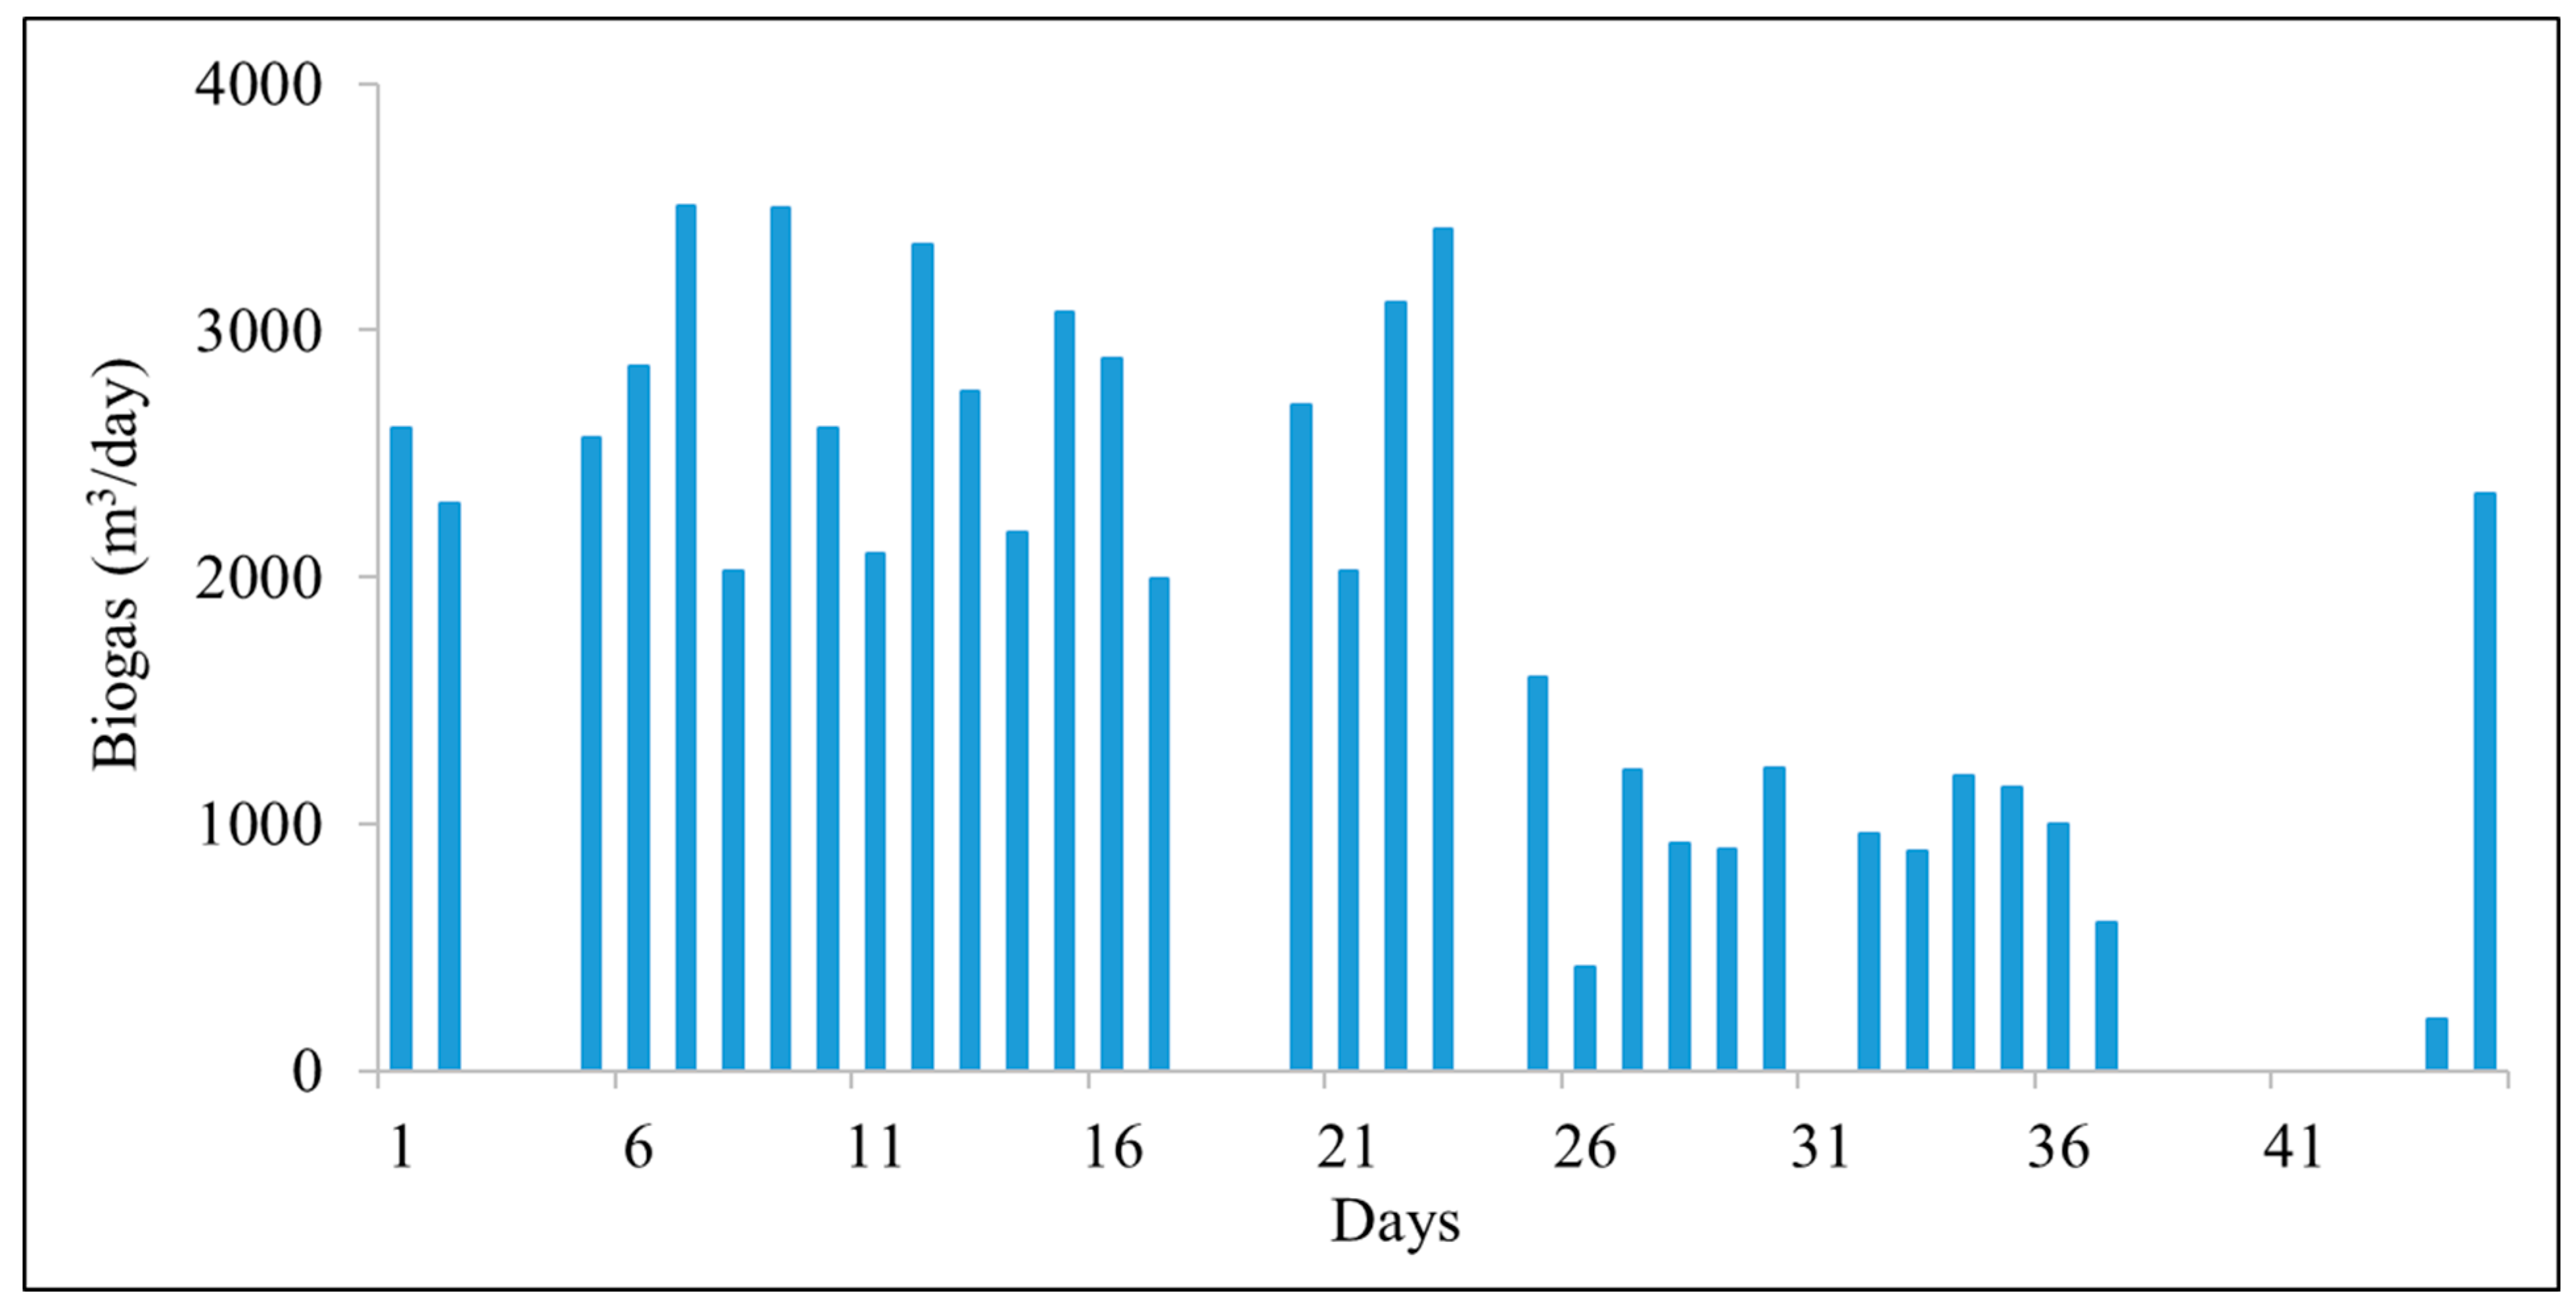
3.1. Iron Oxide Scrubber (SIOS)

The mean H2S concentrations in the pre-scrubbed and post-scrubbed biogas of SIOS were 450 ± 42 ppm and 430 ± 41 ppm (based on 179 data points: n = 179), respectively, when averaged over the entire study period (August 2016–January 2017) (Figure 1). Prior to the media change from scrap iron to steel wool (n = 85), the H2S concentrations in the pre-scrubbed biogas was 740 ± 53 ppm and post-scrubbed biogas was 719 ± 52 ppm. After the media change, the pre-scrubbed H2S concentration (52 ± 9 ppm) was significantly higher (p-value < 0.0001) than the post-scrubbed H2S concentration (33 ± 6 ppm). This rapid decrease (Days 102–120) in H2S concentration is likely due to the temperature drop in the unheated digester at that time. The temperature of the digester effluent dropped from 28.1 °C in August to 10.5 °C in December, which corresponded with the ambient temperatures, which averaged 26.1 °C and 3.5 °C, respectively [13]. Sulfate reducing bacteria (SRB), the primary producers of H2S in anaerobic digesters, have lowered activities at temperatures below 20 °C [14].
The use of scrap iron and unoxidized steel wool as scrubbing media, instead of iron sponge or proprietary iron-oxide based adsorbents resulted in poor H2S removal efficiencies for SIOS. Dry iron-oxide based adsorbents are the most commonly used and effective scrubbing technique but can generate a hazardous waste stream [2]. Commercially available iron sponge media can be up to 100% effective, but the use of scrap iron and steel wool as the adsorption media resulted in low H2S reduction efficiency (3%) for SIOS [12]. Kohl and Nielsen (1997) also reported that wetted iron-oxide based adsorbents are not as effective as chemically hydrated oxides [15]. The steel wool media and the scrap iron media were not allowed to oxidize before being used for H2S scrubbing, which could have contributed to the low scrubbing efficiency.
The media replacement to steel wool and the increased residence time due to the lowered biogas flow rates in the winter season resulted in a decrease in the biogas H2S content even though the pre-scrubbed H2S concentration was below 100 ppm. The biogas production varied from 1202 m3/d in the summer (June to September, with an average temperature of 28 °C) to 51 m3/d in the winter (January to February, with an average temperature of 10.9 °C) (Figure 2). The average biogas flow rate before the media change was 980 m3/d (n = 4), which was reduced to 51 m3/d (n = 4) due to the temperature drop that coincided with the media change. The residence time of the biogas in the scrubber increased from 0.25 min to 6 min, as the lower winter temperatures led to a sharp decline in the biogas production from the unheated digester. Commercially available iron oxide media usually require 1–15 min residence time and could have been more efficient at removing H2S for SIOS, especially during the summer months [12]. Zicari (2003) reported that a farm digester (capacity—554 m3) with an average biogas production of 669 m3/d could reduce H2S concentrations from 3600 to <1 ppm, with a 4200 L iron oxide scrubber with a bed height of 240 cm [2]. The SIOS volume was 208 L with an empty bed height of 88 cm (66 cm media height), with 4.2 kg of steel wool. The low adsorption efficiency seen in this study was affected by the high volume of biogas passing through the scrubber compared to the scrubber size. The total volume of biogas passing through the scrubber from August to November 2016 was 119,000 m3, with 3.8 kg of H2S removed from the biogas through the scrubber. After the media replacement with steel wool, a total of 1800 m3 of biogas flowed through the scrubber in 36 days, with 68 g of H2S removed. The low sulfur removal was likely due to the low concentrations of H2S present in the biogas coupled with the comparatively low effectiveness of the fresh steel wool. Iron oxide-based adsorbents have been shown to remove 0.56 kg H2S/kg adsorbent in a batch system, with a recommended bed height of 120–300 cm [15]. Based on the results from the study, the steel wool had an adsorption capacity of 0.016 kg H2S/kg steel wool, which is an order of magnitude lower than the adsorption capacities of commercially available dry iron oxide-based sorbents.
During the study period, the average CH4 content in the pre-scrubbed biogas was 64.1 ± 0.2%, with 64.9 ± 0.2% CH4 in the post-scrubbed biogas (Figure 3). The average daily CH4 production rate calculated using the biogas production data over one year (June 2016 to May 2017) was 432 m3/d or 0.58 m3/cow.day. The daily CH4 production rate from a mesophilic dairy manure AD system can vary from 1.5 m3/cow·day to 3.9 m3/cow·day [16]. As the AD system in this study was not heated, the average CH4 yield was below this average range.
The generator produced a total of 47,158 kWh of electrical energy from the produced biogas from August to December 2016 (131 days), resulting in a daily average rate of 380 kWh/d. The EGS stopped functioning in December 2016, but the exact reason for generator failure was not determined. During daily operation, the generator did not run continuously, which could affect the EGS lifetime. The EGS had an average run-time of 12 h/d, corresponding with day-time farm operations, but variations in the EGS run-time were verified in the farmer’s reports. From June to December 2016, the biogas flow rate was continuous during the EGS operational hours, with the regenerative blower suppling the biogas to the generator. The average daily CH4 production during the monitoring period of generator activity was 542 m3/d. The electricity generated from the biogas was 0.70 kWh/m3 CH4, but the flare was not metered, so the actual value may be lower than estimated.

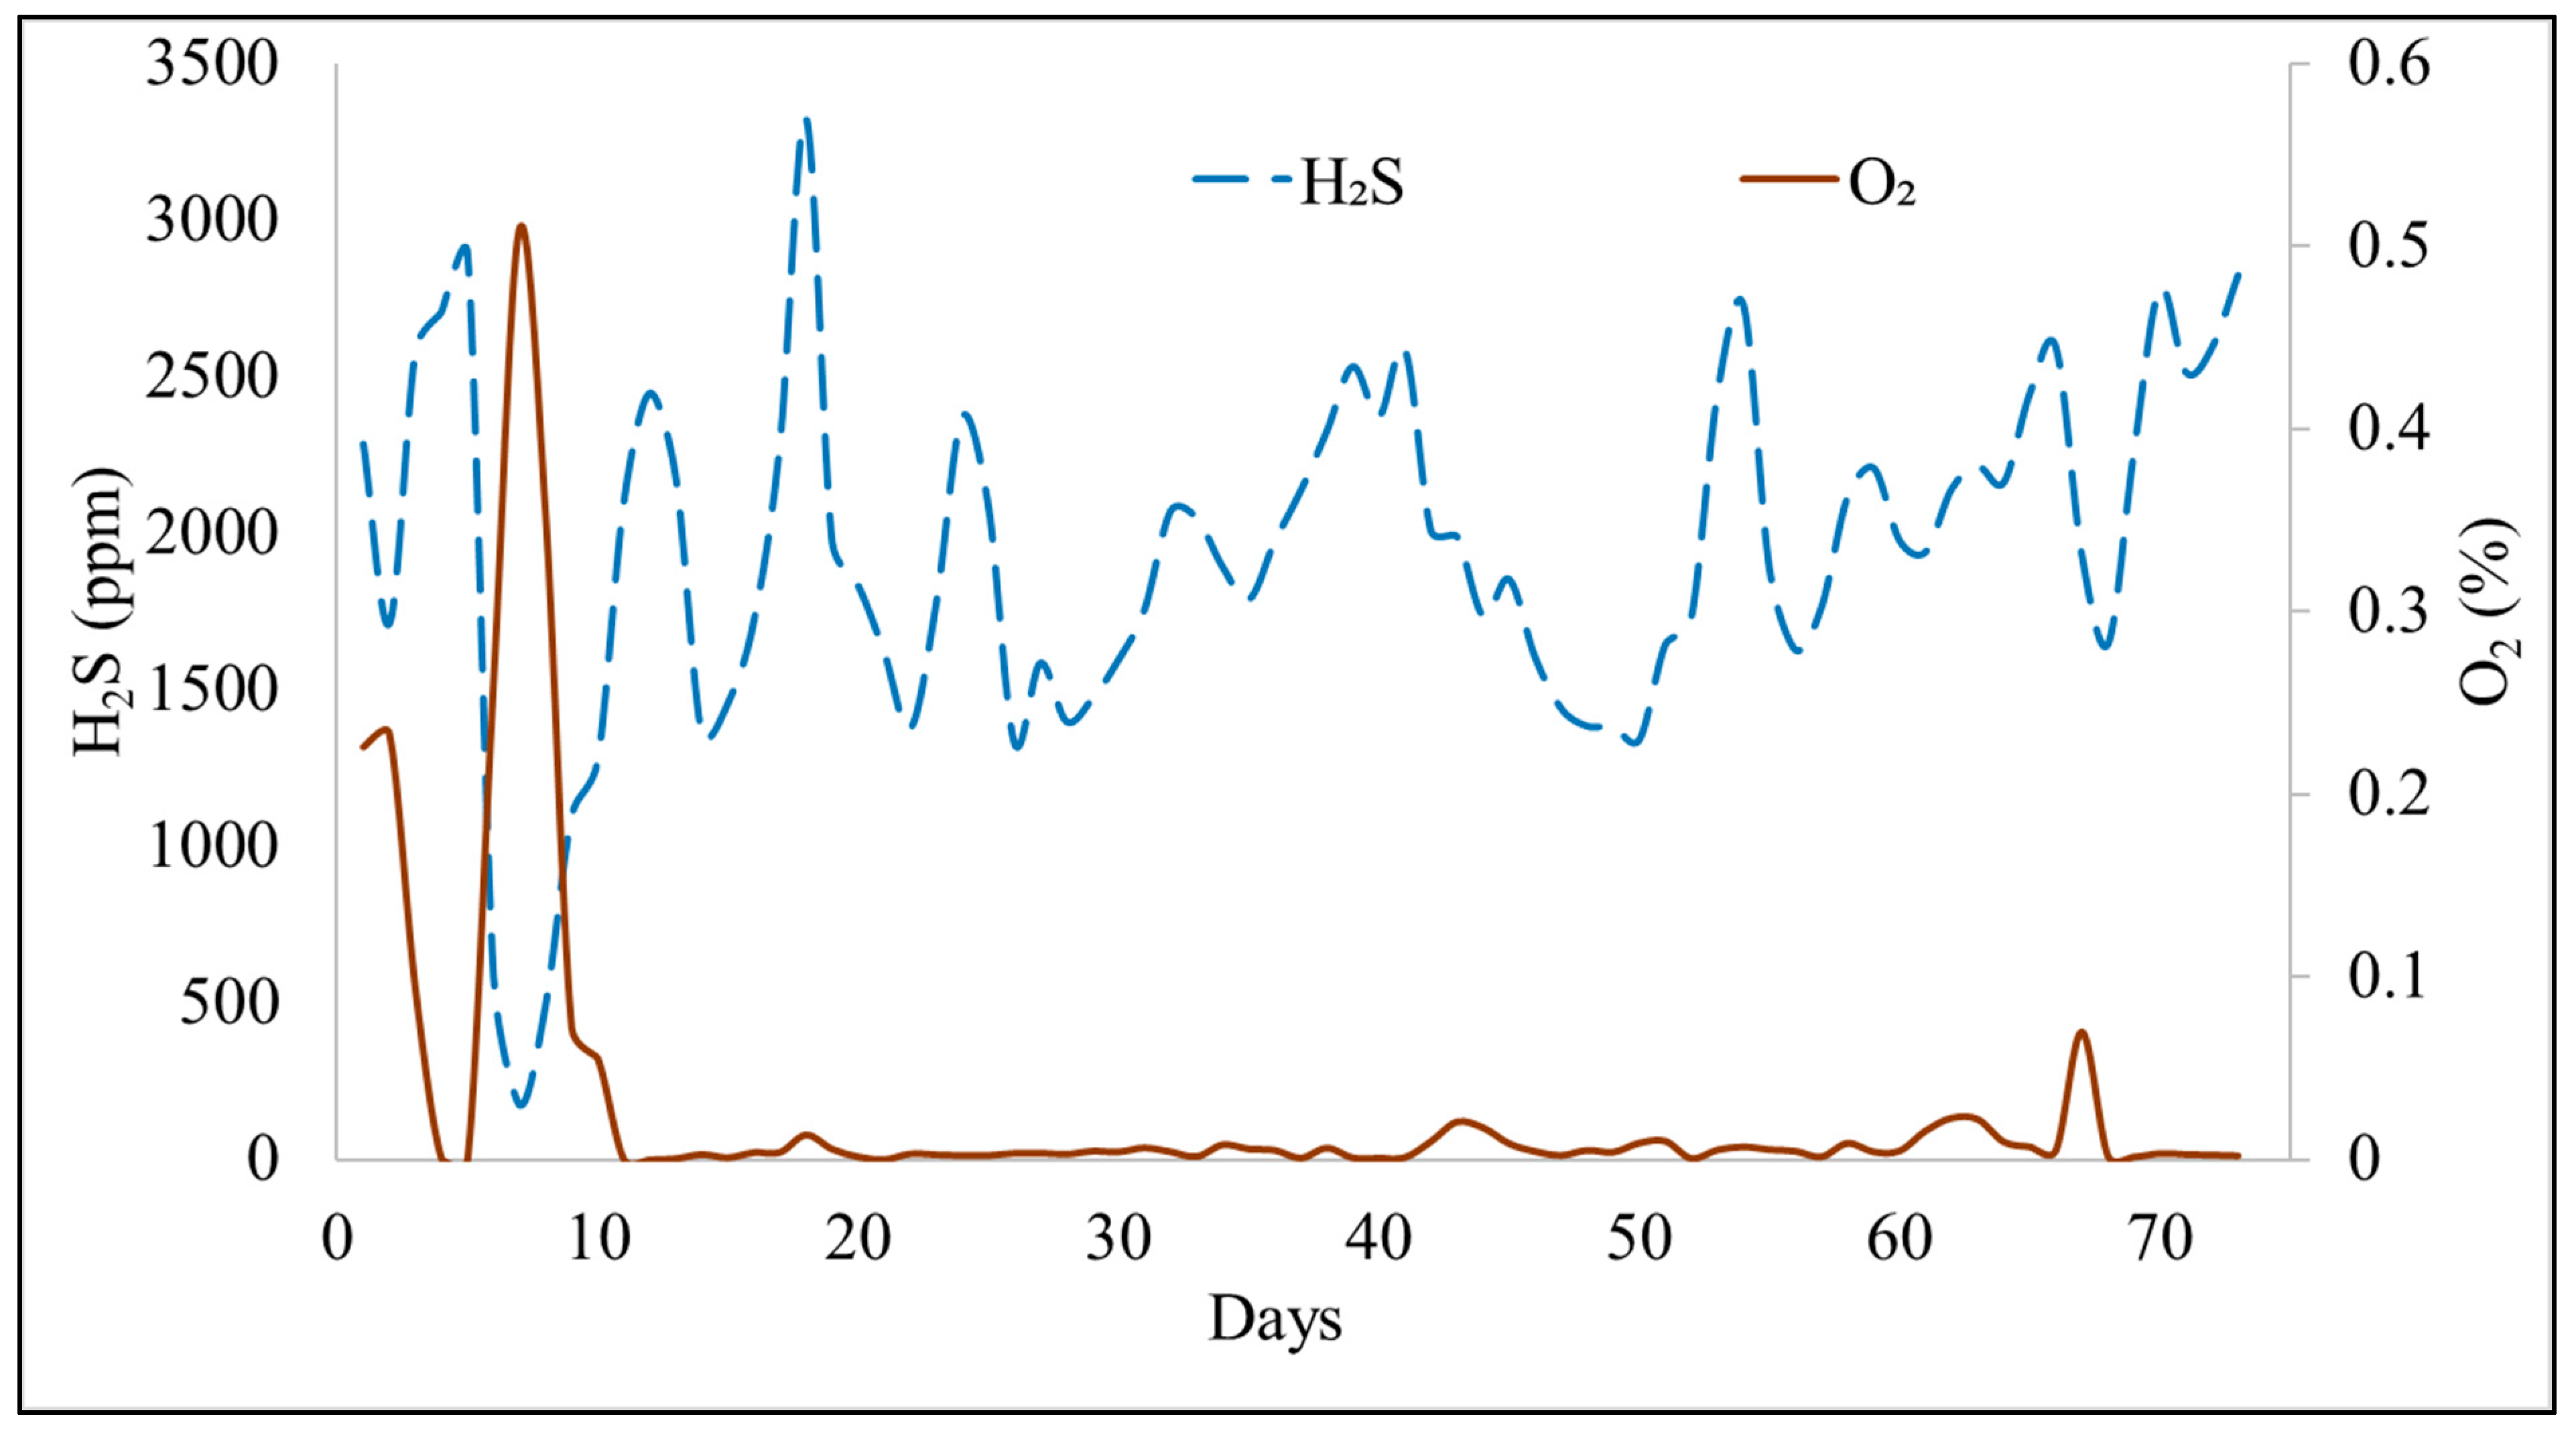
3.2. In-Vessel Biological Desulfurization System Using Air Injection (SBDS)

Overall, biogas H2S concentrations (average: 1938 ± 65 ppm; n = 73) varied considerably during the study period from 171 to 3327 ppm, but the CH4 (56.2 ± 0.1%) and O2 concentrations (0.030 ± 0.004%) were consistent (October to December 2016). Correlations between the H2S, CH4, and O2 were also observed, as expected (Figure 4 and Figure 5). In mid-October (Day 7), the H2S concentration decreased to 171 ppm, while the O2 concentration rose to 0.51%, and the CH4 concentration dropped to 50%, likely due to nitrogen (N2) introduced into the biogas stream with air injection. It is likely that once the oxygen was depleted, further oxidation did not take place, and the H2S concentration increased (after Day 9). Schieder et al. (2003) reported that micro-aeration by itself may not be sufficient to achieve complete desulfurization [10]. They collected data from biogas plants in the state of Baden-Württemberg in Germany and found that 54% of the micro-aerated AD systems had outlet H2S concentrations >500 ppm. They suggested the use of an external biological scrubber to achieve outlet H2S concentrations of <100 ppm and increase the life of combined heat and power (CHP) units and decrease the frequency of oil changes. In practice, digester manufacturing companies in the US have recommended limits of 500 ppm H2S in the biogas [4]. The variable H2S concentrations during the study period indicated variable treatment efficiency. The O2 concentration was not always sufficient for adequate H2S removal (<500 ppm) throughout the period after the initial rise to 0.51% O2. The O2 concentrations increased to 0.07% in mid-December for a short duration, which correlated with a decrease in the H2S concentration from 2596 to 1645 ppm.
Ramos et al. (2013) showed that an outlet H2S concentration of <200 ppm can be obtained with low O2 (0.2% to 0.3%) concentrations in the output biogas [17]. The O2 utilization efficiency for H2S oxidation by the SOB increased with a decrease in the O2input/H2Sinitial ratio. Mulbry et al. (2017) also showed that an outlet H2S concentration of <100 ppm can be obtained with 0.5% O2 in the output biogas [18]. In SBDS, the average outlet O2 concentration was much lower (0.03%), as the air input was set at 2.86 m3/h (2.75% of the average biogas flow rate), resulting in an average O2 input of 0.58%. An increase in the air injection rate could have decreased H2S concentrations further but at the cost of lowering CH4 concentration due to N2 dilution. The AD operator did not increase the air injection rate due to the low CH4 concentration (50% to 55%) in the produced biogas. The EGS efficiency can be negatively affected when operated with a CH4 concentration of <50% [15,16]. In such cases, a pure O2 input may be desirable over air injection, but a pure O2 input entails a higher operational cost.
A constant air flow rate could have reduced the desulfurization efficiency in the digester headspace. A variable air flow rate based on the H2S production can ensure sufficient desulfurization to meet recommended limits for heating or electricity production while minimizing N2 dilution [19]. Ramos and Fdz-Polanco (2014) used a PID (proportional-integral-derivative) controller to vary the O2 flow rate to meet the set output H2S concentrations. The O2 input was controlled using two methods: H2S content in the biogas, and biogas production rate, and in both cases >99% removal of H2S was obtained [20]. The ORP (oxidation–reduction potential) of the liquid wastewater was used by Khanal and Huang (2006) as a parameter to control the injection rate to prevent under-dosing/overdosing of O2 [21]. However, instead of adding O2 directly into the headspace, the authors injected it into the outlet of the reactor that contained a mixture of both biogas and the digester effluent. The resulting mixture was then sent to a separate sulfur oxidizing unit to separate the biogas, the effluent, and the elemental sulfur produced by the SOB. The method was able to reduce >99% of the total dissolved and gaseous sulfides for a range of initial dissolved sulfide concentrations (287 mg/L–1997 mg/L). However, using ORP as a controlling parameter could be unreliable, as each AD system is different and a set standard for an ORP increase may not be appropriate [19]. Addition of O2/air into the digester liquid could also lead to degradation of organics in the digestate, and therefore, a higher dose of air/O2 may be required for adequate H2S removal [22].
Another factor that could have affected the desulfurization efficiency is the excess formation of sulfur mats in the digester headspace. The digester headspace was never cleaned, and therefore, large-sized elemental sulfur particles would drop back into the digester, along with the formation of sulfur laden biofilms on the liquid surface [18]. Sulfate reducing bacteria are also known to use elemental sulfur as an energy source for H2S production [23]. The accumulation of oxidized sulfates and elemental sulfur can be reduced again by SRB and can lead to increased H2S concentrations in the biogas [24]. External vessels used by Ramos et al. (2013) and Mulbry et al. (2017) that can be cleaned on a regular basis have been suggested as a better alternative to prevent reduction of the accumulated sulfates and sulfur [17,18], which resulted in a steady CH4 production rate within the range for mesophilic digesters (1.5 m3/cow·day to 3.9 m3/cow·day) [16]. The farm averaged 2003 m3/d of biogas flow through the generator (1125 m3/d or 1.73 m3/cow·day CH4 yield) and produced 689,656 kWh of electricity in 10 months at a rate of 1.95 kWh/m3 CH4 combusted. The average rate of electricity production was 2196 kWh/d. The average biogas flow rate was affected by the generator malfunction during the last 3 weeks of data collection (Figure 6).

3.3. Economic Analysis

The total cost of the scrubber systems was calculated using data provided by the farm owners. The total capital cost of the iron oxide scrubber system (SIOS) was approximately $525 based on the reactor vessel and piping costs, as this was a homemade system. All the maintenance was conducted by the farm owner, and the labor costs were considered negligible. Additionally, scrap iron ($25 cost) was added by the farmer once during the study. Steel wool media cost $80 to fill the space within the scrubber. The replacement media for the scrubber was calculated to be $650/year with original iron scrap based on 26 media replacements per year and $960/year with grade 000 steel wool based on 12 media replacements per year. Approximately, $450/year was required for oil changes as one liter of oil was added to the generator every other day (183 L/yr). The total cost to own and operate the scrubber was $1100 (with iron scrap media) and $1410 (with grade 000 steel wool). Generator maintenance and repair can add significant costs as well, but no information was available for generator repair costs.
The total capital cost of SBDS was approximately $450 for the air pump for air injection into the digester headspace. Scrubber maintenance was carried out by cleaning out the air injection connection into the digester on a weekly basis. This was estimated to take 20 min per week and cost the farm $120/year in labor costs (estimated to be $10/week at $30/h.). Oil change costs ranged from $1190 to $1795 per month and additional costs during a month were for generator repairs. The farm owner spent $10,798 for oil changes and repairs to the EGS engine head in April 2017. One of the primary reasons for the lower costs of oil change for SIOS was the lower average H2S concentrations (430 ppm) compared to SBDS (1938 ppm).
Zicari (2003) tabulated data for different proprietary iron-oxide based adsorbents, where the capital costs ranged from $8000 to $43,600 and the operating costs ranged from $8290 to $23,840 for a biogas stream with 4000 ppm of H2S and a gas flow rate of 1350 m3/d, which is comparable to the average daily biogas flow rates for both farms in this study [2]. These cited costs were much lower than the costs associated with owning and operating the BTF units in the study conducted by Shelford et al. (2019) [4]. The operational, maintenance, and utilities costs for BTF systems in their study ranged from $17,050 for farm 2 to $32,563 for Farm 1, which are comparable to the operational costs of iron oxide scrubbers, but the capital costs were at least four times higher. The proprietary iron-oxide scrubbers examined by Zicari (2003) had high H2S removal efficiencies and low H2S output concentrations (up to 100% and less than 1 ppm) compared to the lower efficiencies (80.1% and 94.5%) and higher H2S output concentrations (450 and 150 ppm) seen in the study by Shelford et al. (2019) [4,12]. However, on larger farms, the operating costs associated with iron oxide scrubbers may be much higher due to the larger volume of biogas to be treated and the higher handling and disposal costs of the spent media [12]. When the costs were normalized on the basis of volume of biogas treated, the costs were comparable, with iron-based adsorbents costs ranging from $0.024 to $0.046 per m3 of biogas treated and BTF systems costs ranging from $0.012 to $0.03 per m3 of biogas treated [2,4,12].
Shelford et al. (2019) also calculated the economic benefits of having a BTF scrubbing system by calculating the savings associated with less frequent oil changes after scrubber installation [4]. The farms reported a net annual loss of $61,593 for BTF 1 and $30,093 for BTF 2, which may be economically infeasible for smaller farms, especially during low milk price cycles in the US.
The results and observations from this study and Shelford et al. (2019) study showed that even though H2S scrubbing system existed on all four farms studied, consistent performance was lacking in the inexpensive systems analyzed in our study. Both SBDS and SIOS had significantly lower capital and operating costs than the two BTF systems, but it is unclear if the farmers realized any economic or social benefits from these two H2S scrubbing systems during the study period. It is also difficult to calculate monetary benefits of having the scrubbing systems, since there was no information available on oil changes prior to scrubber installation and the highly inefficient performance of the scrubbing systems. Table 2 shows the cost information of the BTF units from Shelford et al. (2019) in comparison to the scrubbing systems monitored in this study.

3.4. Scrubber Management

An important factor to consider for efficient scrubber operation is scrubber management by farm or AD operators. H2S management on agricultural digesters has lagged behind municipal and industrial digesters due to limited funding [18]. Hiring full-time operators for ensuring efficient scrubber performance can lead to unaffordable operating and labor costs, especially for farm owners with AD systems.
Changing the iron-oxide media after saturation is a labor-intensive process due to a need for careful handling of the saturated media [12]. Without proper monitoring of biogas quality, it is also impossible for farmers to know when to replace the saturated media or ascertain if biological conversion of H2S is occurring in the digester headspace. Portable biogas quality monitoring equipment used in the study cost $17,000 and required technical expertise for regular calibration and H2S sensor replacements every 3–6 months for accurate data collection. The farm with in-vessel biological desulfurization (SBDS) had previously installed an external BTF to work in conjunction with the in-vessel micro-aeration. The BTF unit was abandoned for several years after the farmers encountered operational issues that they could not troubleshoot. It is important for manufacturers to provide on-field assistance for the maintenance of these systems for several years after they are purchased. In addition, one of the farms in the Shelford et al. (2019) study had a dedicated operator, and the H2S scrubbing efficiency was 94.5%, whereas, the other farm had multiple personnel acting as temporary operators for the BTF unit, which contributed to the H2S scrubbing efficiency dropping to 80.1% (Table 3) [4]. SIOS and SBDS, in this study, did not have dedicated operators maintaining the scrubbing systems, and monitoring H2S concentrations in the scrubbed biogas. As a result, the scrap iron media for SIOS was not replaced upon saturation, and it was impossible to determine the effectiveness of the media, leading to poor performance of the system (3% removal efficiency). In the case of SBDS, regular maintenance of the air flow lines to prevent flow obstruction and appropriate modification of the air flow rates could have resulted in a lower H2S concentration in the biogas.
In a detailed report compiled by Lusk (1998), it was shown that AD operators faced a multitude of problems caused by high H2S content in biogas [25]. Currently, managing H2S in biogas is still an issue, as seen from our study results. Based on interaction with the participating farmers operating the AD systems, frequent EGS oil changes to reduce corrosion instead of managing the H2S scrubbing system were considered to be a more practical solution. Libarle (2014) found that most AD technology adopters encountered operational and maintenance issues due to a lack of training and scientific understanding of the processes involved [26]. Similar issues were observed during this study, as the farm owners of the SIOS and SBDS systems encountered several hurdles while trying to increase the H2S scrubbing efficiencies of their underperforming systems. In addition, the rural locations of the farms limit access to consultants and AD experts capable of aiding farmers facing challenges from elevated H2S concentrations in the biogas. There seems to be a need for increased assistance (education and outreach workshops, free biogas monitoring services, etc.) to impart more technical knowledge to the farm owners and offset some of the costs involved in managing and maintaining these systems.

4. Conclusions

The studied in-vessel air injection system for biological desulfurization had a low capital and time investment, with positive but inconsistent H2S removal efficiencies. The iron-oxide scrubber also had a low time and labor investment but negligible H2S removal efficiencies over the study period. The use of the appropriate scrubbing media (commercially available iron oxide or iron sponge) for increased reactivity and contact area, instead of scrap iron and steel wool could have increased the scrubber performance. The study also showed a substantial effect of scrubber operation and management on its performance. H2S scrubber systems that were better managed with more time and labor investment have shown more efficient and consistent scrubbing performance. Future studies should quantify and incorporate long-term costs (5 or more years) associated with engine overhauls, down-times, repairs, etc., undertaken due to H2S related damage to better understand the economic benefits of H2S scrubbers.

Author Contributions

Conceptualization, G.F., C.G. and S.L.; data curation, A.C.; formal analysis, A.C.; funding acquisition, G.F., C.G. and S.L.; investigation, A.C. and T.S.; methodology, A.C., T.S., G.F., C.G. and S.L.; project administration, G.F., C.G. and S.L.; resources, C.G. and S.L.; software, A.C. and T.S.; supervision, G.F., C.G. and S.L.; validation, A.C. and T.S.; visualization, C.G. and S.L.; writing—original draft, A.C.; writing—review and editing, A.C., T.S., G.F., C.G. and S.L.

Funding

This material is based upon work supported by the National Institute of Food and Agriculture at the U.S. Department of Agriculture through a Northeast Sustainable Agriculture Research and Education (SARE) grant (#LNE15-341).

Acknowledgments

The authors would also like to thank the participating farmers on both farms for their enthusiasm and assistance with data collection for the project.

Conflicts of Interest

The authors declare no conflict of interest.

References

  1. Occupational Safety and Health Administration. OSHA safety and health standards. 29 CFR 1910.1000. Occup. Saf. Health Adm. Revis. 1997, 1, 444. [Google Scholar]
  2. Steven, M. Zicari Removal of Hydrogen Sulfide from Biogas Using Cow Manure Compost; Cornell University: Ithaca, NY, USA, 2003. [Google Scholar]
  3. Krich, K.; Augenstein, D.; Batmale, J.P.; Benemann, J.; Rutledge, B.; Salour, D. Biomethane from Dairy Waste; Western United Dairymen: Modesto, CA, USA, 2005. [Google Scholar]
  4. Shelford, T.J.; Gooch, C.A.; Lansing, S.A. Performance and Economic Results for Two Full-Scale Biotrickling filters to remove H2S from Dairy Manure-derived Biogas. Appl. Eng. Agric. 2019, 35, 283–291. [Google Scholar] [CrossRef]
  5. Gooch, C.A.; Hogan, J.S.; Glazier, N.; Noble, R. Use of Post-Digested Separated Manure Solids as Freestall Bedding: A Case Study; Cornell University: Ithaca, NY, USA, 2006. [Google Scholar]
  6. Key, N.; Sneeringer, S. Climate Change Policy and the Adoption of Methane Digesters on Livestock Operations; U.S. Department of Agriculture: Washington, DC, USA, 2012.
  7. Allegue, L.B.; Hinge, J. Biogas Upgrading Evaluation of Methods for H2S Removal; Danish Technology Institute: Taastrup, Denmark, 2014; p. 31. [Google Scholar]
  8. Petersson, A.; Wellinger, A. Biogas Upgrading Technologies–Developments and Innovations; IEA Bioenergy: Paris, France, 2009. [Google Scholar]
  9. Oliver, J.P.; Gooch, C.A. Microbial Underpinnings of H2S Biological Filtration; Cornell University: Ithaca, NY, USA, 2016. [Google Scholar]
  10. Schieder, D.; Quicker, P.; Schneider, R.; Winter, H.; Prechtl, S.; Faulstich, M. Microbiological removal of hydrogen sulfide from biogas by means of a separate biofilter system: Experience with technical operation. Water Sci. Technol. 2003, 48, 209–212. [Google Scholar] [CrossRef] [PubMed]
  11. Shelford, T.; Gooch, C. Hydrogen Sulfide Removal from Biogas: Iron Sponge Basics; Cornell University: Ithaca, NY, USA, 2017. [Google Scholar]
  12. Abatzoglou, N.; Boivin, S. A review of biogas purification processes. Biofuels Bioprod. Biorefin. 2009. [Google Scholar] [CrossRef]
  13. Weather Underground. Available online: https://www.wunderground.com/history/daily/us/md/rising-sun/KILG (accessed on 17 October 2019).
  14. Cord-Ruwisch, R.; Kleinitz, W.; Widdel, F. Sulfate-reducing Bacteria and Their Activities in Oil Production. J. Pet. Technol. 1987, 39, 97–106. [Google Scholar] [CrossRef]
  15. Kohl, A.L.; Nielsen, R.B. Gas Purification; Elsevier: Amsterdam, The Netherlands, 1997; Volume 10, ISBN 978-0-88-415220-0. [Google Scholar]
  16. Mehta, A. The Economics and Feasibility of Electricity Generation Using Manure Digesters on Small and Mid-Size Dairy Farms. 2002. Available online: https://papers.ssrn.com/sol3/papers.cfm?abstract_id=2638078 (accessed on 23 August 2019).
  17. Ramos, I.; Pérez, R.; Fdz-Polanco, M. Microaerobic desulphurisation unit: A new biological system for the removal of H2S from biogas. Bioresour. Technol. 2013, 142, 633–640. [Google Scholar] [CrossRef] [PubMed]
  18. Mulbry, W.; Selmer, K.; Lansing, S. Effect of liquid surface area on hydrogen sulfide oxidation during micro-aeration in dairy manure digesters. PLoS ONE 2017, 12, e0185738. [Google Scholar] [CrossRef] [PubMed] [Green Version]
  19. Krayzelova, L.; Bartacek, J.; Díaz, I.; Jeison, D.; Volcke, E.I.P.; Jenicek, P. Microaeration for hydrogen sulfide removal during anaerobic treatment: A review. Rev. Environ. Sci. Biotechnol. 2015, 14, 703–725. [Google Scholar] [CrossRef]
  20. Ramos, I.; Fdz-Polanco, M. Microaerobic control of biogas sulphide content during sewage sludge digestion by using biogas production and hydrogen sulphide concentration. Chem. Eng. J. 2014, 250, 303–311. [Google Scholar] [CrossRef]
  21. Khanal, S.K.; Huang, J.-C. Online Oxygen Control for Sulfide Oxidation in Anaerobic Treatment of High-Sulfate Wastewater. Water Environ. Res. 2006, 78, 397–408. [Google Scholar] [CrossRef] [PubMed]
  22. Khanal, S.K.; Huang, J.C. ORP-based oxygenation for sulfide control in anaerobic treatment of high-sulfate wastewater. Water Res. 2003, 37, 2053–2062. [Google Scholar] [CrossRef]
  23. Speece, R.E. Anaerobic Biotechnology and Odor/Corrosion Control for Municipalities and Industries; Nashville (Ten.); Archae Press: Nashville, TN, USA, 2008; ISBN 9781578430529. [Google Scholar]
  24. Greer, D. Biogas conditioning and upgrading in action. Biocycle 2010, 51, 53–56. [Google Scholar]
  25. Lusk, P. Methane Recovery from Animal Manures: A Current Opportunities Casebook, 3rd ed.; NREL/SR-25145; National Renewable Energy Laboratory: Golden, CO, USA, 1998. [Google Scholar]
  26. Libarle, D.L. Barriers to Adoption of Methane Digester Technology on California Dairies; California Polytechnic State University: San Luis Obispo, CA, USA, 2014. [Google Scholar]
Figure 1. Hydrogen sulfide (H2S) concentrations in the biogas from the iron oxide scrubber (SIOS), with scrubber media replacement to steel wool after 105 days (mid-November).
Energies 12 04605 g001
Figure 2. Average daily biogas production over two month period from June 2016 to May 2017 in the AD system with the iron oxide scrubber (SIOS).
Energies 12 04605 g002
Figure 3. Daily average pre-scrubbed and post-scrubbed CH4 concentration in biogas produced from the AD system with the iron oxide scrubber (SIOS).
Energies 12 04605 g003
Figure 4. Hourly H2S and O2 concentrations in the biogas from the AD system with in-vessel biological desulfurization (SBDS).
Energies 12 04605 g004
Figure 5. Hourly biogas CH4 concentrations from the AD system with in-vessel biological desulfurization (SBDS).
Energies 12 04605 g005
Figure 6. Daily biogas production (m3/d) through the generator, operating on the farm with SBDS, for electricity production.
Energies 12 04605 g006
Table 1. Recommended hydrogen sulfide (H2S) concentration limits for biogas utilization technologies [7,8].
TechnologyH2S Limit (ppmv)
Gas Heating Boilers<1000
Combined Heat and Power (CHP)<1000
Fuel Cells<1
Natural Gas Upgrade<4 (variations among countries)
Table 2. Capital and operating cost summary of different scrubbing technologies in Northeast US.
Scrubber TypeIron Oxide Scrubber (SIOS)In-Vessel Biological Desulfurization (SBDS)Bio-Trickling Filter 1 *Bio-Trickling Filter 2 *
Farm Size750 cows650 cows4200 cows1500 cows
Generator Capacity110 kW140 kW1000 kW500 kW
Scrubber System Capital Cost$525$450$342,000$185,000
Annual Labor, Cleanout CostsN/A$0$10,323$4340
Annual Generator Maintenance Costs$450$28,708N/AN/A
Annual Scrubber Maintenance Costs$960 #$120$8900$9400
Notes: * data obtained from [4]; # Annual scrubber maintenance costs with steel wool as the scrubbing media.
Table 3. Performance summary of two different scrubbing technologies in Northeast US.
Scrubber TypeIron Oxide Scrubber (SIOS)In-Vessel Biological Desulfurization (SBDS)Bio-Trickling Filter 1 *Bio-Trickling Filter 2 *
Average Untreated H2S (ppm)450 ± 42N/A2640 ± 5.852350 ± 5.67
Average Treated H2S (ppm)430 ± 411938 ± 65150 ± 1.84450 ± 3.42
Overall removal Efficiency (%)3.0N/A94.580.1
Avg. Mass of H2S removed (kg/h)0.0009N/A2.370.35
Engine-Generator Set Capacity FactorN/A0.760.930.68
Notes: * data obtained from [4].

