Article

A Case Study on Distributed Energy Resources and Energy-Storage Systems in a Virtual Power Plant Concept: Economic Aspects

1
Faculty of Electrical Engineering, Wroclaw University of Science and Technology, 50-370 Wroclaw, Poland
2
Faculty of Computer Science and Management, Wroclaw University of Science and Technology, 50-370 Wroclaw, Poland
3
TAURON Ekoenergia Ltd, 58-500 Jelenia Góra, Poland
*
Authors to whom correspondence should be addressed.
Energies 2019, 12(23), 4447; https://doi.org/10.3390/en12234447
Submission received: 7 October 2019 / Revised: 12 November 2019 / Accepted: 21 November 2019 / Published: 22 November 2019
(This article belongs to the Special Issue Economics of Sustainable and Renewable Energy Systems)

Abstract

:
This paper analyzes the technical and economic possibilities of integrating distributed energy resources (DERs) and energy-storage systems (ESSs) into a virtual power plant (VPP) and operating them as a single power plant. The purpose of the study is to assess the economic efficiency of the VPP model, which is influenced by several factors such as energy price and energy production. Ten scenarios for the VPP were prepared on the basis of the installed capacities of a hydropower plant (HPP), rooftop solar photovoltaic (PV), and energy-storage system (ESS), as well as weather conditions, in Poland. On the basis of technical conditions, it was assumed that the maximum power capacity of the ESS equaled 1.5 MW. The economic efficiency analysis presented in this paper demonstrated that, in seven years, the VPP will achieve a positive value of the net present value (NPV) for a scenario with 0.5 MW battery storage and rainy summers. Furthermore, sensitivity analysis was conducted on price factors and DER production volume. The price variable had a major impact on the NPV value for all scenarios. The scenario with a 0.5 MW battery and typical summers was highly sensitive to all factors, and its sensitivity decreased as the ESS capacity grew from 0.5 to 1.5 MW.

1. Introduction

The idea of virtual organizations is a concept that was created in the 1980s with the development of information technology (IT). Terms such as virtual company, virtual enterprise, and virtual organization were introduced in works [1,2,3]. Then, a large body of the literature was mainly created in two categories, information and communication technology (ICT), and management. Because a virtual organization consists of different users or a virtual community located at spread sites, different issues can affect it. Therefore, virtual organization management must be studied from both the human and technical aspect.
Definitions of a virtual power plant (VPP) are primarily focused on its technical aspect, and insufficient attention is paid to management [4]. By using advanced management concepts and software technologies, the VPP can become a distributed energy resource (DER) management tool [5], for which DERs the realization of the optimal scheduling could be solved by the economic dispatch model. Numerous works have focused on the issue of VPP economic dispatch (VPED). The VPED model uses scheduling goals including minimizing the total DER generation cost, and maximizing VPP profits, energy savings, and emissions reduction. VPED strategies can adopt centralized dispatch by using centralized scheduling algorithms (e.g., genetic algorithms [6], particle-swarm optimization [7], and differential evolution [8], as well as distributed dispatch algorithms [9,10]). In terms of its optimization model features, economic dispatch can be classified as deterministic or stochastic. A comprehensive review of economic dispatch methods has been conducted in previous papers [11,12].
The VPP is a type of virtual organization. Technological innovations in local power engineering and in ICT (such as smart grids, smart metering, and micro-installations), as well as distributed energy sources (mainly renewable energy sources, RES) contribute to VPP development.
There are two types of VPP, technical and commercial [5]. A technical VPP focuses on the optimization of power generation and flows in real technical conditions; a commercial VPP focuses on competitive participation in the electricity market and attempts to optimize the relation between generation and demand, irrespective of network limitations. Services and functions from a technical VPP include local system management for the distribution system operator (DSO), and providing transmission system operator (TSO) system balancing and ancillary services. Both have the same VPP components, and are only connected together by offering the aggregated profile of DER units to the transmission system [13,14]. The technical and commercial functionality facilitated through a VPP has been described in case studies, with [5] demonstrating the benefits of aggregation.
The presented investigations are based on a real case of the VPP project that consisted of a fragment of the medium and a low-voltage distribution network, in Poland, with a connected hydropower plant (HPP), photovoltaics (PV), and energy storage systems (ESS). One of the investigations had a result related to technical aspects, identifying the maximum ESS power capacity planned to be connected in the selected node of the network associated with the VPP. It was specified that the planned 0.5 MW of the maximum ESS power capacity could be extended to 1 MW due to technical limitations related to grid requirements.
Therefore, the main aim of this paper is to link the technical and economic approach to the virtual power plant. In this paper, the economic efficiency of the investigated VPP was calculated by using the net present value (NPV) method, and the break-even point (BEP) was separately identified for different scenarios. Additionally, sensitivity analysis was conducted that took into consideration factors independent from the VPP (weather and market price). These influence the cost or revenue, so they have a great impact on the economic efficiency of the VPP business. The goal of this paper is to assess and compare the economic efficiency of integrating various users (such as a hydropower plant, rooftop PV, prosumer, and ESS) into a VPP.

2. Literature Review

2.1. RES, Microgrid, and, VPP Economic Analysis

An investment feasibility study is usually conducted through economic analysis to obtain the internal rate of return, NPV, and payback period. Additionally, the sensitivity of several factors, including product price, operational cost, and capital cost is analyzed. Sensitivity analysis is a common methodology for understanding the relationship between input parameters and outputs, testing output robustness, quantifying uncertainty, and identifying the optimal set of assumptions for the model. Both analyses are widely used by financial analysts and economists.
Numerous papers have focused on using NPV to assess the economic efficiency of investment in various micro-RESs [15,16,17,18,19], particular renewables combined together in a hybrid model [20,21,22], or even microgrids [23]. In several, sensitivity analysis was conducted [17,18,19], but only a few papers focused on VPP economic efficiency [24,25]. Therefore, this paper fills the research gap on VPP economic efficiency.
NPV was used to assess the feasibility of various models of small-scale grid-connected microgrid deployment that consists of photovoltaics and an energy-storage system [23]. The analysis was conducted by considering the possible business models available in Indonesia. Results showed that the deployment of a small-scale microgrid equipped with modern control technologies for enabling microgrid services is not economically viable if only the net metering business model is considered. However, providing an incentive for utilizing renewable sources, such as in the feed-in tariff, considerably increased the NPV. In another paper [15], the NPV was used for economic evaluation to choose the most beneficial investment of photovoltaic-distributed generation on the basis of the technical calculation of an optimal PV location and the capacity to reduce power losses. In other investigations, NPV was used to assess the feasibility of a combined heating and power unit coupled with a wind turbine at five locations, in China [20], the feasibility of fuel treatment and bioenergy production by using a case study of ponderosa pine and mixed-conifer forests [21], and the optimal storage sizing for a community composed of multiple houses and distributed solar generation [22]. The NPV method was also used to forecast PV subsidies per kWh, in China, with subsidies for 10 or 20 years, and initial investment subsidies [16].
A sensitivity analysis was used to provide enough information to decide whether solar PV utilization is good for the grid or not, to find the most influential variable for economic parameters in the case of Indonesia [17], and to understand parameters affecting investment in the case of a hybrid photovoltaic and battery energy-storage system for demand-side applications in Taiwan [18]. Sensitivity analysis was also carried out to investigate the effect of battery capacity on consumer dissatisfaction [19].
In [24], the net present value of economic efficiency was assessed from the perspectives of VPP service providers and power companies. The authors considered all benefits associated with the operation, as well as distribution and operation costs that are incurred only for distributing emergency generators in South Korea. In [25], the authors compared the economic efficiency of integrating various flexibility technologies (e.g., DER) into a VPP by using the following criteria: expected operational revenue, conditional value at risk, and expected return of investment.

2.2. Financial Feasibility

There is decision conflict between engineers and businesspeople (managers and economists) related to the efficiency of implemented technologies. Engineers are usually interested in the technical feasibility of an investment, while managers take into consideration the economic aspects, which include financial, environmental, and social aspects. In the case of RES technology, a new investment is usually financially unprofitable unless the environmental and social aspects are included [19,20,21] or a subsidy is used [26,27]. In this paper, we want to answer the question of whether RES technology is still unprofitable in Polish conditions.
In [26], a techno-economic analysis for a solar PV prosumer of the residential sector in Sweden was conducted, and the results showed that the PV investor likely had a 71% chance for a 3% real return on investment, but this chance was decreased to 8% without subsidies. The author in [27] evaluated the potential of developing technically and economically feasible microgrids for selected customer categories, in California, and performed a sensitivity analysis. The results showed that the deployment of a microgrid was economically unprofitable for customers with peak loads below 1 MW, but it could be feasible if there is any external funding available. On the one hand, it was discovered that the higher capacity of the battery purchased by a consumer can decrease consumer dissatisfaction of appliance scheduling with respect to its average peak-period demand, but on the other hand, it could sustain a higher initial cost that is not economically feasible [19]. In the case of a combined heating and power (CHP) unit coupled with a wind turbine, the economic and environmental performance was evaluated. Results indicated that the used model is only economically feasible if environmental indicators are enclosed. Additionally, the feed-in tariff showed a significant impact on real-time operation strategies [20]. In [21], economic evaluation was done on fuel treatment and bioenergy production using a case study of Colorado’s wildland–urban interface. Nonmarket benefits, such as people’s willingness to pay for better forest health, lower likelihood of wildfires, improved air quality, and expanded renewable-energy production were incorporated into the techno-economic analysis of biopower production. The results showed that nonmarket benefits associated with forest health, wildfire likelihood, and air quality significantly improved NPV.

3. Problem Statement

3.1. VPP Participants

In recent years, few amendments have been introduced to Polish legislation related to RES. According to these changes, it can be assumed that potential participants of a VPP could be renewable-energy sources, energy-storage systems, prosumers, energy producers in small RES installations, energy clusters, and energy cooperatives.
The prosumer is an energy end user with a general energy sales contract established with a selected energy seller, only producing electricity from renewable-energy sources in micro-installations with a capacity lower than 40 kW, and not using the generated energy for the needs of the prosumer’s own business [28].
According to Polish law [29], energy-storage systems fulfil the role of supporting installations that generate electricity from RES. This is a beneficial situation to RES installations with capacities beyond 500 kW, which directly sell the produced energy on the market without the participation of obligated energy sellers.
The micro-installation owner uses the produced energy for the needs of their business, which has to be declared in the Regulated Activity Register because it is a regulated activity according to Polish law. The surplus of produced energy over the energy used for their own needs can be bought by any energy seller if the price and delivery conditions are accepted by both sides. They can settle their energy balance by using net metering, but switching to net metering means the loss of the right to energy certificates [30].
An energy cluster is a civil–legal agreement that may include individuals, legal persons, scientific units, research institutes, or local government units. The cluster deals with the generation and balancing of energy demand, distribution, or trading from RES or from other sources within a distribution network with a rated voltage of less than 110 kV.
Energy cooperatives are associations whose purpose is to produce energy for their own needs and to sell possible surpluses to the network. The law on cooperatives determines their functioning, production volume, and the area of functioning for the members. Total energy production inside the cooperative is limited depending on the energy carrier: electricity (unit power up to 10 MWe), biogas (efficiency up to 40 million m3 per year), and heat (heating power up to 30 MWc).

3.2. VPP Business Models

Since 1957, when the term “business model” (BM) was first used by Bellman, Clark, Malcolm, Craft, and Ricciardi, the business model became a kind of simplified and aggregated representation of the essential activities of a company. Numerous papers confirmed the importance of BMs in practice because they are related to ensuring and growing a competitive advantage, but only a few of them concern VPPs. A comprehensive analysis of different BMs and their components was conducted by Wirtz et al. in [31], and Shafer et al. in [32]. These considerations resulted in a BM consisting of the following nine relevant components: (1) strategy, (2) resources, (3) network, (4) customer, (5) value proposition, (6) revenue, (7) service provision, (8) procurement, and (9) finances.
The BM presented in [33] contained only resources, customers (residential), and value-stream transactions between participants. The case study was based on a micro virtual power plant (µVPP), a VPP unit that has all the necessary interfaces ready for vertical integration into a VPP, established in Malmo, Sweden. The µVPP is equipped with solar PV microgeneration, controllable loads such as electric vehicles and electric heat pumps, a scalable ESS, a home energy-management system, and other critical household appliances. It analyzed the following economic criteria: bill savings, VPP profit, ESS lifetime, and payback period.
In [34], the authors focused on a value proposition for end users of DG units that they can enjoy if they formulate a VPP with the increased flexibility of controllable loads. In this study, data from a pilot VPP consisting of three different installations, in Greece, with a variety of DER sources and flexible loads were used. The authors analyzed one of the experimental business models within the European Distributed Energy Partnership (EU-DEEP) project, in which the impact of flexibility on load management was studied. The economic criteria that were analyzed were demand reduction and operation costs. The value added for the VPP was the reduction of requested energy from the grid.
Leisen et al. [35] focused on new sustainable business models in the energy sector, in Germany, but surveyed them in terms of their risk profile, especially concerning the risk of regulatory, market, and operational changes. They conducted extended case-study analysis for six new sustainable-energy business models built on clean-energy transition, liberalization, and digitization. One of the identified BMs was the VPP, with customers such as energy-sector players and commercial/industrial players devoid of households. They assumed that the VPP could participate in frequency regulation and reserve markets, and therefore the VPP faces many different market conditions and regulatory processes. The authors identified 23 risks, of which 11 are risks with high probability and financial impact.
In [36], the authors performed a critical comparison of several VPPs in terms of BM, and pointed out both common and unique features for each model from the following countries: USA, Germany, Finland, Denmark, and Australia. The analysis included the following six components of business models: strategy, resources, network, customers, value propositions, and revenue. Two different types of DER portfolio in VPP were specified: (1) solid oxide fuel cells based on m-CHP that are used alone or with PV and (2) different RES connected together with energy-storage systems. Among RES, PVs are predominately used, but also wind turbines and biogas. Among customers to whom the value proposition is addressed are residential customers, municipalities, commercial and industrial customers, energy storage, and utility companies.
An in-depth analysis of the VPP BM in terms of using it under Polish conditions was conducted in [30]. The authors emphasized that the most important BM component is, on the one hand, the relationship between customers, clients, partners, and suppliers, and, on the other hand, resources that can be expanded and used (new customers and new dispersed energy sources), as well as potential sources of future economic benefits (new products, power market, and megawatts). A systemic approach that combines these elements was, therefore, chosen and the business model canvas proposed by Osterwalder and Pigneur [37] was used. This structure analyzes a company’s business with the help of nine components that clearly describe the business model.

3.3. Local Conditions in Poland

In the case presented in this article, the VPP is the business separated from the organizational structure of Polish energy companies. A VPP business model could be perceived as a business independent from other services delivered by the analyzed enterprise. Each separated business model should be profitable, which means that the VPP should be self-financing, but it is not easy to achieve this in Polish conditions, which are presented in Section 4.3. It seems that the situation is similar in other countries. Therefore, investors look closely at the VPP business and analyze its profitability from the point of view of end users and energy organizations (e.g., energy utility companies) by using the cost-benefit analysis (CBA) method [24] or a modified NPV [33].
Actual Polish conditions and relations in the holding company were taken into account. Special assumptions were connected with the owners, and the level of asset depreciation belonging to the VPP and its financial sources, as well as accounting for principles of energy usage resources (including water generators).

4. Investigation of DER and ESS Impact on VPP Efficiency, a Case Study

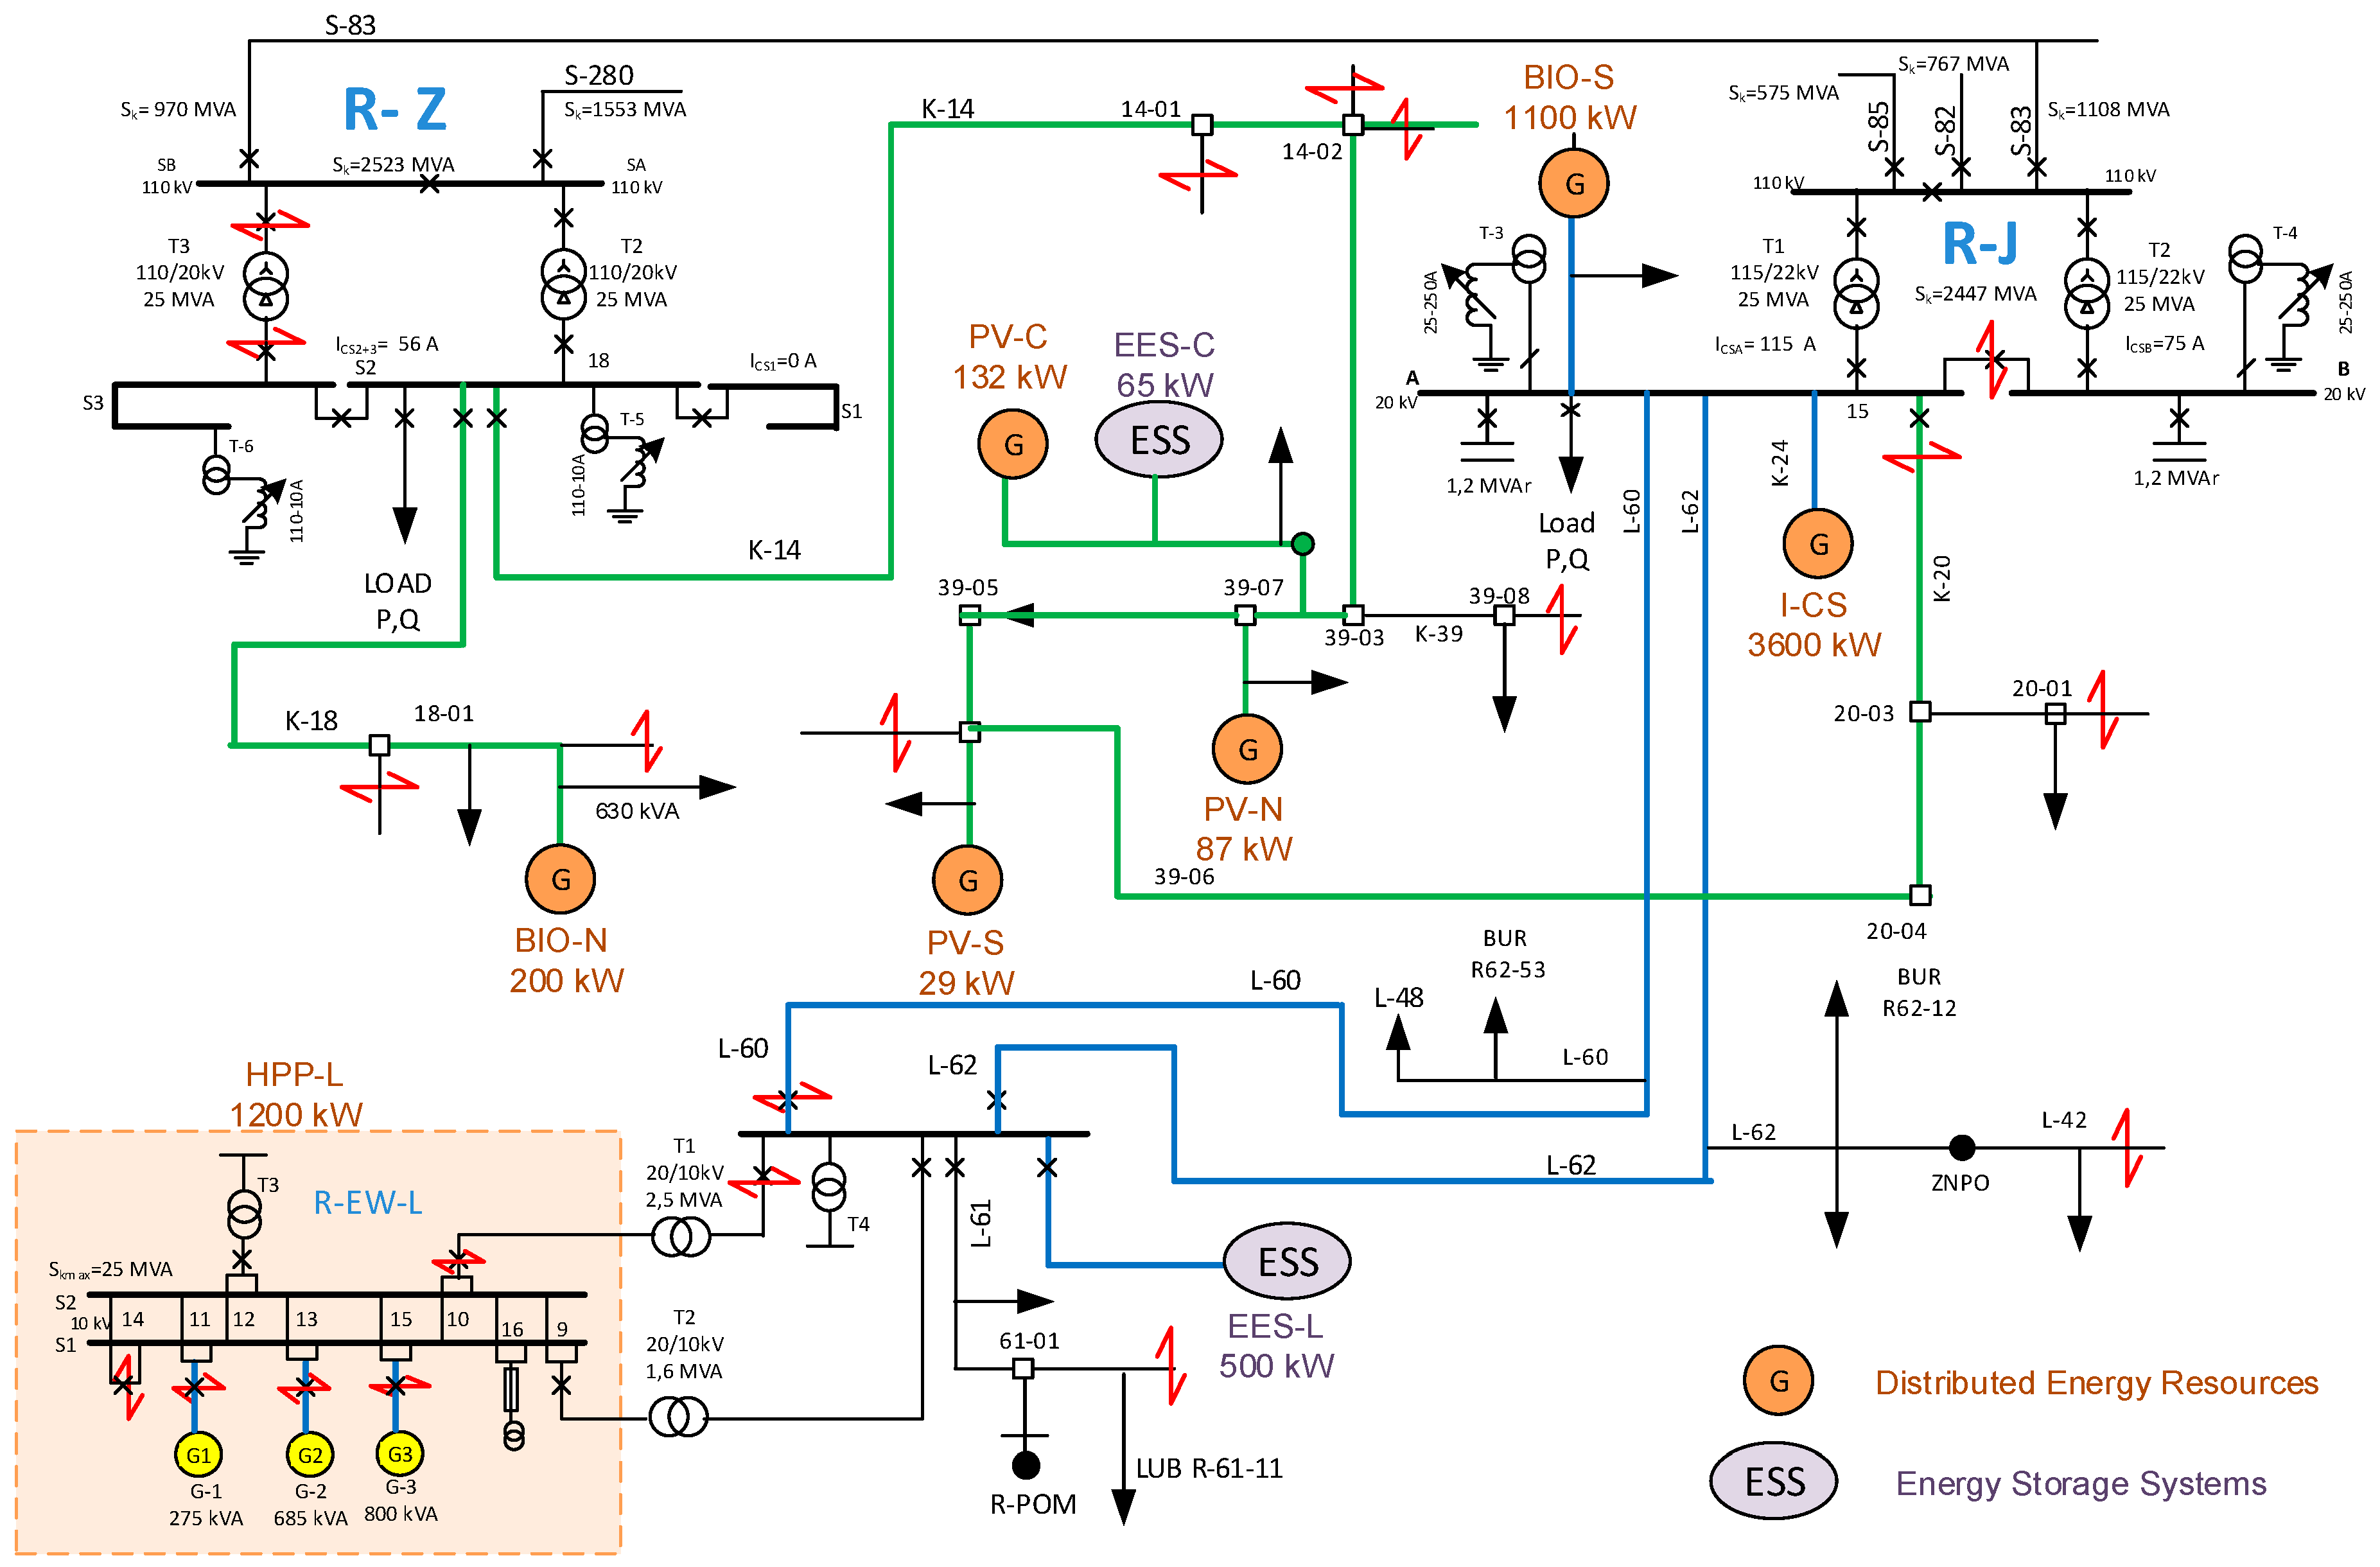
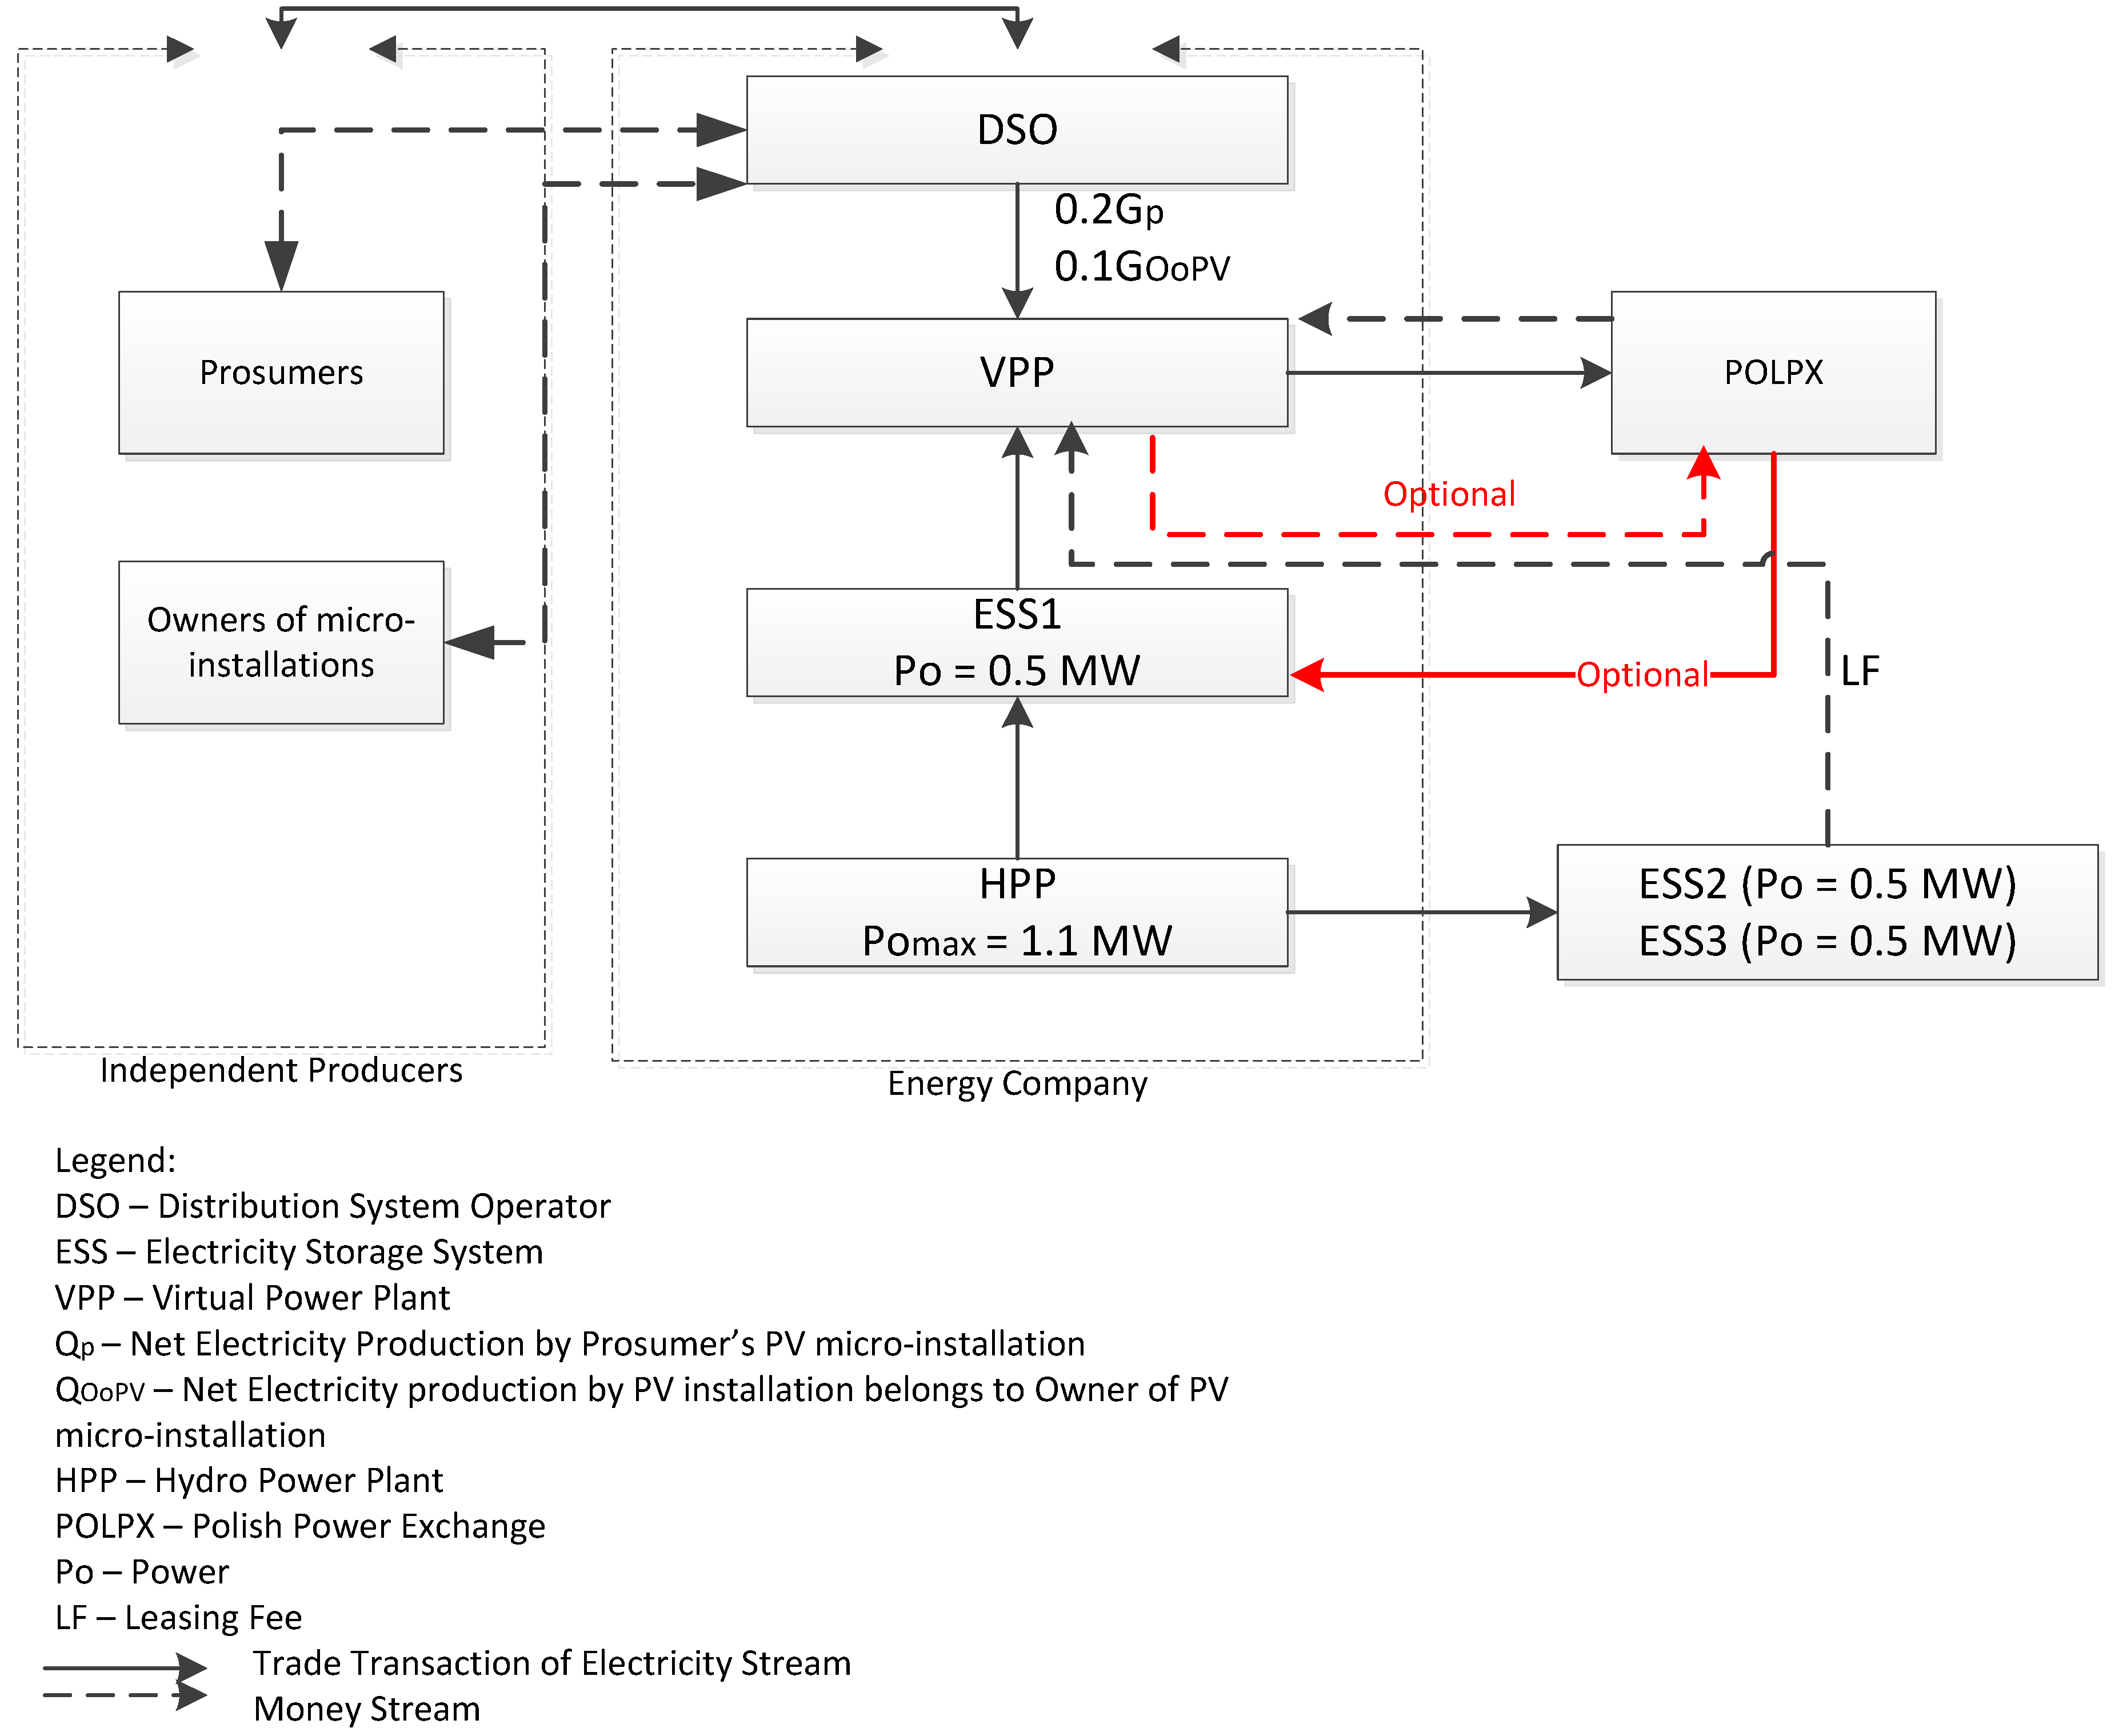
4.1. Assumption of VPP Assets and Its Relation with Electricity-Market Cooperators (Partners)

The analyzed VPP is located in a real electricity-grid system. The typology of the investigated VPP is presented in Figure 1.
The VPP is an autonomous business that is physically located in a Polish energy company with a typical organizational structure for a holding company. The company could be treated as a typical Polish energy corporation that generates electricity (mainly from RES) and heat, trades energy, participates in whole and local energy markets, transmits and distributes energy to consumers, is independent from electricity operators, and offers other energy services. The performed functions are in accordance with European Union (EU) regulations (e.g., unbundling principle/rule).
The main asset belonging to the VPP is an IT system that manages and optimizes processes such as the electricity storage coming from distributed independent sources (mainly from prosumers) and electricity trade. It needs additional services delivered by outside companies, e.g., by ICT operators, owners of price database, or data about weather forecasting. The effective work and simulations made by optimization algorithms embedded in the IT system need to be fed by the appropriate database, and the IT system needs access to a cloud that allows computing operations in a short amount of time. Costs come from these necessary IT services provided by outside (outsourced) firms. This fact was taken into consideration in financial assumptions.
Apart from IT assets, the VPP needs a worker, i.e., an IT system administrator. From the presented characteristics of the VPP assets and direct services comes the main direct cost of the VPP. Additionally, in the presented business model of the VPP, it was assumed that personalized advisors are employed. The number is dependent on the number of prosumers, and each advisor could cooperate with the maximum number of 50 prosumers.
The idea of the VPP is based on the physical cooperation with such partners as prosumers and other owners of renewable-energy sources, an independent distribution system operator (DSO), and an ESS owner. Figure 2 presents the main partners of the VPP, and the physical (energy) and financial streams between them. One of the energy-storage batteries (creating the ESS) and the hydrogenerators belong to the energy company, but the VPP must partially contribute to their costs. ESS1 was cofunded from an EU fund. The other two energy-storage batteries (ESS2 and ESS3) were leased from an independent energy company. Costs depend on generator age and financial sources. The capacity of each energy-storage battery equals 0.5 MWh, and power totals 0.5 MW. It can be discharged to up to 90% of the maximum capacity, and the maximum number of cycles is 5000 for an 80% level of discharge.
In the analyzed VPP business model, there are two kinds of independent producers (IP) who generate and provide electricity. This energy is purchased by the energy company and it is used to optimize the benefits of VPP activity. The first IP is a prosumer. For prosumer micro-installations, the role of power storage is played by the distribution network with the energy register received by the seller from the prosumer [38]. The second IP type is owners of micro-installations. It is an energy producer in a small installation whose technical role is similar to the prosumer’s but, according to Polish legislation, the conditions of cooperation and the payment mechanism are completely different. The prosumer accounts for the delivered electricity with the obligatory seller (the energy company) in the discount system. This means that the prosumer only buys the surplus of consuming energy as compared with the produced energy by its micro-installation, or the energy company pays them if the prosumer consumes less than they produce. The period of calculation equals a one-year cycle. The energy company (DSO) takes some energy for free, and its value totals a percentage of the produced net energy (without auto-consumption by micro-installation) in a micro-installation that belongs to a prosumer. The percentage depends on the power of an installation and its type (e.g., micro-wind turbine, biomass generator, water generator, and PV installation), and it is defined in the Polish Renewable Energy Sources Act. For the surplus of produced energy above the prosumer’s needs and introduced into the network, the DSO gives the prosumer a discount in the provided energy in the proportion from 1 to 0.7 (or from 1 to 0.8 for micro-installations of no more than 10 kW of power), i.e., the prosumer "gives" 70% or 80% of the received energy. It is a similar solution to the barter trade system. On the basis of this legislation, it was assumed in the presented VPP model that 20% of net electricity production is provided to the VPP for free (Figure 2). A similar solution was proposed for cooperation with a micro-installation owner, but according to an interview with energy-company employers, the calculated discount was 10%. This part of energy is sold by the VPP in real time on the wholesale market (POLPX). Of course, a more complex VPP business model could take into consideration other options, and it links energy production in micro-installations with a more elaborate ESS, including batteries and/or prosumers’ electric cars. However, this solution is unlikely in Poland in a wide range and without any additional government-support programs.
The energy generated by the HPP belonging to the energy company is dedicated to the VPP. Thus, the VPP has all the HPP power at its disposal. The energy company before this act underwent complex renovation of its water turbines and automatic control system, which is now compatible with the VPP’s IT system. The HPP modernization was made with EU funds. Nowadays, the HPP has a regulation function in the local electricity system, and energy generated by the HPP.
The produced energy in the HPP is distributed to energy consumers joined to the local electricity-distribution grid belonging to the DSO. After moving energy produced in the HPP to the VPP, the energy company should cover this demand from other sources, but this issue is not the topic of this article. Notably that the average electricity production coming from the HPP’s turbines is equal to about 950 prosumers having a PV installation of average power that equals 5 kWp in the analyzed area.
The batteries (ESS) are charged by the HPP. Available historical data on the energy company (from 2008 to 2018) confirm that this solution is realistic. Only in one year was the total annual electricity production by the HPP about 1300 MWh, while in other years it was more than 2400 MWh. Therefore, there could be a problem with charging the third battery from this source during the dry seasons (e.g., in summer). On the basis of the data, the probability of this random event is 10%. Streams marked red in Figure 2 illustrate this optional situation.
The final partner of the VPP is the Polish Power Exchange (POLPX) as the main consumer.

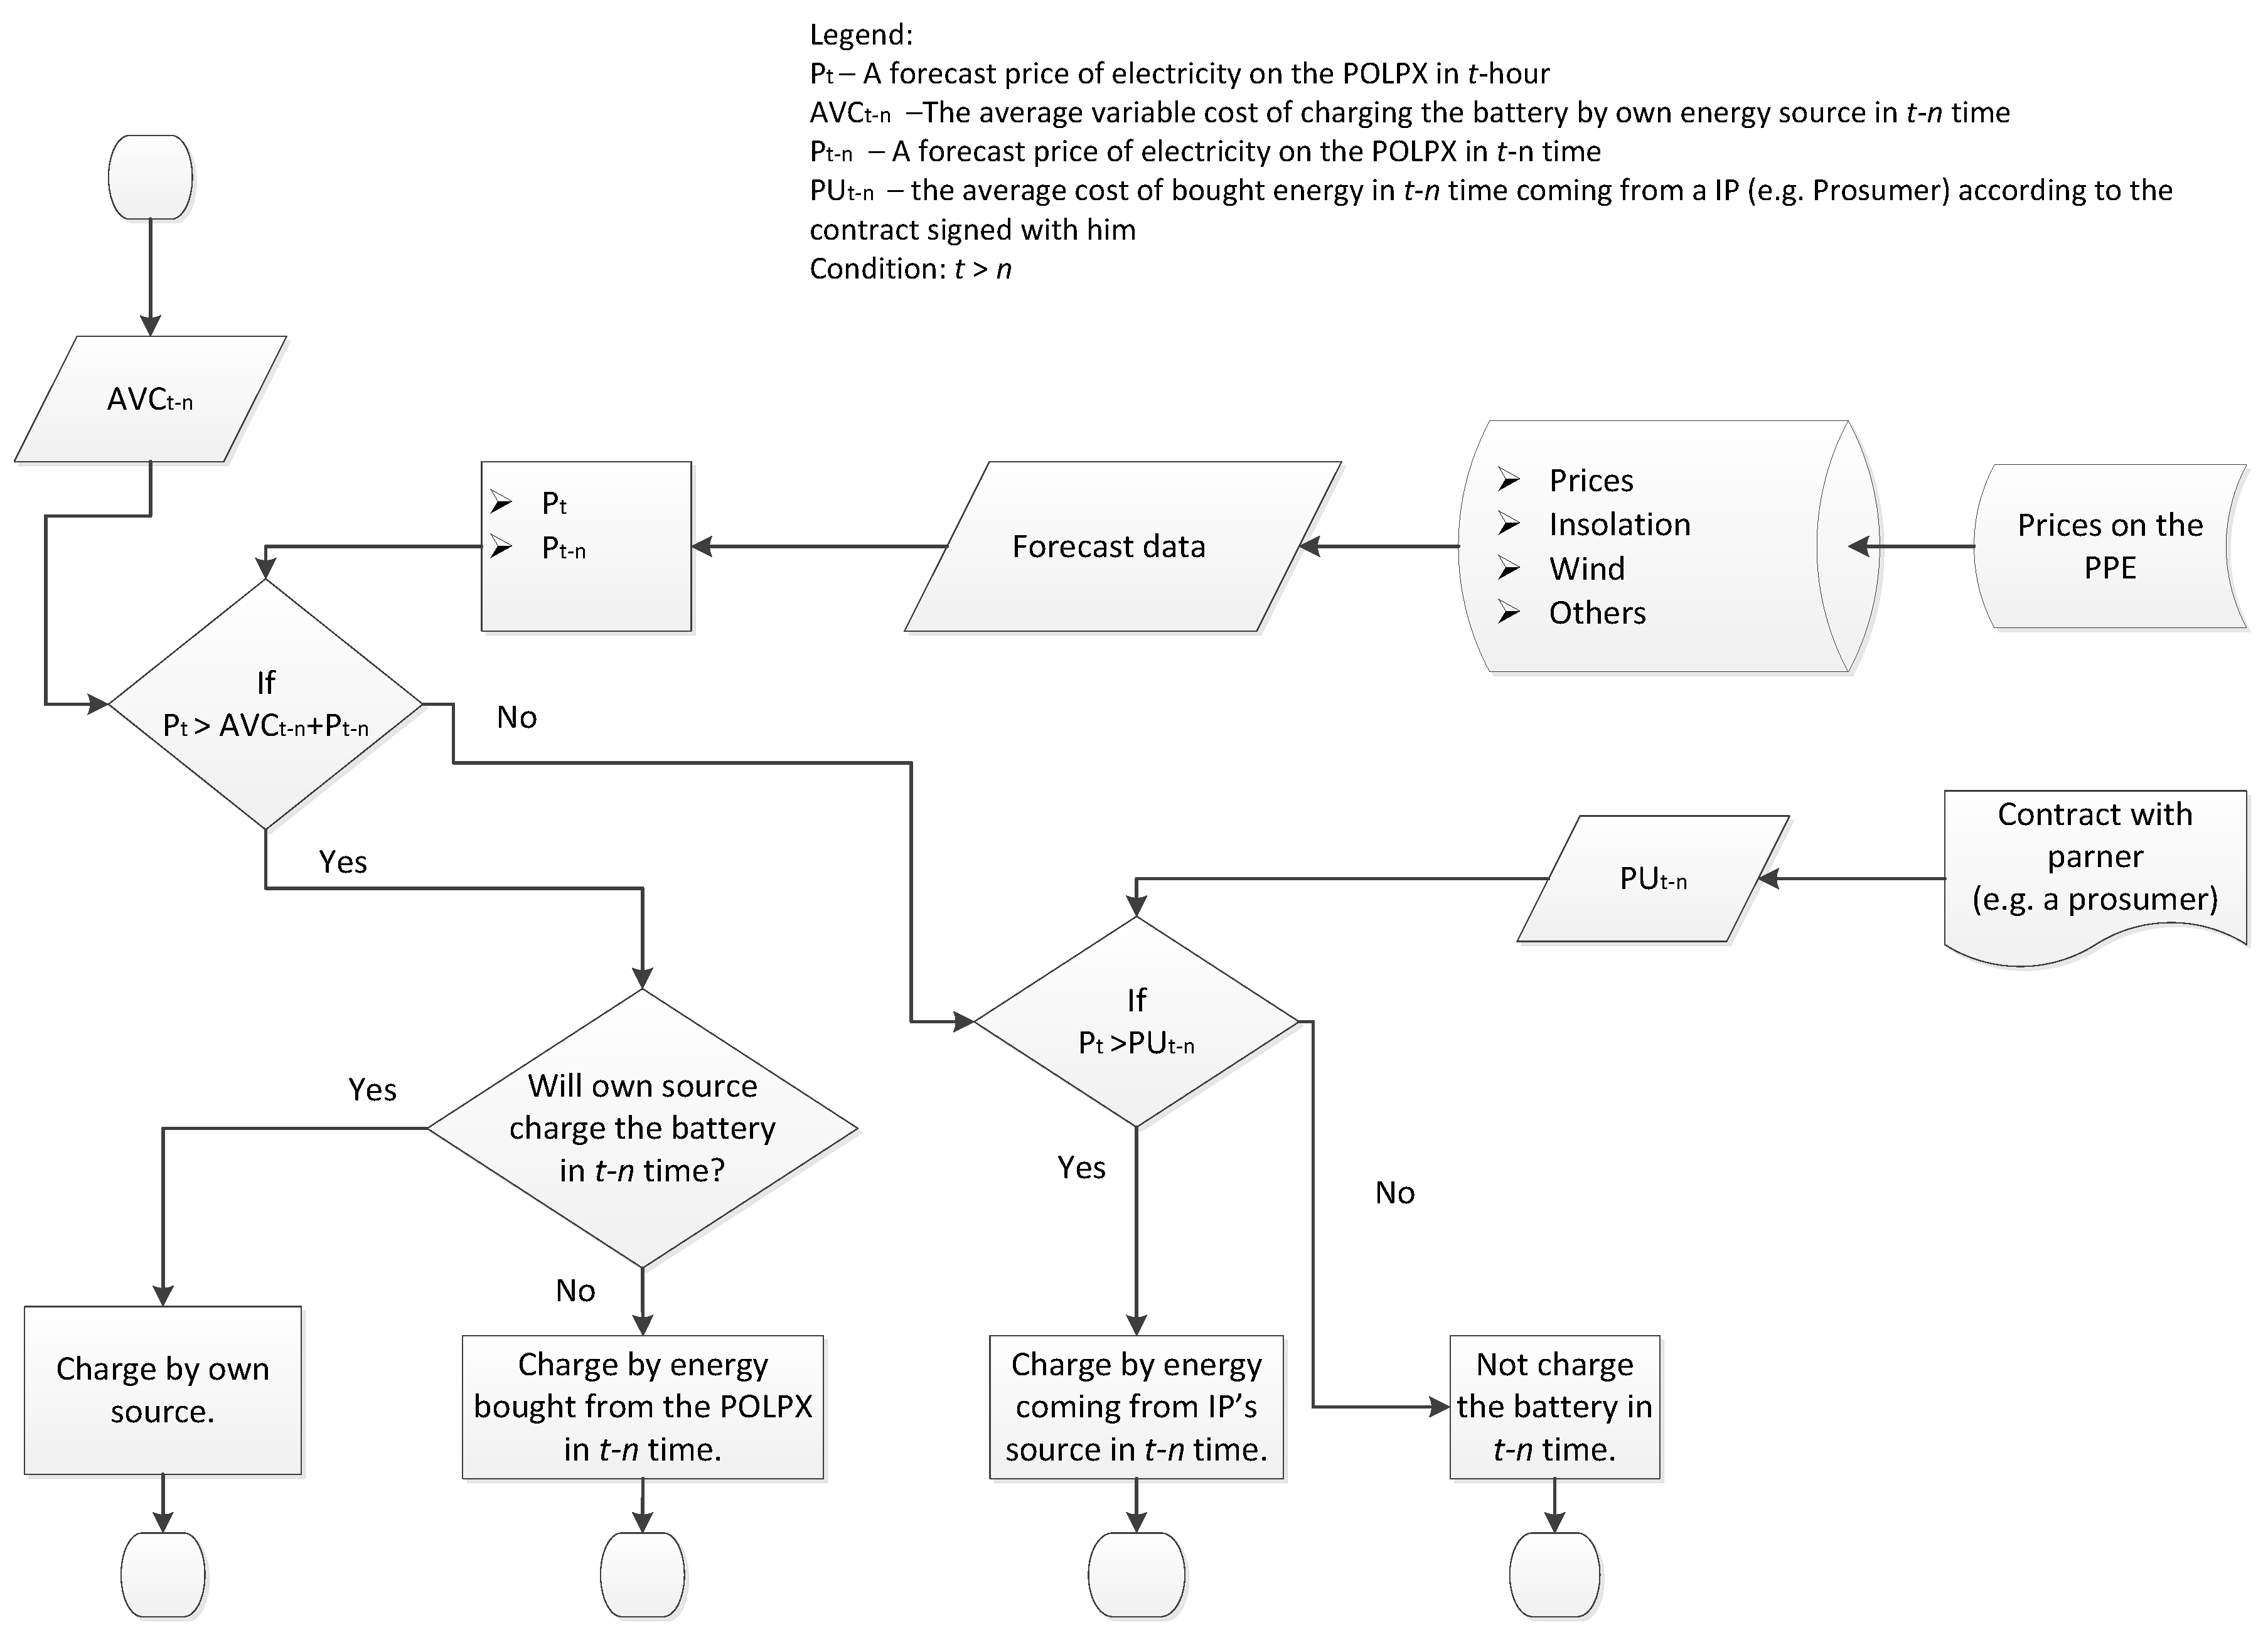
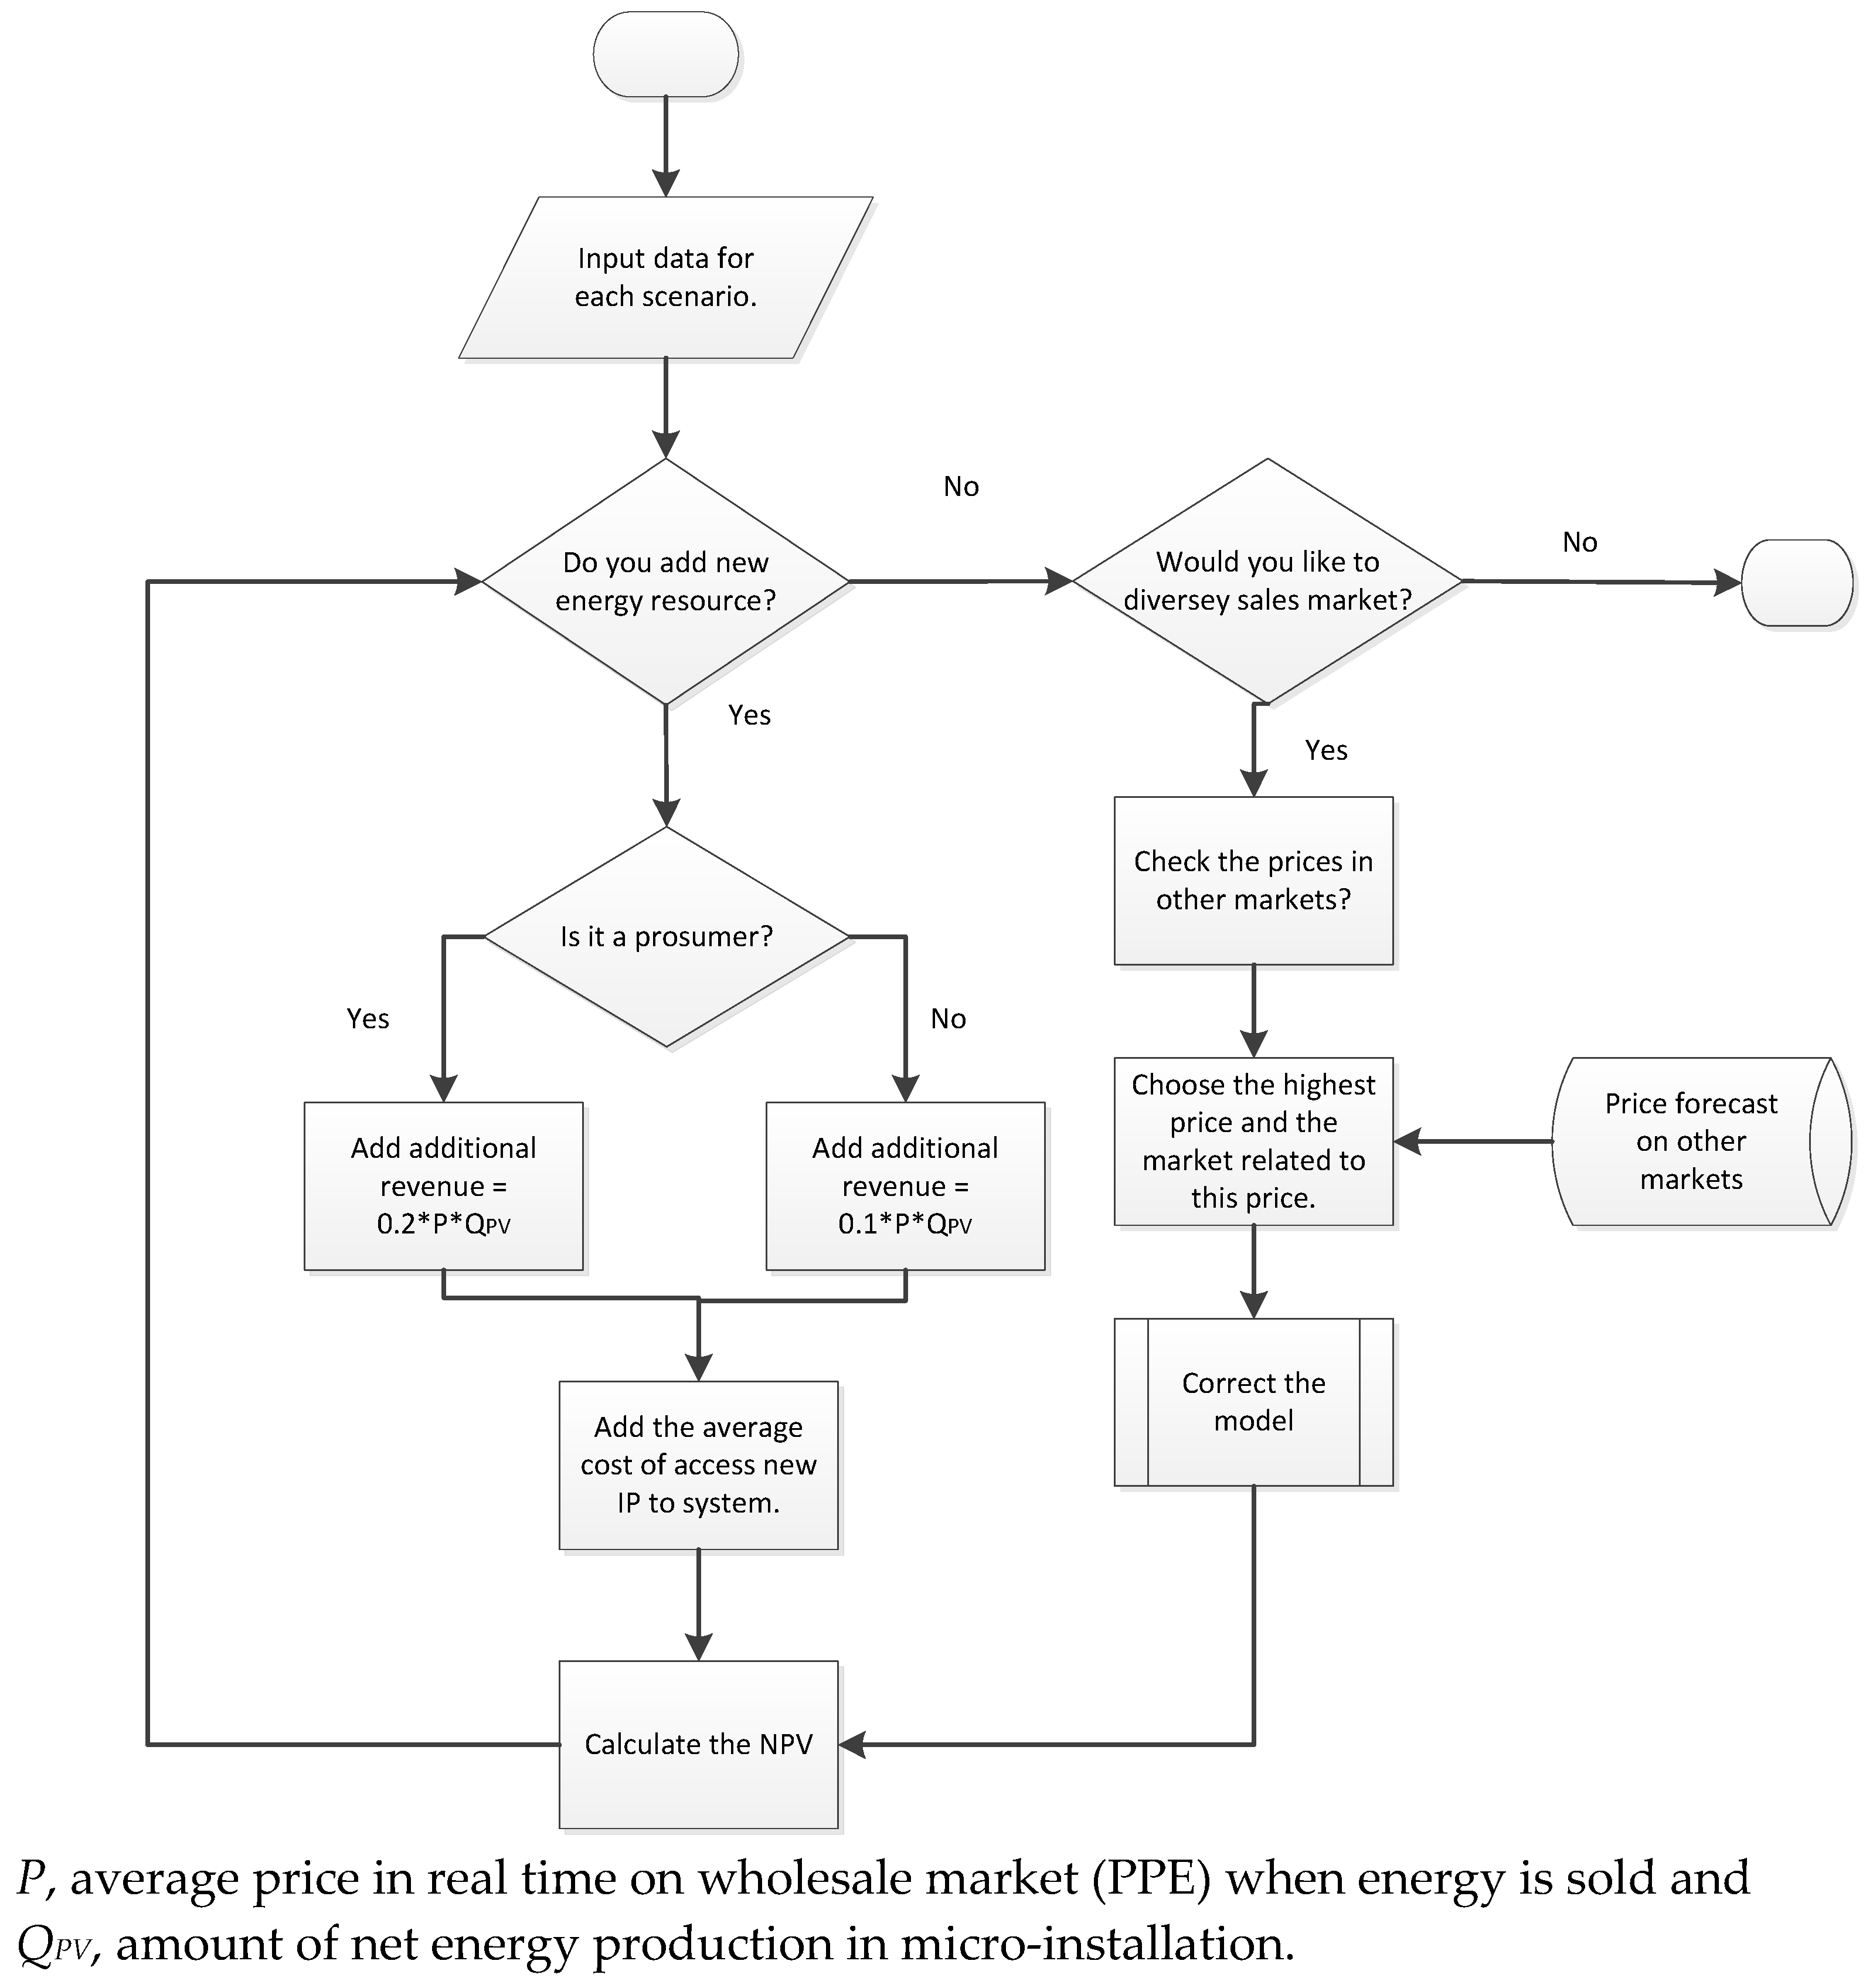
4.2. VPP Decision Model

On the basis of the accessed RES (the HPP and PV micro-installations belonging to the IP), the main aim of the VPP is to maximize profit while taking into consideration technological and technical constraints and accessed storage power. Profit is defined as an additional benefit coming from the possibilities of selling energy when the price is the highest on the market (in peak-up hours) and buying energy when the price is the lowest (in low-price hours). The ESS allows energy storage and the shift of consumption in relation to its production. The IT system of the VPP supports this procedure and achieves a result close to the optimal situation on the market. In this case study, profit maximization means maximizing Formula (1).
Y   =   M A X j = 1 m t = 1 24 [ P m a x j Q E S S t   P m i n j Q E S S t n ] ,
where:
  • Pmaxj is the maximum price on POLPX during j day;
  • Pminj is the minimum price on POLPX during j day;
  • QESSt is the energy amount coming from the ESS that is sold on t hour in j day when market price is the highest;
  • QESSt –n is theenergy amount charging the battery storage on t-n hour in j day when market price is the lowest;
  • t is the hour in a day j;
  • j is the day in a year;
  • m is thenumber of days in a year.
The daily-price function is characterized by two peak hours and two low hours. Thus, there are two Pmax as the local extremes on the daily-price function on POLPX. One of the PMax was higher than the other; an analogous situation is the case with PMin. This justifies discharging the ESS twice a day when prices reach the local extreme and charging the ESS twice a day when prices are the lowest.
Efficiency is calculated by using the modified NPV method according to Formulae (2) and (3).
N P V   =   ( I E x     F E U )   +   i = 1 n C F i ( 1 + r ) i
C F   =   T R H P P   +   T R E S S   +   T R I P   +   T R P     ( T C H P P   +   T C V P P   +   T C E S S     A V P P   +   T C P O L P X )
where:
  • IEx is the investment expenditure;
  • FEU is the grant from EU fund;
  • CFi is the cash flow in i year;
  • r is the discount rate;
  • TRHPP is the total revenue coming from energy sold in real time that was produced in the HPP and not used for charging ESS;
  • TRESS is the total revenue coming from energy sold from ESS;
  • TRIP is the total revenue coming from IP micro-installations;
  • TRP is the total revenue coming from prosumers micro-installations
  • TCHPP is the total VPP cost (taxes, operational costs);
  • TCVPP is the total VPP cost (IT administrator wages, ICT services, database, and amortization);
  • TCESS is the total ESS cost (leasing cost of ESS1 and ESS2);
  • AVPP is the VPP amortization calculated only for non-cofunded volume of investment expenditure;
  • TCPOLPX is the cost of buying energy from POLPX to charge ESS3 (only in scenario 10 (S10)).
Each revenue was calculated separately for workdays (usually from Monday to Friday), and for free days (usually Saturday, Sunday, and holidays). For each type of day, total revenue is the sum of revenue in peak and nonpeak hours. Additionally, TRIP and TRP depend on the free quota (amount) of energy that a prosumer and an IP give to the energy company for free. This trade aspect is described in Section 4.1 and presented in Figure 2. Formulas (4) and (5) show how TRIP and TRIP are calculated.
T R I P   =   0.1 N I P i = 1 j = 1 w ,   h P i j Q P V i , j
T R P   =   0.2 N P i = 1 j = 1 w ,   h P i j Q P V i , j ,
where:
  • Pij is the average price on POLPX in days and j hours;
  • QPVi,j is the net production from micro-installation belonging to IP (Formula 4) or prosumer (Formula 5);
  • NIP is the number of IPs;
  • NP is the number of prosumers;
  • w is the type of day (work or free day);
  • h is the type of hour in i day (peak or nonpeak hours).
In terms of the presented case study, revenue coming from electricity sold on POLPX is compared with the expenditure that is mainly connected with operational activities that equal VPP operational costs and the cost of batteries. In this case study, the energy company bears only part of the investment expenditure because VPP investment was cofunded by the EU grant. From the point of view of cash flow, this procedure is more complicated. It means that the company bears all investment costs and, later, part of the eligible expenditure is returned as the grant from the EU fund. These reimbursed expenditures are calculated according to account regulations as other types of revenue in financial statements. Figure 3 presents a simple VPP decision model to calculate the NPV.
The most important factors influencing NPV (revenue, cost) are electricity price, number of IPs, weather (dry or sunny summer), and ESS charging and discharging. The VPP could only influence ESS work and acquire new IPs (prosumers and owners of micro-installations). It is possible to diversify the sales market, but in the presented simple model there is only one market segment, POLPX. The presented decision model is linked with a short-run decision, but NPV calculation is made on the basis of a long-run assumption. Error of the embedded mathematical algorithm in the VPP IT system, which makes short-run decisions, has a significant influence on the financial result of the VPP over a long period of time. The decision process connected with charging and discharging the ESS (Figure 4) is complementary to the main decision process of the VPP. Additionally, there is the possibility of charging the battery with energy coming from micro-installations belonging to the IPs (Figure 4).
In the presented VPP model, it was assumed that the financial cost of charging the battery by its own source equals zero (null). In terms of the economic analysis, to maximize Formula (1) before the battery-charging process by its own source, the decision maker (in the case of the VPP, the decision maker is the IT system) has to compare the price forecast in t-n time and in t time. If the difference is the maximum, the battery should charge for one hour; n is one hour because the battery needs one hour to be charged. To achieve Formula (1), the VPP must have a daily forecast of market prices (“forecast data” in Figure 4) and choose the hour during which the forecast price is the lowest. In reality, the battery is charged if the difference is positive. Otherwise, the generated energy in its own source should be sold in real time (Figure 4).

4.3. Assumptions, Conditions, and Scenarios

In this paper, ten scenarios were taken into consideration. The differentiating factors are weather conditions and the number of batteries and all scenarios are presented in Table 1.
Revenue is mainly dependent on the following:
  • energy production in the HPP, which is a result of water level, which, in turn, depends on average rainfall in a year;
  • market price on POLPX.
Some assumptions are common in each scenario (Table 2). They are connected with cost, revenue, rates, and expenditure. Scenarios based on statistical data for the HPP are as follows:
  • S1, S2, and S3 have net energy production equaling average arithmetic production for the analyzed historical period;
  • S4, S5, and S6 have energy production equaling average arithmetic production plus standard deviation for the analyzed historical period;
  • S7, S8, and S9 have energy production equaling average arithmetic production minus standard deviation for the analyzed historical period; and
  • S10 have energy production equaling average arithmetic production minus standard deviation for the analyzed historical period without the possibilities of charging ESS3 in the HPP.

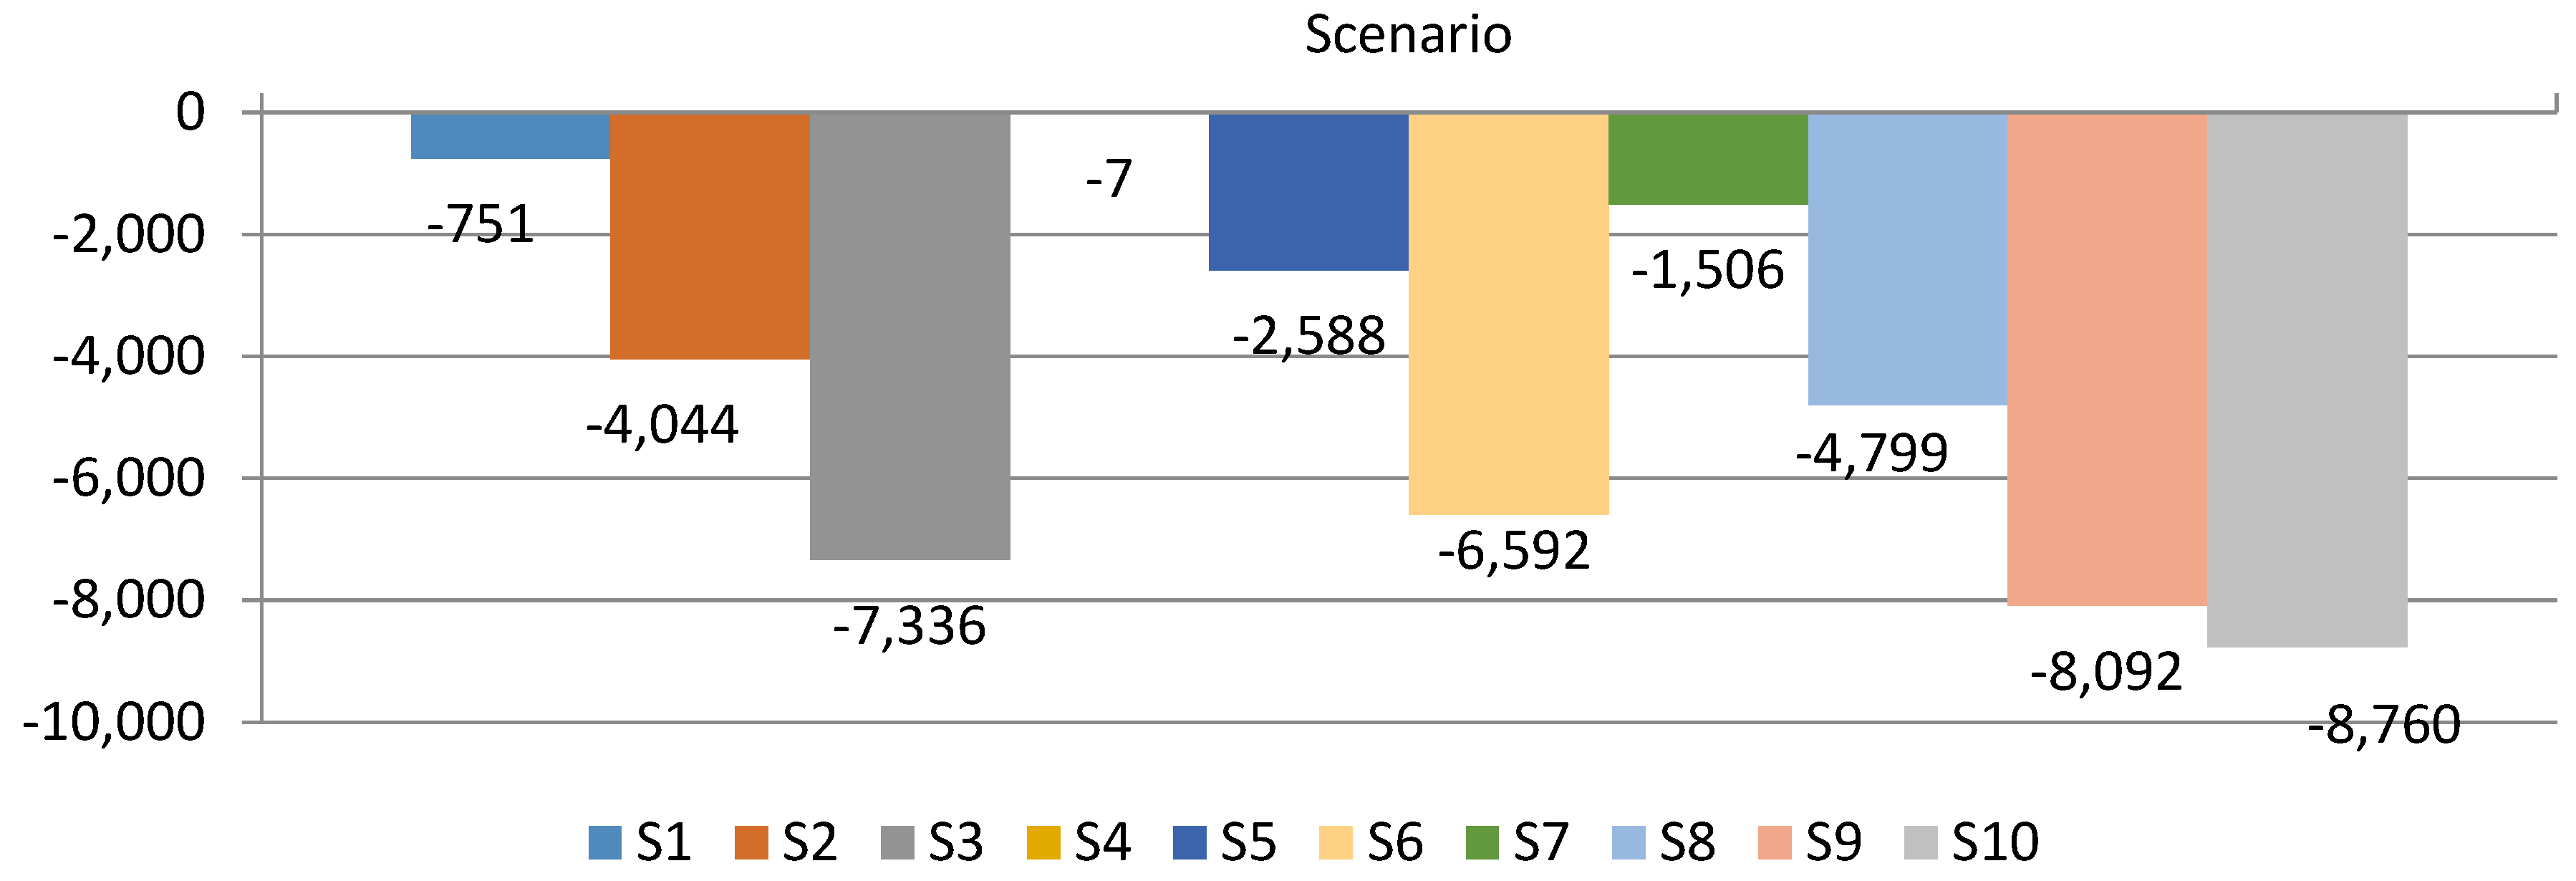
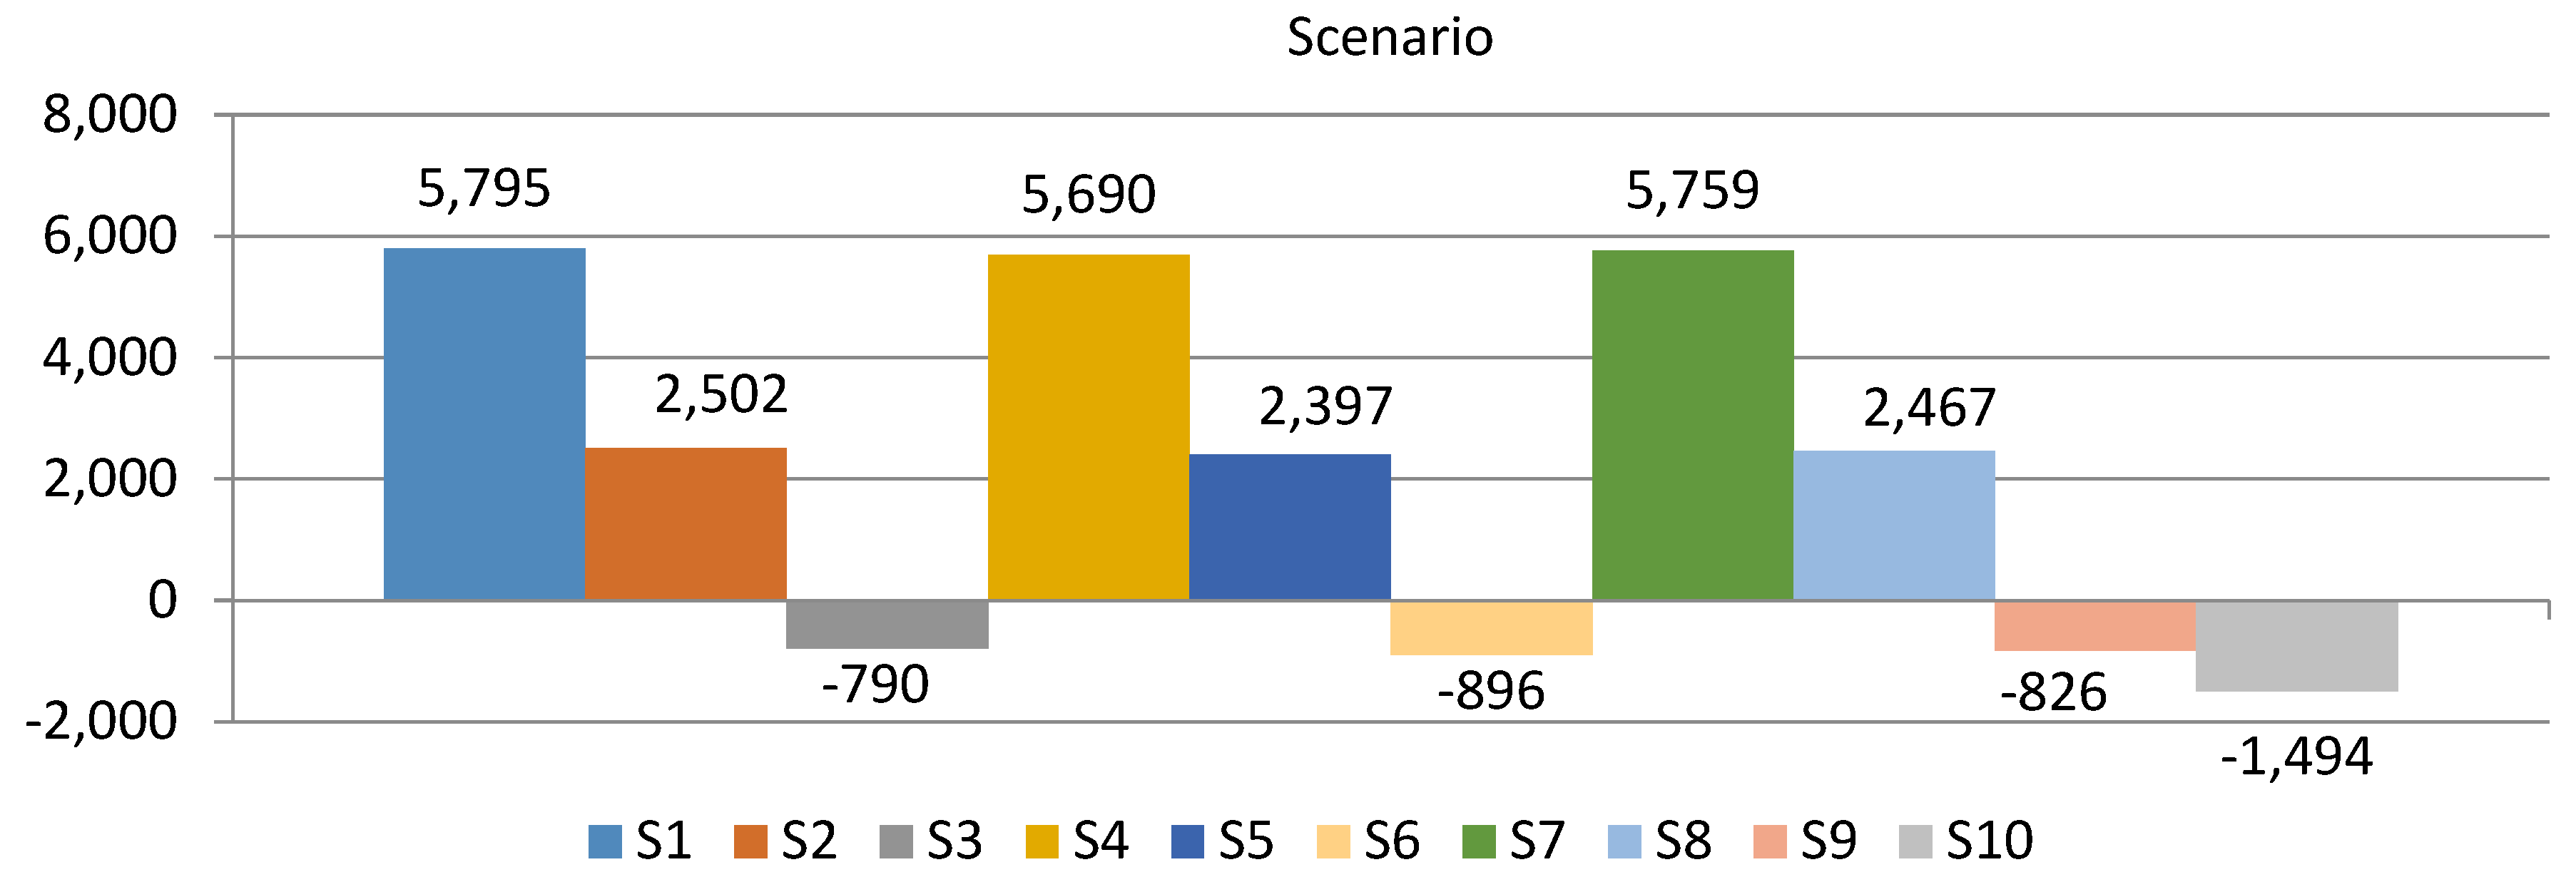
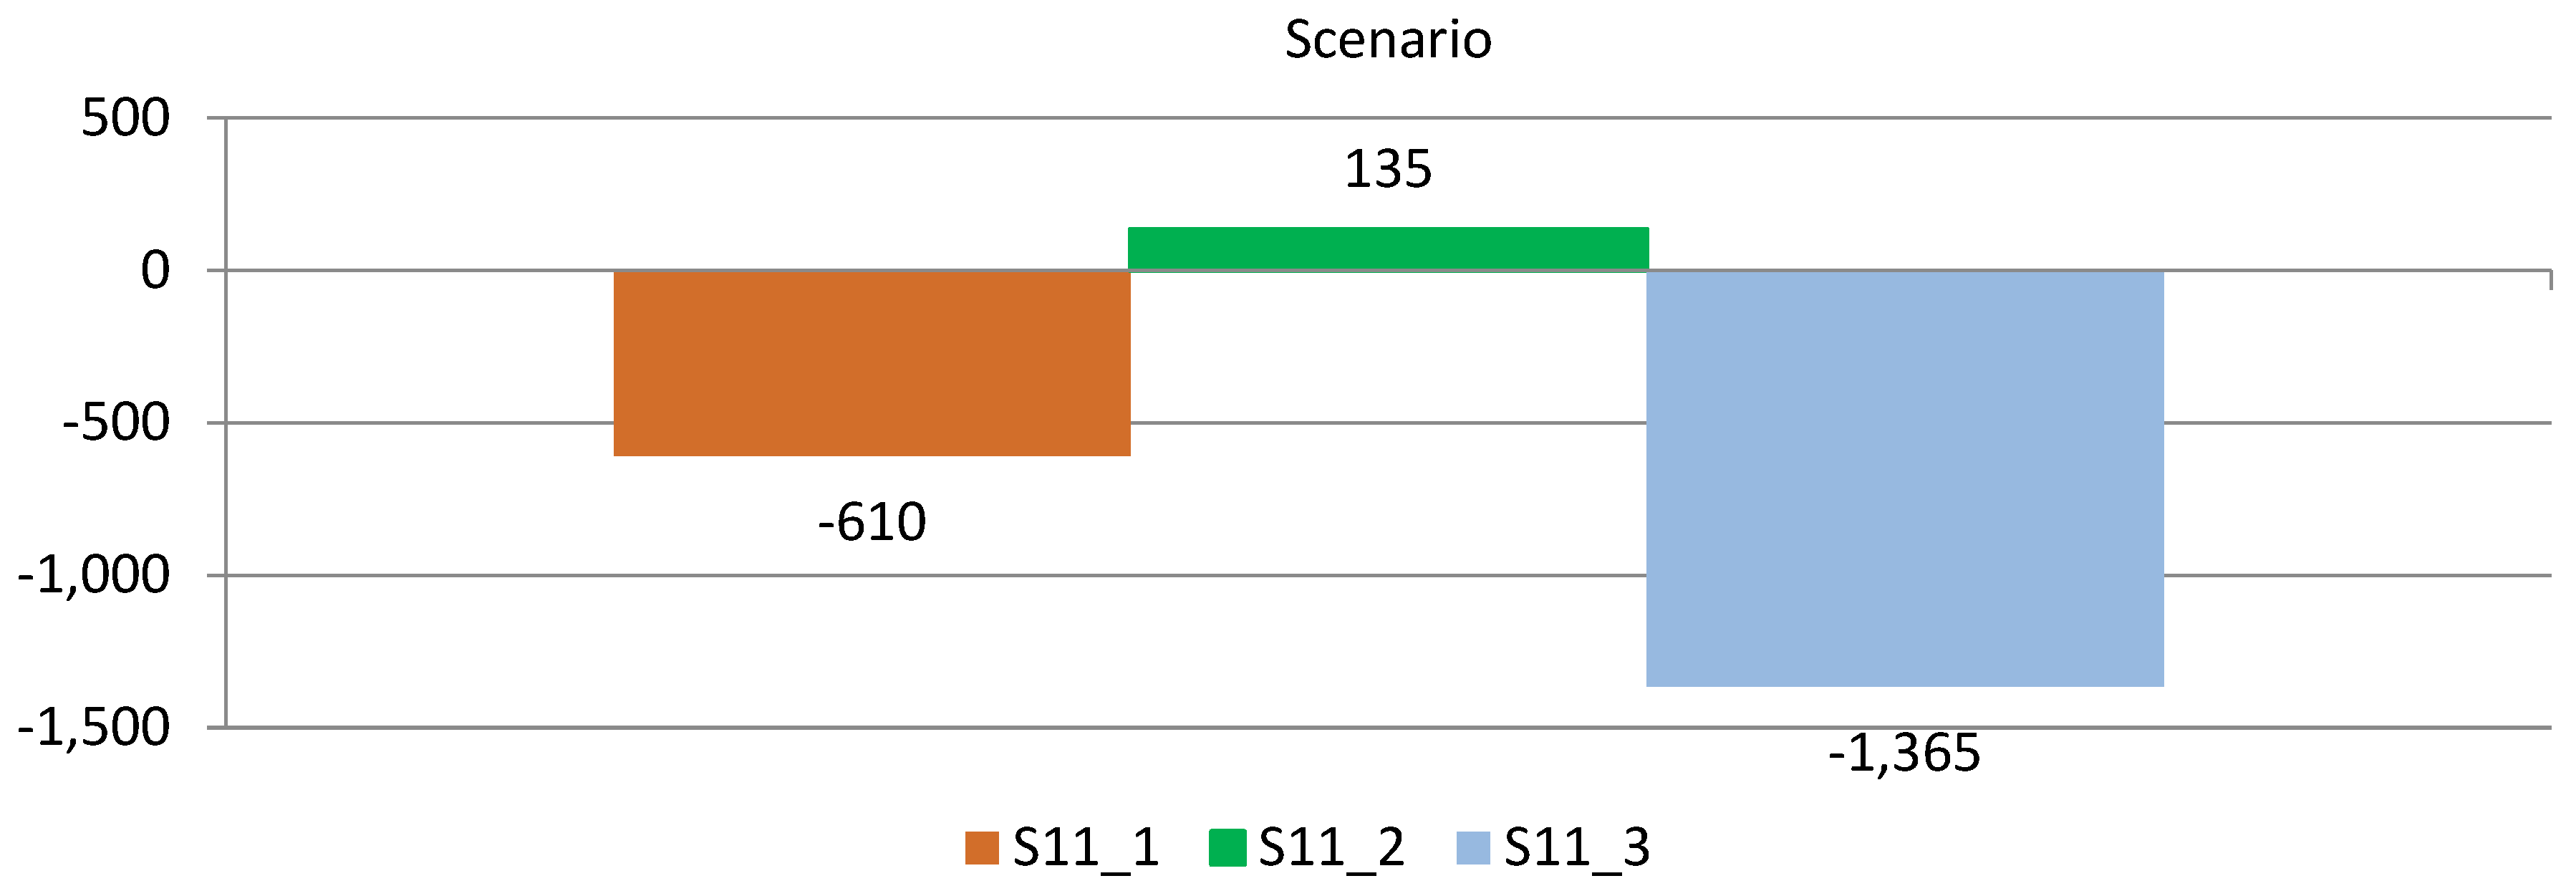
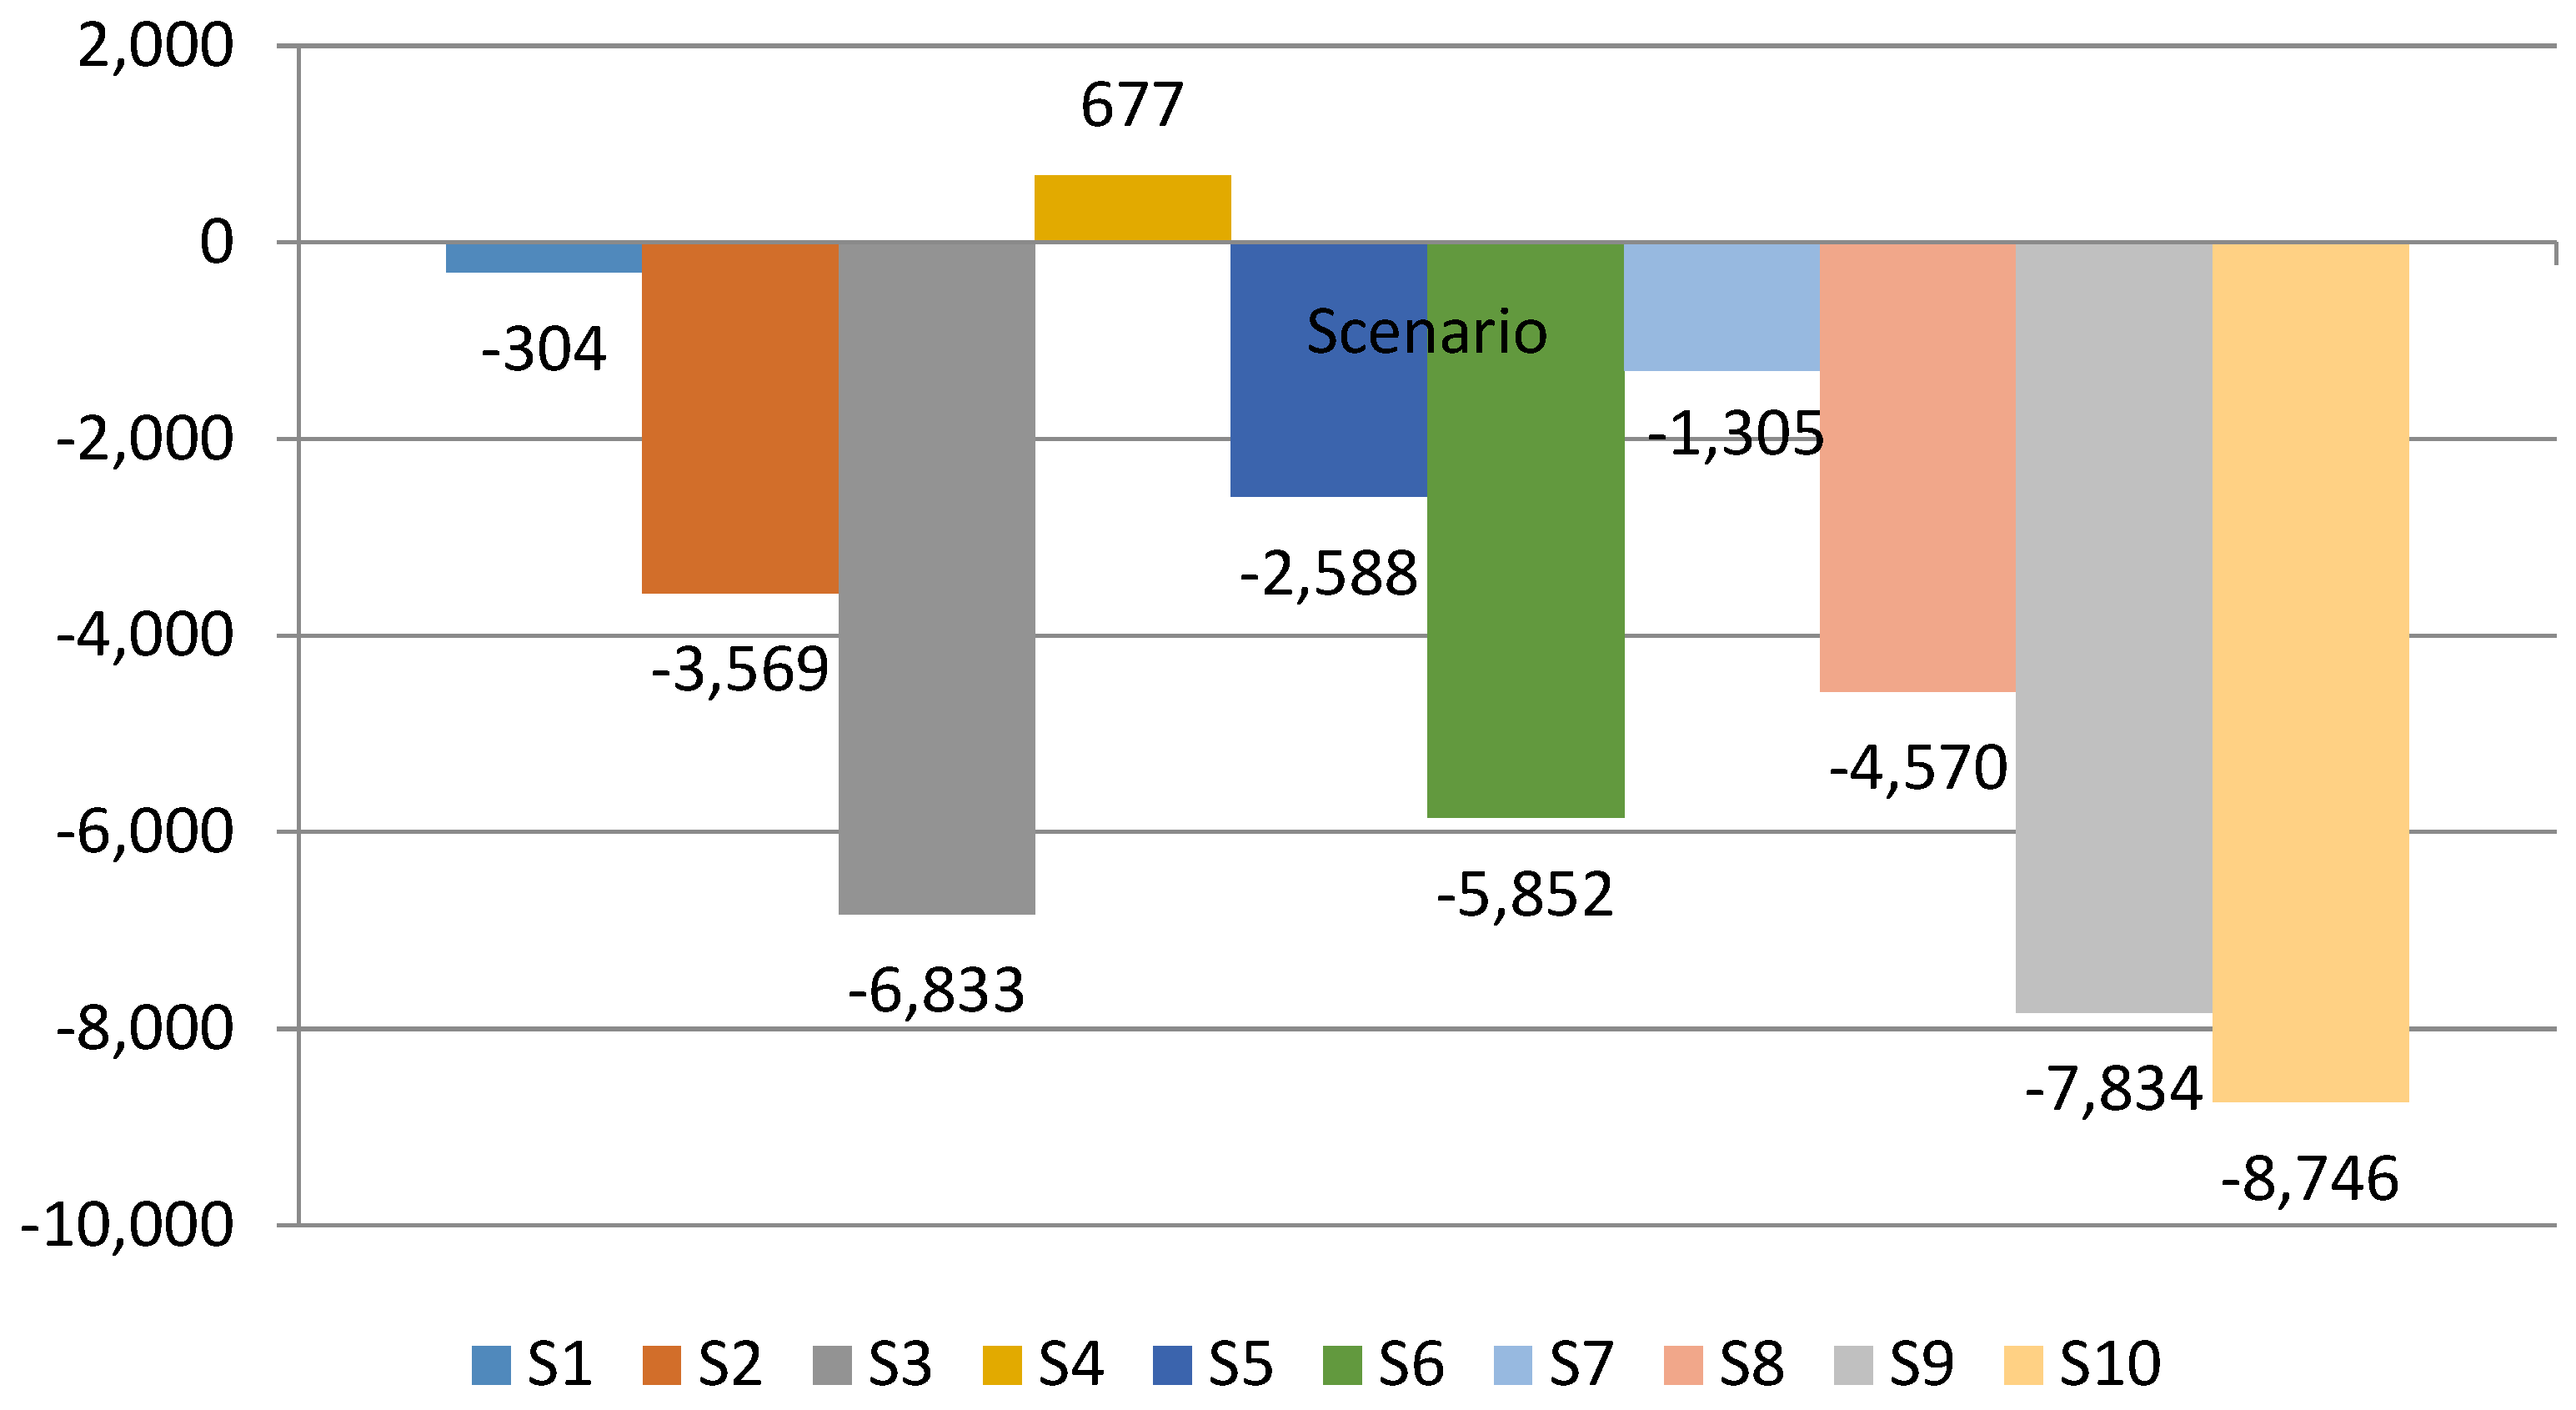
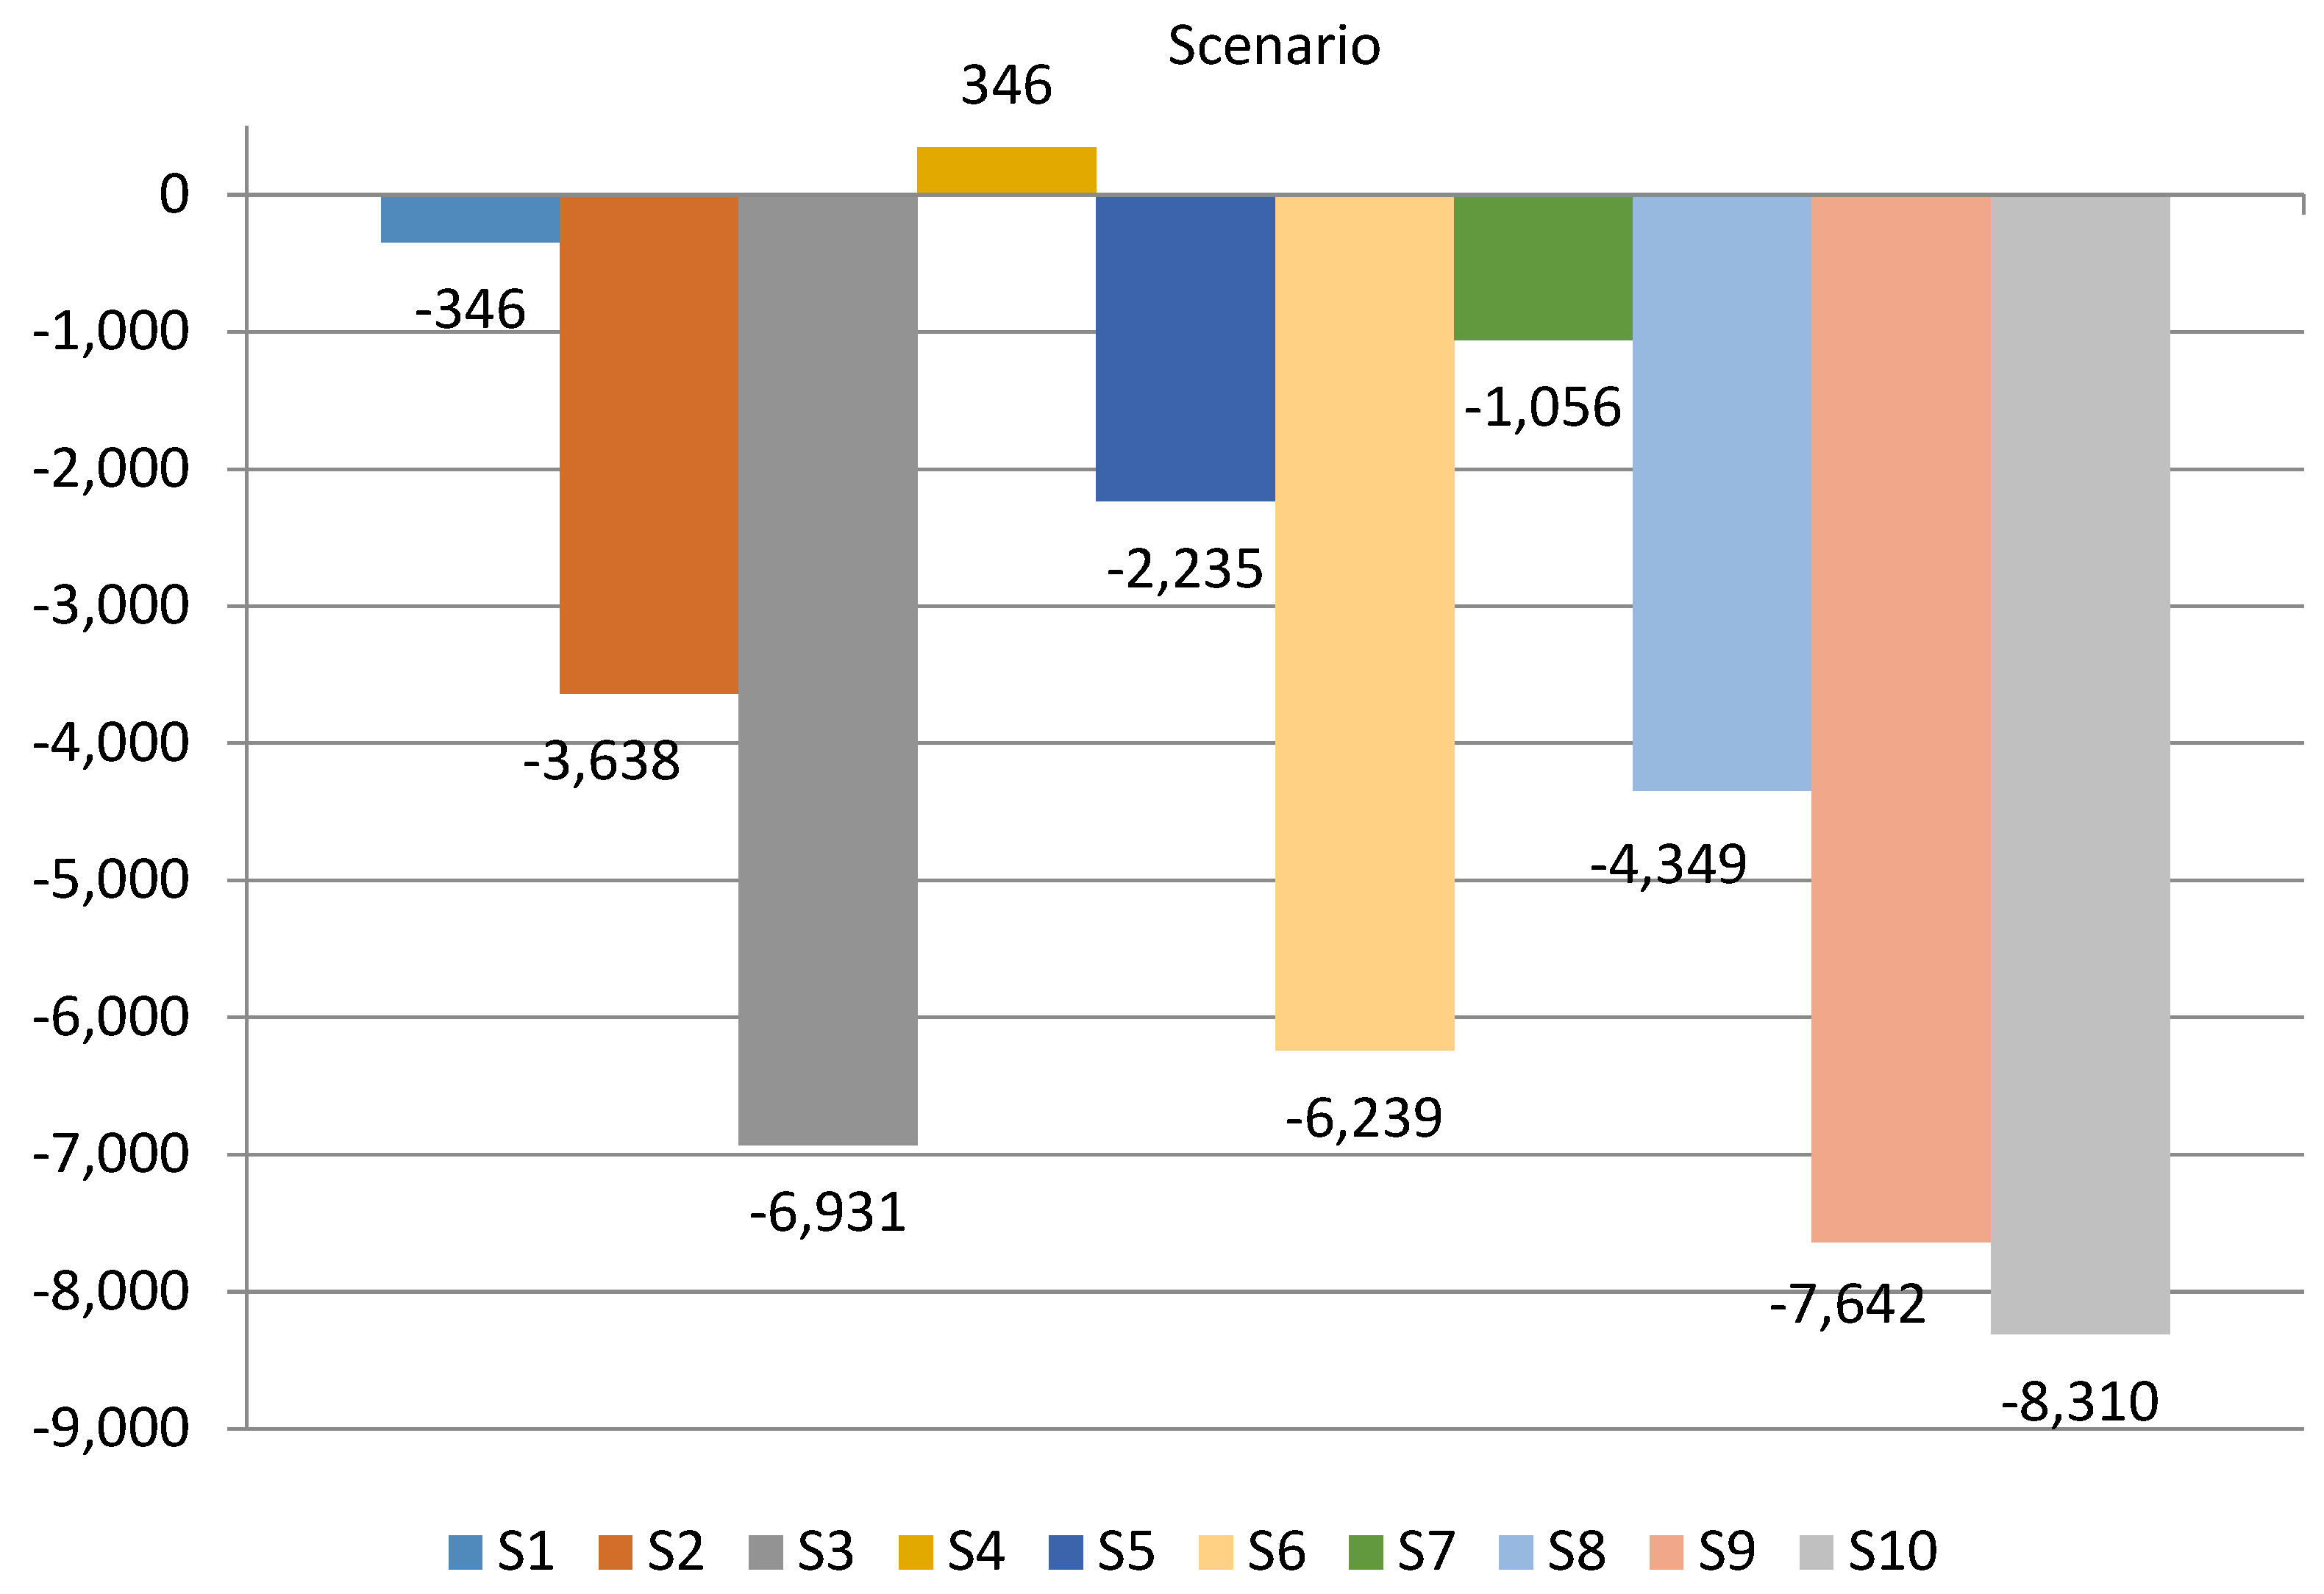
4.4. NPV Calculation Results for Particular Scenarios

On the basis of the presented assumptions, the results of financial simulations are presented in Figure 5. For each scenario, the NPV reached a negative value. The best result was for scenario 4 (with one battery and in years with rainy summers) and scenario 10 was the worst. It is more efficient to charge a battery with its own depreciated source (HPP) than the outsourced battery with leasing fees. Despite cofunding the investment and the modernization of assets by the EU grant, the investment was inefficient from the financial point of view of the assumed conditions and marketing strategy.

4.5. Break-Even Point

The BEP stipulates how many prosumers should be joined to the distribution grids to cover the total cost of the VPP by revenue. In terms of the BEP, typical scenarios were taken into consideration, i.e., S1, S2, and S3. Calculations were made for three options of energy prices. in 2019. They are the forecast price according to assumptions presented in Table 2, according to Formula (6):
B E P   =   A V P P + T C V P P + T C H P P ( T R H P P + T R E S S ) P F i ( 0.1 Q P V I P + 0.2 Q P V P ) ,
where QPVIP is the annual net energy production by IP micro-installations and QPVP is the annual net energy production by prosumer micro-installations.
The first price (PF1) equals 222 PLN/MWh, which was 14% lower than the average weighted price in the peak hours on POLPX. This price was used for the simulations to calculate the revenue of the generated energy in the PV micro-installations. The second price (PF2) totals 210 PLN/MWh, and the third price (PF3) was 152.2 PLN/MWh as the forecast price in the nonpeak hours on POLPX in 2019. Calculations were prepared for two suboptions. The first was that only prosumers (with average PV power totaling 5 kWp) participate in the VPP. The second was that only PV micro-installation owners (with average net PV power equal to 100 kWp) participate in the VPP. The results are presented in Table 3.
The IT platform can provide a service to 100,000 IPs. However, taking into account its technical limitations, it is only possible to connect about 1000 IPs. Therefore, scenario three is not feasible because it is impossible to connect more IPs without additional investment in the grids. In scenario two, with a maximal power of 1 MW, profits could be achieved if the number of prosumers exceeded 7150 or if the number of IPs exceeded 1092. Taking into consideration the assumptions that are presented in Table 2, the BEP for S2 was not achieved.

4.6. Sensitity Analysis

Sensitivity analysis was carried out in relation to changes of energy production in the HPP, energy production in PV micro-installations, and wholesale market price (POLPX, including the difference between price in peak and nonpeak hours). It was used to estimate the influence of variables (mentioned above) on the NPV. Estimation of the elasticity index (ENPV/x) was made on the basis of Formula (7), where x is the independent variable, and NPV is the dependent variable.
E N P V / x   =   Δ N P V ( x ) N P V B ( x ) Δ x x B
The rate of change of each independent variable was 10%. Elasticity of was separately calculated for each scenario, namely, S1, S2, and S3. Additionally, the price-elasticity index was estimated for S10. The NPV output values are shown in Table 4. The NPV output value is the simulation effect when independent variables increase by 10%. Table 5 presents elasticity indices for each variable and the analyzed scenarios.
If the analyzed independent variables increase by 10% in relation to basic volume of this variable (xB), new calculated NPVs are higher (Table 4) than the base NPVs for S1, S2, S3, and S10, as presented in Figure 5.
In each scenario, the NPV was most sensitive to difference changes between price in peak and nonpeak hours, and least sensitive when the HPP energy production changed. Generally, the influence of price-variable changes on the NPV was stronger than production changes. Sensitivity decreased if the next battery was added to the VPP because battery ESS1 did not have an amortization cost and it was charged by energy coming from HPP (S1). The second storage battery (ESS2) was also charged by energy coming from HPP (average HPP cost is lower than that in S1), but the operational cost of ESS was higher because the energy company spent leasing fees for ESS2 usage. The costliest was usage of the third battery (ESS3) because the energy had to be bought on POLPX, so the average cost of HPP was not decreased, and the energy company spent leasing fees for the usage of ESS2 and ESS3.

5. Discussion

In this situation, there are four interesting questions that were the inspiration for the next estimations which include:
  • What happens if the forecast period is longer?
  • What happens if more IPs are joined to grids in the first year of the forecast, e.g., 1000 prosumers in each year?
  • What is the NPV if the number of micro-installation owners with a PV net power of 100 kWp is 1.000 in each year?
  • What is the NPV if the available ESS increased its maximum power capacity from 0.5 to 1 MW, it belonged to the energy company, and was cofunded?
The appropriate simulations are presented in Figure 6, Figure 7 and Figure 8. A longer period of forecasting gives better results (Figure 6), but there is the threat that the battery could have worse effectiveness because its lifecycle is five years. The NPV is positive if there is 0.5 MW of battery and it is a rainy summer (S4).
More aggressive marketing actions for potential prosumers (households) give a slightly better NPV value (Figure 7), but a longer forecast period follows a higher NPV because the VPP is depreciated over the course of five years, and the amortization cost in the sixth and seventh year totals to null.
A large number of micro-installations with a net power of 100 kWp were taken into consideration. In this situation, financial effectiveness was satisfied (Figure 8). Negative NPV values were only achieved if two batteries were leased. Thus, more active marketing addressing micro-installation owners is recommended.
The answer to the last, but not least important, question (Figure 9) creates three scenarios if battery capacity is 1 MWh, power is 1 MW, and it belongs to the energy company, cofunded by the EU grant. Scenario S11_1 is for typical weather conditions, S11_2 for a year with rainy summer, and S11_3 for a dry and sunny one. The NPV results were much better than those in analogous scenarios S2, S5, and S8, respectively.

6. Conclusions

The results of the presented economic efficiency analysis demonstrated that the VPP reaches a negative NPV value for a forecasting period that is equal to give years. However, keeping the number of prosumers at 1000, and number of micro-installation owners at 20, the VPP reaches a positive NPV value in the forecasting period that is only equal to seven years for scenario four (with 0.5 MW battery and rainy summers). This fact confirms the need to cofund this kind of investment by public grants if the VPP business model is not more sophisticated than it is in the presented paper. However, increasing the number of micro-installations with the net power equal to 100 kWp gives positive NPV results for the majority of scenarios.
The VPP reaches the break-even point if 1895 prosumers with rooftop solar PV of 5 kWp or 220 micro-installation owners of 100 kWp PV join the VPP. If the ESS belonging to the VPP increases the maximum power capacity to 1 MW, reaching the BEP requires 6441 prosumers or 747 micro-installation owners. Of course, if the VPP is not cofunded, the number of micro-installations should be greater, and technical conditions have to again be analyzed. It could be needed to invest in grids. Promotion actions could be more active among households and businesspeople who are potential micro-installation owners. The changed VPP business model, e.g., offering more products or services to IPs, should improve the financial effect.
Scenario one is characterized by major sensitivity that decreased with growing ESS capacity (S2 and S3). The HPP production variable is characterized by minor sensitivity, and the price variable had significant impact on the NPV (for S1, elasticity is equal to 4.4). This means that a 10% change in the price variable for S1 caused a 44% change in the NPV. Price elasticity for S10 was the lowest and was equal to 2.5% if prices increased by 10%. In the case of the difference between prices in peak and nonpeak hours, sensitivity decreased with the increase of battery capacity, and the lowest was for S10 with two leasing batteries (ESS3). The sensitivity value for S10 was ten times lower than that for S1 with a lower ESS capacity.
Future research should focus on two aspects. First, analysis of more sophisticated VPP business models, e.g., including more service offers for potential prosumers and additional benefits coming from motivating programs of energy consumption during the day. In this situation, it is recommended to install storage batteries by prosumers, for example, electric cars. Secondly, analysis investigating the economic and ecological effects of VPP by using the BCA.

Author Contributions

Conceptualization, T.S., E.R.-S., and M.W.; methodology of technical aspects, T.S., M.S., and W.R.; methodology of economic aspects, E.R.-S. and M.W.; software for technical simulation, M.S., W.R., and J.S.; software for economic calculation, E.R.-S.; formal analysis of technical aspects, T.S., M.J., R.L., J.R., D.K., and P.K.; formal analysis of economic aspects, E.R.-S., M.W.; investigation of technical aspects, T.S., W.R., M.S., and M.J.; investigation in the range of economic aspects, E.R.-S. and M.W.; resources of technical aspects, D.K., R.L., J.R., M.J., T.S., Z.L., and P.K.; resources of economic aspects, E.R.-S. and M.W.; technical-data curation, J.S., M.S., D.B., and P.J.; economic-data curation, E.R.-S. and M.W.; visualization of technical aspects, W.R., M.J., D.K., and P.K.; visualization of economic aspects, E.R.-S. and M.W.; writing—original draft preparation, T.S., M.J., D.K., J.R., R.L., E.R.-S., and M.W.; writing—review and editing, T.S, M.J., E.R.-S., and M.W.; supervision, T.S. and M.W.; project administration, T.S. and P.J.; funding acquisition, T.S. and P.J.

Funding

This research was funded by the National Center of Research and Development in Poland, project “Developing a platform for aggregating generation and regulatory potential of dispersed renewable energy sources, power retention devices and selected categories of controllable load” supported by the European Union Operational Program Smart Growth 2014–2020, Priority Axis I: Supporting R and D carried out by enterprises, Measure 1.2: Sectoral R and D Programs, POIR.01.02.00-00-0221/16, performed by TAURON Ekoenergia Ltd.

Acknowledgments

The study used annual weather conditions and power-production data of a PV power plant provided by the Center of Energy Technologies in Swidnica, Poland.

Conflicts of Interest

The authors declare no conflict of interest.

Abbreviations

The following abbreviations are used in the paper:
BEPbreak-even point
BMbusiness model
DER, DGdistributed energy resources, distributed generation
DSOdistributed
ESSenergy-storage system
HPPhydropower plant
IPindependent producer
ITinformation technologies
ICTinformation and communication technologies
NPVnet present value
POLPXPolish Power Exchange
PPEwholesale market
PVphotovoltaic
RESrenewable-energy sources
VPPvirtual power plant
VPEDVPP economic dispatch

References

  1. Davidow, W.H.; Malone, M. The Virtual Corporation: Structuring and Revitalizing the Corporation for the 21st Century; HarperCollins: New York, NY, USA, 1992. [Google Scholar]
  2. Introna, L.D.; Moore, H.; Cushman, M. The Virtual Organisation-Technical or Social Innovation: Lessons from the Film Industry; Department of Information Systems, London School of Economics and Political: London, UK, 1999. [Google Scholar]
  3. Camarinha-Matos, L.M.; Afsarmanesh, H.; Ollus, M. Virtual Organizations; Camarinha-Matos, L.M., Afsarmanesh, H., Ollus, M., Eds.; Kluwer Academic Publishers: Boston, MA, USA, 2005; ISBN 0-387-23755-0. [Google Scholar]
  4. Kuceba, R. Wirtualna Elektrownia. Wybrane Aspekty Organizacji i Zarzadzania Podmiotów Generacji Rozproszonej; Scientific Society for Organization and Management “Dom Organizatora”: Torun, Poland, 2011. [Google Scholar]
  5. Pudjianto, D.; Ramsay, C.; Strbac, G. Virtual Power Plant and System Integration of Distributed Energy Resources. IET Renew. Power Gener. 2007, 1, 10. [Google Scholar] [CrossRef]
  6. Chiang, C.L. Improved Genetic Algorithm for Power Economic Dispatch of Units With Valve-Point Effects and Multiple Fuels. IEEE Trans. Power Syst. 2005, 20, 1690–1699. [Google Scholar] [CrossRef]
  7. Selvakumar, A.I.; Thanushkodi, K. A New Particle Swarm Optimization Solution to Nonconvex Economic Dispatch Problems. IEEE Trans. Power Syst. 2007, 22, 42–51. [Google Scholar] [CrossRef]
  8. Bhattacharya, A.; Chattopadhyay, P.K. Hybrid Differential Evolution With Biogeography-Based Optimization for Solution of Economic Load Dispatch. IEEE Trans. Power Syst. 2010, 25, 1955–1964. [Google Scholar] [CrossRef]
  9. Jia, Y.; He, Z.Y.; Zang, T.L. S-Transform Based Power Quality Indices for Transient Disturbances. In Proceedings of the 2010 Asia-Pacific Power and Energy Engineering Conference, Chengdu, China, 28–31 March 2010; pp. 1–4. [Google Scholar]
  10. Yang, H.; Yi, D.; Zhao, J.; Dong, Z. Distributed Optimal Dispatch of Virtual Power Plant Via Limited Communication. IEEE Trans. Power Syst. 2013, 28, 3511–3512. [Google Scholar] [CrossRef]
  11. Xia, X.; Elaiw, A.M. Optimal Dynamic Economic Dispatch of Generation: A Review. Electr. Power Syst. Res. 2010, 80, 975–986. [Google Scholar] [CrossRef]
  12. Ciornei, I.; Kyriakides, E. Recent Methodologies and Approaches for the Economic Dispatch of Generation in Power Systems. Int. Trans. Electr. Energy Syst. 2013, 23, 1002–1027. [Google Scholar] [CrossRef]
  13. Loisner, M.; Bottger, D.; Bruckner, T. Economic Assessment of Virtual Power Plants in the German Energy Market—A Scenario-Based and Model-Supported Analysis. Energy Econ. 2017, 62, 125–138. [Google Scholar] [CrossRef]
  14. Candra, D.; Hartmann, K.; Nelles, M. Economic Optimal Implementation of Virtual Power Plants in the German Power Market. Energies 2018, 11, 2365. [Google Scholar] [CrossRef]
  15. Haramaini, Q.; Setiawan, A.; Damar, A.; Ali, C.H.; Adhi, E. Economic Analysis of PV Distributed Generation Investment Based on Optimum Capacity for Power Losses Reducing. Energy Procedia 2019, 156, 122–127. [Google Scholar] [CrossRef]
  16. Yang, C.H.; Yao, R.; Zhou, K. Forecasting of Electricity Price Subsidy Based on Installed Cost of Distributed Photovoltaic in China. Energy Procedia 2019, 158, 3393–3398. [Google Scholar] [CrossRef]
  17. Pranadi, A.D.; Haramaini, Q.; Setiawan, A.; Setiawan, E.A.; Ali, C.H. Sensitivity Analysis of Financial Parameters in Varying PV Penetrations in the Optimum Location of a Feeder. Energy Procedia 2019, 156, 95–99. [Google Scholar] [CrossRef]
  18. Su, W.F.; Huang, S.J.; Lin, C.E. Economic Analysis for Demand-side Hybrid Photovoltaic and Battery Energy Storage System. IEEE Trans. Ind. Appl. 2001, 37, 171–177. [Google Scholar]
  19. Longe, O.M.; Ouahada, K.; Rimer, S.; Harutyunyan, A.N.; Ferreira, H.C. Distributed Demand Side Management with Battery Storage for Smart Home Energy Scheduling. Sustainability 2017, 9, 120. [Google Scholar] [CrossRef]
  20. Zhu, X.; Zhan, X.; Liang, H.; Zheng, X.; Qiu, Y.; Lin, J.; Chen, J.; Meng, C.H.; Zhao, Y. The Optimal Design and Operation Strategy of Renewable Energy-CCHP Coupled System Applied in Five Building Objects. Renew. Energy 2020, 146, 2700–2715. [Google Scholar] [CrossRef]
  21. Campbell, R.M.; Anderson, N.M. Comprehensive Comparative Economic Evaluation of Woody Biomass Energy from Silvicultural Fuel Treatments. J. Environ. Manag. 2019, 250, 109422. [Google Scholar] [CrossRef]
  22. Hafiz, F.; Rodrigo De Queiroz, A.; Fajri, P.; Husain, I. Energy Management and Optimal Storage Sizing for a Shared Community: A Multi-Stage Stochastic Programming Approach. Appl. Energy 2019, 236, 42–54. [Google Scholar] [CrossRef]
  23. Astriani, Y.; Shafiullah, G.M.; Anda, M.; Hilal, H. Techno-Economic Evaluation of Utilizing a Small-Scale Microgrid. Energy Procedia 2019, 158, 3131–3137. [Google Scholar] [CrossRef]
  24. Chung, B.J.; Kim, C.S.; Son, S.Y. Analysis of the Virtual Power Plant Model Based on the Use of Emergency Generators in South Korea. J. Electr. Eng. Technol. 2016, 11, 38–46. [Google Scholar] [CrossRef]
  25. Thie, N.; Vasconcelos, M. Evaluating the Business Case for Flexibilities as Risk Management in Direct Marketing of Renewable Energies. In Proceedings of the 42nd IAEE International Conference Local Energy, Global Markets, Montreal, QC, Canada, 29 May–1 June 2019. [Google Scholar]
  26. Sommerfeldt, N.; Madani, H. Revisiting the Techno-Economic Analysis Process for Building-Mounted, Grid-Connected Solar Photovoltaic Systems: Part Two-Application. Renew. Sustain. Energy Rev. 2017, 74, 1394–1404. [Google Scholar] [CrossRef]
  27. Singh, P. Technical and Economic Potential of Microgrids in California. Master’s Theses and Projects, Humboldt State University, Arcata, CA, USA, 2017. Available online: https://digitalcommons.humboldt.edu/etd/33 (accessed on 6 November 2019).
  28. Act of February 20, 2015, on renewable energy sources, Journal of Laws of 2015, item 478. Available online: http://prawo.sejm.gov.pl/isap.nsf/download.xsp/WDU20150000478/U/D20150478Lj.pdf (accessed on 6 August 2019).
  29. Act of June 22, 2016 on renewable sources energy and some other acts, Journal of Laws of 2016, item 925. Available online: http://prawo.sejm.gov.pl/isap.nsf/download.xsp/WDU20160000925/T/D20160925L.pdf (accessed on 6 August 2019).
  30. Ropuszynska-Surma, E.; Weglarz, M. A Virtual Power Plant as a Cooperation Network. Mark. Manag. Innov. 2018, 4, 136–149. [Google Scholar] [CrossRef]
  31. Wirtz, B.W.; Pistoia, A.; Ullrich, S.; Gottel, V. Business Models: Origin, Development and Future Research Perspectives. Long Range Plann. 2016, 49, 36–54. [Google Scholar] [CrossRef]
  32. Shafer, S.M.; Smith, H.J.; Linder, J.C. The Power of Business Models. Bus. Horiz. 2005, 48, 199–207. [Google Scholar] [CrossRef]
  33. Fu, H.; Wu, Z.; Li, J.; Zhang, X.P.; Brandt, J. A Configurable u VPP With Managed Energy Services: A Malmo Western Harbour Case. IEEE Power Energy Technol. Syst. J. 2016, 3, 166–178. [Google Scholar]
  34. Hatziargyriou, N.D.; Tsikalakis, A.G.; Karfopoulos, E.; Tomtsi, T.K.; Karagiorgis, G.; Christodoulou, C.; Poullikkas, A. Evaluation of Virtual Power Plant (VPP) Operation Based on Actual Measurements. In Proceedings of the 7th Mediterranean Conference and Exhibition on Power Generation, Transmission, Distribution and Energy Conversion (MedPower 2010), Agia Napa, Cyprus, 7–10 November 2010; IET: London, UK, 2010; p. 136. [Google Scholar]
  35. Leisen, R.; Steffen, B.; Weber, C. Regulatory Risk and the Resilience of New Sustainable Business Models in the Energy Sector. J. Clean. Prod. 2019, 219, 865–878. [Google Scholar] [CrossRef]
  36. Ropuszynska-Surma, E.; Węglarz, M. The Virtual Power Plant–A Review Of Business Models. E3S Web Conf. 2019, 108, 01006. [Google Scholar] [CrossRef]
  37. Osterwalder, A.; Pigneur, Y. Business Model Generation: A Handbook for Visionaries, Game Changers, and Challengers, 1st ed.; Osterwalder, A., Ed.; John Wiley and Sons: Hoboken, NJ, USA, 2010. [Google Scholar]
  38. Gochnio, W.; Kulesa, M. Zmiany na Rynku Energii Elektrycznej Wywolane Nowelizacja Ustawy o OZE oraz Nowa Ustawa o Efektywnosci Energetycznej. In Rynek Energii Elektrycznej. Polityka i ekonomia; Połecki, Z., Pijarski, P., Eds.; Politechnika Lubelska: Lublin, Poland, 2017; pp. 18–31. [Google Scholar]
Figure 1. Topology of the planned virtual power plant (VPP).
Energies 12 04447 g001
Figure 2. VPP partners, and physical and financial streams between them.
Energies 12 04447 g002
Figure 3. Efficiency-estimation model.
Energies 12 04447 g003
Figure 4. Battery-charging decision.
Energies 12 04447 g004
Figure 5. Net present value (NPV) for each scenario if the forecasting period equals five years (tPLN).
Energies 12 04447 g005
Figure 6. NPV for each scenario if the forecasting period equals seven years (tPLN).
Energies 12 04447 g006
Figure 7. NPV for each scenario if the forecasting period equals five years and, in the first year, number of prosumers is 1000 and number of micro-installation owners is 20 in each year (tPLN).
Energies 12 04447 g007
Figure 8. NPV for each scenario if the forecasting period equals five years, there are 1000 micro-installation owners in each year (net power 100 kWp), and there are no prosumers (tPLN).
Energies 12 04447 g008
Figure 9. NPV if available maximum ESS power capacity is 1 MW, and ESS belongs to the energy company and is cofunded by EU grant.
Energies 12 04447 g009
Table 1. Scenarios according to weather and number of batteries in the energy-storage system (ESS).
Weather factorESS1ESS1 and ESS2ESS1, ESS2, and ESS3
Typical summerScenario 1 (S1)Scenario 2 (S2)Scenario 3 (S3)
Rainy summerScenario 4 (S4)Scenario 5 (S5)Scenario 6 (S6)
Dry and sunny summerScenario 7 (S7)Scenario 8 (S8)Scenario 9 (S9)
Extremely dry summer--Scenario 10 (S10)
Table 2. Assumptions in each scenario.
FactorProcess Value or Dynamicity
Simulation periodFive years
Number of battery chargesTwice per day
Battery life period Five years
Average price of electricity on PPE in 2018 in nonpeak hours143.6 PLN/MWh
Average price of electricity on PPE in 2018 in peak hours (workdays)264.5 PLN/MWh
Average price of electricity on PPE in 2018 in peak hours (free days)200 PLN/MWh
Progress of electricity price on PPEFirst year of simulation, 6%; second, third, and fourth years, 7%; fifth year, 4%.
Investment expenditure for information technology (IT) system funded by energy company’s capital2,000,000 PLN
Average rate of cofunded expenditure50%
Discount period of IT systemFive years
IT administrator salary23,000 PLN/Yr and 5% increase rate in each year
Fee for IT and information and communication technology (ICT) services109,200 PLN/year
Fee for database6000 PLN/year and 2% increase rate in each year.
Operational cost of HPP, taxes, and other fees541,820 PLN and 5% increase rate of taxes and other fees in each year
Average energy production in HPP when weather is typical (S1, S2, and S3)3053.7 MWh/year
Average energy production in HPP when summer is rainy (S4, S5, and S6)4153.3 MWh/year
Average energy production in HPP when summer is dry and sunny (S7, S8, and S9)1954 MWh/year
Average energy production in HPP when summer is sunny and extremely (S10)1280 MWh/year or less
Discount rate8%
Residual value of VPP assets 0 PLN
Maximum number of photovoltaic (PV) installations with net power of 100 kWp 20 (in the last year of simulation).
Average net production by PV installation with net power of 100 kWp in a year with typical summer65.5 MWh/year
Average net production by PV installation with net power of 100 kWp in a year with rainy summer57.0 MWh/year
Average net production by PV installation with net power of100 kWp in a year with sunny summer72.7 MWh/year
Maximum number of PV installations with power of 5 kWp belonging to prosumers.1000 (in the last year of simulation).
Progress rate of new prosumers per year = 200
Average net production by PV installation with power of 5 kWp in a year with typical summer3.8 MWh/Yr
Average net production by PV installation with power of 5 kWp in a year with rainy summer3.3 MWh/Yr
Average net production by PV installation with power of 5 kWp in a year with sunny summer4.2 MWh/Yr
Production percentage from PV micro-installations sold on free days (holidays, weekends)32%
Production percentage from PV micro-installations sold on workdays 68%
Table 3. Break-even point (BEP): Number of prosumers or IPs joined to the distribution grids that allow achieving nonprofit financial result (cost = revenue).
ScenarioS1S2S3
Options with prosumers
BEP (PF1)1895644110,988
BEP (PF2)2006681911,632
BEP (PF3)2103715012,197
Options with micro-installation owners (IPs)
BEP (PF1)2207471275
BEP (PF2)2337911350
BEP (PF3)32110921862
Table 4. NPV output value (tPLN).
Independent Variable (x)New NPV Value
S1S2S3S10
HPP production increases by 10% as compared to basic scenarios–700.47–3993.4–7285.81-
PV production increases by 10% as compared to basic scenarios–694.98–3987.66–7280.33-
Price increases by 10% as compared to basic scenarios–420.45–3698.97–6977.50–8543.47
Difference between prices in peak and nonpeak hours increases by 10% as compared to basic scenarios89.75–3028.59–6146.93–7748.97
Table 5. NPV elasticity indices.
Independent VariableNPV Elasticity Index
S1S2S3S10
HPP production –0.67–0.13–0.07-
PV production –0.75–0.14–0.08-
Price–4.40–0.85–0.49–0.25
Difference between the price in peak and nonpeak hours–11.19–2.51–1.62–1.15

