Abstract
The Kingdom of Saudi Arabia (KSA) has a large solar and wind energy resource. Through its Vision 2030 to exploit such resources, KSA is planning to install 9.5 GW of renewable energy power generation systems by 2030, through a mix of solar and wind energy. The government is planning to invest 109 billion US$ over the next 20 years for solar energy. The focus will be on solar photovoltaic (PV) and concentrated solar technologies at a national level. So far, the electricity demand in KSA is almost entirely dependent on fossil fuels for generating power. This paper addresses the potential to utilize the solar radiation resource at a different scale and reduce the power demand from the grid, bringing collateral benefits for householders and the government alike. The work presents the results from monitoring the electricity consumption of two typical domestic buildings (villas) in Jeddah, KSA. The electricity consumption observations were associated with indoor environmental conditions to study how and when cooling demand affects final demand. The study investigated options to serve the observed demand profile of the villas with simulated power generation from arrays of PV panels installed on two buildings’ roofs. Finally, a model of dynamic solar radiation simulation was developed to assess the hourly electricity generation, and a cost-benefit analysis was conducted for different capacity PV systems scenarios. The results indicate that locally used rooftop PV output could reduce the household electrical demand from the grid by around 80% at the housing level and in combination with building refurbishment solutions, could result in additional energy savings. The economic analysis discusses the implications of a proposed feed-in tariff with the associated payback periods and ROI, as well as proposals for PV system deployment at a large scale on the roof of buildings in KSA.
1. Introduction
Saudi Arabia is one of the world’s largest producers of oil, and it was the 10th global consumer of total primary energy in 2016 [1]. The high oil revenues of the last decades drove a fast growth in construction projects and facilities. The new form of the cities, modern lifestyle, and government electricity price subsidies led consequently to a 7% annual increase in fuel consumption between 2006 and 2016. Oil-based electricity generation capacity was increased through an estimated 900,000 barrels of equivalent oil per day (BOE/d) to support this demand [1]. The alarming changes in energy usage made the government revise its dependence on petroleum as a single source of energy. Subsequently, it started looking to diversify the resources by introducing natural gas, renewable energy, and nuclear power in the national mix. Amidst these changes, Saudi Arabia released its Vision 2030 transformation plan in 2016, which encompasses cultural governance and Saudi society economic aspects [2]. The Vision listed the transformations that will be taken by the government, which include diversifying the resources and making the country less dependent on oil. Saudi Arabia is estimating to increase the electricity generation capacity to 120 GW by 2032 [1]. To compensate for this rise in demand, Vision 2030 has set a goal for generating 9.5 GW from renewables [2].
Interest in research and development in solar energy has grown in Saudi Arabia since the mid-seventies. Pilot projects were installed at different locations, through cooperation programs with the USA and Germany, to investigate the diversification of electricity generation. These programs were evaluated in terms of feasibility and the lessons learnt through the operation and maintenance and the reasons for failures and successes. Among the lessons learnt, Alawaji recommends that funds should be directed to the applications of renewable energy, rather than on basic research. He found that PV systems are a cost-effective solution in Saudi Arabia, that would help smooth the peak electricity demand and provide lighting in remote areas [3].
The efforts were continued by establishing King Abdullah City for Atomic and Renewable Energy (KA-CARE), which commissioned monitoring stations at different locations in Saudi Arabia, to measure solar irradiation, temperature, humidity, and wind speed. The result was an atlas for renewable energy in Saudi Arabia. KA-CARE anticipates that demand for electric power will exceed 120 GW in 2032. The demand for fuels from fossil sources is estimated to increase by 8% per annum, from 3.4 million barrels of oil equivalent per day in 2010 to 8.3 million BOE in 2028 [4].
In 2018, Saudi Arabia generated 383.8 Terawatt-hours (TWh) of electricity, of which 150.6 TWh came from oil derivatives, 233.0 TWh came from natural gas, and 0.2 TWh from renewable resources. The growth rate per annum in power generation between 2007 and 2017 was 6.5%, as shown in Figure 1 [5]. The renewable energy generation accounted for only 0.05% of the total generation, which implies that generating electricity is almost entirely dependent on oil and gas. It is evident that the power sector is responsible for a big share of pollution and its impact on the environment.
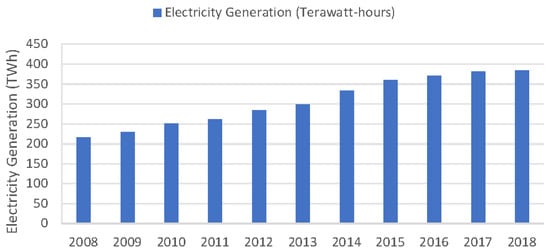
Figure 1.
The growth of annual electricity generation between 2007 and 2017 (TWh) [5].
Exploiting the natural solar resources that KSA has can improve energy security and sustainability. Saudi Arabia solar resource intensity is highly suitable for photovoltaic and concentrating solar technologies to perform well, where the average solar irradiation can reach to 2400 kWh/m2/year in the western area and closer to 2000 kWh/m2/year in the eastern region [6]. To achieve the installation of 9.5 GW in solar systems as set in its Vision 2030, the government is planning to invest 109 billion US$ over the next 20 years for solar energy. The focus will be on solar photovoltaic (PV) and concentrated solar systems.
Installing PV panels on the rooftop of domestic houses and the potential of generating electricity and its impact on energy consumption has not received enough attention. Few studies highlighted the potential of using rooftops for generating electricity from PV panels [7,8,9,10]. These studies focused on building structure, shading areas, and the expected output of electricity from PV, but they have hardly mentioned power demand and utilization. These types of buildings, as with almost all the buildings in KSA, are essentially appropriate for installing PV panels. Their flat rooftops, that equal the size of the whole building, are not substantially used, yet they provide convenient space for installation and maintenance of PV panels.
This paper provides knowledge to support this gap, addressing solar power applications in domestic houses in Saudi Arabia. It presents data on real electricity consumption, gathered for 31 months, from two identical villas in Jeddah. The environmental conditions (temperature, relative humidity, and carbon dioxide) and power demand were monitored and linked to power consumption patterns and occupancy behaviour. The potential energy yields from rooftop PV arrays were estimated and compared with the household demand. Electricity and environment measurements were used to create a half-hourly power demand profile for the villas, to be able to understand the energy consumption behaviour of the occupants. This profile was compared against the electricity generation potential of rooftop PV modules. The paper includes technical assessment, economic analysis for the annual savings in electricity bills, a discussion on the implication of the results on a proposed feed-in tariff, and the payback period, as well as generalised implications to the deployment of a PV system at scale in domestic buildings in KSA.
The paper is divided into six main sections. The context of micro-generation from rooftop PV deals with renewable energy in cities and specifically in domestic buildings. The methodology explains the adapted procedure and presents the location of the two villas and the building characteristics. The results section presents the measurement of temperature, relative humidity, CO2, and power demand in Villa 1. Moreover, it presents the solar radiation simulation, the energy consumption profiles, and the power production from solar PV systems. The economic assessment presents the impact of PV power generation on-demand and proposes feed-in tariff and return on investment. The summary and conclusion present the findings and recommendations for future work.
2. Context of Micro-Generation from Rooftop PV
Cities currently occupy around 2% of the earth’s land surface. They account for half the global population. Two-thirds of energy resources are consumed, and 70% of energy-related CO2 emissions are generated in cities [11]. Introducing renewable energies in cities could contribute to lowering CO2 emissions that are associated with global temperature rise and climate change. Cities are where wealth, growth, innovations, and leadership co-exist. They can provide the leadership to propel low carbon transitions at national, regional, and international levels [12].
2.1. Renewable Energy in Cities
One way of increasing the electric power generation share from solar resources is by utilizing the spaces inside the urban areas. Cities have a lot of unutilized spaces, such as buildings’ roofs and car-parks canopies, which can be covered with PV modules (crystalline or flexible). This approach was successful at a pilot study of a prototype carport with a PV system canopy at King Abdulaziz University campus in Jeddah [13]. Also, existing adjacent car park canopies similar in size to the carport were covered using flexible solar panels. The collected data showed potential for generating clean electricity by utilizing the spaces around and above buildings [13]. The approach can easily be extended to domestic buildings since the architectural style in Saudi Arabia allows the open roof utilization. Building-integrated and rooftop PV systems can be connected either to the grid or to specific loads, such as cooling, heating, and lighting. Khan et al. estimated that most of the roofs in Saudi Arabia could be utilized for PV panels installation if they are well oriented, otherwise, up to 75% of the roof area for each house is a potential area for deploying solar systems. They estimated that 51 TWh/year of electricity could be generated from cities, which represents about third of the demand in the domestic sector [14]. Dehwah et al. investigated the potential for rooftop application of PV in the domestic sector in a district in Al-Khober city, east of Saudi Arabia, covering 33,000 residential units. They found that 21% of apartment rooftops and 28% of villa rooftops in the targeted district, accounting for 14.21 km2, could be utilized for generating 796 GWh of electricity, and the findings could be extended to the Gulf countries due to similarity in house design [7].
2.2. Renewable Energy in Domestic Buildings
Alaidroos and Krarti conducted a study on the energy performance of residential buildings in five areas in Saudi Arabia, which have different climates. Different parameters were taken into consideration to improve the energy performance: the insulation for walls, roofs and windows, and thermal mass. They found that the saving in energy is related to the improvement in the performance of the above elements [15]. They extended the energy model simulation for the proposed villa in Jeddah, Riyadh, Dhahran, Tabuk, and Abha, as shown in Figure 2. They found that space cooling accounts for a high percentage of the total annual electrical energy consumption in the residential sector for a typical villa, which is 71% in Jeddah, 66% in Riyadh, 53% in Tabuk, 40% in Abha, and 67% in Dhahran. The highest space cooling demand was in Jeddah, a location with no heating load during the winter [15]. This is because Jeddah is a coastal area, where the weather is hot and humid during the summer and mild during the winter. The climate in Jeddah is classified as BWH (Hot Arid Climate), according to the Köppen-Geiger climate classification [16], where the average temperature is 28.0 °C per year, the annual precipitation fall is about 52 mm, and the annual average relative humidity (RH) is 63%; see Figure 3 [17]. The lowest cooling and heating demand space was in Abha, which is located at an elevation of more than 2000 m above sea level. Abha is cold and rainy during the winter and mild during the summer, which needs more heating than cooling [15]. Abha is classified as BSK (Cold Semi-arid Climate), according to the Köppen-Geiger climate classification, with an average temperature of 17.5 °C per year, an average yearly rainfall of 278 mm, and 54% annual average relative humidity, as shown in Figure 3 [18].
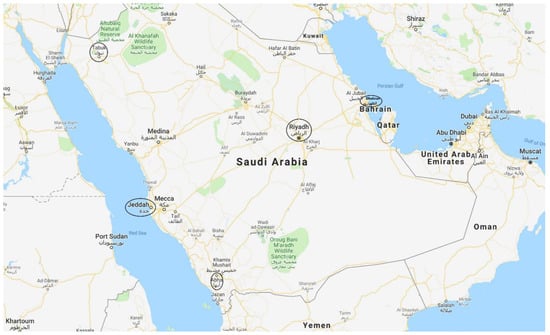
Figure 2.
A map of Saudi Arabia showing the locations of the 5 cities.
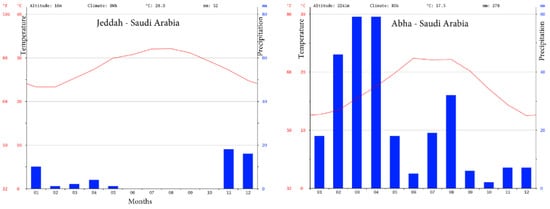
Figure 3.
Jeddah (left, climate classification BWH) and Abha (right, climate classification BSK) average monthly climate graph [17,18].
3. Methodology
In order to get more realistic results and to study the real circumstances of energy consumption in domestic houses, field investigations are encouraged. In this study, energy consumption in two villas (Villa 1 and Villa 2), identical in terms of size, facilities (including power, AC sizes), and number of occupants, are compared. Temperature and relative humidity sensors were fitted to Villa 1 to measure variations on hourly bases. Power monitoring kits were connected to the main distribution panels of each floor in Villa 1 to measure hourly power demand. The loads in both villas were exactly the same; Table A1, Table A2, Table A3 and Table A4 in Appendix A, show the power rating in volt ampere (VA) for lighting and equipment used for the ground, first, and second floors, and the auxiliary, respectively. Moreover, solar PV panel installation is proposed to study the reduction in energy consumption cost because it is a conventional application and is the most available and the cheapest solution. Using PV panels were addressed in much of the literature around the world. In a previous study [13], we thoroughly investigated the feasibility of generating electricity from PV panels, as the western side of Saudi Arabia is sunny all year round and, thus, has high solar irradiation. In a planned future international collaboration study, different methods will be investigated, including solar thermal and different ways of interventions.
Economic analysis is used to estimate feed-in tariff (FiT), with the associated payback periods and return on investment (ROI).
In order to determine the need for air conditioning (AC), which typically accounts for up to 71% of the total consumption of electrical energy for a villa in Jeddah according to Alaidroos and Krarti [15], carbon dioxide, electricity consumption, air temperature, and relative humidity sensors were installed at different spaces in each level for Villa 1 under this study. The sensors were provided and technically supported by the Energy and Climate Change Division at the University of Southampton, UK. The CO2, air temperature and relative humidity inside the villa were measured using different sensors. Power consumption was monitored using current transformer coils fitted in the distribution panel (consumer unit) of each floor. The sensors are controlled through a Raspberry Pi processor and collected data are sent to a remote server. The monitoring of consumption is ongoing and will be later augmented with surveys and nudges for occupants behaviour change. The results from such monitoring were collected between February and July 2019 and are presented and discussed in Section 4.
The following sub-sections provide a description of the two participating villas, their location, and building characteristics.
3.1. Location
The villas (Villa 1 and Villa 2) are in the western region of Saudi Arabia, in the city of Jeddah (Figure 2), which has different styles of buildings, in the form of apartments, villas, towers, residential compounds, shopping centres, and industrial metal hangers. Each district in the city has its own building style, which is limited by the type and height of buildings. In this study, two villas in Alrrihab District were selected. This district is devoted to villas of a maximum of 3 levels. Figure 4 shows the location of Villa 1 and 2 in Jeddah on Google Maps.
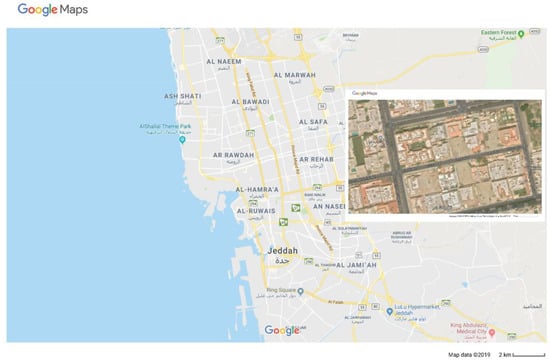
Figure 4.
Villa 1 and 2 location in Jeddah on Google Maps.
3.2. Building Characteristics
Villa 1 and Villa 2 are of the same size and number of occupants. Each villa is composed of 3 floors (ground, first, and second) and auxiliaries (swimming pool, WC and shower room, and janitor’s room). There are pieces of equipment operating on a timer powered by the auxiliary meter, which are mainly the swimming pool pumps (1.5 and 2.2 kW pumps operating on timers), in addition to the AC for the janitor room. The ground floor (GND), first floor (1st), and the second floor (2nd) occupy an area of 284.6 m2, 300 m2, and 227 m2, respectively. Figure 5 shows the layout of the ground floor for Villa 1 and Villa 2, and the first and second floor for Villa 1, as well as the location of temperature, CO2, and power demand sensors in each floor.
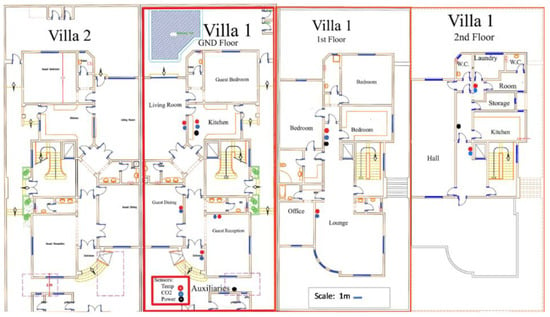
Figure 5.
Layout showing sensor location for the ground floor, 1st floor, and 2nd floor for Villa 1.
The sensors were provided and technically supported by the Energy and Climate Change Division at the University of Southampton, UK. The CO2, air temperature, and relative humidity inside the villa were measured using a single board computer with custom software. Power consumption was monitored using current transformer coils (clip-on CT) fitted in the distribution panel (consumer unit) of each floor. The monitoring of consumption is ongoing and will later be supplemented with surveys and nudges for occupants behaviour change. The monitoring period was from February to July 2019 (~6 months). Initial results are presented in Section 4. The specifications of the sensors used in this study are shown in Table 1.

Table 1.
The specifications of the sensors used in this study.
Each villa was occupied by six inhabitants, which leaves many spaces in the building unutilized. The characteristic of the villas is summarised in Table 2. The PV solar panels are proposed to be installed on the roof of the 2nd floor, which occupies an area of 227 m2, as shown in Figure 6.

Table 2.
The characteristics of the two identical villas, used in the case study.
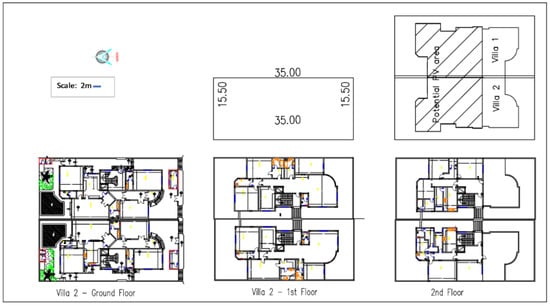
Figure 6.
Layout for Villla 1 and Villa 2, showing the floors and the potential roof area for PV panels. This paper presents data on electricity consumption from the two identical buildings, Villa 1 and Villa 2, in Jeddah; and the potential energy yields from rooftop PV arrays. The electricity observations were linked with ambient and indoor environmental conditions and specifically air temperature. The potential energy yields from rooftop PV arrays were estimated and compared with the household demand. Indoor air temperature and relative humidity levels (RH) were monitored over the period between February and July 2019 in Villa 1, on different floors and spaces. In addition, the daily maximum power demand was compared for different ambient temperature observations. The electricity and environment measurements were used to create the half-hourly power demand profile for the villas to be able to understand the energy consumption behaviour of the occupants. This profile was compared against the electricity generation potential of rooftop PV modules.
An economic analysis for the annual cost savings was also carried out, that related PV power generation to electricity bills. This was augmented by discussing the results’ implication on the suggested FiT and the payback period, in addition to the implications on deploying PV panels at a large scale on the roof of buildings in Saudi Arabia.
4. Results, Analysis, and Discussion
4.1. Measurements
The CO2 level, air temperature, relative humidity and power demand inside Villa 1 were measured using the sensors explained in the methodology section. The findings are explained in the following subsections.
4.1.1. Temperature and Relative Humidity
Sensors were distributed on different floors and sections. The total number of temperature sensors are eight. Two sensors were allocated for each floor, except the ground floor, which has four sensors. The collected results are summarised in Figure 7 and Figure 8. Boxplots show the 15-min average temperature for different groups of relative humidity (RH). Most of the time, the temperatures in the kitchen and the living room are above 26 °C. Some values in the kitchen indicate temperature around 28 °C with RH above 70% (yellow boxplot). This could be the result of boiling and cooking activities and inadequate ventilation. It is believed that these conditions are uncomfortable and there might be risks of condensation and building degradation. Nevertheless, ventilation alone is not enough in this environment, where the ambient temperature and humidity are high, and using the air conditioning (AC) more frequently as a solution to this problem will eventually increase the power consumption. This will add more burden on the consumer financially and on the network economically, and the impact will be reflected on the environment and the household’s CO2 emissions since the current carbon intensity of the grid is quite high at around 720 g CO2/kWh [19].
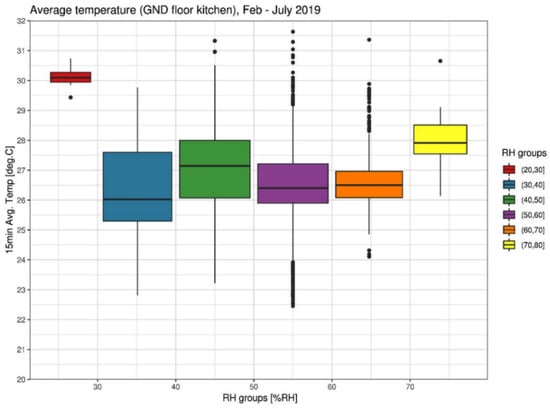
Figure 7.
Temperature and RH boxplots for ground floor kitchen from February to July 2019.
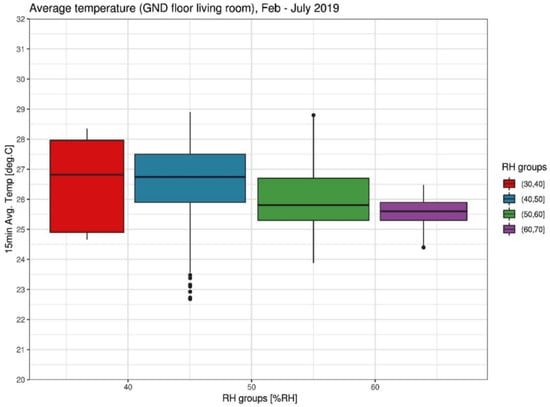
Figure 8.
Temperature and RH boxplots for ground floor living room from February to July 2019.
Figure 9 demonstrates the comparison of the fluctuations of temperature in the kitchen and living room of the ground floor, which are air-conditioned, and shows the temperature variation during the day with the minimum ambient temperature on 4 March 2019 (late winter) in the measurement period from February to July 2019. The figure shows little variation and low sensitivity to ambient temperature changes. The internal temperature decreases early in the morning when the ambient temperature is low, perhaps due to opening the windows. In particular, on the morning of 5 March 2019, the temperature in both the kitchen and the living room follow the changes in ambient temperature. Whereas at noon, when the temperature was almost 27 °C, the temperature in the kitchen was about 25 °C. It is highly likely that the windows were closed, and the AC was turned on. Considering Saudi lifestyle, lunch is the main meal in Jeddah. It is prepared around noon and served between 2:30 and 4:00 p.m., usually in the dining table at the living room. The AC temperature set point was adjusted to 24 °C both in the kitchen and the living room.
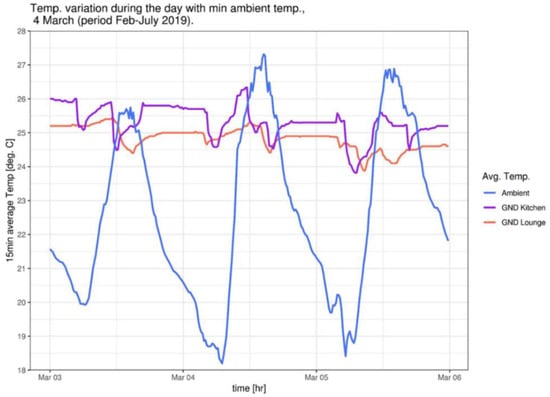
Figure 9.
Temperature variation during the day with the min. ambient temperature (4 March) in the measurement period from February to July 2019.
Figure 10 shows the temperature variation during the day in summer, with the maximum ambient temperature in the measurement period from February to July 2019 on 21 June 2019. The steep temperature decreases in the living room during the evenings (orange line) suggests that the AC operation lowers the temperature set point to around 23 °C lower than usual.
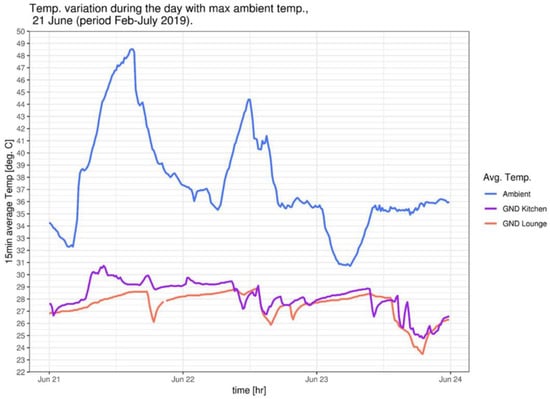
Figure 10.
Temperature variation during the day with the maximum ambient temperature on 21 June 2019 in the measurement period from February to July 2019.
The temperature profile on 21 June (Friday, weekend in KSA), suggests that both the kitchen and the living room were not occupied until the evening. On school holidays, the family’s lifestyle tends to be flexible. For example, there is no need to prepare the main meal at 14:30 when most family members come from school and work, as is the case on 4 March 2019. Instead, the children get up late and spend most of the day in the lounge of the first floor. They usually have precooked/ordered food or sandwiches for a late breakfast or an early lunch. In the summer holiday, dinner becomes the main meal and is sometimes accompanied by a gathering of relatives, as might be the case on 23 July. The rate and trend of temperature increase in the kitchen during the morning of 21 June (21 and 22 June 2019 had the highest recorded temperature) indicates the effect of the Eastern orientation and the heating gains due to solar radiation and also the behaviour of the occupants, where the kitchen is lightly or not used, as discussed above. In the afternoon of 23 June, the ambient temperature went down to the normal actual average value (highest: 36°/lowest: 24°) as checked from the monthly weather forecast, as shown in Figure 11. Interestingly, the living room temperature profile suggests that the air conditioner was operated manually for a certain time, while the thermostat was adjusted to around 23 °C. From Figure 10 and Figure 11, it seems that the temperature inside the villa is not highly affected by the ambient temperature. This is because the outer walls and roof of the villa are thermally insulated, and the windows are double glazed. The slight variation in temperature that seems to correspond to the ambient temperature may be due to the aluminium frames of the windows, where heat transfer may occur.
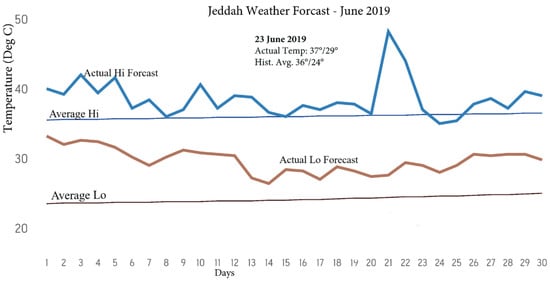
Figure 11.
Jeddah, monthly weather for 23 June 2019 (Source: AccuWeather).
4.1.2. CO2 Measurement
The carbon dioxide (CO2) level was measured in the kitchen in the ground floor. Figure 12 shows the level of CO2 in parts per million (ppm) for four months. The blue line shows the daily mean CO2 levels measured in the kitchen, which ranges between 400 and 500 ppm. The black ribbon shows the daily range (min to max), which reaches as high as 900 ppm, depending on the activities in the kitchen. A period in early April can be identified when the house was not occupied. The accuracy of the sensor is low (±50 ppm +3% of reading) but in general, the CO2 levels in the kitchen seem to be within the expected range. These levels are reduced when the kitchen ventilation hood is operating and the window shutter is slightly released beside the air conditioning, which means, more electric energy is consumed.
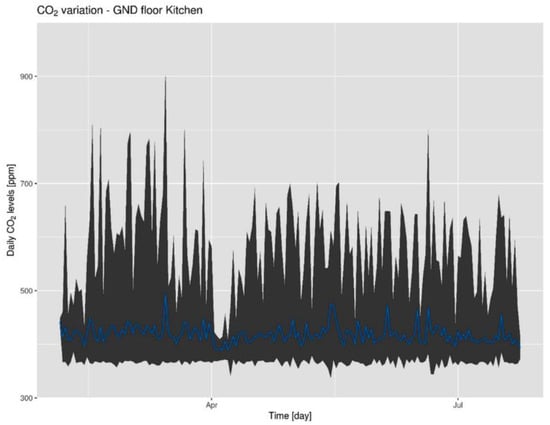
Figure 12.
CO2 variation on ground GND floor kitchen—period February to July 2019.
4.1.3. Power Demand (Consumption)
The daily maximum power demand, on the ground floor, in relation to daily mean ambient temperature in the measurement period from February to July 2019, is shown in Figure 13. In general, the daily maximum load follows the ambient temperature profile, increasing as the temperature gets higher, due to the air conditioning. Interestingly, the large peaks do not seem to be related to external temperature, suggesting days with different than typical occupancy and activities. The peaks are probably associated with the use of kitchen appliances, and that should be confirmed by the hourly power consumption profiles.
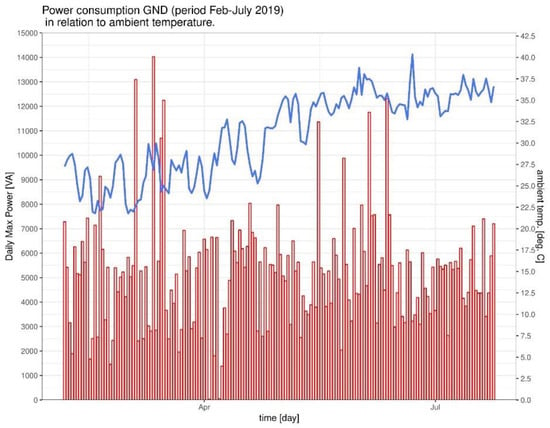
Figure 13.
The daily maximum power demand, in the ground floor, in relation to daily mean ambient temperature (blue line) in the measurement period from February to July 2019.
The 15-min average maximum power demand in the ground floor, in relation to the 15-min mean ambient temperature for the day with the minimum temperature (lower ambient temperature) in the measurement period (3 March 2019), from February to July 2019 is shown in Figure 14. The sub-hourly maximum electricity demand analysis confirms the initial hypothesis that the peaks are associated with cooking and/or other activities. The profile follows the occupancy and not the ambient temperature. This was also the case with the space temperature as the living room is fully conditioned. This confirms the importance of thermal insulation and double glazing in houses in reducing power consumption, as discussed above.
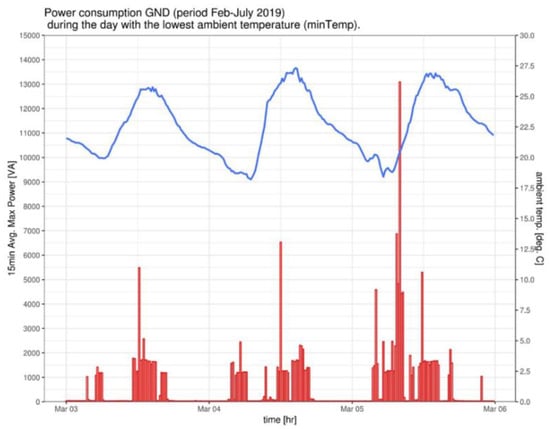
Figure 14.
The 15-min average maximum power demand in GND, in relation to the 15-min mean ambient temperature (blue line) for the day with the minimum temperature in the measurement period.
Figure 15 shows the 15-min average maximum power demand in summer (high ambient temperature) in the ground floor (GND) in relation to the 15-min mean ambient temperature for the day with the max temperature in the measurement period from February to July 2019. The power demand is indicative of the occupants’ consumption profile. There is no evidence of an AC time schedule, and the consumption profile suggests that this is manually operated at the ground floor. The different consumption pattern on June 22 can be explained by the fact that it is a weekend day (Saturday).
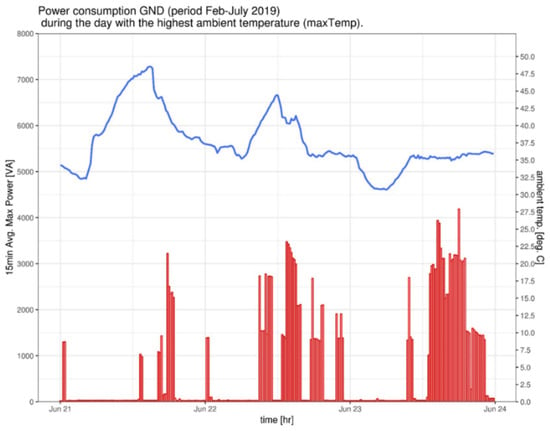
Figure 15.
The 15-min average max power demand (GND) in relation to 15-min mean ambient temperature (blue line) for the day with the max temperature in the measurement period.
Figure 16 shows the 15-min average max power demand from the ground floor, first floor, and the auxiliary meter (which meters the AC, the swimming pool pumps, the yards lighting, and the janitor room lights consumption), for a week in July 2019. The first floor has a continuous consumption profile (grey line) that indicates the constant use of the space and possibly the AC. There is equipment in the ground floor operating on a timer powered by the auxiliary circuit (blue line) with a separate meter. These are timer-controlled 1.5 and 2.2 kW swimming pool pumps, besides the AC for the janitor room, which is outside the ground floor.
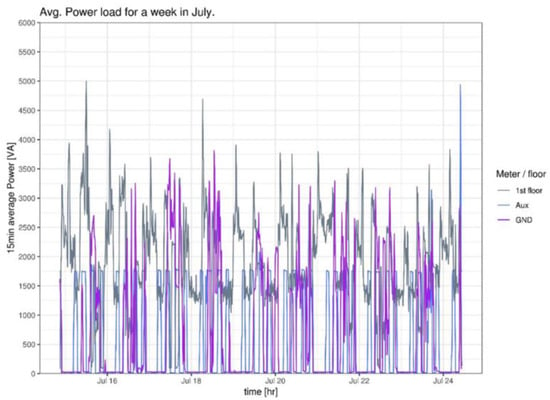
Figure 16.
The 15-min average maximum power demand for the ground floor, first floor, and the auxiliary meter for a week in July 2019.
Figure 17 shows that both villas have similar electricity consumption when cooling is not considered. However, Villa 2 (blue line) has a higher AC electricity consumption (58% of villa’s total load) than Villa 1 (48% of villa’s load). The base cooling degree-days (CCD) was considered 23 °C.
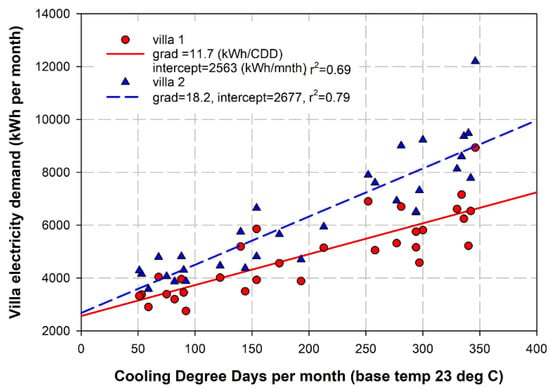
Figure 17.
Monthly AC electricity demand in relation to the number of cooling degree days. The intercept (CDD = 0) shows the base, non-cooling electricity demand.
4.2. Shading Simulation
A shading simulation was run for a year to identify the potential for the use of the villa’s rooftops for PV electricity generation. A GIS-based solar simulation model is used to estimate the long-term impact of shading on solar systems. Therefore, two constant coefficients have been chosen to represent the average condition of the sky and the PV system efficiency over the entire study period, which, in this study, is defined as one year.
An example of the shading analysis results for the two villas in summer and winter, as modelled on the SketchUp and simulated on Autodesk Ecotect software, is shown in Figure 18. The top roof is unshaded for the most time of the year, except from the shadow cast from the boundary walls (balustrade) which are 80 cm high, the lift shaft enclosure and some AC compressor units, none of which exceeds 1 m in height. Therefore, the PV canopy should be raised above 100 cm height at least, to avoid overshadowing, and, at the same time, it should not exceed the 180 cm height, to avoid the impact of wind forces. The suggested clearance height is 180 cm, to allow the PV panels to cover the AC compressor units on the roof, near the balustrade, and give enough room for under-panel and compressors maintenance. It will also permit the air to circulate and provide natural convective cooling for the equipment. The adjacent buildings have almost the same height, which is regulated by the city municipality of Jeddah, so there are no adjacent high buildings or trees that could project shades on the roofs of the two villas. Figure 18 shows the roof area and the surrounding areas.
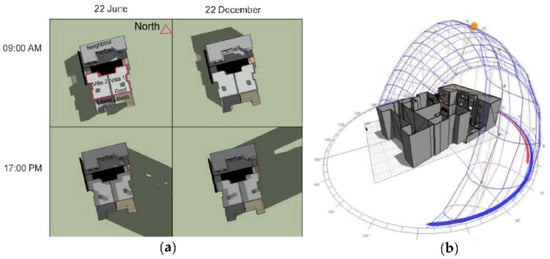
Figure 18.
(a) Shading simulation for the two Villas at 09:00 and 17:00, during summer (left) and winter (right); (b) sunlight tracking using Autodesk Ecotect software.
4.3. Solar Radiation Simulation
The solar radiation results from the simulation during winter and summer are shown in Figure 19. The results indicate that the shaded areas are those outside the building, the yards and the boundary walls, and the elevator enclosure above the roof, which are outside the coverage of the PV panels. The estimated global radiation on the roof is over 2.3 MWh/m2/year. The areas around the boundaries of the roof have a value of around 1.1 MWh/m2/year.
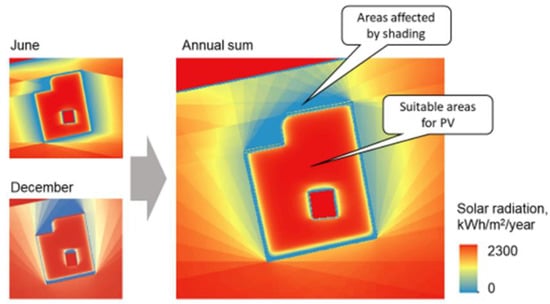
Figure 19.
Solar radiation for the Villa 1 during summer and winter.
4.4. Energy Consumption
The electrical consumption profiles for Villa 1 and Villa 2 for 31 months, from January 2017 until July 2019 are detailed in Figure 20 and Figure 21, respectively. The total consumption for Villa 1 is 152,420 kWh, and the average total per year is 59,001 kWh, while for Villa 2 it is 196,655 kWh, and the average total per year is 76,125 kWh. The domestic tariff of electricity in Saudi Riyal (SR) per kWh is 0.18 (1 US$ = 3.75 SR). The load pattern shows that the highest consumption of 6000 kWh is recorded during summer and autumn (June–September), whereas the minimum value of 3000 kWh is recorded in winter (January–March). This is due to the AC requirements in the hot and humid climate of KSA in summer, which could be responsible for up to 71% of the total electricity consumption according to Alaidroos and Kararti [15] when they selected 18 °C as the base CCD (cooling degree-days). In this study, Figure 17 above shows that both villas have similar electricity consumption when cooling is not considered. However, when a more realistic base CCD of 23 °C was selected that reflects the thermostat set point in Villa 1, which is between 23 and 25 °C, Villa 2 shows a higher AC electricity consumption than Villa 1, which accounts for 58% and 48% of the total load for Villa 2 and Villa 1, respectively.
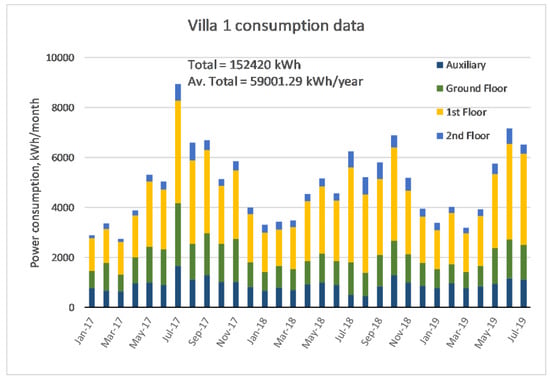
Figure 20.
Consumption for Villa 1 for 31 months, from January 2017 until July 2019.
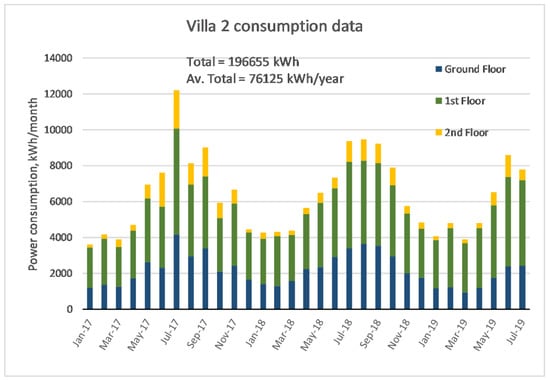
Figure 21.
Consumption for Villa 2 for 31 months, from January 2017 until July 2019.
The two villas have a similar pattern of electricity consumption. Villa 2 has a higher consumption rate despite having the same space, design, equipment, and number of occupants, and the only difference is the thermostat set-point and the manual operation of AC. This difference is likely attributed to the different behaviour and occupancy of the residents in both villas.
4.5. Power Production from Solar PV Systems
Electrical power system in Saudi Arabia is centralized, whereby energy is delivered through interconnected networks that link cities. Generation stations have occupied vast vital spaces, near water and fuel resources. The used fuel is mainly fossil, which emits CO2 and other gases that can cause damage to the environment. This led the government to seek alternatives. The most feasible solution was to use renewable resources. One of the best alternatives in a city like Jeddah, that has high solar radiation, is the solar system. Most of the land in Jeddah is privately owned and thus installing big-size solar towers or PV farms would be very costly, would need continuous maintenance, and should be connected to the grid through a robust and expensive network. The best solution is to use a decentralized building applied photovoltaic (BAPV) system, which is privately owned and can have a positive impact on the city’s landscaping by utilizing the available roofs. It will be more economical, considering the scale of the houses and the savings that the government can gain from avoiding the cost of installation and maintenance.
From the villa layout, as shown in Figure 5 and Figure 6, and the solar radiation simulation results as discussed above, the total roof area at each villa (1 and 2) is 227 m2. The final area suitable for PV systems is 180 m2 (Table 3) for each villa, Figure 22. This is the area after excluding AC equipment and the shaded parts, including the shades projected by the PV rows on each other and allowing access for equipment maintenance. Khan et al. in their study estimated that only 75% of the total area of the roofs in residential sectors in KSA is usable [14].

Table 3.
Parameter of designed photovoltaic (PV) system (from GIS model).
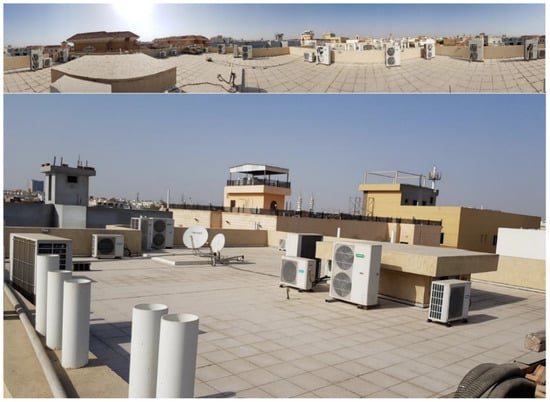
Figure 22.
A view of the roof and the installed equipment at Villa 1.
In this study, although all the area on the roof can be utilised if the PV panels are installed on a raised canopy at a height of more than 1.20 m, an area of 180 m2 only, which accounts for 79% of the total roof area (227 m2), was considered in the model. It is still a generous area for this purpose. Table 3 summarises the parameters of the proposed PV system design. This specific technology has been widely tested, and it is commercially available with competitive pricing and maintenance support. The annual total array yield was calculated from the sum of the monthly yields (Table 4) calculated with the Photovoltaic Geographical Information System (PVGIS) [20]. The azimuth and tilt angles were considered 0 degrees, as the PV panels are planned to be placed on a levelled raised canopy, to avoid shading projected by tilted rows on each other. It is important to note that the choice of 0 degrees in this study is to provide universal guidance, which could be repeated in future studies in Saudi Arabia. An actual PV system could be designed to include an approximate amount of sloping angle, or even a different orientation, to extend its economic profitability. The determination of the sloping angle and orientation will not be discussed in this paper. The annual electricity generation could be in the range of 1700 kWh/kWp/year. Figure 23 provides a breakdown of the estimated power generation for each month. The installed capacity at the 180 m2 roof area is around 28 KWp. The number of PV panels that can be installed is 110, based on the assumption that each one has an area of 1.64 m2 and can produce 275 Wp, the assumed specifications are listed in Table 5. The dust accumulation on PV panels has not been considered in these calculations, but it is expected that regular cleaning will be necessary. An automated cleaning water–recycling system could be used, such as the one that was commissioned at King Abdulaziz University in Jeddah and detailed in a previous publication [21].

Table 4.
Power generation from PV panels (source: PVGIS).
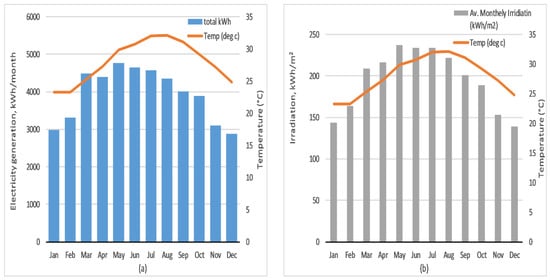
Figure 23.
(a) Monthly generated power from solar PV panels and (b) monthly solar irradiation vs Temperature.

Table 5.
Parameter of designed PV system (from GIS model).
5. Economic Assessment (Villa 1)
5.1. Impact of PV Power Generation on Demand
In order to reduce the consumption in the two villas, the optimum solution is to deploy photovoltaic systems in the roofs of the buildings. Villa 1 and Villa 2 have an unshaded roof of about 180 m2 each, which is enough for installing PV arrays of capacity 28 kWp per building. To allow for more space to walk on the roof for cleaning or maintenance, accommodate the controls and inverters, and avoid drilling through the water tight insulation when installing the PV units, it would be more practical to install them on raised canopies, which can provide support for PV and shade for the AC units. Figure 24 shows a raised rooftop PV-canopy system recently installed on one of the apartment buildings in Jeddah, which utilized the roof effectively and allowed for the AC compressors to be placed in the shade.
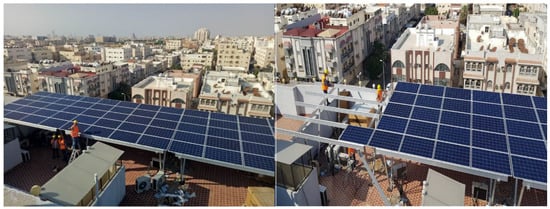
Figure 24.
A recent PV-canopy system installed on the roof of an apartment building in Jeddah (Courtesy of Solar Land sle.sa).
Figure 25 and Figure 26 show the PV electrical generation vs the consumption for Villa 1 for 31 months, from January 2017 until July 2019. Most of the load consumption will be compensated by the electricity generated from the solar PV systems. The saving in consumption is around 80% for Villa 1 and 62% for Villa 2, as summarised in Table 6.
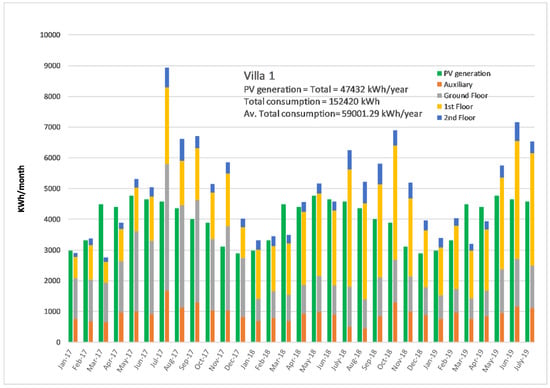
Figure 25.
PV electricity generation vs consumption for Villa 1 for 30 months, from January 2017 until July 2019.
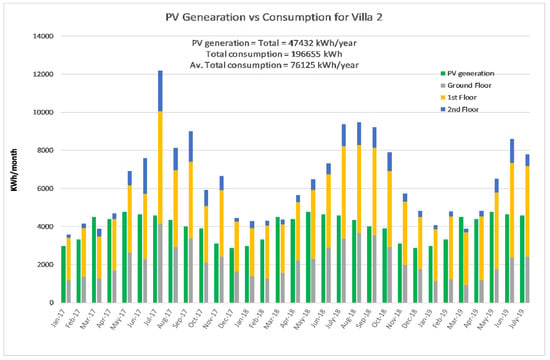
Figure 26.
PV electricity generation vs consumption for Villa 2 for 31 months, from January 2017 until July 2019.

Table 6.
Summary for the generated energy, cost, and the payback period in years.
5.2. Feed-in Tariff
In this section, an analysis of the consumption profile and the proposed feed-in-tariff will be discussed based on power demand and the power generated from the solar PV panels. The analysis includes discussions on savings in consumption of electricity, and the proposed FiT scheme, in addition to implications on deploying PV panels at a large scale on the roof of buildings in Saudi Arabia.
5.2.1. Load Curve of the Villas
Figure 27 shows the load curve for the monthly consumption for Villa 1 and Villa 2. Saudi Arabia has two levels of tariff for the domestic houses, 0.18 SR/kWh for the first 6000 kWh and 30 SR/kWh for higher consumption. This scheme was implemented in January 2018, after the government adopted a plan to unsubsidized energy consumption.
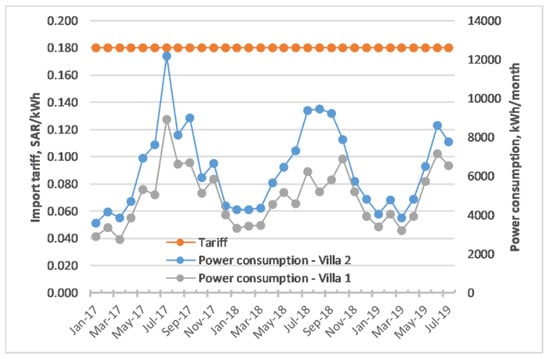
Figure 27.
Load curve for the monthly consumption for Villa 1.
5.2.2. Proposal for Feed-in Tariff in Saudi Arabia
Saudi Arabia has not yet proposed a feed-in tariff scheme (FiT). Two scenarios are suggested in this paper. Scenario 1 assumes that the financial benefit is solely from avoidance of electricity import (annual net metering), while scenario 2 includes the import saving and income from FiT.
Figure 28 and Figure 29 show cost savings in electricity bills for Villa 1 and Villa 2, respectively, from the PV panels for 31 months (January 2017–July 2019) when scenario 1 is adopted.
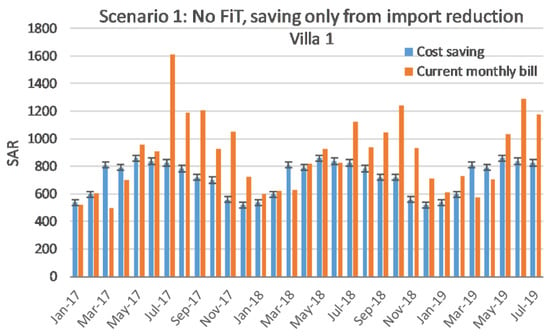
Figure 28.
Cost saving from the PV panels generated power, for Villa 1, for 31 months (January 2017–July 2019), only from import reduction (no FiT).
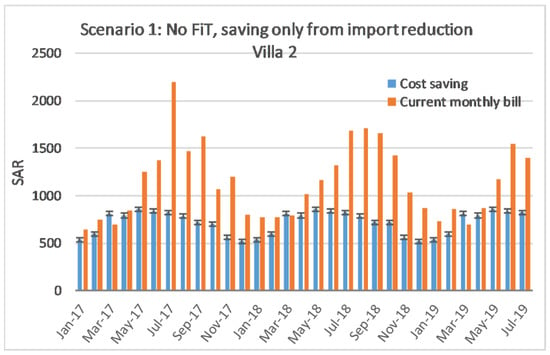
Figure 29.
Cost saving from the PV panels generated power, for Villa 2, for 31 months (January 2017–July 2019), only from import reduction (no FiT).
The total PV capacity to be deployed for Villa 1 and Villa 2 is estimated to be 28 kWp, which can generate 47,432 kWh of electricity per year. The average electricity consumption based on 31 months long bill observations between January 2017 until July 2019, is around 59,000 kWh/year for Villa 1, and 76,125 kWh/year for Villa 2. Therefore, the estimated reduction in electrical energy demand, when scenario 1 is applied, is 80.39%, and 62.3% for Villa 1 and Villa 2, respectively. This reduction is equivalent to 8537.76 SR at 0.18 SR domestic tariff, as summarised in Table 6.
Scenario 2 is demonstrated in Figure 30 and Figure 31, for Villa 1 and Villa 2, when a feed-in tariff (FiT) scheme is put in place. It is assumed that the tariff is the same as the import tariff (0.18 SAR ± 10%) and fixed for a certain period (e.g., 20 calendar years). Thus, the financial benefits include import saving and income from FiT.
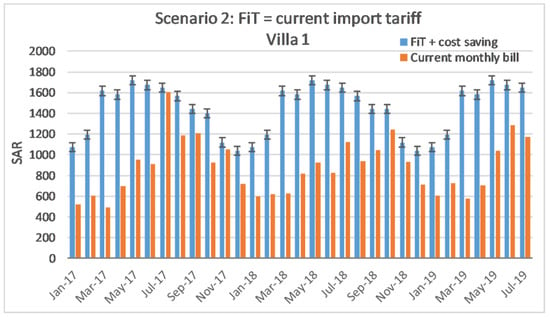
Figure 30.
Scenario 2 for Villa 1—cost saving from the PV panels generated power, for 31 months (January 2017–July 2019), from import saving and income from FiT (FiT + cost saving = 0.36 SR).
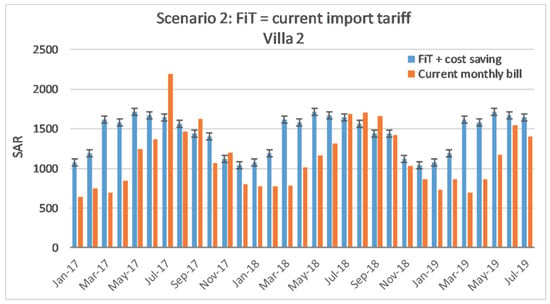
Figure 31.
Scenario 2 for Villa 2—cost saving from the PV panels generated power, for 31 months (January 2017–July 2019), from import saving and income from FiT (FiT + cost saving = 0.36 SR).
As discussed above with scenario 1, the estimated annual reduction in consumption is 80.39% for Villa 1 and 62.3% for Villa 2. This is equivalent to 17,076 SR, when scenario 2 is applied (FiT + Cost saving = 0.36 SR). Accordingly, a profit of 6455.77 SR and 3373.59 SR can be made, as summarised in Table 6.
The suggested scenarios above are suitable to be implemented in KSA, since a FiT scheme should be developed first. Elsewhere, FiT schemes have been subject to a variety of considerations, taking into perspective both environmental and economic issues. In the UK, for example, the tariff rate varies with the size of the installed PV system. It is adjusted annually to match the retail price index (RPI) [22]. The European Union has implemented many schemes; the latest is the tendering scheme [23].
5.3. Return on Investment
Ko et al., in 2019, estimated the cost for a 10 kWp plant in the West of Saudi Arabia, where Jeddah is located, to be 28,025.00 SR, which includes the cost and installation of each of the following in Saudi Riyal (SR): solar panels (15,810.00), inverters (3800), 21.4 Ah batteries (4665), wiring (3750) [24]. If the above figure is taken as the local cost for deploying PV systems, the installation for 28 kWp for this case study is estimated to be 78,470.00 SR for each villa. The cost for energy consumption for 31 months (January 2017 until July 2019), from the bills of Saudi Electric Company (SEC) is 27,435.06 SR, which is equivalent to 10,620.23 SR/year for Villa 1. For Villa 2 the energy cost for 31 months is 35,397.9 SR, which is equivalent to 13,702.41 SR/year.
If Scenario 1, as discussed above, is selected, where no feed-in tariff is available and net metering is applied, then the payback period on investment is 9.19 years. If scenario 2 is selected, by introducing a FiT of 0.18 SR, the payback period will decrease to 4.8 years. The payback period is within the 25 years lifetime for the PV system. Table 6 summarises the generated energy, cost, and the payback period in years. The maintenance is included in the total cost of installation, and a 0% discount rate is assumed.
6. Overall Summary and Conclusions
High energy cost could have implications on the lifestyle and wellbeing of the occupants, especially in countries with adverse climate. It was found that living spaces in the building under study were kept under uncomfortable conditions, in terms of temperature, RH, and CO2 levels. The AC units were kept off most of the day, especially in the unoccupied areas, while the occupied areas were set at a temperature that is expected to be above the recommended for achieving thermal comfort. The windows were kept shut, to avoid heat transfer from outside, which resulted in high RH and CO2 levels. Identifying cheaper energy solutions for households in this particular climate would have a rebound effect on the wellbeing and life quality of the residents.
This work presented energy consumption data of two buildings linked to potential energy yields from appropriately designed PV arrays on the roofs of the buildings. The results indicated that the PV systems output could reduce the household electrical demand from the grid by around 80% and payback periods well below the lifetime of the solar panels.
The financial benefit which is solely from avoidance of electricity import would result into a reasonable period for return on investment of around nine years (which is within the 25 years lifetime for PV panels), while introducing FiT with the same tariff as import tariff would reduce the payback period to around 4.6 years.
From the results and discussion above, it feasible to generalise the deployment of solar PV panels at scale in domestic buildings in Saudi Arabia. Installing PV panels will avoid land use if installed on buildings, and will serve as multifunctional components: weather barrier, power generation, light control, and shading. This will help in utilizing unused infrastructure that is normally available. Solar PV will contribute, as discussed above, to demand reductions in buildings in cities like Jeddah and also reduce loads on the distribution network, avoiding expensive reinforcement, as power is used where it is generated. Implementation of PV systems in buildings could provide opportunities for innovation, growth, training, and employment.
This case-study will be elaborated on in the future to cover more samples. Different approaches will be considered as intervention tools to reduce the consumption cost, including solar thermal for shedding the AC loads. Different styles of PV panels will be used, and different orientation and slope angels will be considered to extend their economic profitability. The occupancy behaviour will be thoroughly investigated through surveys and interviews. The measurement of temperature, CO2, RH, and power demand will be extended for at least 12 months to cover different seasons and holidays, and results will be compared with the findings in this study. The analysis could inform new regulations for the utilization of domestic buildings in power generation in Saudi Arabia. Moreover, different base cooling degree-days (CCD) will be selected to investigate the cooling load. Load matching and self-sufficiency ratios will be considered to show how PV energy is linked with the building loads, based on hourly data. Future work would also need to implement more economic assessment tools to measure the financial benefits and give more insight into the effectiveness of the proposed solutions.
Funding
This research was funded by King Salman bin Abdulaziz Chair for Energy Research, grant number KSCER 19-1.
Acknowledgments
The author would like to acknowledge King Salman bin Abdulaziz Chair for Energy Research for supporting this work. I would also like to acknowledge the Energy and Climate Changes Division at the University of Southampton, AbuBakr S Bahaj and his team; Leo Bourikas, Wu Yue, Luke Blunden, and Patrick James for the technical support and useful discussions and comments.
Conflicts of Interest
The author declares no conflict of interest.
Appendix A

Table A1.
List of the loads for the ground floor in each Villa.
Table A1.
List of the loads for the ground floor in each Villa.
| Room | Item | No. | Load (VA) | Total Load (VA) |
|---|---|---|---|---|
| Guest Reception | Spot Light | 14.00 | 10.00 | 140.00 |
| Chandler | 1.00 | 80.00 | 80.00 | |
| AC | 1.00 | 7811.55 | 7811.55 | |
| Guest Dining Room | Spot Light | 12.00 | 10.00 | 120.00 |
| Chandler | 1.00 | 60.00 | 60.00 | |
| AC | 1.00 | 5170.00 | 5170.00 | |
| Toilet 1 and Washing | Light | 5.00 | 10.00 | 50.00 |
| Extract Fan | 1.00 | 14.00 | 14.00 | |
| Main Entrance | Light | 8.00 | 10.00 | 80.00 |
| Toilet 2 | Light | 3.00 | 10.00 | 30.00 |
| Extract Fan | 1.00 | 14.00 | 14.00 | |
| Living Room | Spot Light | 16.00 | 10.00 | 160.00 |
| Chandler | 1.00 | 80.00 | 80.00 | |
| TV | 1.00 | 200.00 | 200.00 | |
| AC | 1.00 | 7811.55 | 7811.55 | |
| Toilet 3 | Light | 3.00 | 10.00 | 30.00 |
| Instant Water Heater | 1.00 | 7000.00 | 7000.00 | |
| Extract Fan | 1.00 | 14.00 | 14.00 | |
| Guest Bedroom | Spot Light | 12.00 | 10.00 | 12.00 |
| Chandler | 1.00 | 100.00 | 100.00 | |
| AC | 1.00 | 5170.00 | 5170.00 | |
| Kitchen | Light | 2.00 | 18.00 | 36.00 |
| Instant Water Heater | 1.00 | 7000.00 | 7000.00 | |
| Extract Fan | 1.00 | 150.00 | 150.00 | |
| Spot Light | 8.00 | 10.00 | 80.00 | |
| Sockets | 1.00 | 3000.00 | 3000.00 | |
| AC | 1.00 | 3212.00 | 3212.00 | |
| Oven | 1.00 | 3500.00 | 3500.00 | |
| Fridge/Freezer | 1.00 | 500.00 | 500.00 | |
| Dishwasher | 1.00 | 3050.00 | 3050.00 | |
| Side Entrance | Light | 8.00 | 10.00 | 80.00 |
| AC | 1.00 | 3256.00 | 3256.00 | |
| Total Load (VA) | 58,011.1 |

Table A2.
List of the loads for the first floor in each Villa.
Table A2.
List of the loads for the first floor in each Villa.
| Room | Item | No. | Load (VA) | Total Load (VA) |
|---|---|---|---|---|
| Lounge | Spot Light | 12.00 | 10.00 | 120.00 |
| Chandler | 1.00 | 30.00 | 30.00 | |
| TV | 1.00 | 200.00 | 200.00 | |
| AC | 2.00 | 7811.55 | 15,623.10 | |
| - | Fridge | 1 | 500 | 500 |
| Bedroom 1 | Spot Light | 8.00 | 10.00 | 80.00 |
| AC | 1.00 | 5170.00 | 5170.00 | |
| Toilet 1 | Light | 3.00 | 10.00 | 30.00 |
| Extract Fan | 1.00 | 14.00 | 14.00 | |
| Corridor | Light | 3.00 | 10.00 | 30.00 |
| Master Bedroom | Light | 6.00 | 10.00 | 60.00 |
| AC | 1.00 | 7811.55 | 7811.55 | |
| Master Toilet | Light | 5.00 | 10.00 | 50.00 |
| Instant Water Heater | 1.00 | 10,500.00 | 10,500.00 | |
| Extract Fan | 1.00 | 17.00 | 17.00 | |
| Bedroom 2 | Spot Light | 8.00 | 10.00 | 80.00 |
| AC | 1.00 | 5170.00 | 5170.00 | |
| Toilet 2 | Light | 3.00 | 10.00 | 30.00 |
| Instant Water Heater | 1.00 | 9500.00 | 9500.00 | |
| Extract Fan | 1.00 | 14.00 | 14.00 | |
| Bedroom 3 | Spot Light | 8.00 | 10.00 | 80.00 |
| AC | 1.00 | 5170.00 | 5170.00 | |
| Total Load (VA) | 60,279.65 |

Table A3.
List of the loads for the second floor in each Villa.
Table A3.
List of the loads for the second floor in each Villa.
| Room | Item | No. | VA | Total Load (VA) |
|---|---|---|---|---|
| Hall | Spot Light | 20.00 | 10.00 | 200.00 |
| TV | 1.00 | 200.00 | 200.00 | |
| AC | 1.00 | 7811.55 | 7811.55 | |
| AC | 1.00 | 5170.00 | 5170.00 | |
| Toilet 1 | Light | 2.00 | 18.00 | 36.00 |
| Instant Water Heater | 1.00 | 7000.00 | 7000.00 | |
| Extract Fan | 1.00 | 14.00 | 14.00 | |
| Corridor | Light | 3.00 | 10.00 | 30.00 |
| AC | 1.00 | 3212.00 | 3212.00 | |
| Bedroom | Light | 2.00 | 18.00 | 36.00 |
| Sockets | 1.00 | 2000.00 | 2000.00 | |
| AC | 1.00 | 1100.00 | 1100.00 | |
| Extract Fan | 0.00 | 14.00 | 14.00 | |
| Toilet 2 | Light | 3.00 | 10.00 | 30.00 |
| Extract Fan | 1.00 | 14.00 | 14.00 | |
| Store | Light | 2.00 | 18.00 | 36.00 |
| AC | 1.00 | 1100.00 | 1100.00 | |
| Washing Room | Washing machine | 1.00 | 2200.00 | 2200.00 |
| AC | 1.00 | 1100.00 | 1100.00 | |
| - | Light | 4.00 | 18.00 | 72.00 |
| Kitchen | Light | 4.00 | 18.00 | 72.00 |
| Extract Fan | 1.00 | 400.00 | 400.00 | |
| Spot Light | 10.00 | 5.00 | 50.00 | |
| AC | 1.00 | 3212.00 | 3212.00 | |
| Oven | 1.00 | 3500.00 | 3500.00 | |
| Fridge/Freezer | 1.00 | 500.00 | 500.00 | |
| Dishwasher | 1.00 | 1950.00 | 1950.00 | |
| Lift | Lift-VVVF | 1.00 | 2000.00 | 2000.00 |
| Total Load (VA) | 43,059.55 |

Table A4.
List of the loads for the Auxiliary.
Table A4.
List of the loads for the Auxiliary.
| Room | Item | No. | Load (VA) | Total Load (VA) |
|---|---|---|---|---|
| Janitor | Light | 2.00 | 20.00 | 40.00 |
| Sockets Circuit | 2.00 | 150.00 | 150.00 | |
| TV | 1.00 | 200.00 | 200.00 | |
| AC | 1.00 | 1100 | 1100 | |
| Swimming Pool | Pump | 1.00 | 2000.00 | 2000.00 |
| - | Extract Fan | 1.00 | 14.00 | 14.00 |
| Yard | Light | 5.00 | 18.00 | 90.00 |
| Water Pump | 1.00 | 740.00 | 740.00 | |
| Shower | Light | 1.00 | 18.00 | 18.00 |
| Extract Fan | 1.00 | 14.00 | 14.00 | |
| Total Load (VA) | 4366 |
References
- US Energy Information Administration (EIA). Country Analysis Brief: Saudi Arabia. Available online: https://www.eia.gov/beta/international/analysis_includes/countries_long/Saudi_Arabia/saudi_arabia.pdf (accessed on 20 October 2017).
- Kingdome of Saudi Arabia 2030 Vision. Available online: https://vision2030.gov.sa/en/node/87 (accessed on 20 October 2017).
- Alawaji, S.H. Evaluation of solar energy research and its applications in Saudi Arabia-20 years of experience. Renew. Sustain. Energy Rev. 2001, 5, 59–77. [Google Scholar] [CrossRef]
- King Abdullah City for Atomic and Renewable Energy, the Vision. Available online: https://www.kacare.gov.sa/en/FutureEnergy/Pages/vision.aspx (accessed on 1 September 2019).
- BP Statistical Review of World Energy, 2019, 68th Edition. Available online: https://www.bp.com/content/dam/bp/business-sites/en/global/corporate/pdfs/energy-economics/statistical-review/bp-stats-review-2019-full-report.pdf (accessed on 10 September 2019).
- Zell, E.; Gasim, S.; Wilcox, S.; Katamoura, S.; Stoffel, T.; Shibli, H.; Engel-Cox, J.; Al Subie, M. Assessment of solar radiation resources in Saudi Arabia. Sol. Energy 2015, 119, 422–438. [Google Scholar] [CrossRef]
- Dehwah, A.H.A.; Asif, M.; Rahman, M.T. Prospects of PV application in unregulated building rooftops in developing countries: A perspective from Saudi Arabia. Energy Build. 2018, 171, 76–87. [Google Scholar] [CrossRef]
- Asif, M.; Hassanain, M.A.; Nahiduzzaman, K.M.; Sawalha, H. Techno-economic assessment of application of solar PV in building sector A case study from Saudi Arabia. Smart Sustain. Built Environ. 2019, 8, 34–52. [Google Scholar] [CrossRef]
- Aldossary, N.A.; Rezgui, Y.; Kwan, A. Establishing domestic low energy consumption reference levels for Saudi Arabia and the Wider Middle Eastern Region. Sustain. Cities Soc. 2017, 28, 265–276. [Google Scholar] [CrossRef]
- Alyahya, S.; Irfan, M.A. Role of Saudi universities in achieving the solar potential 2030 target. Energy Policy 2016, 91, 325–328. [Google Scholar] [CrossRef]
- International Renewable Energy Agency (IRENA), Renewable Energy in Cities, ISBN 978-92-95111-32-5, Abu Dhabi, October 2016. Available online: https://www.irena.org/-/media/Files/IRENA/Agency/Publication/2016/IRENA_Renewable_Energy_in_Cities_2016.pdf (accessed on 10 September 2019).
- United Nations Department of Economic and Social Affairs Population Division, World Urbanization Prospects: The 2018 Revision, Highlights (ST/ESA/SER.A/352), New York, USA. 2018. Available online: https://population.un.org/wup/Publications/Files/WUP2018-Highlights.pdf (accessed on 15 September 2019).
- Alghamdi, A.S.; Bahaj, A.S.; Wu, Y. Assessment of Large Scale Photovoltaic Power Generation from Carport Canopies. Energies 2017, 10, 686. [Google Scholar] [CrossRef]
- Khan, M.M.A.; Asif, M.; Stach, E. Rooftop PV Potential in the Residential Sector of the Kingdom of Saudi Arabia. Buildings 2017, 7, 46. [Google Scholar] [CrossRef]
- Alaidroos, A.; Krarti, M. Optimal design of residential building envelope systems in the Kingdom of Saudi Arabia. Energy Build. 2015, 86, 104–117. [Google Scholar] [CrossRef]
- Beck, H.E.; Zimmermann, N.E.; McVicar, T.R.; Vergopolan, N.; Berg, A.; Wood, E.F. Present and future Koppen-Geiger climate classification maps at 1-km resolution. Sci. Data 2018, 5. [Google Scholar] [CrossRef] [PubMed]
- Climat-Data.Org. Available online: https://en.climate-data.org/asia/saudi-arabia/makkah-region/jeddah-764388/ (accessed on 20 September 2019).
- Climat-Data.Org. Available online: https://en.climate-data.org/asia/saudi-arabia/asir-region/abha-3634/ (accessed on 2 September 2019).
- Climate Transparency, Brown to Green: G20 Transition to a Low Carbon Economy. Available online: https://www.climate-transparency.org/wp-content/uploads/2016/09/Saudi-Arabia_Country-Profile.pdf (accessed on 30 October 2019).
- European Commission, Photovoltaic Geographical Information System (PVGIS), Geographical Assessment of Solar Resource and Performance of Photovoltaic Technology. Available online: https://re.jrc.ec.europa.eu/pvgis.html (accessed on 22 July 2019).
- Alghamdi, A.S.; Bahaj, A.S.; Blunden, L.S.; Wu, Y. Dust Removal from Solar PV Modules by Automated Cleaning Systems. Energies 2019, 12, 2923. [Google Scholar] [CrossRef]
- Britain’s Energy Regulator, Ofgem. Available online: https://www.ofgem.gov.uk/environmental-programmes/fit/fit-tariff-rates (accessed on 4 October 2019).
- Council for European Energy Regulators (CEER), Sustainable Development Work Stream Tendering Procedures for RES in Europe: State of Play and First Lessons Learnt. Available online: https://www.ceer.eu/documents/104400/-/-/167af87c-5472-230b-4a19-f68042d58ea8 (accessed on 4 October 2019).
- Ko, W.; Al-Ammar, E.; Almahmeed, M. Development of Feed-in Tariff for PV in the Kingdom of Saudi Arabia. Energies 2019, 12, 2898. [Google Scholar] [CrossRef]
© 2019 by the author. Licensee MDPI, Basel, Switzerland. This article is an open access article distributed under the terms and conditions of the Creative Commons Attribution (CC BY) license (http://creativecommons.org/licenses/by/4.0/).