Abstract
Offshore wind turbines in shallow waters are predominantly installed using a monopile foundation, onto which a transition piece and wind turbine are attached. Previously, the monopile to transition piece (MP-TP) connection was made using a grouted connection, however, cases of grout failure causing turbine slippage, among other issues, were reported. One solution is to use bolted ring flange connections, which involve using a large number of M72 bolts to provide a firm fixing between the MP-TP. It is in the interest of offshore wind operators to reduce the number of maintenance visits to these wind turbines by maintaining a preload (Fp) level above the minimum requirement for bolted MP-TP connections. The present study focuses on the effect of the tightening sequence on the Fp behaviour of M72 bolted connections. A detailed finite element (FE) model of a seven-bolt, representative segment of a monopile flange was developed with material properties obtained from the available literature. Three analyses were made to examine the effect on Fp after tightening, including the initial Fp level applied to the bolts, the tightening sequence and the effect of an additional tightening pass.
1. Introduction
Offshore wind turbines using monopile foundations require two main connection points to secure them: the monopile to transition piece (MP-TP) connection and the transition piece to wind turbine (TP-WT) connection, both which often utilise bolted ring flange connections. Turbine ring-flange connections are usually fastened with prestressed, high-strength bolt assemblies (HV-sets) with large diameters [1]. Due to the high loads experienced at the transition piece connections, bolts with large diameters of up to M72 are used. The application of bolts with such dimensions takes place almost exclusively in the wind energy sector. Consequently, even though applicable design standards do not explicitly exclude the application of large diameters, the current knowledge and experimental validation is limited to bolts with diameters of up to M64. The behaviour of such large bolts is mostly unknown, making them an important area of research for which further knowledge is required. Data from smaller bolts cannot be used accurately to estimate the behaviour of larger bolts due to the geometrical size effect, as the stress gradient from the threaded surface to the centre of the bolt increases with diameter [2].
It is known that bolts experience short-term relaxation once they are tightened, which can ultimately lead to a loss of clamping load. Some offshore operators have reported that preload (Fp) has reduced significantly in their installations, and in some cases, bolts have become fully loose. Standards for wind turbine flange connections [3] recommend a minimum Fp value as a function of the bolt material’s 0.2% proof stress (i.e., Rp 0.2% which is often taken as yield stress) or ultimate tensile strength (UTS). The objective is for the Fp in the bolt to be maintained at the initial tightening load, but due to a large number of influencing factors, it is almost impossible to achieve or retain the desired value. However, it must be noted that the main concern is the clamping force that holds the joint together, not the value of bolt Fp, even though it has a direct influence.
Some of the numerous influencing factors include loading method, frictional effects, thread engagement, bolt hole dimensioning and misalignment, plastic deformation in the threads and surface, and low temperature creep [4]. A loss of Fp in the bolts can be due to either short-term effects, happening within the first few hours, or long-term effects such as cyclic loading during the operational life cycle. In this paper, the effect of long-term relaxation is not considered; however, current literature suggests that short-term relaxation can cause an instant Fp loss of up to 11%, with a further reduction in the first hours of tightening [5].
The difficulty of achieving uniform bolt Fp’s in a joint with multiple bolts is well-known due to elastic interaction, and even more so when there are over 100 bolts in the flange. In practice, multipass, bolt-up operations are conducted to achieve a more uniform bolt load. However, due to the additional influences causing loss of Fp, the scatter is inevitable. Bibel and Ezell [6] and Bibel and Eric [7] reported that due to elastic interaction, some bolts experience Fp relaxation of up to 98%. Current literature includes studies on achieving uniform clamping load in gasketed bolt joints using finite element (FE) models [8,9,10], where the effect of tightening sequence and Fp are experimentally validated. These experiments do not take into account the short-term relaxation effects on Fp; however, the results of the FE simulation and experiments tend to agree. These studies are based on five to eight small-diameter bolts with Fp values of up to 35% of the bolt’s yield strength. According to these studies, a large Fp reduction was experienced and a minimum of three passes were needed to achieve the required Fp level. However, Nassar et. al [8] suggested a strategy for a single pass that requires loading bolts to difference levels based on the tightening sequence.
Offshore wind projects have large capital costs, as well as ongoing operation and maintenance (O&M) costs that the industry is striving to reduce in order to become more competitive with other energy sources [11,12,13,14]. Improving tightening strategies and reducing the number of maintenance visits required will aid in reducing both capital and operational costs. In this study, a FE model for single-pass and multipass bolt tightening operations is introduced to explore the tightening strategies for achieving a more uniform bolt Fp with minimum scatter. The purpose of the study is to improve the knowledge of M72 bolts by conducting a sensitivity analysis to monitor the sensitivity of Fp relaxation to the tightening sequence. The tightening pattern and initial bolt Fp level were investigated with the aim of informing the offshore wind industry about their effects on Fp relaxation in order to improve tightening strategies. The overall aim of the study is to highlight the requirement for further research and practical validation for M72 bolts and tightening strategies of such large, flanged assemblies. This research will contribute towards the cost reduction and structural safety of offshore wind turbines, and will help to build confidence in large bolts and structures, which may open avenues for other industries or improve the lifespan and design of existing assets.
2. Materials and Methods
Two materials were considered for this study. Monopiles and integrated flanges are manufactured from S355G8+M steel, and the bolts, washers, and nuts are defined as 10.9 grade high- strength steel. The material properties are shown in Table 1. Tensile test data was not readily available for 10.9 grade steel; therefore, a simplified Ramberg-Osgood (RO) model was used to define the material behaviour.

Table 1.
Material properties employed in numerical simulations.
The RO material model uses a simplified formulation to obtain a tensile trend for the elastic-plastic behaviour of the material by using limited information or data points available for a given material. According to the RO material model, the total strain can be described as
where
- ε is the total strain
- E is the Elastic Young’s modulus
- σ is the applied stress
- K and n are material constants
Yield strength values are more commonly determined by the offset method, and therefore the modified version proposed by Hill [15] has been used
where
- is the yield stress of the material
- UTS is the ultimate tensile strength
The constants required to describe the tensile behaviour of materials considered in this study were obtained using the yield stress and UTS data points, which were obtained from the literature and are shown in Table 1. As the bolt loads were predominantly in the elastic region, the plastic region of the curve was only modelled until the UTS was reached.
Figure 1 shows the stress-strain curves for both materials, calculated from the RO material model. This data was used to determine the elastic-plastic behaviour of the material as required by ABAQUS FE simulation software. A tensile test on S355 was carried out to validate the material model, the data of which are also plotted on the graph. The graph shows that the S355 curve, determined using the RO model, agreed well with the tensile test data, and therefore the model is suitable for use with both materials.
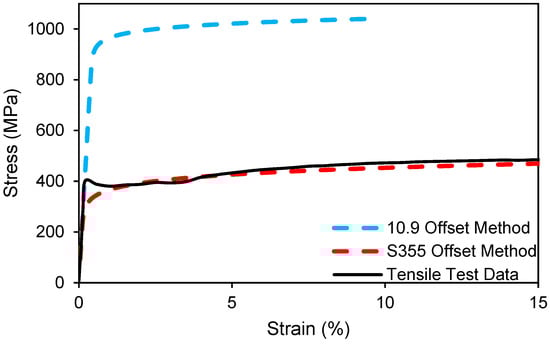
Figure 1.
Stress-strain curves obtained using the offset method.
3. FE Model Setup
To simplify the model and reduce its overall size, a seven-bolt, 90° segment was modelled containing all of the relevant connection components to replicate a full-sized flange, including bolts, washers and nuts, as shown in Figure 2 and Table 2. This model included upper and lower flange sections, bolts, nuts and washers, as depicted in Figure 3. The dimensions of the original flange [16] are shown in Figure 3. The cross-sectional dimension of the flange was replicated in the FE model; however, small details such as the radius between the flange and the wall, as well as the angle between the flanges were neglected. As elastic interaction of the flange is important; it was ensured that the distance between the bolts was maintained between the full-scale flange and the FE model, which determined a flange diameter of 1.456 m.
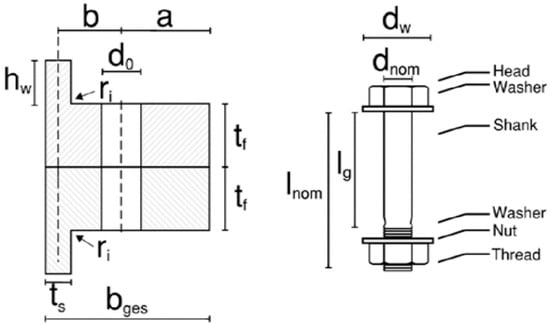
Figure 2.
Schematic illustration of flange dimensions.
Table 2.
Flange dimensions employed in finite element model (FE) simulations—all dimensions in mm.
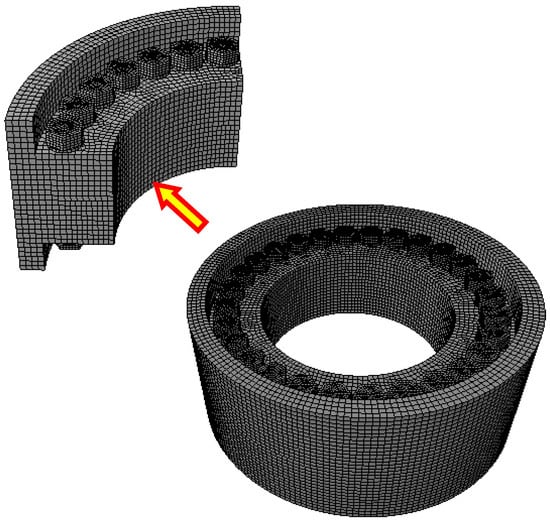
Figure 3.
FE model setup for the flange section.
3.1. Load and Boundary Conditions Definition
Two loading types were used for the FE model: bolt load and gravitational load. External cyclic and long-term relaxation are only considered for long-term Fp studies; therefore, they were not considered for the present work.
Three levels of bolt loads were used based on the percentage of the bolt’s yield strength and were calculated from equation 1. Based on a cross-sectional area of 4071.5 mm2, which is the area of the bolt shank at the mid-length, the following three values were calculated:
- The load corresponding to 70% of the yield stress = 2.679 MN;
- The load corresponding to 80% of the yield stress = 3.062 MN;
- The load corresponding to 90% of the yield stress = 3.444 MN.
To apply the bolt Fp, the bolt load command in ABAQUS was used. In this approach, the focus is on the middle section of the bolt where the bolt length is reduced based on the required Fp value. With the reduction in bolt length, while keeping the rest of the assembly unchanged, the same load state as in real bolted connections is achieved. To allow the bolt to behave as a standard deformable component, the “Fix at Current Length” option for the bolt load was selected after the loading of each bolt. Without the use of this function, ABAQUS would simply adjust the length of the bolt to maintain the prescribed load originally applied.
As shown in Figure 4, an encastre boundary condition was applied to the bottom surface to simulate the monopile bottom fixed to the seabed. A cyclic symmetry interaction was also used to project the 90° flange section around a central axis to simulate the full flange (Figure 3) and reduce the size of the model. Cyclic symmetry made it possible to analyse the behaviour of the full 360° flange based on a repetitive sector, meaning that it also simulates multiple bolts being tightened at the same time (in this case, four bolts, one from each sector), a technique used for the installation of wind turbines.
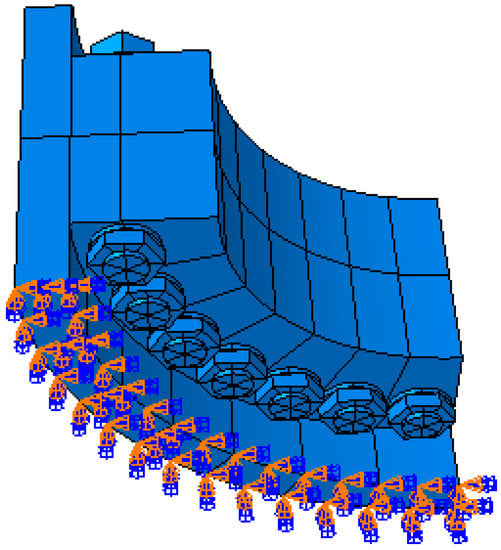
Figure 4.
Boundary conditions in the FE model.
3.2. Contact Definition
A friction coefficient of 0.2 was defined between all contact surfaces using the “Friction: Penalty” option in ABAQUS. The “Tie” constraint was used between each bolt and nut pair to ensure that they were fixed together with no slippage, which might have influenced the Fp.
3.3. Mesh Definition
Hexagonal C3D8R elements were used to mesh all parts, with structured mesh used for the fixings due to its stability and ability to mesh the model neatly. Due to the shape of the flange, a hexagonal sweep was used to mesh the flange sections. Several partitions were created to limit the total number of elements. The mesh verification command indicated none of the elements had an aspect ratio higher than 10 and angular limits below 0.1, which determined a good mesh structure with no distortion [17].
A mesh sensitivity analysis was performed to determine the correct mesh density, reduce the potential computational time, and ensure the accuracy of the analysis results. Figure 5 shows that the graph begins to converge at the global seed size of around 10 mm, which is much smaller than the actual size of the offshore wind turbine flange and M72 bolts employed in this study; therefore, the element size is deemed suitable for FE analysis.
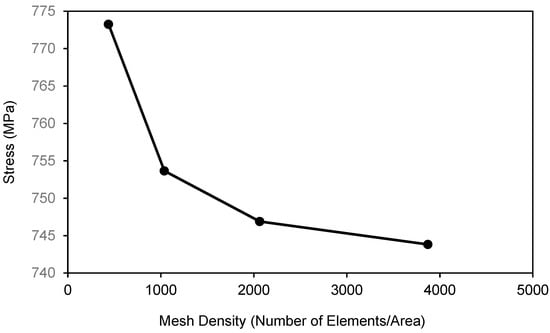
Figure 5.
Mesh sensitivity analysis.
3.4. Tightening Sequence and Number of Passes
To monitor the effect of the tightening sequence on Fp, three different sequences were used to tighten the bolts and the results were compared. With respect to the bolt number presented in Figure 6, the sequences were as follows:
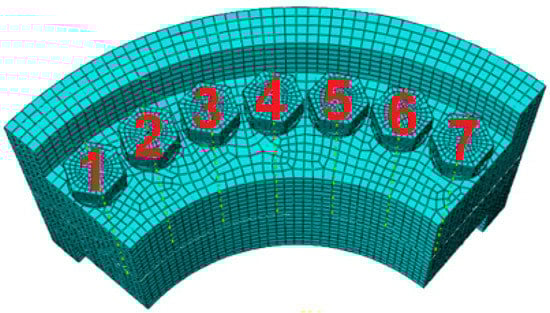
Figure 6.
Bolt numbers according to FE model.
- Sequence as suggested by the tensioning tool manufacturer [18] based on a segment of seven bolts in a 28-bolt flange (1, 5, 3, 7, 2, 6, 4).
- Alternative sequence from literature [19] based on a segment of seven bolts in a 28-bolt flange (1, 4, 6, 2, 5, 3, 7).
- Clockwise sequence (1, 2, 3, 4, 5, 6, 7), which is an uncommon practice.
It is suggested that more than one pass be made on each bolt in the same sequence to ensure that any deformation in the flange or relaxation of bolts is accounted for [20,21]. To simulate this, a second pass was made using sequence A.
4. Results and Discussion
A three-dimensional (3D) FE model was developed based on the geometry of an offshore, monopile, bolted-flange connection, to monitor the effect of tightening sequence on Fp variations in M72 bolt sets. Three main analyses were conducted based on the data from the simulations and are presented in the following subsections.
4.1. Analysis of Fp Level
Tightening to and maintaining a Fp level in flange bolts is notoriously difficult in industries of all sizes, but predominantly in nuclear and pressure industries. Most literature is for smaller bolted- flange assemblies, which are subjected to loading regimes that are quite different from those found in the wind industry. Standards specify a minimum required Fp level, indicating that the Fp values are generally higher than those used in similar research [10]. Due to the importance of this minimum limit, three levels of Fp were used to tighten each of the bolts in turn, based on sequence A (1, 5, 3, 7, 2, 6, 4). The stress from bolt 1, as shown in Figure 6, was monitored to quantify the variation in Fp through the tightening sequence. Bolt 1 was selected because it was the first bolt tightened in the sequence, and thus experienced the largest variation. The variation in stress over the cross-section was less than 1%; therefore, the axial stress in the Y-direction (S22) was extracted from the centre of the bolt for analysis purposes.
Figure 7 shows the stress of bolt 1 against the number of bolts tightened in the sequence for all three load levels. After completion of the tightening sequence, a 5% reduction in Fp was observed in bolt 1 for all three load levels. Although the Fp reduced by 5% for each of the load levels, the total reduction in Fp increased based on a higher initial Fp level. This indicates the importance of the initial load level, as the Fp levels reduced to 66.5%, 76% and 85.5% of the bolt’s yield stress after the tightening of all bolts. Due to the requirement of a minimum final load of 70% of the yield stress, the reduction in Fp shows that the lower load level was below the minimum required value after the tightening sequence was completed.
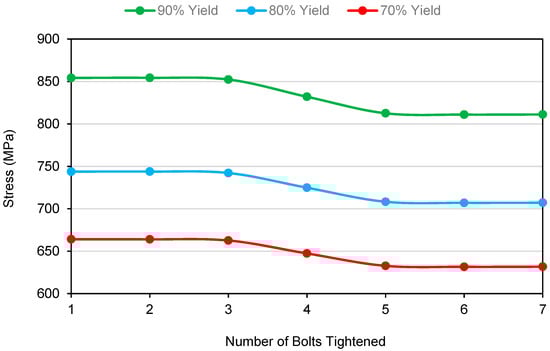
Figure 7.
Comparison of bolt preload (Fp) reduction at three load levels.
The graph shows that the reduction of Fp was predominantly due to the tightening of two bolts in the sequence, bolts 2 and 7, which were the bolts neighbouring bolt 1. The load reduction was due to the non-uniformity of the clamp load caused by the tightening pattern and cross talk. Elastic interaction such as this occurs due to the deformation of the flange during assembly and tightening of the first bolts. As the gaps in the flange compress, the clamp length reduces accordingly, yet the bolt length remains constant, resulting in a reduction in load on the bolt.
Figure 8 shows the stress data from each bolt after the completion of the tightening sequence. A similar trend was observed for all three of the Fp levels, with the first three bolts in the sequence experiencing a Fp reduction of around 5%, the fourth bolt experiencing a reduction of around 2.5% and the final three bolts experiencing little or no reduction. This is due to the number of neighbouring bolts subsequently tightened after the bolt in question and relates back to the elastic interaction of the flange. As each bolt is tightened, the flange in the immediate vicinity is compressed, causing the area around it to also be compressed. Elastic interaction is affected by the stiffness of the flange [22,23], and due to the stiffness of the flange, only the bolts which are immediate neighbours are affected. This would suggest that an increase in stiffness in the flange design would likely reduce the level of elastic interaction.
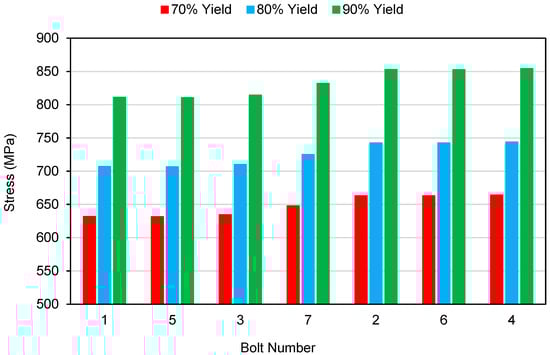
Figure 8.
Fp scatter in different bolts at various load levels.
4.2. Analysis of Sequence Effects
Three different tightening sequences were used to analyse the effect of the tightening order on the final level of Fp. The 80% Fp value was used for this analysis. The stress of bolt 1, which was always the first bolt to be tightened in the sequences, was monitored while subsequent bolts in the sequence were tightened. Accordingly, the most positive point on the x-axis (bolt number), the stress of bolt 1, is shown after all other bolts were tightened. From Figure 9, it can be observed that although the change in Fp varies over the course of the tightening, the total reduction in Fp is always the same once the sequence is completed.
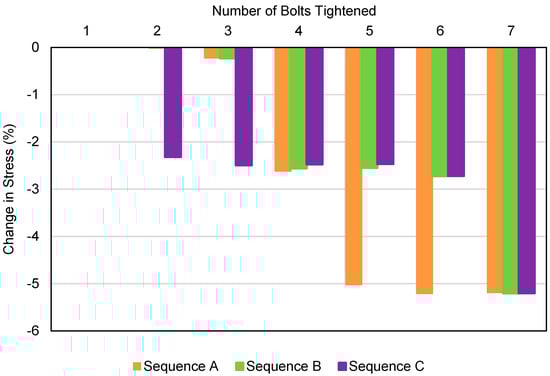
Figure 9.
Comparison of bolt Fp using three different tightening sequences.
In comparing Figure 9 with Figure 8, it is demonstrated that the two neighbouring bolts have the highest influence on bolt Fp. An interesting observation is that each of the neighbouring bolts contributes to half of the Fp reduction. This conclusion is made in the literature and is known to be the main cause of elastic interaction and Fp relaxation.
The Fp of each bolt was extracted after the completion of each tightening sequence. Figure 10 shows two results of interest. First, sequence A and B resulted in very similar levels of Fp, despite the bolts being tightened in a different sequence. This suggests that as long as a star pattern is used, the sequence in which the bolts are tightened has a negligible effect on the Fp of the first bolt tightened in the sequence.
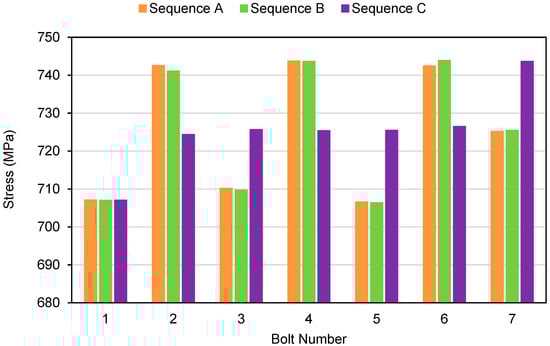
Figure 10.
Fp scatter using different tightening sequences.
From sequence C, a lower scatter of Fp was observed, as the Fp of bolts 2 to 6 all reduced by 2.5%. The reason for this is that each of the bolts only had one neighbouring bolt tightened subsequently. It was also observed that the tightening sequence had no effect on the Fp of the first and last bolt tightened in the sequence.
4.3. Analysis of Multiple-Pass Tightening
As can be seen in Figure 10, sequence A resulted in a scatter in final bolt Fp values, the maximum of which was a 5% reduction after tightening. A further pass was modelled using the same Fp values and sequences, the results of which are presented in Figure 11. It is standard practice to perform multiple-pass tightening to reduce the Fp scatter across the bolts. As observed in the results of this simulation, after just one additional pass, the Fp values for all seven bolts increased to their required load, giving an even clamping force around the flange. This shows that if the bolts are retightened using the same sequence, a more uniform load distribution is achieved with less scatter. Additionally, this result shows that the elastic interaction of the flange only has an influence on the bolt’s Fp level until a certain level of clamping load is achieved. As mentioned in Section 4.1, this is likely due to a combination of a high level of Fp and flange stiffness. As a consequence of total contact between the flanges, the behaviour of the joint was stiffer, therefore, there was negligible elastic interaction from the flange [24]. This suggests that at least one further tightening is required to achieve the desired Fp level. A future study will need to be conducted to explore if this conclusion can be applied to larger flanges with a larger number of bolts.
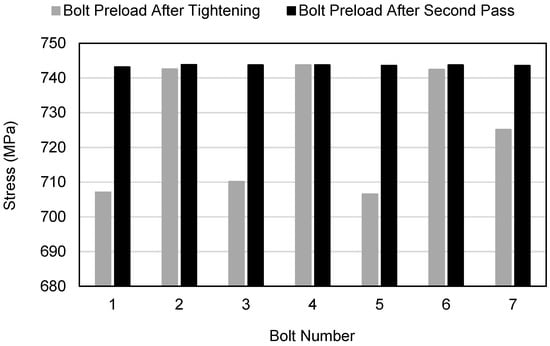
Figure 11.
Fp scatter difference between first and second pass.
5. Conclusions
In this work, the effect on Fp value of tightening sequence, initial load level, and multiple passes were investigated using a FE model, from which the following conclusions were made:
- A maximum Fp reduction across bolts of around 5% is experienced for all initial load levels;
- Higher initial Fp levels lead to a larger total value of Fp reduction;
- Lower initial Fp levels are susceptible to a reduction below the minimum required limit;
- Tightening of neighbouring bolts has a direct relation to a reduction in Fp and each neighbouring bolt contributes to around half of the Fp reduction;
- A scatter in Fp values is experienced across the bolts upon completion of all of the tightening sequences;
- The tightening sequence has no effect on the final Fp value of the first bolt tightened in any sequence, which experiences the largest reduction in Fp;
- Sequences A and B resulted in the same level of Fp across the bolts, indicating that tightening using star pattern sequences have negligible effect on final Fp values;
- Tightening of the bolts using sequence C results in less Fp scatter across the bolts;
- A second tightening pass in the same sequence results in all of the bolts achieving their required value of Fp.
Author Contributions
FE simulations and data analyses were performed by J.B.; A.M. supervised the research project and contributed to the data interpretation, discussion and conclusions.
Funding
This research received no external funding.
Conflicts of Interest
The authors declare no conflict of interest.
References
- Esteban, M.D.; Couñago, B.; López-Gutiérrez, J.S.; Negro, V.; Vellisco, F. Gravity based support structures for offshore wind turbine generators: Review of the installation process. Ocean Eng. 2015, 110, 281–291. [Google Scholar] [CrossRef]
- Kadam, S.; Joshi, S.G. Nominal Diameter, Clamp Length and Thread Pitch Analysis for Bolt Preload Augmentation. Int. J. Mech. Eng. Technol. 2013, 4, 141–151. [Google Scholar]
- Offshore Standard DNV-OS-J101. Design of Offshore Wind Turbine Structures; Det Norske Veritas: Høvik, Norway, 2004. [Google Scholar]
- Bickford, J.H. Introduction to the Design and Behavior of Bolted Joint: Non-gasketed Joints; CRC Press: Boca Raton, MA, USA, 2008. [Google Scholar]
- Kulak, G.L.; Fisher, J.W.; Struik, J.H.A. Guide to Design Criteria for Bolted & Riveted Joints; American Institute of Steel Construction, Inc.: Chicago, IL, USA, 2001. [Google Scholar]
- Bibel, G.D.; Ezell, R.M. Bolted Flange Assembly: Preliminary Elastic Interaction Data and Improved Bolt-Up Procedures. Weld. Res. Counc. Bull. 1996, 408, 1–27. [Google Scholar]
- Bibel, G.D.; Eric, M.W. Flange Bolt-Up Simulation Using 3-D Finite Element Modeling. In Proceedings of the ASME Pressure Vessels and Piping Conference, Cleveland, OH, USA, 20–24 July 1994; pp. 9–16. [Google Scholar]
- Nassar, S.A.; Wu, Z.; Yang, X. Achieving Uniform Clamp Load in Gasketed Bolted Joints Using a Nonlinear Finite Element Model. J. Press. Vessel Technol. 2010, 132. [Google Scholar] [CrossRef]
- Zhu, L.; Bouzid, A.-H.; Hong, J.; Zhang, Z. Elastic Interaction in Bolted Flange Joints: An Analytical Model to Predict and Optimize Bolt Load. J. Press. Vessel Technol. 2018, 140. [Google Scholar] [CrossRef]
- Abid, M.; Hussain, S. Bolt preload scatter and relaxation behaviour during tightening a 4 in-900# flange joint with spiral wound gasket. Proc. Inst. Mech. Eng. Part E J. Process Mech. Eng. 2008, 222, 123–134. [Google Scholar]
- Cost Reduction Monitoring Framework 2016-Summary Report to the Offshore Wind Programme Board; ORE Catapult: Glasgow, UK, 2016.
- Rademakers, L.; Braam, H.; Verbruggen, T.W. R&D needs for O&M of wind turbines; ecn nl: Petten, The Netherlands, 2003. [Google Scholar]
- Röckmann, C.; Lagerveld, S.; Stavenuiter, J. Operation and Maintenance Costs of Offshore Wind Farms and Potential Multi-use Platforms in the Dutch North Sea. In Aquaculture Perspective of Multi-Use Sites in the Open Ocean: The Untapped Potential for Marine Resources in the Anthropocene; Buck, B.H., Langan, R., Eds.; Springer International Publishing: Cham, Switzerland, 2017; pp. 97–113. [Google Scholar]
- Carroll, J.; McDonald, A.; McMillan, D. Failure rate, repair time and unscheduled O&M cost analysis of offshore wind turbines. Wind Energy 2016, 19, 1107–1119. [Google Scholar]
- Hill, H.N. Determination of Stress-Strain Relations from ‘OFFSET’ Yield Strength Values; NASA Technology Ubrary: Washington, DC, USA, 1945.
- Madsen, C.A.; Kragh-Poulsen, J.C.; Thage, K.J.; Andreassen, M.J. Analytical and numerical investigation of bolted steel ring flange connection for offshore wind monopile foundations. IOP Conf. Ser. Mater. Sci. Eng. 2017, 276, 16. [Google Scholar] [CrossRef]
- Simulia, D.S. ABAQUS 6.13 Documentation. Vol. III; Simulia: Providence, RI, USA, 2015. [Google Scholar]
- TENTEC. Tentec Bolt Load Instruction Document; Tentec: West Bromwich, UK, 2016. [Google Scholar]
- Flange Bolt Torque Sequence and Torque Table-A Complete Bolt Tightening Procedure. Available online: https://hardhatengineer.com/flange-bolt-torque-sequence-table/ (accessed on 14 November 2019).
- Coria, I.; Martín, I.; Bouzid, A.H.; Heras, I.; Aguirrebeitia, J. Optimized bolt tightening sequences in bolted joints using superelement FE modeling technique. In Proceedings of the 37th International Conference Ocean Offshore and Arctic Engineering, Madrid, Spain, 17–22 June 2018; pp. 1–7. [Google Scholar]
- Abid, M.; Khan, Y.M. The effect of bolt tightening methods and sequence on the performance of gasketed bolted flange joint assembly. Struct. Eng. Mech. 2013, 46, 843–852. [Google Scholar] [CrossRef]
- Wang, Y.-Q.; Wu, J.-K.; Liu, H.-B.; Xu, S.-T. Modeling and numberical analysis of multi-bolt elastic interaction with bolt stress relaxation. J. Mech. Eng. Sci. 2015, 203. [Google Scholar] [CrossRef]
- Wang, Y.-Q.; Wu, J.-K.; Liu, H.-B.; Kuang, K.; Cui, X.-W.; Han, L.-S. Analysis of elastic interaction stiffness and its effect on bolt preloading. Int. J. Mech. Sci. 2017, 130, 307–314. [Google Scholar] [CrossRef]
- Abasolo, M.; Aguirrebeitia, J.; Aviles, R.; Fernandez de Bustos, I. A Tetraparametric Metamodel for the Analysis and Design of Bolting Sequences for Wind Generator Flanges. J. Press. Vessel Technol. 2011, 133. [Google Scholar] [CrossRef]
© 2019 by the authors. Licensee MDPI, Basel, Switzerland. This article is an open access article distributed under the terms and conditions of the Creative Commons Attribution (CC BY) license (http://creativecommons.org/licenses/by/4.0/).