Article

Modelling the Ammoniation of Barium Chloride for Chemical Heat Transformations

School of Engineering, University of Warwick, Coventry CV4 7AL, UK
*
Author to whom correspondence should be addressed.
Energies 2019, 12(23), 4404; https://doi.org/10.3390/en12234404
Submission received: 18 October 2019 / Revised: 15 November 2019 / Accepted: 18 November 2019 / Published: 20 November 2019

Abstract

:
The coupling of reversible ammoniation reactions between two salts presents a method for the exploitation of low grade waste heat. This resorption configuration can be used for thermal transformation or heat pumping, to recover waste heat to primary producers, or for integration in heat networks. To understand the solid/gas reaction behaviour and to model its kinetics, Large Temperature Jump (LTJ) experiments were performed on a composite of barium chloride in an expanded natural graphite (ENG) matrix. A model has been built using a semi-empirical equation from the literature, which has been validated with the LTJ results. The results suggest the semi-empirical model provides a reasonable prediction for solid/gas reactions once the constants have been identified. Enhancing the model to handle sequential phase change reactions will enable a wide number of salts to be modelled, making the design of a resorption system practicable.

Graphical Abstract

1. Introduction

Halide salts reacting with ammonia are an attractive prospect for the purpose of heat pumping and transforming. The reversible reaction may present a comparatively inexpensive alternative to existing absorption systems, particularly in a simple resorption system, which avoids evaporator and condenser components. Existing absorptive systems on the market, such as ammonia-water gas fired heat pumps, are not widely adopted due to high costs. Future physical adsorption systems (e.g., carbon-ammonia or zeolite-water) may become more affordable, but chemisorption systems (e.g., resorption with ammonia—metal halides) produce more heat per kg adsorbed refrigerant and have potentially higher Coefficient of Performance (COP).
Barium chloride presents a reasonable starting point for understanding the kinetics of the halide reactions with its single phase change and low temperature reaction conditions. The salt was impregnated within expanded natural graphite (ENG) in order to address conductivity issues, swelling, or agglomeration. The composite material exhibits the characteristics favoured for a chemisorption machine.
To test the material, it was necessary to perform experiments following the Large Temperature Jump (LTJ) method. LTJ experiments provide a simple technique for testing sorption heat cycles under typical operating conditions and are well documented [1,2,3,4]. In typical sorption operation, the change in temperature of the heat exchanger in thermal contact with the adsorbent bed initiates the adsorption and desorption reactions [3]. Therefore, an LTJ test piece comprised of a typical section of heat exchanger containing a small sample of adsorbent will emulate the performance of a working resorption bed or adsorption generator. The rapid heating and cooling of the sample, while recreating the actual reaction conditions, also presents a simple case to model the rate-limiting phenomena of heat transfer and reaction dynamics. A semi-empirical kinetic model presented by Mazet et al. [5] enabled a simulation model to be written using the temperature rise of the heat exchanger (LTJ) wall as the driving force. The results were then compared to the real experimental data, considering the reaction rate and evolution of the conditions. The large temperature jump reactor designed for this experiment can be seen in Figure 1.

2. Materials and Methods

2.1. Sample Preparation

The reactive material was comprised of halide salts impregnated within a conductive matrix of expanded natural graphite (ENG). The disks from each sample were cut from SGL Sigratherm board L10/1500, with a density of 1500 g/m3. The 10 mm thick board was cut using a water jet cutter into disks of 10.8 mm to fit into half-inch stainless steel tubes (of 10.8 mm bore). A 1 mm hole was drilled in the centre to receive a stainless steel sheathed thermocouple. The disks were weighed and then held submerged in a barium chloride solution, the strength of which determined the disk uptake. The containers with the submerged samples were then evacuated using a vacuum pump. They were left under vacuum for 24 h before removal and then dried in an oven at 200 °C for an hour to remove all moisture [6,7]. The uptake of salt was measured; 4.5 g of anhydrous barium chloride in 25 mL of water gave an uptake of 0.23 g of salt in 5 disks of 0.642 g ENG in total. In another case, 4.5 g in 25 mL gave 0.294 g in 5 disks with a total mass of 0.632. A higher uptake was produced with 9.38 g added to 25 mL where the 5 disks had an uptake of 0.759 g in a total of 0.67 g ENG.

2.2. Large Temperature Jump Apparatus

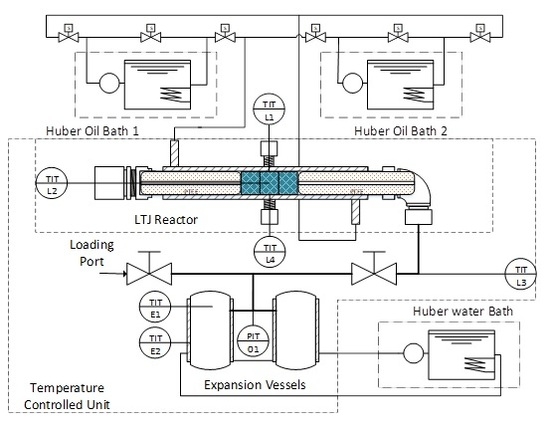
The reactor design can be seen in Figure 1. The main component is a reaction vessel that holds the reactive samples; this was comprised of a one-inch stainless steel tube welded around a half-inch tube with cuffs to form a jacket. The half-inch tube is 15 cm in length and the outer 12 cm. The design is to ensure a uniform flow of oil (little velocity variation around the circumference) through the jacket delivering heat to the reactor contents. Swagelok face seal fittings were used to connect to further pipework, to ensure the rig could be removed and replaced easily.
Thermocouples (seen as temperature transmitters in Figure 2) measure temperatures of the LTJ wall, the centre of the salt sample, the expansion vessel temperature, and expansion vessel wall temperature. These are connected to an Omega data acquisition device (OMB-DAQ-2408-2AO) and LabVIEW program to collect data and to monitor and control the operation. The valves are switched to alternate the bath feeding the rig. The rapid change in oil temperature feeding the reactor causes the temperature jump effect. The entire rig is shown in Figure 2. To reduce the gas volume within the reactor vessel, PTFE (Polytetrafluoroethylene) cylinders were placed to hold the samples in the middle. They were drilled with a 1.2 mm centre hole to ensure gas transport (right hand side) in Figure 2. Or access for the central thermocouple (Left hand side in Figure 2). The rig was evacuated and then loaded to a set ammonia pressure in the expansion vessels with the LTJ reactor isolated so that the mass of ammonia in the system could be calculated. For each different nominal pressure tests, the cell was again evacuated so that the total mass of ammonia in the system was known. In operation, the baths were set to temperatures away from the phase change, based on the data presented by Neveu and Castaing [8]. The reactions were carried out at a number of pressures and for the different samples with different masses of salt.

2.3. Reaction Model

A model was built and written into MATLAB to simulate the behaviour of the composite during the process; the kinetic equation component is from work by Mazet, Amouroux, and Spinner [1,9] and Lebrun and Spinner [10]. The function is shown in Equation (1).
d x d t = ( 1 x ) m A r ( P P e P )
l n ( P e ) = Δ H R T + Δ S R
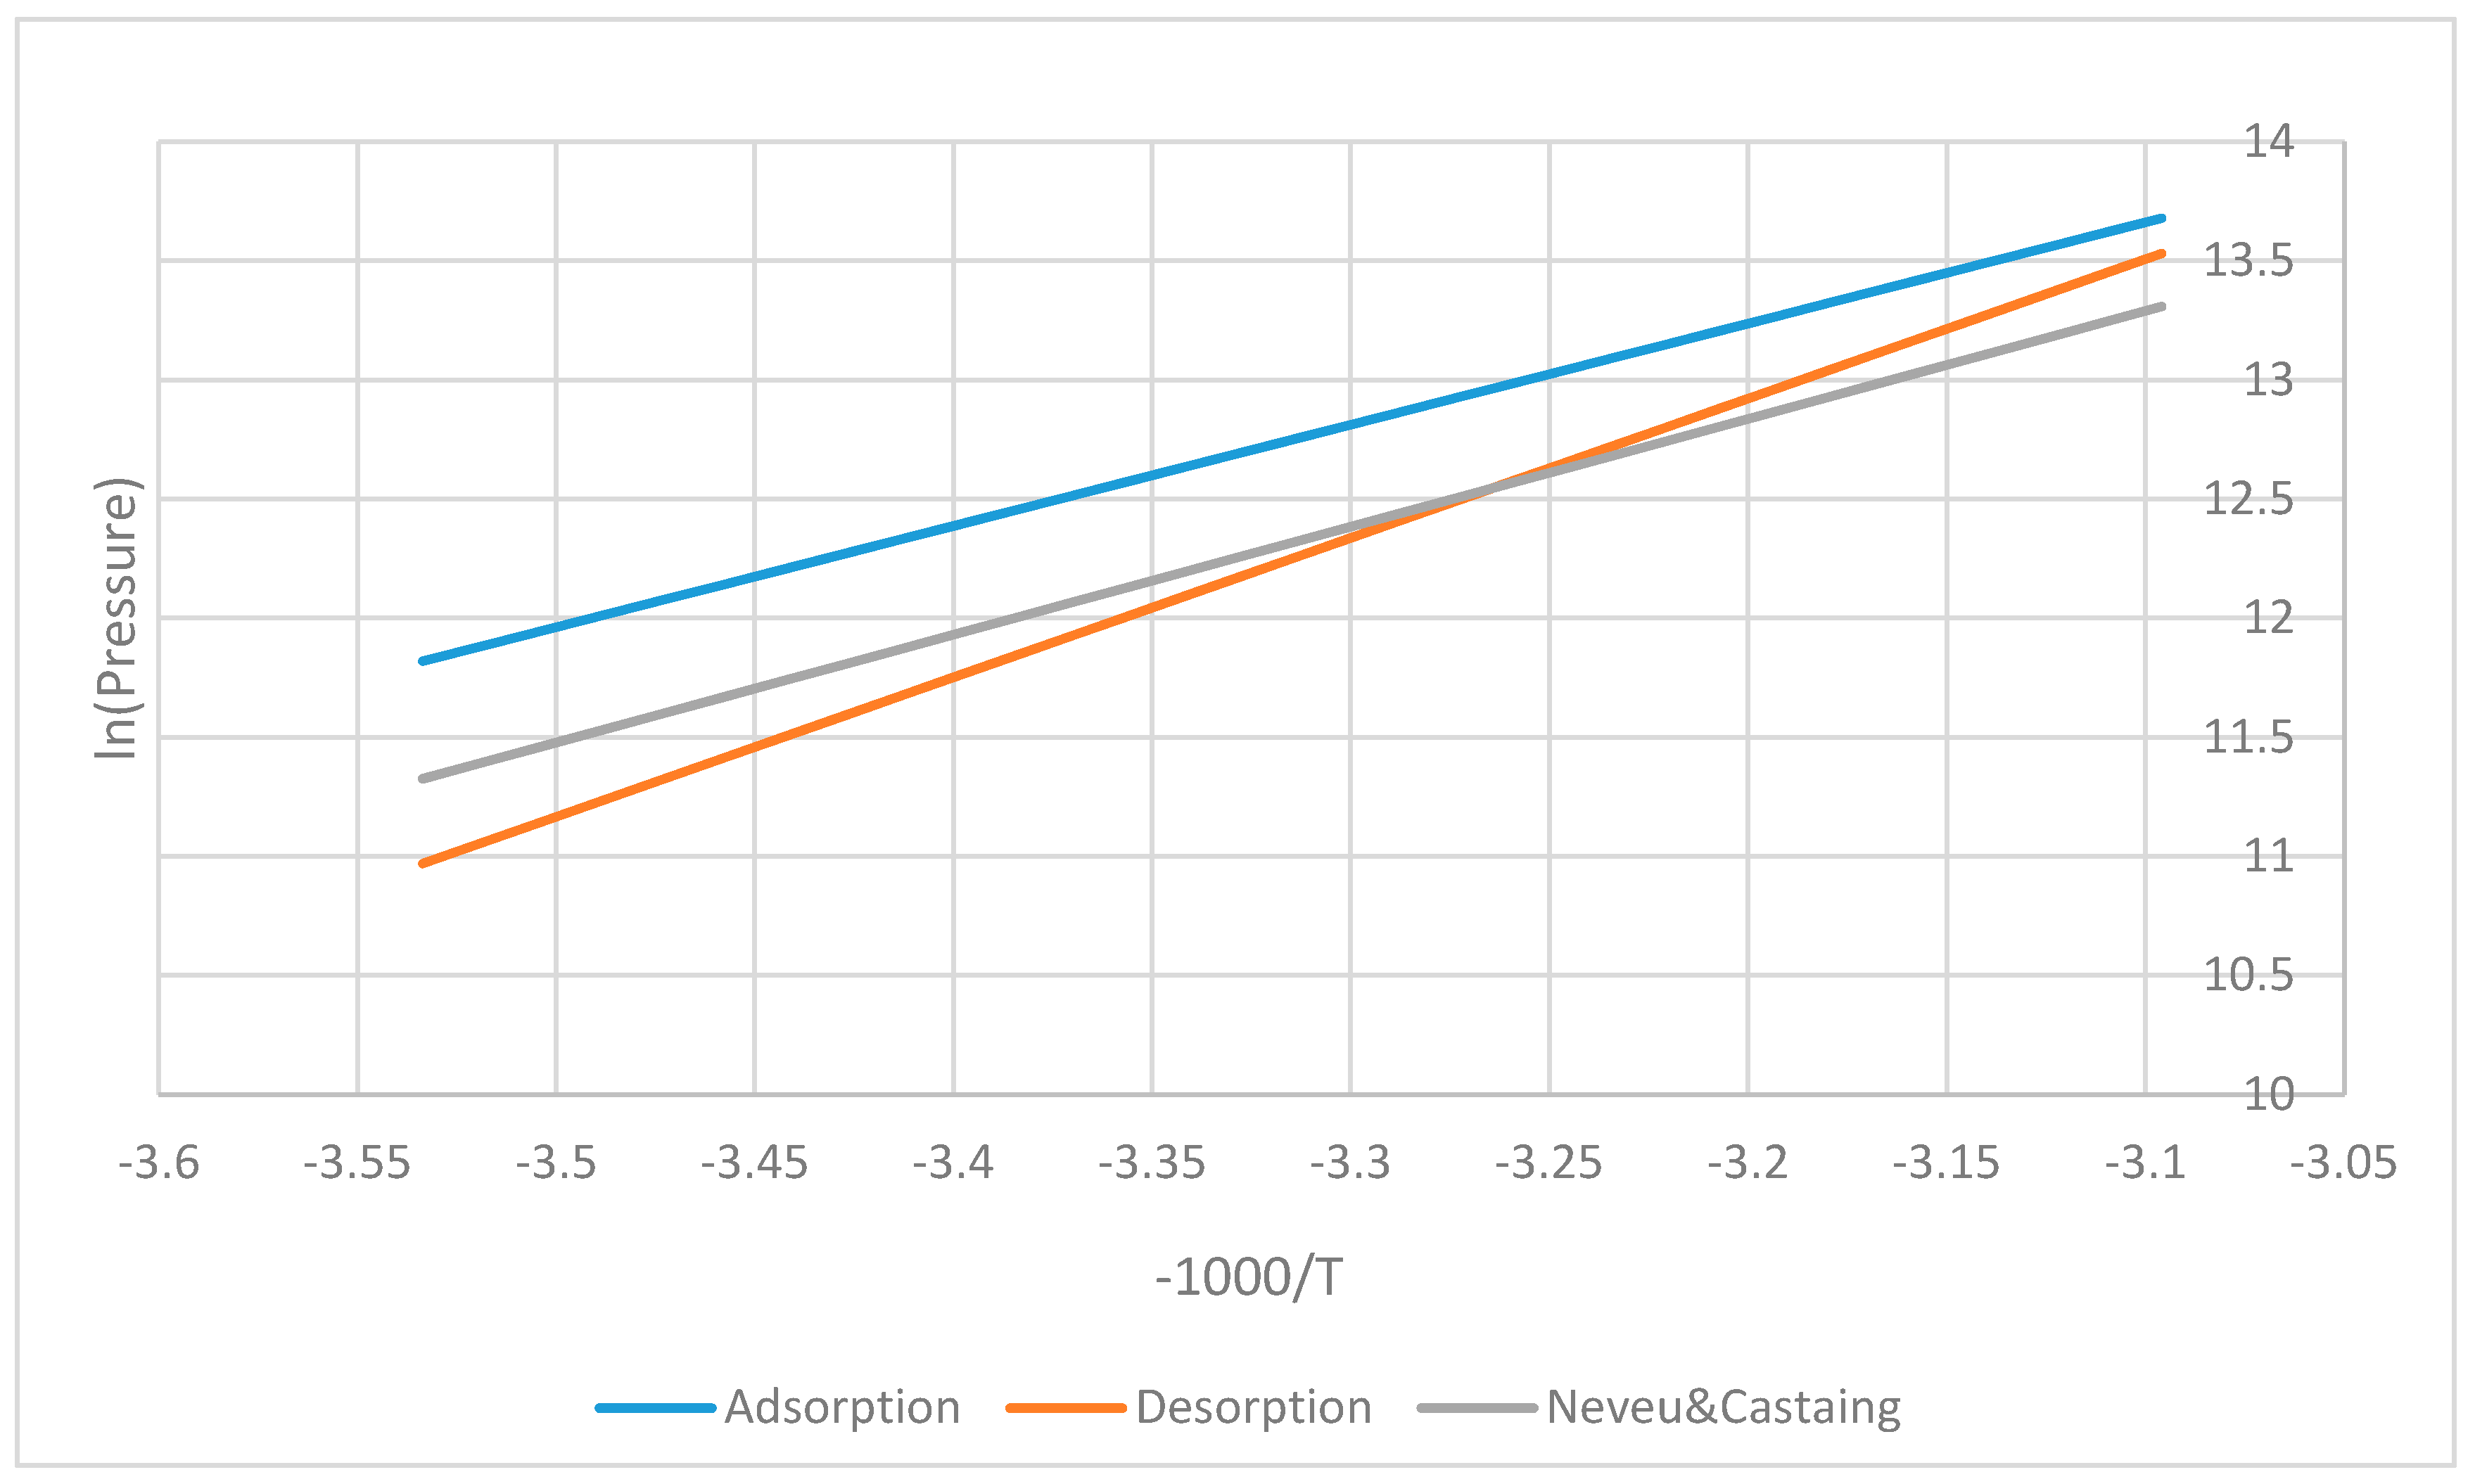
The function describes the rate of reaction dx/dt and is the same for both adsorption and desorption reactions, but these must be handled separately. The term x represents the degree of conversion, which is defined by x = 0 at t = 0 and x = 1 at t = ∞. Pseudo constants to be calculated are m and Ar; m represents the order of the reaction, and Ar is a function of Arhenius’ law accounting for the activation energy. P is the pressure, and Pe the equilibrium pressure. The equilibrium pressure is calculated from the Clapeyron relationship, Equation (2) where Δ H is the reaction enthalpy change in J mol−1, ΔS is the reaction entropy change in J mol−1 K−1, and R is the universal gas constant in J mol−1 K−1.
To adapt the kinetic equation to a reaction model, a finite element model was written discretising the reactive sample across one dimension (radial). Each element was simulated as a lumped parameter model with heat flow in and out and an enthalpy generated from the reaction. Experimental results provided the temperature of the wall, which is in contact with the first element.
If an equal pressure rise in a small timestep is assumed for all the elements, then knowing the quantity of heat flow in or out of each, plus the assumed kinetic equation allows the change in temperature and mass of adsorbed or desorbed ammonia to be calculated. These, in turn, allow the total mass of ammonia in the whole system, which should be constant, to be calculated. Iteration of the value of the pressure rise to ensure the ammonia mass balance gives the new conditions for the next timestep. The mass balance equation takes account of factors such as gas voids within the cell and the changing volume of ammoniate present. The heat transfer resistance to the first element is modelled as a gas gap, the size of which was calculated by carrying out a temperature jump with no phase change and fitting the predicted temperature curve to the recorded centre temperature. The mathematic model was written in MATLAB (Appendix B).
Equilibrium lines (Equation (2)) from the literature or from our own measurements of a composite sample in a magnetic suspension balance were not necessarily valid in the LTJ, as discussed below. New equilibrium lines were calculated from the LTJ results, so the conditions of the reaction initiation were known before using trial and error to find the constants in the kinetic equation (Equation (1)). With the correct equilibrium line and constants, the model could then predict the temperature of the salt sample as the phase change occurs. This was repeated for the different LTJ tests.

3. Results and Discussion

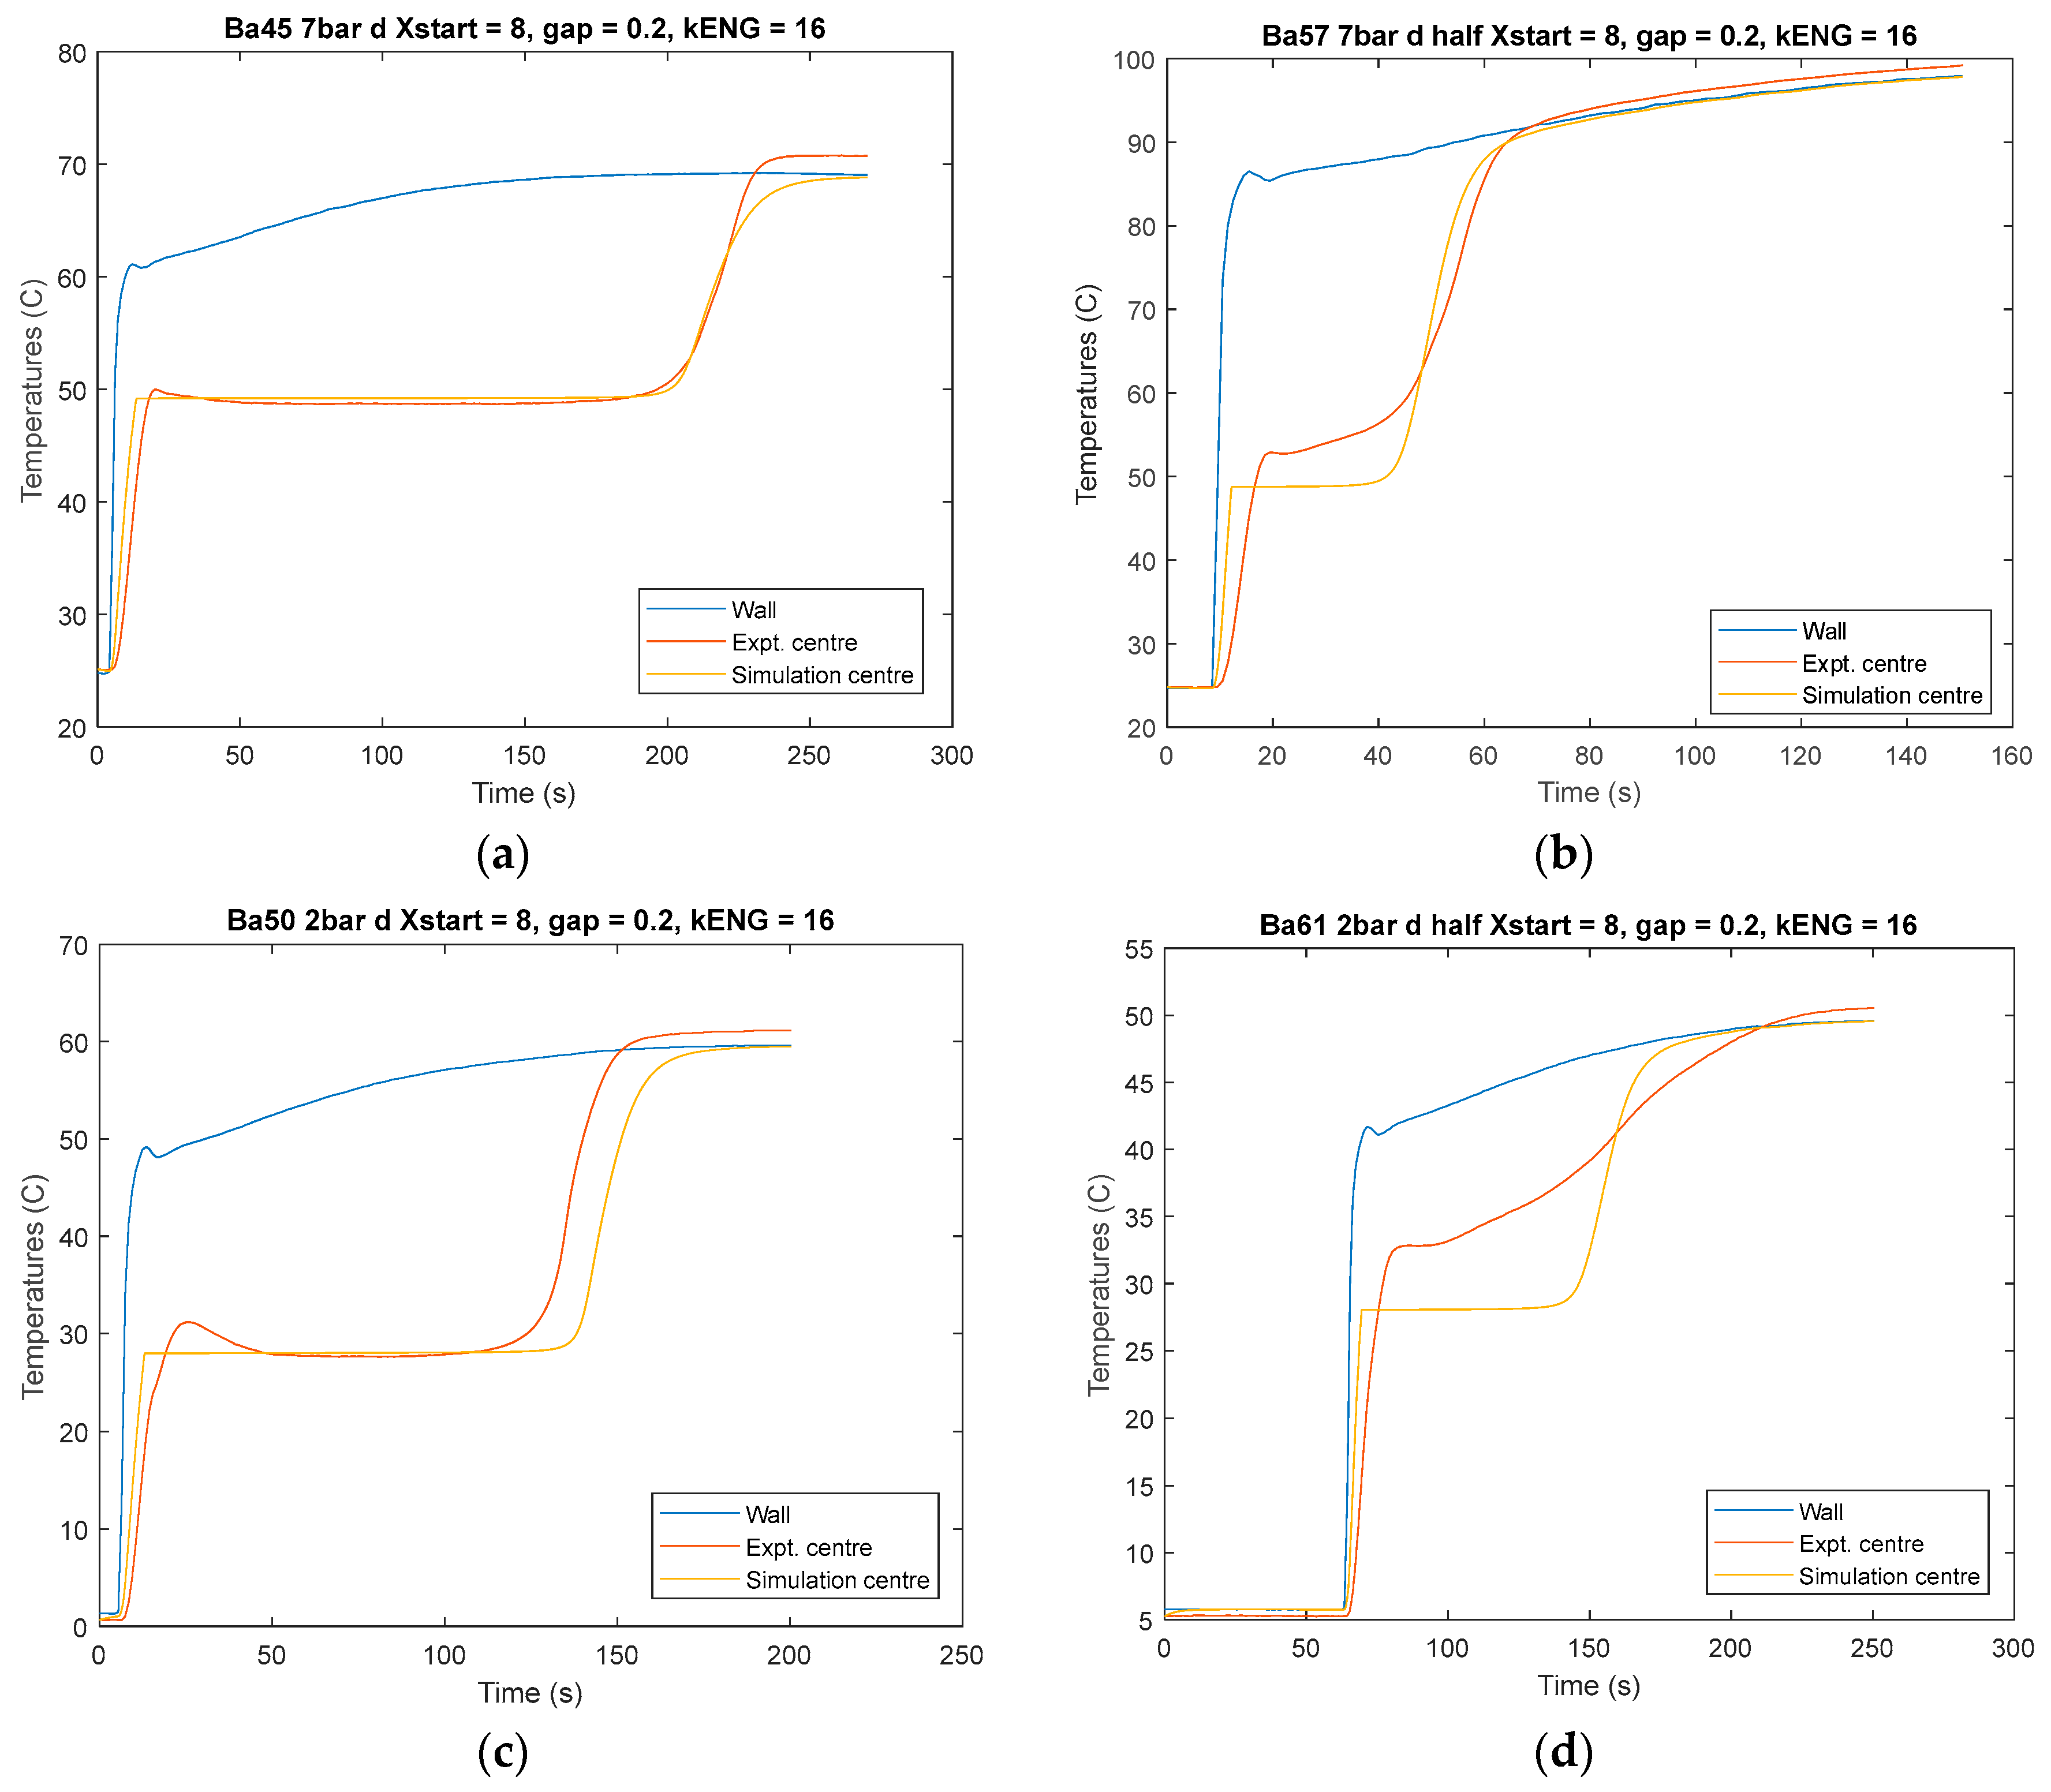
A number of tests were performed on the samples with differing amounts of salt. During a desorption–adsorption cycle, it was noted that the temperature of the sample was often found to exceed the point at which the phase change occurs, before quickly going back and settling at the temperature of the reaction. This was found in all cases of desorption and in some cases of adsorption. This is further evidence as to why an LTJ experiment is the best way to test sorption materials; alternative methods do not collect enough data during the transient reaction process, and supersaturation-like effects will not be observed by the use of other techniques. Specifically, a slow ‘equilibrium’ measurement using, for example, a magnetic suspension balance, may pick out the non-equilibrium temperature peak at the onset of reaction rather than the temperature that exists during the overwhelming bulk of the reaction.

3.1. Equilibrium Data

With the reaction data, it was possible to get an array of data points at which the reaction occurs. For the desorption reaction (susceptible to exceeding the equilibrium point), the value was taken after any spike at the plateau.
Notably, the adsorption points all occurred on the same line, as shown in Figure 3. The desorption plots were more scattered, with each of the three different salt concentration samples having slightly different adsorption equilibria. A new equilibrium line based on the Clapeyron equation can be calculated using Equation (2). The result can be seen in Figure 4. The fact that the calculated lines presented would ultimately cross suggests that these relationships are not really linear but present a reasonable approach for the model simulation. The calculated enthalpy and entropy values are 35,340 (J/mol) and 223 (J/molK) for adsorption, respectively, and 48,670 (J/mol) and 263 (J/molK) for desorption, respectively.

3.2. LTJ and Modelling Results

Once the heat transfer and equilibrium properties were established, trial and error was used to find the constants m and Ar from Equation (1). The desorption and adsorption reactions were treated separately and had different constants. The findings show that the kinetic model was reasonably accurate at predicting the rate of reaction over a number of different conditions for samples with different mass fractions of salt.
The experimental and simulated results are shown in Figure 5 and Figure 6. One can observe the previously described non-equilibrium temperature peaks (desorption) and troughs (adsorption) in the experimental results. In desorption, the wall temperature can be seen to rise, showing the temperature jump and the driving force for the reaction. There is some divergence between results, but what gives particular confidence is the ability of the model to predict the absorption reaction, which is slower and will likely be the rate-limiting effect in a resorption system. Furthermore, it is significant that the overall cycle times are so short, often less than 15 min. For all desorption tests, the values for the constants m and Ar that gave the best fit were 2 and 3.5, respectively, suggesting a second order reaction. Adsorption reactions m and Ar were found to be 1 and 0.1, respectively.
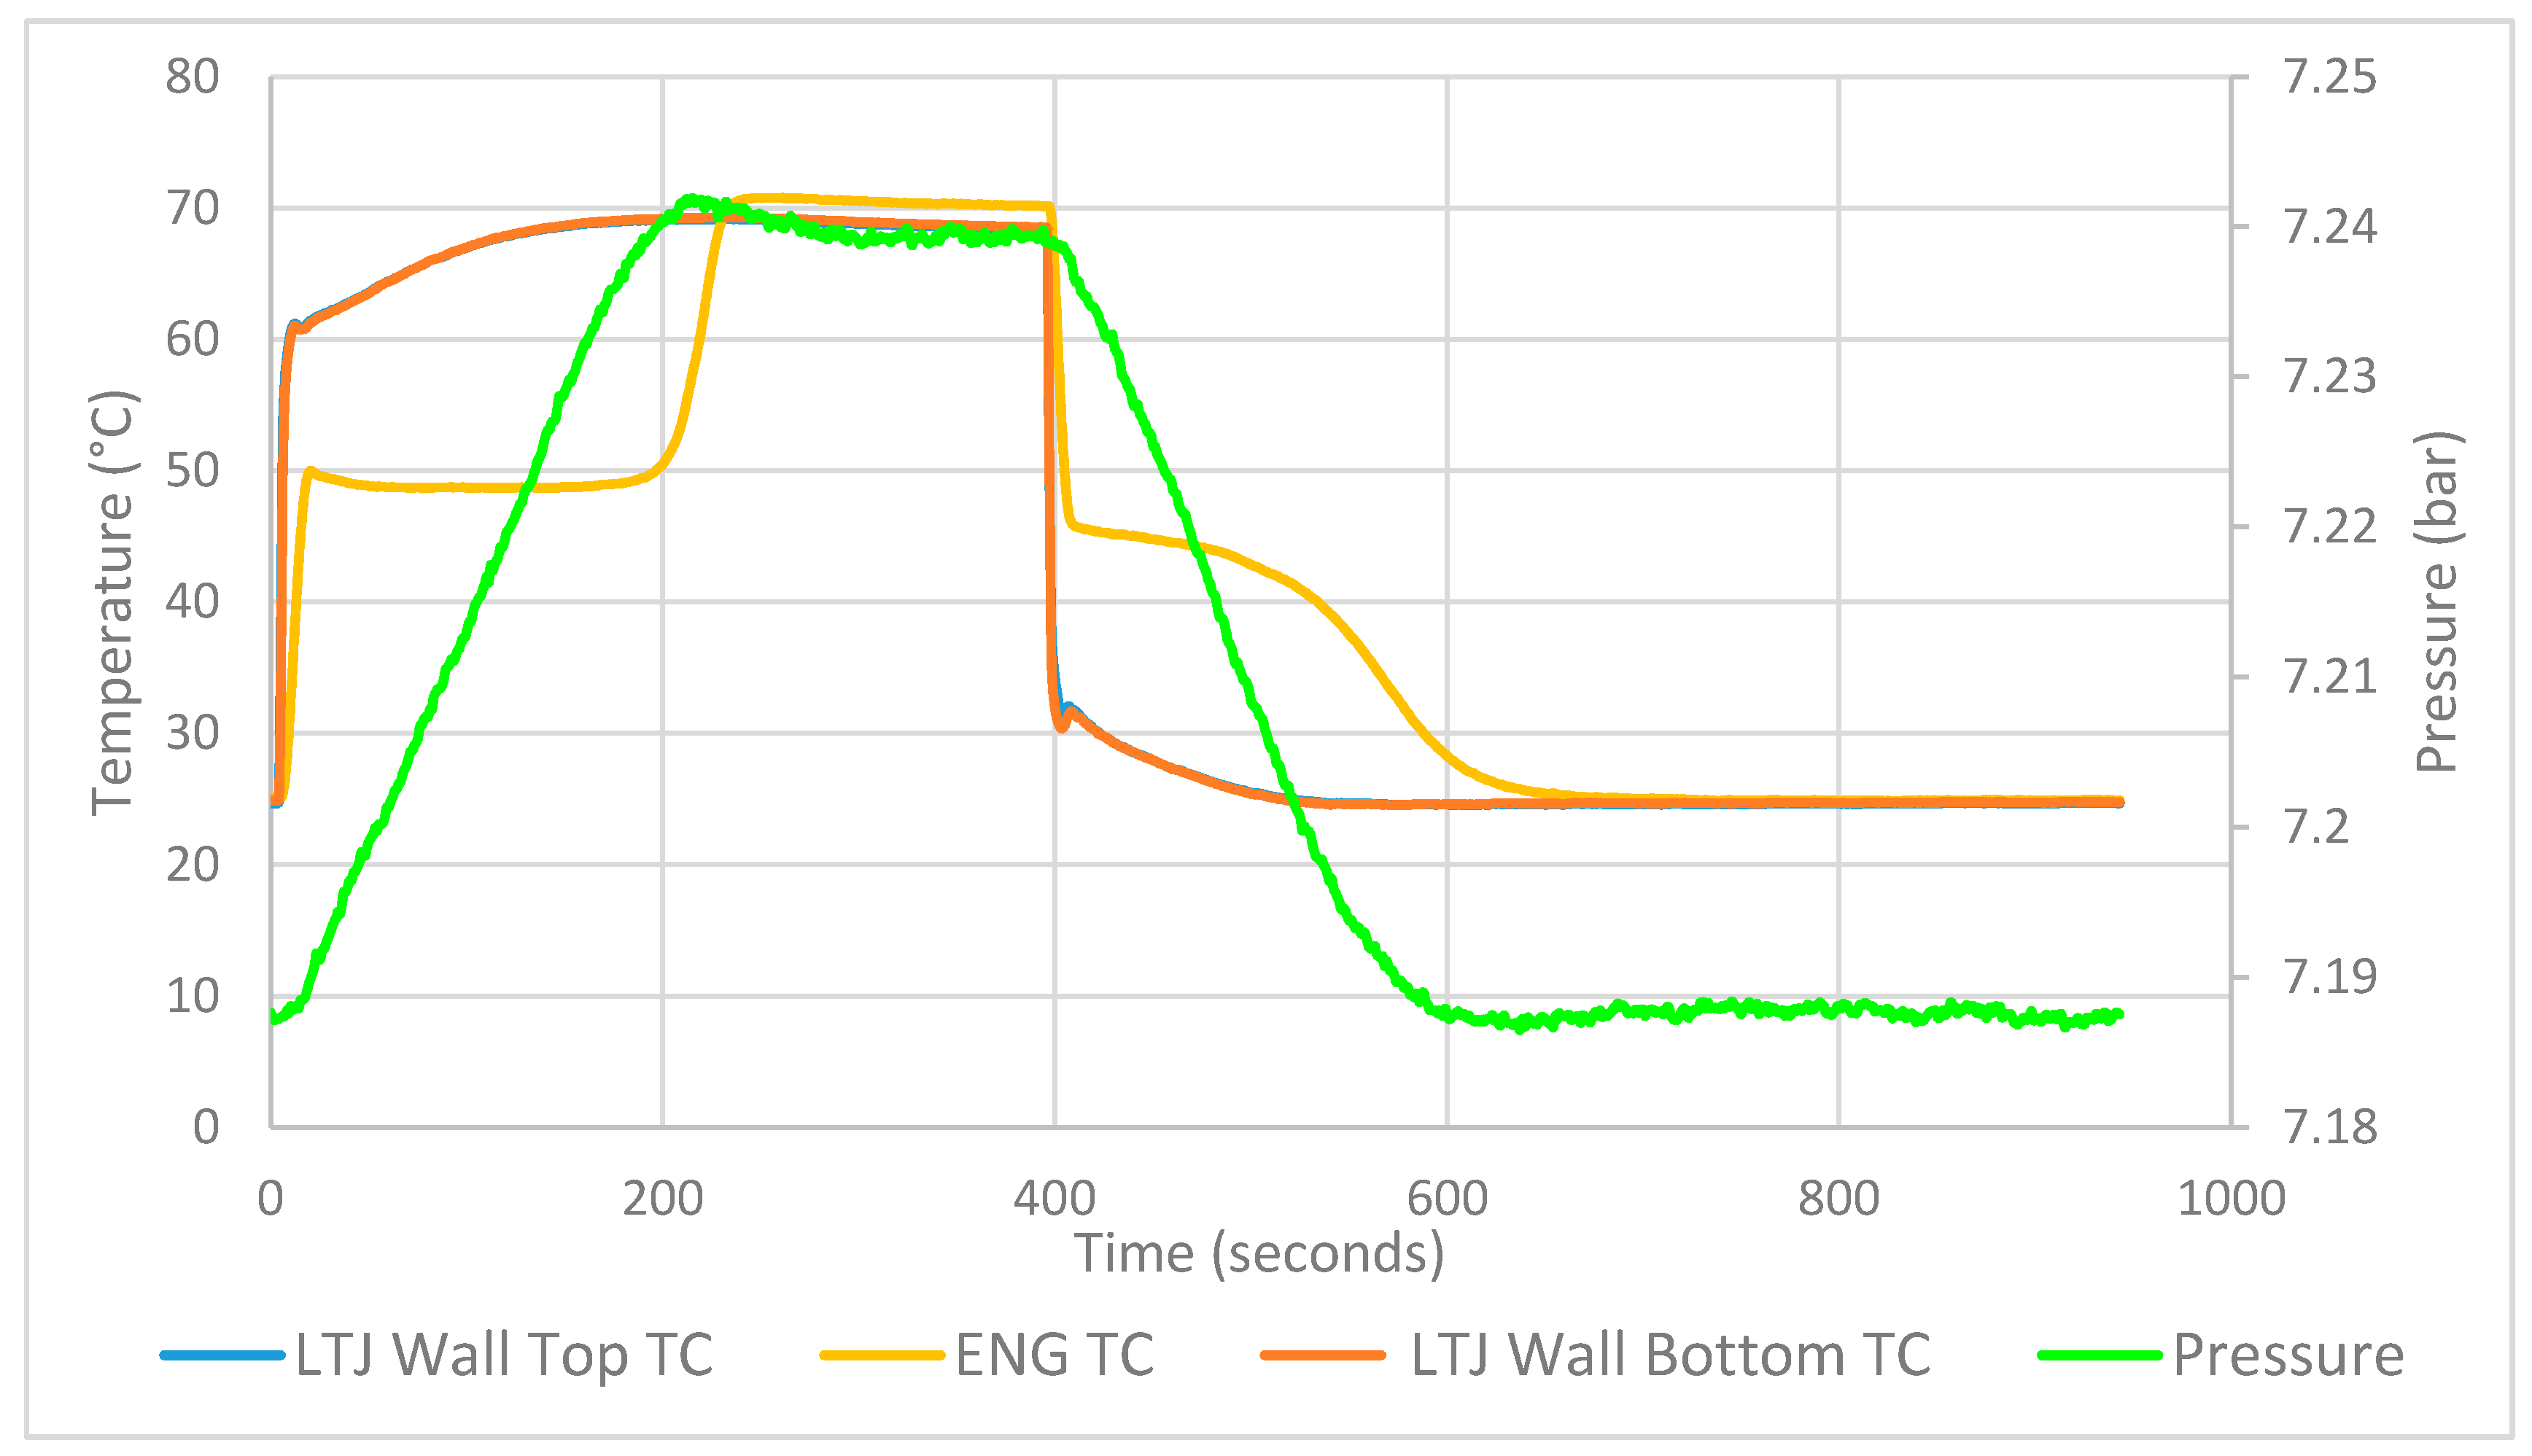
The results shown in Figure 5 and Figure 6 show that the semi-empirical model provides a reasonable prediction for solid–gas reactions, predicting the reaction quantity and rate for the range of conditions tested (between two and eight bar). At room temperature, above eight bar ammonia is at danger of condensing and below two bar is outside the expected working conditions, and mass transfer effects begin to effect below this. This is particularly important as evidence suggests that in these composite samples, the reaction is heat-transfer limited rather than chemical-reaction-rate limited. This can be seen in Appendix A, where the pressure change during the reaction can be observed as linear, suggesting there is no diminishment in rate due to a change in concentration of ammoniate.
These results will enable the design of a prototype transformer to show the potential for waste heat recovery. Further research will explore the more detailed behaviour of the material. Figure 5d shows the divergence between the predicted and experimental centre temperature. However, the predicted pressure (not shown) and, hence, the desorption rate remains a satisfactory match. This is the greatest disparity occurring at extreme reaction conditions (low pressure and salt concentration) outside the range of anticipated use. Further adjustment of parameters may reduce this, but the values of the derived constants m and Ar suggest a first and second order reaction as might be expected and should be applicable to the design of full-scale reactors. Future research should consider the chemistry of the composite material and aim to understand the causes of the meta state and reaction initiation, as well as hysteresis and differing equilibrium lines. Future work will look at other salts that will be paired with barium chloride for resorption machines and can consider different kinetic models.

4. Conclusions

LTJ test results on barium chloride impregnated into a conductive matrix, showed promise for real resorption systems with favourable short cycle times. Modelling the behaviour with a semi-empirical model presented by Mazet et al. was successful in predicting the chemical dynamics over multiple test samples and a range of pressures and temperatures. The results provide enough evidence and knowledge to produce a detailed design for a resorption bed or adsorption generator. Previously recorded equilibrium lines were found to be not appropriate in the dynamic situation, but more experimentation is required. Partly due to the observation of a meta state in both desorption and adsorption, an initial temperature rise or fall beyond the equilibrium level is observed before the reaction commences returning to phase change temperatures. With more tests on other salts and the expansion of the simulation model, a design of a resorption system will proceed.

Author Contributions

Conceptualization, R.E.C. and S.H.; methodology, R.E.C. and S.H.; software, R.E.C. and S.H.; validation, R.E.C., and S.H.; formal analysis, S.H.; investigation, S.H.; resources, R.E.C.; data curation, S.H.; writing—original draft preparation, S.H.; writing—review and editing, R.E.C. and S.H; visualization, S.H.; supervision, R.E.C.; project administration, S.H.; funding acquisition, R.E.C.

Funding

This research was funded by the TNO project ‘EASIER’ and EPSRC studentship in conjunction with the Energy Research Accelerator funded by InnovateUK.

Acknowledgments

We thank Charles Joyce of the University of Warwick for assistance in producing the materials for the experiment and his insightful knowledge of workshop processes, and also other members of the STET department at Warwick for much advice when discussing the experiment.

Conflicts of Interest

The authors declare no conflict of interest.

Appendix A

Figure A1. Raw results from the LTJ experiment, TC stands for thermocouple. Both LTJ wall thermocouples can be seen to show the same results, which shows effective design.
Energies 12 04404 g0a1

Appendix B. LTJ Matlab Code

Equation=1; % Chose rate equation as below:
% 1: madsnew(n)=mads(n)-dt*msalt(n)*((x(n)-xinitial)^yads)*Aads*(1.-peq/p)
% 2: madsnew(n)=mads(n)-dt*msalt(n)*((x(n)-xinitial)^yadsln)*C1ads*...
   %exp(-Ea/R0/T)*log(p/peq)
dt=0.01;   % Time step (s) for simulatiom If N=3 use 0.02
R0=8314;   % Universal Gas Constant J/kmol K
RNH3=R0/17;  % Approximate ammonia gas constant J/kg K
Cpgas = 2760; % Specific heat Cp of ammonia gas (mean) J/kg K
Cvgas =Cpgas-RNH3; % Specific heat Cv of ammonia gas (mean) J/kg K
Cpads=3120;  % Specific heat of ammoniate J/kmol NH3 ***kg???
CpENG = 720;  % Specific heat of ENG J/kg K
rhoENG=195.9;  % Density of unfilled block of ENG kg/m^3
rhoads=817;  % Density of solid ammoniate - ammonia ice from Wiki kg/m^3
MWamm=17.03;  % MW ammonia
rhogra=2250;  % density of graphite kg/m^3 to get true volume
experiment = menu('choose experiment number', '44-52', '53-56', '57-62')
if experiment == 1
%%%% Data from EXP 44-52 salt mass and ENG initial multiplier to smooth curves
 MassSalt = 0.759e-3;
 MassSalt = MassSalt*0.47;
 MassENG = 0.67e-3;
end
if experiment == 2
%%%% Data from EXP 53-56 salt mass and ENG initial multiplier to smooth curves
  MassSalt = 0.23e-3;
  MassSalt = MassSalt*0.47;
  MassENG = 0.642e-3;
end
if experiment == 3
%%%% Data from EXP 53-56 salt mass and ENG initial multiplier to smooth curves
  MassSalt = 0.294e-3;
  MassSalt = MassSalt*0.47;
  MassENG = 0.632e-3;
end
% Input salt and reaction
saltname = menu('Choose Reaction', 'BaCl2', 'CaCl2(8-4)', 'CaCl2(4-2)')
if saltname==1 % All BaCl2 parameters below
  Cpsalt=361.2; % Specific heat of BaCl2 J/kg K (Nist 75.22 J/(mol K))
  rhosalt=3856; % Density of unammoniated salt kg/m^3 Wikipedia
  MWsalt=208.23;% MW of salt - BaCl2
  Xmax=8;% Max moles NH3 per mole salt assumed equal in all nodes
  Xmin=0;% Min moles NH3 per mole salt assumed equal in all nodes
  Xstart=8;  % value of X at time zero
  delHdes=48670.37e3; % Altered with LTJ results
  delSdes=263.17772e3; % Altered with LTJ results
  delSads=223.1352e3; % Altered with LTJ results  Pretty certain
  delHads=35338.96e3; % Altered with LTJ results  about ads results
      ydes=2;     % Dynamic parameter desorption Eq 1
      Ades=3.5;     % Dynamic parameter desorption Eq 1
      yads=0.2;     % Dynamic parameter adsorption Eq 1
      Aads=0.75;     % Dynamic parameter adsorption Eq 1
      yadsln=1;    % Dynamic parameter desorption Eq 2
      ydesln=1;    % Dynamic parameter desorption Eq 2
      C1ads=500;    % Dynamic parameter desorption Eq 2 (1/s)
      C1des=100;    % Dynamic parameter desorption Eq 2 (1/s)
      Eaads=25000;% Dynamic parameter ads Eq 2 (J/kmol K [as R0])
      Eades=25000;% Dynamic parameter des Eq 2 (J/kmol K [as R0])
else
  if saltname==2 % All CaCl2 8-4 parameters below
    Cpsalt=656.8; % Cp of CaCl2 J/kg K (Wikipedia 72.89 J/(mol K))
    rhosalt=2150; % Density of unammoniated salt kg/m^3 Wikipedia
    MWsalt=110.984;% MW CaCl2
    Xmax=8;% Max moles NH3 per mole salt assumed equal in all nodes
    Xmin=0;% Min moles NH3 per mole salt assumed equal in all nodes
    Xstart=8;  % value of X at time zero
    delHdes=41013000;% Reaction enthalpy J/mol for CaCl2 8-4
    delSdes=230300; % Reaction entropy change for CaCl2 8-4 J/molK
    delHads=41013000;% Reaction enthalpy J/mol for CaCl2 8-4
    delSads=230300; % Reaction entropy change for CaCl2 8-4 J/molK
      ydes=1.5;     % Dynamic parameter desorption Eq 1
      Ades=0.7;     % Dynamic parameter desorption Eq 1
      yads=1.5;     % Dynamic parameter adsorption Eq 1
      Aads=0.7;     % Dynamic parameter adsorption Eq 1
      yadsln=1;     % Dynamic parameter desorption Eq 2
      ydesln=1;     % Dynamic parameter desorption Eq 2
      C1ads=500;    % Dynamic parameter desorption Eq 2 (1/s)
      C1des=100;    % Dynamic parameter desorption Eq 2 (1/s)
      Eaads=25000;% Dynamic parameter ads Eq 2 (J/kmol K [as R0])
      Eades=25000;% Dynamic parameter des Eq 2 (J/kmol K [as R0])
  else
    if saltname==3% All CaCl2 8-4 parameters below
      Cpsalt=656.8; % Cp of CaCl2 J/kg K (Wikipedia 72.89 J/(mol K))
      rhosalt=2150; % Density of unammoniated salt kg/m^3 Wikipedia
      MWsalt=110.984;% MW CaCl2
      Xmax=4;% Max moles NH3 per mole salt assumed equal in all nodes
      Xmin=2;% Min moles NH3 per mole salt assumed equal in all nodes
      Xstart=2;   % value of X at time zero
      delHdes=42268000;% Reaction enthalpy J/mol for CaCl2 4-2
      delSdes=229920; % Reaction entropy change for CaCl2 4-2 J/molK
      delHads=42268000;% Reaction enthalpy J/mol for CaCl2 4-2
      delSads=229920; % Reaction entropy change for CaCl2 4-2 J/molK
      ydes=1.5;    % Dynamic parameter desorption Eq 1
      Ades=0.7;    % Dynamic parameter desorption Eq 1
      yads=1.5;    % Dynamic parameter adsorption Eq 1
      Aads=0.7;    % Dynamic parameter adsorption Eq 1
      yadsln=1;   % Dynamic parameter desorption Eq 2
      ydesln=1;   % Dynamic parameter desorption Eq 2
      C1ads=500;   % Dynamic parameter desorption Eq 2 (1/s)
      C1des=100;   % Dynamic parameter desorption Eq 2 (1/s)
      Eaads=25000;% Dynamic parameter ads Eq 2 (J/kmol K [as R0])
      Eades=25000;% Dynamic parameter des Eq 2 (J/kmol K [as R0])
    else
      'Incorrect salt entered';
    end
  end
end
Ve=11.423e-3;  % Volume of expansion vessel and pipework in m^3
massfracsalt = MassSalt/MassENG;
N=3;        % Number of nodes
Bore=0.01088;% LTJ tube bore (m)
TCbore = 1e-3; %tc hole
length=5*9.5e-3;    % Total axial length of samples (m)
VvoidLTJ=0;%2.7e-5;   %Void volume in LTJ tube (m^3)
hwall=5e5;  % Wall to ENG heat transfer coefficient
kammgas=0.024; % Conductivty of gas W/mK
gap=0.0002; % Wall ENG gap in m
hwall=kammgas/gap;
% CHECK Radial conductivity of ENG + SALT
kENG=16;
% ********** END OF PARAMETERS FOR TWEAKING ***********
% Input experimental data
filename = input('Enter filename (without .xls)' ,'s')
figname=filename + string(' Xstart = ')+num2str(Xstart)+...
  ", gap = "+num2str(gap*1000)+string(', kENG = ')+...
  num2str(kENG); % Figure titles
expt=xlsread(filename);
%Columns are t(s) Twall (C) Te (C) Tewall (C) Tcentre(C) p(bar)
% Convert to K and Pa
expt(:,2) = (expt(:,2)+expt(:,8))/2; % average wall temps
expt(:,2:5)=expt(:,2:5)+273; % Temperatures to K
expt(:,6)=expt(:,6)*1e5;  % Pressures to bar (Check guage is absolute)
toff=expt(1,1); % Time offset
expt(:,1)=expt(:,1)-toff; % Time column begins at zero.
datasize=size(expt);
rows=datasize(1); % Number of rows
tmax=floor(expt(rows,1)/dt)*dt;% Max time rounded to whole number of dt's
jmax=floor(expt(rows,1)/dt);
  % Rows in array to be used in simulation, start at dt, end tmax
tempoffe=-expt(1,4)+expt(1,3); % Offset to add to col 4 (Te)
expt(:,4)=expt(:,4)+tempoffe;
expt(:,6)=smooth(expt(:,6),20);
% 20 point moving average to smooth pressure data
expt(:,3)=smooth(expt(:,3),20); % smooth Te
expt(:,4)=smooth(expt(:,4),20); % smooth Tewall
dataarray=zeros(jmax,6);
for j=1:jmax; % Make data array from time dt to tmax
time=dt*j;
for ROW=1:rows-1
  if time>=expt(ROW,1)& time<=expt(ROW+1,1);
    row=ROW;
  end
end
% row is lower row for interpolation
fract=(time-expt(row,1))/(expt(row+1,1)-expt(row,1));
dataarray(j,1)=time;
dataarray(j,2)=expt(row,2)+fract*(expt(row+1,2)-expt(row,2));
dataarray(j,3)=expt(row,3)+fract*(expt(row+1,3)-expt(row,3));
dataarray(j,4)=expt(row,4)+fract*(expt(row+1,4)-expt(row,4));
dataarray(j,5)=expt(row,5)+fract*(expt(row+1,5)-expt(row,5));
dataarray(j,6)=expt(row,6)+fract*(expt(row+1,6)-expt(row,6));
end
xinitial=Xmax*MWamm/MWsalt; % Maximum kg ammonia / kg salt
xfinal=Xmin*MWamm/MWsalt;  % Minimum kg ammonia / kg salt
xstart=Xstart*MWamm/MWsalt;  % kg ammonia / kg salt at time zero
Tinitial=300; % initial temperature of all nodes in K
Tinitial=expt(1,5);
% Expansion vessel properties
pinitial=3e5; % Initial pressure in Pa
pinitial=expt(1,6);
Teinitial=300;% Initial temperature in K
Teinitial=expt(1,3);
Te=Teinitial;
meinitial=pinitial*Ve/Teinitial/ramms(pinitial/1e5,Teinitial-273);
meinitial=pinitial*Ve/Teinitial/RNH3;
       % Initial kg of NH3 in expansion vessel
me=meinitial;
%%% **********SET UP NODE VOLMES and UAs**************
T=ones(1,N)*Tinitial;
V=zeros(1,N);
for n=1:N
  r(n)=Bore/2*n/N;% Radius of element
  Aouter(n)=2*pi*r(n)*length; % Outer ht area of element (m^2)
  if n==1
    V(n)=0.5*pi*r(1)*r(1)*length;  % Volume of elements in m^3
  else V(n)=0.5*pi*r(n)*r(n)*length-0.5*pi*r(n-1)*r(n-1)*length;
  end
  if n==1
    rmean(n)=r(1)/sqrt(2);
    % Mean radius such that areas either side are equal (m)
  else rmean(n)=sqrt((r(n)*r(n)+r(n-1)*r(n-1))/2);
  end
end
Vtotnodes=sum(V);
% ************CALCULATE ALL UAs*************
if N==1
  UAouter(1)=2*pi*length/(1/hwall/r(1)+log(r(1)/rmean(1))/kENG);
  UAinner(1)=0;
else
for n=1:N-1
  UAouter(n)=2*pi*kENG*length/(log(rmean(n+1)/rmean(n)));
  if n==1
    UAinner(n)=0;
  else
    UAinner(n)=2*pi*kENG*length/(log(rmean(n)/rmean(n-1)));
  end
end
UAouter(N)=2*pi*length/(1/hwall/r(1)+log(r(1)/rmean(1))/kENG);
UAinner(N)=2*pi*kENG*length/(log(rmean(N)/rmean(N-1)));
end
% *********Calculate other parameters for elements******
for n=1:N
% mENG(n)=V(n)*rhoENG;
mENG(n) = MassENG/N;
msalt(n) = MassSalt/N;
% Mass of ENG in node(s)in kg. In general a 1-d array
% msalt(n)=massfracsalt*mENG(n); % Mass of salt in nodes (kg)
mads(n)=msalt(n)*xstart;  % Mass of adsorbate in nodes (kg)
x(n)=mads(n)/msalt(n); % Mass NH3/mass salt in nodes
MCp(n)=mENG(n)*CpENG+msalt(n)*Cpsalt;
          % Combined MCp for ENG and salt J/K
V0void(n)=(V(n)-mENG(n)/rhogra-msalt(n)/rhosalt);
          % Void volume m^3 with zero adsorbate
% add VvoidLTJ proportional to node volumes
V0void(n)=V0void(n)+VvoidLTJ*V(n)/Vtotnodes;
Vvoid(n)=V0void(n)-mads(n)/rhoads; % initial void volume in node n in m^3
mgas(n)=pinitial*Vvoid(n)/Tinitial/ramms(pinitial/1e5,Tinitial-273);
mgas(n)=pinitial*Vvoid(n)/Tinitial/RNH3;
          % Mass of gas in voids (kg)
T(n)=Tinitial;  % Temperature of node (K)
end% of unchanging node or initial properties
p=pinitial;
mgasinitial=sum(mgas); %Initial mass of gas (kg).
% Assumes xinitial salt volume
totgasinitial=mgasinitial+me; % Initial total mass of gas (kg)
% Set up result storage arrays
  mgasarray=zeros(N,ceil(tmax/dt));
  madsarray=zeros(N,ceil(tmax/dt));
  Tarray=zeros(N,ceil(tmax/dt));
  xarray=zeros(N,ceil(tmax/dt));
  Xarray=zeros(N,ceil(tmax/dt));
  parray=zeros(1,ceil(tmax/dt));
  mearray=zeros(1,ceil(tmax/dt));
  Tearray=zeros(1,ceil(tmax/dt));
  mtotarray=zeros(1,ceil(tmax/dt));
  xexptarray=zeros(1,ceil(tmax/dt));
index=0;      % Counter for time loop
for t=dt:dt:tmax;   % Time in seconds
index=index+1;
Twall=dataarray(index,2);   % Wall temperature (K)
%Calculate heat into nodes dQ (J)
if N==1
dQ=dt*UAouter(n)*(Twall-T(n));
else
  for n=1:N-1
    if n>1;
      dQ(n)=dt*(UAouter(n)*(T(n+1)-T(n))+UAinner(n)*(T(n-1)-T(n)));
    else
      dQ(n)=dt*UAouter(n)*(T(n+1)-T(n));
    end
  end
  dQ(N)=dt*UAouter(N)*(Twall-T(N));
end
dQwall=dt*UAouter(n)*(Twall-T(n));
%Joules into element
dQe=0.;    % Joules into vessel in time step.
pnew=fzero(@saltmasserrornew,p+1000);
%T
%Tnew
%stop
% fzero finds pnew such that saltmasserror.m returns a zero
% Store masses in arrays
for j=1:N
  mgasarray(j,index)=mgasnew(j);
  madsarray(j,index)=madsnew(j);
  Tarray(j,index)=Tnew(j);
  xarray(j,index)=madsnew(j)/msalt(j);
  Xarray(j,index)=xarray(j,index)*MWsalt/MWamm;
end
parray(1,index)=pnew;
peqadsarray(1,index)=peqads;
peqdesarray(1,index)=peqdes;
adsarray(1,index)=ads;
mearray(1,index)=menew;
mtotarray(1,index)=menew+sum(madsnew)+sum(mgasnew);
Tearray(1,index)=Tenew;
% Calculate experimental change in x
meexpt=dataarray(index,6)*Ve/RNH3/dataarray(index,3);
% pV/RT for experimental vessel gas mass
mgasexpt=dataarray(index,6)*sum(Vvoidnew)/RNH3/(dataarray(index,2)+...
  dataarray(index,5))*2;% Expt gas mass using calculated Vvoid, mean T
totgasexpt=meexpt+mgasexpt;
delgas=totgasexpt-totgasinitial;
delxexpt=-delgas/sum(msalt); % Change in x from start
xexptarray(1,index)=xstart+delxexpt;
%if xexptarray(1,index)<0;xexptarray(1,index)=0;end; %Remove negatives
% Estimated x based on initial value and gas mass
%Carry out mass balance
Oldmass=sum(mgas)+sum(mads)+me;
Newmass=sum(mgasnew)+sum(madsnew)+menew;
Masschange=1-Oldmass/Newmass;
% Carry out energy balance on elements
for n=1:N
ENGplusSALTheat(n)=MCp(n)*(Tnew(n)-T(n));
deltaUgas(n)=Cvgas*(mgasnew(n)*Tnew(n)-mgas(n)*T(n));
deltaUads(n)=madsnew(n)*(Cpgas*Tnew(n)-pnew/rhoads-delHdes/MWamm)-.../
  mads(n)*(Cpgas*T(n)-p/rhoads-delHdes/MWamm);
%Uadsnew=Cpgas*Tnew(n)-pnew/rhoads-delHdes/MWamm;
%Uads=Cpgas*T(n)-p/rhoads-delHdes/MWamm;
deltaH(n)=dmouthout(n);
end
sumheat=sum(ENGplusSALTheat+deltaUgas+deltaUads+deltaH);
ENGplusSALTheatarray(1,index)=sum(ENGplusSALTheat);
dQwall;
Heatfraction=(dQwall-sumheat)/dQwall;
Heatfractionarray(1,index)=Heatfraction;
dQarray(1,index)=dQwall;
%Uadsarray(1,index)=Uads;
sumheatarray(1,index)=sumheat;
deltaHarray(1,index)=sum(deltaH);
deltaUadsarray(1,index)=sum(deltaUads);
deltaUgasarray(1,index)=sum(deltaUgas);
% Energy balance on vessel
%stop
% Set old values to new ones
mgas=mgasnew;
mads=madsnew;
T=Tnew;
p=pnew;
x=xnew;
Te=Tenew;
me=menew;
Vvoid=Vvoidnew;
t;
end% of simulation, t=tmax
function F=saltmasserror (pnew)
for n=1:N
  n;
  % adsorbing (ads=1) or desorbing (ads=0) ??
  peqads=exp(-delHads/R0/T(n)+delSads/R0); % Equilibrium p (ads) in Pa
  peqdes=exp(-delHdes/R0/T(n)+delSdes/R0); % Equilibrium p (des) in Pa
  ads;
  if  p<peqdes;
     ads=0;
     peq=peqdes;
     delH=delHdes;
    if Equation==1 % Linear model
    madsnew(n)=mads(n)+dt*msalt(n)*((xinitial-xfinal)*...
      (((x(n)-xfinal)/(xinitial-xfinal)))^ydes)*Ades*(1.-peq/p);
    end
    if Equation==2 % Log model with Arrhenius f(T)
    madsnew(n)=mads(n)+dt*msalt(n)*(xinitial-xfinal)*...
    (((x(n)-xfinal)/(xinitial-xfinal))^ydesln)*...
    C1des*exp(-Eades/R0/T(n))*log(p/peq);
    end
  else
  %%
  if p>peqads;
      ads=1;
      peq=peqads;
      delH=delHads;
    if Equation==1 % Linear model
    madsnew(n)=mads(n)+dt*msalt(n)*((xinitial-xfinal)*...
      (((x(n)-xfinal)/(xinitial-xfinal)))^yads)*Aads*(1.-peq/p);
    end
    if Equation==2 % Log model with Arrhenius f(T)
    madsnew(n)=mads(n)+dt*msalt(n)*(xinitial-xfinal)*...
      (((xfinal-x(n)/(xinitial-xfinal))^yadsln))*...
      C1ads*exp(-Eaads/R0/T(n))*log(p/peq);
    end
     else
      % In hysteresis band keep going in the same direction.
      % If starting in the band arbitrarily suppose desorption
      if ads==[];
      ads=0;
      peq=peqdes;
      delH=delHdes;
    if Equation==1 % Linear model
      madsnew(n)=mads(n)+dt*msalt(n)*((xinitial-xfinal)*...
      (((x(n)-xfinal)/(xinitial-xfinal)))^ydes)*Ades*(1.-peq/p);
    end
    if Equation==2 % Log model with Arrhenius f(T)
     madsnew(n)=mads(n)+dt*msalt(n)*((x(n)-xfinal)^ydesln)*...
      C1des*exp(-Eades/R0/T(n))*log(p/peq);
    end
      end
    end
  end
  % Limit x between max and min
  xnew(n)=madsnew(n)/msalt(n);
  if xnew(n)>xinitial; xnew(n)=xinitial;end
  if xnew(n)<xfinal; xnew(n)=xfinal; end
  madsnew(n)=xnew(n)*msalt(n);
  R=RNH3;
  Vvoidnew(n)=V0void(n)-madsnew(n)/rhoads;% new void volume in node n m^3
  if ads==0; % Desorption
    a=-Cpgas*(0.5*mads(n)+0.5*madsnew(n)+p*Vvoid(n)/2/R/T(n))-MCp(n);
    b=dQ(n)+MCp(n)*T(n)-Cvgas/R*(pnew*Vvoidnew(n)-p*Vvoid(n))...
    +mads(n)*(Cpgas*T(n)-p/rhoads-delH/MWamm)+...
     madsnew(n)*(pnew/rhoads+delH/MWamm)...
 -Cpgas/2*(T(n)*(mads(n)-madsnew(n)+p*Vvoid(n)/R/T(n))-pnew*Vvoidnew(n)/R);
    c=Cpgas*T(n)*pnew*Vvoidnew(n)/2/R;
  % a,b,c quadratic parameters for Tnew
  else %adsorption
    a=-MCp(n)-madsnew(n)*Cpgas;
    b=dQ(n)+MCp(n)*T(n)-Cvgas/R*(pnew*Vvoidnew(n)-p*Vvoid(n))...
    +mads(n)*(Cpgas*T(n)-p/rhoads-delH/MWamm)+...
     madsnew(n)*(pnew/rhoads+delH/MWamm)...
     -Cpgas*Te*(mads(n)-madsnew(n)+p*Vvoid(n)/R/T(n));
    c=Cpgas*Te*pnew*Vvoidnew(n)/R;
  end
  %a, b, c % Check signs to get correct root.
  Tnew(n)=(-b-sqrt(b*b-4*a*c))/2/a; % Positive root taken
  if Tnew(n)==0;stop;end
  mgasnew(n)=pnew*Vvoidnew(n)/R/Tnew(n); % New gas mass kg
  dmout(n)=mads(n)-madsnew(n)+mgas(n)-mgasnew(n)%mass of gas expelled kg
  dmouthout(n)=dmout(n)*Cpgas*(T(n)+Tnew(n))/2; % Enthalpy flow out
end
mout=sum(dmout); % Total mass to vessel kg
hout=sum(dmouthout); % Total enthalpy flow to vessel.
R=ramms(pnew/1e5,T(n)-273); % Accurate ammonia gas constant
R=RNH3;
Tenew=(dQe+me*Cvgas*Te+hout)/Cvgas/(me+mout); % New vessel temperature K
menew=pnew*Ve/R/Tenew;      % New gas mass in vessel kg
F=menew-me-mout;      % Mass imbalance kg
end
References

  1. Aristov, Y.I.; Dawoud, B.; Glaznev, I.S.; Elyas, A. A new methodology of studying the dynamics of water sorption/desorption under real operating conditions of adsorption heat pumps: Experiment. Int. J. Heat Mass Trans. 2008, 51, 4966–4972. [Google Scholar] [CrossRef]
  2. Veselovskaya, J.V.; Tokarev, M.M. Novel ammonia sorbents “porous matrix modified by active salt” for adsorptive heat transformation: 4. Dynamics of quasi-isobaric ammonia sorption and desorption on BaCl2/vermiculite. Appl. Therm. Eng. 2011, 31, 566–572. [Google Scholar] [CrossRef]
  3. Aristov, Y.I. Adsorptive transformation and storage of renewable heat: Review of current trends in adsorption dynamics. Renew. Energy 2017, 110, 105–114. [Google Scholar] [CrossRef]
  4. Aristov, Y.I. Experimental and numerical study of adsorptive chiller dynamics: Loose grains configuration. Appl. Therm. Eng. 2009, 32, 675–686. [Google Scholar] [CrossRef]
  5. Mazet, N.; Amouroux, M.; Spinner, B. Analysis and Experimental Study of the Transformation of a Non-Isothermal Solid/Gas Reacting Medium. Chem. Eng. Commun. 1991, 99, 155–174. [Google Scholar] [CrossRef]
  6. Armarego, W.L.F. Purification of Laboratory Chemicals, 8th ed.; Elsevier: Amsterdam, The Netherlands, 2017. [Google Scholar]
  7. Daintith, J. Dictionary of Chemistry, 6th ed.; Oxford University Press: Oxford, UK, 2008. [Google Scholar]
  8. Neveu, P.; Castaing, J. Solid-gas chemical heat pumps: Field of application and performance of the internal heat of reaction recovery process. Heat Recovery Syst. CHP 1993, 13, 233–251. [Google Scholar] [CrossRef]
  9. Mazet, N.; Amouroux, M. Analysis of Heat Transfer in a Non-Isothermal Solid/Gas reacting Medium. Chem. Eng. Commun. 1991, 99, 175–200. [Google Scholar] [CrossRef]
  10. Lebrun, M.; Spinner, B. Models of heat and mass transfers in solid—Gas reactors used as chemical heat pumps. Chem. Eng. Sci. 1990, 45, 1743–1753. [Google Scholar] [CrossRef]
Figure 1. Large Temperature Jump (LTJ) reactor design; cross hatched area represents reactor heating oil jacket.
Energies 12 04404 g001
Figure 2. Process flow diagram of the entire LTJ rig.
Energies 12 04404 g002
Figure 3. Equilibrium lines, shows all results for adsorption and desorption.
Energies 12 04404 g003
Figure 4. Calculated equilibrium lines compared to data by Neveu and Castaing attributed to a thesis by S. Mauran (1982) Perpignan [8].
Energies 12 04404 g004
Figure 5. Model results versus measured results for desorption reaction: (a) approx. 7 bar with 0.531 kg salt/kg of composite; (b) approx. 7 bar with 0.317 kg salt/kg of composite; (c) approx. 2 bar with 0.531 kg salt/kg of composite; (d) approx. 2 bar with 0.317 kg salt/kg of composite.
Energies 12 04404 g005
Figure 6. Model results versus measured results for adsorption reaction: (a) approx. 7 bar with 0.531 kg salt/kg of composite; (b) approx. 7 bar with 0.317 kg salt/kg of composite; (c) approx. 3 bar with 0.531 kg salt/kg of composite; (d) approx. 3 bar with 0.317 kg salt/kg of composite.
Energies 12 04404 g006