Article

Multi-Criteria and Life Cycle Assessment of Wood-Based Bioenergy Alternatives for Residential Heating: A Sustainability Analysis

1
Centre for Environmental and Marine Studies (CESAM), Department of Environment and Planning, University of Aveiro, Campus Universitário de Santiago, 3810-193 Aveiro, Portugal
2
CeBER and Faculty of Economics, University of Coimbra, Av. Dias da Silva 165, 3004-512 Coimbra, Portugal
3
INESCC—Institute for Systems Engineering and Computers at Coimbra, 3030-290 Coimbra, Portugal
4
ADAI-LAETA, Department of Mechanical Engineering, University of Coimbra, Polo II Campus, R. Luís Reis Santos, 3030-788 Coimbra, Portugal
*
Author to whom correspondence should be addressed.
Energies 2019, 12(22), 4391; https://doi.org/10.3390/en12224391
Submission received: 18 September 2019 / Revised: 7 November 2019 / Accepted: 18 November 2019 / Published: 19 November 2019

Abstract

:
Moving towards a global bioeconomy can mitigate climate change and the depletion of fossil fuels. Within this context, this work applies a set of multi-criteria decision analysis (MCDA) tools to prioritise the selection of five alternative bioenergy systems for residential heating based on the combination of three commercial technologies (pellet, wood stove and traditional fireplace) and two different feedstocks (eucalypt and maritime pine species). Several combinations of MCDA methods and weighting approaches were compared to assess how much results can differ. Eight indicators were used for a sustainability assessment of the alternatives while four MCDA methods were applied for the prioritisation: Weighted Sum Method (WSM), Technique for Order of Preference by Similarity to Ideal Solution (TOPSIS), Elimination and Choice Expressing Reality (ELECTRE), and Preference Ranking Organization Method for Enrichment Evaluation (PROMETHEE). Regarding the sustainability performance indicators, the highest environmental impacts were calculated for the fireplace alternatives, and there was not a best environmental option. Also, no clear trend was found for the economic and social dimensions. The application of MCDA tools shows that wood stove alternatives have the best sustainability performance, in particular wood stove with combustion of maritime pine logs (highest scores in the ranking). Regarding the worst alternative, fireplaces with combustion of eucalypt logs ranked last in all MCDA rankings. Finally, a sensitivity analysis for the weighting of the performance indicators confirmed wood stoves with combustion of maritime pine logs as the leading alternative and the key role of the analysts within this type of MCDA studies.

Graphical Abstract

1. Introduction

The effects of climate change and the continuous depletion of fossil fuels require a change in the global economy that should be based on the use of renewable resources. The implementation of processes based on the production, supply and processing of biomass can boost that change, reducing environmental impacts and ensuring the conservation of finite resources. Thus, the concept of bioeconomy emerges as a suitable opportunity to link economic growth with sustainable development [1,2]. The European Commission defines the bioeconomy concept as “the production of renewable biological resources and the conversion of these resources and waste streams into value added products, such as food, feed, bio-based products, and bioenergy” [3].
The bioeconomy created a turnover of 2.3 trillion € in the European Union (EU) in 2015, with the bio-based electricity and forestry sectors having the greatest growth rates [4]. Thus, the correct exploitation of forest resources can contribute to provide a sustainable source of energy, promoting the development of rural areas and jobs creation [5]. In particular, bioenergy options based on wood feedstocks are presented as a convenient solution for residential heating, especially in countries like Portugal where forest resources are still abundant [6,7,8]. Several wood-based technologies are currently available in the market for residential heating, from traditional fireplaces to wood/pellet stoves [9,10,11]. An appropriate selection of these technologies in terms of sustainability will be crucial for paving the way to a future wide deployment of the European bioeconomy.
When taking into consideration the sustainability of energy systems, the search for logical and optimal solutions is a complex process since it involves: (i) many sources of uncertainty at different scales (e.g., at technology, company or policy level), (ii) probably long time frames according to the lifespan of energy systems, (iii) capital intensive investments, and (iv) a large number of stakeholders with different views and preferences [12]. In this sense, multiple criteria are needed to reflect the complexity of the sustainability assessment for decision-makers and to create an adequate basis for a quality and comprehensive decision. This means taking into account not only environmental criteria but also economic and social indicators (covering the main dimensions of the sustainability concept). In this respect, approaches with a life-cycle perspective are considered as effective sources for supplying performance indicators in one dimension or in all dimensions of sustainability [13,14].
In addition to indicators, methods are needed to reduce the complexity of integrating and interpreting multiple criteria and preferences of stakeholders. Multi-criteria decision analysis (MCDA) arises as an operational evaluation and decision support approach that is suitable for addressing complex problems (e.g., energy and environmental issues) featuring high uncertainty, conflicting objectives, different forms of data and information, multiple interests and perspectives, and the accounting for complex and evolving biophysical and socio-economic systems [15,16]. According to Ibáñez-Forés et al. [17], MCDA methods can be classified into two broad groups: Multi-Attribute Decision Analysis (MADA) and Multi-Objective Decision Analysis (MODA). The former is used when the decision-maker has to choose between a finite number of options, while the latter implies setting the value of decision variables (implicitly defining an infinite number of alternatives). Within the MADA, which fits better with the interest of the present study, the most popular are the following: Multi-Attribute Utility Theories (MAUT), the Outranking methods, Analytical Hierarchy Process (AHP) method, and other multiple attribute decision-making (OMADM) methods (such as distance-to-target approaches) [12,18,19].
MCDA tools have been widely applied for supporting the choice of more sustainable energy solutions, mainly in the following areas: energy policy and management, evaluation of power generation technologies, evaluation of other energy systems, and electrical regional planning [20,21]. However, there is a lack in the existing literature concerning the use of MCDA tools for providing robust and sustainable choices within the bioenergy context [21]. According to the review conducted by Scott et al. [22], the most common topic studied in MCDA applied to bioenergy is the selection of the technology to use, comparing between technologies or between equipment within the same technology. The sustainability of bioenergy was only evaluated in 14% of the reviewed literature. This trend remains at present with only few studies addressing sustainable choices in the MCDA application to bioenergy systems (mainly application to biomass conversion routes [23,24]). In addition, little attention has been paid to MCDA studies of energy systems for heating in residential buildings [25,26,27]. These studies are mainly based on the use of economic and environmental indicators for the MCDA analysis.
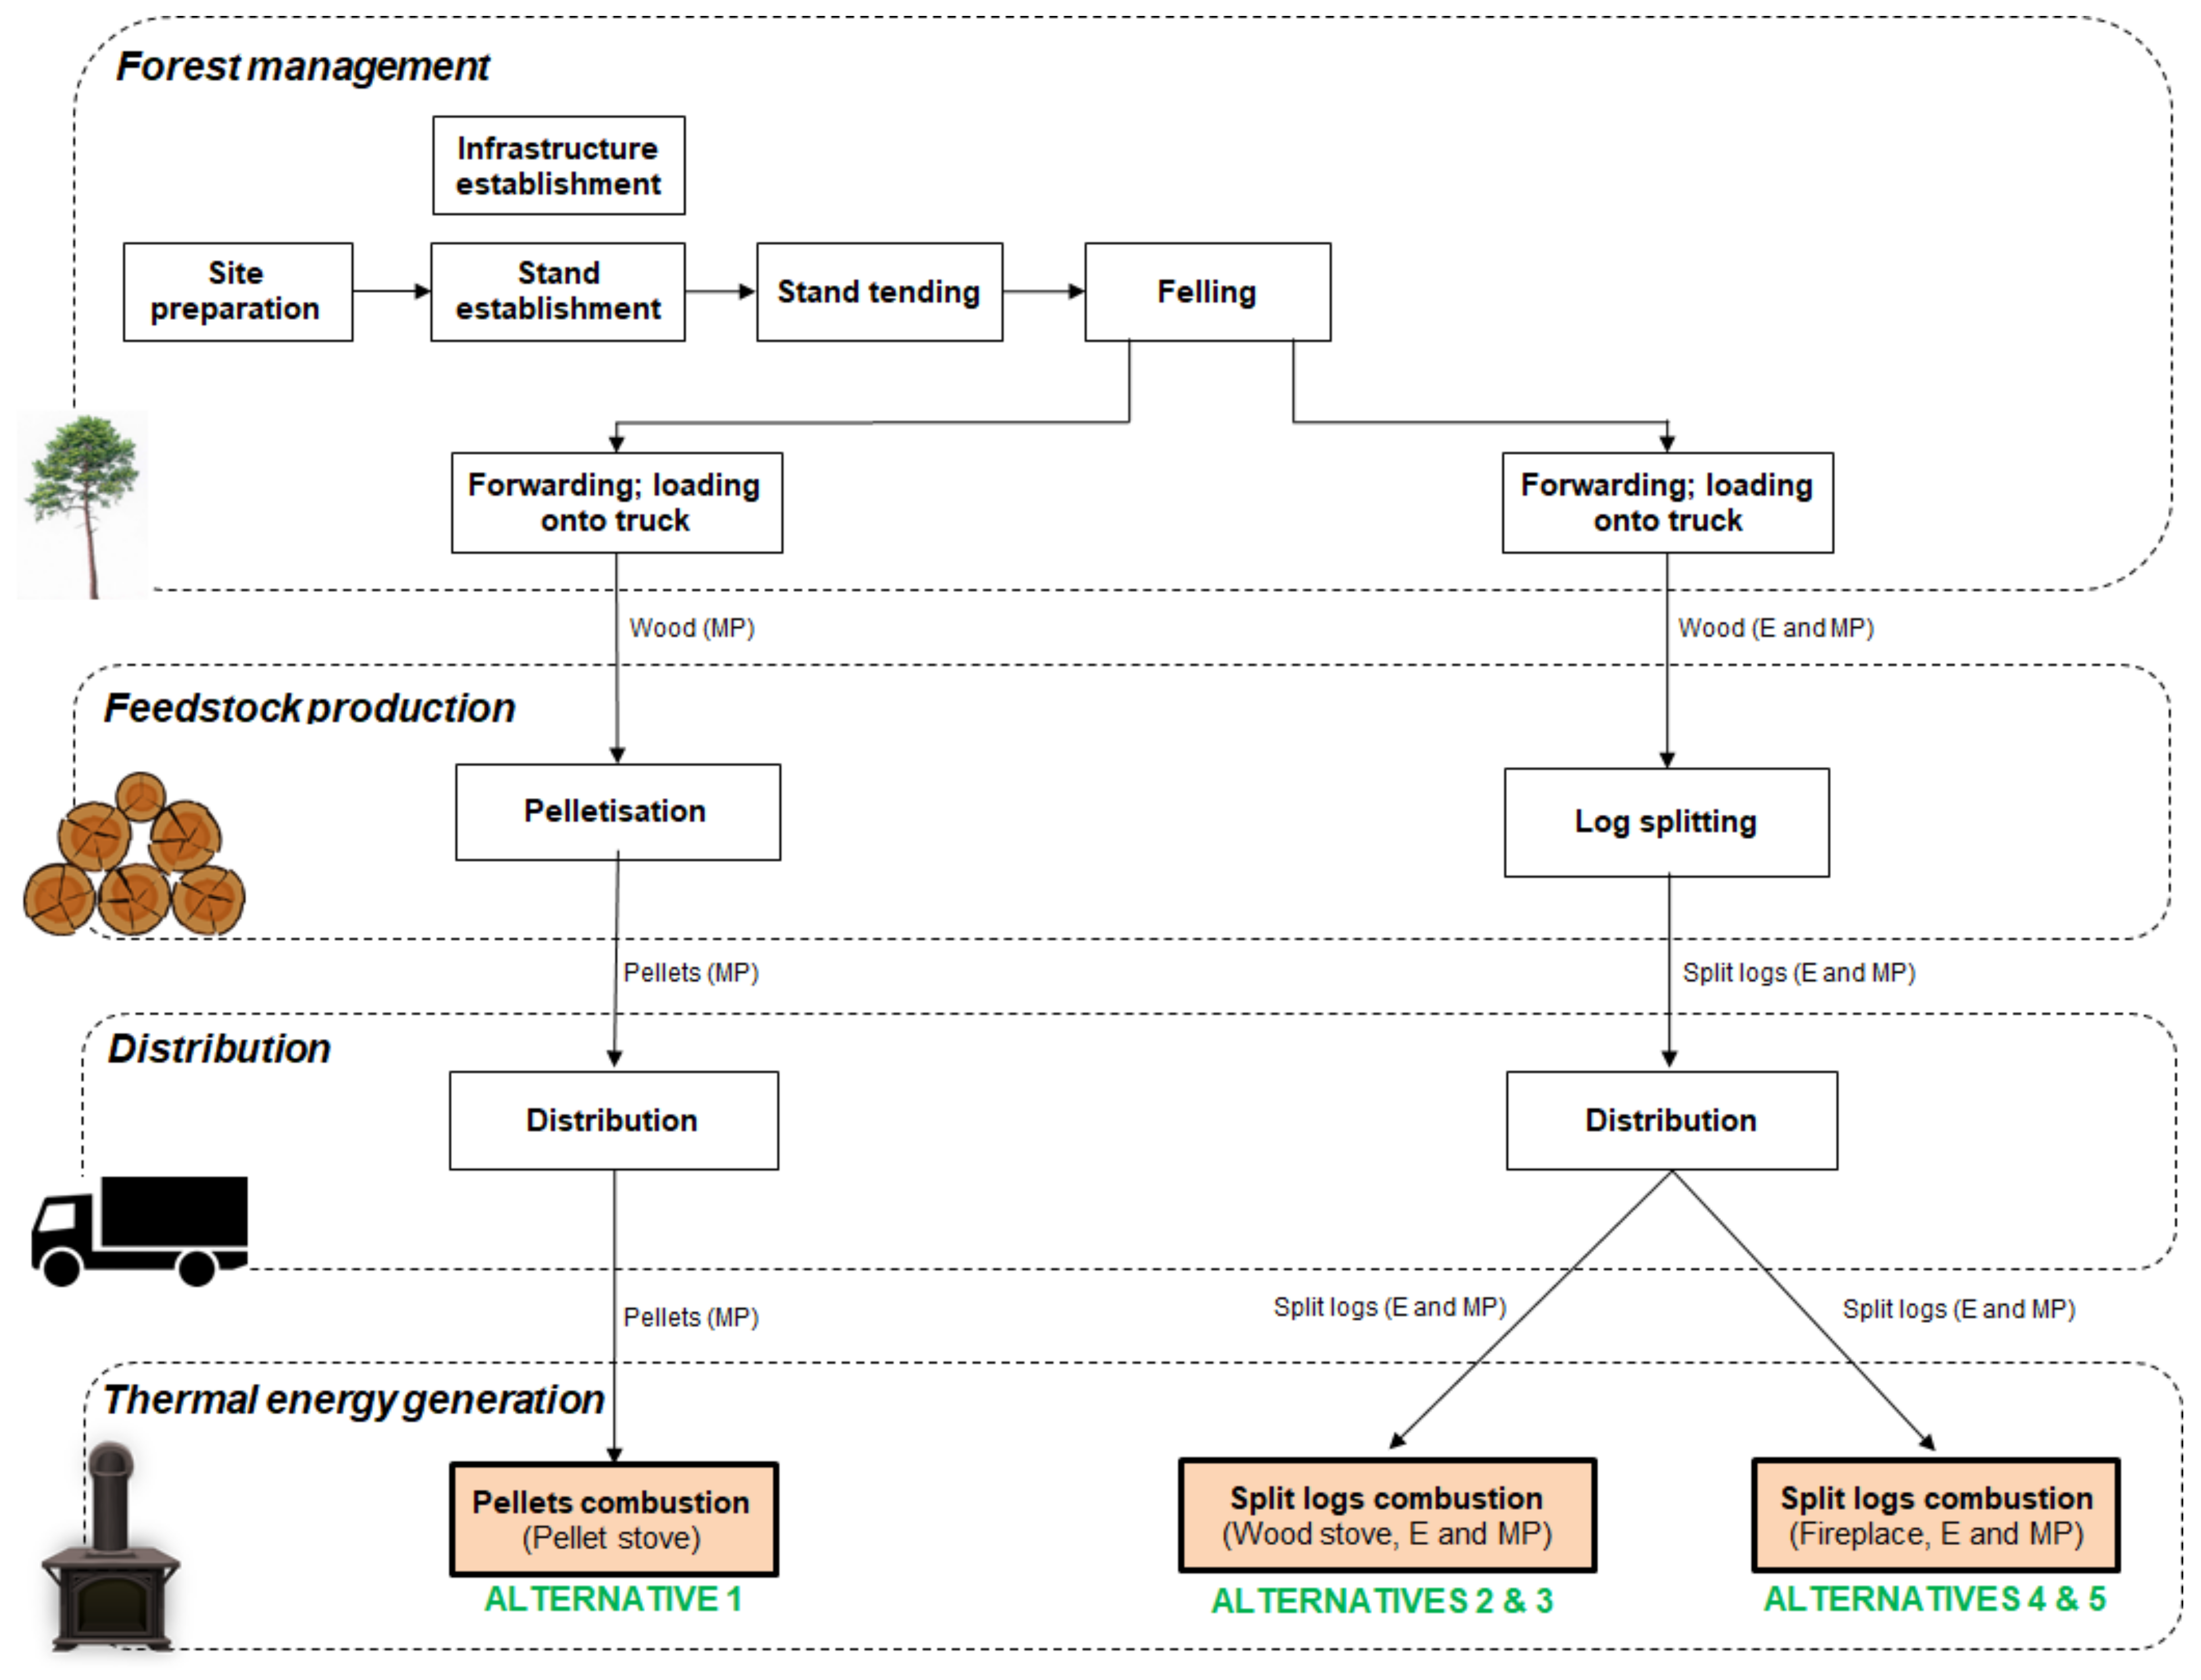
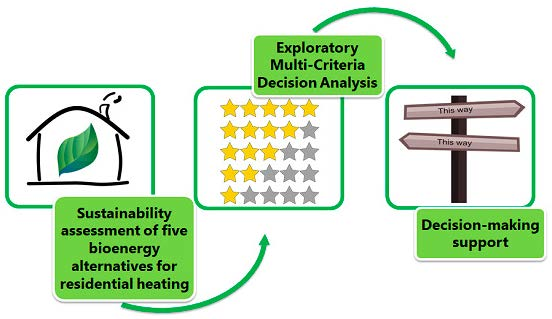
This paper aims to fill the knowledge gap in the literature regarding the application of MCDA tools for bioenergy systems, as well as to provide recommendations for the selection of the best bioenergy options for residential heating in Southern Europe. Five different wood-based residential heating alternatives based on the work conducted by Quinteiro et al. [8] are evaluated in this study through the combination of three commercial technologies (pellet stove, wood stove and traditional fireplace) and the use of two different feedstocks widely available in the selected region (eucalypt and maritime pine species). In order to follow a sustainability perspective, the environmental analysis of the alternatives carried out in Quinteiro et al. [8] is complemented in this study with the evaluation of the economic and social dimensions for the prioritisation of alternatives, considering eight indicators (four environmental, two economic and two social). Moreover, an exploratory MCDA analysis is carried out in this work to obtain a synthesis of the results encompassing the three sustainability dimensions. Because of the wide availability of options concerning MCDA methods and weighting vectors, this exploratory analysis applies four of the most commonly used MCDA methods: Weighted Sum Method (WSM) [28], TOPSIS [29], ELECTRE [30], and PROMETHEE [31]. The sensitivity of the obtained rankings concerning the weighting approach is also carried out. Together, these analyses allow assessing the influence of the MCDA modelling options (method and weighting approach) on the recommended choice.

2. Materials and Methods

2.1. Five Wood-Based Residential Heating Alternatives

Five different wood-based residential heating alternatives for a single-family house are considered in this article to support decision-makers in developing sensible choices for the deployment of a European bioeconomy context. The three selected technologies represent the most widely used systems for residential heat supply in Southern Europe and more specifically in Portugal. In this sense, despite the traditional use of fireplaces, they are being replaced by wood stoves (for burning logs) and pellet stoves (for burning compressed biomass pellets) with higher energy conversion efficiency and lower air pollution. Additionally, wood pellets have higher energy density and thus require less space for storage than firewood. However, the selection of the most appropriate wood-fuelled system should be linked not only to technical indicators, but also economic, environmental and social criteria. Table 1 contains a brief description of the selected bioenergy options and the main assumptions taken into account for each one.
Figure 1 shows the life cycle stages of each alternative including: (i) forest management of both eucalypt and maritime pine species up to log loading onto trucks; (ii) pellets and wood split logs production; (iii) distribution of pellets and wood split logs; and (iv) thermal energy generation. The forest management stage includes all operations carried out during infrastructure establishment, site preparation, stand establishment, stand tending, and wood felling, forwarding and loading onto the truck. Regarding the production stage, five main operations are considered for the wood pellet alternative: (i) log chipping; (ii) milling; (iii) drying, using the heat produced from the combustion of maritime pine logging residues, chipped at the forest roadside; (iv) pelletising, and; and (v) packaging. In the case of split logs production, this process consists in splitting the wood logs into smaller portions of wood ready for burning.
Concerning the distribution stage of pellets, a distance of 15 km by truck is considered from pellets mill to the storage of wood pellets packed in LDPE bags (15 kg of pellets per bag). Additionally, another 15 km by private car from store to households is assumed. These average distances correspond to a ‘short chain topology’, involving proximity between the places of energy consumption and production [8]. In the case of the distribution of split logs, an average distance of 15 km by truck from the log splitting facilities to households has been considered [8].
Regarding the thermal energy generation stage, three wood-fuelled systems are selected, as previously mentioned, for residential heating based on the combustion of logs or pellets feedstock (from eucalypt or maritime pine): fireplace, wood stove and pellet stove. The pellet stove has a nominal thermal power of 9.5 kWth with an internal pellet storage tank and an auger screw to the burner for the provision of biomass feedstock. The wood stove presents a nominal power of 18.20 kWth and has a manual control of combustion air. Finally, the fireplace consists of a brick open fireplace operated manually. The annual consumption of feedstock for each alternative presented in Table 1 was calculated taking into consideration the requirement of fuel per MJ of heat [8] and the energy demand provided below. Further information regarding the features of the systems can be found in Quinteiro et al. [8].
The selected alternatives are used to meet the energy demand for space heating of the living room (total area 30 m2) of a representative single-family house [32]. The house is located in the north of Portugal and the number of heating degree days considered in this region is 1652 °C·days, with an outdoor design temperature of 10 °C [32]. The estimation of the useful energy for heating is made following the methodology detailed in the decree-law n° 80/2006 of 4 April corresponding to the Portuguese Regulation of product characteristics for thermal performance in buildings [33]. Thus, 7978.85 MJ·yr−1 is the maximum useful energy required for the space heating of the living room of an average single-family house located in the north of Portugal according to the Equation (1) and the surface area:
N = 4.5 + (0.021 + 0.037·FFGD
where N corresponds to the maximum value of useful energy required for heating (usually measured in kWh·m−2·yr−1); shape form (FF) is the ratio between the sum of the areas of the house envelope (outer and inner) and its respective interior volume; and GD is the number of degree days (i.e., a measure of the variation of 1 day’s temperature against a standard reference temperature) of the area.

2.2. Criteria for Sustainability Assessment

The following eight indicators were selected for the sustainability assessment of wood-based alternatives: (i) global warming, (ii) terrestrial acidification, (iii) freshwater eutrophication, (iv) ozone formation (human health), (v) annualised capital costs, (vi) annual operation and maintenance costs, (vii) annual working hours for feedstock production, and (viii) annual number of days of absence due to non-fatal accidents during the feedstock production (Table 2). The sample of indicators are organised into a hierarchy that comprehends the three main dimensions of sustainability and their selection is motivated by the specific features of the case study. Furthermore, the chosen set of indicators represents commonly used indicators for evaluating the sustainability of energy systems [21], covering impacts for ecosystems and human health.
The environmental criteria were based on Quinteiro et al. [8], who calculated the indicators per 1 MJ of thermal energy generated by each alternative using LCA methodology. The suitability of life-cycle approaches as robust and reliable sources of environmental indicators is demonstrated in Martin-Gamboa et al. [21]. The functional unit is defined as 7978.85 MJ·yr−1 (i.e., the energy demand for space heating of the living room), as already explained. The environmental indicators were calculated with the ReCiPe 2016 impact assessment method [34].
The selected economic criteria encompass the annualised capital costs and the annual operation and maintenance costs. The first indicator includes costs of equipment and installation of the wood-based technologies. The average capital costs of these technologies range from approximately 1600 € in the case of pellet stoves to 1350 € (wood stoves) and 1050 € (fireplaces). These costs are estimated based on price information from suppliers and literature [35]. With the aim of providing the same temporal reference as the remaining indicators, capital costs are annualised multiplying them by the capital recovery factor (CRF), a ratio used to calculate the present value of an annuity [36]. According to the recommendations of García-Gusano et al. [37], an interest rate of 5% is used for the calculation of the annualised capital costs. This value agrees with other studies that establish the discount rate for households in energy system analysis between 3–5% [38]. Regarding the lifetime of the equipment under evaluation, 20 years is estimated for the pellet and wood stoves while a lifetime of 50 years is assumed for the fireplace, taking into account the average useful life of a residential house [32].
With respect to the second economic indicator (annual operation and maintenance costs), it includes cost of feedstock, electricity, maintenance, and contingencies (e.g., breakdowns). This indicator is computed according to the heat demand of 7978.85 MJ·yr−1. Based on the Association of Forestry Producers of Portugal [39], a price of 0.056 €·kg−1 is estimated for eucalypt wood and 0.046 €·kg−1 for maritime pine. In the case of pellet feedstock, an average price of 3.35 € per bag of 15 kg is assumed according to direct suppliers. An electricity price of 0.23 €·kWh−1 is used, which is obtained from the statistics of the European Union for Portugal [40]. Lastly, maintenance costs are calculated taking into account a percentage (4%) of capital costs, while contingency costs are assumed as 10% of the operation and maintenance costs [41].
Finally, the social criteria are the annual working hours and the annual number of days of absence due to non-fatal work-related accidents. Both indicators cover the stages needed to produce the feedstock (i.e., forest management and biomass feedstock production stages). The information for the calculation of the annual working hours were obtained from Dias and Arroja [6] and Dias et al. [42], used for obtaining the working hours in terms of forest management, as well as from Hunsberger and Mosey [43], used for providing the working hours required for the whole pellet production process. The working hours linked to the logs splitting were obtained from direct communication. It is important to keep in mind that the calculated working hours refer to the effective working time required to provide the annual amount of feedstock for each of the wood-based alternatives. Additionally, they can also be understood as a contribution of the forestry sector to local economic development.
The number of days of absence is calculated according to statistical data from Dos Santos [44] for the year 2014 (last year for which data are available). Firstly, the number of non-fatal work-related accidents (per worker) and the days of absence due to these accidents (per year) in the forestry sector for some districts of the north region of Portugal were obtained (see Table A1 and Table A2 of the Appendix). The following districts were considered: Aveiro, Braga, Coimbra, Leiria, Porto, Viana do Castelo, Vila Real, and Viseu. These districts were selected because they represent the largest area of distribution of eucalypt and maritime pine forests in Portugal [45]. From the statistical data of work-related accidents and their corresponding days of absence, the average values of the whole region considered were obtained and subsequently linked to the working hours previously calculated to obtain the annual days of absence specific to each alternative under evaluation.

2.3. MCDA Methods

The choice of the best option in terms of sustainability is a difficult decision that usually entails the application of an MCDA method. Within the wide range of MCDA methods currently available, the selection of a specific one highly depends on the particular characteristics of each problem (e.g., identification of the most suitable energy technology for satisfying local electricity demand) and the decision-makers’ needs. To ensure the robustness of the present analysis, four MCDA techniques are applied in this case study, viz., WSM, TOPSIS, ELECTRE, and PROMETHEE. The rationale behind the selection of these tools is that they are widely applied in the literature [12,17,21] and follow different principles.

2.3.1. Weighted Sum Method

The WSM [28] follows the principle of aggregating the performances of the alternatives on the multiple criteria according to an additive aggregation:
S(ai) = w1·v1(ai) + … + wn·vn(ai)
where S(ai) denotes the global value of the i-th alternative, ai; n denotes the number of criteria (indicators); wj denotes the weight of the j-th criterion; and vn(ai) denotes the value of ai on the j-th criterion (j = 1,…, n). Since the impacts are measured in different mathematical scales, the values aggregated in Equation (2) must be transformed so that scales are commensurate. This can be accomplished by a normalisation operation, with the following being one of the most popular and selected in the present work to transform the impact of an alternative ai according to the j-th criterion, denoted Ij(ai):
vj(ai) = |Ij(worstj) − Ij(ai)|/|Ij(worstj) − Ij(bestj)|
where worstj and bestj denote the alternatives with the worst and best potential sustainability impact according to the j-th indicator. According to Equation (3), the normalised values on each indicator vary between 0 for the worst alternative to 1 for the best alternative.
It should be noted that the previous normalisation, despite being very popular, can be biased by the introduction of a new alternative that is extremely good or extremely bad on some indicator [46], and so it might be preferable to use a normalisation based on a fixed reference [47,48]. Another sensible option is to replace normalisation by building value functions that reflect the preferences of a decision-maker [18,19].

2.3.2. TOPSIS Method

The TOPSIS tool [29] follows the principle of aggregating the performances of the alternatives on the multiple criteria into a single value representing how close it is to an ideal solution, represented by the vector (best1,…, bestn), and how far it is from an anti-ideal solution, represented by the vector (worst1,…, worstn). Denoting by di+(ai) the Euclidean distance between an alternative ai and the ideal solution and denoting by di(ai) the Euclidean distance between an alternative ai and the anti-ideal solution, the score of ai is given by:
S(ai) = di(ai)/[di (ai) + di+(ai)]
Thus, the score varies between 0 and 1 (and more is better, meaning that the alternative is farther away from the anti-ideal). As in the WSM, before computing distances, the mathematical scales must be normalised so that scales are commensurate. In TOPSIS, normalisation consists in dividing the impacts on each criterion by the square root of the sum of the squares of the impacts of the alternatives being compared. These normalised values are also multiplied by the weights of the criteria, so that the Euclidean distances used in Equation (4) are weighted distances. It should be noted that the weights are non-negative and their sum is equal to 1.

2.3.3. ELECTRE Method

The ELECTRE method [30] follows the principle of building an outranking relation S resulting from comparisons between each alternative and its competitors. In the original ELECTRE variant, the outranking relation is crisp (true/false) rather than valued (values in [0,1]), requiring the definition of a concordance threshold (required majority). When comparing two alternatives, ai and aj, ELECTRE adds up the total weight of the criteria on which ai is at least as good as aj (concordance) and checks whether ai is worse than aj by a large difference on any criterion (discordance). Then, based on the concordance threshold c (required majority) and the discordance threshold d (maximum discordance) it concludes if globally ai is at least as good as (outranks) aj, denoted ai S aj:
ai S aj ⇔ Sum{for j: vj(ai) ≥ vj(aj)}wjc ∧ Max{for j: vj(ai) < vj(aj)}[vj(aj)−vj(ai)] ≤ d
The value of the alternatives on a given criterion, vj(ai) and vj(aj), needs to be normalised according to Equation (3). In this work, the concordance threshold c was set to its minimum value 0.51 (a simple majority), and the discordance threshold d was set to 0.8 (discordance vetoes an outranking relation if it is greater than 80% of the scale amplitude).
To obtain comparable results with the WSM and TOPSIS, which yield a ranking of the alternatives, there are several variants of ELECTRE available [49]. One of the simplest ways of obtaining a ranking, which has a clear axiomatic foundation, is the net flow approach and its particular instance of the Copeland method [50]. According to this method, alternatives are ranked by the number of “wins” (alternatives they outrank) minus the number of “losses” (alternatives that outrank them). The ELECTRE score used in this work for ranking the alternatives in a set A is then:
S(ai) = #{ajA: ai S aj} − #{ajA: aj S ai}

2.3.4. PROMETHEE Method

The PROMETHEE method [31] also follows the principle of building an outranking relation resulting from comparisons between each alternative and its competitors. However, the outranking relation is always valued (values in [0,1]), it computes only the concordance that one alternative is preferred to others (not computing discordance opposed by the minority criteria), and it does not rely on the notion of a required majority threshold.
Similarly to ELECTRE, the PROMETHEE method compares each alternative against all the competing alternatives in a set A. The preference degree of an alternative ai over another aj is equal to 0 if ai is worse than aj, is equal to 1 if ai is better than aj by a difference of pj or larger (pj is a parameter named preference threshold), and is a value between 0 and 1 obtained by linear interpolation if the advantage of ai over aj is positive but less than pj. This way of computing a preference index corresponds to Type III, one of the six formulae available in PROMETHEE to compute it [31]. In this work, on each criterion, pj was considered to be 50% of the average performance of the alternatives compared. Then, the single-criterion preference indexes are aggregated as a weighted sum taking into account the criteria weights, to obtain the overall preference of ai over aj, denoted π(ai,aj).
Finally, the ranking of the alternatives in PROMETHEE follows a net flow approach, based on the following Φ scores:
Φ(ai) = Sum{for ajA}[π(ai,aj) − π(aj,ai)]

3. Results and Discussion

In the present section, firstly the sustainability profiles of each wood-based system are presented. Then, the alternatives are prioritised through the four MCDA methods selected: WSM, TOPSIS, ELECTRE, and PROMETHEE. Finally, a sensitivity analysis of the rankings obtained with regard to the weighting approach is carried out. In this respect, the weights are modified—each “weighting scenario” emphasizes a different dimension of sustainability—to evaluate their influence in the original ranking (where an equal-weighted approach is taken).

3.1. Sustainability Assessment of Wood-Based Alternatives

Table 3 contains the results obtained for each indicator of the sustainability assessment. The highest impact values for the environmental criteria are associated with the alternatives based on the use of a fireplace. In particular, the alternative based on eucalypt feedstock (F–E) presents the greatest impacts in all the environmental indicators considered, negatively affecting its sustainability performance. This unfavourable performance is strongly linked to an inefficient combustion of wood split logs, which requires a higher amount of feedstock and involves a higher emission of gaseous pollutants per MJ of thermal energy produced in comparison with the rest of alternatives. Regarding the identification of the best alternative in terms of environmental criteria there is not a clear trend, with the pellet stove alternative (PS–MP) being the most favourable in global warming (env1) and ozone formation (human health) (env4), while wood stove (eucalypt, WS–E and maritime pine, WS–MP) performs better in terms of terrestrial acidification (env2) and freshwater eutrophication (env3).
In the case of economic criteria, it is not possible to identify a best or worst alternative. Despite presenting the lowest installation costs, PS–MP is the worst alternative in terms of annualised capital costs (ec1) due to its high market price in comparison with the remaining alternatives (more than 1300 € on average). On the other hand, operation and maintenance costs (ec2) are strongly affected by the annual feedstock costs. Thus, the systems based on the use of a fireplace to meet the residential heat demand (especially in the case of F–E with higher prices of the biomass feedstock) are identified as the worst alternatives because they require the largest amounts of biomass fuel within the set of options evaluated.
Finally, a similar not-dominant trend is found in the case of social criteria. In contrast to the remaining indicators, the annual working hours (soc1) should be maximised with the aim of contributing to the local economic development. Fireplace alternatives are the most favourable systems in terms of annual working hours (mainly F–E) due to the longer working times employed in these alternatives to provide the annual amount of biomass feedstock (more than 4 tonnes of eucalypt or maritime pine). For this indicator, wood stove alternatives emerge as the worst systems with the lowest working hours (especially WS–MP). It should be noted that longer working times are associated with a higher probability of accidents [44]. For this reason, fireplace alternatives are identified as the worst alternatives when days of absence due to non-fatal work accidents are estimated. The observed variability of indicators results makes it difficult to select directly the most sustainable bioenergy systems. Therefore, the use of MCDA tools emerges as necessary and convenient to prioritise the set of wood-based alternatives according to the multiple criteria evaluated.

3.2. MCDA Prioritisation of Wood-Based Alternatives

The data presented in Table 3 constitute the matrix which is the input for an own-developed MCDA model implemented in Excel to compute the scores. The results obtained with the four different tools (viz., WSM, TOPSIS, ELECTRE, and PROMETHEE) applying the same weights for all the indicators are presented in Table 4. The scores obtained have different scales due to the specific mathematical formulation of each method (Section 2.3).
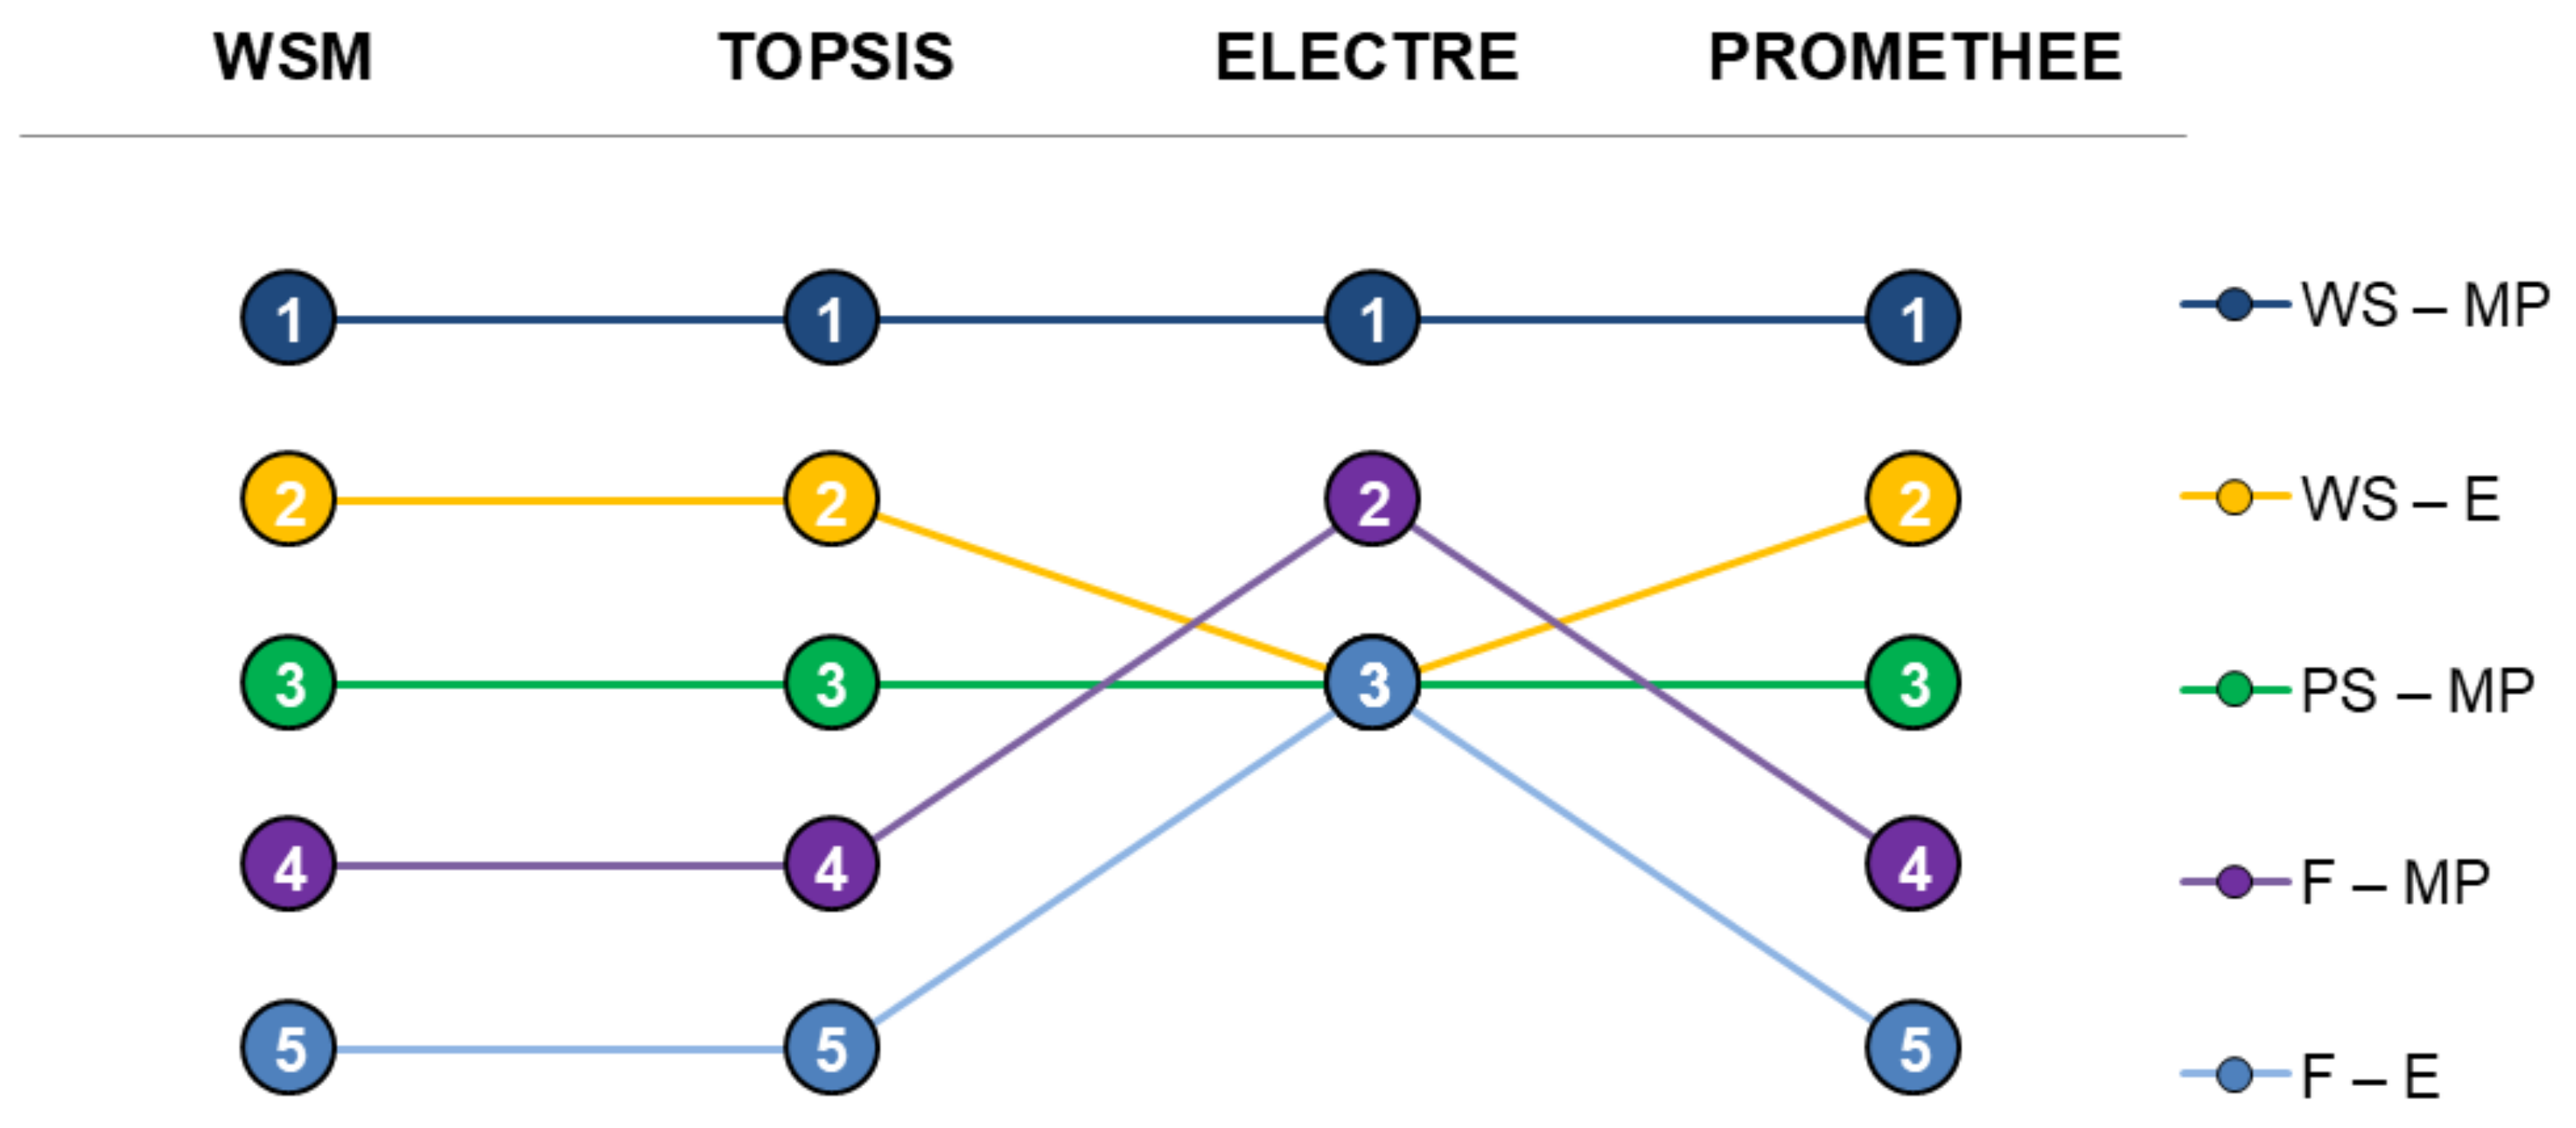
Differences in the ranking of alternatives due to the application of the different MCDA tools can be observed in Figure 2. In this sense, the best alternative according to their position in the four rankings is WS–MP. This alternative presents the highest scores calculated through the application of the four MCDA tools included in the analysis. Despite this fact, the scores are similar between the two wood stoves alternatives (with exception of the application of ELECTRE method). Thus, both WS–MP and WS–E could be considered as appropriate bioenergy systems for residential heating in terms of sustainability performance. Regarding the worst alternative, F–E is ranked last in all rankings (in the case of ELECTRE, tied in the last position with the wood stove and fireplace alternatives based on the combustion of eucalypt split logs).
The similarity between rankings shows that the results are quite robust relative to the choice of the MCDA tools used for the present case study. The only differences are found when the ELECTRE method is applied for the prioritisation of the alternatives. These differences stem from the strong non-compensatory nature of the discordance condition in ELECTRE. Since the pellet and wood stove options (PS–MP, WS–E, and WS–MP) are much worse than the fireplace options (F–E and F–MP) on the indicators annualised capital costs (ec1) and annual working hours (soc1), none of the former three alternatives can outrank the latter two. On the other hand, since the fireplace options F–E and F–MP are so much worse on the remaining indicators, neither can outrank PS–MP, WS–E or WS–MP. These form two incomparable groups, according to ELECTRE. In the first group, PS–MP and WS–E are outranked by WS–MP and outrank no other alternative; hence they are placed in the third (viz., last) position with a net flow of -1. On the other hand, F–MP benefits because it is capable of outranking the other fireplace alternative F–E while no other alternative outranks it.

3.3. Influence of Weighting

The results presented in the previous section correspond to considering equal weights for all the indicators. However, in MCDA, different decision-makers will have other preferences. Depending on the perspective, they might wish to emphasise environmental, economic, or social criteria, possibly leading to different results than those obtained by considering equal weighting. It is therefore important to analyse how sensitive the results are to changes in the sample of weights.
A possible way of assessing the effect of using different weight vectors is to consider different “weighting scenarios”, each one overweighting a given sustainability dimension. Table 5 presents an example of this strategy, placing 75% of the total weight on a single dimension at a time (i.e., the weight of each dimension is the triple of the other two dimensions together). This is a common strategy to represent the preference of a decision-maker in a specific dimension. Computing the results for these weights using the same methods as before does not lead to major changes. In fact, the rankings presented in Figure 2 are maintained in the majority of the cases. When the weights prioritising the environmental dimension are used, all the rankings remain unchanged except in the case of ELECTRE, placing the WS–E alternative in the last position. When the weights prioritising the economic dimension are used, the ranking changes for the WSM, ELECTRE and PROMETHEE, with PS–MP falling from 3rd to 5th place (F–MP and F–E therefore climb one position). When the weights prioritising the social dimension are used, the ranking changes only for the TOPSIS method, with PS–MP climbing from 3rd to 1st place (WS–MP and WS–E therefore drop one position to become 2nd and 3rd). In the latter case, however, the scores of PS–M become very close to the scores of WS–MP and WS–E.
Rather than selecting a few different weighting vectors as described above, it is also possible to perform a stochastic analysis simulating thousands of weight vectors drawn randomly from a uniform distribution [48,51]. Using Monte-Carlo simulation, it is then possible to obtain statistics about the results corresponding to these stochastic weights.
Table 6 shows the Monte-Carlo simulation results (obtained with the @Risk software) for 50,000 random weight vectors uniformly distributed on the simplex defined by the constraints that weights are non-negative and their sum is equal to 1, following the process of Butler et al. [52]. Since ELECTRE yields tie into the rankings frequently (e.g., Figure 2), in this stochastic analysis the number of “losses” was used as a tie-breaking procedure (but some ties still remain when the number of “losses” is the same among tied alternatives).
It can be observed that the rankings presented in Figure 2 are rather stable, but in extreme cases they can be quite different. Just as an example, according to the WSM, PS–MP is ranked 3rd for 79.2% of the random weights, but for weights such as, e.g., w = (0.21, 0.02, 0.01, 0.36, 0.01, 0.03, 0.35, and 0.01) it is ranked 1st and for weights such as, e.g., w = (0.15, 0.02, 0.22, 0.03, 0.01, 0.01, 0.49, and 0.07) it is ranked 5th. The probability of obtaining the same rankings of Figure 2 is higher for the WSM and PROMETHEE, but TOPSIS and ELECTRE also establish the ranking positions in Figure 2 with high probability.

3.4. Influence of Hierarchy

The analysis reported so far considers all the sustainability dimensions on an equal standing, but this ignores a potential issue: The environmental dimension is represented by four criteria, whereas the economic dimension and the social dimension are represented by only two criteria each. This means that the results presented in Section 3.2, considering equal weights, are in fact overweighting the environmental dimension.
If decision-makers wish that all the sustainability dimensions have the same weight (1/3), then a different weighting vector should be applied: dividing 1/3 by four yields a weight of 1/12 for each one of the four environmental indicators; dividing 1/3 by two yields a weight of 1/6 for each one of the two economic indicators, and the same weights apply to the two social indicators. Given this weighting vector, the scores in Table 4 would be changed to those in Table 7. Nevertheless, the ranking of the alternatives (Figure 2) would remain the same except in the case of ELECTRE, with PS–MP falling from 3rd to 5th place (F–E drop one position to become 4th).
The same consideration is in order if a stochastic weights analysis is performed. Indeed, since there are more environmental criteria than economic or social ones, the environment dimension will on average have more weight than the economic or the social dimension. Correcting this requires a two-step strategy to generate random weights. In a first step, the total weight of each dimension (wEnv, wEc, wSoc) is generated randomly such that (wEnv, wEc, wSoc) ≥ 0 and wEnv + wEc + wSoc = 1. Then, the relative sub-weights of the four environmental indicators (senv1, senv2, senv3, senv4) are randomly generated such that (senv1, senv2, senv3, senv4) ≥ 0 and senv1 + senv2 + senv3 + senv4 = 1. Setting the sub-weights for the economic indicators requires only one random value, sec1, drawn from the uniform distribution in [0,1], and then setting sec2 = 1 − sec1. Similarly, a random value, ssoc1 is generated, allowing to define ssoc2 = 1 – ssoc1. Finally, dimension weights and sub-weights are combined so that wEnv1 = wEnv.senv1,…, wEnv4 = wEnv.senv4, wEc1 = wEc.sec1, wEc2 = wEc.sec2, wSoc1 = wSoc.ssoc1, and wSoc2 = wSoc.ssoc2.
Considering the stochastic weights as described above, the probability results in Table 6 are replaced by the probability results in Table 8. In every case, the most likely rank has a probability greater than about 60% and these most likely rankings still coincide with Figure 2. However, by comparing Table 6 with Table 8 one can observe that the latter rankings are less stable in all the cases, i.e., the most likely ranking has less probability. The reason for this is that respecting the hierarchical structure increases the role of the economic and social indicators in the final result, and indicators ec1 and soc1 do not favour the top-ranked alternatives. Since now they have more chances of influencing the result, the scores of the top-ranked three alternatives tend to decrease and so they can more often be surpassed by other alternatives.
Even though TOPSIS places WS–MP in the first position with a relatively low probability of 65.7% (Table 8), the analysis carried out in the present section corroborates the results from Figure 2. Overall, the main conclusion that WS–MP is the most preferred option for all the methods is still fairly robust.

3.5. Final Remarks

The current development of energy policies, roadmaps or plans at all levels (i.e., national, regional, local, etc.) should be in line with the Sustainable Development Goals (SDGs) agreed by the United Nations [53]. The exploratory MCDA analysis conducted in the present study for the sustainability-oriented prioritisation of wood-based bioenergy systems can contribute to set strategies aligned with those SDGs. In particular, it facilitates the decision-making process and the provision of plans that address most of the targets covered by both SDG7 (access to affordable and clean energy) and SDG13 (climate change mitigation). Additionally, links with some of the targets related to well-being (SDG3), decent work and economic growth (SDG8), and sustainable regions (SDG11) could also be identified if the outcomes of this study are taken into account by decision-makers in the elaboration of plans. It is important to note that the relevance of the outcomes of this research is not limited to energy actors in Portugal, but they are relevant to any decision-maker considering the development of energy plans, roadmaps or strategies under sustainability aspects.
The significant involvement of stakeholders (e.g., policy-makers, actors from biomass-related sector, local community or consumers) usually found in the energy sector encompasses a wide range of views which could significantly vary the outcomes of the prioritisation. The weighting scenarios reported in this study allow visualising the influence of different actors’ preferences (i.e., criteria weights) leading to contrasting and practical recommendations. Regarding the choice of indicators (e.g., type and number per sustainability dimension) and technical options within the MCDA methods (e.g., normalisation, concordance and discordance thresholds, etc.), special attention should be paid to the selection of these elements due to their influence on the final results. In this study, indicators and technical options were chosen by academics, but a future involvement of decision-makers at company or policy level may have modified those elements. Thus, a sensitivity analysis on the choice of indicators and technical MCDA options should be further studied. In addition, the incorporation of a life-cycle perspective into the economic and social criteria is also a future direction to explore.

4. Conclusions

An MCDA exploratory analysis was carried out to prioritise five bioenergy alternatives for residential heating in Southern Europe filling a gap in the MCDA application to bioenergy systems. The highest impacts for the environmental criteria were identified for the fireplace due to inefficient combustion of wood split logs, while there was not a preferred environmental performance option. Regarding the economic and social dimensions, no clear trend was found as the alternatives present favourable or unfavourable performances depending on the criterion evaluated. This fact strongly supported the need to apply MCDA methods for the prioritisation of alternatives in terms of sustainability.
The MCDA prioritisation revealed the wood stove options (similar scores for combustion of maritime pine or eucalypt logs) as the most appropriate alternatives in terms of sustainability performance. Regarding the worst alternative, fireplaces based on the combustion of eucalypt logs were ranked last in all MCDA rankings. Furthermore, analyses in terms of how sensitive were the results to changes in weighting were carried out in order to incorporate the vision of decision-makers and to facilitate their role in the prioritisation of bioenergy alternatives for residential heating. These analyses confirmed wood stoves with the combustion of maritime pine logs as the leading alternative and the key role of the analysts within this type of MCDA studies. Therefore, an appropriate prioritisation of bioenergy alternatives in terms of sustainability was demonstrated to be relevant for paving the way to a future wide deployment of the European bioeconomy sector, being the role of the analyst key to provide robust and reliable decisions.

Author Contributions

M.M.-G. conceived the study, calculated the economic and social indicators and implemented the MCDA methods; L.C.D. implemented the MCDA methods and developed the stochastic analysis; P.Q. calculated and provided the environmental indicators; all authors analysed the data and contributed to writing the paper.

Funding

“This research was partly funded by CESAM (UID/AMB/50017/2019), by FEDER (project SABIOS code PTDC/AAGMAA/6234/2014 - POCI-01-0145-FEDER-016765), and by FCT (contracts CEECIND/00143/2017 and CEECIND/02174/2017)”.

Acknowledgments

Martín-Gamboa states that thanks are due to FCT/MCTES for the financial support to CESAM (UID/AMB/50017/2019), through national funds. This work is a contribution to the project SABIOS (PTDC/AAGMAA/6234/2014) funded under the project 3599-PPCDT by FEDER, through COMPETE2020 - Programa Operacional Competitividade e Internacionalização (POCI), and by national funds, through FCT/MCTES. Thanks are also given to the FCT for contracts granted to Paula Quinteiro (CEECIND/00143/2017) and to Ana Cláudia Dias (CEECIND/02174/2017).

Conflicts of Interest

The authors declare no conflict of interest. The funders had no role in the design of the study; in the collection, analyses, or interpretation of data; in the writing of the manuscript, or in the decision to publish the results.

Appendix A

Table A1 and Table A2 present the number of non-fatal work-related accidents (per worker) and the annual days of absence due to these accidents in the forestry sector for the selected districts of the north region of Portugal. These values were based on statistical data of agriculture, forestry and fishing sectors from Dos Santos [44]. Within this estimation, a simplifying assumption is made such that data from these sectors was totally allocated to forestry sector due to lack of availability of local information.
Table A1. Non-fatal work-related accidents per worker.
DistrictsNon-Fatal Work-Related Accidents
Aveiro4.50 × 10−2
Braga3.14 × 10−2
Coimbra5.17 × 10−2
Leiria7.31 × 10−2
Porto3.57 × 10−2
Viana do Castelo2.14 × 10−2
Vila real1.43 × 10−2
Viseu3.56 × 10−2
Table A2. Annual days of absence due to non-fatal work-related accidents.
DistrictsAnnual Days of Absence
Aveiro48.12
Braga34.95
Coimbra40.00
Leiria32.14
Porto34.72
Viana do Castelo40.94
Vila real60.09
Viseu34.64

References

  1. Dahiya, S.; Kumar, A.N.; Sravan, J.S.; Chatterje, S.; Sarkar, O.; Mohan, S.V. Food waste biorefinery: Sustainable strategy for circular bioeconomy. Bioresour. Technol. 2018, 248, 2–12. [Google Scholar] [CrossRef] [PubMed]
  2. Patterman, C.; Aguilar, A. The origins of the bioeconomy in the European Union. New Biotechnol. 2018, 40, 20–24. [Google Scholar] [CrossRef] [PubMed]
  3. European Commission. Communication from the Commission to the European Parliament, the Council, the European Economic and Social Committee and the Committee of the Regions. Innovating for Sustainable Growth: A Bioeconomy for Europe; EC: Brussels, Belgium, 2012. [Google Scholar]
  4. Ronzon, T.; M’Barek, R. Brief on Jobs and Growth of the Bioeconomy 2009–2015; Publications Office of the European Union: Luxembourg, 2018. [Google Scholar]
  5. Phillips, D.; Mitchell, E.J.S.; Lea-Langton, A.R.; Parmar, K.R.; Jones, J.M.; Williams, A. The use of conservation biomass feedstocks as potential bioenergy resources in the United Kingdom. Bioresour. Technol. 2016, 212, 271–279. [Google Scholar] [CrossRef] [PubMed]
  6. Dias, A.C.; Arroja, L. Environmental impacts of eucalypt and maritime pine wood production in Portugal. J. Clean. Prod. 2012, 37, 368–376. [Google Scholar] [CrossRef]
  7. Nunes, J.; Freitas, H. An indicator to assess the pellet production per forest area. A case-study from Portugal. For. Policy Econ. 2016, 70, 99–105. [Google Scholar] [CrossRef]
  8. Quinteiro, P.; Tarelho, L.; Marques, P.; Martin-Gamboa, M.; Freire, F.; Arroja, L.; Dias, A.C. Life cycle assessment of wood pellets and wood split logs for residential heating. Sci. Total Environ. 2019, 689, 580–589. [Google Scholar] [CrossRef]
  9. Strzalka, R.; Schneider, D.; Eicker, U. Current status of bioenergy technologies in Germany. Renew. Sustain. Energy Rev. 2017, 72, 801–820. [Google Scholar] [CrossRef]
  10. Ferreira, J.; Esteves, B.; Cruz-Lopes, L.; Evtuguin, D.V.; Domingos, I. Environmental advantages through producing energy from grape stalk pellets instead of wood pellets and other sources. Int. J. Environ. Stud. 2018, 75, 812–826. [Google Scholar] [CrossRef]
  11. Paredes-Sánchez, J.P.; López-Ochoa, L.M.; López-González, L.M.; Las-Heras-Casas, J.; Xiberta-Bernata, J. Evolution and perspectives of the bioenergy applications in Spain. J. Clean. Prod. 2019, 213, 553–568. [Google Scholar] [CrossRef]
  12. Zhou, P.; Ang, B.W.; Poh, K.L. Decision analysis in energy and environmental modeling: An update. Energy 2006, 31, 2604–2622. [Google Scholar] [CrossRef]
  13. International Organization for Standardization. ISO 14040:2006 Environmental Management—LIFE Cycle Assessment—Principles and Framework; ISO: Geneva, Switzerland, 2006. [Google Scholar]
  14. International Organization for Standardization. ISO 14044:2006 Environmental Management—Life Cycle Assessment—Requirements and Guidelines; ISO: Geneva, Switzerland, 2006. [Google Scholar]
  15. Munda, G. Multi criteria decision analysis and sustainable development. In Multiple Criteria Decision Analysis: State of the Art Surveys; Figueira, J., Greco, S., Ehrogott, M., Eds.; Springer: New York, NY, USA, 2005; pp. 953–986. [Google Scholar]
  16. Wang, J.J.; Jing, Y.Y.; Zhang, C.F.; Zhao, J.H. Review on multi-criteria decision analysis aid in sustainable energy decision-making. Renew. Sustain. Energy Rev. 2009, 13, 2263–2278. [Google Scholar] [CrossRef]
  17. Ibánez-Forés, V.; Bovea, M.D.; Pérez-Belis, V. A holistic review of applied methodologies for assessing and selecting the optimal technological alternative from a sustainability perspective. J. Clean. Prod. 2014, 70, 259–281. [Google Scholar] [CrossRef]
  18. Belton, V.; Stewart, T. Multiple Criteria Decision Analysis. An Integrated Approach; Kluwer: Boston, MA, USA, 2002. [Google Scholar]
  19. Dias, L.C.; Silva, S.; Alçada-Almeida, L. Multi-criteria environmental sustainability assessment with an additive model. In Handbook on Methods and Applications in Environmental Studies; Ruth, M., Ed.; Edward Elgar: Northampton, UK, 2015; pp. 450–472. [Google Scholar]
  20. Antunes, C.H.; Henriques, C.O. Multi-Objective Optimization and Multi-Criteria Analysis Models and Methods for Problems in the Energy Sector. In Multiple Criteria Decision Analysis; Greco, S., Ehrgott, M., Figueira, J., Eds.; Springer: New York, NY, USA, 2016. [Google Scholar]
  21. Martín-Gamboa, M.; Iribarren, D.; García-Gusano, D.; Dufour, J. A review of life-cycle approaches coupled with Data Envelopment Analysis within multi-criteria decision analysis for sustainability assessment of energy systems. J. Clean. Prod. 2017, 150, 164–174. [Google Scholar] [CrossRef]
  22. Scott, J.A.; Ho, W.; Dey, P.K. A review of multi-criteria decision-making methods for bioenergy systems. Energy 2012, 42, 146–156. [Google Scholar] [CrossRef]
  23. Schröder, T.; Lauven, L.P.; Beyer, B.; Lerche, N.; Geldermann, J. Using PROMETHEE to assess bioenergy pathways. Cent. Eur. J. Oper. Res. 2019, 27, 287–309. [Google Scholar] [CrossRef]
  24. Myllyviita, T.; Leskinen, P.; Lähtinen, K.; Pasanen, K.; Sironen, S.; Kähkönen, T.; Sikanen, L. Sustainability assessment of wood-based bioenergy—A methodological framework and a case-study. Biomass Bioenergy 2013, 59, 293–299. [Google Scholar] [CrossRef]
  25. Kontu, K.; Rinne, S.; Olkkonen, V.; Lahdelma, R.; Salminen, P. Multicriteria evaluation of heating choices for a new sustainable residential area. Energy Build. 2015, 93, 169–179. [Google Scholar] [CrossRef]
  26. Alanne, K.; Salo, A.; Saari, A.; Gustafsson, S.I. Multi-criteria evaluation of residential energy supply systems. Energy Build. 2007, 39, 1218–1226. [Google Scholar] [CrossRef]
  27. Campisi, D.; Gitto, S.; Morea, D. An evaluation of energy and economic efficiency in residential buildings sector: A multi-criteria analysis on an Italian case study. Int. J. Energy Econ. Policy 2018, 8, 185–196. [Google Scholar]
  28. Fishburn, P.C. Utility Theory for Decision Making; Wiley: New York, NY, USA, 1970. [Google Scholar]
  29. Hwang, C.L.; Yoon, K. Multiple Attribute Decision Making—Methods and Applications—A State-of-the-Art Survey; Springer: Berlin, Germany, 1981. [Google Scholar]
  30. Roy, B. Classement et choix en présence de points de vue multiples (La méthode ELECTRE). Rev. Fr. Inform. Rech. Opér. 1968, 2, 57–75. [Google Scholar]
  31. Brans, J.P.; Vincke, P. A preference ranking organisation method (The PROMETHEE method for multiple criteria decision-making). Manag. Sci. 1985, 31, 647–656. [Google Scholar] [CrossRef]
  32. Zangheri, P.; Armani, R.; Pietrobon, M.; Pagliano, L.; Fernández Boneta, M.; Müller, A. Heating and Cooling Energy Demand and Loads for Building Types in Different Countries of the EU; Deliverable 2.3. of WP2 of the Entranze Project; Polytechnic University of Turin, End-Use Efficiency Research Group: Turin, Italy, 2014. [Google Scholar]
  33. Ministry of Public Works, Transport and Communications. Decree-law n° 80/2006 of 4 April corresponding to the Regulation of product characteristics for thermal performance in buildings. D. Repúb. 2016, 67, 2468–2513. [Google Scholar]
  34. Huijbregts, M.A.J.; Steinmann, Z.J.N.; Elshout, P.M.F.M.; Stam, G.; Verones, F.; Vieira, M.D.M.; Zijp, M.; van Zelm, R. ReCiPe 2016: A Harmonized Life Cycle Impact Assessment Method at Midpoint and Enpoint Level—Report 1: Characterization; National Institute for Public Health and the Environment: Bilthofen, The Netherlands, 2016. [Google Scholar]
  35. Petrusa, J.; Norris, S.; Depro, B. Regulatory Impact Analysis (RIA) for Proposed Residential Wood Heaters NSPS Revision; U.S. Environmental Protection Agency: Washington, DC, USA, 2014.
  36. Short, W.; Packey, D.J.; Holt, T. A Manual for the Economic Evaluation of Energy Efficiency and Renewable Energy Technologies; National Renewable Energy Laboratory: Golden, CO, USA, 1995. [Google Scholar]
  37. García-Gusano, D.; Espegren, K.; Lind, A.; Kirkengen, M. The role of the discount rates in energy systems optimisation models. Renew. Sustain. Energy Rev. 2016, 59, 56–72. [Google Scholar] [CrossRef]
  38. Steinbach, J.; Staniaszek, D. Discount Rates in Energy System Analysis; Buildings Performance Institute Europe: Berlin, Germany, 2015. [Google Scholar]
  39. Association of Forestry Producers of Portugal. Forest Markets. Available online: http://www.apfc.pt/ (accessed on 18 October 2018).
  40. Eurostat, Energy Prices. Available online: https://ec.europa.eu/eurostat/web/energy/data/database (accessed on 18 October 2018).
  41. Chau, J.; Sowlati, T.; Sokhansanj, S.; Preto, F.; Melin, S.; Bi, X. Techno-economic analysis of wood biomass boilers for the greenhouse industry. Appl. Energy 2009, 86, 364–371. [Google Scholar] [CrossRef]
  42. Dias, A.C.; Arroja, L.; Capela, I. Carbon dioxide emissions from forest operations in Portuguese eucalypt and maritime pine stands. Scand. J. For. Res. 2007, 22, 422–432. [Google Scholar] [CrossRef]
  43. Hunsberger, R.; Mosey, G. Pre-Feasibility Analysis of Pellet Manufacturing on the Former Loring Air Force Base Site; National Renewable Energy Laboratory: Golden, CO, USA, 2014. [Google Scholar]
  44. Dos Santos, A.J.R. Work-Related Accidents in Portugal: Contributions to the Improvement of Prevention Effectiveness; University of Algarve: Faro, Portugal, 2017. [Google Scholar]
  45. Instituto da Conservação da Natureza e das Florestas (ICNF). IFN6—Áreas dos Usos do Solo e das Espécies Florestais de Portugal Continental. Resultados Preliminare; Instituto da Conservação da Natureza e das Florestas: Lisboa, Portugal, 2013. [Google Scholar]
  46. Dias, L.C.; Domingues, A.R. On multi-criteria sustainability assessment: Spider-gram surface and dependence biases. Appl. Energy 2014, 113, 159–163. [Google Scholar] [CrossRef]
  47. Domingues, A.R.; Marques, P.; Garcia, R.; Freire, F.; Dias, L.C. Applying Multi-Criteria Decision Analysis to the Life-Cycle Assessment of Vehicles. J. Clean. Prod. 2015, 107, 749–759. [Google Scholar] [CrossRef]
  48. Dias, L.C.; Passeira, C.; Malça, J.; Freire, F. Integrating Life-Cycle Assessment and Multi-Criteria Decision Analysis to compare alternative biodiesel chains. Ann. Oper. Res. 2016, 1–16. [Google Scholar] [CrossRef]
  49. Figueira, J.; Greco, S.; Roy, B.; Slowinski, R. An overview of ELECTRE methods and their recent extensions. J. Multi Criteria Decis. Anal. 2013, 20, 61–85. [Google Scholar] [CrossRef]
  50. Bouyssou, D. Ranking methods based on valued preference relations: A characterization of the net flow method. Eur. J. Oper. Res. 1992, 60, 61–67. [Google Scholar] [CrossRef]
  51. Prado-Lopez, V.; Seager, T.P.; Chester, M.; Laurin, L.; Bernardo, M.; Tylock, S. Stochastic multiattribute analysis (SMAA) as an interpretation method for comparative life-cycle assessment (LCA). Int. J. Life Cycle Assess. 2014, 19, 405–416. [Google Scholar] [CrossRef]
  52. Butler, J.; Jia, J.; Dyer, J. Simulation techniques for the sensitivity analysis of multi-criteria decision models. Eur. J. Oper. Res. 1997, 103, 531–546. [Google Scholar] [CrossRef]
  53. United Nations. Transforming Our World: The 2030 Agenda for Sustainable Development; United Nations: New York, NY, USA, 2015. [Google Scholar]
Figure 1. Simplified diagram of the wood-based residential heating alternatives in the MCDA prioritisation (E = eucalypt; MP = maritime pine).
Energies 12 04391 g001
Figure 2. Ranking (equal weighted) of wood-based residential heating alternatives obtained through application of: (i) WSM, (ii) TOPSIS, (iii) ELECTRE, and (iv) PROMETHEE.
Energies 12 04391 g002
Table 1. List of wood-based alternatives residential heating considered in the multi-criteria decision analysis (MCDA) prioritisation.
AlternativeCodeDescription 1
Pellet stove, maritime pinePS–MPThermal energy generation through combustion of maritime pine pellets (annual consumption of 0.53 t) in a pellet stove (energy conversion efficiency of 82%; 9.50 kWth of nominal power)
Wood stove, eucalyptWS–EThermal energy generation through combustion of eucalyptus split logs (annual consumption of 0.70 t) in a wood stove (energy conversion efficiency of 65%; 18.20 kWth of nominal power)
Wood stove, maritime pineWS–MPThermal energy generation through combustion of maritime pine split logs (annual consumption of 0.66 t) in a wood stove (energy conversion efficiency of 65%)
Fireplace, eucalyptF–EThermal energy generation through combustion of eucalyptus split logs (annual consumption of 4.56 t) in a fireplace (energy conversion efficiency of 10%)
Fireplace, maritime pineF–MPThermal energy generation through combustion of maritime pine split logs (annual consumption of 4.32 t) in a fireplace (energy conversion efficiency of 10%)
1 The main assumptions taken into account for each alternative are based on Quinteiro et al. [8].
Table 2. Description of indicators included in the MCDA for prioritisation of wood-based residential heating alternatives.
IndicatorsCodeUnit
Global warming potentialenv1kg CO2 eq·yr−1
Terrestrial acidificationenv2kg SO2 eq·yr−1
Freshwater eutrophicationenv3kg P eq·yr−1
Ozone formation—human healthenv4kg NOx eq·yr−1
Annualised capital costsec1€·yr−1
Annual operation and maintenance costsec2€·yr−1
Annual working hours—feedstock productionsoc1h·yr−1
Annual number of days of absence due to non-fatal accidentssoc2days·yr−1
Table 3. Indicator results applied in the MCDA for prioritisation of wood-based residential heating alternatives.
AlternativeEnv1Env2Env3Env4Ec1Ec2Soc1Soc2
PS–MP62.240.631.49·10−21.47126.62210.341.921.39·10−3
WS–E181.120.644.72·10−32.31108.10107.271.319.85·10−4
WS–MP177.930.474.01·10−32.14108.1097.461.188.92·10−4
F–E973.424.091.84·10−214.8457.48328.648.496.40·10−3
F–MP957.462.971.40·10−213.8057.48265.167.695.80·10−3
Table 4. Scores (equal weighted) of wood-based residential heating alternatives obtained through application of: (i) WSM, (ii) TOPSIS, (iii) ELECTRE, and (iv) PROMETHEE.
AlternativeWSMTOPSISELECTREPROMETHEE
PS–MP0.5900.623−10.162
WS–E0.7420.678−10.425
WS–MP0.7620.68220.475
F–E0.2500.321−1−0.662
F–MP0.3740.3641−0.400
Table 5. Weight vectors emphasising each sustainability dimension with 75% of the weight.
PrioritywEnv1wEnv2wEnv3wEnv4wEc1wEc2wSoc1wSoc2
Environmental0.1875 (3/16)0.1875 (3/16)0.1875 (3/16)0.1875 (3/16)0.0625 (1/16)0.0625 (1/16)0.0625 (1/16)0.0625 (1/16)
Economic0.0417 (1/24)0.0417 (1/24)0.0417 (1/24)0.0417 (1/24)0.375 (3/8)0.375 (3/8)0.0417 (1/24)0.0417 (1/24)
Social0.0417 (1/24)0.0417 (1/24)0.0417 (1/24)0.0417 (1/24)0.0417 (1/24)0.0417 (1/24)0.375 (3/8)0.375 (3/8)
Table 6. Rank probabilities with stochastic weights.
AlternativeRank 1stRank 2ndRank 3rdRank 4thRank 5th
WSMPS–MP1.5%1.0%79.2%7.5%10.8%
WS–E-90.4%5.1%4.4%0.1%
WS–MP91.8%3.6%4.0%0.4%0.2%
F–E0.5%4.0%0.3%6.4%88.9%
F–MP6.2%1.0%11.5%81.3%<0.1%
TOPSISPS–MP11.7%1.6%73.6%3.0%10.1%
WS–E<0.177.0%11.9%8.1%3.0%
WS–MP76.3%10.5%9.3%2.8%1.1%
F–E2.1%8.6%0.3%6.5%82.6%
F–MP9.9%2.4%5.0%79.6%3.2%
ELECTREPS–MP24.1%0.5%27.3%-48.2%
WS–E2.8%0.2%49.9%1.4%45.8%
WS–MP78.8%0.2%19.0%1.2%0.8%
F–E-2.9%6.6%90.6%-
F–MP3.1%93.4%2.8%0.8%-
PROMETHEEPS–MP5.4%3.2%74.4%8.3%8.7%
WS–E-84.0%11.3%4.2%0.5%
WS–MP87.6%7.5%3.4%0.9%0.5%
F–E0.5%4.1%0.4%4.7%90.3%
F–MP6.5%1.2%10.5%81.9%<0.1%
Table 7. Scores (equal weighted considering hierarchy) of wood-based residential heating alternatives obtained through application of: (i) WSM, (ii) TOPSIS, (iii) ELECTRE, and (iv) PROMETHEE.
AlternativeWSMTOPSISELECTREPROMETHEE
PS–MP0.5200.541−2−0.015
WS–E0.6810.59400.217
WS–MP0.6970.59820.247
F–E0.3330.411−1−0.314
F–MP0.4390.4441−0.135
Table 8. Rank probabilities with stochastic weights considering the dimension-indicators hierarchy.
AlternativeRank 1stRank 2ndRank 3rdRank 4thRank 5th
WSMPS–MP1.4%0.9%61.7%8.8%27.2%
WS–E-74.8%9.0%15.8%0.3%
WS–MP76.5%5.2%13.5%2.8%2.0%
F–E4.5%13.7%0.5%10.7%70.5%
F–MP17.6%5.3%15.2%61.8%<0.1%
TOPSISPS–MP7.3%1.0%65.7%3.6%22.4%
WS–E<0.1%65.9%9.1%20.0%5.0%
WS–MP65.7%7.9%18.2%5.1%3.2%
F–E7.1%17.8%0.3%7.0%67.8%
F–MP19.8%7.4%6.8%64.3%1.7%
ELECTREPS–MP21.0%0.5%14.7%-63.7%
WS–E11.9%0.5%59.7%1.7%26.2%
WS–MP80.5%0.5%11.5%1.6%5.9%
F–E0.1%8.8%14.2%77.0%-
F–MP1.8%80.4%11.9%6.0%-
PROMETHEEPS–MP3.8%2.1%60.7%9.8%23.5%
WS–E<0.1%71.4%13.6%14.3%0.7%
WS–MP74.1%7.9%10.4%4.0%3.6%
F–E4.6%13.1%0.7%9.5%72.2%
F–MP17.5%5.5%14.6%62.4%<0.1%

