Abstract
In a general building retrofit process, the reinforcement of insulation performance or air-tightness in walls and windows are conducted to reduce the maximum cooling and heating load of buildings. A heat source consists of heat-source equipment and water-pipe systems, which are replaced with high-efficient specification materials. Most of them are simply replaced with the same capacity as the previous heating equipment. This study aims to investigate matters required for decision making in a retrofit plan, such as conducting an investigation of the maximum load reduction in buildings obtained by the retrofit and the capacity of heat-source equipment that reflects the reduction, and the re-use or replacement of the water-pipe system, etc. in advance. This study verified that when the capacity of heat-source equipment was reduced, the pipe diameter of the water-pipe system was also decreased, but if existing pipes were re-used, the transportation power of the pump was reduced due to the reduction in flow velocity. The changes in maximum cooling and heating load through retrofit were quantitatively verified compared to that of the initial design of the building based on previous study results, and flow rates of cool and hot water were determined by re-calculating the capacity of the heat-source equipment. Using the results, the water-pipe system was re-designed, and the annual transportation power of the pump was calculated through simulations. The calculation results verified that the transportation power decreased by up to approximately 10% when oversized pipes were re-used from the existing water-pipe system. Additionally, when the capacity of the heat-source equipment was decreased, reasonable measures considering remodeling, construction duration, and cost were derived.
1. Introduction
About 36% of global energy consumption is attributed to residential and commercial buildings (41% in Europe, 34% in the USA, 34% in Japan, and 24% in Korea) [1]. Thus, steady research and development of methodologies to reduce energy consumption in buildings have been conducted. South Korea has strengthened insulation standards for new buildings to meet a passive house level, which has been used in Germany since 2017, and has encouraged low-consumption energy buildings by using policies such as green building certification and energy efficiency ratings, etc. [2]. Moreover, the energy reduction in existing buildings, which account for about 97% of all buildings, is also very important and has, therefore, been studied under the name of “green remodeling” [3]. The retrofit ratio of the buildings in the permit area from 2002 to 2012 amounted to about 20% [4], among which green remodeling was concentrated mostly in residential buildings [5]. In addition, the survey result of building completion year showed that the number of buildings completed between 1991 and 2000 was 8735, which was the largest, followed by buildings between 1981 and 1990, exhibiting that most buildings were completed from 10 to 30 years ago.
Figure 1 [6] shows the survey results of green retrofits, which exhibit the current status of applicable component technologies per building purpose. Among the component technologies, the replacement with high-performance windows accounts for 38%, which is the highest, followed by insulation reinforcement at 26%. As shown in this figure, windows, insulation, and light-emitting diode (LED) light replacement are the general methodologies used currently as component technologies to save energy during a retrofit.
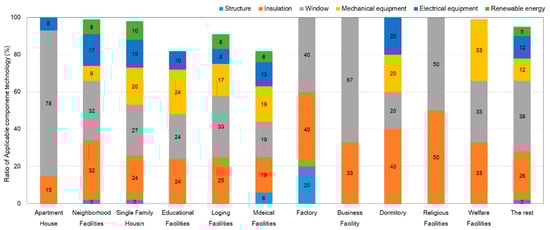
Figure 1.
Analysis for applicable component technology.
The changes in the maximum cooling and heating loads occur after a retrofit where window replacement and envelope insulation reinforcement are applied. In addition, the retrofit execution time is the same as the replacement time of heat-source equipment due to deterioration, in which the same capacity of high-efficiency heat-source equipment is used in the replacement. However, an over-design of heat-source equipment has been pointed out in existing studies [7,8]. In particular, a study by [9] emphasized the importance of the investigation of the maximum cooling and heating load at the time of the design of the heat-source system. That is, the change in maximum cooling and heating load may occur during the retrofit of buildings due to the reinforcement of energy-saving design standards, etc. Thus, with a simple replacement of heat-source devices without considering proper capacity, an over-estimation of the device capacity may occur. Thus, this could lead to energy waste due to low-load operation, or increased construction duration and cost due to the replacement with high-efficiency equipment.
Accordingly, the present study aims to consider the changes that maximum cooling and heating loads induced through the replacement of windows and reinforcement of insulation performance in deteriorating buildings, particularly for large office buildings in Korea, and to search for a retrofit method that minimizes the replacement of heat-source equipment.
2. Research Scope and Method
The process for the reduction in CO2 emissions and energy-saving measures in existing office buildings is generally as follows [10]. First, the energy consumption status and characteristics of buildings are identified to determine when, where, how, and for which purpose energy is consumed. Then, effective measures according to the building energy characteristics are adopted and executed in timely manner. After this, the plan → do → check → action (PDCA) cycle is iterated to conduct building operations. Figure 2 shows the diagram of research process. To determine the energy consumption of existing buildings, previous studies were referenced [11,12]. The change in the internal heat gain was quantitatively verified per year using [11], and the energy consumption status of the entire building was determined using minutesecond12]. Accordingly, the present study conducted a replacement of a heat-source system during a retrofit according to changes in the heat-source capacity based on the previous study [12] where the maximum cooling and heating loads were quantitatively studied according to the execution of an envelope retrofit on the basis of Step 2 in Figure 2.
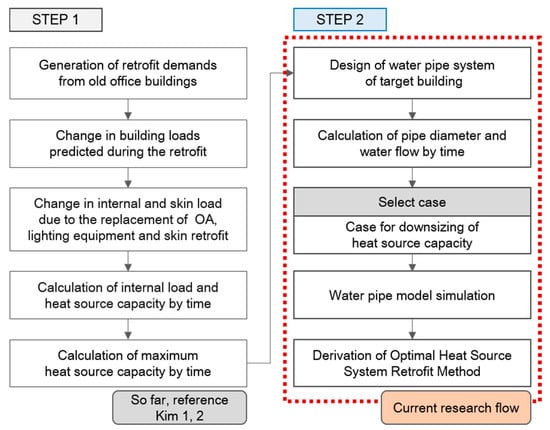
Figure 2.
Energy-saving process in the existing building.
2.1. Overview of the Target Building
Based on the study results by [5], the completion date of the target building was 1985, around 30 years ago, and the building was set up using the large office reference model of EnergyPlus [13]. The detailed overview of the building is presented in Table 1. Figure 3 shows the typical floor of the target office. The cooling and heating area was set to occupy 60% of the total floor area based on the study result by [14].

Table 1.
Detailed overview of target office building.
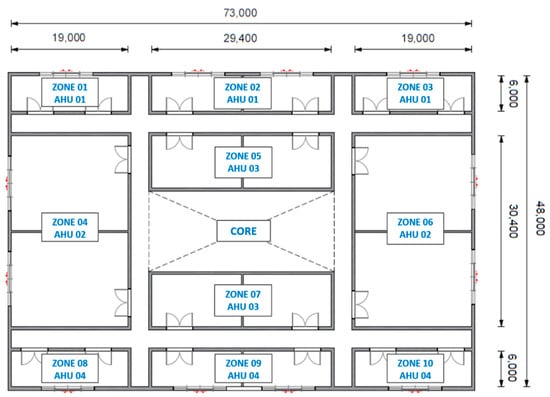
Figure 3.
Zoning of the target office typical floor (unit: mm).
The region of the target building is Seoul, Korea, which is characterized by severe and dry winters and hot humid summer (Dwa) according to the Köppen climate classification. Considering this climate, the detailed design conditions presented in Table 2 were set up by applying design values that conformed to the energy-saving design standards [15].
Table 2.
Detailed design conditions.
2.2. Overview of Target Heating, Ventilation, and Air-Conditioning (HVAC) System
The heating, ventilation, and air-conditioning (HVAC) system consisted of two absorption chillers and heaters, an constant air volume air-handling unit (CAV AHU) and fan coil units (FCU), which were widely applied in the 1980s considering the load processing amount and completion time, etc. Table 3 presents the detailed design conditions of the HVAC system where the energy-saving design standards of building are applied.
Table 3.
Detailed design conditions for heat-source equipment.
As for the energy consumption per equipment of chiller systems using two chillers, the information presented in Table 4 was used [16]. The energy consumption by the pumps in the HVAC system accounted for about 20% of the total consumption annually. Since the change in the flow rate due to the change in cooling and heating loads in the HVAC system influence the pump power, it is necessary to quantitatively verify the change. Thus, this study configured the HVAC system as shown in Figure 4, and adopted a system that controlled the flow rate during cooling and heating according to the opening of a bypass valve. In addition, pipes in the system were connected in parallel to identify the correlation of pump power, pipe diameters, and flow rate with regard to two in-line circulation pumps, which were interoperated with the absorption chillers and heaters.
Table 4.
Energy consumption per equipment according to the configuration of the heating, ventilation, and air-conditioning (HVAC) system.
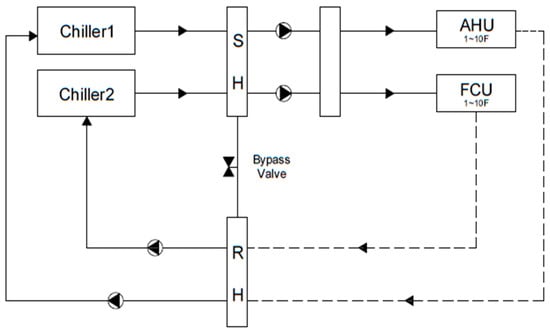
Figure 4.
HVAC system diagram for the target office.
Table 5 [17] presents the specifications of the absorption chillers and heaters adopted in the HVAC system. The device capacities were selected based on the maximum cooling load, and the cooling and heating capacities were changed by limiting to the range of the equipment that had the same performance when loads were changed due to the retrofit.
Table 5.
Specifications of the absorption chiller and heater.
The pump for circulating the cooling and hot water was a single-stage in-line type, and the head of fluid and pump was set to about 50 m considering the height of the target building. Figure 5 shows the pump head and efficiency, in which the rated power was 90 kW, the flow rate was 160–480 m3/h, and the head was 44 to 53.2 m.
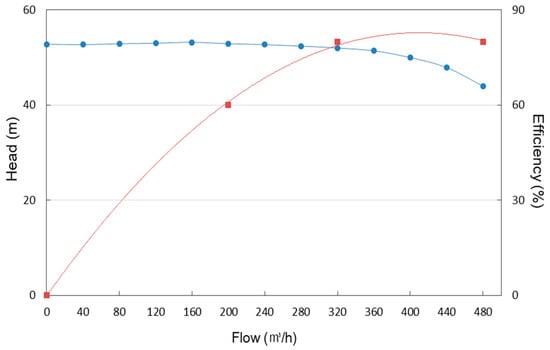
Figure 5.
Head and efficiency of the in-line circulation pump.
2.3. Study Methodology
This study aimed to determine the current status of building loads in Korea and to reflect the actual retrofit level based on the current status. To do this, this study identified the detailed status of large office buildings through literature reviews [11], and quantitatively summarized the changes in internal loads, such as the office automation (OA) equipment load and the heat load from occupants, as well as the building skin loads due to architectural design standards. Reference [11] examined the device-specific catalog of elements for each year of internal load and quantitatively showed the variation of internal load. The result is shown in Figure 6, Figure 6 shows the changes in power consumption of OA equipment, and lighting fixtures (fluorescent light and light-emitting diodes (LED)), and heat loads from occupants for the past 30 years. The OA equipment load in 2015 increased by about 49.6% compared to that in 1985, and the lighting load decreased by about 47% due to the replacement with LED light.
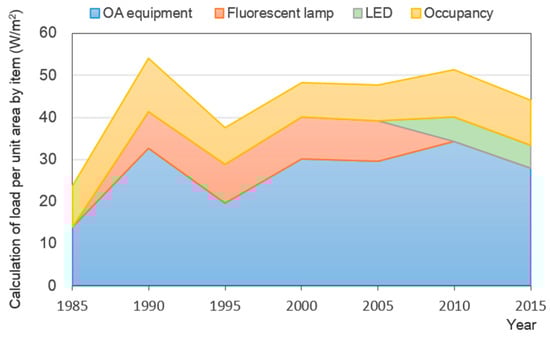
Figure 6.
Changes in indoor heat load for the past 30 years calculated in previous study [11].
Table 6 presents the thermal transmittance criteria of external walls for 30 years from 1985 to 2015 for non-residential buildings in the Korean central resion. The survey results of envelope load [12] exhibited that the regulations for the insulation performance of external walls and windows has been steadily strengthened. As a result, the insulation performance of external walls, roofs, floors, and windows, which are in direct contacted with outdoor air, have improved by 53%, 69%, 50%, and 40%, respectively in the past 30 years.
Table 6.
Changes in the thermal transmittance of envelope design criteria in South Korea (unit: W/m2·K).
The maximum cooling and heating load can be calculated by determining the current status of the indoor heat and envelope loads in large office buildings using previous studies. In addition, the capacity of the absorption chiller and heater, the flow rate of the water supply during cooling and heating, and pipe diameter, etc. can be identified based on the maximum cooling and heating load. Finally, the retrofit measure of the heat-source systems that can respond to the changed loads due to the retrofit was examined through calculations.
Figure 7 is presented to determine the maximum load comparison between the first design and retrofit and the current status of loads in a large office building by design time. Four scenarios with five-year intervals were set to determine the operation status of actual office buildings due to strengthening of regulations and technical advancements, and the current status of loads by retrofit time can be determined for each scenario.
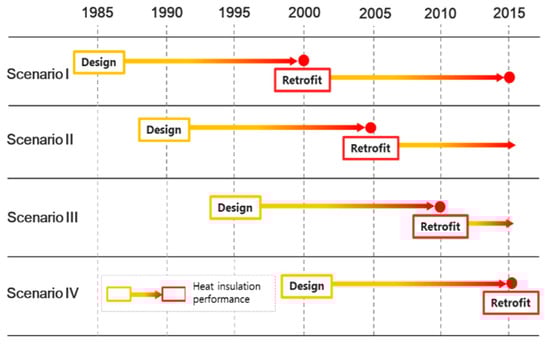
Figure 7.
Retrofit and scenario overview.
Figure 7 is presented to determine the maximum load comparison between the first design and retrofit and the current status of loads in a large office building by design time. Four scenarios with five-year intervals were set to determine the operation status of actual office buildings due to strengthening of regulations and technical advancements, and the current status of loads by retrofit time can be determined for each scenario. In a previous study on four scenarios by [12], the maximum load calculation, and a load reduction rate between completion and retrofit were determined. The internal and envelope loads identified, were calculated using a Korean calculation tool called RTS-SAREK(Radiant Time Series-The Society of Air-Conditioning and Refrigerating Engineers of Korea). RTS-SAREK was used in the previous study as a tool to calculate the maximum load of a building and the capacity of the heat-source equipment. The changes in loads that may occur during the retrofit, such as the exchange of high-insulation and air-tight windows, the strengthening of insulation performance in external walls, the replacement of internal OA equipment due to aging, and LED light replacement were quantitatively considered. The calculation results are presented in Table 7.
Table 7.
Calculated results of the maximum cooling and heating load for each scenario.
For the general retrofit of HVAC systems, not only heat-source devices but also corroded water pipes are also replaced. Steel pipes are widely used for pipes of coolant water and hot and chilled water, and the service life of steel pipes in Korea is set to 30 years by regulation [18]. When existing pipes are regenerated using lining methods, the construction period is shortened and the construction cost is decreased, as well as extending the possible durability [19]. In addition, construction methods to regenerate aging pipes have been developed. Thus, when internal scales in cast-iron and steel pipes that are structurally still usable are removed, and pipe renewal methods, such as forming a protective coating inside the pipe through lining work is performed, the need to completely replace the water-pipe system is reduced.
Since the present study aimed to minimize the replacement of equipment, it created simulation models for each case (Table 8) of the replacement range of aged heat-source systems and calculated each of the models. All cases assume that the maximum load of the building is reduced due to a retrofit. Case 1 refers to a case where the same capacity of absorption chiller and heater and the pipe size with those of existing ones are used. Case 2 refers to a reduction in the capacity of heat-source equipment and the reuse of existing water pipes. Here, the water-pipe system becomes oversized compared to the corresponding heat-source equipment. Case 3 refers to the downsizing of both the heat-source equipment capacity and the water pipe size. It means a complete replacement of the heat-source system.
Table 8.
Selection of cases regarding a range of water pipe replacement in the heat-source system during the retrofit.
3. Design of Water-Pipe System
The water pipe design of the HVAC system and the target building should determine prior to simulations. The flow rate of supplied cooling and hot water that corresponds to the load using the specifications of the absorption chiller and heater are calculated, thereby allowing for the selection of a pipe size suitable for each flow rate. The purpose of this selection is to perform simulations per case according to a replacement range of heat-source systems and four scenarios whose design and retrofit times are different.
3.1. Calculation of Cooling and Hot Water Flow Rate
The specifications for the equipment for design and retrofit times of the four scenarios were selected using the calculation results of maximum cooling and heating load in the target building, which was conducted in a previous study [12] and the specifications of the absorption chiller and heater in Table 5. As a result, the change rate due to applying the absorption chiller and heater was the same in both cooling and heating, and the capacity of the heat source was reduced by the retrofit in all scenarios (Table 9). The reason for the largest reduction in Scenarios I and IV was due to the reduction in the maximum load in the building as the insulation performance of the envelopes was improved by law at the time of retrofit.
Table 9.
Capacity of absorption water heater/cooler due to retrofit in each scenario (* Retrofitting).
After this, the cooling and hot water flow rates were calculated for the water pipe-system design based on Table 10. The calculation items were the flow rate to process the indoor load of the building, changes in flow rate at the time of design and retrofit, and flow rates according to the specifications of the absorption chiller and heater. Since the heat-source equipment was selected based on the maximum cooling load, the hot water flow rate was large in most cases. Thus, a method to adjust the supplied hot water amount during heating by the opening of the bypass pipes using a valve was adopted. In addition, the results verified that both the flow rates of cooling and the hot water were reduced with the reduction of loads due to the retrofit compared to those at the design time.
Table 10.
Comparison of calculated cooling and hot water flow rates and specifications of absorption chiller and heater. (* Retrofitting).
3.2. Calculation of Values Applied in Simulation by Scenario
The pipe diameter of the absorption chiller and heater ranged from 200 to 250 A, carbon steel pipes were used for pipes of the water-pipe system, the friction-head loss was 30 to 40 mmAq/m, and the flow rate was 2.0 m/s in all scenarios.
Each of the values applied to the water pipe simulation are presented in Table 11, Table 12 and Table 13. In the tables, the maximum load that should be processed during cooling and heating, the flow rates of absorption chiller and heater, the supplied flow rate required to process actual loads, and the inner diameters of water pipes that correspond the flow rate are presented. The capacity of the chiller and heater in Case 1 was not changed, but the actual processing load was reduced due to the retrofit so that the actual supply flow rate became approximately 50% to 60% of the maximum flow rate. In Case 2, which applied a downsizing of the chiller and heater due to the load reduction, the actual flow rate was 80% to 100% of the maximum water flow rate. Scenarios 2 to 4 showed a similar result.
Table 11.
Values applied in simulations in Scenario I.
Table 12.
Values applied to simulations in Scenarios 2 to 4 during cooling.
Table 13.
Values applied to simulations in Scenarios 2 to 4 during heating.
4. Simulation Result and Reviews
Simulations that analyzed the inner flow of the pipe system were conducted by applying three cases for each scenario based on the results presented in Table 11, Table 12 and Table 13, and the transportation power of the pump was reviewed.
4.1. Overview of FloMASTER V8.0
FloMASTER V8.0 was utilized to calculate the transportation power according to changes to flow rate in the water pipe. It is a program to analyze internal flows in pipes developed in the UK. It is a one-dimensional thermal flow analysis software that can be applied for analysis utilizing professional components specialized for each of the industries including automobile, ships, plants, aerospace, and oil- and gas-piping thermal flow analysis [20].
This tool is to perform analysis after entering physical values of the system in the planning phase before generating drawings and determining the validity of the design, by which changes in pressure, flow rate, and temperature between components of the system planned by the designer can be analyzed easily. The biggest advantage of this program is that it can analyze thermal fluid systems, so it can analyze the interaction with other systems under real situations according to boundary conditions of each component by reflecting the mechanical properties of complex systems.
Figure 8 shows the construction of a simulation model of the HVAC system in this study using the FloMASTER V8.0 program components. Since this study limited to the scope to the water pipes and the transportation pump in the primary heat-source system, the loss portion of flow rate in the building, and pressure due to the head were re-produced using the components for the secondary load. The HVAC system reproduced in FloMASTER V8.0 reflects Figure 4 and Figure 5, and is targeted at the system in relation to Figure 3. Configure the water flow rate and pipe diameter for the design conditions in Table 3, the instrument specifications in Table 10, and the RTS-SAREK results in Table 11, Table 12 and Table 13. The details of each component function are described in Table 14.
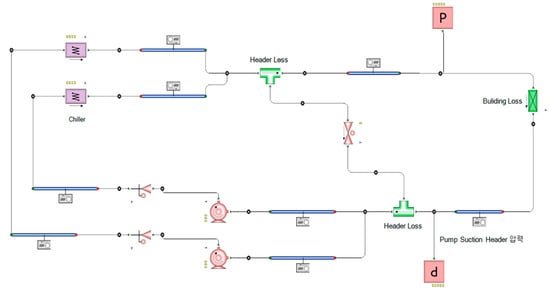
Figure 8.
HVAC system implemented using FloMASTER V8.0.
Table 14.
Component characteristics of the HVAC system.
4.2. Simulation Result and Analysis of Water Pipes
In the four scenarios in this study, the maximum cooling and heating loads and equipment capacity, etc. tended to decrease in a similar manner. Since the feature of Scenario I had two retrofits and the analysis on this was first conducted, whereas the differences compared to Scenario I were described for Scenarios 2 to 4.
4.2.1. Scenario I
In Case 1, because the maximum load was reduced due to the retrofit, the actual flow rate was 60% to 65% of the maximum flow rate of the absorption chiller and heater. This meant that the heat-source equipment operated at partial-load conditions even at the time of maximum cooling and heating, leading to the reduction in energy usage. In Case 2, the downsizing of the heat-source equipment was applied reflecting the reduction in the maximum cooling and heating load, but existing pipes were utilized. Thus, the water-pipe system is a case of oversizing operations overall. The actual flow rate was around 90% of the maximum flow rate of the heat-source equipment and pump power was reduced by around 10% due to the reduction in flow velocity. Case 3 refers to a replacement of both the equipment capacity and pipe diameter with appropriate sizes due to the reduction in maximum load. It was determined in response to the maximum load. The power of the transportation pump was reduced by about 10%, which was similar to that of Case 2.
However, since Case 3 was accompanied by the exchange of equipment in the absorption chiller and heater and entire replacement of water-pipe system, it required a much higher construction cost and longer construction time. This result indicates that energy-saving effects inside the heat-source system may be achieved due to the reduction in the flow rate and velocity just with the replacement of suitable heat-source equipment as shown in Case 2 when considering the replacement of the existing heat-source system at the time of the retrofit of buildings. In addition, since the energy waste due to the application of partial-load operation caused by over-design could be prevented, the results from Case 2 showed the best outcome.
Moreover, the reduction rate in of power in Scenario I was slightly higher, by about 2% in 2015 as compared to that of 2000, which was the year of the first retrofit. This was due to the reduction in the maximum load in 2015 compared to that of 2000, due to the result of the strong regulation enforcement of insulation performance. The above results were consistent in both cooling and heating. The detailed results are presented in Table 15.
Table 15.
Simulation results in Scenario I (cooling and heating).
4.2.2. Scenarios II to IV
Figure 9, Figure 10 and Figure 11 show the simulation results of the transportation pump for each scenario. Scenarios 2 to 4 showed a similar trend as Scenario I. That is, the power of transportation pump was reduced in Cases 2 and 3. This was because the flow velocity was decreased due to the reduction in the flow rate compared to the pipe size in Case 2, and the pump power was decreased as a result of using equipment of proper capacity in Case 3.
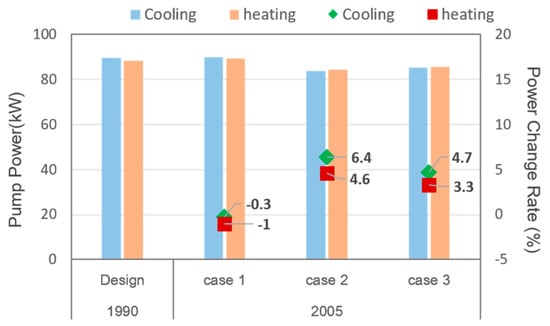
Figure 9.
Simulation results of cooling and heating transportation pump power in Scenario II.
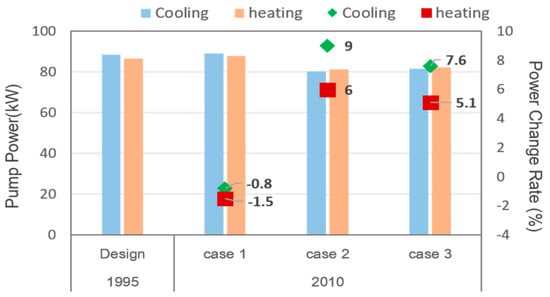
Figure 10.
Simulation results of cooling and heating transportation pump power in Scenario III.
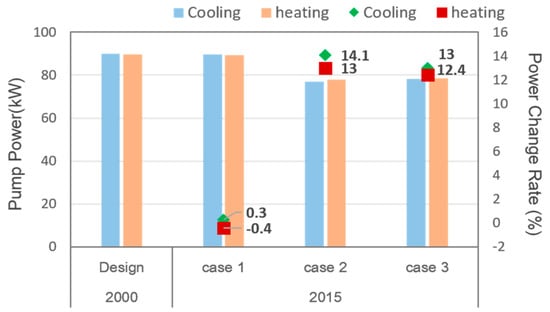
Figure 11.
Simulation results of cooling and heating transportation pump power in Scenario IV.
The most considerable power reduction rate in the transportation pump in all scenarios and was consistent with the largest reduction rate of maximum load and equipment capacity. This verified that the calculation of proper loads at the time of retrofit and the reduction in loads inside and outside the building influenced the heat-source system. Furthermore, this study applied the absorption chiller and heater for cooling and heating using a single piece of heat-source equipment. However, if the cooling and heating equipment are separated, the effects of power-saving during heating will be further improved.
Table 16 and Table 17 present the results of the above three scenarios in the figures by item, which exhibit the results having a similar pattern with those in Scenario I.
Table 16.
Values applied to simulations in Scenarios 2 to 4 during cooling.
Table 17.
Values applied to simulations in Scenarios 2 to 4 during heating.
5. Conclusions
This study aimed to search for the optimal measures of a heat-source system during retrofit to minimize the equipment replacement considering the maximum cooling and heating load that was changed due to the retrofit for large office buildings in Korea. To do this, the capacity of heat-source equipment at the time of retrofit was calculated based on the loads obtained in previous studies, and review cases including the range of the water-pipe system were selected. After this, simulations were conducted with regard to the pump power and water pipes using FloMASTER V8.0.
The simulation results exhibited that Case 2, which employed the downsizing of heat-source equipment while using the existing water pipes, was found to obtain the most substantial power reduction in transportation pump out of four scenarios. Energy was saved by about 10%, and the power of the transportation pump was also reduced when the maximum load was reduced by the retrofit conducted after the insulation performance standards were reinforced.
The results also verified that Case 1, which simply replaced existing heat-source equipment with the same capacity of equipment, increased the partial-load operation time, thereby reducing the energy performance. Case 3, which performed the retrofit using the downsizing of both heat-source equipment and water pipes, had a similar energy-saving effect with that of Case 2, but it increased the construction time and cost due to the full replacement of the system.
In summary this study determined that: (1) change rates of the indoor heat and envelope loads in large offices in Korea for past 30 years were quantitatively investigated; (2) the importance of calculating the heat-source equipment capacity at the time of retrofit compared to that of design time due to the change in maximum load was identified; and (3) retrofits can be economically feasible and efficient when a replacement of the water-pipe system in heat-source equipment was minimized based on the proper heat-source equipment selection.
Author Contributions
H.K. has searched literatures, made simulation models and wrote the paper; K.-s.P. and S.C. examined calculated values; Y.-h.S. conceived and designed the methodology the paper.
Funding
National Research Foundation of Korea : 2017R1A2B2006424.
Acknowledgments
This work was supported by the National Research Foundation of Korea (NRF) grant funded by the Korea government (MSIT) (No.2017R1A2B2006424).
Conflicts of Interest
The authors declare no conflict of interest. The founding sponsors had no role in the design of the study; in the collection, analyses, or interpretation of data; in the writing of the manuscript; and in the decision to publish the results.
References
- Futuristic Housing. Zero Energy Housing; KB Financial Group Inc.: Seoul, Korea, 2016; Volume 39. [Google Scholar]
- Park, S.H. Domestic Green Remodeling Policy Status and Market Activation Plan. In Real Estate Focus; Research Institute of KAB: Deagu, Korea, 2015; Volume 87, pp. 50–59. [Google Scholar]
- Jagarajana, R.; Asmonia, M.N.A.M.; Mohammeda, A.H.; Jaafara, M.N.; Meia, J.L.Y.; Babab, M. Green retrofitting—A review of current status, implementations and challenges. Renew. Sustain. Energy Rev. 2017, 67, 1360–1368. [Google Scholar] [CrossRef]
- Yoon, Y.S.; Park, C.H. Retrofit Trends and Implication of Building Types in Seoul; Construction & Economy Research Institute of Korea: Seoul, Korea, 2013. [Google Scholar]
- Lim, J.H.; Han, H.G.; Kang, D.R. Analysis on Green Remodeling Status, Satisfaction and Energy Saving Effect- Focusing on Window Replacing of Residential Buildings. J. Archit. Inst. Korea Struct. Constr. 2017, 3, 75–90. [Google Scholar]
- Kim, S.M. Analysis on Application of Green Remodeling Technology and Energy Saving Effect for Existing Buildings. J. KARSE 2017, 11, 238–245. [Google Scholar]
- Oh, B.K.; Ryu, B.S.; Lee, G.T.; Jun, T.Y.; Kim, W.S. According to standard building design load of the equipment capacity research. In Proceedings of the SAREK 2014 Summer Annual Conference, Pyeongchang, Korea, 25–27 June 2014. [Google Scholar]
- Kim, D.H. Performance Alternatives of the Envelope and Primary HVAC System for Existing Building’s Energy-Saving. Master’s Thesis, University of Seoul, Seoul, Korea, 2015. [Google Scholar]
- Fernando, D.M.; José, M.C.L.; Antonio, C.A. Uncertainty in peak cooling load calculations. Energy Build. 2010, 42, 1010–1018. [Google Scholar]
- Building Energy Operation Management Guidelines, Mate Plus Co., Seoul, Korea. Available online: http://www.kemco.or.kr/web/kem_home_new/info/data/open/ (accessed on 15 August 2019).
- Kim, H.M.; Park, K.S.; Kim, H.Y.; Song, Y.H. Study on variation of internal heat gain in office buildings by chronology. Energies 2018, 11, 1013. [Google Scholar] [CrossRef]
- Kim, H.M.; Park, K.S.; Kim, H.Y.; Song, Y.H. A Study on the Changes in the Heat Source Capacity and Air-Conditioning Load due to Retrofit; Focusing on a Large Office Building in Korea. Energies 2019, 12, 835. [Google Scholar] [CrossRef]
- Koo, S.J. A Study on the Design Value of Occupancy Density for Mechanical System Design of Office Building. Ph.D. Thesis, Suwon University, Hwaseong, Korea, 2017. [Google Scholar]
- Park, J.I.; Yun, J.K. Analysis HVAC Drawings of Office Building. In Proceedings of the SAREK 2005 Summer Annual Conference, Pyeongchang, Korea, 29 June–1 July 2005. [Google Scholar]
- Energy Saving Design Standard of Building; Ministry of Land, Infrastructure and Transport: Seoul, Korea, 2013.
- Chiller Application Guide AG 31-003-4, Fundamentals of Water and Air Cooled Chillers, Daikin Co. Available online: https://www.daikinapplied.com/o365/api/graphapi/GetDocument/Doc100/Daikin_AG_31-003_Chiller_Application_Guide.pdf/ (accessed on 20 August 2019).
- Direct Fired Absorption Chiller & Heating Catalog. Seoul, Shinsung Engineering Co. Available online: http://www.ishinsung.com/product/product_list/central/21/74 (accessed on 20 July 2019).
- Depreciation Rate in the Enforcement Regulation of the Corporate Tax Act, Article 15 Service Life and Service Life Table of Buildings, etc.; National Tax Service: Seoul, Korea, 2019.
- Kim, J.B. Improved durability of water supply piping by lining method. J. KARSE 1996, 13, 46–54. [Google Scholar]
- Ju, K.M. Pipeline analysis of buildings using Flowmaster v7. J. KARSE 2010, 27, 36–42. [Google Scholar]


© 2019 by the authors. Licensee MDPI, Basel, Switzerland. This article is an open access article distributed under the terms and conditions of the Creative Commons Attribution (CC BY) license (http://creativecommons.org/licenses/by/4.0/).