Article

Huff-n-Puff Experimental Studies of CO2 with Heavy Oil

1
Center for Hydrocarbon Recovery, Skolkovo Institute of Science and Technology, Moscow 121205, Russia
2
Department of Technology Development for High Viscosity and Heavy Oils, LUKOIL-Engineering LCC, Moscow 109028, Russia
3
Management Department of Scientific and Technical Projects, RITEK JSC, Moscow 115035, Russia
*
Author to whom correspondence should be addressed.
Current address: Skolkovo Innovation Center, Bolshoy Bulvar 30-1, Moscow 121205, Russia.
Energies 2019, 12(22), 4308; https://doi.org/10.3390/en12224308
Submission received: 30 September 2019 / Revised: 28 October 2019 / Accepted: 6 November 2019 / Published: 12 November 2019
(This article belongs to the Special Issue CO2 EOR and CO2 Storage in Oil Reservoirs)

Abstract

:
This work is devoted to CO2 Huff-n-Puff studies on heavy oil. Oil recovery for heavy oil reservoirs is sufficiently small in comparison with conventional reservoirs, and, due to the physical limitation of oil flow through porous media, a strong need for better understanding of tertiary recovery mechanisms of heavy oil exists. Notwithstanding that the idea of Huff-n-Puff gas injection technology for enhanced oil recovery has existed for dozens of years, there is still no any precise methodology for evaluating the applicability and efficiency of this technology in heavy oil reservoirs. Oil recovery factor is a question of vital importance for heavy oil reservoirs. In this work, we repeated Huff-n-Puff tests more than three times at five distinct pressure points to evaluate the applicability and efficiency of CO2 Huff-n-Puff injection to the heavy oil reservoirs. Additionally, the most critical factor that affects oil recovery in gas injection operation is the condition of miscibility. Experimental data allowed to distinguish the mixing zone of the light fractions of studied heavy oil samples. The experimental results showed that the pressure increase in the Huff-n-Puff injection process does not affect the oil recovery when the injection pressure stays between miscibility pressure of light components of oil and minimum miscibility pressure. It was detected that permeability decreases after Huff-n-Puff CO2 tests.

1. Introduction

The continuous increase in energy consumption [1] enhances the total demand for every type of hydrocarbon resource [2,3]. Despite the very challenging production of oil from heavy oil reservoirs, heavy oil is becoming a very prospective and valuable source of energy these days. Combined with the facts that (1) oil production from conventional reservoirs is decreasing [4], (2) tremendous heavy reserves are more than 3 times bigger than conventional oil reserves [5], and (3) tertiary oil recovery techniques are advancing each year [6,7], we predict that more and more studies about heavy oil will be published in the upcoming years.
This work is devoted to the experimental studies of CO2 applicability, efficiency, and miscibility with heavy oil by Huff-n-Puff tests. Oil recovery in heavy oil reservoirs is sufficiently small in comparison with oil recovery from conventional reservoirs due to the physical limitation of the oil flow through the porous media. As heavy oil reservoirs do not effectively respond to secondary recovery methods, the tertiary enhanced oil recovery techniques are the only practical and possible options. Therefore, a need for better understanding of tertiary recovery mechanisms for heavy oil reservoirs exists nowadays. Notwithstanding that the idea of gas injection technology for enhanced oil recovery operations, either in flooding or the Huff-n-Puff regime, was developed long time ago [8], and the first experimental studies of CO2 applicability in heavy oil reservoirs were conducted in the 1980s and 1990s [9,10], there is no precise methodology for the evaluation of applicability and efficiency of Huff-n-Puff gas injection technology in heavy oil reservoirs [11].
Huff-n-puff CO2 injection is an enhanced oil recovery technique that is widely used for conventional oil reservoirs [12] and is known as cyclic injection of CO2. The Huff-n-Puff injection is presented by three divided stages: (1) the injection stage, (2) the soaking stage, and (3) the production stage [9]; all three stages will be experimentally modeled. Oil recovery factor is a question of vital importance that petroleum companies have about hard to recover resources. The most critical factor that affects oil recovery in any gas injection operation is the condition of miscibility [13]. The injected gas can be either in the miscible or immiscible regime. Commonly, gas injection over minimum miscibility pressure (MMP) is considered as the most favorable regime with the highest possible oil recovery [14]. Miscibility depends on the number of parameters like oil composition, swelling coefficient, diffusion, solubility, and mainly on pressure, which is above MMP [15]. MMP is an indication of pressure, temperature, or gas composition when gas and oil are completely miscible in any proportions [16].
Regarding the light oil of conventional reservoirs, the determination of MMP is not very challenging: MMP of CO2 and oil can be predicted by empirical correlations, numerical simulations, and rapid experimental techniques. Most of the empirical correlations were made with the help of experimental data obtained from experiments performed with light oil. Therefore, they are hardly applicable to heavy oil [17]. For the proper numerical simulation, the composition of the oil is needed. However, the composition of heavy oil is very hard to precisely determine, and it is sufficiently different in its behavior from field to field. Due to the high compositional differences of heavy oil, it tends to have two distinct miscibility pressures at which we can reach miscibility, with light components of oil first, and only then with heavy components of oil. In the most cases related to heavy oil reservoirs, researches assume that heavy oil is not miscible because MMP in heavy oil reservoir is usually much higher than the reservoir pressure [18,19,20]. However, it also coincides with another problem—MMP determination for heavy oil is very challenging. Traditionally, MMP for the light oil can be determined by such conventional methods as the slim tube, Vanishing Interfacial Tension (VIT), and Rising Bubble Apparatus (RBA) tests. However, these techniques fail when dealing with high viscosity oil. The industrially accepted method, the slim tube test, is not physically affordable for high viscosity oil [21].
To evaluate heavy oil recovery by Huff-n-Puff CO2 injection and evaluate the miscibility conditions of CO2 and heavy oil, we implement the Huff-n-Puff gas injection tests. The studied pressure range was restricted to the field injection limitations. Obtaining oil recovery factors after five Huff-n-Puff cycles of five different pressure points expanded our knowledge on the Huff-n-Puff process and its efficiency for heavy oil reserves. Forty Huff-n-Puff gas injection tests were conducted in total. Experiments coincide with other studies where heavy oil is mainly extracted by the first three cycles of CO2 Huff-n-Puff injection [11,22]. Then, the received data allowed to distinguish the mixing zone for the light fractions of studied oil samples with CO2, proving that it is applicable for possible miscibility evaluation. Experiments shown no difference for oil recovery when injection pressure is between miscibility pressure of light components and MMP. Additionally, the change of oil composition after Huff-n-Puff tests was analyzed. Permeability reduction was observed by running core flood experiments with different solvents.

2. Materials

In this study, wellhead oil samples from heavy oilfields #1 and #2 were provided by LUKOIL-Engineering; the oil samples were free from gas. Reservoir properties are presented in Table 1. As some part of the experimental procedure is meant to be conducted under atmospheric pressure, there was no need to make recombined oil samples. Berea Sandstone core plugs were used for these Huff-n-Puff tests. The main properties of dead oil samples were measured by PVT 3000-L (Chandler Engineering, Tulsa, OK, USA) and are presented in Table 2. The compositions of the oil samples were measured by gas chromatography/mass spectrometry and presented in Table 3. The initial water content of the oilfield #1 and oilfield #2 oil samples was over 20%. Therefore, the samples were dewatered by (1) thermostabilization at 90 C for 72 h and (2) the centrifuge, PrO-ASTM BC (Centurion Scientific Ltd., Chichester, UK), at 75 C for 80 min. Every core sample was drilled from one homogeneous block of Berea sandstone. Core diameters, lengths, and helium permeability are presented in Table 4. The volume difference of used samples does not exceed 20%, the porosity is ~20%, and permeability ranges from 154 to 175 mD. The injection gas in these Huff-n-Puff tests is CO2 with purity greater than 99.99%.

3. Experimental Setup

The assemblies used in saturation operations and Huff-n-Puff tests are presented in Figure 1 and Figure 2, respectively. The assemblies are presented by two piston vessels, a climate chamber, vacuum pump, and the pump. The pump, Quizix QX (Chandler Engineering, Tulsa, OK, USA), is a piston pump with two cylinders that works in the regime of continuous delivery and receiving; it pushes the piston of the cylinder filled by oil or gas and replaces the liquid into high-pressure stainless steel container 1, which is filled by the vertically placed rock samples. The samples are placed on the piston inside the annulus of container 1, and they are free from any sleeves. The piston is adjusted on the desired level by water on the bottom side of container 1. The pump allowed to inject the gas at the pressure up to 24 MPa. The climate chamber, MK 240 (Binder GmbH, Tuttlingen, Germany), maintained the reservoir temperature with fluctuations up to 0.5 C.

4. Experimental Procedures

The experimental procedure used in this work [23] was adapted to the experiments with heavy oil. In the original procedure, the Huff-n-Puff injection of gas occurs at each pressure regime with every shale core sample. Despite the real rock samples having moderately high porosity–permeability, we decided to use highly homogeneous samples of Berea sandstone to speed up the original procedure of CO2 Huff-n-Puff injection at different pressure regimes. The experimental procedure presented has two steps: (1) core saturation and (2) the Huff-n-Puff gas injection tests.

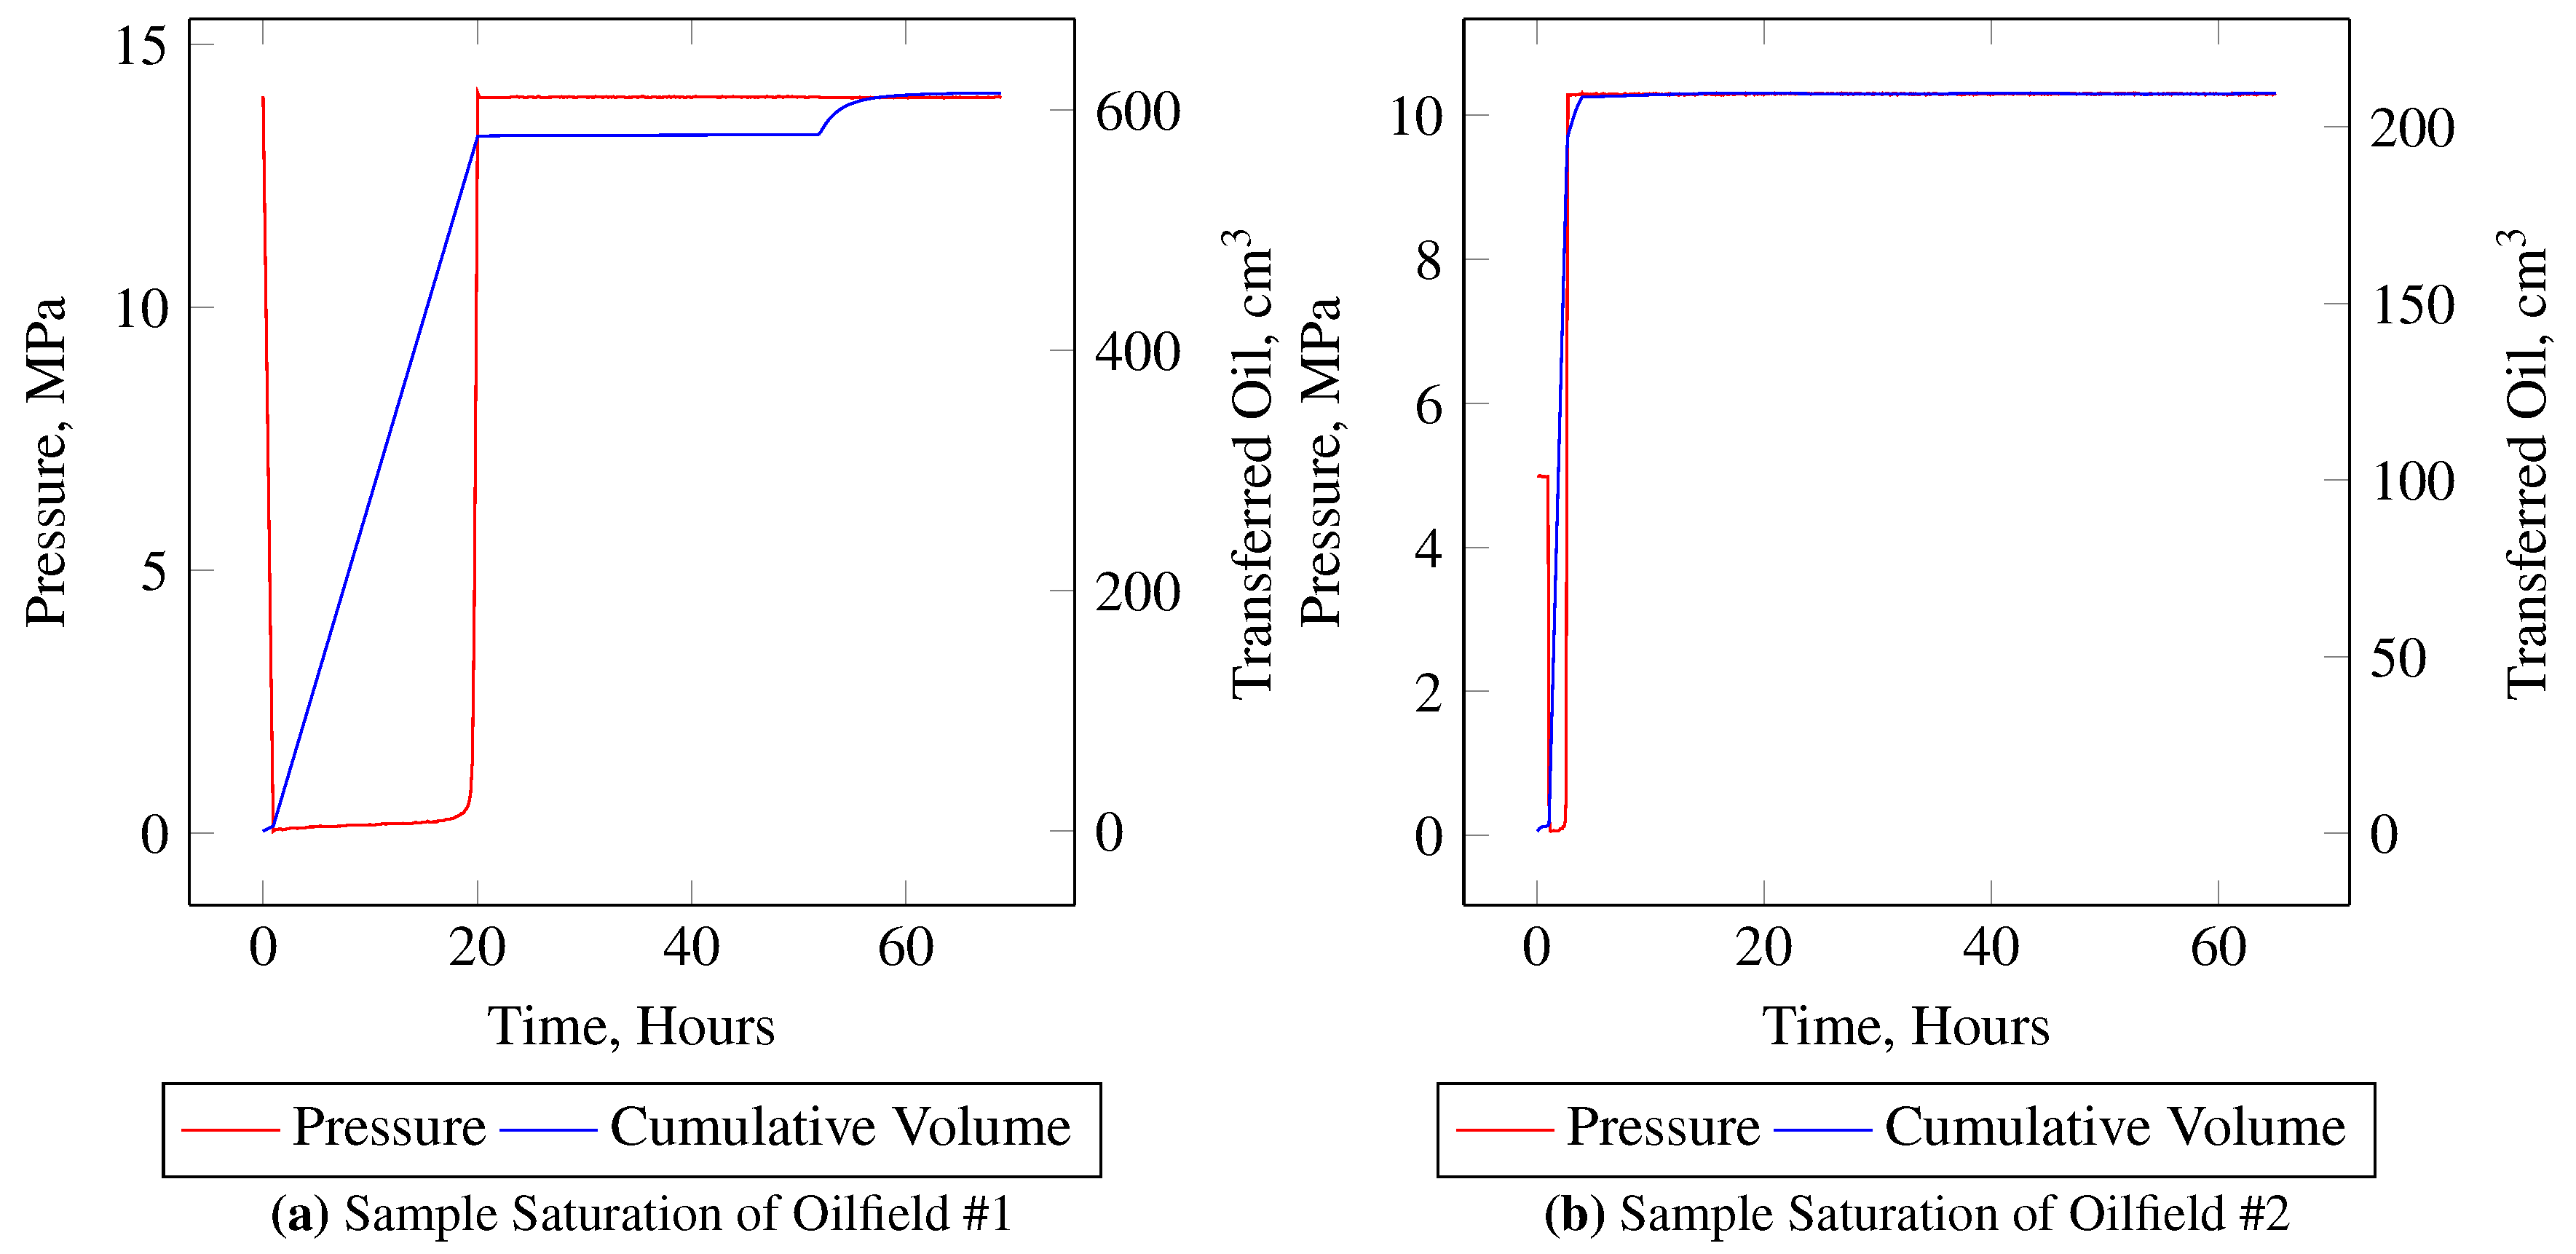
4.1. Saturation Step

To saturate the samples, the collection of samples was extracted by kerosene and then dried in the oven under 120 C during 24 h. The weight ( W d ) of the dried core samples was measured. Then, the samples were placed in the container 1 (Appendix A) and vacuumed in the container for 6 h. The saturation process was conducted at a temperature two times greater than the temperature of paraffin crystallization (Table 2). At the next stage, the Quizix QX pump pushed the pistons of container 2 and oil-filled container 1 with samples at a speed of 5 mL/min and restored the reservoir pressure. The pressure of container 2 was maintained for at least 24 h (Appendix B). Then, the core samples were taken out, cleaned by cleaning paper, and the weight of each sample was measured and registered as W s . Then, the samples were stored in desiccator to keep the oil in the samples between the experiments. The core samples were saturated to 100% with oil without connate water.

4.2. Huff-n-Puff Gas Injection Procedure

Part of the Huff-n-Puff gas injection tests is presented in Figure 2 and should simulate the Huff-n-Puff injection of CO2 in the oil field. Initially, the air in container 1 is blown off by multiple reinjections of CO2 from the external gas cylinder under 0.25 MPa. Then, the lines between the containers are vacuumed by a vacuum pump. Then, the CO2 is injected from container 2 to container 1 for 30 min, and then the pressure should be raised to the experimental pressure by piston pump if it is needed. The soaking time is 6 h. After the soaking period, the pressure should be released with depletion rate of 0.5 MPa/min to the atmospheric pressure. Then, the production period is 6 h. Therefore, finally, the samples are taken out from the vessel (Figure A1b) and cleaned (Figure A2). Then, the core samples are weighed ( W i ). The next injection cycle starts immediately after weighing. The same procedure is repeated for all subsequent cycles after the first cycle of injection. The weight measurements are done to estimate oil recovery using Equation (1). However, Equation (1) does not estimate the density of the original oil as being similar to the remaining oils at different stages.
O i l R e c o v e r y i n c y c l e i = W i W d W s W d × 100 %
In the original procedure developed for the shale samples, each sample should go through all of the injection pressure regimes. However, in our case, homogeneous Berea sandstone samples were used. Despite the high similarity in size, porosity, and permeability among the samples, oil recovery of each sample should be normalized according to their surface area and volume using Equation (2). The first injection cycle yielded the highest incremental oil recovery from 20.70% to 27.67% for different injection pressure regimes. The porosity has not been used in this normalizing factor as it is taken into account in the oil recovery values itself.
O i l R e c o v e r y n o r m a l i z e d = O i l R e c o v e r y cycle i S u r f a c e A r e a V o l u m e × M e a n S u r f a c e A r e a M e a n V o l u m e

5. Results and Discussion

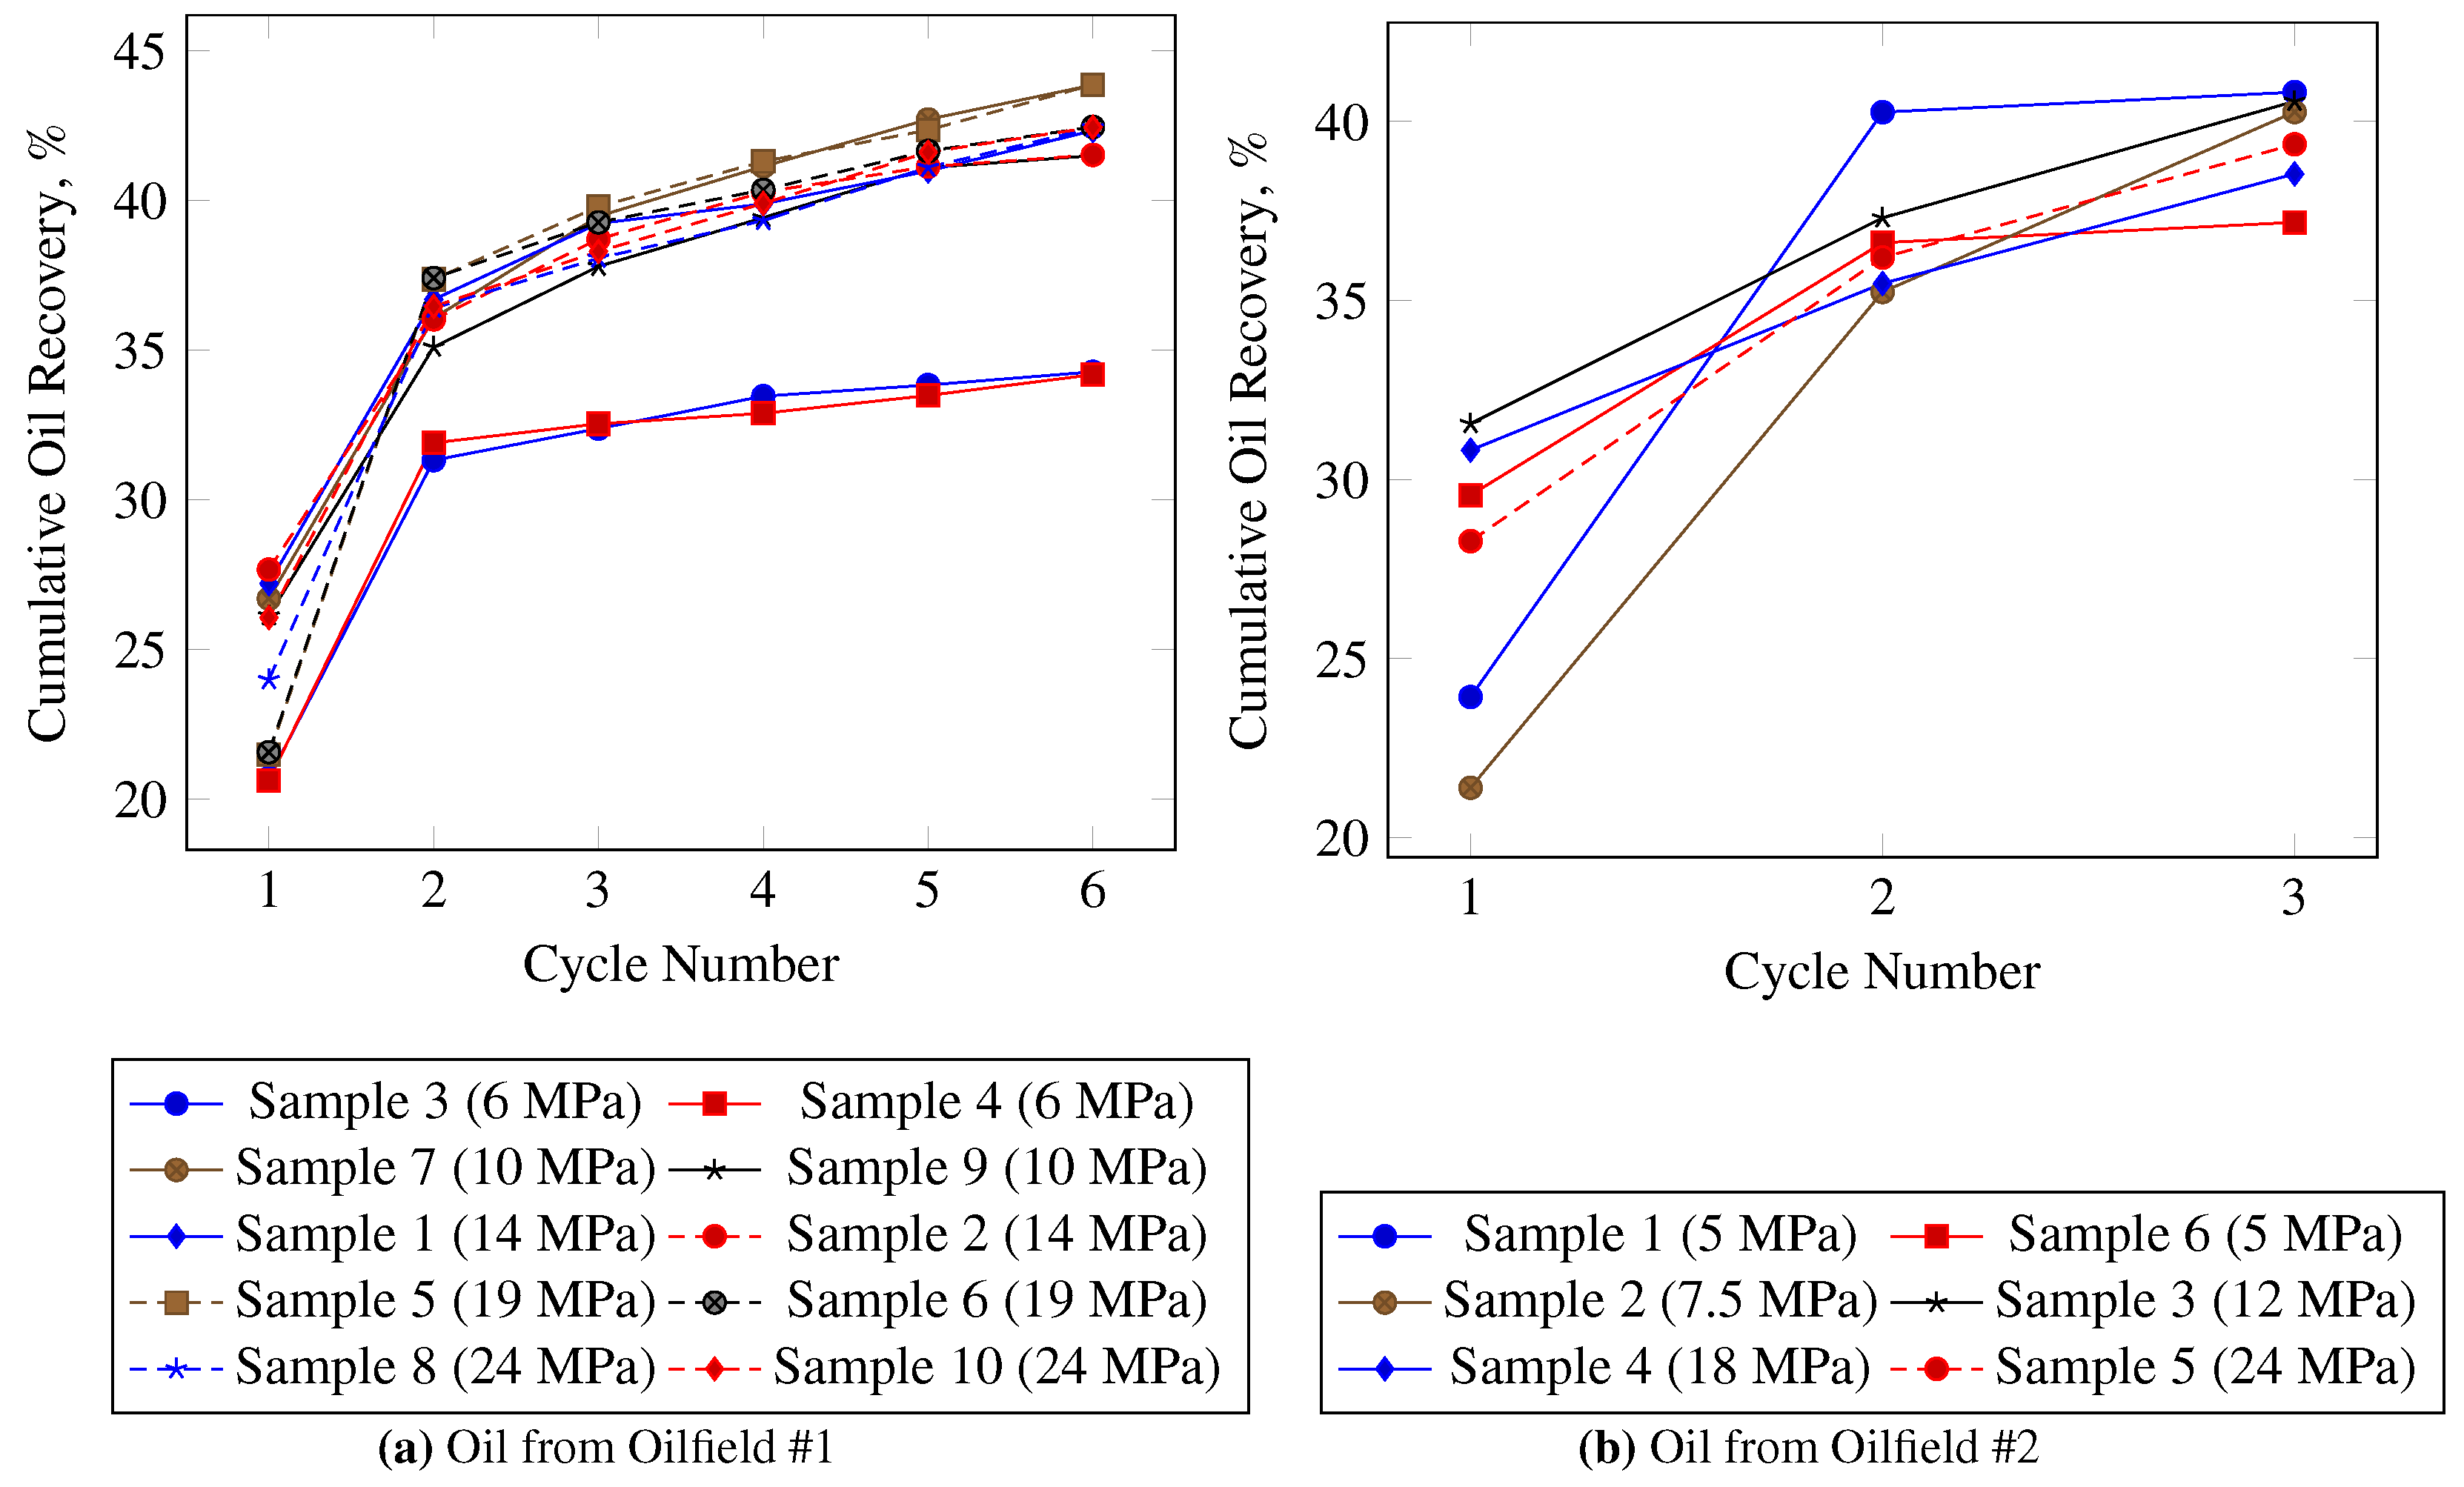
5.1. Effect of Cycle Number

Each subsequent cycle of the Huff-n-Puff CO2 injection gives less incremental oil recovery than the previous cycle. Experiments with oil from oilfield #1 was conducted earlier than experiment with oil from oilfield #2. The biggest amount of oil from oilfield #1 is extracted during the first three cycles of injection, and then just a small volume of oil can be produced. This is why we only use three cycles of injection instead of six cycles in the experiments with oil from oilfield #2. Incremental oil recovery for each injection cycle is shown in Table 5 and Table 6 for both reservoirs. The decrease of subsequent incremental oil recovery occurs because of the reduction of the contact area of CO2 and oil inside the pore space, which caused the remaining oil to become heavier and more viscous (2) and the heavy oil deposits to be destabilized, and they caused a decrease of permeability of the core samples (3). The first two cycles can give an incremental recovery factor above 35%. After these cycles, the incremental oil recovery does not usually exceed 3% in one cycle. Raw experimental data was previously published by Maksakov and Cheremisin [24].

5.2. Cumulative Oil Recovery

The graphical representation of cumulative oil recovery for both oil reservoirs is presented in Figure 3. Clearly, three cycles is not high enough for the experiments with oilfield #2, as shown in Figure 3b, if the experiments continued cumulative oil recovery for different pressure regimes would be equalized. According to the company’s prerequisite, the range of injection pressure of CO2 was predetermined by the limitation of the surface injection pumps and reservoir fracture pressure. The cumulative heavy oil recovery can be over 40% after a number of Huff-n-Puff CO2 injection cycles.

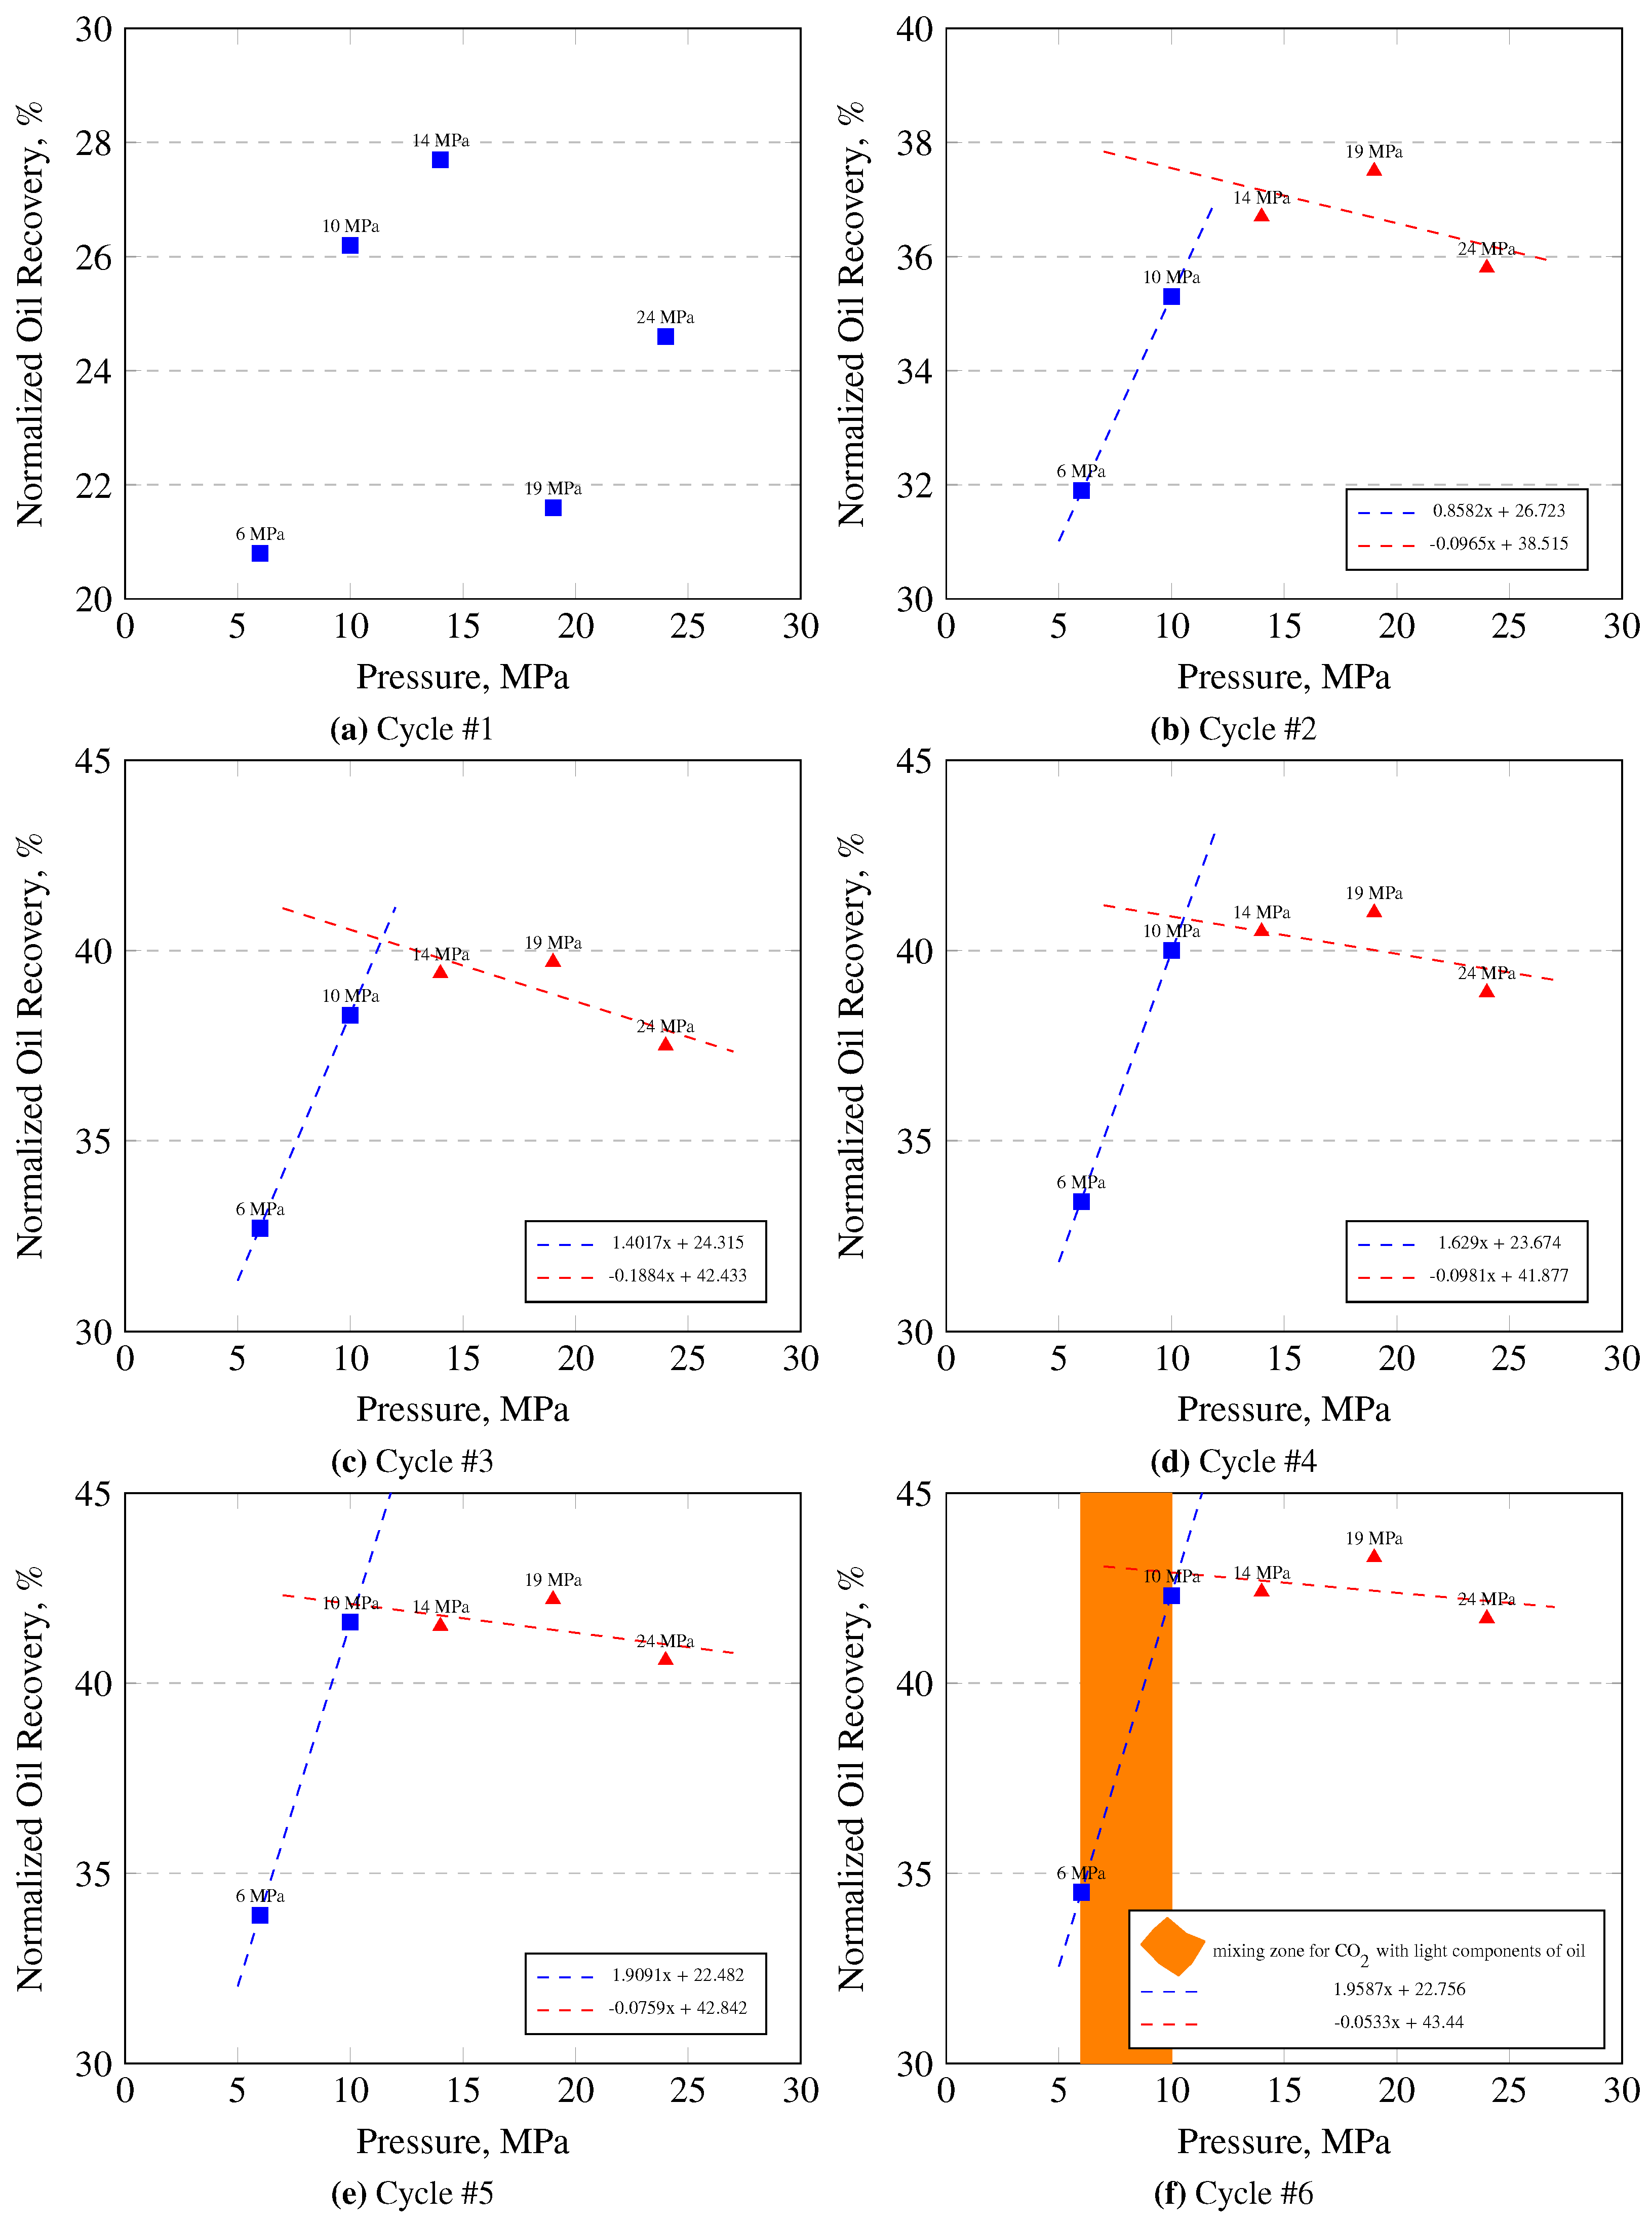
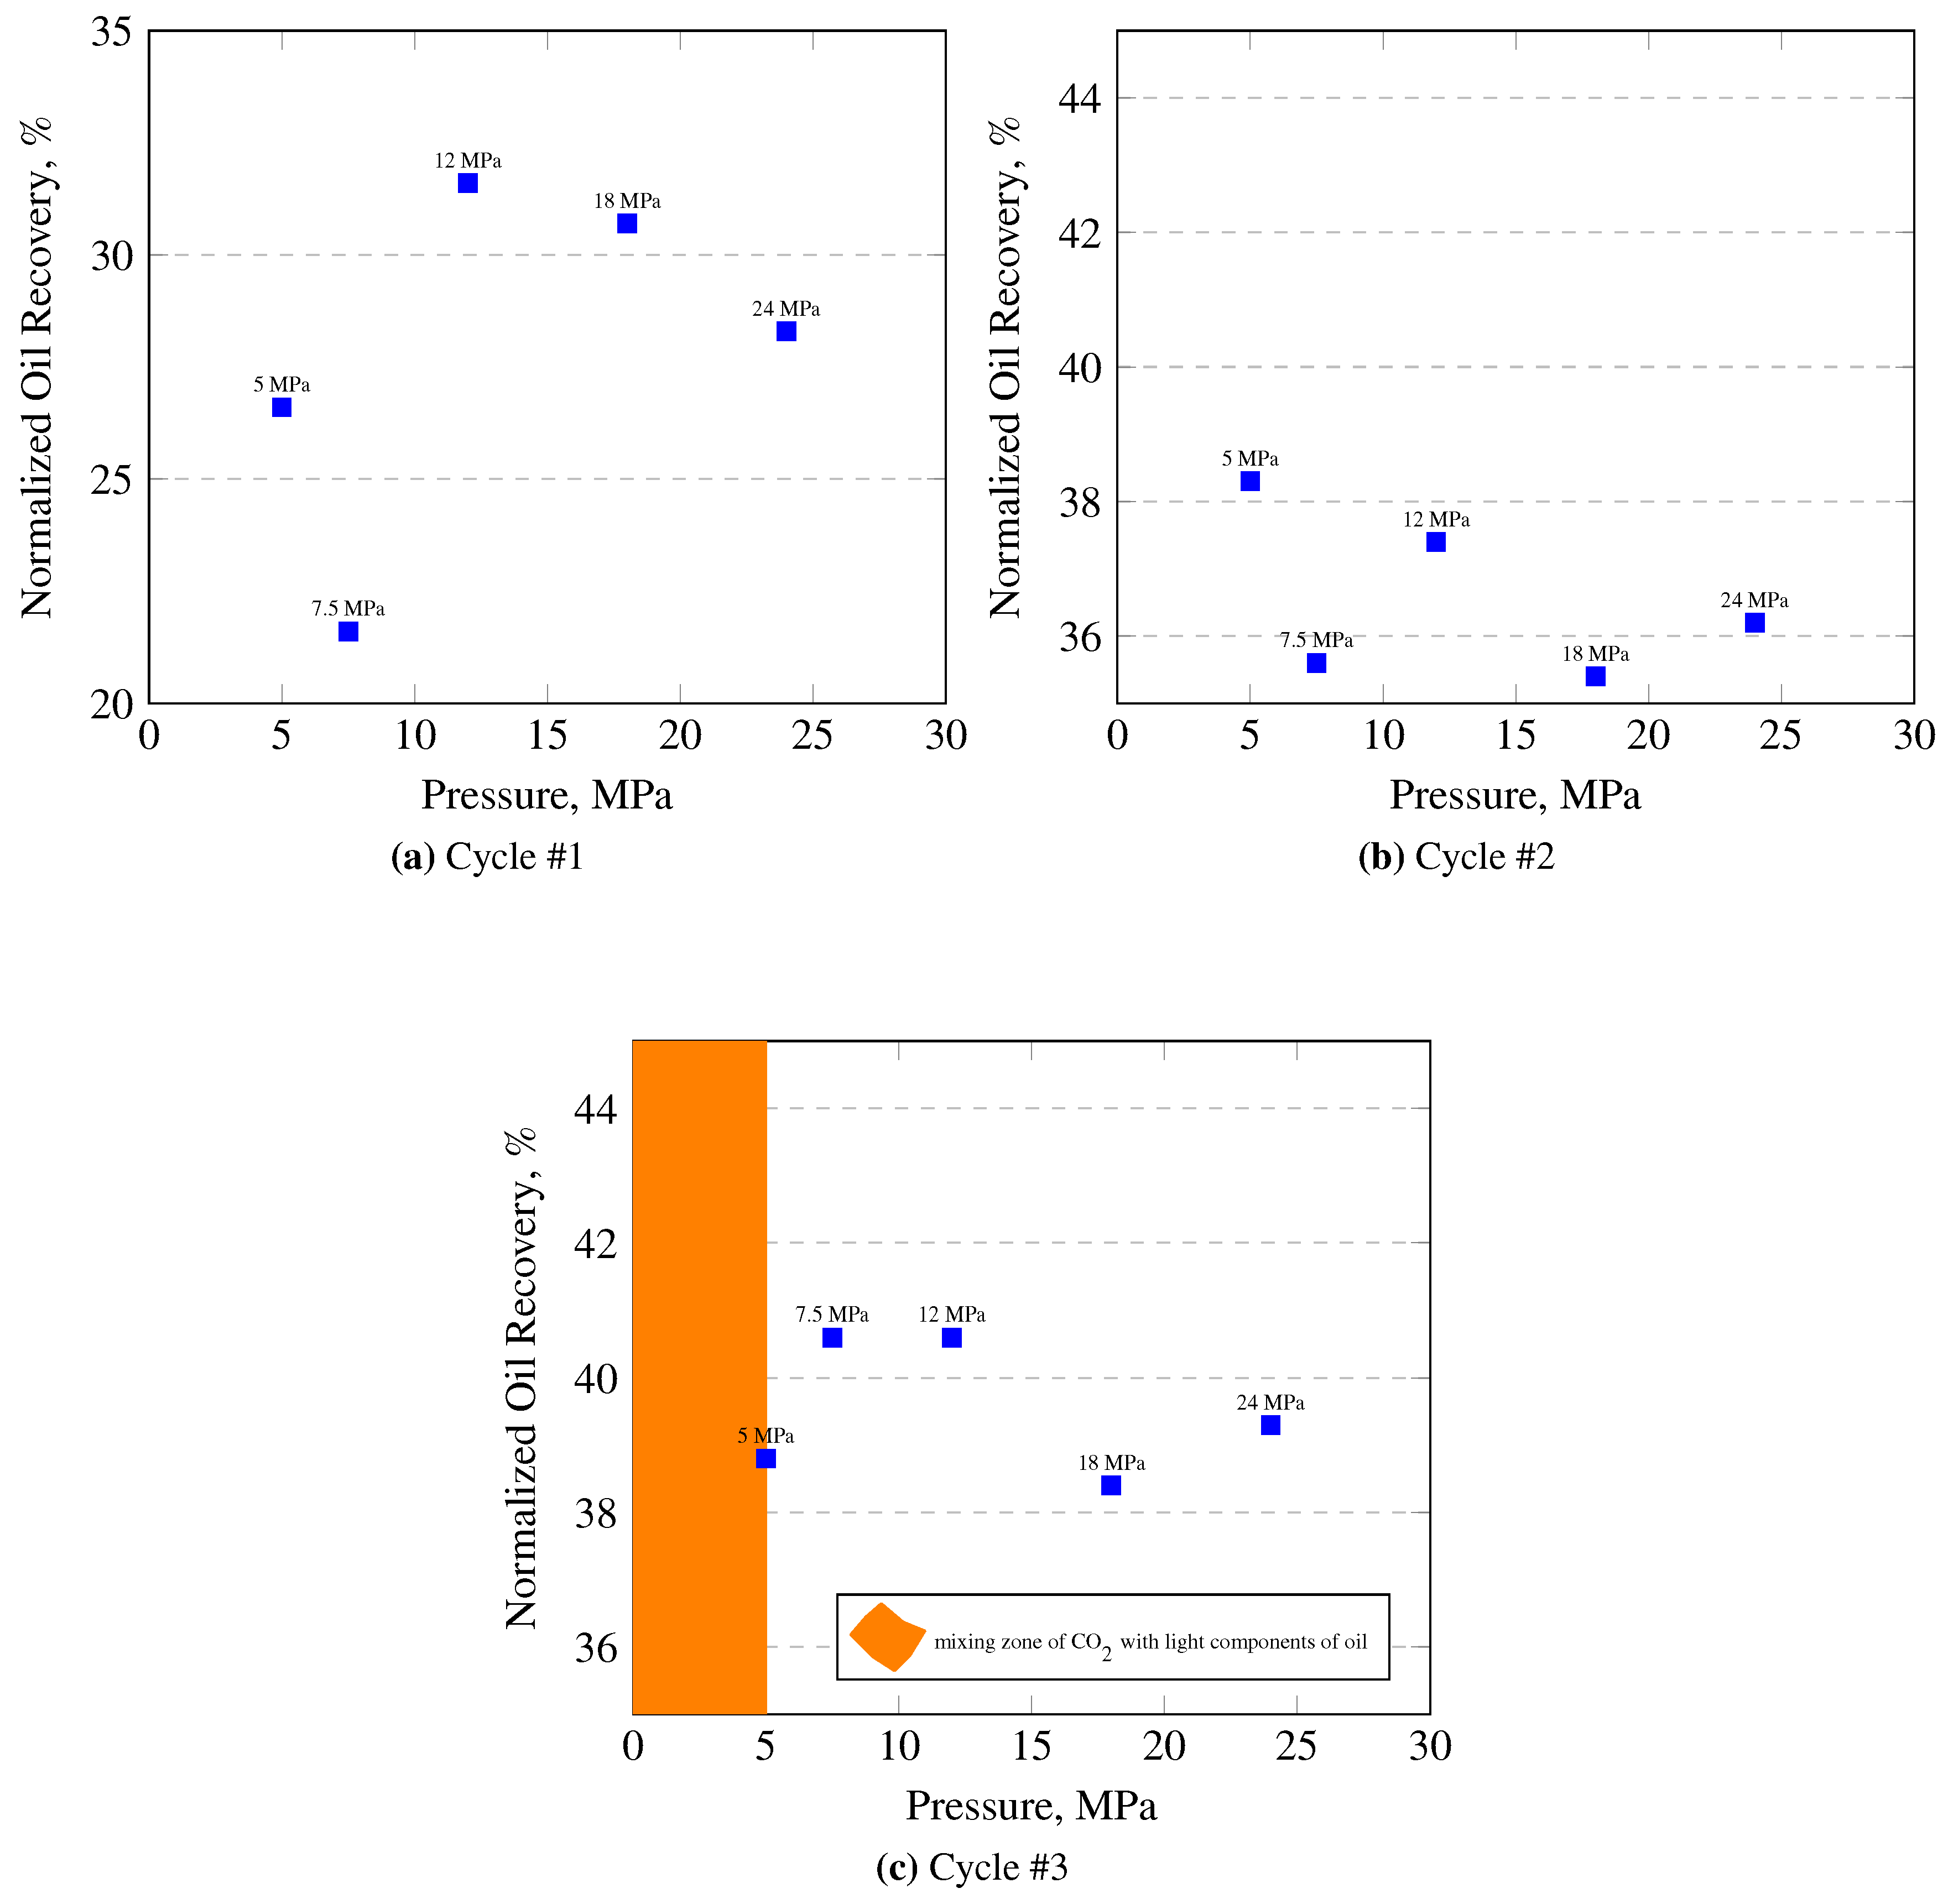
5.3. Miscibility Studies

To evaluate the miscibility of oil samples with CO2, vast Huff-n-Puff injection experiments were conducted at five different pressure regimes for both oil heavy samples. Each oil recovery was normalized according to the volume and surface area of the used samples, and the mean value was taken if more than one samples were used in the Huff-n-Puff injection test. Normalized oil recovery for oil samples from oilfield #1 and oilfield #2 are presented in Figure 4 and Figure 5. For the normalized oil recovery studies (Oilfield #1) shown in Figure 4b–f, two straight lines can be drawn. As there is not a clear intersection of these lines, the miscibility pressure cannot be determined. According to the special PVT studies of oil samples from oilfield #1 and oilfield #2, these oil samples tended to form two-phase systems under reservoir conditions when the concentration of CO2 was higher than 70% mole (Appendix C). These two-phase systems formed by the phase of CO2 and light oil components and by the phase of heavy oil components. Taking into account the results of special PVT studies, it is possible to define the mixing zone, when CO2 becomes miscible with light components of oil. The mixing zone of CO2 with light oil components of oil from oilfield #1 lies in the interval from 6 MPa to 10 MPa, as shown in Figure 4f. The mixing zone of CO2 and light oil components of oil from oilfield #2 is below 5 MPa, as it is shown in Figure 5c. Oil samples from oilfield #1 and oilfield #2 tended to split into the two-phase mixture over 10 MPa and 5 MPa accordingly. Therefore, we made the following assumption: when the miscibility pressure of CO2 with light components is achieved, the oil recovery remained the same until it reaches miscibility pressure with heavy components.

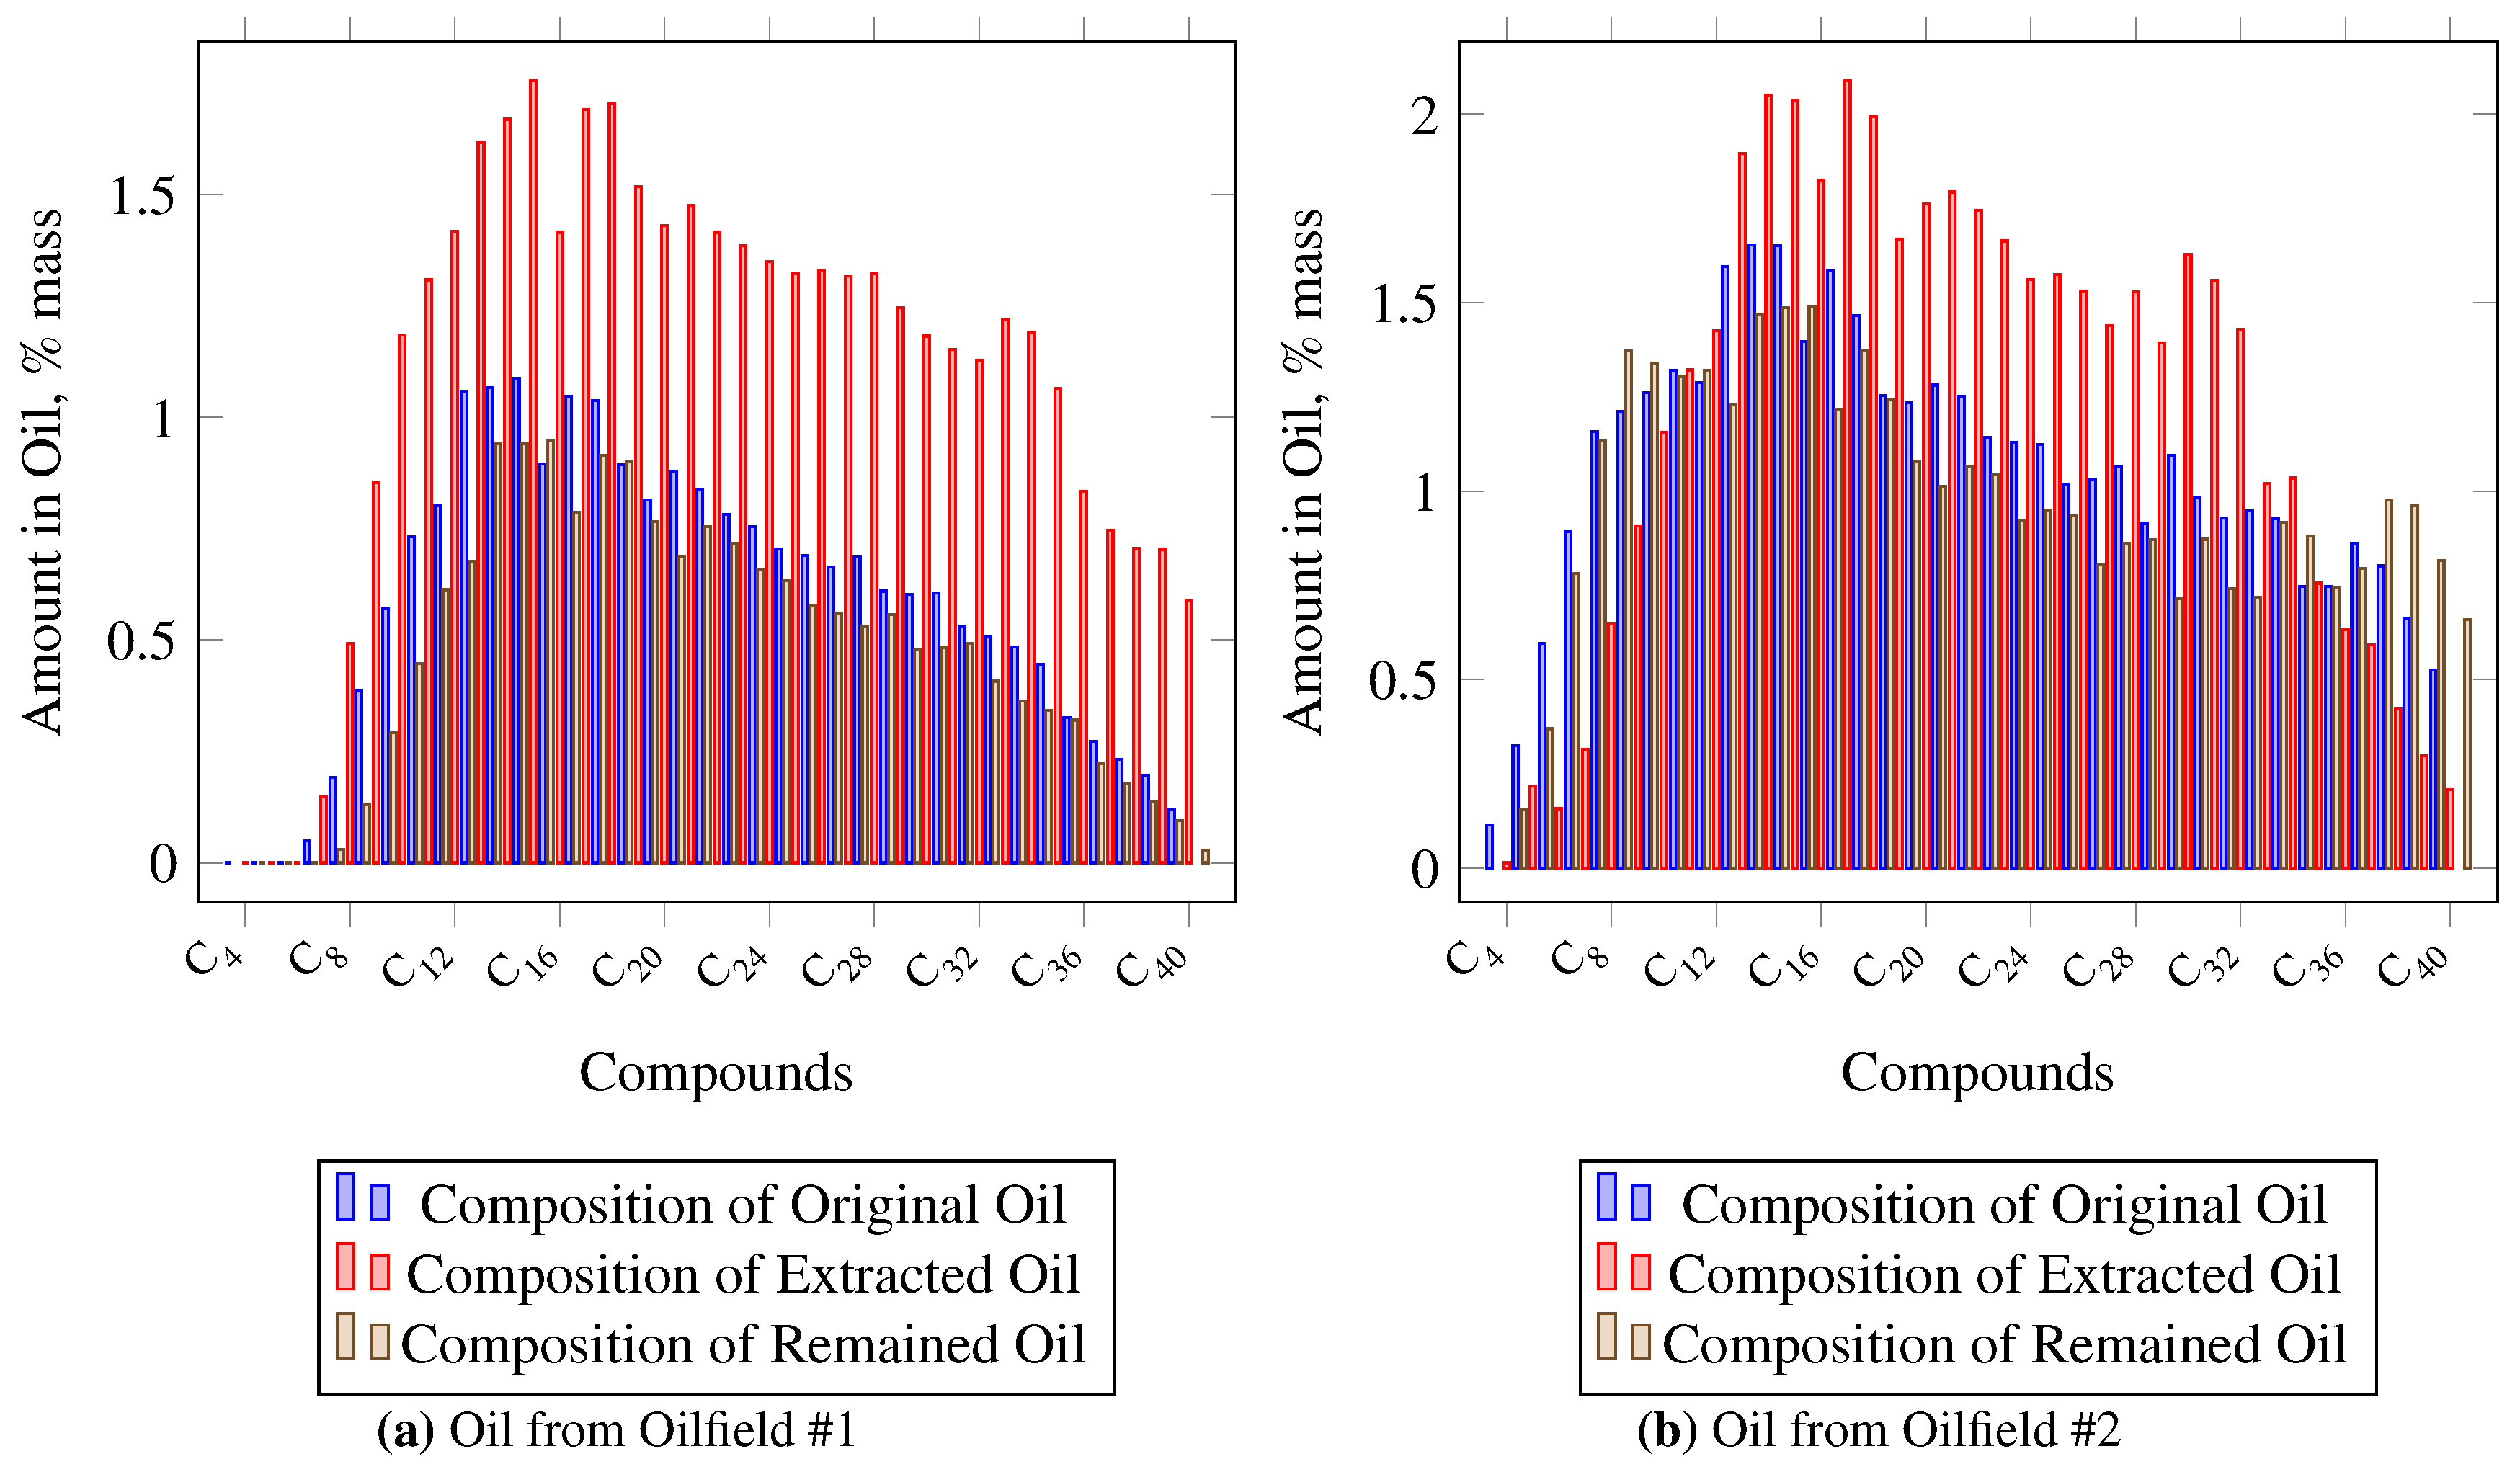
5.4. Effect of CO2 Injection on Oil and Rock Properties

The Huff-n-Puff injection of CO2 leads to the extraction of light components first and can accelerate heavy oil depositions. To prove the idea that light components of oil yield first, the extracted oil sample was collected after Huff-n-Puff CO2 injection tests and analyzed using gas chromatography–mass spectrometry (GC-MS). The oil sample from oilfield #1 was collected after the 1st cycle of injection at 14 MPa, and the oil sample from oilfield #2 was collected after the 1st cycle of injection at 5 MPa. Figure 6 presents the difference of composition of the original oil, extracted oil, and the remaining oil in the samples after yield. The composition of remained oil was calculated using compositions of initial and extracted oil, and the masses of oil before and after the experiments. This investigation of the change of oil composition after Huff-n-Puff injection of CO2 tests proved that the extracted oil from the samples is much lighter that the oil that remained in the samples. However, it represents an open question about heavy oil deposits.
Compositional change of heavy oil due to injection CO2 can lead to destabilization of asphaltenes, resin, and paraffin deposits [25]. As this process can cause the precipitation and deposition of asphaltene particles in the pore space of the samples [26], we needed to evaluate the change of permeability after Huff-n-Puff CO2 injection. To evaluate the permeability, sample #7 from experiments with oil from oilfield #1 and sample #2 from experiments with oil from oilfield #2 were taken. Flood experiments were conducted, and permeability was measured by N-pentane with both samples. Permeability was measured in the presence of asphaltenes because N-pentane does not dissolve precipitated heavy oil deposits [27,28]. Then, the samples were dried, and permeability by helium was measured so as to compare it with the initial permeability before the Huff-n-Puff tests. Therefore, in the end, further core flood experiments were conducted using toluene. Toluene dissolves all heavy deposits, which is why true liquid permeability was measured. The injection pressure was equal to reservoir pressure. The confining pressure was 30% higher than the injection pressure. The injection speed was 0.5 mL/min in flood experiments with solvents. These permeability tests proved that the injection of CO2 decreased the permeability of the rock sample due to the heavy oil deposits, and all the permeability values are presented in Table 7.
These tests indicated the permeability decrease after Huff-n-Puff injection tests, but the damage from heavy oil deposits depends on the specific oil composition, amount of heavy oil deposits of the specific oil, reservoir pressure and temperature, gas injection rate, and oil depletion rate. A universal strategy could not exist due to the high amount of variables.

6. Conclusions

In this study, CO2 Huff-n-Puff tests with two heavy oil samples were conducted using Berea sandstone samples. The determination of oil miscibility with CO2 by Huff-n-Puff tests was proved. From this study, some conclusions can be drawn:
  • The recovery of heavy oil obtained from CO2 injection experiments was as high as 43%. This result shows that CO2 Huff-n-Puff injection can be an efficient approach to enhance heavy oil recovery. However, it was not to possible to differentiate the oil recovery as a result of solution gas drive (gas nucleation, gas expansion) during the pressure drop mode.
  • The major amount of oil is extracted by the first three cycles of CO2 injection. The subsequent cycles of CO2 injection do not cause a considerable change in oil recovery.
  • CO2 injection in heavy oil causes heavy oil deposition and decreases permeability. Permeability measured by gas, n-pentane, and toluene showed the difference of permeability of the core plugs in the presence and the absence of heavy oil deposits.
  • Huff-n-puff tests can be applied for miscibility studies of heavy oil with gas. However, MMP for heavy oil is very high should be taken into consideration.
  • When miscibility of CO2 with light oil components of heavy oil is achieved, the subsequent pressure increase under MMP does not affect oil recovery at the core scale experiments. However, it would be conjecture to presume that the higher injection pressure of gas leads to the higher rate of oil heavy deposits and more severe porosity and permeability damage.

Author Contributions

Conceptualization, E.S., A.C., K.M., and S.K.; Methodology, E.S.; Formal Analysis, E.S.; Investigation, E.S.; Resources, K.M. and A.K.; Data Curation, E.S.; Writing—Original Draft Preparation, E.S.; Writing—Review & Editing, E.S. and A.C.; Visualization, E.S.; Supervision, A.C.

Funding

This research is based on the results of the industrial project funded by LUKOIL-Engineering LCC.

Acknowledgments

This research was funded by LUKOIL-Engineering LCC and Ritek JSC. We thank our colleagues from industry for providing the resources for experimental studies. We would also like to show our gratefulness to Pavel Zobov, Denis Bakulin, and Sergey Antonov for their technical assistance in the presented experiments.

Conflicts of Interest

The authors declare no conflicts of interest.

Abbreviations

The following abbreviations are used in this manuscript.
W d dry core sample weight, g
W s saturated core sample weight, g
W i core sample weight after Huff-n-Puff injection cycle, g
AS/Vsurface-to-volume ratio, cm 2 /cm 3

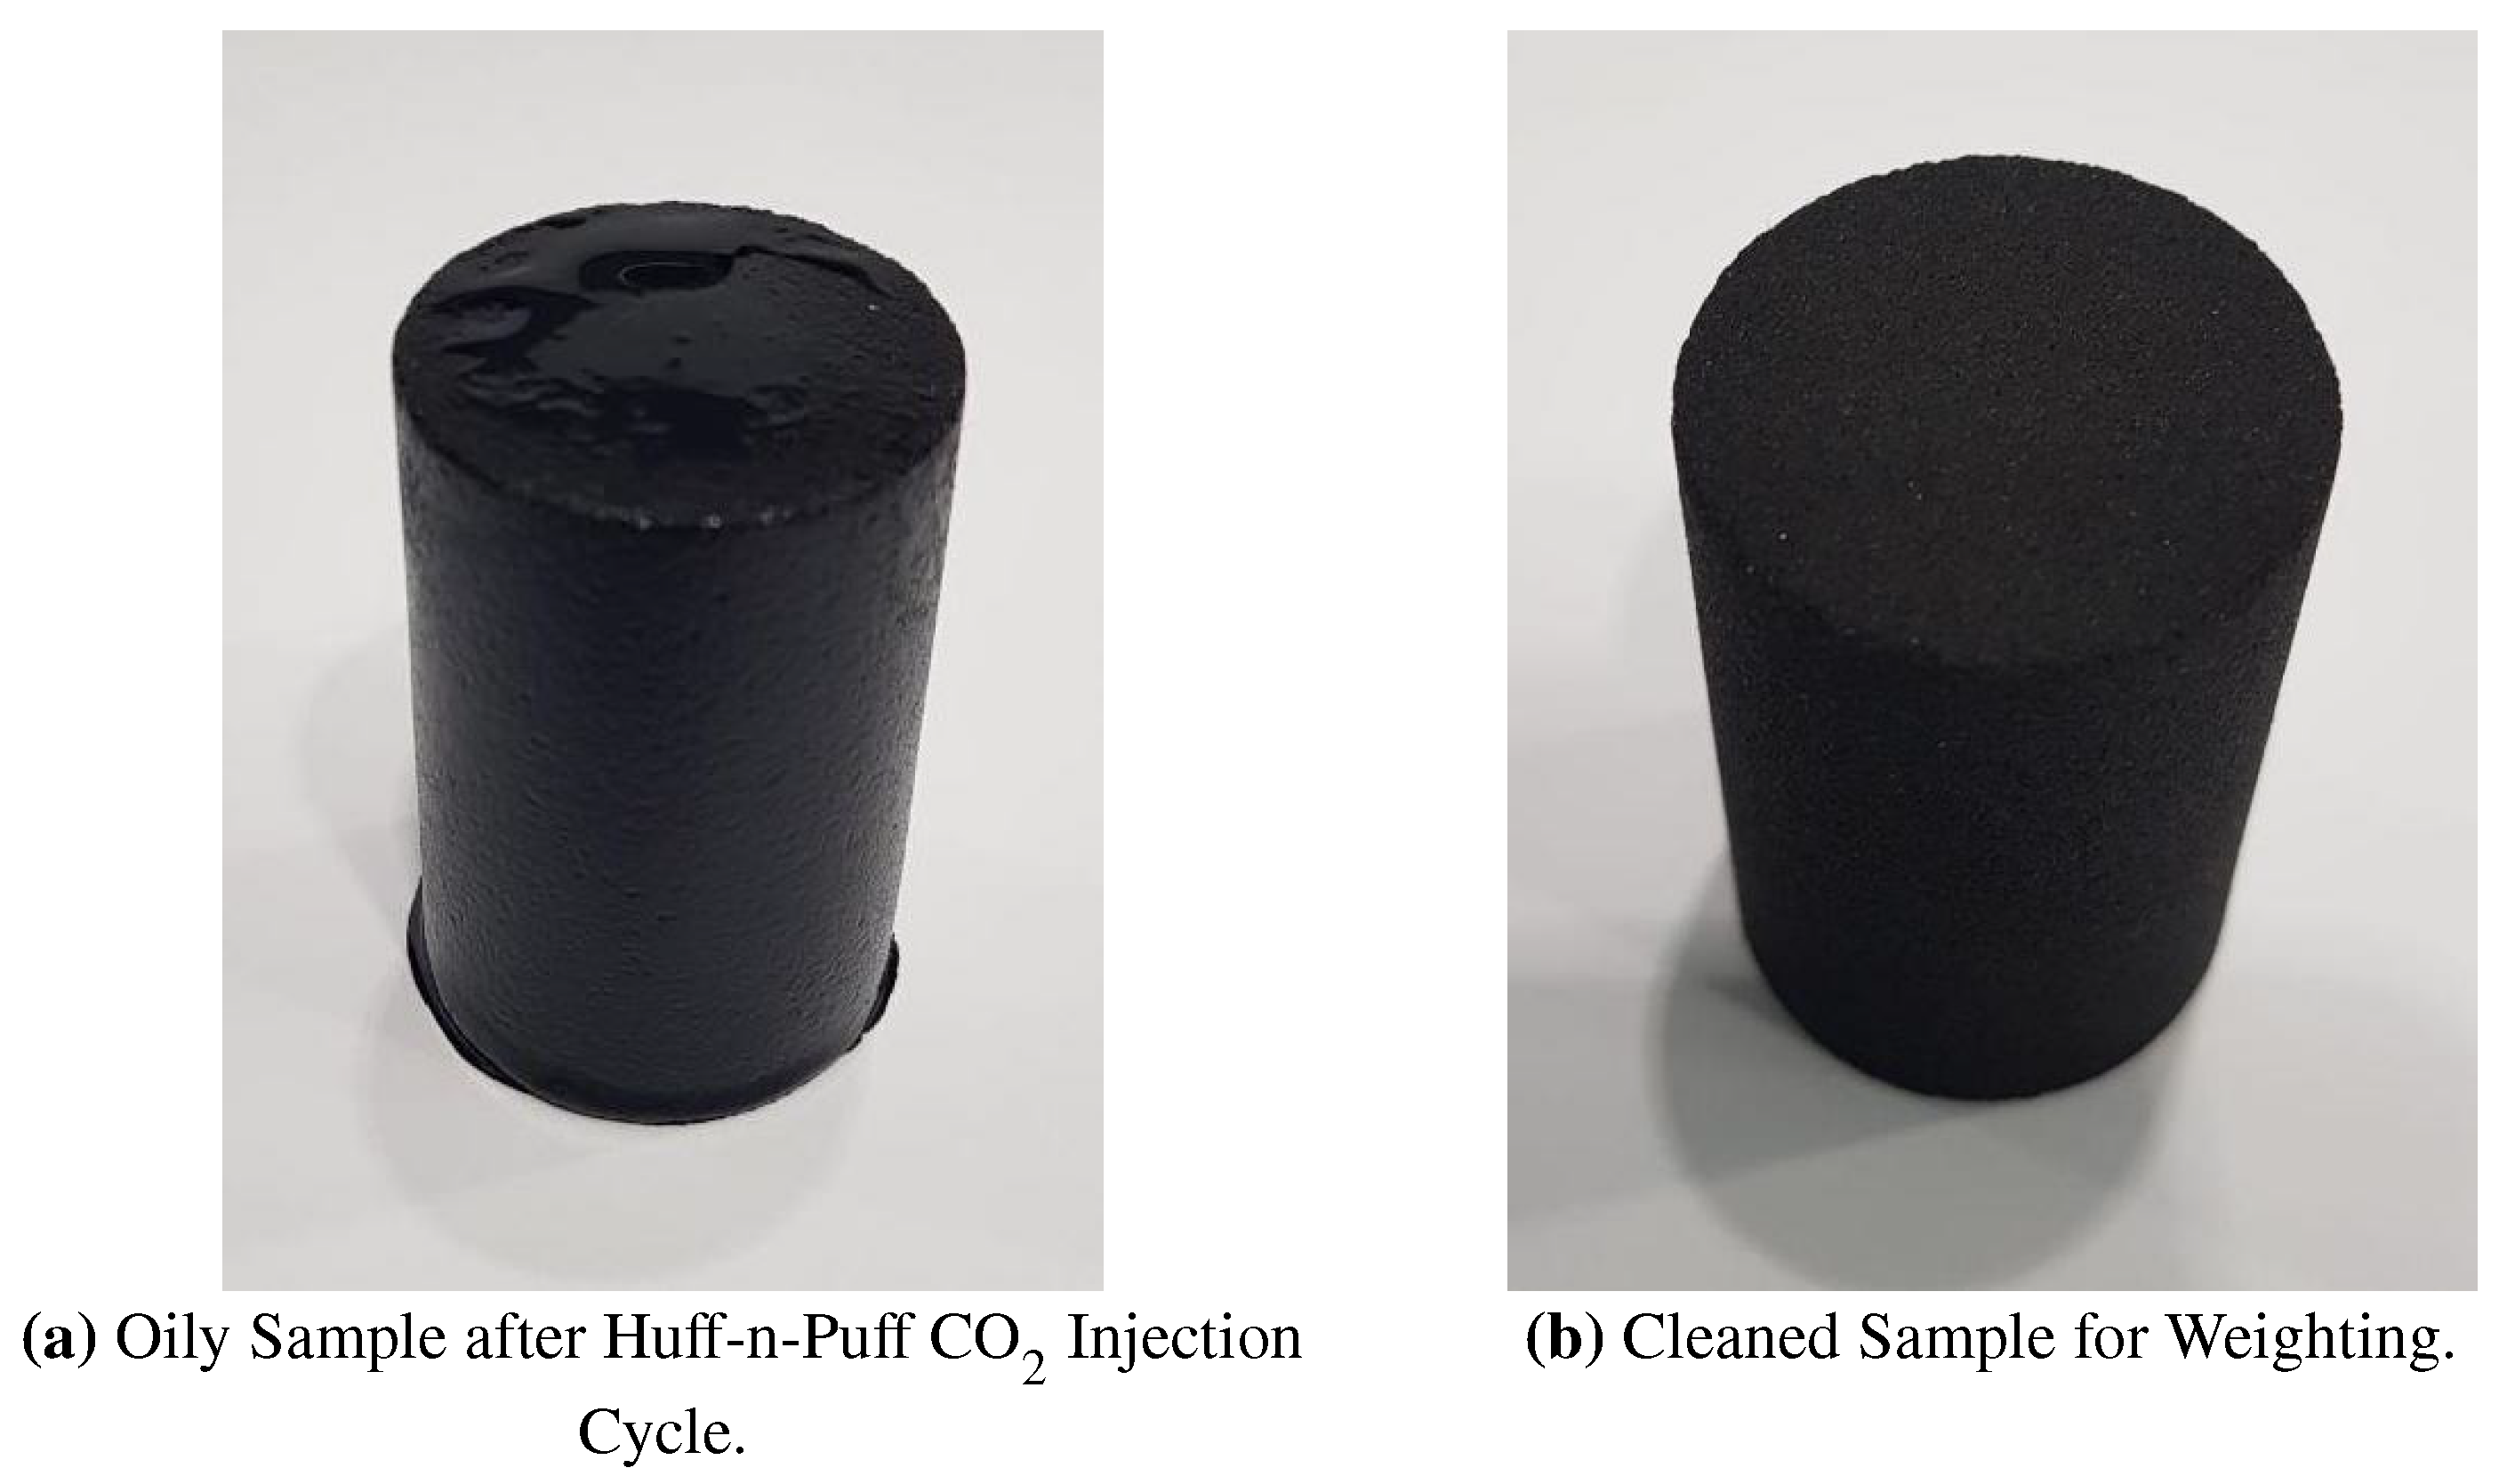
Appendix A. Example Photos

Figure A1. Example of experimental operations.
Energies 12 04308 g0a1
Figure A2. Photos of sample after Huff-n-Puff injection cycle.
Energies 12 04308 g0a2

Appendix B. Saturation Logs

As the samples were placed to the stainless steel container 1 (Figure A1a), the oil should fill the empty volume of the container first and only then the porous media of the samples. Figure A3a shows the saturation process of the samples by the oil sample from Oilfield #1; during this saturation operation, an oil leakage between the transfer vessel filled with oil and the vessel filled with samples occurred; that is why the amount of transferred oil is bigger than in the next saturation operation. Figure A3b shows the saturation process of the samples by the oil sample from Oilfield #2; after transferring of 209 mL of oil, the pressure was rapidly increased to the reservoir pressure of 10.3 MPa.
Figure A3. Saturation logs.
Energies 12 04308 g0a3

Appendix C. Viscosity Measurements from Special PVT Test

According to the special PVT studies, if the concentration of CO2 is over 70%, the oils from both oilfields split to unmixed light and heavy phases; it is reflected by viscosity increase on the Figure A4. The special PVT studies were done with recombined oil samples, which are less viscous than the dead oil samples used in the Huff-n-Puff experiments. The light phase is presented mainly by CO2, and the heavy phase is mainly presented by oil.
Figure A4. Viscosity of heavy phase depending on amount CO2 mole concentration for recombined oil.
Energies 12 04308 g0a4

References

  1. U.S. EIA. Annual Energy Outlook 2017 with Projections to 2050; Technical Report 8; U.S. EIA: Washington, DC, USA, 2017.
  2. Atkinson, N.; Barret, C.; Packey, P.; Bosoni, T.; Petrosyan, K.; Lejeune, O.; Kloss, A.; Wang, J.; Yarita, M.; Pierre, M.; et al. World Energy Outlook 2018; Technical Report; International Energy Agency: Paris, France, 2018. [Google Scholar] [CrossRef]
  3. British Petroleum. BP Statistical Review of World Energy 2019; Technical Report; British Petroleum: London, UK, 2019. [Google Scholar]
  4. Ahmed Ali, S.; Suboyin, A.; Haj, H.B. Unconventional and Conventional Oil Production Impacts on Oil Price—Lessons Learnt with Glance to the Future. J. Glob. Econ. 2018, 6, 1–9. [Google Scholar] [CrossRef]
  5. Alboudwarej, H.; Felix, J.; Taylor, S.; Badry, R.; Bremner, C.; Brough, B.; Skeates, C.; Baker, A.; Palmer, D.; Pattison, K.; et al. Highlighting Heavy Oil. Oilfield Rev. 2006, 18, 34–53. [Google Scholar]
  6. Wei, B.; Pang, S.; Pu, W.; Lu, L.; Lingle, K. Mechanisms of N2 and CO2 Assisted Steam Huff-n-Puff Process in Enhancing Heavy Oil Recovery: A Case Study Using Experimental and Numerical Simulation. In Proceedings of the SPE Middle East Oil & Gas Show and Conference, Manama, Bahrain, 6–9 March 2017. [Google Scholar] [CrossRef]
  7. Erpeng, G.; Yongrong, G.; Youwei, J.; Yunjun, Z. Super Critical CO2 and Steam Co-Injection Process for Deep Extra-Heavy Oil Reservoir. In Proceedings of the SPE EOR Conference at Oil and Gas West Asia, Muscat, Oman, 26–28 March 2018; pp. 1–12. [Google Scholar] [CrossRef]
  8. Hutchinson, C.A.J.; Braun, P.H. Phase relations of miscible displacement in oil recovery. AIChE J. 1961, 7, 64–72. [Google Scholar] [CrossRef]
  9. Sayegh, S.G.; Maini, B.B. Laboratory Evaluation of the CO2 Huff-N-Puff Process for Heavy Oil Reservoirs. J. Can. Pet. Technol. 1984, 23, 29–36. [Google Scholar] [CrossRef]
  10. Olenick, S.; Schroeder, F.A.; Haines, H.K.; Monger-Mcclure, T.G. Cyclic CO2 Injection for Heavy-Oil Recovery in Halfmoon Field: Laboratory Evaluation and Pilot Performance. In Proceedings of the SPE Annual Technical Conference and Exhibition of the Society of Petroleum Engineers, Washington, DC, USA, 4–7 October 1992. [Google Scholar] [CrossRef]
  11. Zhou, X.; Yuan, Q.; Rui, Z.; Wang, H.; Feng, J.; Zhang, L.; Zeng, F. Feasibility study of CO2 huff ’n’ puff process to enhance heavy oil recovery via long core experiments. Appl. Energy 2019, 236, 526–539. [Google Scholar] [CrossRef]
  12. Kuuskraa, V.; Wallace, M. CO2-EOR set for growth as new CO2 supplies emerge. Oil Gas J. 2014, 112, 92. [Google Scholar]
  13. Shen, Z.; Sheng, J.J. Experimental and numerical study of permeability reduction caused by asphaltene precipitation and deposition during CO2 huff and puff injection in Eagle Ford shale. Fuel 2017, 211, 432–445. [Google Scholar] [CrossRef]
  14. Chukwudeme, E.A.; Hamouda, A.A. Enhanced oil recovery (EOR) by miscible CO2 and water flooding of asphaltenic and non-asphaltenic oils. Energies 2009, 2, 714–737. [Google Scholar] [CrossRef]
  15. Ahmed, T. Equations of State and PVT Analysys; Gulf Publishing Company: Houston, TX, USA, 2007; p. 553. [Google Scholar] [CrossRef]
  16. Tathed, V.; Dandekar, A.Y.; Patil, S.L. Determination of Minimum Miscibility Pressure using Vanishing Interfacial Tension (VIT) in Support of EOR for Alaska North Slope (ANS) Heavy Oil. In Proceedings of the Twentieth international Offshore and Polar Engineering Conference, Beijing, China, 20–25 June 2010; International Society of Offshore and Polar Engineers: Mountain View, CA, USA, 2010. [Google Scholar]
  17. Li, L.; Zhang, Y.; Sheng, J.J. Effect of the Injection Pressure on Enhancing Oil Recovery in Shale Cores during the CO2 Huff-n-Puff Process When It Is above and below the Minimum Miscibility Pressure. Energy Fuels 2017, 31, 3856–3867. [Google Scholar] [CrossRef]
  18. Mangalsingh, D.; Jagai, T. A Laboratory Investigation of the Carbon Dioxide Immiscible Process. In Proceedings of the SPE Latin America/Caribbean Petroleum Engineering Conference, Port-of-Spain, Trinidad, 23–26 April 1996. [Google Scholar] [CrossRef]
  19. Cuthiell, D.; Kissel, G.; Jackson, C.; Frauenfeld, T.; Fisher, D.; Rispler, K. Viscous fingering effects in solvent displacement of heavy oil. J. Can. Pet. Technol. 2006, 45, 29–38. [Google Scholar] [CrossRef]
  20. Quoc, T.; Duy, M.; Neogi, P.; Bai, B. Stability of CO2 Displacement of an Immiscible Heavy Oil in a Reservoir. SPE J. 2017, 22, 539–547. [Google Scholar] [CrossRef]
  21. Shilov, E.; Cheremisin, A. The CO2 Huff-n-Puff Test For Minimum Miscibility Pressure Determination for Heavy Oil. In Proceedings of the 5th CO2 Geological Storage Workshop, Utrecht, The Netherlands, 21–23 November 2018; pp. 1–5. [Google Scholar] [CrossRef]
  22. Qazvini Firouz, A.; Torabi, F. Feasibility Study of Solvent-Based Huff-n-Puff Method (Cyclic Solvent Injection) To Enhance Heavy Oil Recovery. In Proceedings of the SPE Heavy Oil Conference Canada, Calgary, AB, Canada, 12–14 June 2012. [Google Scholar] [CrossRef]
  23. Li, L.; Sheng, J.J. Experimental study of core size effect on CH4 Huff-n-Puff enhanced oil recovery in liquid-rich shale reservoirs. J. Nat. Gas Sci. Eng. 2016, 34, 1392–1402. [Google Scholar] [CrossRef]
  24. Nekrasov, A.; Maksakov, K.; Usachev, G.; Karpov, V.; Cheremisin, A. Optimization of the Technological Efficiency Of CO2 Injection in Extra-Viscous Oil Deposits Using Laboratory Studies and Numerical Modeling. In Geology, Geophysics and Development of Oil and Gas Fields; All-Russian Scientific Research Institute of Organization, Management and Economy of the Oil and Gas Industry: Moscow, Russia, 2019; pp. 81–86. [Google Scholar] [CrossRef]
  25. Zhou, X.; Yuan, Q.; Peng, X.; Zeng, F.; Zhang, L. A critical review of the CO2 huff ‘n’ puff process for enhanced heavy oil recovery. Fuel 2018, 215, 813–824. [Google Scholar] [CrossRef]
  26. Abedini, A.; Torabi, F. Oil Recovery Performance of Immiscible and Miscible CO2 Huff-and- Puff Processes. Energy Fuels 2014, 28, 774–784. [Google Scholar] [CrossRef]
  27. Speight, J.G. The Chemistry and Technology of Petroleum, 5th ed.; Chemical Industries; CRC Press: Boca Raton, FL, USA, 2014. [Google Scholar]
  28. Mansoori, G.A. Asphaltene and other Heavy Organic Depositions. Dev. Pet. Sci. 1994, 40, 179–205. [Google Scholar] [CrossRef]
Figure 1. Schematic of experimental setup used for saturation.
Energies 12 04308 g001
Figure 2. Schematic of experimental setup for the CO2 Huff-n-Puff test.
Energies 12 04308 g002
Figure 3. Pressure effect on CO2 Huff-n-Puff performance.
Energies 12 04308 g003
Figure 4. Effect of pressure on normalized oil recovery at different cycles of Huff-n-Puff CO2 injection with oil from oilfield #1.
Energies 12 04308 g004
Figure 5. Effect of pressure on normalized oil recovery at different cycles of Huff-n-Puff CO2 injection with oil from oilfield #2.
Energies 12 04308 g005
Figure 6. Difference in oil composition after CO2 Huff-n-Puff injection.
Energies 12 04308 g006
Table 1. Reservoir properties.
ReservoirOilfield #1Oilfield #2
Temperature ( C)27.421.6
Pressure (MPa)13.810.9
Table 2. Measured properties of dead oil samples from oilfield #1 and oilfield #2.
Dead Oil SampleOilfield #1Oilfield #2
Dead oil density at 20.0 C (kg m 3 )1006.70931.03
Dead oil viscosity at 25.0 C (mPa s)1116.00421.8
Dead oil molecular weight (g mol 1 )346.74499.51
Dead oil compressibility (1/MPa) 4.45 × 10 4 6.29 × 10 4
Water content after dewatering (%)0.780.33
Paraffin crystallization temperature at 0.2 MPa ( C)30.433.1
Table 3. Results of compisitional analysis of the dead oil samples from oilfield #1 and oilfield #2.
ComponentOilfield #1Oilfield #2ComponentOilfield #1Oilfield #2
wt.%mol.%wt.%mol.%wt.%mol.%wt.%mol.%
H00.000300C170.07840.16510.35080.5132
H2S0.00120.017000C180.09930.19750.39140.5407
CO20.01350.15320.00050.0040C190.07260.13780.25030.3299
N20.29195.20560.01880.2330C200.06360.11560.24860.3134
C10.02070.64420.01390.2996C210.05770.09910.20790.2477
C20.02660.44130.04600.5304C220.04310.07060.19840.2256
C30.03100.35110.46083.6235C230.03990.06270.18910.2062
iC40.01280.11040.04420.2639C240.03580.05410.16870.1768
nC40.03490.29970.71414.2601C250.03220.04660.14250.1432
iC50.02810.19480.26721.2843C260.03140.04360.13600.1313
nC50.02660.18440.57362.7567C270.02510.03350.10500.0973
C60.10330.61431.56856.4746C280.02190.02820.08560.0765
C70.11890.61851.51885.4856C290.01880.02340.06400.0552
C80.10400.48570.81712.6479C300.01620.01950.04930.0411
C90.04530.18700.25320.7256C310.01440.01680.04590.0370
C100.04650.17330.22830.5907C320.01380.01560.03520.0275
C110.04840.16440.20640.4869C330.01220.01340.01470.0111
C120.04950.15350.24780.5336C340.00870.00920.01080.0079
C130.04670.13330.28290.5606C350.00660.00680.00810.0058
C140.06660.17510.28640.5227C36+98.061388.22989.202764.6417
C150.06610.16030.27750.4671Total100100100100
C160.06430.14470.26890.4201
Table 4. Summary of physical properties of the cores applied in this study.
Sample No.   LengthDiameterVolumeSurface Area/VolumePorosityPermeability
cmcmcm 3 m 2 /cm 3 %mD
14.8192.94032.721.6420.14153.5
24.7602.94132.341.6520.21157.6
34.7642.94132.361.6520.16153.2
44.7252.93832.031.6520.16156.4
54.6982.94331.961.6520.15156.5
64.5032.94130.581.6620.35168.3
74.3752.94029.711.6720.40173.7
84.3712.94029.681.6720.42174.9
94.2822.94129.081.6820.42171.4
103.8922.93726.361.7120.63174.8
Table 5. Incremental oil recovery at each cycle of Huff-n-Puff CO2 injection for experiments with oil from oilfield #1.
Sample No.   PressureCycle 1Cycle 2Cycle 3Cycle 4Cycle 5Cycle 6
MPa%%%%%%
3620.7010.621.061.080.370.44
4620.6311.270.640.350.600.69
71026.709.373.411.661.571.15
91026.128.982.701.631.670.40
21427.209.492.540.651.101.35
11427.678.362.681.570.850.39
51921.4815.882.431.511.051.51
61921.5715.841.861.081.300.81
82423.9912.411.671.261.781.32
102426.0610.401.841.611.710.83
Table 6. Incremental oil recovery at each cycle of Huff-n-Puff CO2 injection for experiments with oil from oilfield #2.
Sample No.   PressureCycle 1Cycle 2Cycle 3
MPa%%%
1523.9216.330.56
6529.567.050.57
27.521.3913.845.02
31231.565.753.25
41830.814.663.06
52428.277.923.16
Table 7. Permeability change due to the Huff-n-Puff CO2 injection.
Sample No.ReservoirHelium Permeability
before Experiments
N-Pentane Permeability
after Experiments
Helium Permeability
after Experiments
Toluene Permeability
after Experiments
mDmDmDmD
7 (10 MPa)Oilfield #11731315977
2 (7.5 MPa)Oilfield #2147814439

