Article

Carbon Storage and Enhanced Oil Recovery in Pennsylvanian Morrow Formation Clastic Reservoirs: Controls on Oil–Brine and Oil–CO2 Relative Permeability from Diagenetic Heterogeneity and Evolving Wettability

1
Petroleum Engineering Department, New Mexico Institute of Mining and Technology, Socorro, NM 87801, USA
2
Petroleum Recovery Research Center, New Mexico Institute of Mining and Technology, Socorro, NM 87801, USA
3
Earth and Environmental Science Department, New Mexico Institute of Mining and Technology, Socorro, NM 87801, USA
4
Geology and Environmental Science Department, Wheaton College, Wheaton, IL 60187, USA
5
Nuclear Waste Disposal Research and Analysis, Sandia National Laboratories, Albuquerque, NM 87123, USA
6
Geomechanics Department, Sandia National Laboratories, Albuquerque, NM 87123, USA
*
Author to whom correspondence should be addressed.
Now at Timber Creek Energy LLC, Trinidad, CO 81082, USA.
Energies 2019, 12(19), 3663; https://doi.org/10.3390/en12193663
Submission received: 20 July 2019 / Revised: 2 September 2019 / Accepted: 16 September 2019 / Published: 25 September 2019
(This article belongs to the Special Issue CO2 EOR and CO2 Storage in Oil Reservoirs)

Abstract

:
The efficiency of carbon utilization and storage within the Pennsylvanian Morrow B sandstone, Farnsworth Unit, Texas, is dependent on three-phase oil, brine, and CO2 flow behavior, as well as spatial distributions of reservoir properties and wettability. We show that end member two-phase flow properties, with binary pairs of oil–brine and oil–CO2, are directly dependent on heterogeneity derived from diagenetic processes, and evolve progressively with exposure to CO2 and changing wettability. Morrow B sandstone lithofacies exhibit a range of diagenetic processes, which produce variations in pore types and structures, quantified at the core plug scale using X-ray micro computed tomography imaging and optical petrography. Permeability and porosity relationships in the reservoir permit the classification of sedimentologic and diagenetic heterogeneity into five distinct hydraulic flow units, with characteristic pore types including: macroporosity with little to no clay filling intergranular pores; microporous authigenic clay-dominated regions in which intergranular porosity is filled with clay; and carbonate–cement dominated regions with little intergranular porosity. Steady-state oil–brine and oil–CO2 co-injection experiments using reservoir-extracted oil and brine show that differences in relative permeability persist between flow unit core plugs with near-constant porosity, attributable to contrasts in and the spatial arrangement of diagenetic pore types. Core plugs “aged” by exposure to reservoir oil over time exhibit wettability closer to suspected in situ reservoir conditions, compared to “cleaned” core plugs. Together with contact angle measurements, these results suggest that reservoir wettability is transient and modified quickly by oil recovery and carbon storage operations. Reservoir simulation results for enhanced oil recovery, using a five-spot pattern and water-alternating-with-gas injection history at Farnsworth, compare models for cumulative oil and water production using both a single relative permeability determined from history matching, and flow unit-dependent relative permeability determined from experiments herein. Both match cumulative oil production of the field to a satisfactory degree but underestimate historical cumulative water production. Differences in modeled versus observed water production are interpreted in terms of evolving wettability, which we argue is due to the increasing presence of fast paths (flow pathways with connected higher permeability) as the reservoir becomes increasingly water-wet. The control of such fast-paths is thus critical for efficient carbon storage and sweep efficiency for CO2-enhanced oil recovery in heterogeneous reservoirs.

1. Introduction

Enhanced oil recovery (EOR) utilizing reservoir flooding with high density supercritical carbon dioxide (scCO2) is a means to mitigate rising atmospheric carbon dioxide levels while extracting oil as an energy resource, with a net storage of carbon in geologic units (often termed carbon capture, utilization, and storage or CCUS). The focus of EOR/CCUS is on depleted oil reservoirs, and an example of this is the Farnsworth Unit (FWU) of West Texas (Figure 1), which has been in operation since the 1950s [1] and a target of EOR operations since 1984 [2]. The Southwest Regional Partnership on Carbon Sequestration (SWP) was established in 2003 by the US Department of Energy’s National Energy Technology Laboratory, to study the feasibility of capturing and permanently storing CO2. Part of the SWP’s activities has been devoted to reservoir characterization, injection of scCO2, and monitoring CCUS efficiency at the Farnsworth Unit [2,3,4,5].
The efficient management of CCUS in a reservoir or field involves assessing the heterogeneity and behavior of flow for three-phase oil, brine, and scCO2 transport, and to this end, in this paper we examine these for the Morrow B sandstone reservoir (part of the Pennsylvanian Morrow Formation) of the FWU. Using a method developed by [6], we quantify Morrow B reservoir heterogeneity in Well 13-10A of the FWU, based on analysis of fifty-three core plugs from this well (listed in Table A1 in the Appendix A), in terms of five hydrologic flow units. We use this classification as a basis to sample representative core plugs for relative permeability experiments. X-ray micro-computed tomography (μCT) along with optical petrography is used to quantify spatial variations in grain size, macroporosity (i.e., pores resolvable at the scanning resolution), microporosity in clay-rich regions, and carbonate cement amongst the flow units. Petrographic analysis shows that much of the residual oil resides in the clay-associated microporosity but also as pore-lining films in macro-pores. Time-varying measurements of oil and brine contact angles show that wettability is transient and quickly modified by pore fluid replacement. The relative permeability of oil–scCO2 and oil–brine binary pairs was determined for each core plug using a core flooding apparatus, demonstrating that relative permeability varies between the five flow units, particularly in residual saturations. Similar to the contact angle tests, the results suggest that wettability is modified during the measurements, especially with the CO2 flooding experiments. To show how the measured relative permeability variations might influence flooding at the reservoir scale, these results were included in a five-spot water-alternating-with-gas (WAG) injection model extracted from the larger FWU model of Ampomah et al. [7,8]. Results compare favorably with cumulative historical oil production at Farnsworth but fail to describe the observed cumulative water production. We argue that fast paths in the reservoir, composed of the highest permeability flow unit determined in our study, limit the sweep efficiency of CO2 plumes involved in CCUS at Farnsworth, activated as the more depleted zones in the reservoir become increasingly CO2-wetting.

2. Background for CCUS/EOR in the Farnsworth Unit

2.1. Morrow B Heterogeneity

The FWU is located in Ochiltree County in the Texas Panhandle (Figure 1A) and currently contains thirteen CO2 injection wells [9]. All CO2 is derived from two anthropogenic sources: the Arkalon Ethanol Plant in Liberal, Kansas and the Agrium Fertilizer Plant in Borger, Texas. As of June 2018, ~1,180,000 metric tons of CO2 have been stored at FWU by the operator and since SWP started monitoring, ~734,000 metric tons have been stored [10]. The Morrow B sandstone is the target reservoir for the FWU project, located at a depth between 7550 ft (2301 m) and 7950 ft (2432 m) and spanning approximately 28 square miles (72 km2) with a mean thickness of 24.3 ft (7.4 m; Figure 1B,C; see also [7]). The Morrow B sandstone underlies an upper Morrow Formation shale and the Thirteen Finger limestone caprocks (Figure 1B) and is estimated to be capable of effectively storing 25 million metric tons of CO2 [7,8]. The Thirteen Finger limestone has been determined to be a viable caprock to successfully hold the stored CO2 [11]. Note that we use the informal names for lithologies as used by Puckette et al. [12] and Ampomah et al. [8].
The Morrow B sandstone is a transgressive fluvial-estuarine sandstone that filled paleo-valleys cut into an underlying Morrow Formation shale during the previous low-stand of the Pennsylvanian interior sea [12]. As with many fluvial and estuarine deposits [13], the interior sedimentary structure of the formation is extremely heterolithic, with interwoven coarse sandstones, fine to medium sandstones, mudstones, and conglomerates, existing in complicated, unpredictable ways [12]. Overall, the sandstone unit fines upward into an upper Morrow Formation shale (Figure 1C). A large part of SWP activities at FWU is to characterize the heterogeneity of the Morrow B reservoir. Gallagher [3] provided some initial insight into pore-scale heterogeneity of the Morrow B, subdividing the Morrow B into five porosity facies and eight subfacies. The porosity facies were categorized as, “intergranular macroporosity dominated”, “grain-size pore dominated”, “microporous authigenic clay dominated”, “carbonate cement dominated”, and “intragranular porosity dominated.” The subfacies were based on pore types, pore distributions and controls on permeability, such as authigenic clay and siderite cement.
Based on petrophysical properties and well logging data from multiple wells across the FWU, Rose-Coss et al. [5] defined eight unique hydrologic flow units (HFUs) [14,15] to characterize hydrogeologic heterogeneity for the Morrow B using the Winland R35 method (based on correlations between measured porosity and permeability), and show how these were distributed with an example Morrow-B core. The R35 method describes the pore throat aperture radius coinciding to 35% mercury saturation during a mercury porosimetry test [16,17]. Ampomah et al. [7,8] used these definitions to define a reservoir architecture for reservoir simulation purposes (see reference [8], their Figure 2, showing distributions of porosity and permeability using the HFU concept applied to the Morrow B reservoir). Using a history matching approach, Ampomah et al. [8] derived a three-phase permeability relationship for the Morrow B sandstone that was capable of describing the cumulative oil production during water-alternating-with-gas (WAG) EOR operations at the FWU.
For this paper, we apply the same method to core plug data from a core obtained by the SWP from the FWU well 13-10A in Figure 1C. In the Appendix A, we present a data set (Table A1) derived from Terra Tek (now Schlumberger) analysis of fifty-three well 13-10A core plugs under the auspices of the SWP. The porosity and permeability relationships of all core plug data in Table A1 are plotted in Figure 2, along with core plugs used for relative permeability measurements. The HFU designations we apply to the 13-10A heterogeneity are simpler than those applied to the entire FWU Morrow-B by Rose-Coss et al. [6] and are detailed in a manuscript in review by Rasmussen et al. The five HFU designations (I through V as Roman numerals) are shown with color in Figure 2. These designations are validated by mercury porosimetry in the Rasmussen et al. manuscript and are beyond the scope of our discussion here.
This classification scheme was used for down-sampling of 13-10A core plugs from each of these five HFUs for oil–brine and oil–CO2 relative permeability testing in this study. Table 1 defines each of the Morrow B HFUs with respect to dominant pore throat size and pore type. In this paper, we use μCT imaging to obtain quantitative macro-pore size, framework grain size, and pore type useful for interpreting differences in behavior between HFUs for the two-phase flow testing. The differences in spatial distribution of so-called macroporosity (pores resolvable from μCT) and microporosity (micron-sized pores, most commonly residing in between clay grains) are shown to underlie two-phase flow behavior that is manifest both at the core plug scale and, arguably, at the reservoir scale. This is relevant to CCUS/EOR at Farnsworth, as most of the residual oil observed within well 13-10A resides within the microporosity.

2.2. Variability and Evolution of Wettability during CCUS/EOR in Sandstones

Wettability in sandstone reservoirs has implications for CO2 trapping and enhanced oil recovery, but wettability characterization is challenging due to heterogeneous mineralogy in reservoirs and modifications that arise from the variability of conditions in or relevant to subsurface reservoirs. Wettability changes will affect capillary pressure, relative permeability, and brine- and CO2- flooding behavior. In situ or direct wettability measurement is not practical for porous media. Liu and Buckley [18] used water drop contact angles on different mica minerals as rock surfaces to assess their wetting states at different brine, oil, and temperature conditions. Alotaibi et al. [19] used a Drop Shape Analysis (DSA) system to measure the contact angles of oil captive drops on small core slabs with brines of different salinity, temperature, and pressure. Amott or USBM wettability indexes have long been used to evaluate the wetting state of larger size core samples [20,21], however measurements are expensive and time consuming. Their accuracy and repeatability are subject to experiment conditions and empirical bias.
Even with an individual mineral, wettability experiments in an oil–brine–calcite system have demonstrated a range of oil-wet to water-wet responses that depend on pH, mineral surface composition, dissolved ion composition, and whether samples were aged with oil [22,23,24,25]. Still, efforts continue to improve our fundamental understanding of wettability controls. For example, recent research suggests that quartz wettability generally depends on the hydrocarbon and non-aqueous fluid density for a particular set of experimental conditions [26]. Most relevant for our study, wettability may be altered in rock–oil–brine systems [20,21,27]. Low-salinity waterflooding is one such process that causes wettability modification and leads to higher oil recovery [28]; several mechanisms have been proposed to explain the effect, although there has been no consensus [29,30,31,32,33,34]. Wettability modification will also occur in rock–oil–CO2 systems [35], due to the fact that CO2 reduces the viscosity of crude oil [36] and leads to asphaltene precipitation [37,38] during the oil–CO2 interaction. Thus, wettability should be expected to evolve during subsurface engineering endeavors involving perturbations of pore fluid composition, rather than being a simple fixed parameter for a given reservoir rock type.
For the Morrow B lithofacies, we show that two-phase oil–brine and oil–CO2 relative permeability behavior can be interpreted in terms of evolving wettability during experimental testing; our experimental and modeling results suggest that reservoir-scale changes in wettability have occurred in the Morrow B both because of historical water flooding, and also from more recent WAG operations.

3. Methods

3.1. Core Plug Selection and Preparation

A nearly complete section of four-inch diameter cores from the Morrow B well 13-10A at Farnsworth was retrieved and cut into approximately three-foot sections and sealed at the wellsite. The cores were shipped to TerraTek (now Schlumberger) which preserved them in cellophane and foil. Horizontal core plugs 1.0 and 1.5 inches in diameter (2.5 and 3.8 cm, respectively) and approximately three inches (7.6 cm) in length (limited by the diameter of the core) were cut and prepared by TerraTek and were subject to Dean–Stark extraction for hydrocarbons, or “cleaning”. Terra-Tek performed nitrogen gas permeability and porosimetry measurements on fifty-three of the cleaned plugs, and the data are summarized in Table A1 in the Appendix A. The values for residual water saturation and residual hydrocarbon content were determined by TerraTek using this analysis, and are also presented in Table A1. Six plugs were down-selected based on the HFU classification scheme applied to Morrow B heterogeneity by Rose-Coss et al. [5] and Rasmussen et al. (in review). Cores were shipped to Sandia National Laboratories (New Mexico) which prepared right-cylinders ground to tolerance for core flooding, and measured (effective) porosity by helium porosimetry. Additional core was cut from the higher permeability portions of the Morrow B at New Mexico Tech (NMT) to be used as end pieces for the core flooding experiments. This was to mitigate capillary end effects [39] that could arise in the relatively short horizontal core plugs that could be sampled from the Morrow B core. The additional cores were 1.5 inches (3.8 cm) in diameter and were 1.85 inches (4.7 cm) and 2.1 (5.3 cm) inches long.
To achieve a consistent initial wettability for all core plugs (approximating reservoir conditions at the start of water flooding), we examined two methods for flooding cores with an oil phase taken directly from a well head at Farnsworth described below. For one core, reservoir oil flowed through the core at reservoir conditions at a rate of one pore volume per day, for at least seven days. The second core was aged in a vacuum system at 76 °C (reservoir temperature that was used in the relative permeability experiments) that pulled the oil into the core. Once the oil replaced the air within the core, it was left stagnant for seven days to age. The necessary time to bring the core back to reservoir wettability is highly dependent on the reservoir [20,21,40,41] but our experience with Morrow B wettability, described in the Results section, suggests that seven days of exposure is sufficient to bring core to a consistent state of oil-wet initial conditions. Both methods using core sample 19 yielded the same relative permeability results, suggesting that time-exposure to an oil phase was the determining factor in wettability modification. We measured absolute oil phase permeability in our core-flooding apparatus, using a temperature of 76°C, a confining pressure of 8000 psi (55.2 MPa), and a downstream pore pressure of 4000 psi (27.6 MPa). These are in situ reservoir conditions within the Morrow B surrounding the 13-10A well as determined by Rose-Coss et al. [5] and Ampomah et al. [8]. In Table 2, we list core sample numbers, HFU designation, plug depths, final diameter and length used in the testing, helium-derived porosity, and oil-phase permeability for six core plugs used in the two-phase oil–brine and oil–CO2 flow measurements.

3.2. Fluid Origin and Preparation

The brine and oil used in this study for relative permeability measurements were collected from the sampling lines directly located on the wellheads from Farnsworth production wells. For simplicity, the term “brine” will be used throughout the paper to define the produced water from the Farnsworth Field, which is better described as a brackish solution. Although brine compositions across the field vary somewhat with space and time, those used in this study are quite similar. Brine from well 13-14 was used for the contact angle measurements, and brine from well 13-12 was used for the two-phase flow tests. The oil used for this work was from production well 13-12. Brines were collected in 2017 and stored in a refrigerator until use. Chemical properties of the brine are given in Table 3, physical properties of the oil are given as a function of temperature in Table 4, and the physical properties of all three phases at the testing conditions are given in Table 5. The physical and chemical properties of the brine, and density and viscosity data of the oil at different temperatures, were determined by Core Laboratories of Houston, TX. CO2 used in this study was industrial grade and provided by AirGasTM. The density and viscosity of scCO2 at experimental conditions were calculated from the National Institute of Standards and Technology (NIST) Chemistry WebBook (webbook.nist.gov); this uses the NIST Reference Fluid Thermodynamic and Transport Properties Database (REFPROP version 7) based on data in Span and Wagner [42] and Fenghour et al. [43].

3.3. Wettability Measurements

To estimate changes in wettability associated with water-flooding, we measured contact angles using a drop method directly on a 1” diameter core plug subject to sequential oil and brine flooding. We used a one-inch diameter core plug extracted from well 13-14, corresponding to the HFU V hydrologic flow unit (Table 1) and cleaned of residual hydrocarbons using the Dean–Stark extraction method.
Initial Brine flood: After checking for leaks, the core was placed in a Core Laboratories core holder, exposed to vacuum and saturated with brine. Following twenty-four hours of exposure, the brine permeability of the core was measured at room temperature of 21 °C. After brine flooding, the core was removed from the core holder, wrapped with teflon tape and aluminum foil to prevent water evaporation, and then transferred to instrumentation for contact angle measurement.
Oil flood and wettability alteration: After contact angle measurement, the brine-flooded core was reassembled into the core holder and flooded with field oil at room temperature to achieve an oil saturation corresponding to initial water saturation (Swi). After about 10 pore volumes of oil flooding, no visible brine was observed at the core holder exit, and its Swi was calculated based on collected brine volume. The core holder was then transferred to a temperature-controlled oven for wettability alteration. The oven temperature was held at 70 °C (158°F), similar to field conditions at Farnsworth, and the core was aged for two weeks. During this period, at least 3 pore volumes per day of fresh oil were pumped continuously through the core. To prevent oil evaporation, 100 psi (0.69 MPa) back pressure was applied to the core holder along with 450 psi (3.1 MPa) overburden pressure. The final oil permeability was measured at 70 °C and determined to be 129 mD. After aging, the core holder was removed from the oven, cooled, and disassembled, and the core again wrapped in teflon tape and foil for preservation prior to contact angle measurement.
Brine-displacing-oil flood: After contact angle measurement of the oil-flooded core, the core was again placed in the core holder, this time for a brine-displacing-oil experiment. The core was flooded with field brine in a 70 °C oven. After about 10 pore volumes of brine flooding, no oil droplets were observed at the core holder outlet, and the oil phase was considered at residual saturation. The core holder was then removed from the oven and cooled, with the core again preserved with teflon tape and foil wrap and transferred to equipment for contact angle measurement.
Contact angle measurement: Contact angles were measured with a DSA system from Dataphysics (OCA 20 Contact Angle System, SCA20 software, Dataphysics, Charlotte, NC, USA). In this system, the droplet image is captured via CCD camera and contact angle determined from the images using the associated software. All contact angles were measured with reference to the water phase.

3.4. Core Flooding Experiments

Experiments were conducted using a high-pressure flow-through system, shown schematically in Figure 3A. The system is built around a high-pressure core holder (Version DCH, Core Lab Instruments, Tulsa, OK, USA) shown schematically in Figure 3B and uses high-pressure tubing, valves and fittings manufactured by High-Pressure CorporationTM. A single ISCO 100D syringe pump (Teledyne ISCO, Lincoln, NE, USA) is used to supply and maintain confining pressure to the sample; two ISCO series 260 syringe pumps supply the pressure and metering of upstream pore fluids and pressure via two accumulators manufactured by Core Laboratories. A single 500HP ISCO pump supplies downstream pressure and fluid metering via an additional accumulator. The core holder and accumulators are housed within an insulated heating box with a Watlow controller, heater, and fan to equilibrate temperatures within the box.
Within the core holder, three pressure taps are fixed to a Buna-N sleeve containing the sample enabling determination of axial pressure gradients across the sample. Pore pressure was monitored via Heise 7500 psi (51.7 MPa) pressure transducers connected to the pressure taps, with an accuracy of ±1.875 psi or 0.0129 MPa. All wetted parts of the core holder were composed of Hastelloy C360 including pore lines, sample distribution plugs, and fittings. One sample distribution plug is fixed to the core holder end while the other floats, enabling measurement of cores of differing lengths and assuring hydrostatic pressure conditions. The sample core plug was sandwiched in between two rock end pieces composed of Morrow B core from HFU V; this was done to minimize capillary-end effects, especially at the downstream end of the core plug sample.
All tests were conducted at 76 °C, 4000 psi (27.6 MPa) brine fluid pressure, and 8000 psi (55.2 MPa) axial and radial confining (overburden) pressure to simulate in situ effective pressure conditions of the Morrow B reservoir. Prior to the initiation of each two-phase experiment, each fluid pair was pre-equilibrated in the upstream accumulators. The accumulators were pressurized to experimental pore pressure by running the pumps at constant pressure mode, and the pump volumes were recorded. Upon pressurization, pump volumes initially decreased, but phase equilibration was determined when pump volumes stabilized. For the oil and brine experiments, equilibration took a few hours, while the oil and gas experiments took approximately six hours to achieve phase equilibration.
All core flooding experiments were performed under steady-state flow rates and approximately ten pore volumes of fluids were displaced prior to the final relative permeability measurement [44,45]. Initially, absolute oil permeability of each core was determined at increasing confining pressures, until the core holder confining fluid was fully pressurized to 8000 psi (55.16 MPa). Oil permeability was seen to systematically decrease with increasing confining pressure and effective pressure, and this data is plotted by HFU in the Supplementary Materials. Pressure variations were determined at progressively increasing fractional flow of brine, f w i , (or supercritical CO2, scCO2) calculated as
f w i = Q w i Q w i + Q o i
where Qwi is the injection rate of brine at stage i and Qoi is the injection rate of oil at stage i. By changing the injection ratio in a stepwise manner, the entire average water saturation ( S w ) range (irreducible brine saturation, Sw,irr, to residual oil saturation, Sor) can be measured using mass balance:
S w = S w , i r r + ( 1 S o r S w , i r r ) × f w i
Relative permeabilities ( k r o for oil and k r w for brine) are determined from [46]
k r o = Q n w μ n w L A Δ P n w k ,   k r w = Q w μ w L A Δ P w k
where Q ( c m 3 s ) is volumetric flow rate for the nonwetting (nw) phase and wetting (w) phase, µ (cp) is the fluid dynamic viscosity, L (cm) and A (cm2) are the core plug length and cross-sectional area, respectively, ∆P (MPa) is the pressure difference measured across the core, and k (mD) is the single phase (oil) permeability.
Following the series of five or six measurements at varying fractional flow values, irreducible oil saturation (So,irr) is then reached by injecting brine or scCO2, until oil is no longer produced and the pressure difference across the core stabilizes. The sample was then subject to oil displacement to determine irreducible saturation of the non-wetting phase (Snw,irr). This was done by decreasing the brine or scCO2 fractional flow in a stepwise manner to evaluate hysteresis during brine displaced by oil. During all tests, flow rates were limited so that pore fluid pressures did not exceed the confinement pressure and to ensure isolation between pore and confining pressures via the sleeve.
The Corey and Brooks correlation was used to generate the full relative permeability curve and predict the imbibition curve, using both the relative permeability endpoint of brine at residual oil saturation k r w @ S o r ° and the relative permeability endpoint of oil at irreducible brine saturation k r o @ S w , i r r ° from the imbibition experimental run.
k r w = k r w @ S o r ° ( S w S w , i r r 1 S w , i r r S o r ) λ
k r o = k r o @ S w , i r r ° ( 1 S w S o r 1 S w , i r r S o r ) λ
λ defines the uniformity of the grain size distribution [47] and is calculated using a VBA regression code that changes the λ value until the Nash–Sutcliffe efficiency of the laboratory data and the Brooks and Corey correlation reaches maximum efficiency. The Nash–Sutcliffe efficiency (NSE) is the sum of the squared differences between the predicted and the actual values normalized by the variance of the observed values.
N S E = 1 i = 1 n ( Y i O b s Y i S i m ) 2 i = 1 n ( Y i O b s Y i M e a n ) 2

3.5. μCT Imaging and Optical Petrography

X-ray micro-computed tomography (X-ray μCT) imaging was performed on Morrow B core plugs using either a Zeiss Xradia 520 Versa 3D X-ray microscope, which combines geometric and optical magnification to produce tomographic reconstructions of the plug, or a North Star Imaging X50 micro-CT scanner and PaxScan 2520DX Digital Image detector, with North Star efX-DR and efX-CT software used for image acquisition and reconstruction, respectively. Both methods provide tomographic reconstruction in the form of stacks of registered tiff images with a voxel size of 3375 μm3 (15 μm ×15 μm ×15 μm). Digital image analysis of pore characteristics in the pre- and post-image sets utilized FIJITM software [48] to convert tiff stacks to 8-bit images, to perform a cylindrical crop which provided clean right-circular cylindrical boundaries, and to equalize grey levels via a histogram-matching algorithm. The modified image stacks were then examined via FEI’s PERGEOSTM v1.7 software, distributed by Thermo Fisher Scientific. A median filter algorithm applied to the image stacks improved the delineation of phase boundaries. A segmentation algorithm was then applied to determine, label, and measure pore volume and porosity. Macro-pore space was separated into pores and pore throats, which then allowed the creation of 3D visualizations of pores and pore throats, and the generation of pore network models. We used OpenPNM [49], an open source suite of software for analyzing pore network models, to examine single phase permeability of an example HFU. Additionally, we used part of the SynapsisTM software suite, SimplewareTM, to visualize connected and unconnected portions of pore networks delineated by the μCT reconstructions.

3.6. Reservoir Simulation

We examined the impact of using three-phase relative permeability values calculated in this study by mapping the HFU distributions onto a portion of a geocellular model used by Ampomah et al. [8], who describe the primary, secondary, and tertiary recovery operations at this field over fifty-five years. For this study, we have isolated a five-spot injector-producer pattern abstracted from the model of Ampomah et al. [8] and examine tertiary oil recovery occurring since 2011 associated with scCO2 injection via WAG injection following the Ampomah et al. [8] model. Eclipse E300 software was used in all simulation runs, and we compare a model using a single relative permeability relationship from Ampomah et al. [8] to results using relative permeability measurements from this study, mapped onto the HFU distribution in the reservoir model of Rose-Coss et al. [5].
Three-phase oil relative permeability was calculated using the Baker Model, due to the complexity of three-phase laboratory experiments. The Baker Model in (7) (saturation–weight interpolation) is an interpolation between the two-phase oil/brine relative permeability data and the two-phase oil/ CO2 relative permeability data [50].
k r o =   ( S w S w r ) k r o ( w ) + ( S g S g r ) k r o ( g ) ( S w S w r ) + ( S g S g r )
where Swr is the residual brine saturation, Sg is the gas saturation, Sgr is the residual gas saturation, kro(w) is the two-phase oil relative permeability in the oil/brine system, and kro(g) is the two-phase oil relative permeability in the oil/CO2 system.
The five hydraulic flow units were integrated into the existing geological model of the Farnsworth unit developed by Ampomah et al. [8]. The five-spot pattern subsection, including the four wells surrounding the injector well where the cores in this study were drilled (well 13-10A), was used for the simulation analysis (Figure 4). Wells 13-6, 13-16, 13-12, and 13-14 are producers. Brine and oil from these wells were used in the experiments as previously noted in Section 3.2. Figure 4B shows the permeability distribution based on the five hydraulic flow units used by Ampomah et [8]. Figure 4C shows the porosity distribution developed by Rose-Coss et al. [5], incorporating the Farnsworth Unit facies model. Hysteresis was not taken into account.
Additionally, constant wettability (i.e., no switching between oil and water-wet conditions), is implicit in the use of a constant set of absolute and relative permeabilities in both the calibrated and laboratory-based models.

4. Results

4.1. Diagenetic Capillary Heterogeneity in Morrow B Sandstones

Capillary heterogeneity in the Morrow B was discussed by Gallagher [3] in terms of pore types or porosity facies and was placed in the context of the HFU concept by Rasmussen et al. (in review) and herein in Figure 2. Here we provide details on pore connectivity and show how diagenesis, and in particular the development of secondary microporosity associated with clay alteration of feldspars, underlies the HFU concept and ultimate variability of multiphase flow behavior in the Morrow B reservoir. Figure 5 shows photomicrographs of thin sections from core plug end butts, representative of each HFU core plug used in this study. As shown in Figure 2, HFU V is representative of Morrow B sandstones with higher permeability at a given porosity; HFU I is representative of sandstones with the least permeability at a given porosity. HFU V (core 19) in Figure 5A shows that, generally, the HFU V samples are relatively well sorted and have a high degree of connected macroporosity and lesser amounts of clay-associated microporosity compared to the other units. HFU IV (Figure 5B) samples are moderately sorted, with a greater extent of clay-associated microporosity and carbonate cements. HFU III samples (Figure 5C,D) are poorly sorted, with virtually no connected pathways involving macropores, which are isolated and surrounded by microporosity offering the only connected flow pathways in the unit. HFU II and I (Figure 5E,F) are moderately well sorted very coarse-grained sandstones with much of their intergranular volume occluded by authigenic ferroan carbonate cement, most impressively in HFU I where little connected macroporosity is observed. Secondary porosity associated with feldspar dissolution is mostly in the form of clay-associated microporosity. These thin sections show that porosity and by extension permeability differences between the HFUs is related in part to depositional heterogeneity, but relatively minor heterogeneities are amplified by diagenetic alteration to produce much larger variability in permeability.
To more closely examine differences between the intergranular volume of the depositional framework between the HFUs, we show in Figure 6 four full-core μCT scans of HFU units. At the resolution of the images (~31 μm × 31 μm × 31 μm voxel size) one can only observe qualitatively that porosities (in blue) for the HFU V through HFU III samples are nearly the same. In Figure 6D, it is evident that porosity in the HFU I sample is occluded in nearly half of the core by siderite cements, which appear as white patches in the whole core scan.
Using the functionalities of the PergeosTM software, we can extract and segment individual framework grains, macropores, and microporous domains, calculate pore connectivity, and extract pore networks for modeling. Plotted in Figure 7 are framework grain size distribution plots for each of the cores, based on extracting a 500 × 500 × 500 voxel (7.5 × 7.5 × 7.5 mm) domain from the interior of the whole core scans of Figure 6. These show that the HFU cores representative of those chosen for two-phase flow testing are coarse to very coarse-grained, moderately to poorly sorted sandstone and granular conglomerates, which agrees with the assessment of the Morrow B by Gallagher [3] and also by Cather and Cather [51], who did a thorough assessment of the cored wells at FWU. HFU IV is moderately sorted and the coarsest grained of the samples, whereas HFU V is slightly better sorted and slightly finer grained. As evident from the grain distributions, if one were to consider just the compacted framework grains, one would expect relatively high permeability with minor variation between the samples. It is clear then that other processes, such as diagenesis, must be controlling the observed permeability variations. In the Supplementary Materials, we show frequency histograms of macro-pore size and throat distributions and pore connectivity, considering just the porous network consisting of the compacted framework grains only. Differences between the HFUs in pore and pore-throat size distributions and macro-pore connectivity show a textural basis for the measured permeability observed for the HFUs. For example, HFU V has the largest macro pore size, macro pore throat size, and largest connectivity of macropores compared to the other HFUs. Connectivity data comparing connections between micro porous zones and macro-pores show that in HFU IV- HFU II, connected pore networks require transport via micro-porous domains, with more isolated macro-pores from HFU IV to II.
HFU V is the unit closest to this ideal of compacted framework grain porosity approximating actual porosity (i.e., with comparatively minimal microporosity). Figure 8A shows a subset of 1000 × 1000 × 1000 pixels from the whole core 19 (HFU V), examined in detail for the two-phase flow experiments. The macroporosity is visualized in Figure 8B,C, where we see all macropores (in red in Figure 8B) compared to three connected networks of macropores (cyan, green, and purple colored voxels form individual distinct porous networks in Figure 8C). The cyan network in Figure 8C forms a connected pathway across the subset volume, showing that in HFU V, connected networks of macropores exist that likely control the flow properties of this unit. These are separated from other isolated pore networks a few millimeters in size, separated by clay-rich domains containing microporosity.
Network (or so-called ball-and-stick) models of porous domains are a numerically tractable and relatively simple way to examine single and multiphase flow properties of porous media [52]. In Figure 8D–F, we show a 500 × 500 × 500 pixel sub volume in the interior of the network shown in Figure 8B,C. Figure 8D depicts the raw tomographic reconstruction, and Figure 8E shows segmentation into macropores (red) and microporous domains (blue). Also visible in D and E are framework grains (light grey) and Fe-carbonate cements (white specks). Using an algorithm in PergeosTM, we reconstruct pore network models of connected macropores (Figure 8F) and connected macropores plus microporous domains—but not including carbonate cement (which forms a minor portion of sample 19)—and calculate single phase permeability using the OpenPNM pore network simulation package. We find that the permeability values for this small domain with the sample 19 determined by pore network modeling are close to the value determined experimentally of 84 mD (for oil). The value for the macropore-only pore network model is 77 mD, while the values for the macropore plus microporous domains (i.e., the framework grain-only porosity) is 110 mD. This suggests that flow through microporous domains contributes only a small fraction of the overall flow response, and that most of the flow is accommodated by connected macroporous networks for HFU V.
A view of a small core plug butt end of an HFU III sample (sample E1 in Table A1) at a higher voxel resolution of 11 μm × 11 μm × 11 μm, shows the same four main attributes of Morrow B texture discernable from μCT imaging as are visible in Figure 8D, including quartz grains, carbonate cement, macroporosity, and clay-filled pores containing microporosity (Figure 9A). An analysis of the medial axis of connected pathways (connected points equidistant from pore edges) of macropores (Figure 9B) and clay-filled regions with microporosity (Figure 9C) using PergeosTM shows that macropores form isolated networks—whereas connected pathways across the volume involve microporous regions—for this HFU. In general, flow pathways in HFU IV through I necessarily involve flow through microporous domains containing clay, whereas HFU V consists of flow pathways with at least some connected macroporosity. HFU IV and III contain progressively more of these microporous domains than HFU V.
To summarize, framework grains across the HFUs examined here have experienced a similar amount of compaction and yield similar intergranular volumes. Large differences in permeability between HFU V, IV and III can be attributed to connected flow paths consisting of progressively more clay-rich microporous domains connected with isolated networks of macropores. HFUs II and I have porosity largely occluded by extensive Fe-carbonate cements, with isolated macropores and relatively fewer microporous domains. As determined by Gallagher ([3], her Figure 41 carbonate cementation including Fe-rich phases of ankerite and siderite formed early in the paragenetic sequence of the Morrow B, followed by significant compaction, feldspar dissolution and clay mineral formation and lastly calcite cementation. These events were then followed by hydrocarbon emplacement. It is clear that diagenesis is the primary factor in determining flow properties in the Morrow B HFUs, which in turn is likely influenced by primary depositional features.

4.2. Wettability Variability in the Oil–Brine Morrow B Sandstone System

Contact angle measurements at room conditions provide an estimate of wettability variations and evolution in an oil- and brine-flooded Morrow B sandstone core plug from the HFU V group. This plug was initially cleaned of residual oil using Dean–Stark methods, and so is initially water-wetting. We argue that this particular HFU probably was at least partially water-wetting in situ at FWU, given the extensive water flooding and relatively lower residual oil saturations listed for HFU V samples in Table A1. We examine measurements of brine and oil single drops on the core surface just subsequent to an initial brine flood, an oil flood, and a brine-displacing oil flood. The results are summarized in Figure 10 and show the wettability of this HFU is easily modified according to the pore solution flooding history.
Brine drop contact angle of brine-flooded core: Following brine-flooding of the HFU V core, a drop of brine was delivered to the top surface of the brine-flooded core by a syringe pump. Once the brine drop (~5 μL) contacted the core plug surface, it spread instantaneously and a stable brine drop was not formed (not shown in Figure 10). This indicated that the brine contact angle approached 0° and the surface was strongly water-wet.
Oil drop contact angle of brine-flooded core: To do oil-drop contact angle measurements, a captive oil drop was formed beneath the bottom surface of the brine flooded core plug, which was hung over an optical cell that was filled with field brine. The image of a captive drop beneath the bottom surface of brine flooded core is shown in Figure 10A (inset) along with contact angles of six captive oil drops. The average (water) contact angle was 24.7° ± 3.1°. The oil droplet contact angles indicate that the brine flooded core plug is strongly water-wet. It was observed that the contact angles of an oil drop were constant and did not change over two hours of measurement.
Brine drop contact angle of oil-flooded core:Figure 10B (inset) shows the image of a brine sessile drop (SD) on the top of the oil-flooded core plug. Contact angles of five drops including two needles in SDs and three normal SDs are plotted in Figure 10B. The average water contact angle was 106.5° ± 4.4°. This angle indicates that the surface of the oil-flooded core plug was mildly oil-wet. It was observed that the manually formed brine drops on the surface of oil flooded core plug were not stable, and their contact angles decreased with time. In about two hours (Figure 10B), the contact angle of a brine drop decreased to 0° and brine would eventually spread on the core plug surface and penetrate to the core plug body.
Oil drop contact angle of oil-flooded core: Figure 10C (inset) shows an image of a captive oil drop beneath the end surface of the oil-flooded core plug. The average (brine) contact angle of six drops was 117.3° ± 6.1° (Figure 10C). This angle was comparable to the brine drop contact angle of 106.5° ± 4.4°. The oil drop contact angles were not stable and increased with time. In about two hours, the oil drop contact angle increased to 180° and the oil would eventually spread on the core surface and penetrate to the core body.
Brine drop contact angle of oil-displaced core:Figure 10D (inset) shows an image of a brine SD on the top of brine-displacing-oil for the same HFU 5 core. The contact angles of five brine drops including two needles in SDs and three normal SDs are shown in Figure 10D. The average brine contact angle was 98.2° ± 8.3°. The behavior of water droplets on the surface of the oil-displaced core was similar to those on the surface of the oil-flooded core. They were unstable, and the contact angles decreased with time. In about two hours, the contact angles of a brine drop decreased to 0° and brine would eventually spread on the core surface and penetrate to the core body.
Oil drop contact angle of oil-displaced core: The behaviors of oil drops beneath the bottom surface of the oil-displaced core (not shown) were similar to those of the oil-flooded core. They were unstable, and the contact angles increased with time. In about two hours, an oil drop contact angle increased to 180° and the oil would eventually spread on the core surface and penetrate to the core body.
To summarize, when brine was delivered to the surface of the initially cleaned and brine-flooded core, it spread instantaneously, and a stable brine SD could not be formed, indicating that the original wettability of this core was strong water-wet. This was also confirmed by the average oil drop contact angle, which was 24.7° ± 3.1°. After oil flooding, the oil drop contact angle beneath the surface of the oil flooded core increased from 24.7° ± 3.1° to 117.3° ± 6.1°, indicating that the wettability had been changed from strong water-wet to mildly oil-wet. This was also confirmed by brine drop contact angles, which increased from about 0° to 106.5° ± 4.4°. After the second brine flooding, the oil in the core was displaced. The oil drop contact angle was 119.8° ± 7.1°. This angle was about the same as that of the oil flooded core, which was 117.3° ± 6.1°. This suggests that the wettability remained the same after oil had been displaced with brine. While the brine drop contact angle had larger deviation, it decreased from 106.5° ± 4.4° to 98.2° ± 8.3°. These simple measurements show that Morrow B sandstone wettability can be quickly modified on an experimental time scale during brine and/or oil flooding. They also suggest that the wettability of the Morrow B sandstone has been altered from oil-wet to water-wet—at least in HFU V during water flooding in EOR operations at Farnsworth.

4.3. Oil–brine Relative Permeability for Morrow B HFUs

In this section we examine co-injection oil–brine relative permeability in the six Morrow B core plugs listed in Table 2, for the five HFUs. Background data and information for the tests are provided in the Supplementary Materials, and the results are summarized in Table 6.
Given the evidence in the previous section that Morrow B wettability is transient and dependent on history of exposure to oil or brine, it is necessary to return cores to a similar wettability to allow for comparable results. Figure 11A shows oil–brine relative permeability in a core following Dean–Stark extraction of residual oil and water, beginning with an initial oil flood and then followed with sequential floods with increasing fractional flow rate of brine. Results are plotted as a function of brine saturation. The same procedure with a core that experienced aging by exposure to the oil phase is shown in Figure 11B. The “cleaned” sample has a higher residual water saturation and higher end-point relative permeability relative to the aged sample, which has an extremely low end-point brine relative permeability. This shows the importance of aging each core by exposure to the oil phase, which modifies the wettability to be (at least intermediately) oil-wetting.
Oil–brine relative permeability curves for HFUs that experienced the aging process are shown in Figure 12 as a function of brine saturation. Sample 19 (HFU V; Figure 12A) is the most permeable (initial absolute permeability of 83.7 mD, Table 2; see also the Supplementary Materials) in this study. As discussed previously, core 19 (HFU V) contains connected networks of macropores, and relatively little clay. As the brine saturation occupies more pore space, the brine provides more resistance on oil flow, and relative permeability of the oil slowly decreases until the oil becomes immobile. This experiment had the highest range of saturation over which two-phase flow occurs, with an irreducible water saturation (Sw,irr) of 0.201 and a residual oil saturation (Sor) of 0.169.
Similar to 19, sample L7 (HFU IV) contains macropores, although not as well connected, and abundant clay-bearing microporous domains (Figure 12B). The initial absolute permeability was 59.5 mD (Table 2). The total flow rate for this experiment was 1.0 mL/min. The saturation region of flow decreases compared to sample 19 results in between a Sw,irr of 0.334 and Sor of 0.241. The decrease in permeability and larger Sw,irr is likely due to the increase of clay in L7 and less connectivity between macropores. The larger Sor for HFU IV compared to HFU V is due to the greater capillary heterogeneity owing to the more abundant clay-bearing microporosity. These trends continue when comparing HFU III to HFU IV.
Two experiments were run on different HFU III core plugs to confirm consistent results for these HFUs (Figure 12C,D). Samples L6 and L5 (both HFU III) were tested, and the initial absolute permeabilities were 40.1 mD and 22.1 mD, respectively (Table 2). L6 contains abundant clay-bearing microporous domains. Total flow rate for the L6 experiment was at 0.5 mL/min. L5 similarly contains clay-rich microporosity with poorly sorted grain size, and the L5 experiment used a total flow rate of 1.0 mL/min. L6 results show a more narrow range of two-phase flow compared to HFU V and IV, with Sw,irr = 0.439 and Sor = 0.270. Core L5 results show a larger region of two-phase flow with Sw,irr = 0.375 and Sor = 0.260.
For sample L4 (HFU II), the initial absolute permeability was 9.06 mD (Table 2). Sample L4 testing was conducted using a total flow rate of 0.75 mL/min. This HFU shows the narrowest saturation range of flow out of the six core plugs tested, with Sw,irr = 0.453 and Sor = 0.338 (Figure 12E).
Fewer fractional flow rates were implemented for the experiment on sample 1 (HFU I, Figure 12F) because of the significant time required to reach steady-state conditions at each step. With a permeability of 0.149 mD (Table 2), extremely small pore throat sizes, and a lot of cement and clay, the flow rate was limited to 0.02 mL/min so as not to produce inlet pore pressures exceeding the confining pressure. Results indicate that Sw,irr = 0.371 and Sor = 0.274, which is a larger saturation flow region than HFU II, and this may be a function of the slower total flow rate used in the testing. As observed earlier, in this HFU, the reservoir quality is diminished from a significant amount of siderite cementation.
Hysteresis (drainage) floods were performed on all cores with the exception of HFU I (due to time restrictions). The results, illustrated as the dashed black curves on Figure 12, indicate no apparent trend from one HFU to another, although all drainage curves show lower relative permeability than the initial imbibition curves. The drainage flood in HFU V had the most change in relative permeability between imbibition and drainage steps while HFU IV had almost no change.

4.4. Oil-scCO2 Relative Permeability for Morrow B HFUs

Relative permeability curves for oil and scCO2 are shown in Figure 13 as a function of CO2 saturation. Three experiments each were performed using HFU V sample 19 and using HFU III sample L5, with three different injection pressures. For 19 (HFU V) experiments (7 through 9 in Table 6, and Figure 13A–C), the CO2 relative permeability curves were somewhat surprising, having very low values. For all three experiments, they appear to start nearly horizontal, with very little relative permeability and eventually increase slightly near residual oil saturation. In part this is due to the relatively low viscosity of scCO2 relative to oil. For experiment 7 with 3000 psi (20.7 MPa) downstream pressure, the residual gas saturation (Sgr) equals 0.193 and the residual oil saturation (Sor) equals 0.164 (Figure 13A). In experiment 8, 3600 psi (24.8 MPa) downstream pressure, the saturation range of flow increases to Sgr of 0.154 and a Sor of 0.156 (Figure 13B). The region of flow increases for experiment 9, 4000 psi (27.6 MPa) downstream pressure, with a Sgr of 0.127 and a Sor of 0.140 (Figure 13C).
For L5 (HFU III) experiments (#10-12 in Table 6 and Figure 13D–F), the oil relative permeability curves become more linear as the minimum miscibility pressure (MMP) is approached (for the Morrow-B at FWU this was determined to be ~4000 psi, or 27.6 MPa, at the experimental temperature by Gunda et al. [4]). For experiment 10 at 3000 psi (20.7 MPa), Sgr equals 0.094 and Sor equals 0.231 (Figure 13D). For experiment 11, at 3600 psi (24.8 MPa) injection pressure, the saturation range of flow decreases to a Sgr of 0.183 and a Sor of 0.221 (Figure 13E). For experiment 12, 4000 psi downstream pressure (27.6 MPa), the oil relative permeability curve was approximately linear as expected as the MMP was achieved. The experiment resulted in a Sgr of 0.132 and a Sor of 0.175 (Figure 13F).
The oil and gas experiments, with the exception of experiment 9, show a small change or drop in oil relative permeabilities around 40%–60% CO2. For experiment 10, the effluent oil was examined after each run to look for any inconsistencies that could offer an explanation as to why the CO2 relative permeability increases slightly (or experiences a small jump, compared with a drop in the oil relative permeability) with fractional flow during this range, indicated by arrows on Figure 13. At this specific CO2 saturation, the oil at the outlet separator became foamy with its appearance and texture changed, with a lighter brown color (Figure 14). It appears that little mixing of the two phases occurs at lower CO2 saturations, but CO2 dissolves (i.e., is miscible) in the oil at higher CO2 saturations. This suggests that with increasing pore volumes of scCO2 passing though the core plugs, the wettability changes from an initial state of intermediately oil-wet to more scCO2 wet, and this corresponds to an increasing amount of produced, and altered, oil phase. This frothy brown oil has been observed at Farnsworth well heads by one of the authors (R. Grigg), and so the changes in the oil properties induced by a relatively modest exposure to scCO2 are also occurring in the subsurface.
For both HFU V and HFU III tests, the scCO2 endpoint relative permeabilities are extremely low. The endpoints from core 19 range from 0.058 to 0.145 compared to 0.045 to 0.175 for core L5.

4.5. Reservoir Simulation

To examine the consequences of the relative permeability analysis in the previous section on CCUS/EOR, we conduct simulations of the WAG injection scenario at FWU explored by Ampomah et al. [8]. We examine a five-spot injector producer pattern extracted from the larger FWO model of Ampomah et al. [8] for the years 2011–2017. This base model was developed by Ampomah et al. [8], based on a synthesis of well log and core data across the FWU by Rose-Coss et al. [5] and Rose-Coss [6]. In their model, Ampomah et al. [8] used a single relative permeability relationship derived from history matching of produced oil. For our purposes here, two models were compared using different relative permeability methods to analyze reservoir performance for the five-spot injector-extractor pattern. Both models take into account the dissolution of CO2 into oil as CO2 is being injected. The first model (A) was abstracted from the Ampomah et al. [8] history matched WAG model. The model employed a single relative permeability curve for the Morrow B but uses absolute permeability for the Morrow B HFUs determined herein. This relative permeability curve was developed specifically for SWP history matching analyses. The second model (Model B) used the same five-spot subsection and absolute permeability HFU data as Model A but integrated the three-phase relative permeability data presented in this study using equation 7. Data for the relative permeability model used in this study are given in the Supplementary Materials.
The cases were compared to actual production and WAG injection data (termed “Sector Model”) from the Farnsworth well 13-10A pattern from December 2010 to July 2018, given by Ampomah et al. (2017b). Model A and Model B accurately modeled the cumulative oil production, compared to the historical data (Figure 15A). This is a surprising result, in that the laboratory relative permeability data produce results which are basically the same as the history-matched result of Ampomah et al. [8], without any upscaling procedure. Model B results on oil recovery efficiency are also comparable to Model A results, underestimating by about 3% (Figure 15B). Model B however underestimates the cumulative water injection and production amounts (Figure 15C,D). This underestimate could be caused by low brine relative permeability determined at the core scale in this study, for the oil-aged core plugs, and is addressed further in the Discussion section.

5. Discussion

5.1. Integrating Pore-Scale Observations with Experimental and Modeling Results

The wettability and relative permeability of Morrow B sandstones are seen experimentally to be transient and sensitive to flooding history, and likewise the Morrow B reservoir at FWU is expected to form a transient, spatially heterogeneous system. Transient relative permeability is not accounted for in the modeling. By comparing stationary models to the estimated productions from a field likely experiencing transient changes in wettability, we can nonetheless draw insights that bear on CCUS/EOR efficiencies at FWU.
Initially Model B, using measured relative permeabilities, can perform as well as Model A, the extracted history-matched model. Over the long-term, this holds true with oil-production, implying that a significant portion of the reservoir remains oil-wet and relative permeability functions remain constant. For example, we see in the thin section images of Figure 5 that substantial residual oil remains in the Morrow B (particularly in kaolinite-rich microporous regions) following decades of water flooding. However, with CO2 WAG EOR, the presence of CO2 both changes the character of remaining oil (as in Figure 14) and lowers pH of the low salinity injectate water. This would be expected to drive the system to be water-wet over time during water flooding [30,53,54]. This change in wettability invalidates the relative permeability functions used in the models, as the functions would become more like the non-aged rather than the aged relative permeability measurements (Figure 11). What is the mechanism of wettability modification?
Silicate minerals have different regions of surface charge controlled by isomorphous substitution and lattice imperfections, both causing fixed surface charge, and broken or unsatisfied bonds, which lead to variable surface charge [55]. Minerals such as kaolinite or quartz experience more variation in surface charge, due to changes in pH or the concentration of other charged ligands, than those with more extensive isomorphic substitution such as illite or smectite [55]. The variation is caused by the adsorption/desorption of charged ligand, H+ or others, onto the broken bonds at the surface. Similarly, carbonate minerals have pH or charged ligand concentration-dependent surface charges, with reversals of effective surface charge possible as in ’pure’ silicate mineral phases [55].
The reversal of surface charge due to changes in fluid composition is one mechanism for changing the wettability of a mineral from oil-wet to water-wet or vice versa [56]. This is most likely to occur in quartz, feldspar, and kaolinite-rich sandstones that do not have high concentrations of more reactive, higher fixed surface charge clay minerals such as smectite or illite [55]. The Morrow B sandstone mostly contains minerals with more variable (pH and ligand-dependent) surface charges and we would expect that wettability throughout the formation would be highly pH and ligand dependent; we do observe this, in fact, in HFU V. However, if ligands cannot penetrate the wetting phase to alter the effective mineral surface charge, the surface change will not change, and the wetting phase will not be desorbed [57]. A higher curvature and more variable patterns of the wetting phase, that are allowed by large pore throats that cannot be easily bridged, are ways to ensure that ligands can penetrate the wetting phase and disperse it. Conversely, continuous, lower curvature wetting phases—as allowed by micro-pore throats such as in authigenic kaolinite ’books’—will discourage the penetration of ligands to the mineral surface, decreasing the rate or even occurrence of changes in wettability, independent of the underlying per-existing surface charge of the minerals [56].
Simply put, oil–mineral surface tension is broken by changes in pH of the water when pH or other ligands can penetrate to the mineral surface [30,53,54,57], allowing the water to intrude and sheet the mineral surface. This change in surface wetting, in turn, changes the relative permeability of this portion of the rock but does not do so uniformly or instantaneously [53,54]. Thus, there is a time- and space-dependence on the validity of the water relative permeability that is tied to (a) intrusion of low salinity, low pH water; (b) presence of CO2, which lowers the pH and reacts with the oil phase; (c) presence of secondary minerals, particularly kaolinite and carbonates; and (d) the variable capillary heterogeneity observed between the HFUs. In the Morrow B, these combined effects likely correspond to what is observed for HFU V and possibly HFU IV, where, because of larger pore-throat sizes, water and CO2 more easily intrude, and where there are abundant secondary clay minerals. This interpretation is further supported by the agreement early in WAG operations of Model B in Figure 15 with produced waters, that then shifts to a strong mismatch later in time, with water production far exceeding Model B predictions.
At the reservoir scale, however, we observe that the calibrated model and the measured relative permeability measurements produce roughly indistinguishable responses, both matching the historical oil production records. This is not simply a control via absolute permeability. Rather, it is controlled by the time-invariance (stability) of wettability, and thus relative permeability, within a significant portion of the reservoir. Because of smaller pore sizes, this likely is the case in the lower flow units, HFU I through HFU III. The smaller pores allow the oil phase to bridge across pore-throats, leading to a more continuous, lower surface area oil–water–mineral interface [57,58]. This decreased interface combined with a lower water-relative-permeability and lower absolute permeability restricts low-pH, CO2-altered waters from intruding as easily, allowing the minerals to remain oil-wet [58]. Because they remain oil-wet and are in the portions of the reservoir most likely to have retained the most oil, the relative permeability measurements and the initial calibrated model assumptions will remain valid, offering a good approximation of EOR observed at Farnsworth.
To summarize, we interpret the agreement of the calibrated model (Model A) and the relative permeability measurements (Model B) with produced oil, and the mismatch of these models with produced waters later in time, to demonstrate heterogeneous, time-dependent wetting behavior. This line of field-scale evidence is consistent with the laboratory and petrographic evidence: the microporosity controls the stability of wetting and the relative permeability by isolating oil behind continuous interfaces of oil and brine.

5.2. CO2-Oil Interactions during EOR-CCUS

In the oil–CO2 experiments, we argue that the step-down or drop in oil relative permeability in all of the experiments with HFU V and HFU III (Figure 13) is caused by a change in composition and perhaps system wettability in the presence of CO2 (Figure 14). In HFU V (Figure 13A–C), the decrease in oil relative permeability occurs at a range of saturations but has a discrete drop of 0.4 to 0.7 proceeded by a relatively constant oil relative permeability. In one of the tests (Figure 13C), there appears to be two drops in oil relative permeability. In HFU III (Figure 13D–F), the step decrease in oil relative permeability occurs at a CO2 saturation of 0.4 to 0.6 consistently and drops by 0.2 to 0.4. These, too, show a shallowing of slope before the drop in relative permeability. In HFU V, the CO2 has relatively uniform access to the entire pore network even at low saturations; it has large pores throats, so filling pores with CO2 will be a largely random process with few if any “ink-bottle” effects. However, once CO2 has intruded into the sample, it will react with the oil still lining the pores. The CO2 appears to be oxidizing the oil, likely changing its wetting behavior and allowing CO2 to penetrate into dead-ended or otherwise inaccessible pores.
The random nature of macro-pore network intrusion in HFU V explains the wide range of CO2 saturations over which the drop in oil relative permeability occurs, and perhaps the presence of a ‘double-drop’. HFU III samples, however, have limited macro-pore pathways across the sample. CO2 flow pathways in this HFU are controlled by the pervasive microporosity that, if covered with an oil film, restricts CO2 into smaller volumes of the pore network effective CO2–oil interface. To have a penetrative network of CO2 across the sample, a critical threshold of microporosity would need to be intruded with CO2. Percolation theory predicts average thresholds of approximately 0.5 to have connection across a media. The percolation threshold is consistent with our observed drop. Before then, oil–covered micropores and the limited penetration of CO2 through the sample restrict the reaction of CO2 with oil, delaying the drop in relative permeability to flooding with higher CO2 saturations.
All relative permeability drops are preceded by a period of nearly unchanging oil relative permeability and do not show a corresponding sharp increase in CO2 relative permeability. An unchanging relative permeability indicates that the pore network occupied by oil is not changing—that somehow CO2 relative saturation is increasing without changing the oil-filled pore network. This is consistent with CO2 reacting and being incorporated into the oil, suggesting that the geometry of CO2–oil interfaces remain relatively constant. It also implies that for configurations with limited CO2–oil interface surface area, much of the oil will remain in its initial, higher-viscosity state for longer. Given the restriction of CO2–oil surface area likely found with oil-bridging of micropores, this is also consistent with both the smaller and more consistent CO2 relative saturations over which the drops occur in HFU III when compared to HFU V. While the reaction between CO2 and in situ oil is likely a redox reaction from the presence of oxidizing CO2- and O2- in the CO2 flooding, partitioning of certain preferred oil compounds from oil surface chemistry could be occurring as well.

6. Conclusions

The results of this study indicate that transient wettability exists within Morrow B reservoir flow units in the West Texas Farnsworth field, based on room temperature contact angle experiments, relative permeability measurements at in situ conditions, and a comparison of modeled oil and brine production to actual production. Controls on wettability, such as pore size distribution and mineralogy, lead to preferential flow, or fast paths in the most permeable flow unit and preferential trapping in the lower permeable flow units. These are important considerations for efficient CCUS for the Morrow B but would also be relevant in other depleted clastic reservoirs.
(1).
Morrow B heterogeneity in Well 13-10A in the Farnworth Unit of West Texas is examined using core acquired by the SWP. Based on fifty-three core plug measurements, we apply a hydrologic flow unit concept (done for the entire Farnsworth field by Rose-Coss et al. 2016) to quantify core heterogeneity, down-selecting to six core plugs across five units for detailed relative permeability measurements. The HFU characterization, along with detailed petrographic and μCT characterization, reveals that pore (capillary)-to-core scale heterogeneity is largely due to diagenetic processes. Although porosities are largely similar between the flow units, permeability varies over four orders of magnitude due in large part to the presence and spatial distribution of clay-bearing microporosity and carbonate cement, and this has a direct influence in reservoir-scale CCUS behavior from sweep to storage.
(2).
Morrow B wettability is sensitive to and easily modified with flooding history, shown here via simple contact angle experiments, and by effects of aging on oil–brine relative permeability behavior. The current reservoir appears to be at least slightly water-wetting, due to the long history of water-flooding at Farnsworth. Most residual oil resides within the clay-hosted microporosity, which would be accessible to CO2-flooding only at higher capillary pressures. Indeed, in CO2–oil co-injection experiments, more oil is produced, and residual oil saturations decrease, as injection pressures approach the minimum miscibility pressure. CO2 relative permeability curves show a small jump as CO2 saturation increases, which suggests that initially oil-wet, aged Morrow-B samples quickly become at least partially CO2 wetting during even moderate CO2 flooding. Produced oil properties change with progressive exposure to CO2 in the experiments, and similar changes have been observed at Farnsworth associated with CO2-flooding. This suggests that CCUS activity at Farnworth might be altering in situ wettability similar to that observed experimentally.
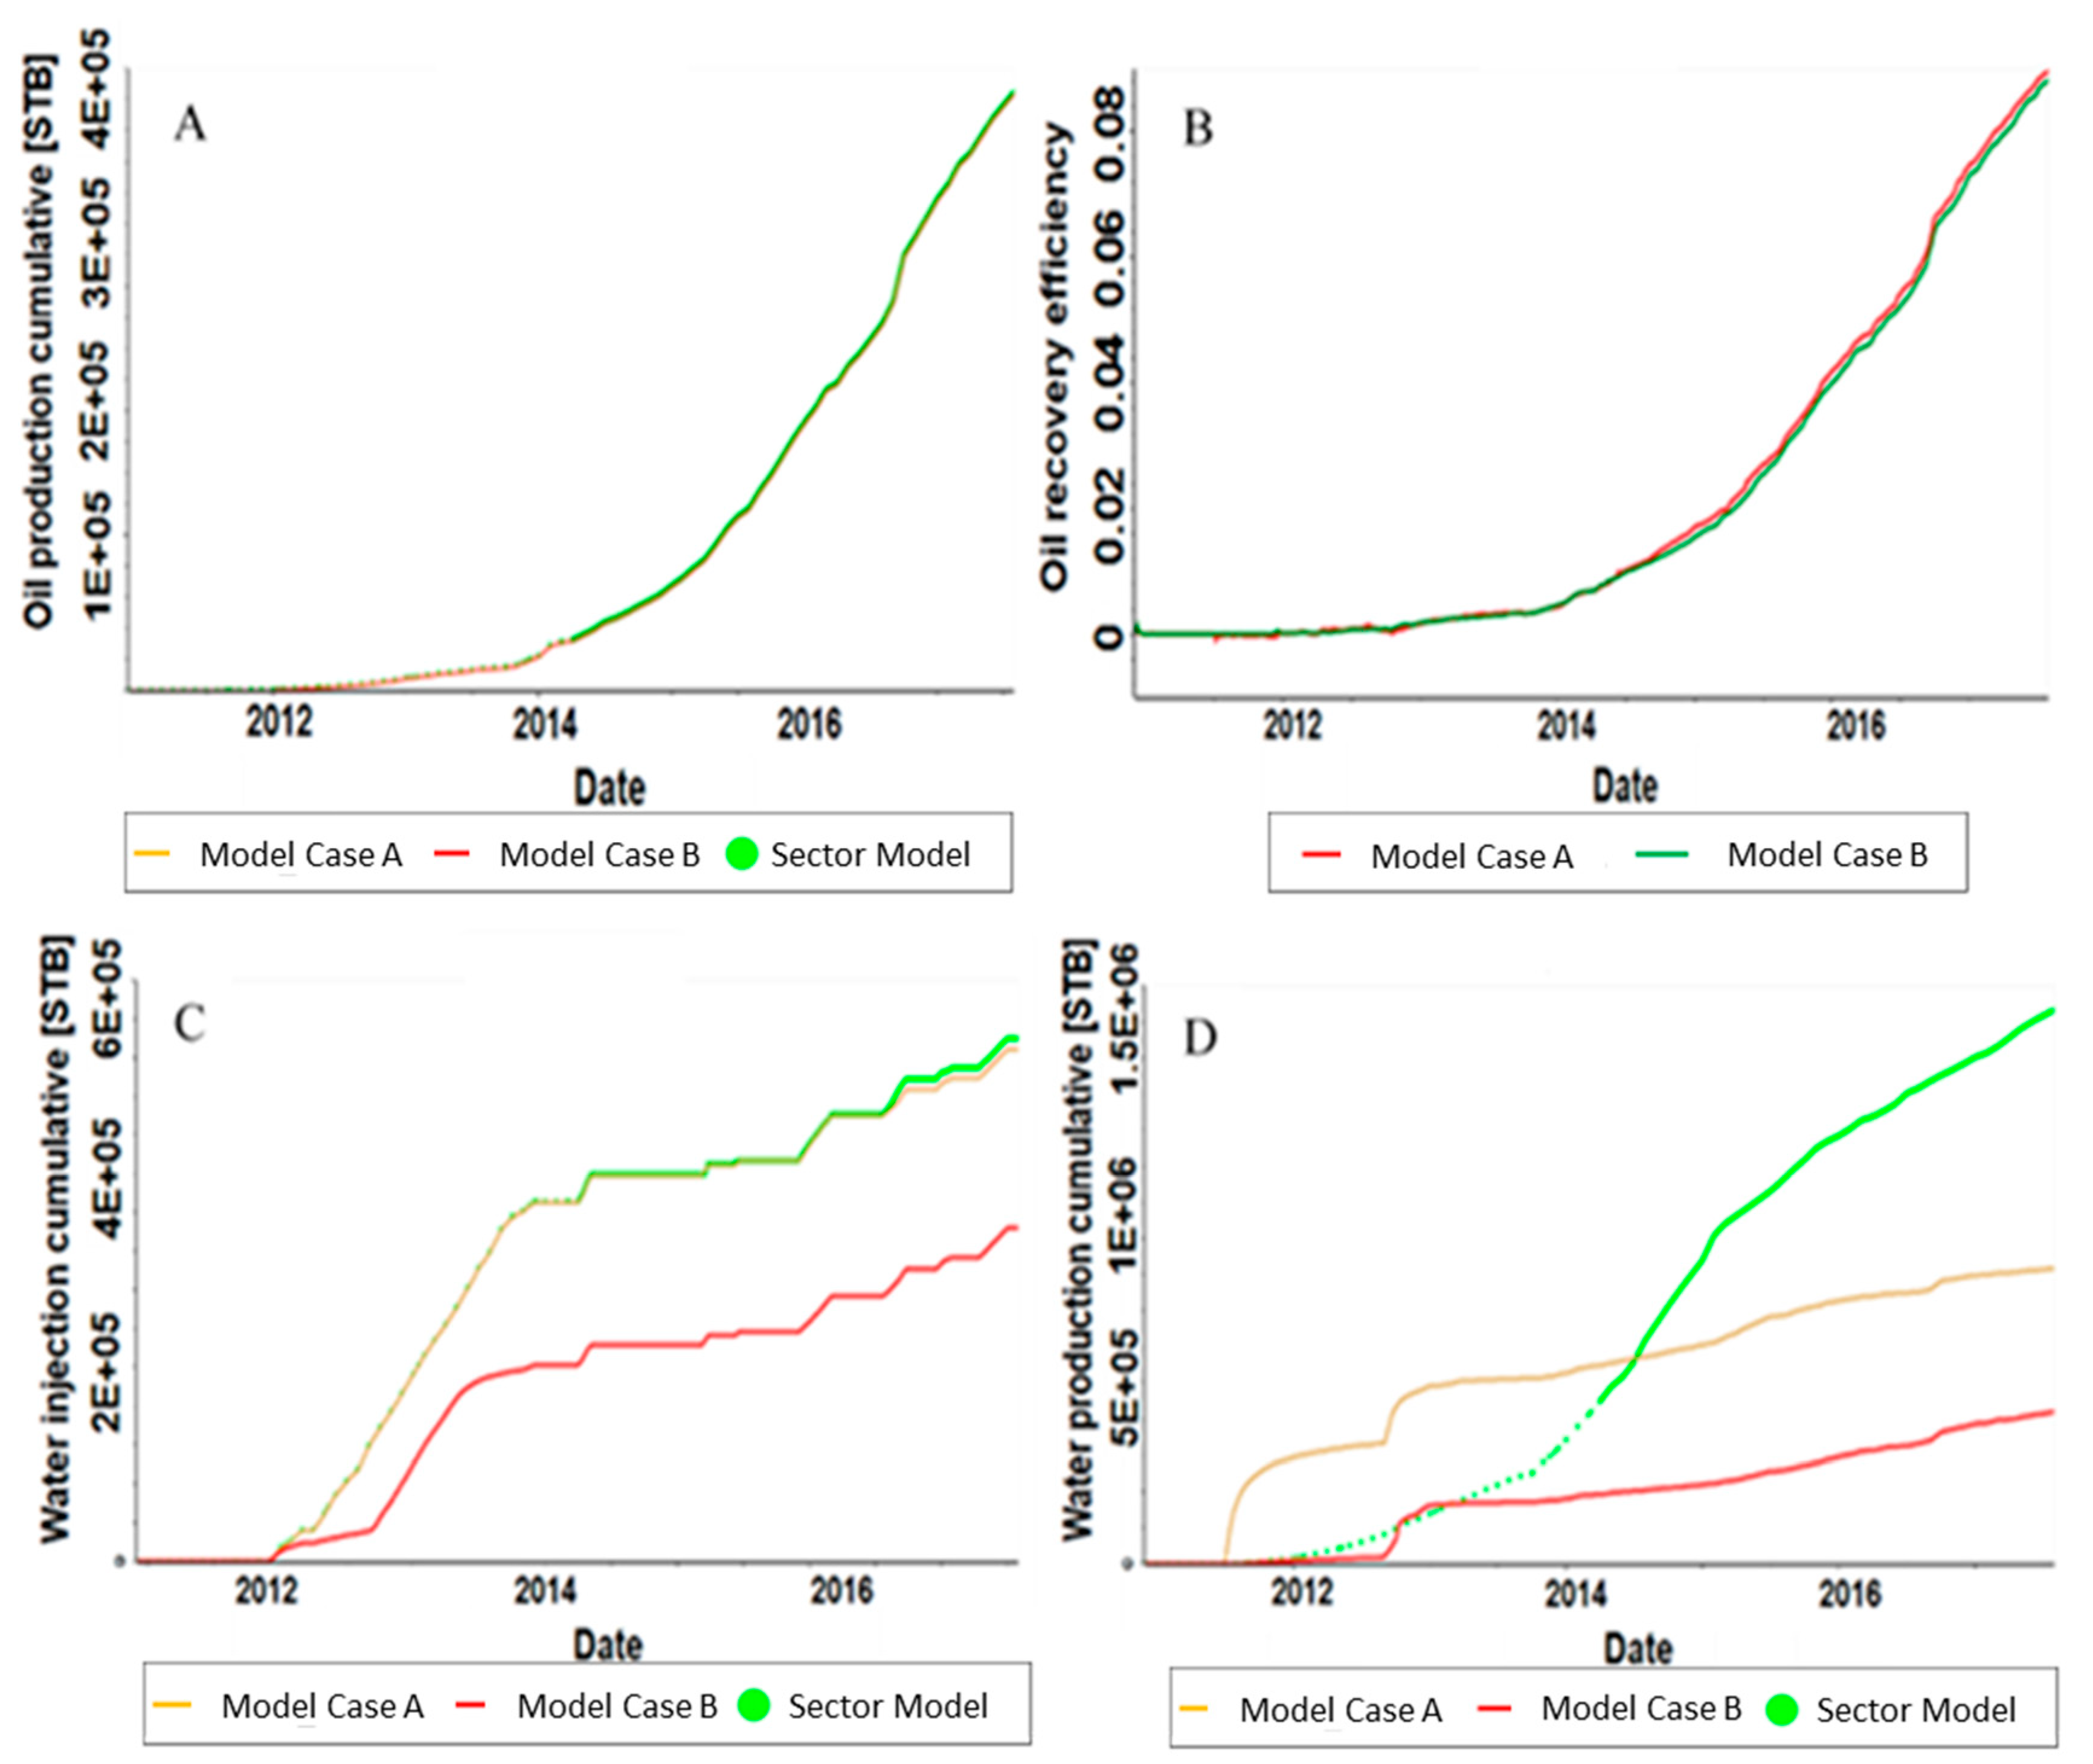
(3).
Measured two-phase relative permeability data were used to estimate three-phase relative permeability, which in turn was applied in the reservoir model of Ampomah et al. [8] to calculate oil recovery and gas storage at the field scale. The numerical simulation yielded results comparable to the actual oil production data, but underestimated water injection and production. We conjecture that this is due to evolving and heterogeneous wettability in the Morrow B at Farnsworth (not accounted for in modeling), particularly in the highest permeability HFU V, which has apparently yielded most of its original oil in place. This shift in wettability, from oil-wet to at least moderately water-wetting, probably has produced fast pathways in the Morrow B that influence and limit the sweep of CO2 during EOR/CCUS activities.

Supplementary Materials

The following are available online at https://www.mdpi.com/1996-1073/12/19/3663/s1, Figure S1: Pore radii and pore throat radii statistics for Morrow B HFUs determined from μCT image analysis using the PergeosTM software suite; Figure S2: Coordination number between connected macro-pores, and between macro-pores and microporous regions; Figure S3: Single phase oil permeability as a function of effective pressure, for all core plugs used in relative permeability experiments described in the text. Table S1: Conditions and values of single-phase oil permeability for Morrow B HFU core plugs plotted in Figure S-3; Table S2: Pressure gradients, saturations, and relative permeability values used in plotting Figure 12 in the text for all oil and brine co-injection experiments; Table S3: Pressure gradients, saturations, and relative permeability values used in plotting Figure 13 in the text for all oil and CO2 co-injection experiments.

Author Contributions

Conceptualization, L.R., A.R., R.G., J.H. and T.D.; methodology, A.L., W.A., J.H. and T.D.; formal analysis, L.R., W.A., T.D., T.F. and R.G.; investigation, L.R.; data curation, L.R.; writing—original draft preparation, L.R., T.F., T.D., A.L., A.R.; writing—review and editing, all authors; supervision, M.C., W.A., A.L., R.G., A.R.; project administration, M.C.; funding acquisition, R.G., M.C.

Funding

Funding for this project is provided by the U.S. Department of Energy’s National Energy Technology Laboratory through the Southwest Regional Partnership on Carbon Sequestration (SWP) under Award No. DE-FC26-05NT42591.

Acknowledgments

Thanks to historical site operator Chaparral Energy, L.L.C., Schlumberger Carbon Services, TerraTek (now Schlumberger), Wagner Petrographic, and Steve Cather at the NM Bureau of Geology, for valuable contributions. Michelle Williams (Sandia) performed the helium porosimetry measurements. We thank Charles Bryan (at Sandia) for comments on an earlier version of the paper. Eric Bower and James Griegos (both at Sandia) performed the X-ray scanning and tomographic reconstructions. Comments from four anonymous reviewers greatly improved the manuscript. This paper describes objective technical results and analysis. Any subjective views or opinions that might be expressed in the paper do not necessarily represent the views of the U.S. Department of Energy or the United States Government. Sandia National Laboratories is a multimission laboratory managed and operated by National Technology & Engineering Solutions of Sandia, LLC, a wholly owned subsidiary of Honeywell International Inc., for the U.S. Department of Energy’s National Nuclear Security Administration under contract DE-NA0003525.

Conflicts of Interest

The authors declare no conflict of interest. The funders had no role in the design of the study; in the collection, analyses, or interpretation of data; in the writing of the manuscript, or in the decision to publish the results.

Appendix A

This appendix lists the results of core plug analyses conducted during the routine core analysis procedure by Terra Tek (now Schlumberger). It summarizes petrophysical measurements of fifty-three core plugs from the Morrow B formation, samples from the core extracted from the well 13-10A at the FWU.
Table A1. Results of Terra Tek Routine Core Analysis and Flow Unit Designation.
Sample NumberSample Depth(m)Dry Bulk Density (kg/m3)Ambient Porosity (%)Water Saturation (%)Oil Saturation (%)Gas Perm. NOB Stress 2.75 MPa (md)R35Flow Unit Designation
E1A2339.6216019.3715.7823.8126.142.85III
E6A2337.2243010.7258.03<1.00N/A
232337.4228015.2723.2922.6411.022.10II
432337.7226018.4222.5417.6924.912.89III
442337.7209022.6916.6914.6622.872.30II
12337.9244015.5634.2825.110.560.36I
242338.4214019.7614.6023.7013.581.90II
252338.6213020.0815.6623.1721.542.46II
452338.8225017.3520.5422.1014.912.25II
462338.8222017.5714.7623.891.890.66I
32338.9216018.8320.5426.3989.276.01IV
532338.9212020.4817.6921.1044.093.69III
262339.2212020.2822.4024.4344.833.76III
E1B2339.6216019.7314.2225.0030.253.05III
52339.9213019.9328.2326.58171.598.41IV
272340.2212019.9627.3419.41274.0311.07V
282340.6216018.7519.6311.9527.062.99III
72341.0221016.8025.6622.4527.983.35III
292341.3229013.9411.6818.542.610.97I
302341.6226014.7419.9620.654.091.21II
92342.1236011.7821.9529.301.060.66I
E2A2342.3226014.7825.248.694.591.29II
E2B2342.3224016.49N/AN/A4.251.12II
312342.5229013.4115.6522.884.801.44II
E3A2342.8226014.5228.8218.5711.272.22II
E3B2342.8229013.7626.2413.689.182.07II
112343.2219016.8028.9323.3596.456.94IV
552343.2228013.8233.9630.69139.0910.20V
322343.5216018.2324.5720.53100.096.61IV
332343.7220016.8823.7720.4856.155.03IV
472344.0219017.9617.0422.1512.822.00II
482344.0223016.7413.4025.533.921.06II
132344.2209021.0828.0526.0545.653.68III
572344.3214019.0616.5322.8342.673.85III
342344.6215018.8117.1525.2030.063.17III
352344.9219017.2717.4219.5839.424.00III
152345.3213019.5528.6123.3050.604.17III
362345.6218017.9917.5719.4119.092.52III
E4A2345.8209021.0721.2716.3864.584.51III
E4B2345.8208021.8319.4318.3770.404.60III
372346.1220016.6216.9820.1132.523.70III
172346.3228013.7727.9128.013.421.15II
492346.6214019.1715.9322.3063.014.82IV
502346.6214018.6913.1923.9249.094.26III
382346.9215018.6617.3324.06126.127.43IV
512347.1219016.4915.0923.89128.548.36IV
522347.1218017.2518.7421.2744.634.31III
592347.3219017.2216.5120.86324.5713.89V
192347.4215018.8324.5822.45783.5021.60V
392347.7215018.5729.5417.16449.2015.76V
402348.024607.4510.6819.140.320.48I
412348.325105.4915.1520.050.200.48I
212348.527206.7844.249.152.531.78II
Sample E6A contains clay and more water was recovered than total weight loss (negative oil saturation); Sample E6A not suitable for permeability test; Sample E2B contained an unknown contaminant which made the water volume undeterminable.

References

  1. Parker, R.L. Farnsworth Morrow Oil Field. Panhand. Geonews 1956, 4, 5–13. [Google Scholar]
  2. Ampomah, W.; Balch, R.S.; Grigg, R.B.; Will, R.; Dai, Z.; White, M.D. Farnsworth Field CO2-EOR Project: Performance Case History; Society of Petroleum Engineers. Presented at the SPE Improved Oil Recovery Conference, Tulsa, OK, USA, 11–13 April 2016. SPE- 179528- MS. [Google Scholar] [CrossRef]
  3. Gallagher, S. Depositional and Diagenetic Controls on Reservoir Heterogeneity: Upper Morrow Sandstone, Farnsworth Unit, Ochiltree County, Texas. Unpublished Master’s Thesis, New Mexico Institute of Mining and Technology, Socorro, NM, USA; 215p. Available online: http://www.ees.nmt.edu/outside/alumni/papers/2014t_gallagher_sr.pdf (accessed on 23 August 2019).
  4. Gunda, D.; Ampomah, W.; Grigg, R.B.; Balch, R.S. Reservoir fluid characterization for miscible enhanced oil recovery. In Proceedings of the Carbon Management Technology Conference, Sugarland, Houston-Texas, TX, USA, 16–19 November 2015. [Google Scholar]
  5. Rose-Coss, D.; Ampomah, W.; Balch, R.S.; Cather, M.; Mozley, P.; Rasmussen, L. An improved approach for sandstone reservoir characterization. Society of Petroleum Engineers. Presented at the SPE Western Regional Meeting, Anchorage, AK, USA, 23–26 May 2016. SPE-180375-MS. [Google Scholar]
  6. Rose-Coss, D. A Refined Depositional Sequence Stratigraphic and Structual Model for the Reservoir and Caprock Intervals at the Farnsworth Unit, Ochiltree County, TX, USA. Unpublished Master’s Thesis, New Mexico Institute of Mining and Technology, Socorro, NM, USA, 2017; pp. 40–45. [Google Scholar]
  7. Ampomah, W.; Balch, R.; Grigg, R.B.; Cather, M.; Gragg, E.; Will, R.; Dai, Z. Performance assessment of CO2-enhanced oil recovery and storage in the Morrow reservoir. Geomech. Geophys. Geo Energy Geo Resour. 2017, 3, 245–263. [Google Scholar] [CrossRef]
  8. Ampomah, W.; Balch, R.S.; Cather, M.; Rose-Coss, D.; Gragg, E. Numerical simulation of CO2-EOR and storage potential in the Morrow Formation, Ochiltree County, Texas. Society of Petroleum Engineers. Presented at the SPE Oklahoma City Oil and Gas Symposiium, Oklahoma City, OK, USA, 27–31 March 2017. SPE-185086-MS. [Google Scholar]
  9. Rodosta, T.; Damiani, D.; Farnsworth Unit Project: Pennsylvanian Upper Morrow Formation, Ochiltree County. National Energy Technology Laboratory 2017. Available online: https://netl.doe.gov/sites/default/files/2018-11/Farnsworth-Unit-Project.pdf (accessed on 23 May 2019).
  10. Esser, R. Aqueous and vapor phase studies at the SWP Farnsworth Unit. In Proceedings of the 2018 Mastering the Subsurface Through Technology Innovation, Partnerships and Collaboration: Carbon Storage and Oil and Natural Gas Technologies Review Meeting, Pittsburgh, PA, USA, 13–16 August 2018. [Google Scholar]
  11. Trujillo, N.; Heath, J.E.; Mozley, P.; Dewers, T.; Cather, M. Lithofacies and Diagenetic Controls on Formation-scale Mechanical Transport and Sealing Behavior of Caprocks: A Case Study of the Morrow Shale and Thirteen Finger Limestone Farnsworth Unit Texas. In Proceedings of the United States. AGU Fall Meeting, San Francisco, CA, USA, 12–16 December 2016. [Google Scholar]
  12. Puckette, J.; Al-Shaieb, Z.; van Evera, E. Sequence stratigraphy, lithofacies, and reservoir quality, Upper Morrow Sandstones, Northwestern Shelf, Anadarko Basin. Oklahoma Geological Survey Circular 111. In Proceedings of the a symposium, Oklahoma City, OK, USA, 10–11 May 2015; pp. 81–96. [Google Scholar]
  13. Leeder, M. Sedimentology and Sedimentary Basins: From Turbulence to Tectonics, 2nd ed.; Wiley-Blackwell: Hoboken, NJ, USA, 2011; 768p. [Google Scholar]
  14. Hearn, C.L.; Ebanks, W.J., Jr.; Tye, R.S.; Ranganathan, V. Geological factors influencing reservoir performance of the Hartzog Draw field Wyoming. J. Pet. Technol. 1984, 36, 1335–1344. [Google Scholar] [CrossRef]
  15. Amaefule, J.O.; Altunbay, M.; Tiab, D.; Kersey, D.G.; Keelan, D. Enhanced reservoir description: Using core and log data to identify hydraulic (flow) units and predict permeability in uncored intervals/wells. Presented at the SPE Annual Technical Conference and Exhibition, Houston, TX, USA, 3–6 October 1993. Paper SPE 26436. [Google Scholar] [CrossRef]
  16. Kolodzie, S., Jr. Analysis of Pore Throat Size and Use of the Waxman-Smits Equation to Determine Ooip in Spindle Field, Colorado; paper SPE 19809382; Society of Petroleum Engineers: Dallas, TX, USA, 1980; 10p. [Google Scholar]
  17. Gunter, G.W.; Spain, D.R.; Viro, E.J.; Thomas, J.B.; Potter, G.; Williams, J. Winland pore throat prediction method—A proper retrospective: New examples from carbonates and complex systems. In Proceedings of the 55th Annual Logging Symposium, Society of Petrophysicists and Well-Log Analysts, Abu Dhabi, UAE, 18–22 May 2014. [Google Scholar]
  18. Liu, L.; Buckley, J.S. Alteration of wetting of mica surfaces. J. Pet. Sci. Eng. 1999, 20, 75–83. [Google Scholar] [CrossRef]
  19. Alotaibi, M.B.; Nasralla, R.A.; Nasr-El-Din, H.A. Wettability studies using low-salinity water in sandstone reservoirs. In Proceedings of the OTC Conference, Houston, TX, USA, 3–6 May 2010. [Google Scholar]
  20. Anderson, W.G. Wettability literature survey-Part 1: Rock/oil/brine interactions and the effects of core handling on wettability. J. Pet. Technol. 1986, 38, 1–125. [Google Scholar] [CrossRef]
  21. Anderson, W.G. Wettability literature survey—Part 2: Wettability measurement. J. Pet. Technol. 1986, 38, 1246–1262. [Google Scholar] [CrossRef]
  22. Hirasaki, G.; Zhang, D.L. Surface chemistry of oil recovery from fractured, oil-wet, carbonate formations. SPE J. 2004, 9, 151–162. [Google Scholar] [CrossRef]
  23. Sari, A.; Xie, Q.; Chen, Y.; Saeedi, A.; Pooryousefy, E. Drivers of low salinity effect in carbonate reservoirs. Energy Fuels 2017, 31, 8951–8958. [Google Scholar] [CrossRef]
  24. Woche, S.K.; Goebel, M.-O.; Mikutta, R.; Schurig, C.; Kaestner, M.; Guggenberger, G.; Bachmann, J. Soil-wettability can be explained by the chemical composition of particle interfaces—An XPS study. Sci. Rep. 2017, 7, 42877. [Google Scholar] [CrossRef] [PubMed]
  25. Xie, Q.; Sari, A.; Pu, W.; Chen, Y.; Brady, P.V.; Al Maskari, N.; Saeedi, A. pH effect on wettability of oil/brine/carbonate system: Implications for low salinity water flooding. J. Pet. Sci. Eng. 2018, 168, 419–425. [Google Scholar] [CrossRef]
  26. Pan, B.; Li, Y.; Xie, L.; Wang, X.; He, Q.; Li, Y.; Hejazi, S.H.; Iglauer, S. Role of fluid density on quartz wettability. J. Pet. Sci. Eng. 2019, 172, 511–516. [Google Scholar] [CrossRef]
  27. Mohammed, M.; Babadagli, T. Wettability alteration: A comprehensive review of materials/methods and testing the selected ones on heavy-oil containing oil-wet systems. Adv. Colloid Interface Sci. 2015, 220, 54–77. [Google Scholar] [CrossRef] [PubMed]
  28. Morrow, N.; Buckley, J. Improved oil recovery by low-salinity waterflooding. J. Pet. Technol. 2011, 63, 106–112. [Google Scholar] [CrossRef]
  29. RezaeiDoust, A.; Puntervold, T.; Austad, T. Chemical verification of the EOR mechanism by using low saline/smart water in sandstone. Energy Fuels 2011, 25, 2151–2162. [Google Scholar] [CrossRef]
  30. Sheng, J.J. Critical review of low-salinity waterflooding. J. Pet. Sci. Eng. 2014, 120, 216–224. [Google Scholar] [CrossRef]
  31. Cao, R.; Sun, C.; Ma, Y.Z. Modeling wettability variation during long-term water flooding. J. Chem. 2015. [Google Scholar] [CrossRef]
  32. Shehata, A.M.; Nasr-El-Din, H.A. The Role of Sandstone Mineralogy and Rock Quality in the Performance of Low-Salinity Waterflooding. SPE Reserv. Eval. Eng. 2017, 20, 87–106. [Google Scholar] [CrossRef]
  33. Bartels, W.B.; Mahani, H.; Berg, S.; Hassanizadeh, S.M. Literature review of low salinity waterflooding from a length and time scale perspective. Fuel 2019, 236, 338–353. [Google Scholar] [CrossRef]
  34. Chen, Y.; Xie, Q.; Saeedi, A. Role of ion exchange, surface complexation, and albite dissolution in low salinity water flooding in sandstone. J. Pet. Sci. Eng. 2019, 176, 126–131. [Google Scholar] [CrossRef]
  35. Arif, M.; Abu-Khamsin, S.; Iglauer, S. Wettability of rock/CO2/brine and rock/oil/CO2-enriched-brine systems: Critical parametric analysis and future outlook. Adv. Colloid Interface Sci. 2019, 268, 91–113. [Google Scholar] [CrossRef]
  36. Han, H.; Li, S.; Chen, X.; Zhang, K.; Yu, H.; Ji, Z. The Investigation on the Key Hydrocarbons of Crude Oil Swelling via Supercritical CO2. In Cutting-Edge Technology for Carbon Capture, Utilization, and Storage; Ballerat-Busserolles, K., Wu, Y., Carroll, J.J., Eds.; Scrivener Publishing: Salem, MA, USA; pp. 95–111.
  37. Fang, T.; Wang, M.; Li, J.; Liu, B.; Shen, Y.; Yan, Y.; Zhang, J. Study on the asphaltene precipitation in CO2 flooding: A perspective from molecular dynamics simulation. Ind. Eng. Chem. Res. 2018, 57, 1071–1077. [Google Scholar] [CrossRef]
  38. Fakher, S.; Imqam, A. Asphaltene precipitation and deposition during CO2 injection in nano shale pore structure and its impact on oil recovery. Fuel 2019, 237, 1029–1039. [Google Scholar] [CrossRef]
  39. Honarpour, M.; Koederitz, L.; Harvey, A.H. Relative Permeability of Petroleum Reservoirs; C.R.C. Press: Boca Raton, FL, USA, 1986; pp. 1–13. [Google Scholar]
  40. Braun, E.D.; Blackwell, R.J. A steady-state technique for measuring oil-water relative permeability curves at reservoir conditions. In Proceedings of the 56th Annual Fall Technical Conference and Exhibition, Society of Petroleum Engineers of AIME, San Antonio, TX, USA, 5–7 October 1981; Society of Petroleum Engineers of AIME: Dallas, TX, USA. [Google Scholar]
  41. Wendel, D.J.; Anderson, W.G.; Meyers, J.D. Restored-state core analysis for the Hutton Reservoir. SPE Form. Eval. 1987, 2, 509–517. [Google Scholar] [CrossRef]
  42. Span, R.; Wagner, W. A new equation of state for carbon dioxide covering the fluid region from the triple-point temperature to 1100 K at pressures up to 800 MPa. J. Phys. Chem. Ref. Data 1996, 25, 1509–1596. [Google Scholar] [CrossRef]
  43. Fenghour, A.; Wakeham, W.A.; Vesovic, V. The viscosity of carbon dioxide. J. Phys. Chem. Ref. Data 1998, 27, 31–44. [Google Scholar] [CrossRef]
  44. Ibrahim, M.N.; Koederitz, L.F. Two-phase steady-state and unsteady-state relative permeability prediction models. In Proceedings of the SPE 68065, Manama, Bahrain, 17–20 March 2001. [Google Scholar]
  45. Ramstad, T.; Idowu, N.; Nardi, C.; Oren, P.-E. Relative permeability calculations form two-phase flow simulations directly on digital images of porous rocks. Transp. Porous Media 2012, 94, 487–504. [Google Scholar] [CrossRef]
  46. Chen, X.; Kianinejad, A.; DiCarlo, D.A. Measurements of CO2-brine relative permeability in Berea sandstone using pressure taps and a long core. Greenhouse Gases Sci. Technology 2016, 7, 370–382. [Google Scholar] [CrossRef]
  47. Ezekwe, N. Petroleum Reservoir Engineering Practice; Pearson Education, Inc.: Boston, MA, USA, 2011; ISBN 0137152833. [Google Scholar]
  48. Schindelin, J.; Arganda-Carreras, I.; Frise, E.; Kaynig, V.; Longair, M.; Pietzsch, T.; Preibisch, S.; Rueden, C.; Saalfeld, S.; Schmid, B.; et al. Fiji: An open-source platform for biological-image analysis. Nature Methods 2012, 9, 676–682. [Google Scholar] [CrossRef]
  49. Gostick, J.; Aghighi, M.; Hinebaugh, J.; Tranter, T.; Hoeh, M.A.; Day, H.; Spellacy, B.; Sharqawy, M.H.; Bazylak, A.; Burns, A.; et al. OpenPNM: A pore network modeling package. Comput. Sci. Eng. 2016, 18, 60–74. [Google Scholar] [CrossRef]
  50. Baker, L.E. Three-phase relative permeability correlations. Presented at SPE Enhanced Oil Recovery Symposium, Society of Petroleum Engineers, Tulsa, OK, USA, 16–21 April 1988. Paper SPE-17369-MS. [Google Scholar]
  51. Cather, S.M.; Cather, M.E. Comparative petrography and paragenesis of Pennsylvanian (Upper Morrow) sandstones from the Farnsworth Unit 13-10A, 13-14, and 32-8 wells. Ochiltree County, Texas. PRRC Rep. 2016, 16-01. [Google Scholar]
  52. Blunt, M.J. Flow in porous media—Pore network models and multiphase flow. Curr. Opin. Colloid Interface Sci. 2001, 6, 197–207. [Google Scholar] [CrossRef]
  53. Jackson, M.D.; Vinogradov, J.; Hamon, G.; Chamerois, M. Evidence, mechanisms and improved understanding of controlled salinity waterflooding part 1: Sandstones. Fuel 2016, 185, 772–793. [Google Scholar] [CrossRef] [Green Version]
  54. Katende, A.; Sagala, F. Critical review of low salinity water flooding: Mechanism, laboratory and field application. J. Mol. Liq. 2019, 278, 627–649. [Google Scholar] [CrossRef]
  55. Langmuir, D. Aqueous Environmental Geochemistry, 1st ed.; Prentice Hall: Upper Saddle River, NJ, USA; 600p.
  56. Israeliachvili, J. Intermolecular and Surface Forces, 3rd ed.; Academic Press: San Diego, CA, USA, 2011; 678p. [Google Scholar]
  57. Butt, H.-J.; Graf, K.; Kapple, M. Physics and Chemistry of Interfaces, 3rd ed.; Wiley-VCH: Weinham, Germany, 2013; 461p. [Google Scholar]
  58. Bikkina, P.; Wan, J.; Yongman, K.; Kneafsey, T.J.; Tokunaga, T.K. Influence of wettability and permeability heterogeneity on miscible CO2 flooding efficiency. Fuel 2016, 166, 219–226. [Google Scholar] [CrossRef]
Figure 1. (A). Paleogeography of the Morrow B sandstone in the U.S. midcontinent. Modified from R. Andrews (Oklahoma Geological Survey, Personal Communication). (B). Stratigraphic boundaries based on wireline logs of Morrow B sandstones and surrounding units from well 13-2, Farnsworth Unit, Texas Panhandle (Adapted with permission from [3]). The range in gamma ray log is 0 to 120 gAPI, and the range in resistivity log is 0.20 to 2.0 ohms. (C). North-South cross section across the Farnsworth Unit, hung on the top of the Morrow shale (delineated by the magenta line; figure Adapted with permission from [6]). The Morrow B sandstone tops are delineated by the green line, and the formation bottoms are delineated by the orange line. Well 13-10A (second from left) core plugs from the Morrow B sandstone interval are analyzed for relative permeability and other properties in this paper.
Energies 12 03663 g001
Figure 2. Absolute permeability–porosity relationships measured from Morrow B core plugs taken from well 13-10A at Farnsworth, delineated as per HFU definitions. The solid symbols denote core plug analyses from Terra Tek (now Schlumberger) using N2 gas as pore fluid and listed in Table A1. The ‘x’ symbols and adjacent numbers refer to samples used for relative permeability analyses in this paper, and refer to oil permeability determined at in situ conditions (described in the Supplementary Materials).
Energies 12 03663 g002
Figure 3. (A). High-pressure flow-through system schematic for oil/brine and oil/CO2 experiments. (B). High-pressure hydrostatic core holder, showing the HFU sample core plug, HFU end pieces made of short pieces of core plugs, and multiple pressure taps, used to minimize capillary end effects in the measurement and interpretation of relative permeability.
Energies 12 03663 g003
Figure 4. (A). The five-spot geological model of the Farnsworth Unit used in this study. Well Locations, with well 13-10A being the injector surrounded by producer wells. (B). Permeability distribution following Ampomah et al. [8]. (C). Porosity distribution following Ampomah et al. [8] and Rose-Coss et al. [5].
Energies 12 03663 g004
Figure 5. Thin section photomicrographs of core plug butt ends epoxied with a fluorescent-dyed epoxy. Photomicrographs (AF) correspond to HFUs V through I as labelled in the images. Evident between the HFUs are varying grain size, sorting, amounts and type of iron-bearing carbonate mineral, and extent of macroporosity versus microporosity. Q—quartz; c—clay bearing microporosity including black bitumen; I—undetermined iron carbonate phase; k—kaolinite and bitumen-bearing microporosity; s—siderite with sphalerohedral crystal habit.
Energies 12 03663 g005
Figure 6. μCT reconstructions of full core scans at 31 μm × 31 μm × 31 μm voxel size that show porosity of the different HFU units (in blue). (A). HFU V Sample 19. (B). HFU IV, Sample 18 from Rasmussen et al. (in review). (C). HFU III, Sample 14 from Rasmussen et al. (in review). (D). HFU I, Sample 1.
Energies 12 03663 g006
Figure 7. Grain size distributions in ‘phi’ units (log to base 2) determined from image analysis of the whole core scans of Figure 6, for four of the five HFUs in this study. The plots are color coded to match the colors used in Figure 2. Green is for HFU V, dark blue for HFU IV, light blue for HFU III, and red for HFU I. Grain size descriptors are the following: fs is fine sand, ms is medium sand, cs is coarse sand, vcs is very coarse sand, and vfg is very fine gravel.
Energies 12 03663 g007
Figure 8. (A). Whole core μCT scan of sample 19 with a rectangular subvolume inscribed inside the core cylinder, delineated in blue. (B). Subsection (1000 × 1000 × 1000 pixels, with pixel size of 22.5 μm × 22.5 μm × 22.5 μm) showing location of all segmented macropores in red. (C). Connected networks of macropores (shown as green, teal, and purple), isolated from each other by microporous domains. The teal network extends across the entire subvolume, suggesting that a connected network of macroporosity extends across the entire sample 19 core. (D). 500 × 500 × 500 pixel subvolume sampled from the interior of the domain in (B) and (C), showing raw tomographic reconstruction of sample 19. (E). Segmented macropores (red) and microporous domains (blue) of the subvolume shown in D. (F). Pore network model of connected macropores, with size of spheres scaled to pore size, connected by throats, corresponding to the subvolume in D and E.
Energies 12 03663 g008
Figure 9. (A). μCT reconstruction of HFU III core plug butt end at 11 μm × 11 μm × 11 μm voxel size, 9.5 × 8.4 × 3.2 mm in size. Easily discernable from the scan grey levels are quartz grains (light grey), Fe-bearing carbonate cement (white), macroporosity (dark grey) and clay filled pores with microporosity (intermediate grey). (B). Macropores, realized in green (above), along with medial axis of macropores, showing that macropores in this HFU III sample are largely isolated and do not form connected pathways. (C). Clay-filled pores containing microporosity, realized in blue (above), along with medial axis of microporous regions, showing that connected flow paths through HFU III necessarily must flow through the microporous domains. Sample is E1 from Table A1, FWU well 13-10A, 7684.75’ bgs.
Energies 12 03663 g009
Figure 10. Oil and water contact angle measurements, showing variable wettability following brine- and oil-flooding.
Energies 12 03663 g010
Figure 11. The difference in relative permeability from (A). a cleaned core and (B). an oil-aged core. Relative permeability illustrates the need for aging the core to an original wettability, likely approximating that prior to EOR operations at FWU.
Energies 12 03663 g011
Figure 12. Oil and brine two-phase relative permeability curves for each HFU. (A) HFU V, (B) HFU IV, (C) HFU IIIa, (D) HFU IIIb, (E) HFU II, (F) HFU I.
Energies 12 03663 g012
Figure 13. Oil and gas relative permeability curves. (AC) HFU V relative permeability experiments performed at 20.68 MPa (3000 psi), 24.82 MPa (3600 psi), and 27.58 MPa (4000 psi), respectively. (DF) HFU III relative permeability experiments performed at 20.68 MPa (3000 psi), 24.82 MPa (3600 psi), and 27.58 MPa (4000 psi), respectively.
Energies 12 03663 g013
Figure 14. Photographs of downstream oil. The black oil (left) before the change in relative permeability. Brown frothy oil (right) is the produced oil (with CO2 exsolved) during the relative permeability changes around 40% to 60% CO2 saturation.
Energies 12 03663 g014
Figure 15. Simulation results. (A). Cumulative oil production, STB (stock tank barrel at surface conditions). (B). Oil recovery efficiency (the amount of oil displaced from the reservoir). (C). Cumulative water injection, STB. (D). Cumulative water production, STB.
Energies 12 03663 g015
Table 1. Description of Hydraulic Flow Units (HFUs). Adapted from [6].
Hydraulic UnitPore Throat SizePore TypeDescription
HFU IMicro
0.25 µm-1.0 µm
Predominantly intragranular micro porosityIntergranular porosity obstructed by carbonate cement
HFU IIMeso
1.0 µm-2.4 µm
Predominantly intragranular micro porosityCoarse grained with lesser cement and increased amount of clay
HFU IIIMacro
2.5 µm-4.7 µm
Intragranular micro with a greater amount of intragranular macro porosity, sparse intergranular micro and macro porosityPoorly sorted medium grained with carbonate and clay cement
HFU IVMacro
4.8 µm-10 µm
Intragranular micro and macro porosity as well as intergranular macro and micro porosityCoarse to medium grained, moderately well sorted
HFU VMega
> 10 µm
Intragranular micro and macro porosity, intergranular macro porosity Coarse grained, moderately well sorted with relatively less cement
Table 2. Physical properties of core plug samples used in this study.
Core SampleHFULength (cm)Diameter (cm)Depth (m)Absolute Permeability @ In Situ Effective Pressure (mD) Porosity (%)
19V6.273.762347.483.718.67
L7IV5.513.812343.559.515.41
L6III5.633.792437.140.113.44
L5III5.633.842344.522.115.34
L4II5.033.762338.49.0615.31
1I5.103.762337.90.14915.35
Table 3. Analysis of wells 13-14 and 13-12 brine composition used in the contact angle measurements and two-phase flow tests. TDS is total dissolved solids (calculated), and ORP is measured oxidation reduction potential.
Well13-1413-12
pH7.47.1
Conductivity (uS/cm)76606530
Alkalinity as HCO3- (mg/L)815752
Chloride (Cl) (mg/L)18461721
Fluoride (F) (mg/L)1.51.6
Bromide (Br) (mg/L)19.521.3
Nitrate (NO3) (mg/L)00
Phosphate (PO4) (mg/L)<0.50<0.50
Sulfate (SO4) (mg/L)396.8
Lithium (Li) (mg/L)0.330.4
Sodium (Na) (mg/L)14591312
Potassium (K) (mg/L)7.97.4
Magnesium (Mg) (mg/L)9.29.7
Calcium (Ca) (mg/L)43.949.2
TDS Calculation (mg/L)3807.53478.1
ORP (mV)405nd
Inorganic Carbon (ppm)187.7nd
Non-Purgeable Organic Carbon (ppm)6.34nd
Table 4. Density and viscosity of well 13-12 oil as a function of temperature.
Temp (°C)Viscosity (cP)Density (g/mL)
2029.20.844
2519.40.840
3014.70.844
4010.30.830
507.760.823
605.950.816
704.740.810
Table 5. Physical properties of fluids used for two-phase experiments.
Fluid Density (kg/m3)Viscosity (cP)Salinity (ppt)
scCO2747.60.06-
Brine975.40.407.6
Oil746.61.66-
Table 6. Results from each two-phase core flood experiment performed in this study.
Experiment NumberCore SampleFluid PairsDown-stream Pressure (MPa)Flow Rate (ml/min)Sw,irrSorSgrrw@sorgr@sor
119 (HFU V)Oil/ Brine27.582.000.2010.169-0.091-
2L7 (HFU IV)Oil/ Brine27.581.000.3340.241-0.215-
3L6 (HFU III)Oil/ Brine27.580.500.4390.27-0.186-
4L5 (HFU III)Oil/ Brine27.581.000.3750.26-0.102-
5L4 (HFU II)Oil/ Brine27.580.750.4530.338-0.166-
61 (HFU I)Oil/ Brine27.580.020.3710.274-0.183-
719 (HFU V)Oil/ Gas20.6810.0-0.1640.193-0.058
819 (HFU V)Oil/ Gas24.8210.0-0.1560.154-0.145
919 (HFU V)Oil/ Gas27.5810.0-0.140.127-0.141
10L5 (HFU III)Oil/ Gas20.680.50-0.2310.094-0.045
11L5 (HFU III)Oil/ Gas20.680.50-0.2210.183-0.175
12L5 (HFU III)Oil/ Gas27.580.50-0.1750.132-0.142

