Temporal Evolution of Split-Injected Fuel Spray at Elevated Chamber Pressures


Abstract

1. Introduction
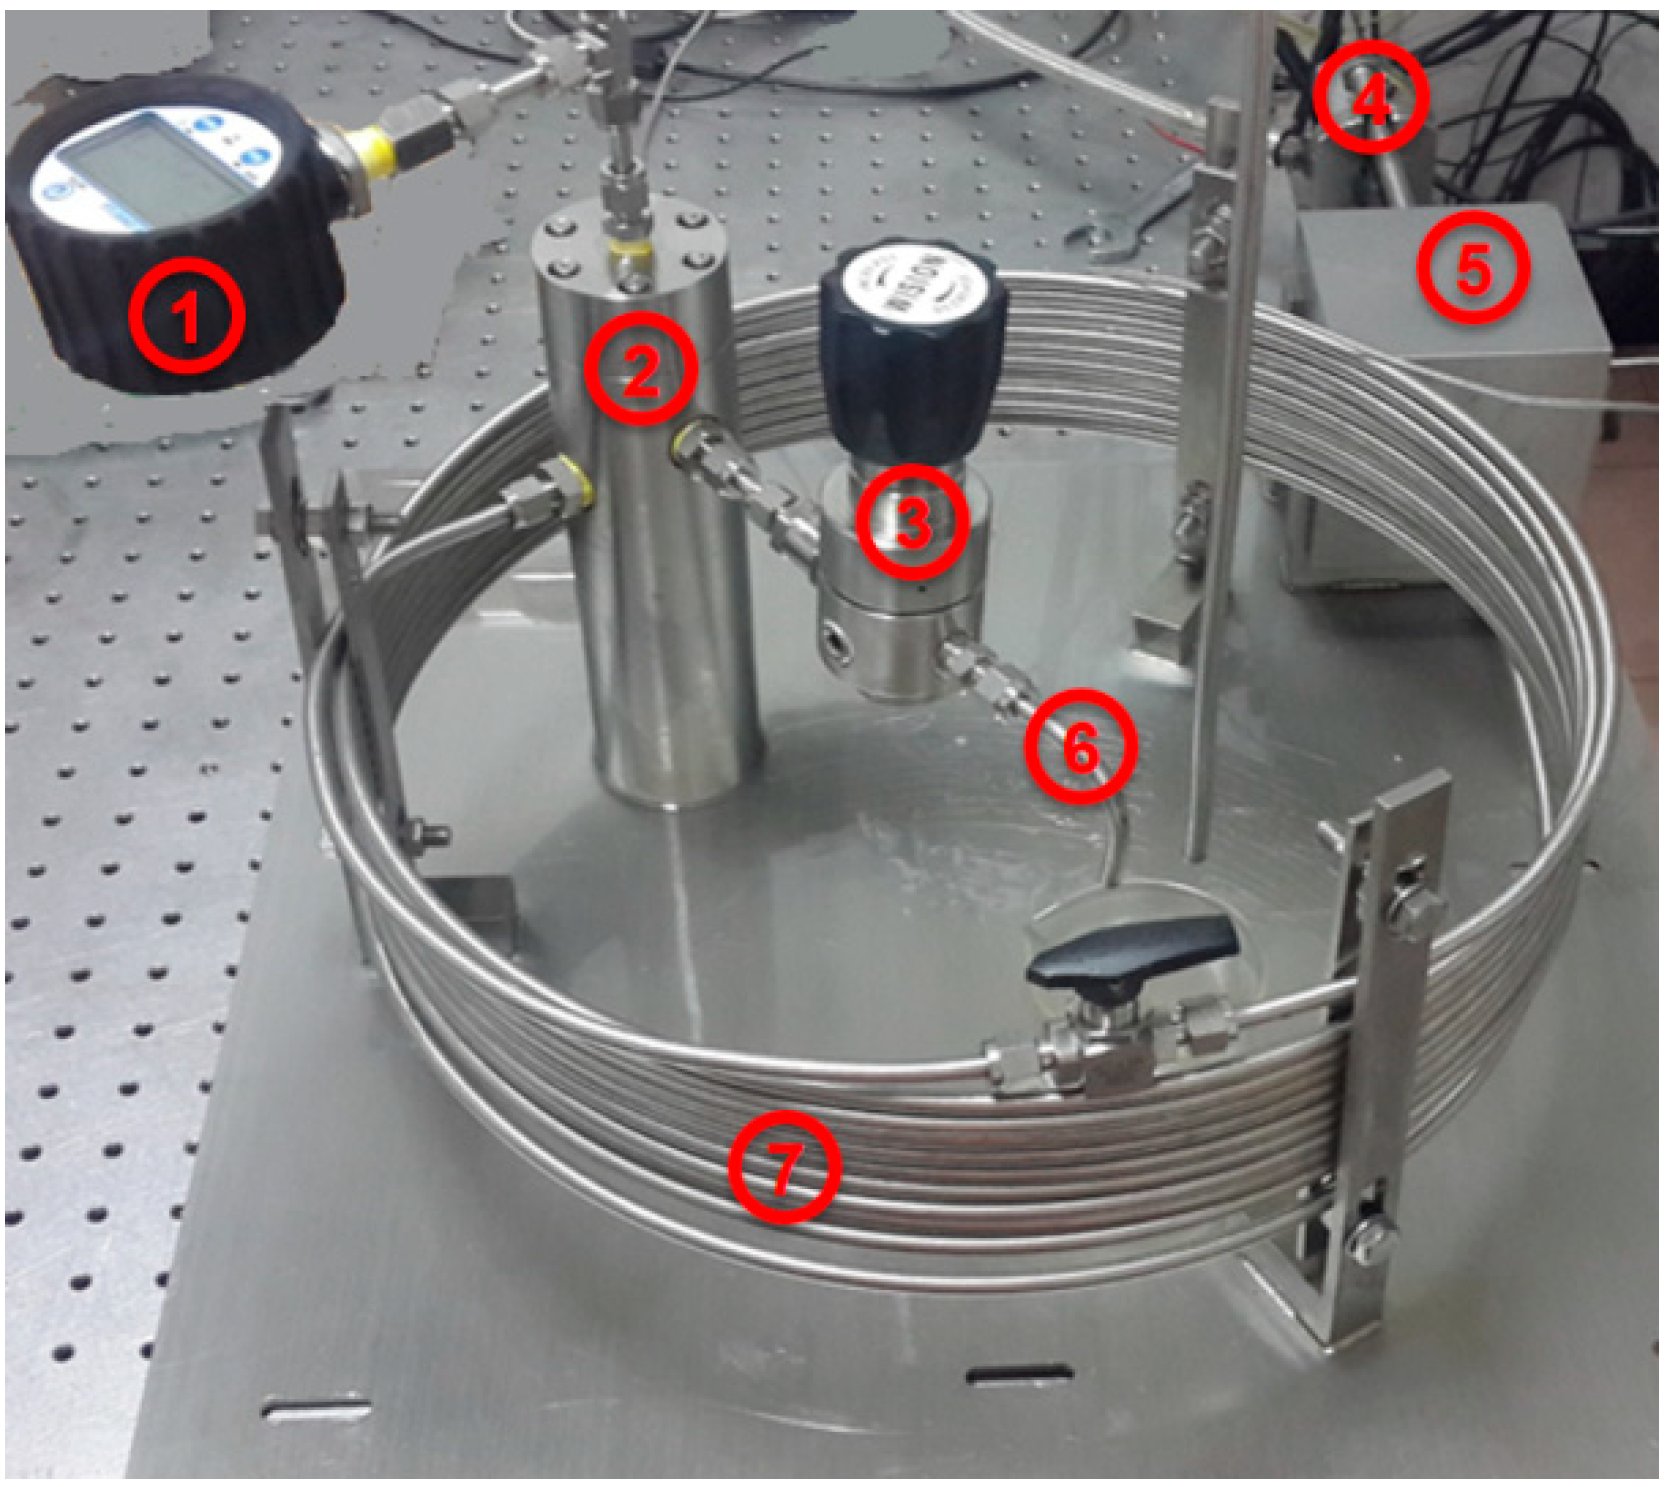
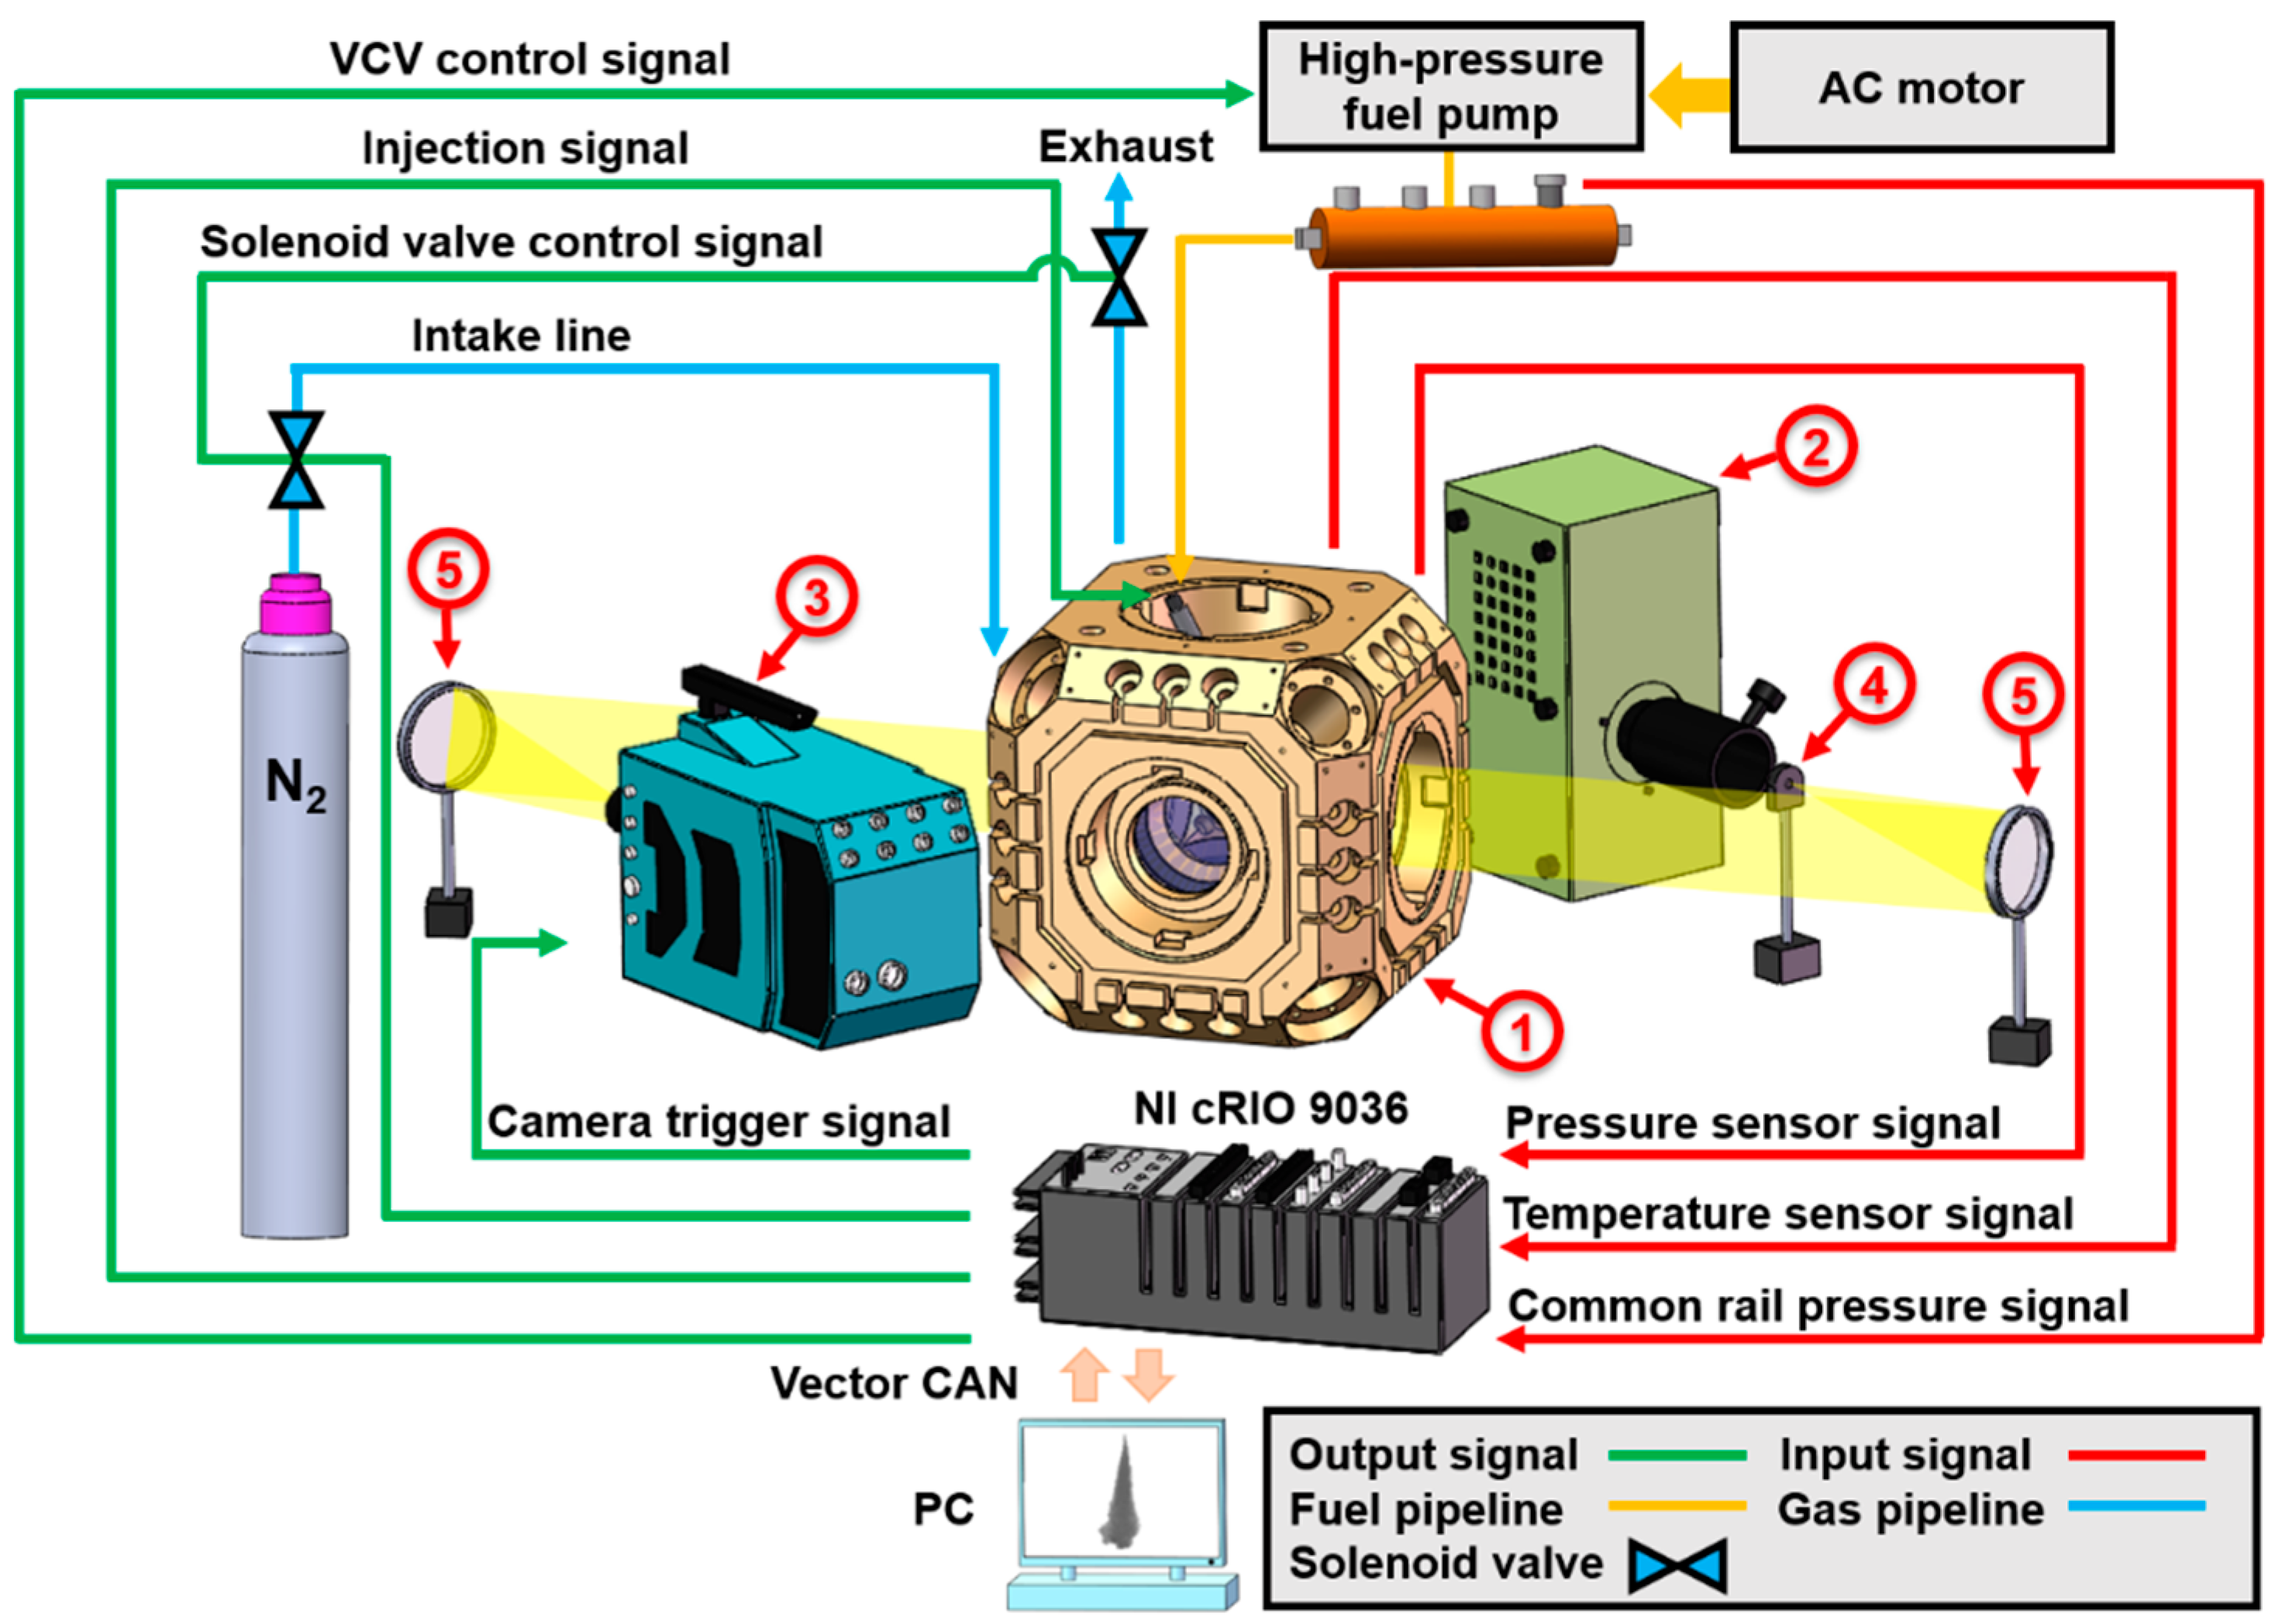
2. Experimental Setup
3. Results and Discussion
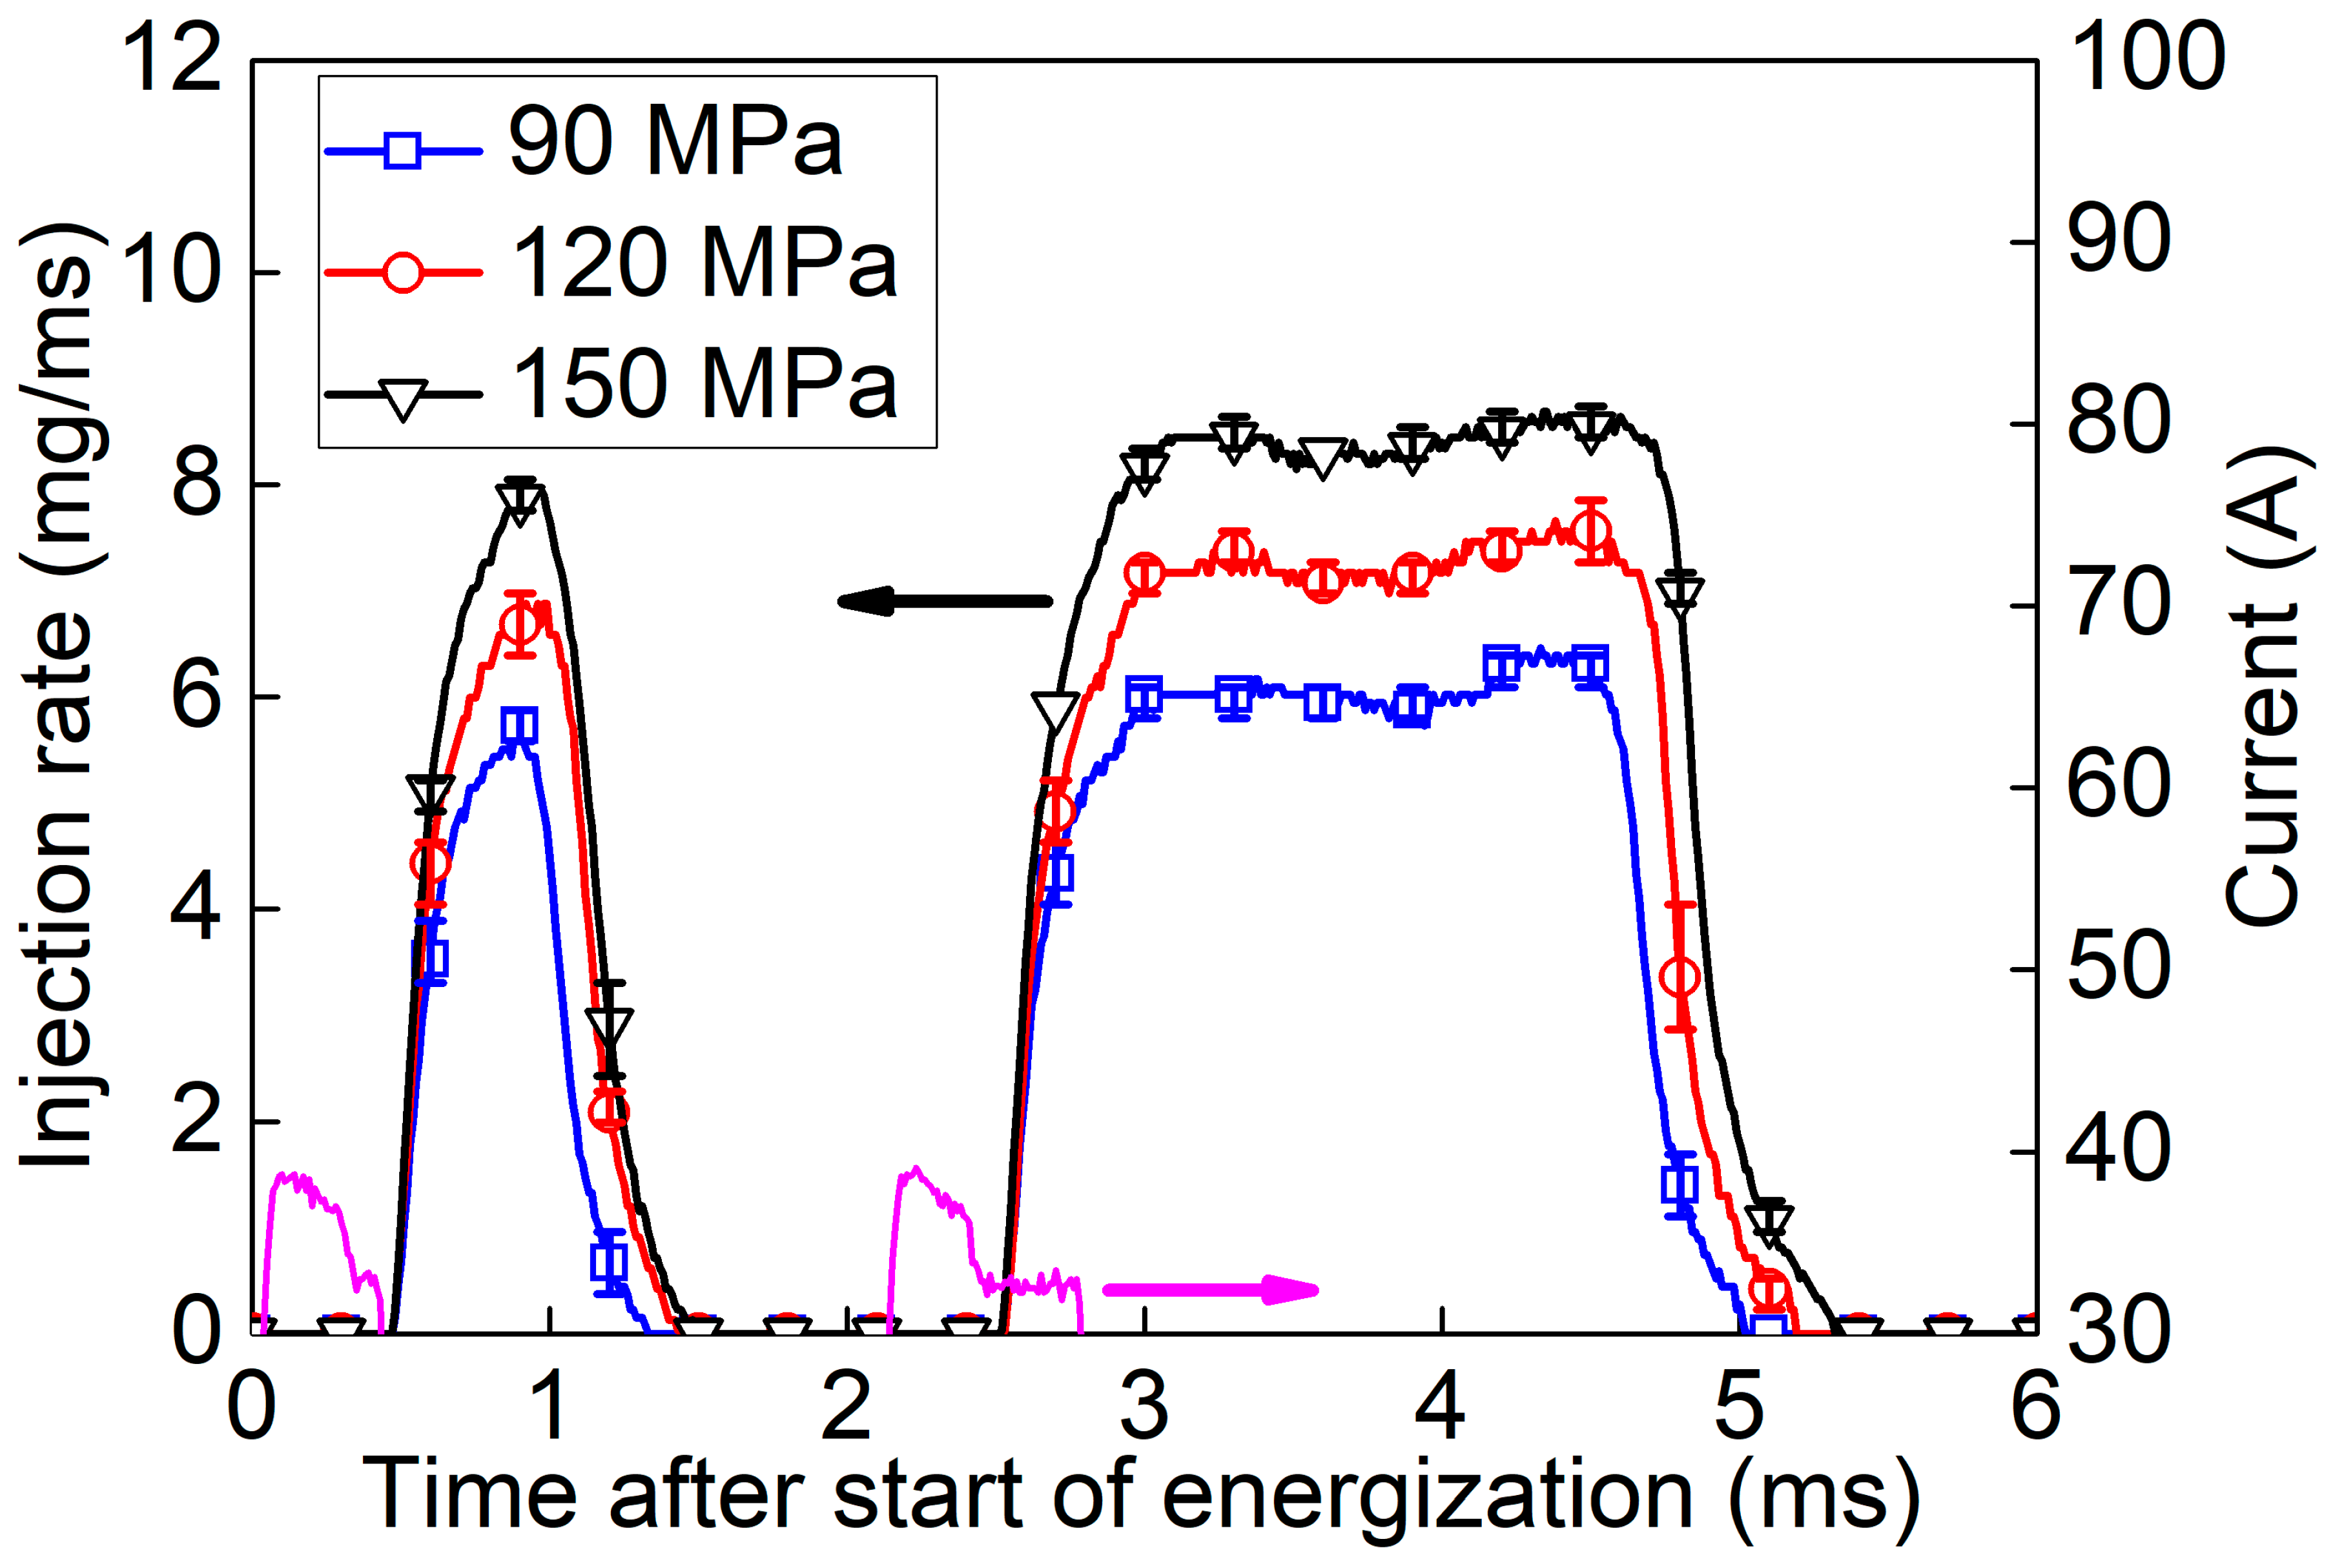
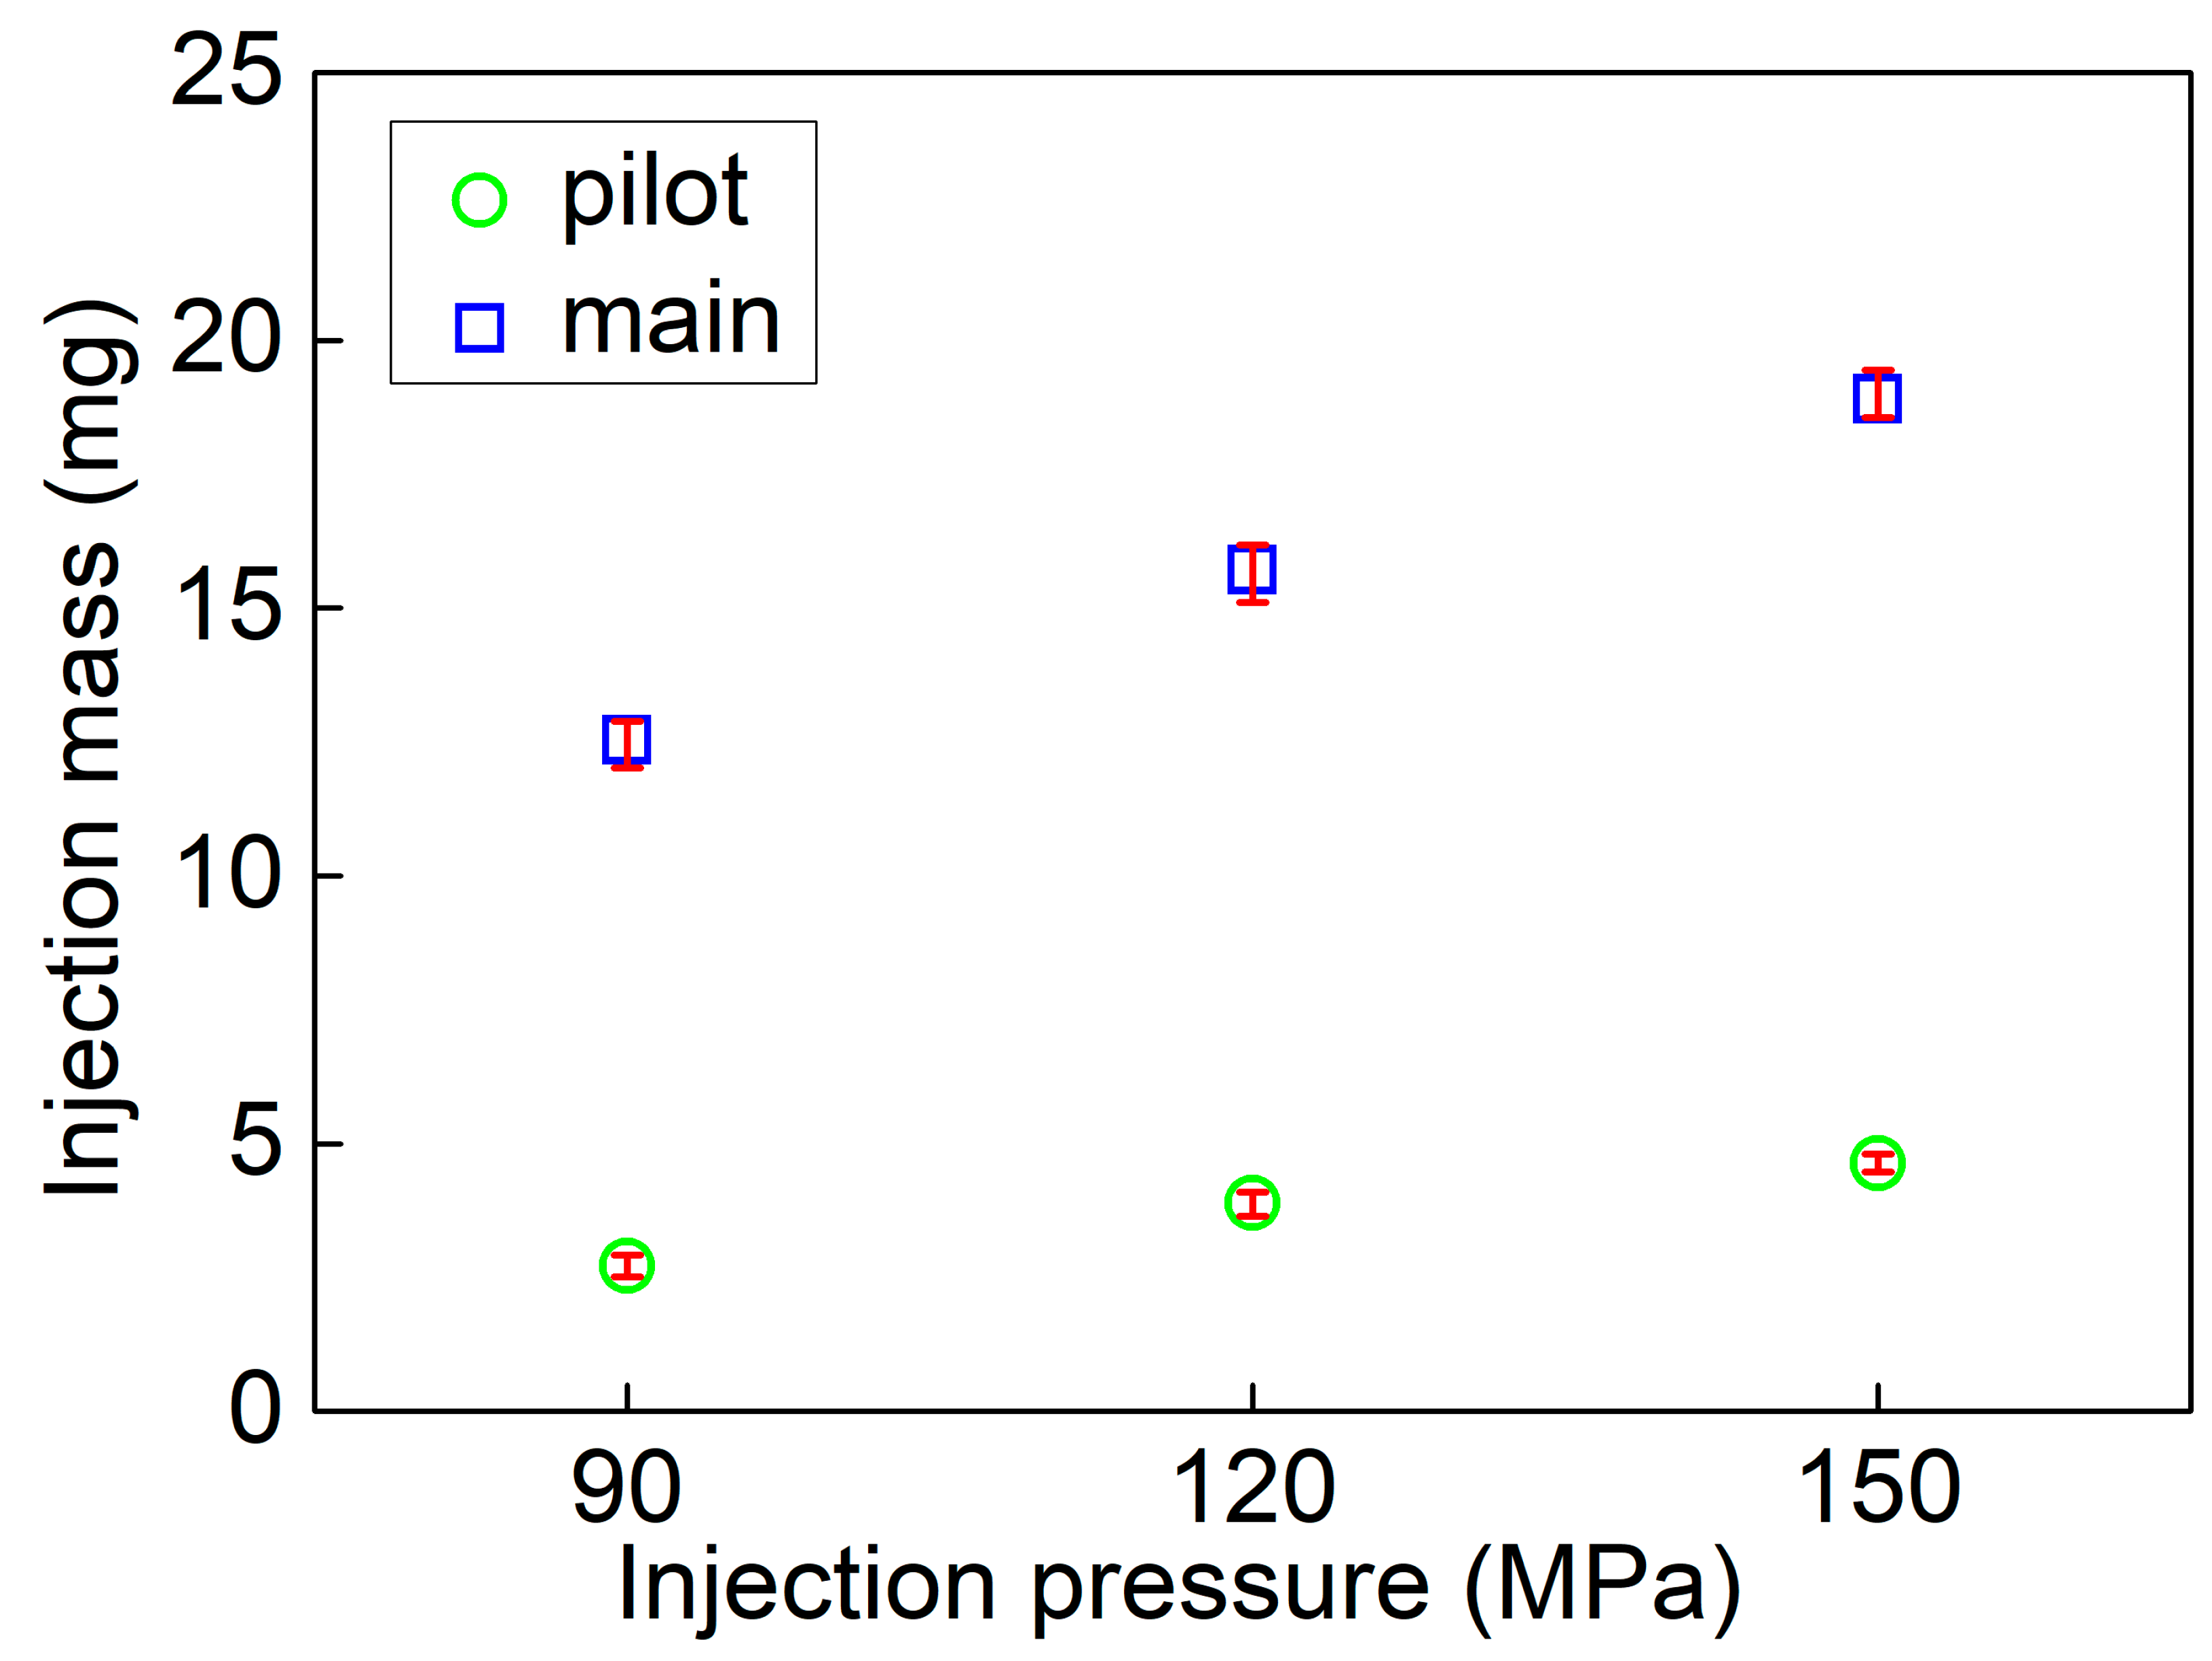
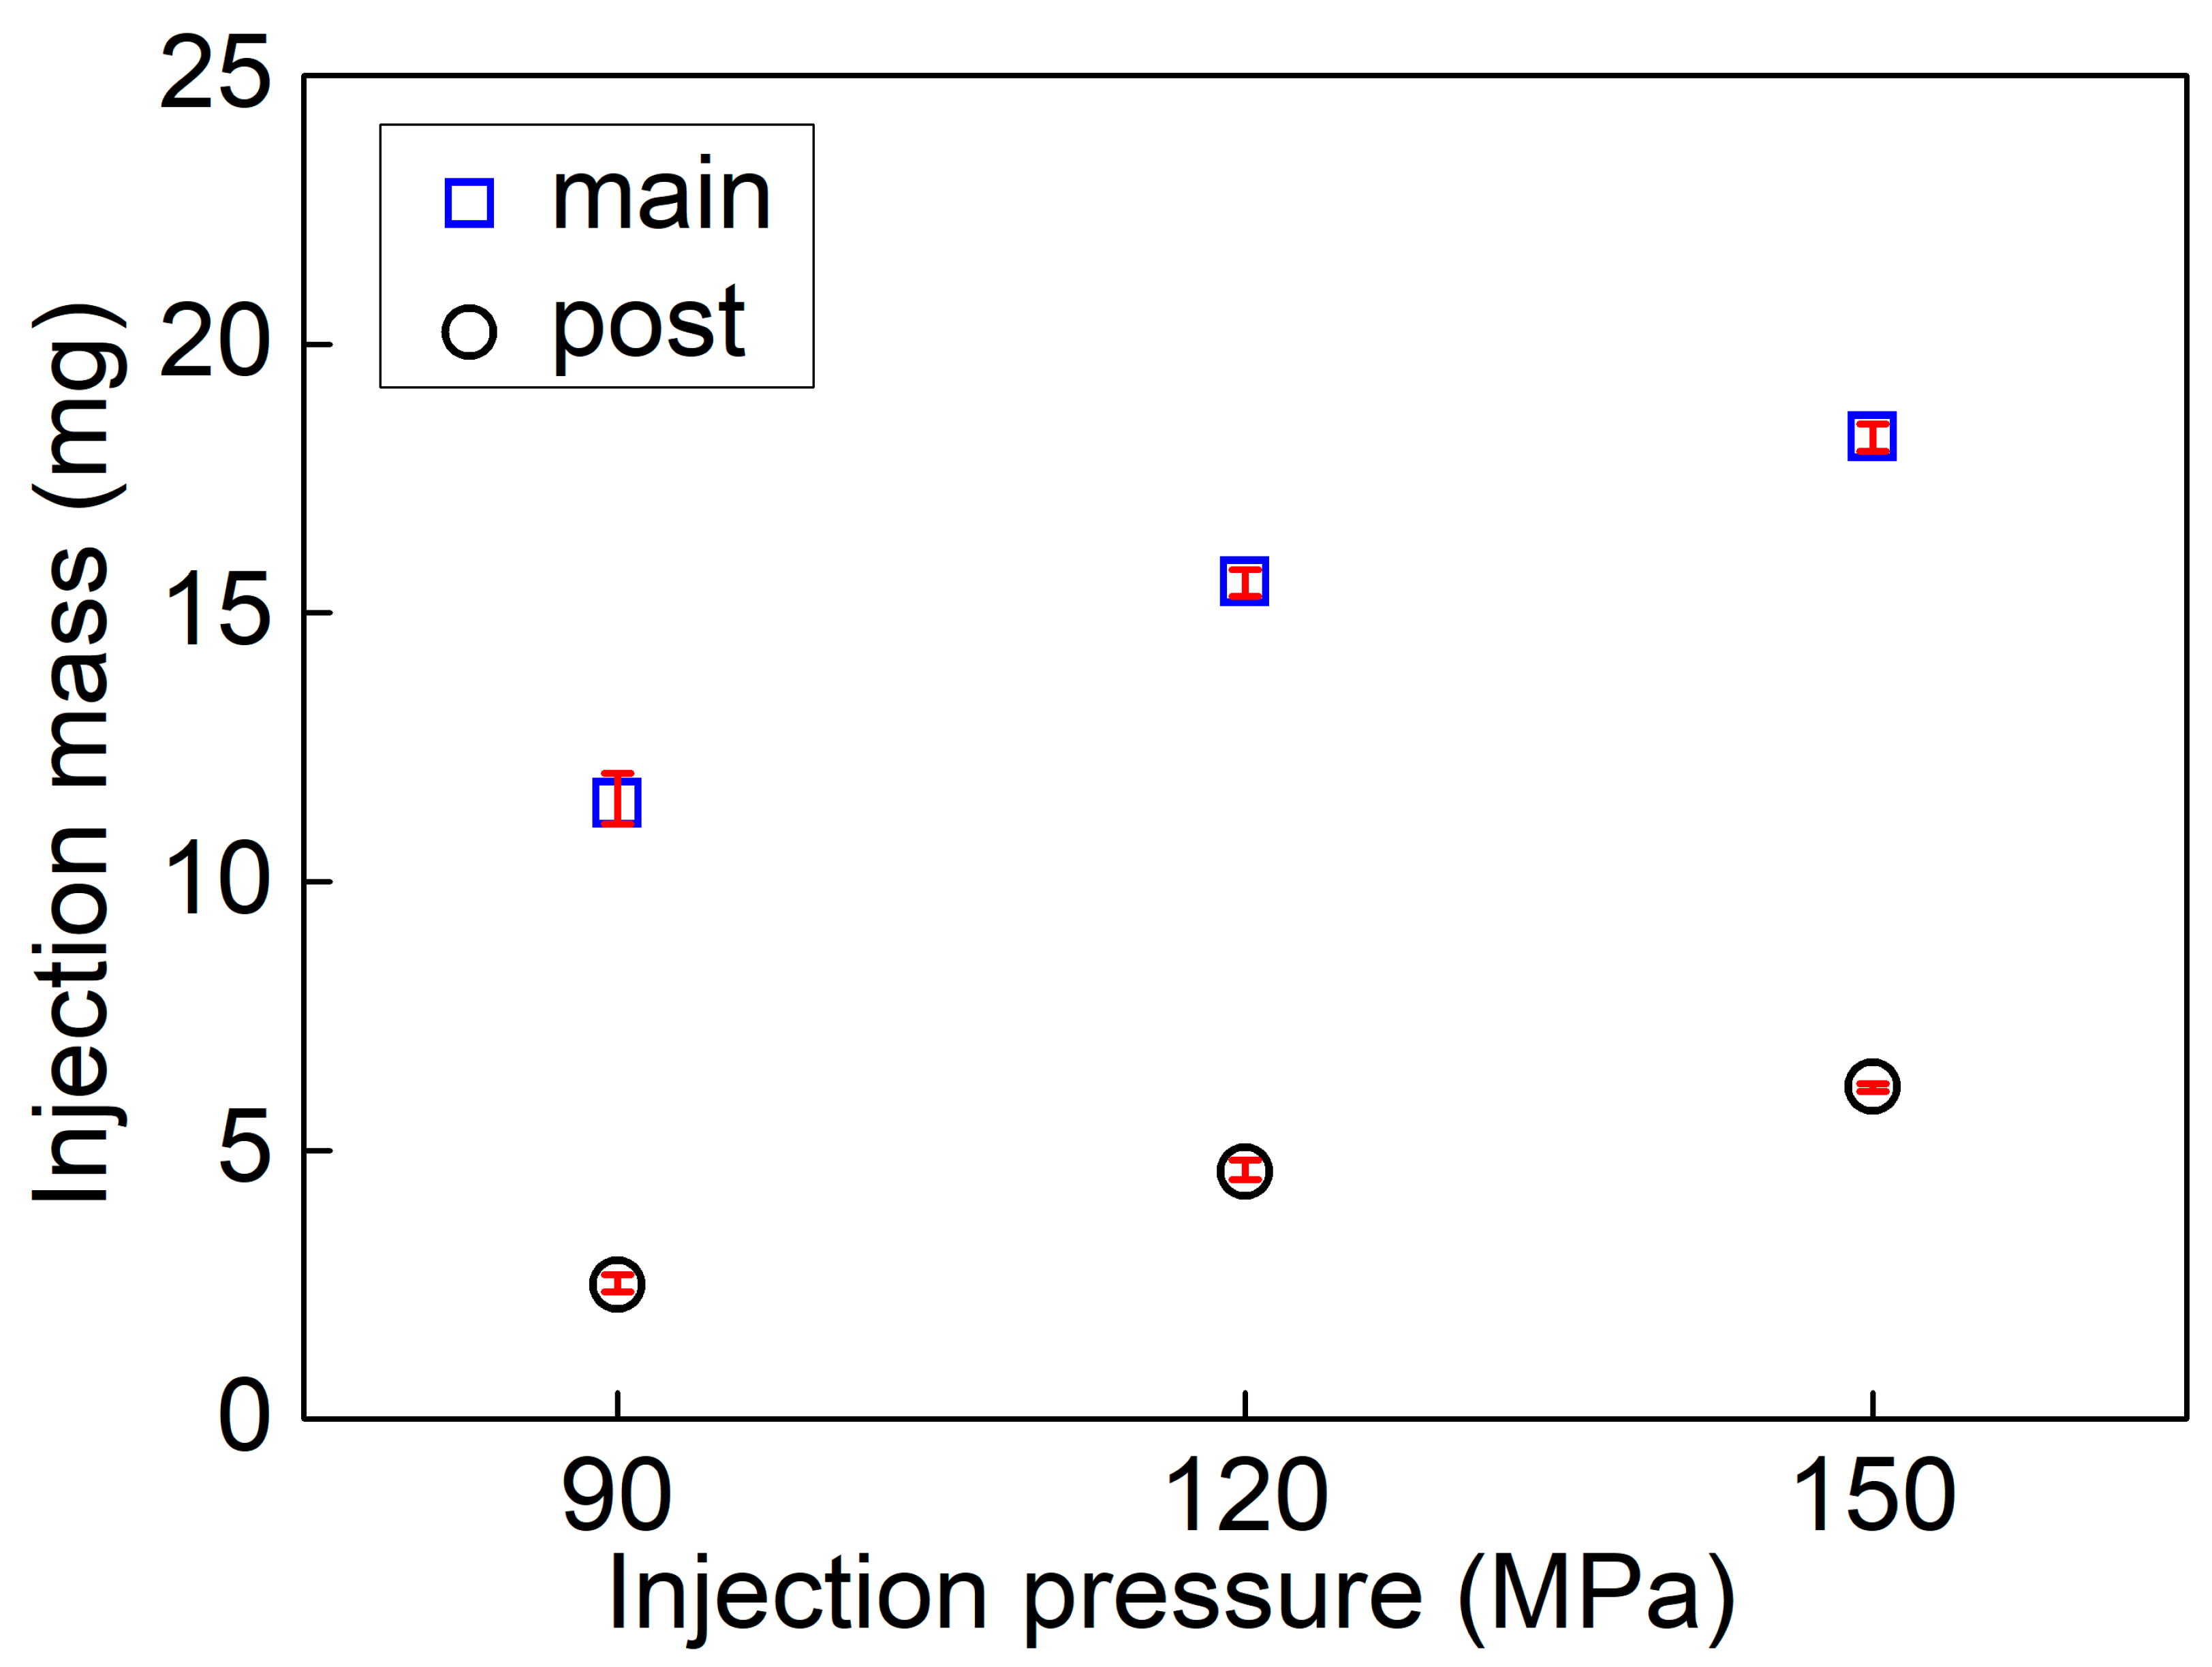
3.1. Injection Rate and Injection Mass
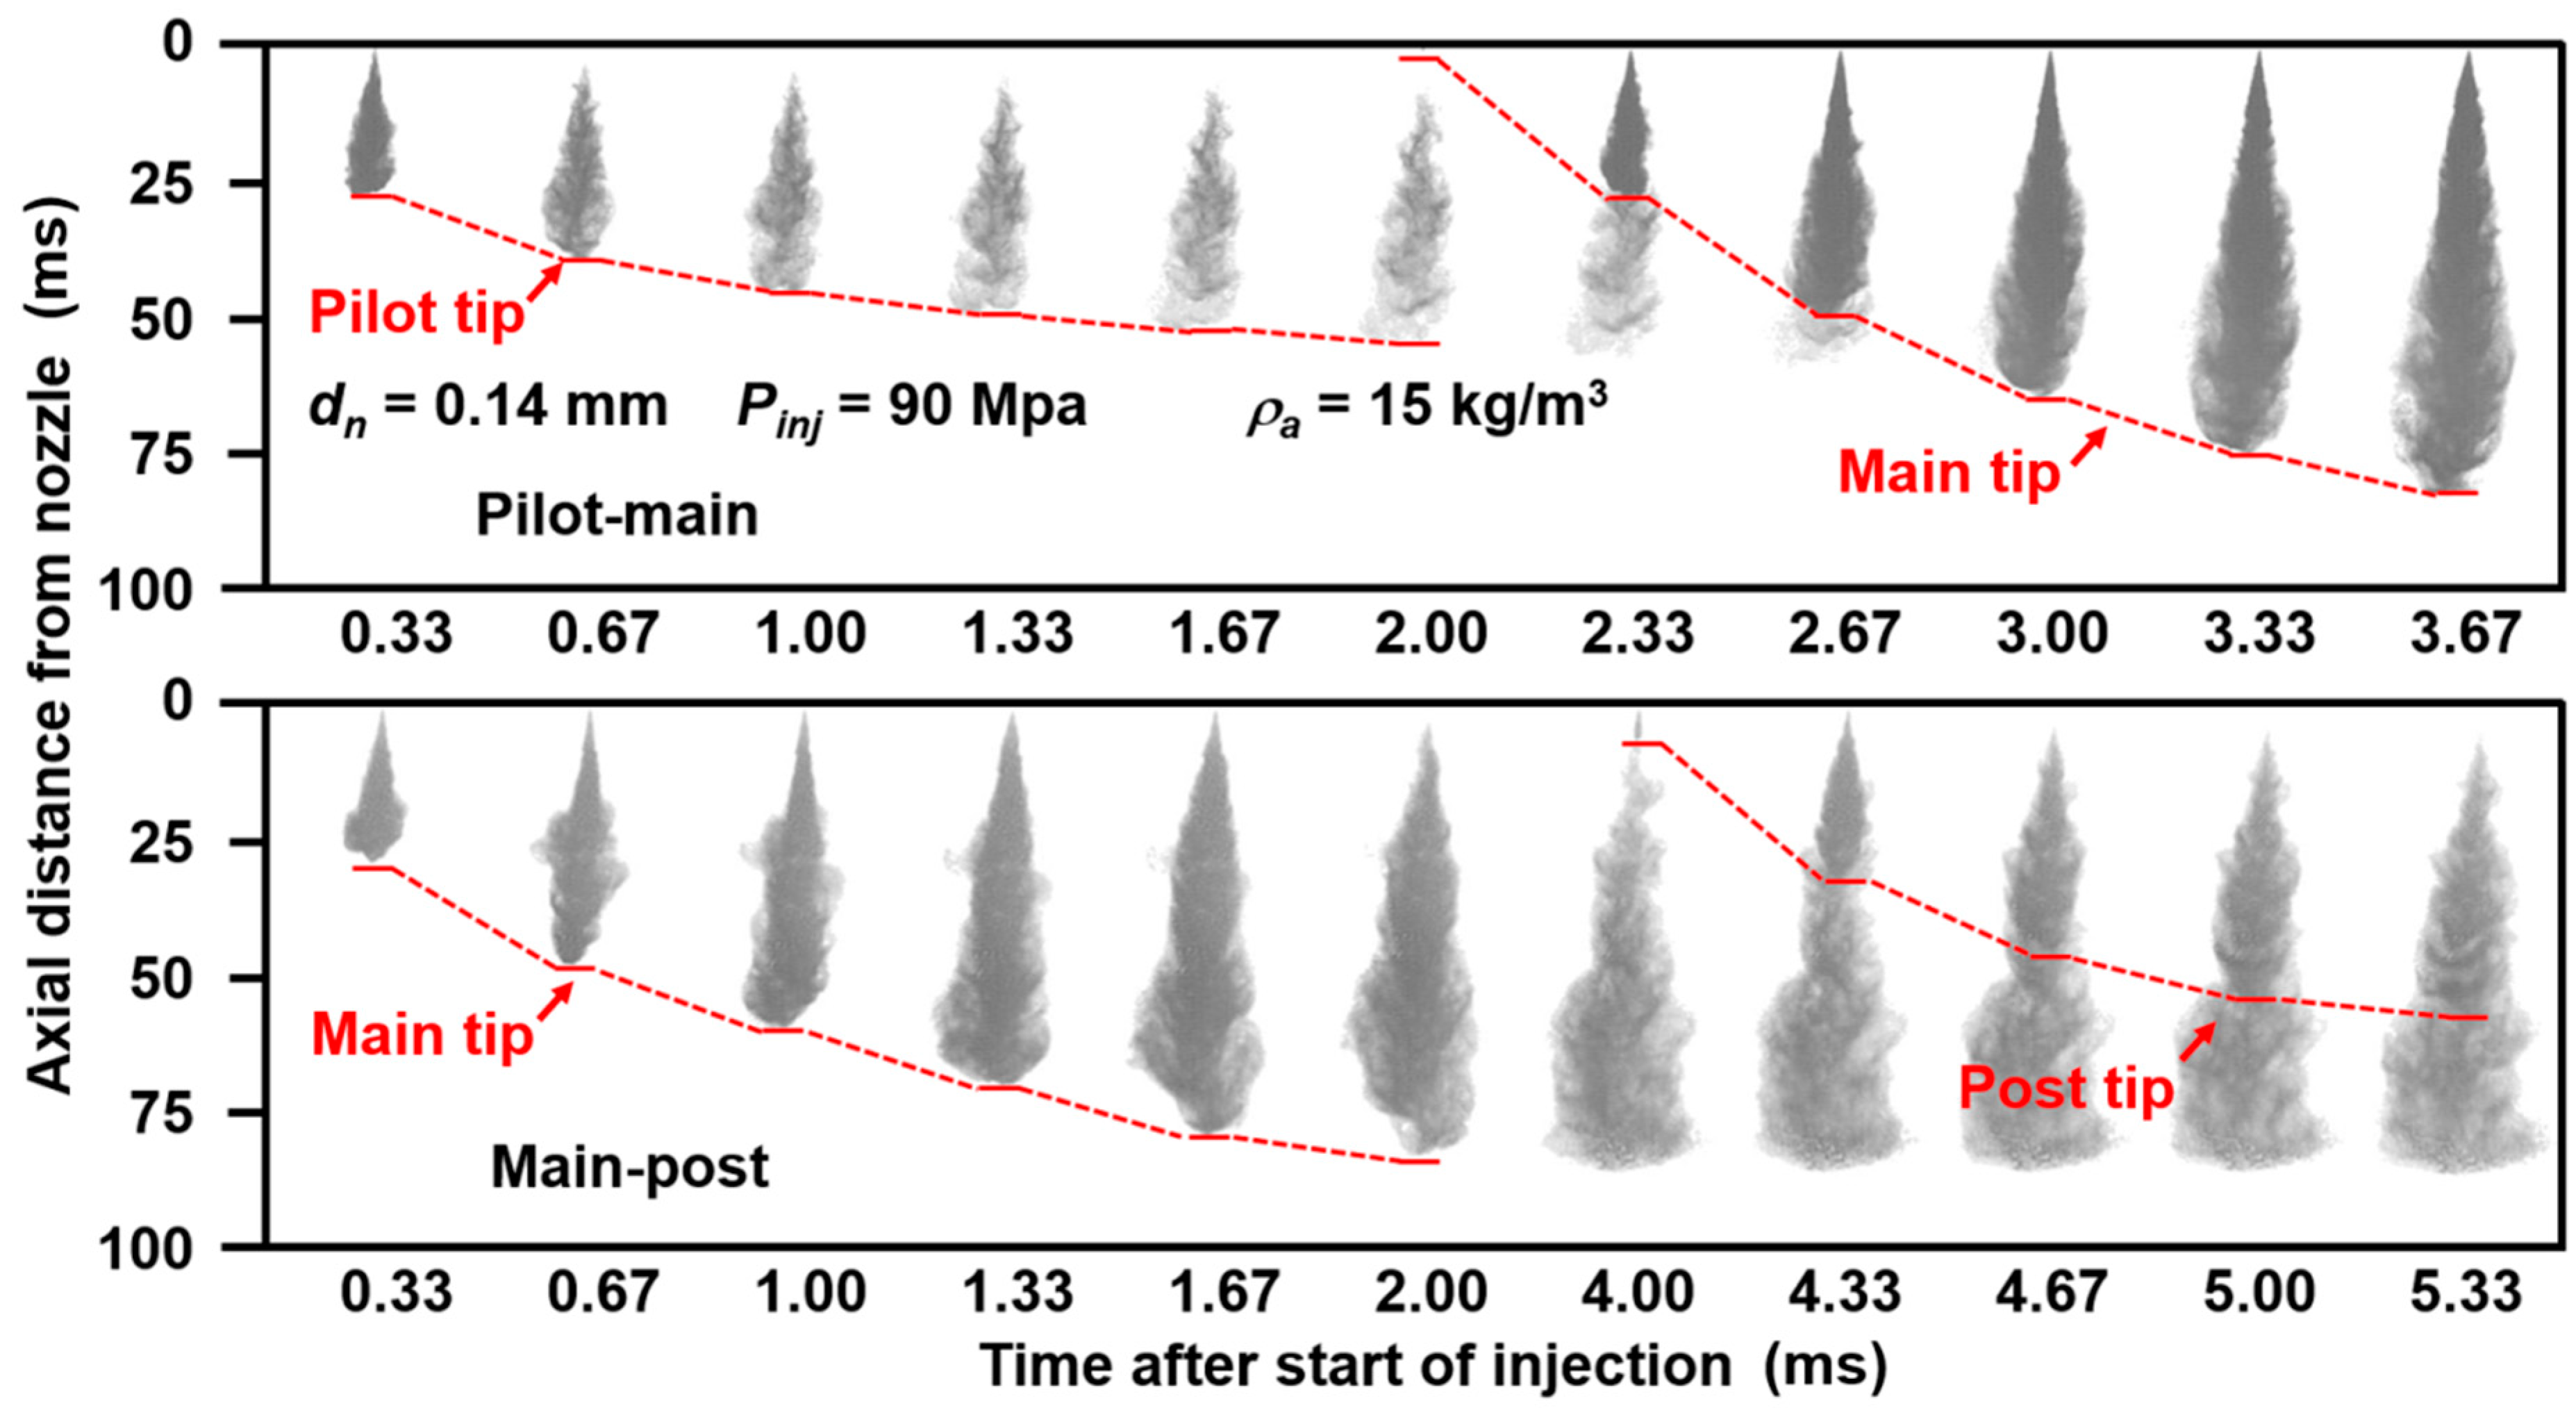
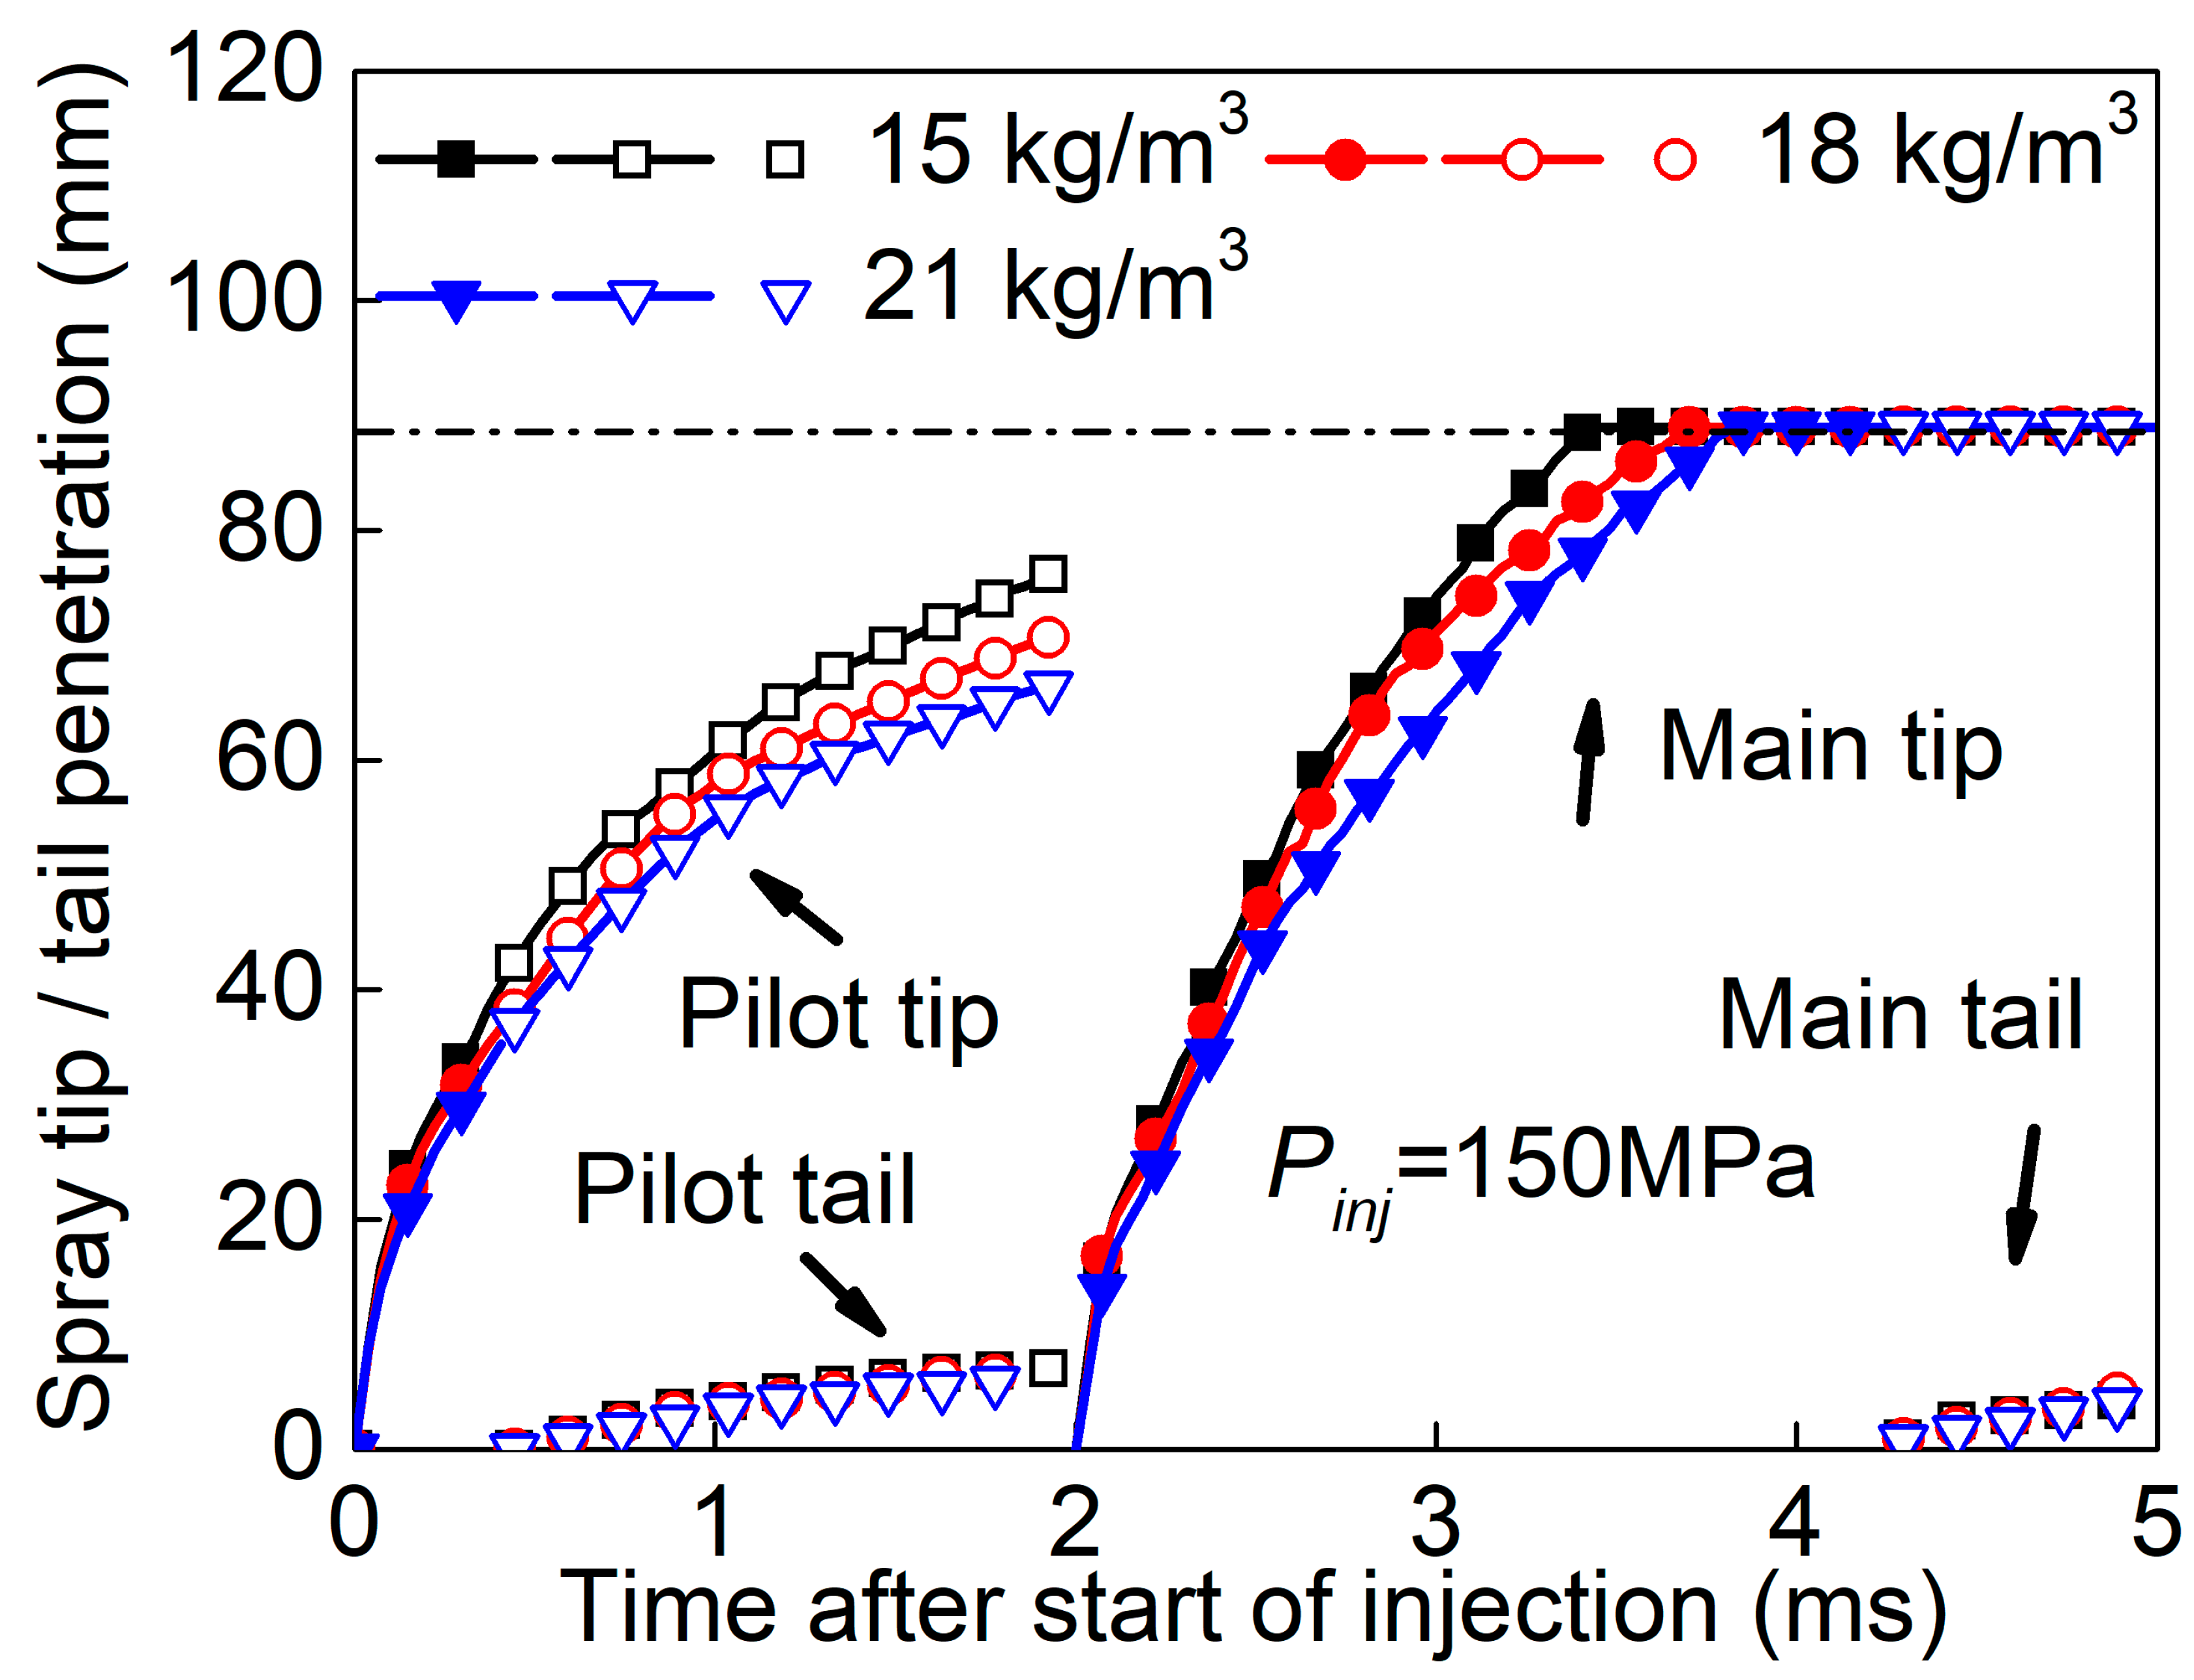
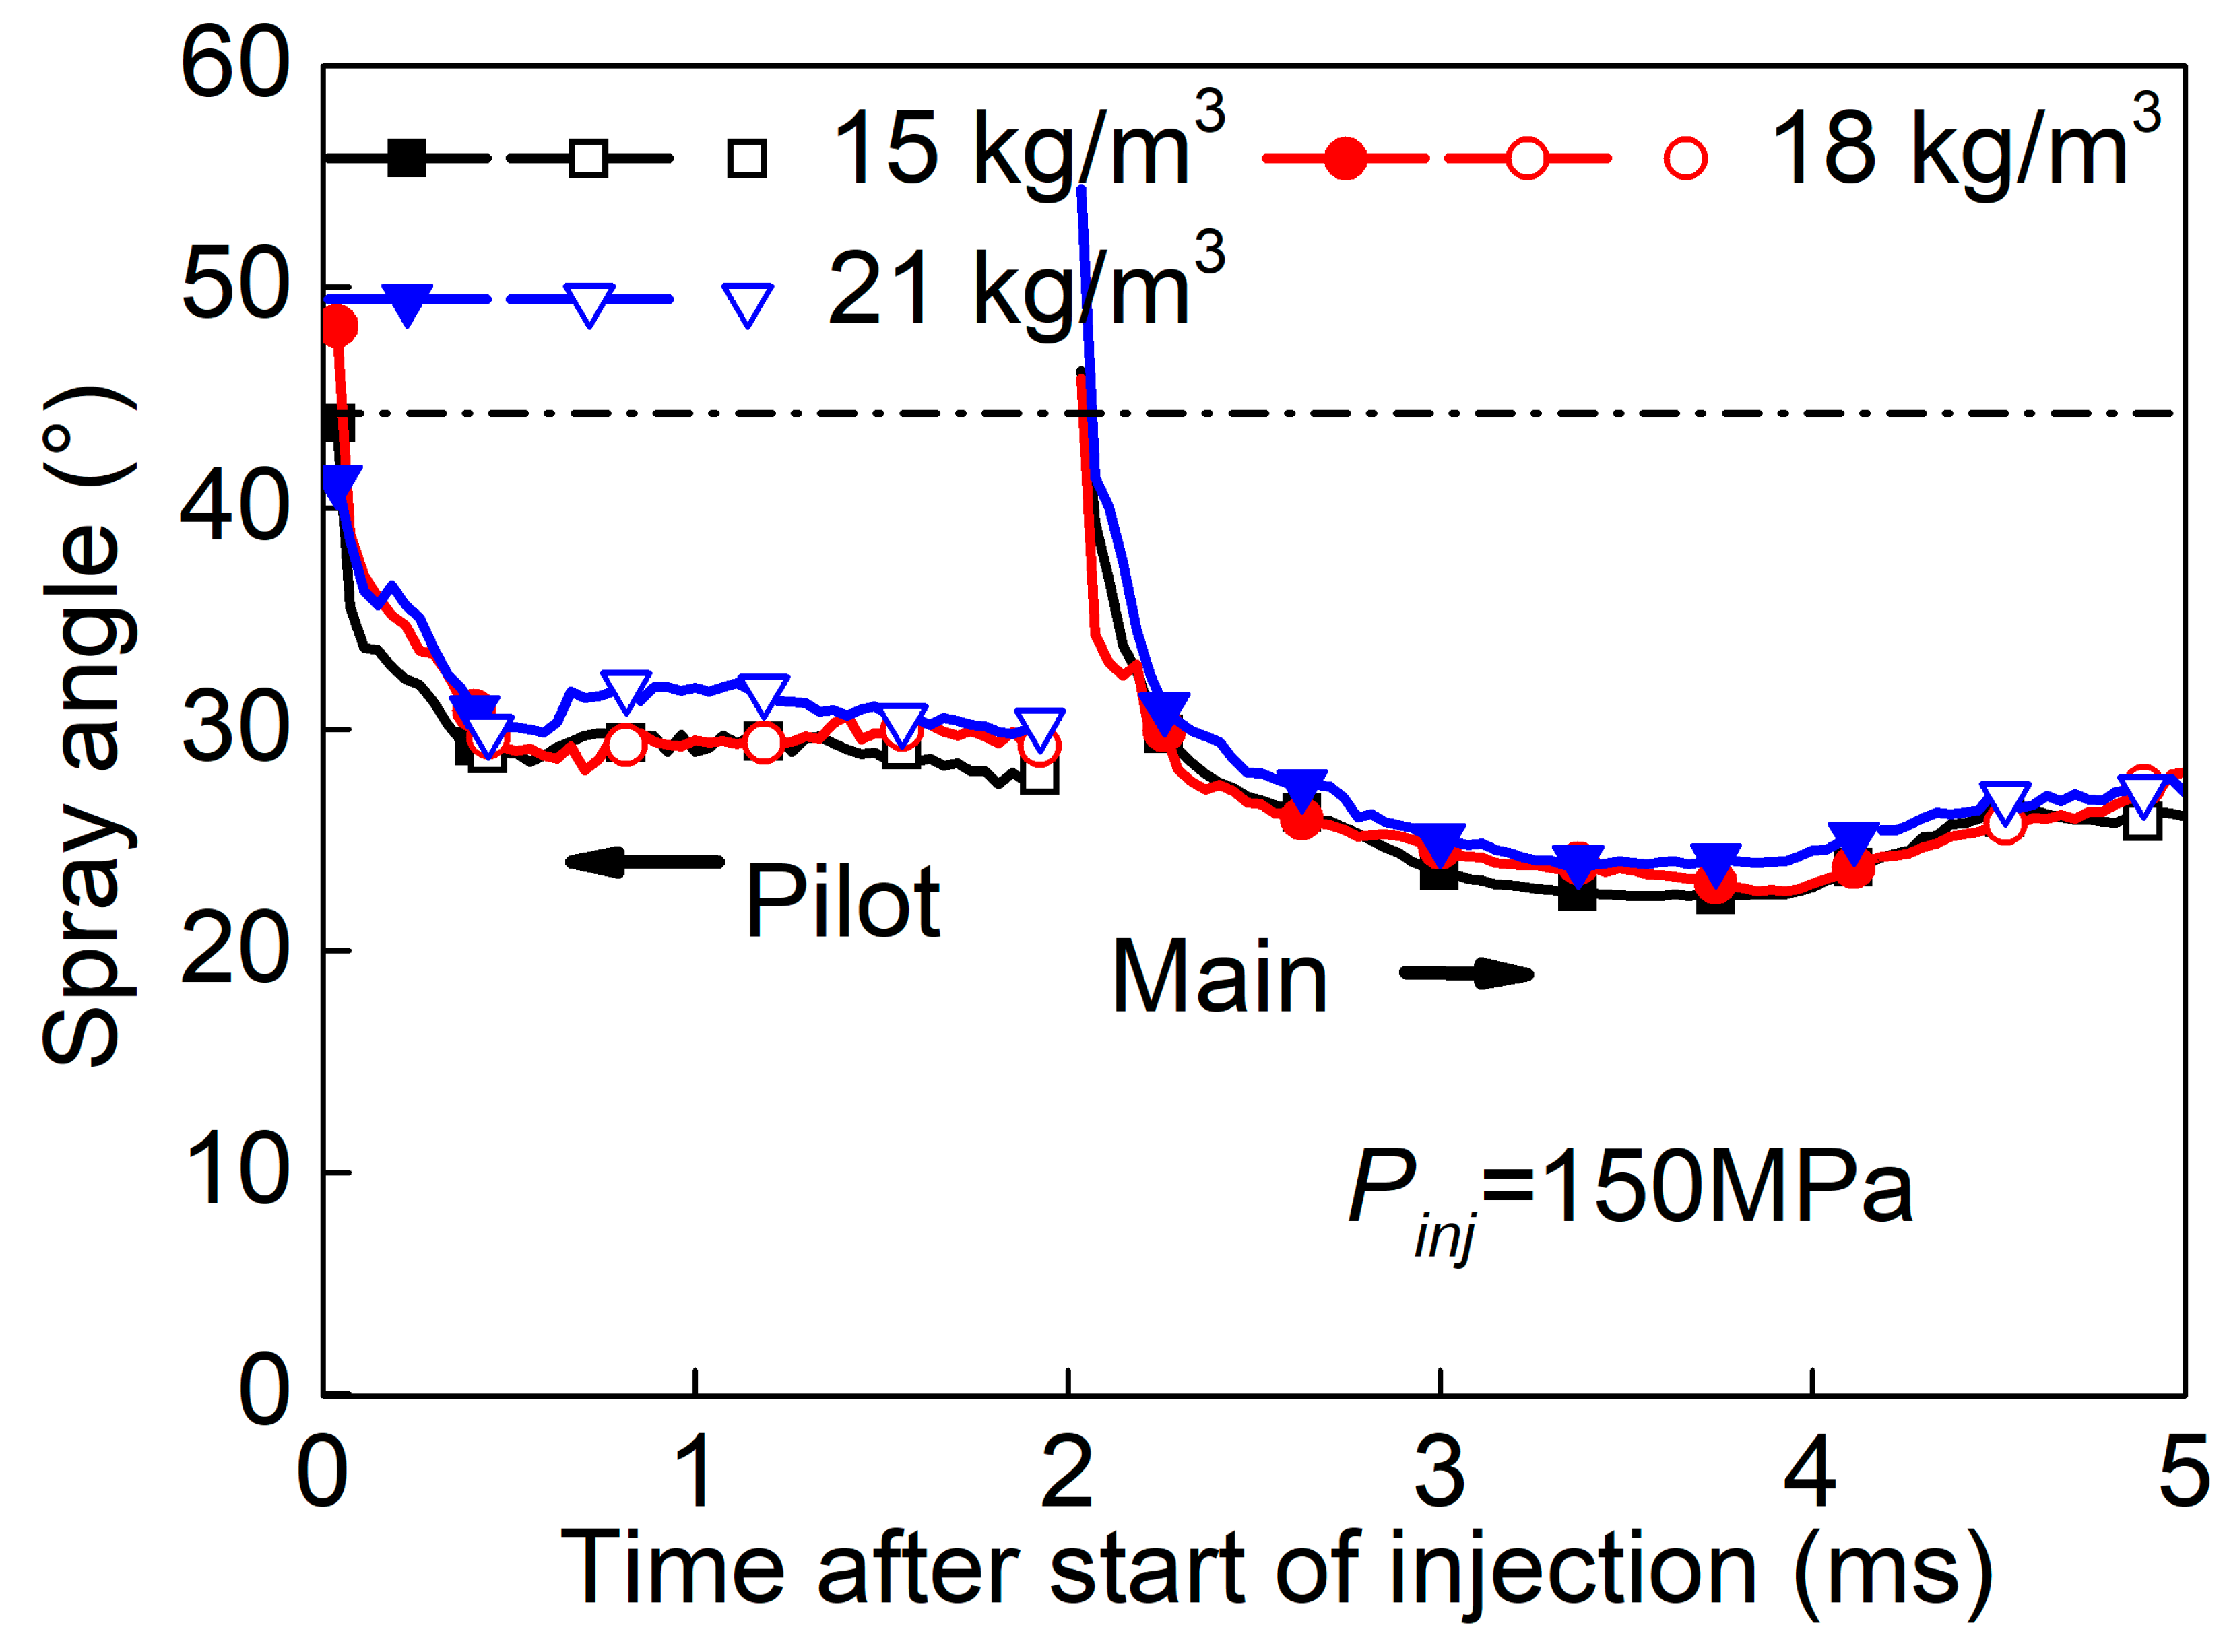
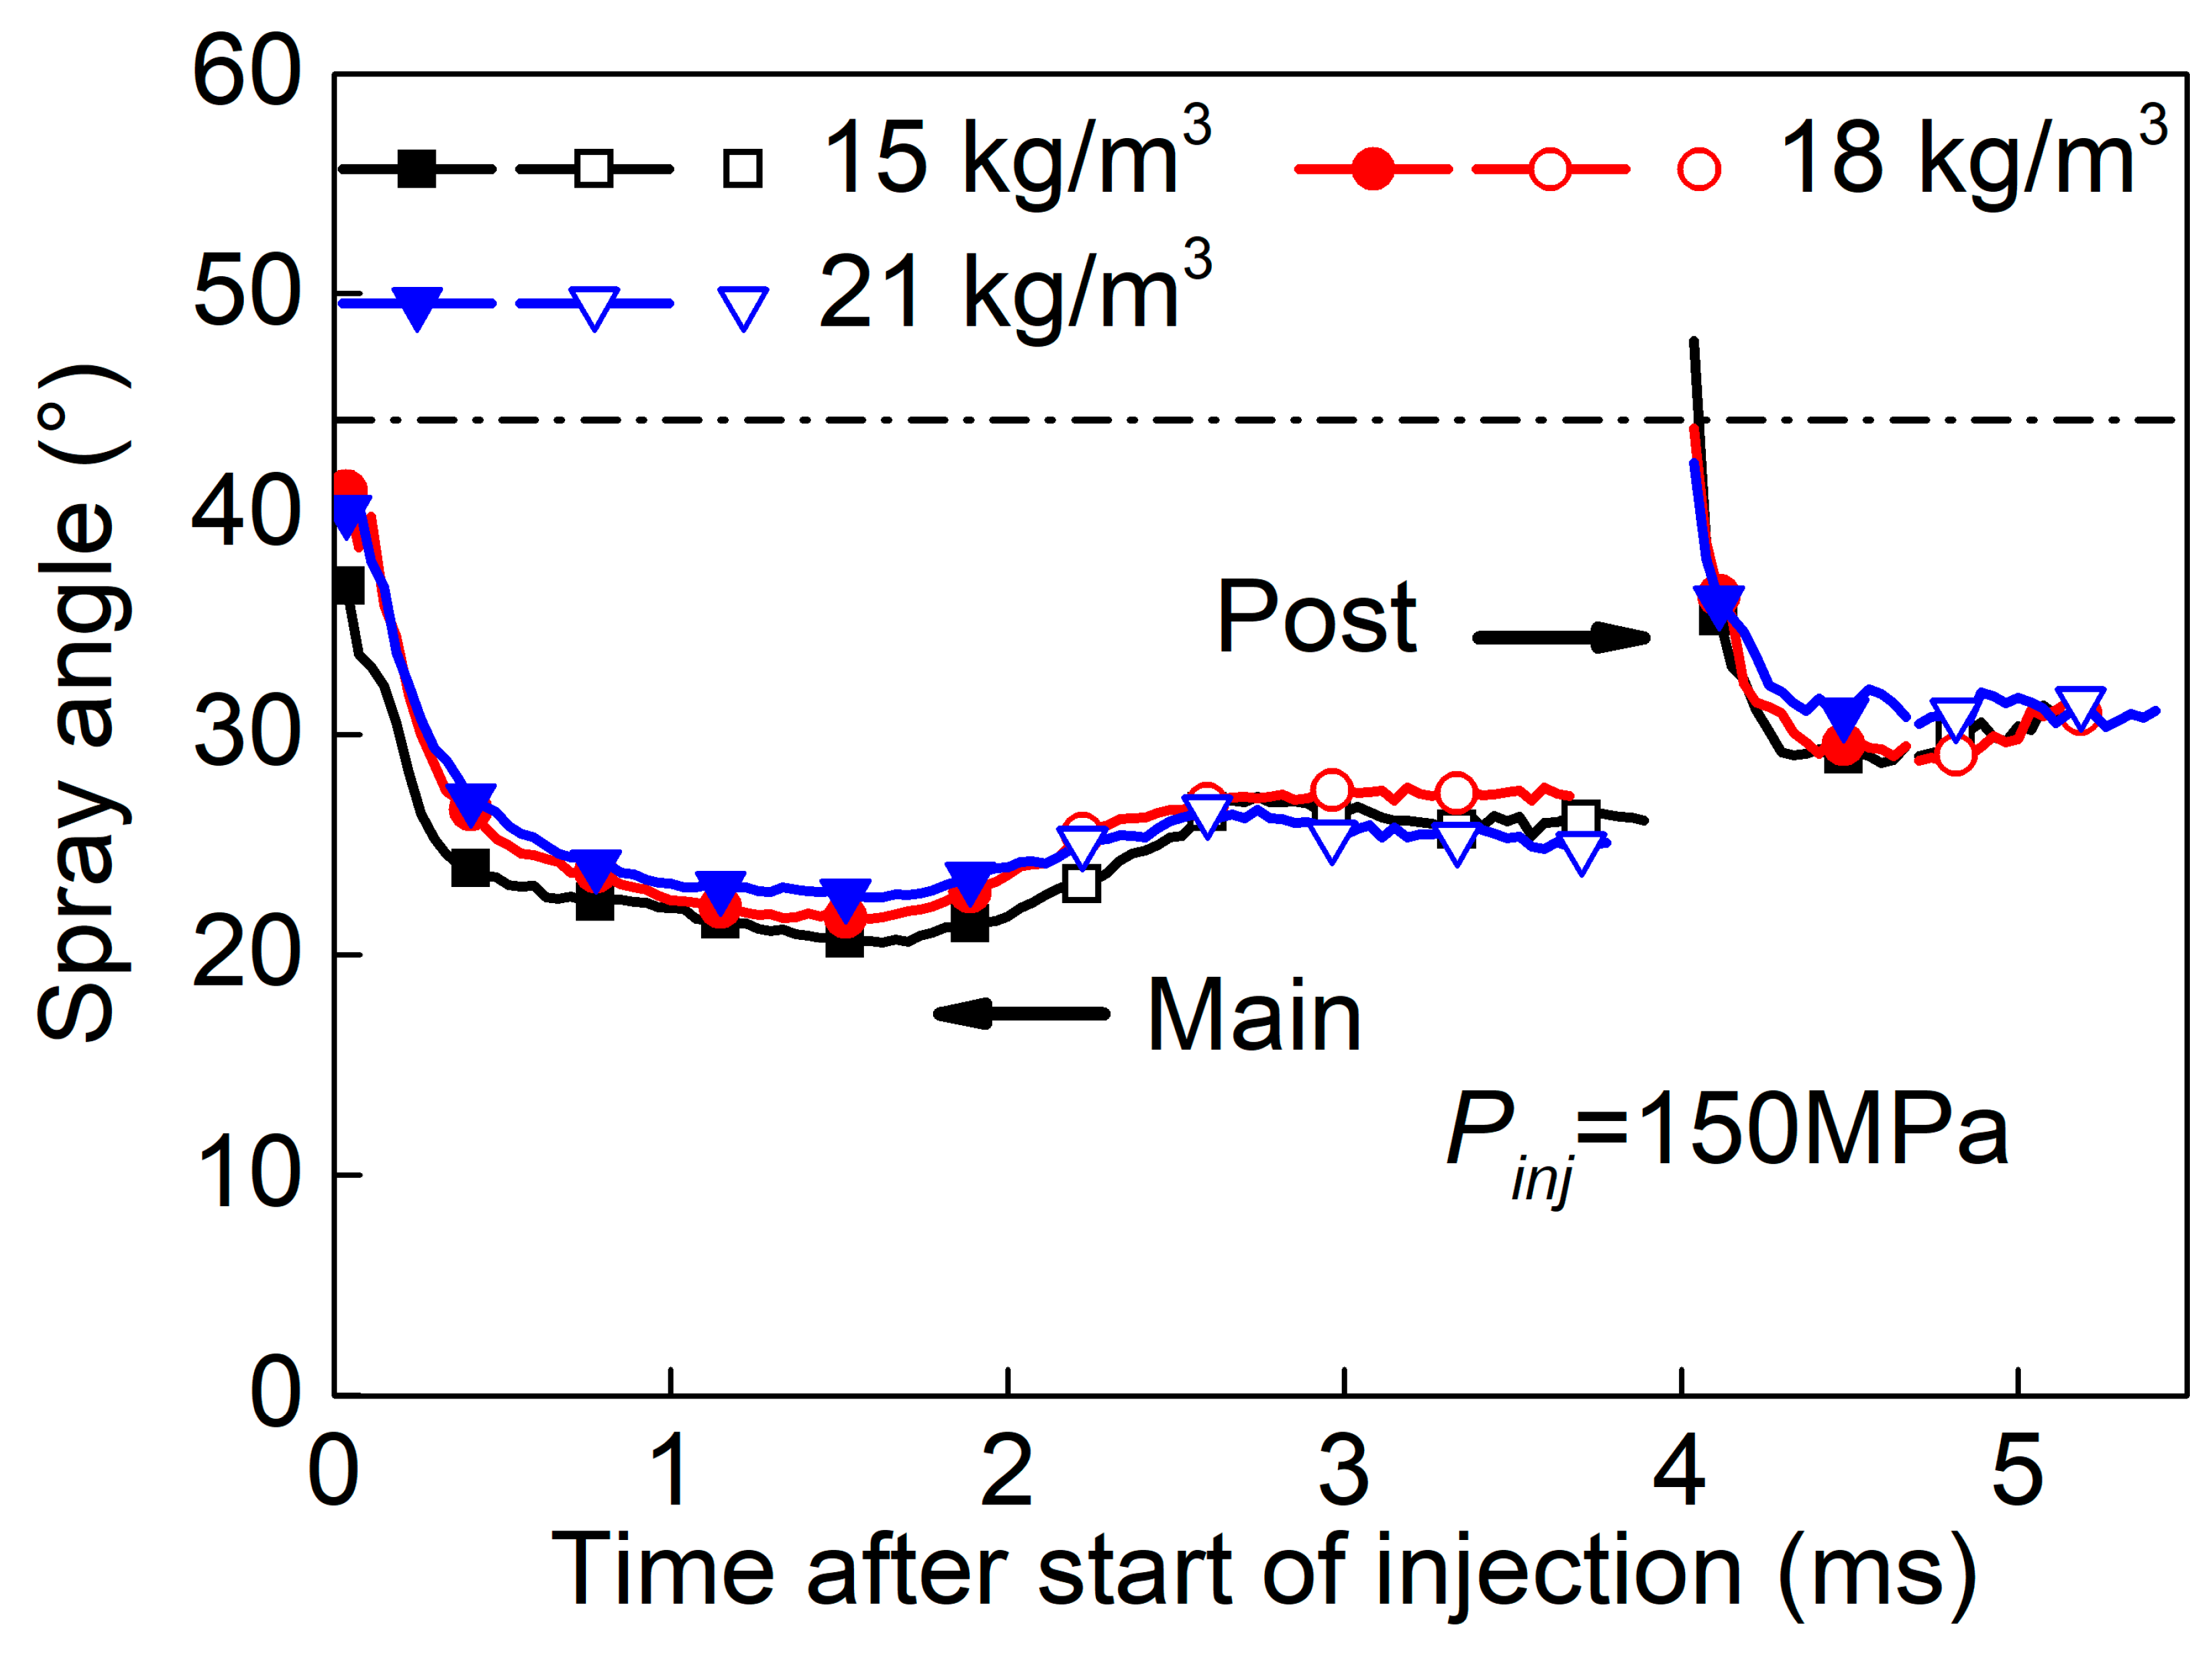
3.2. Split-Injected Spray
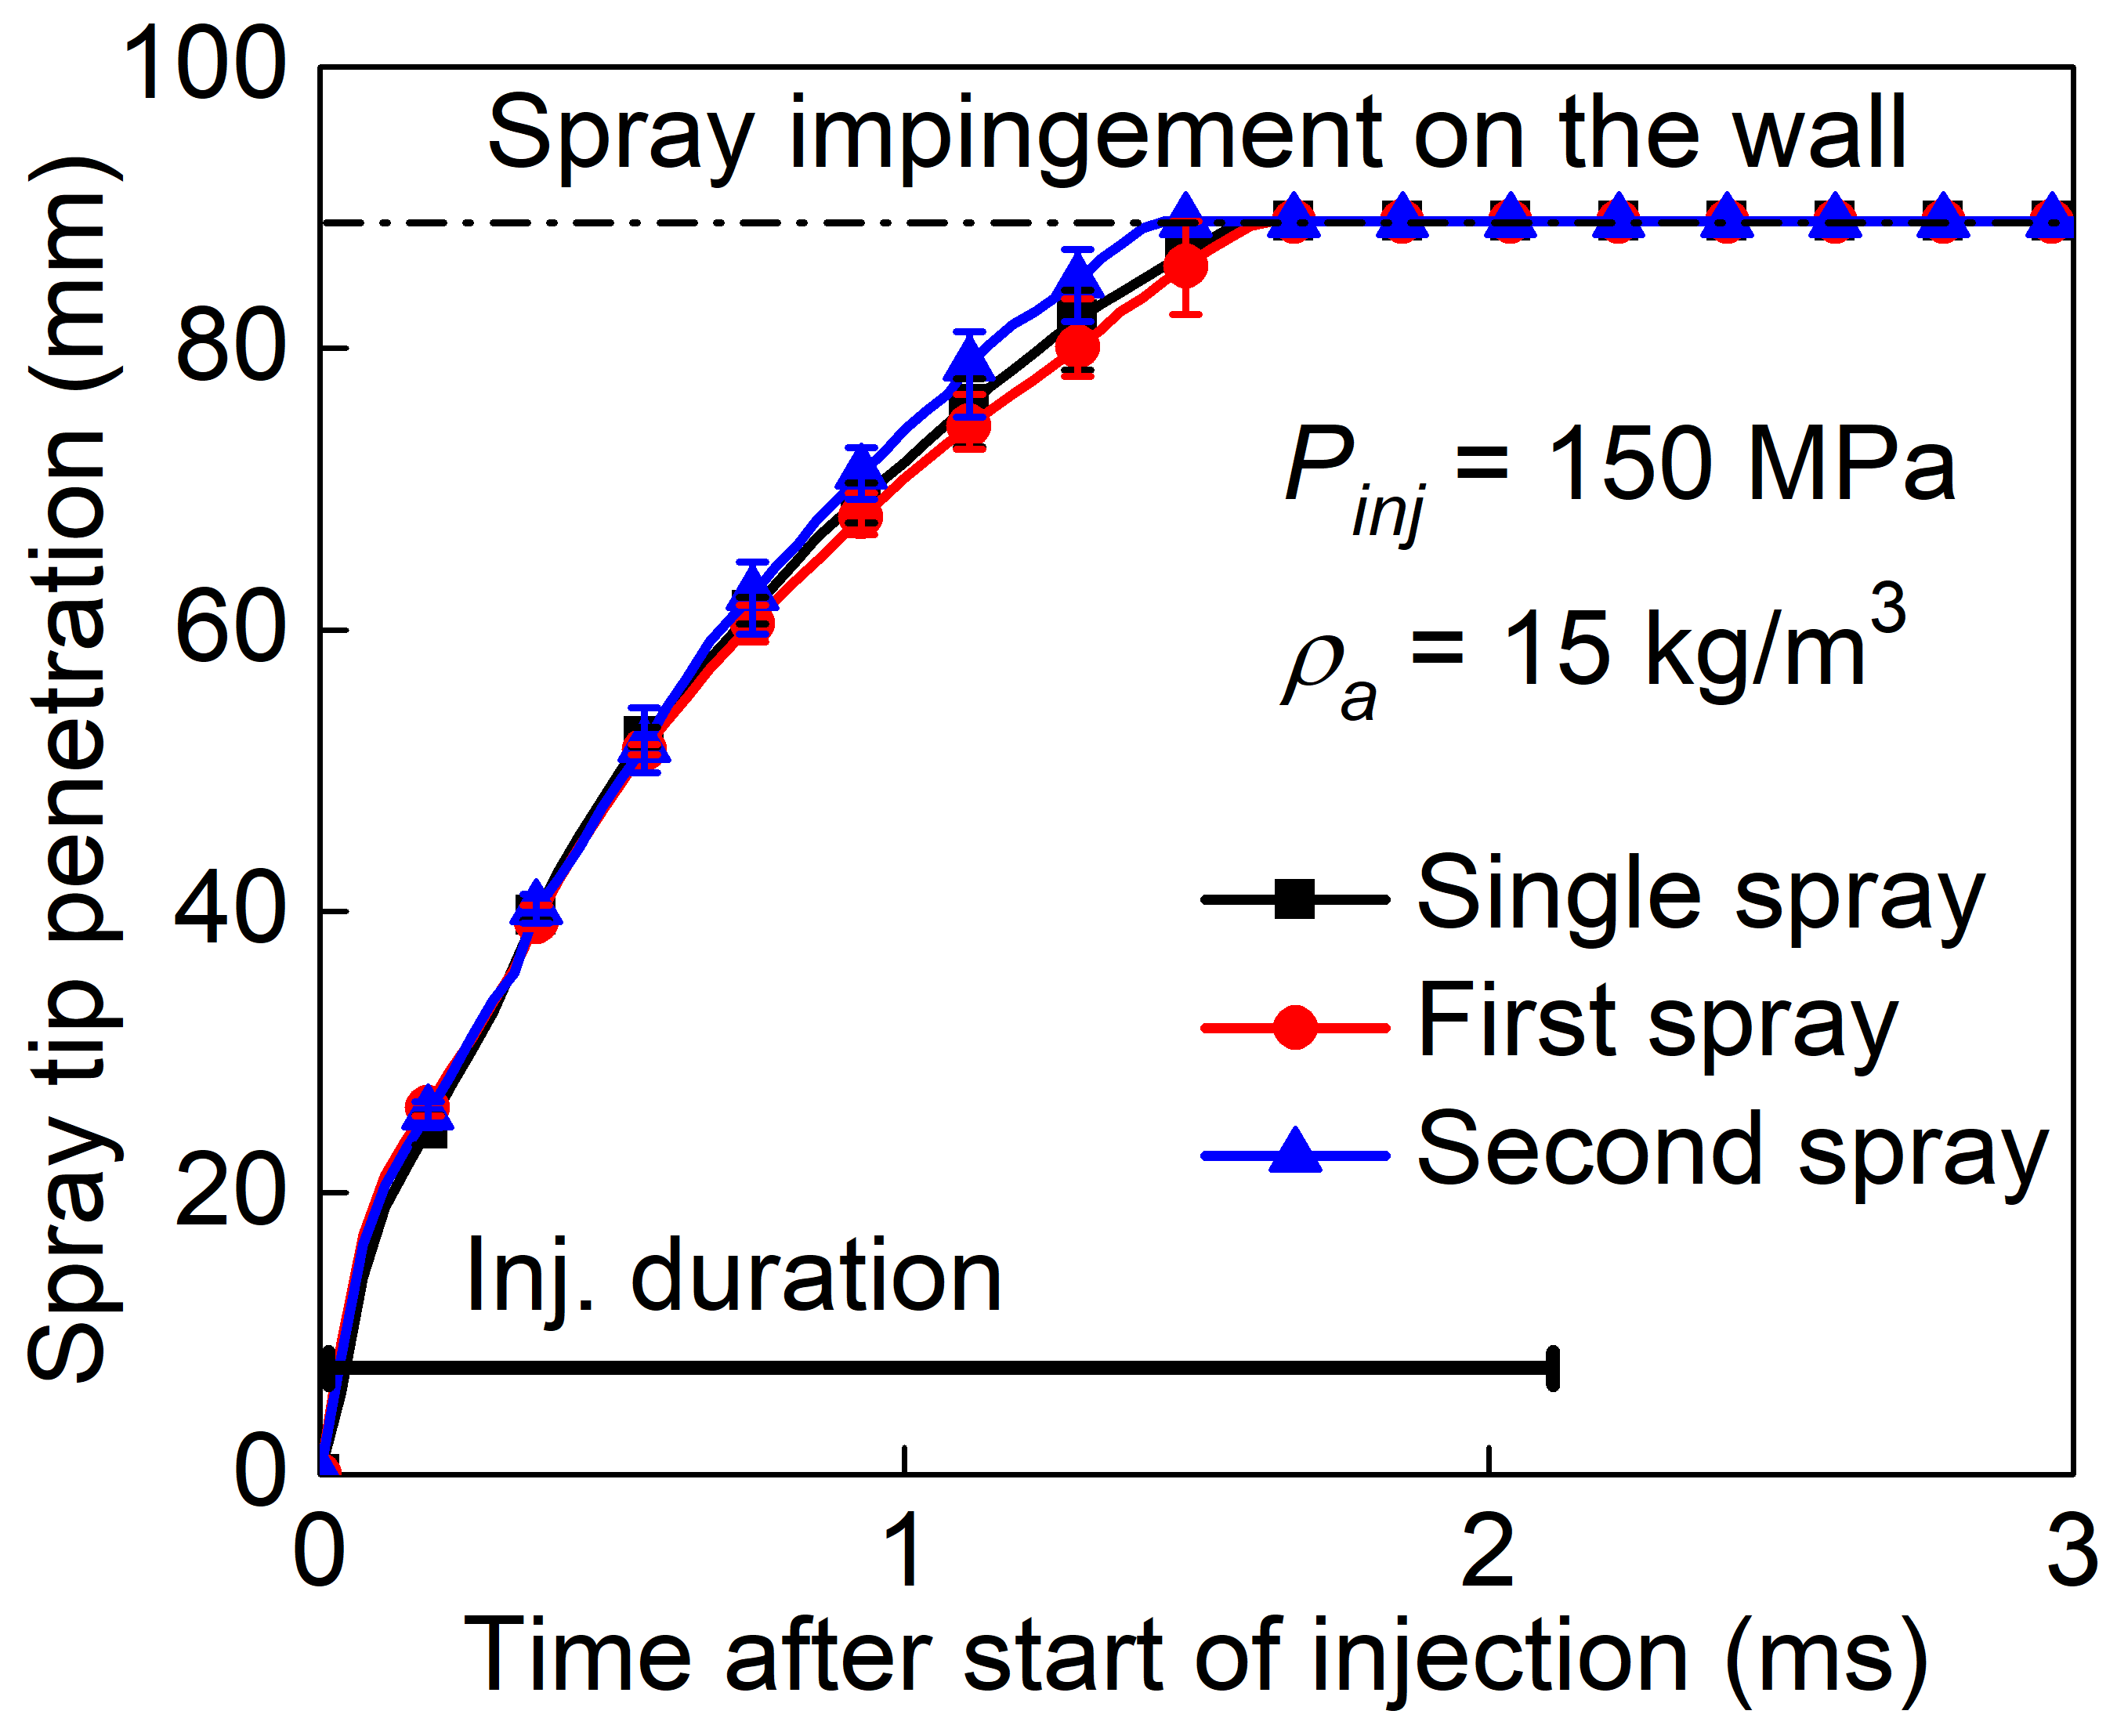
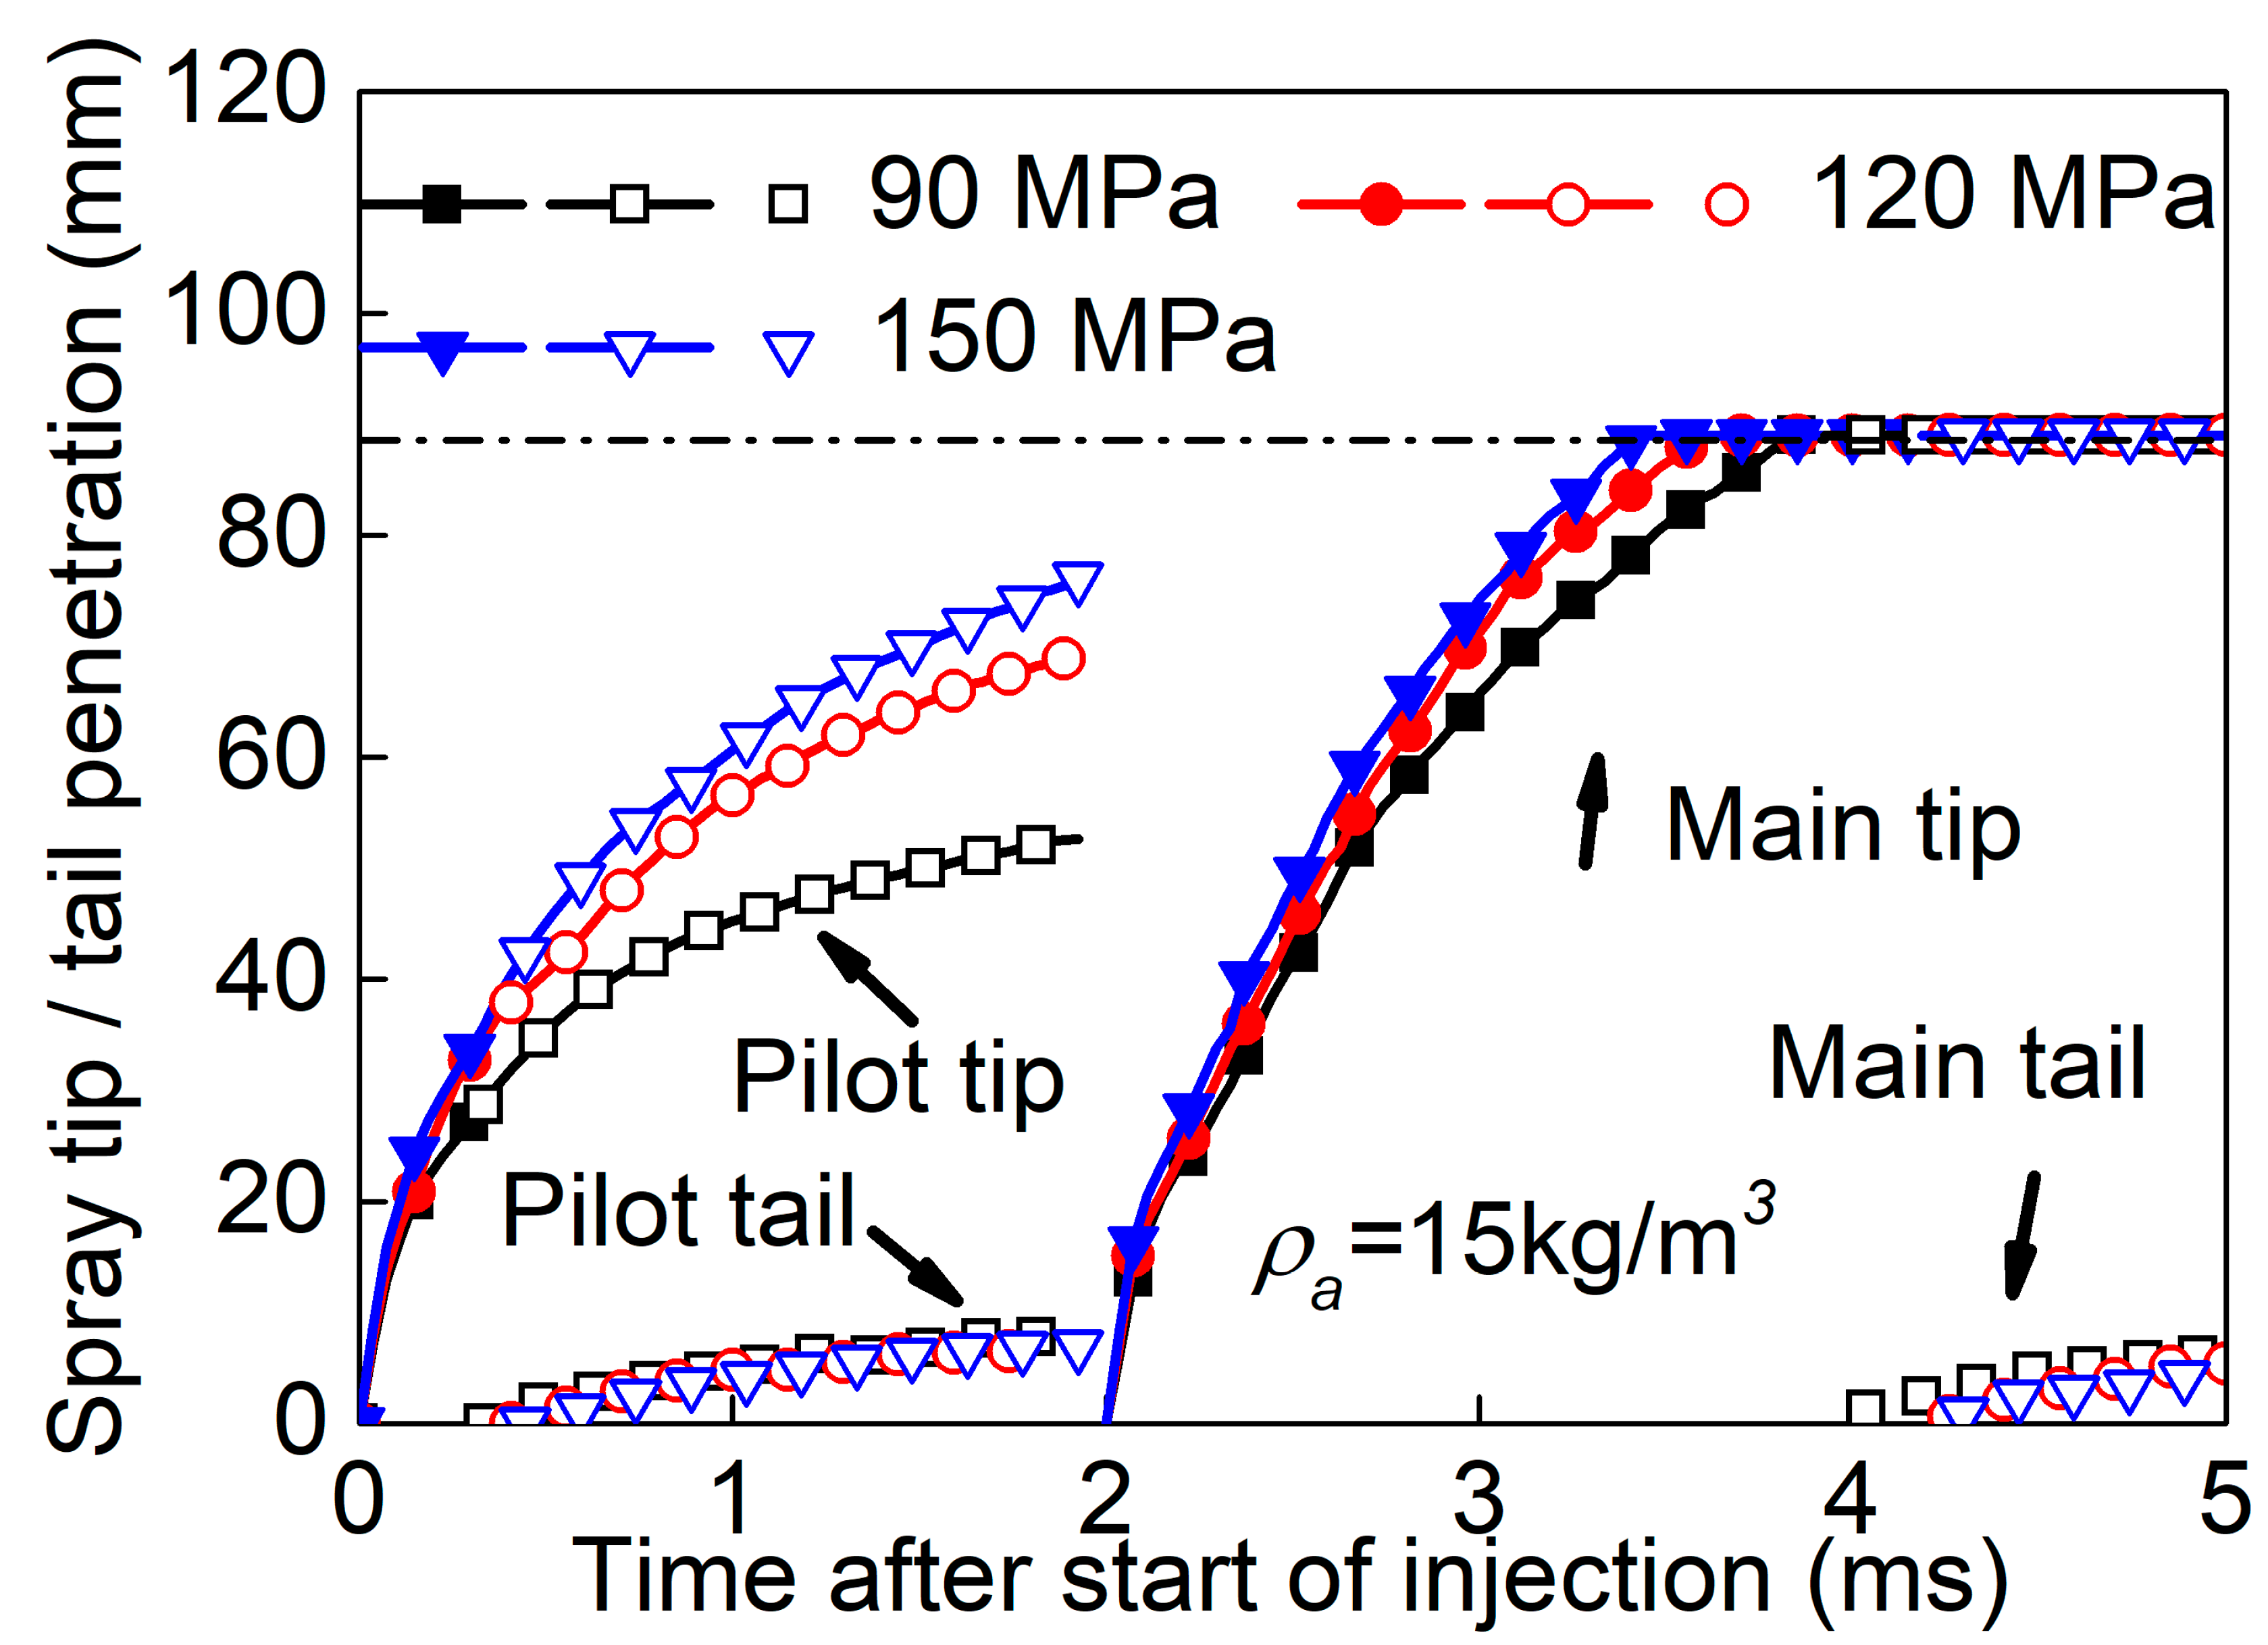
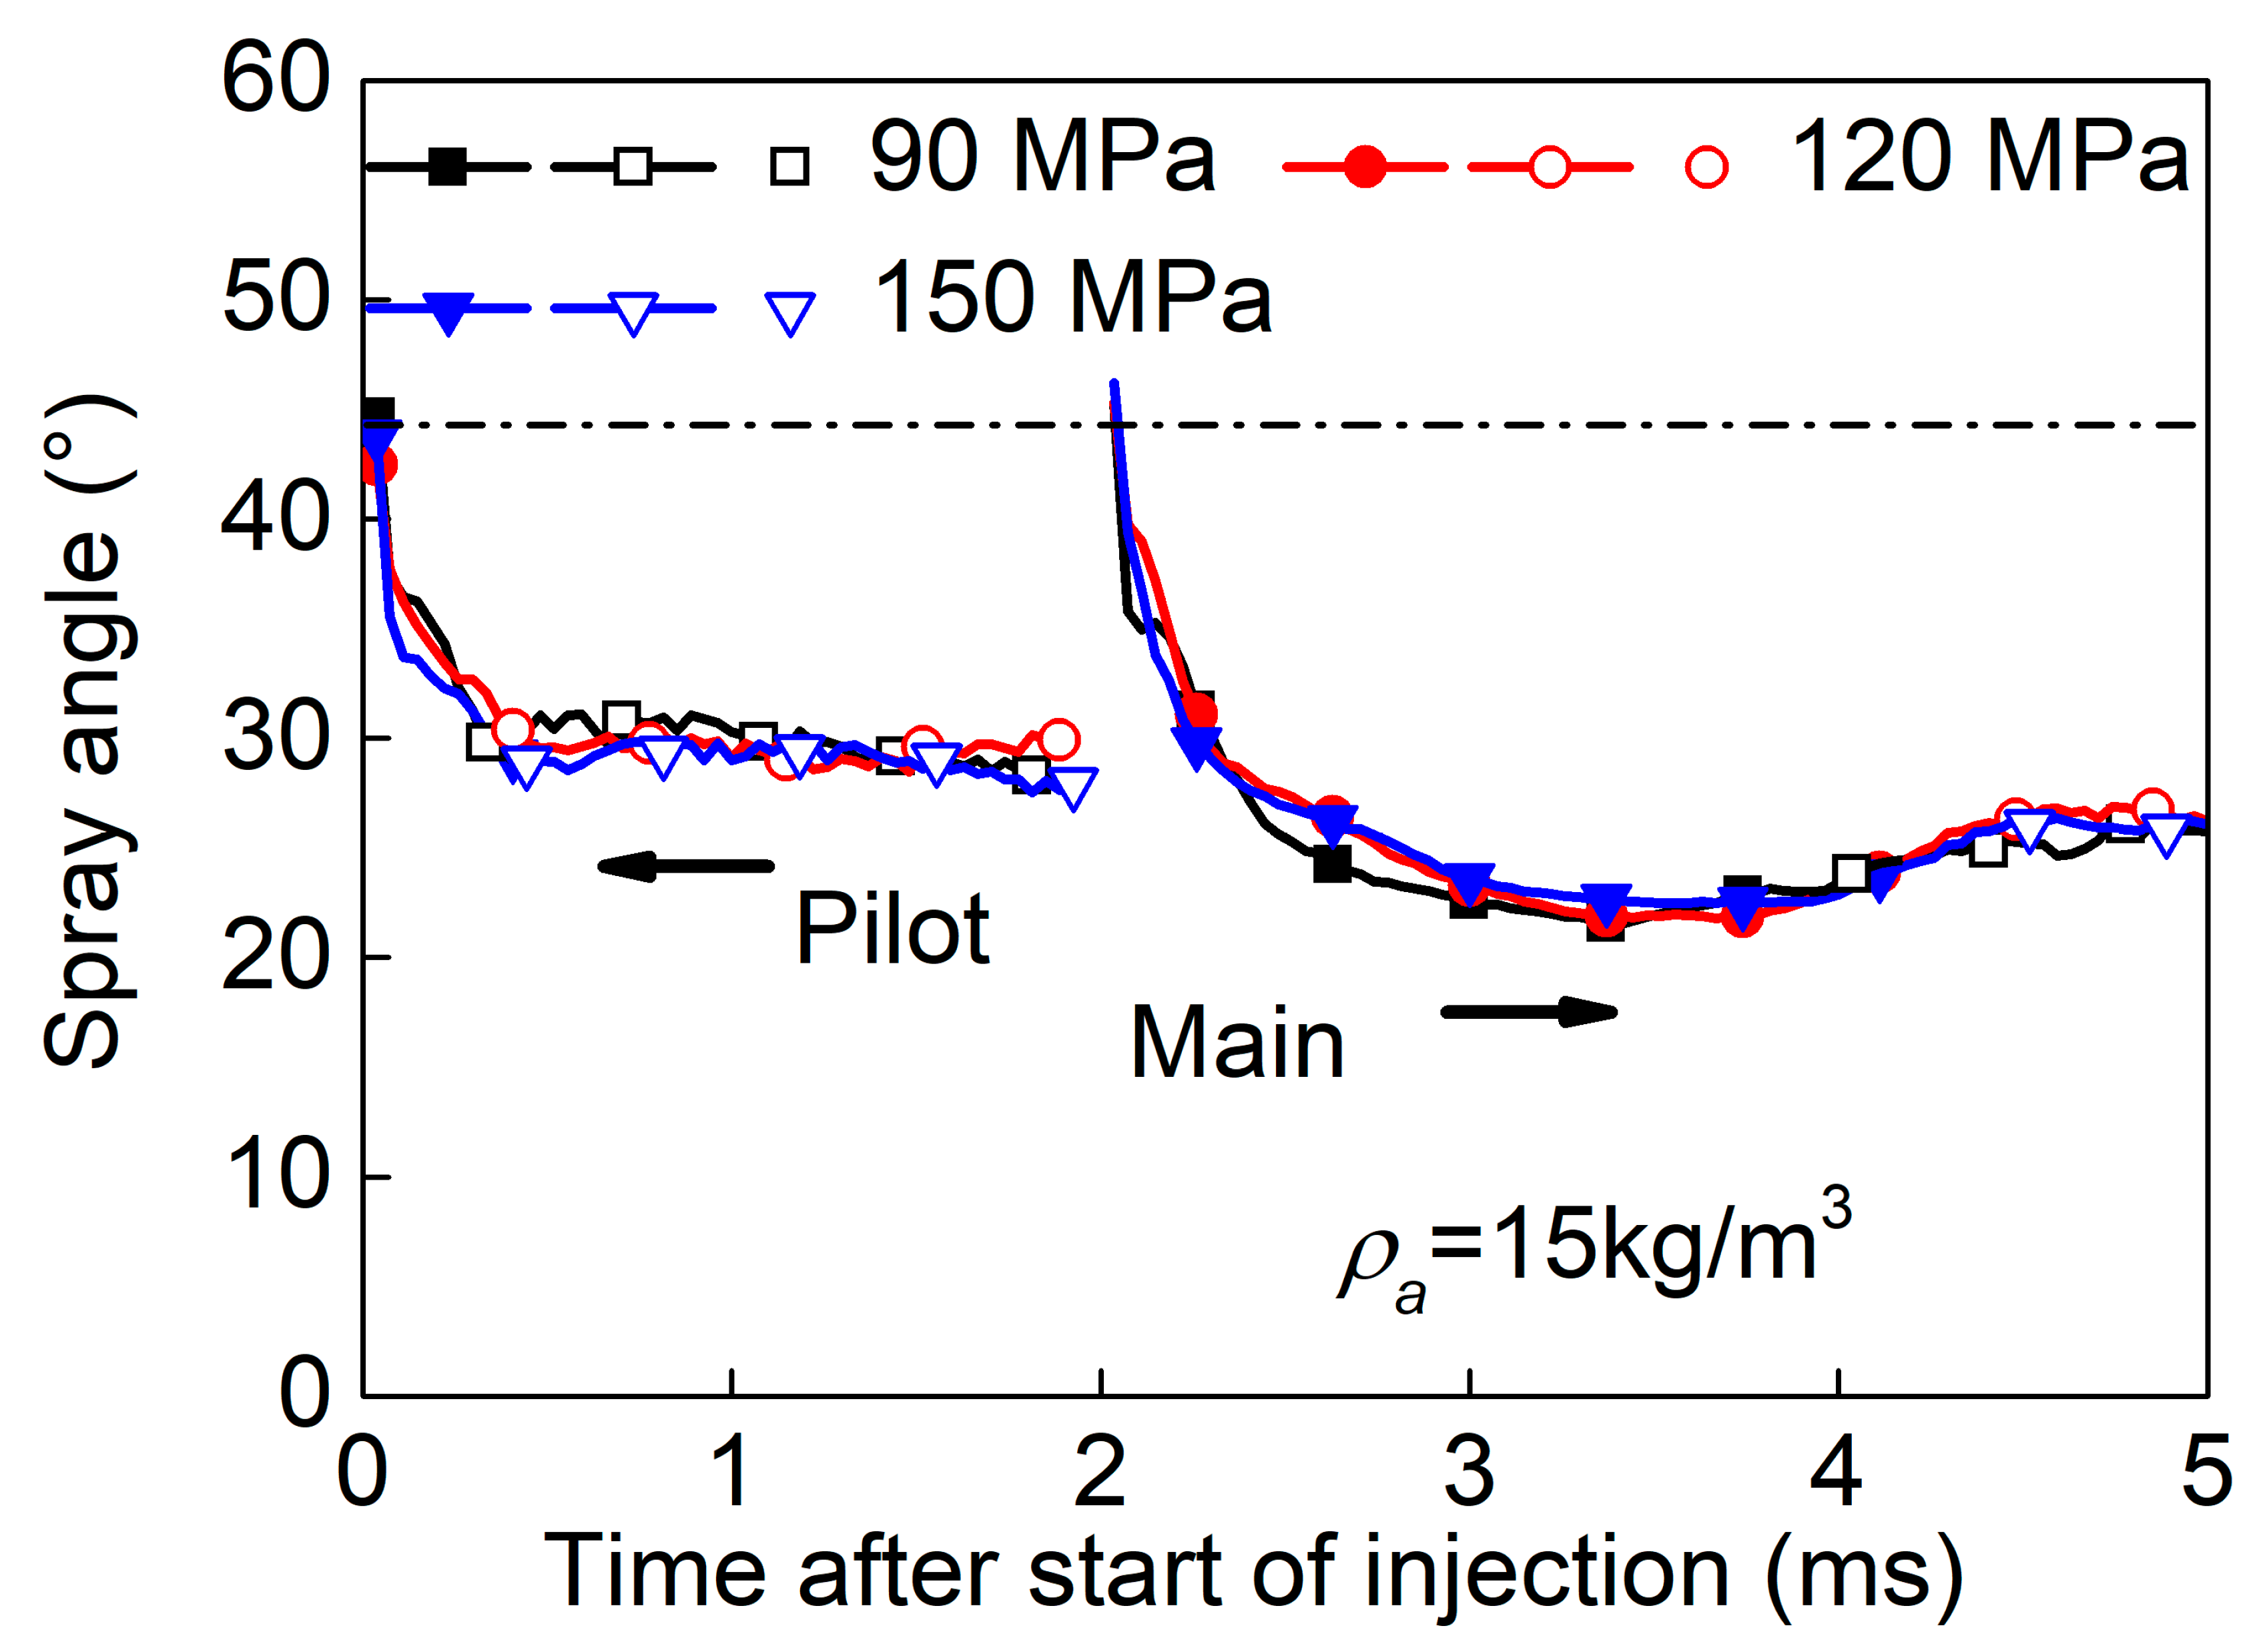
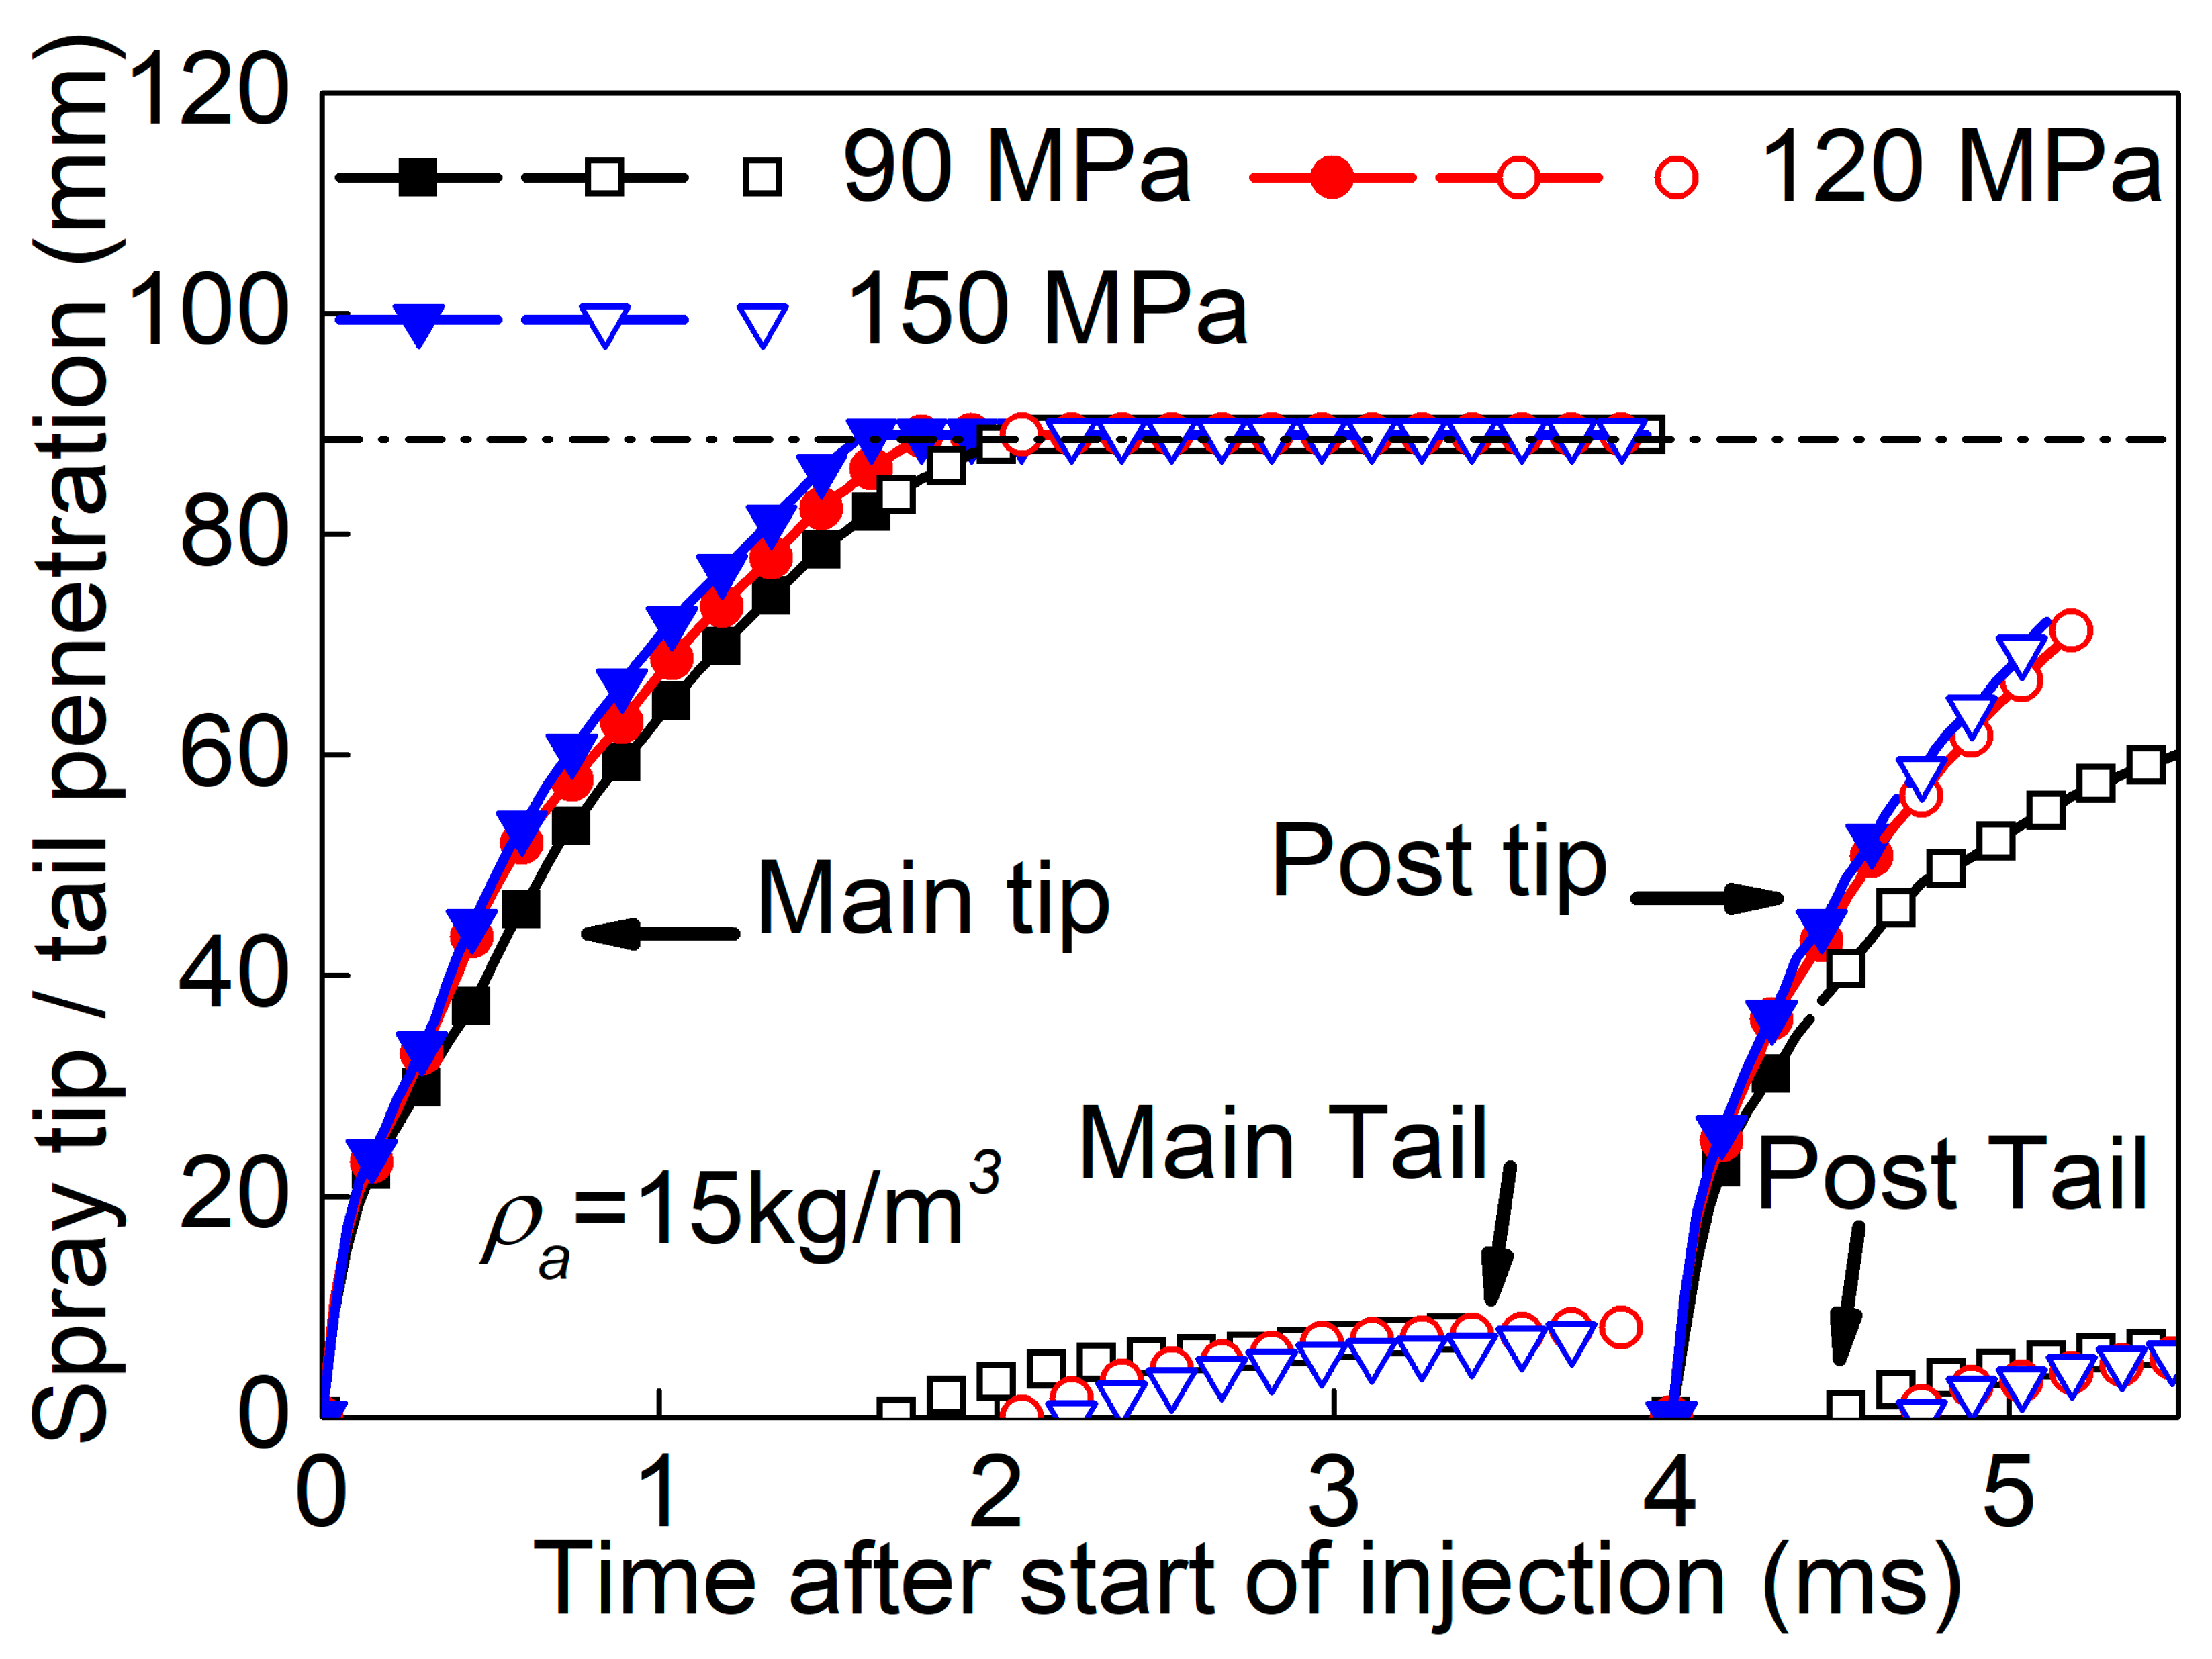
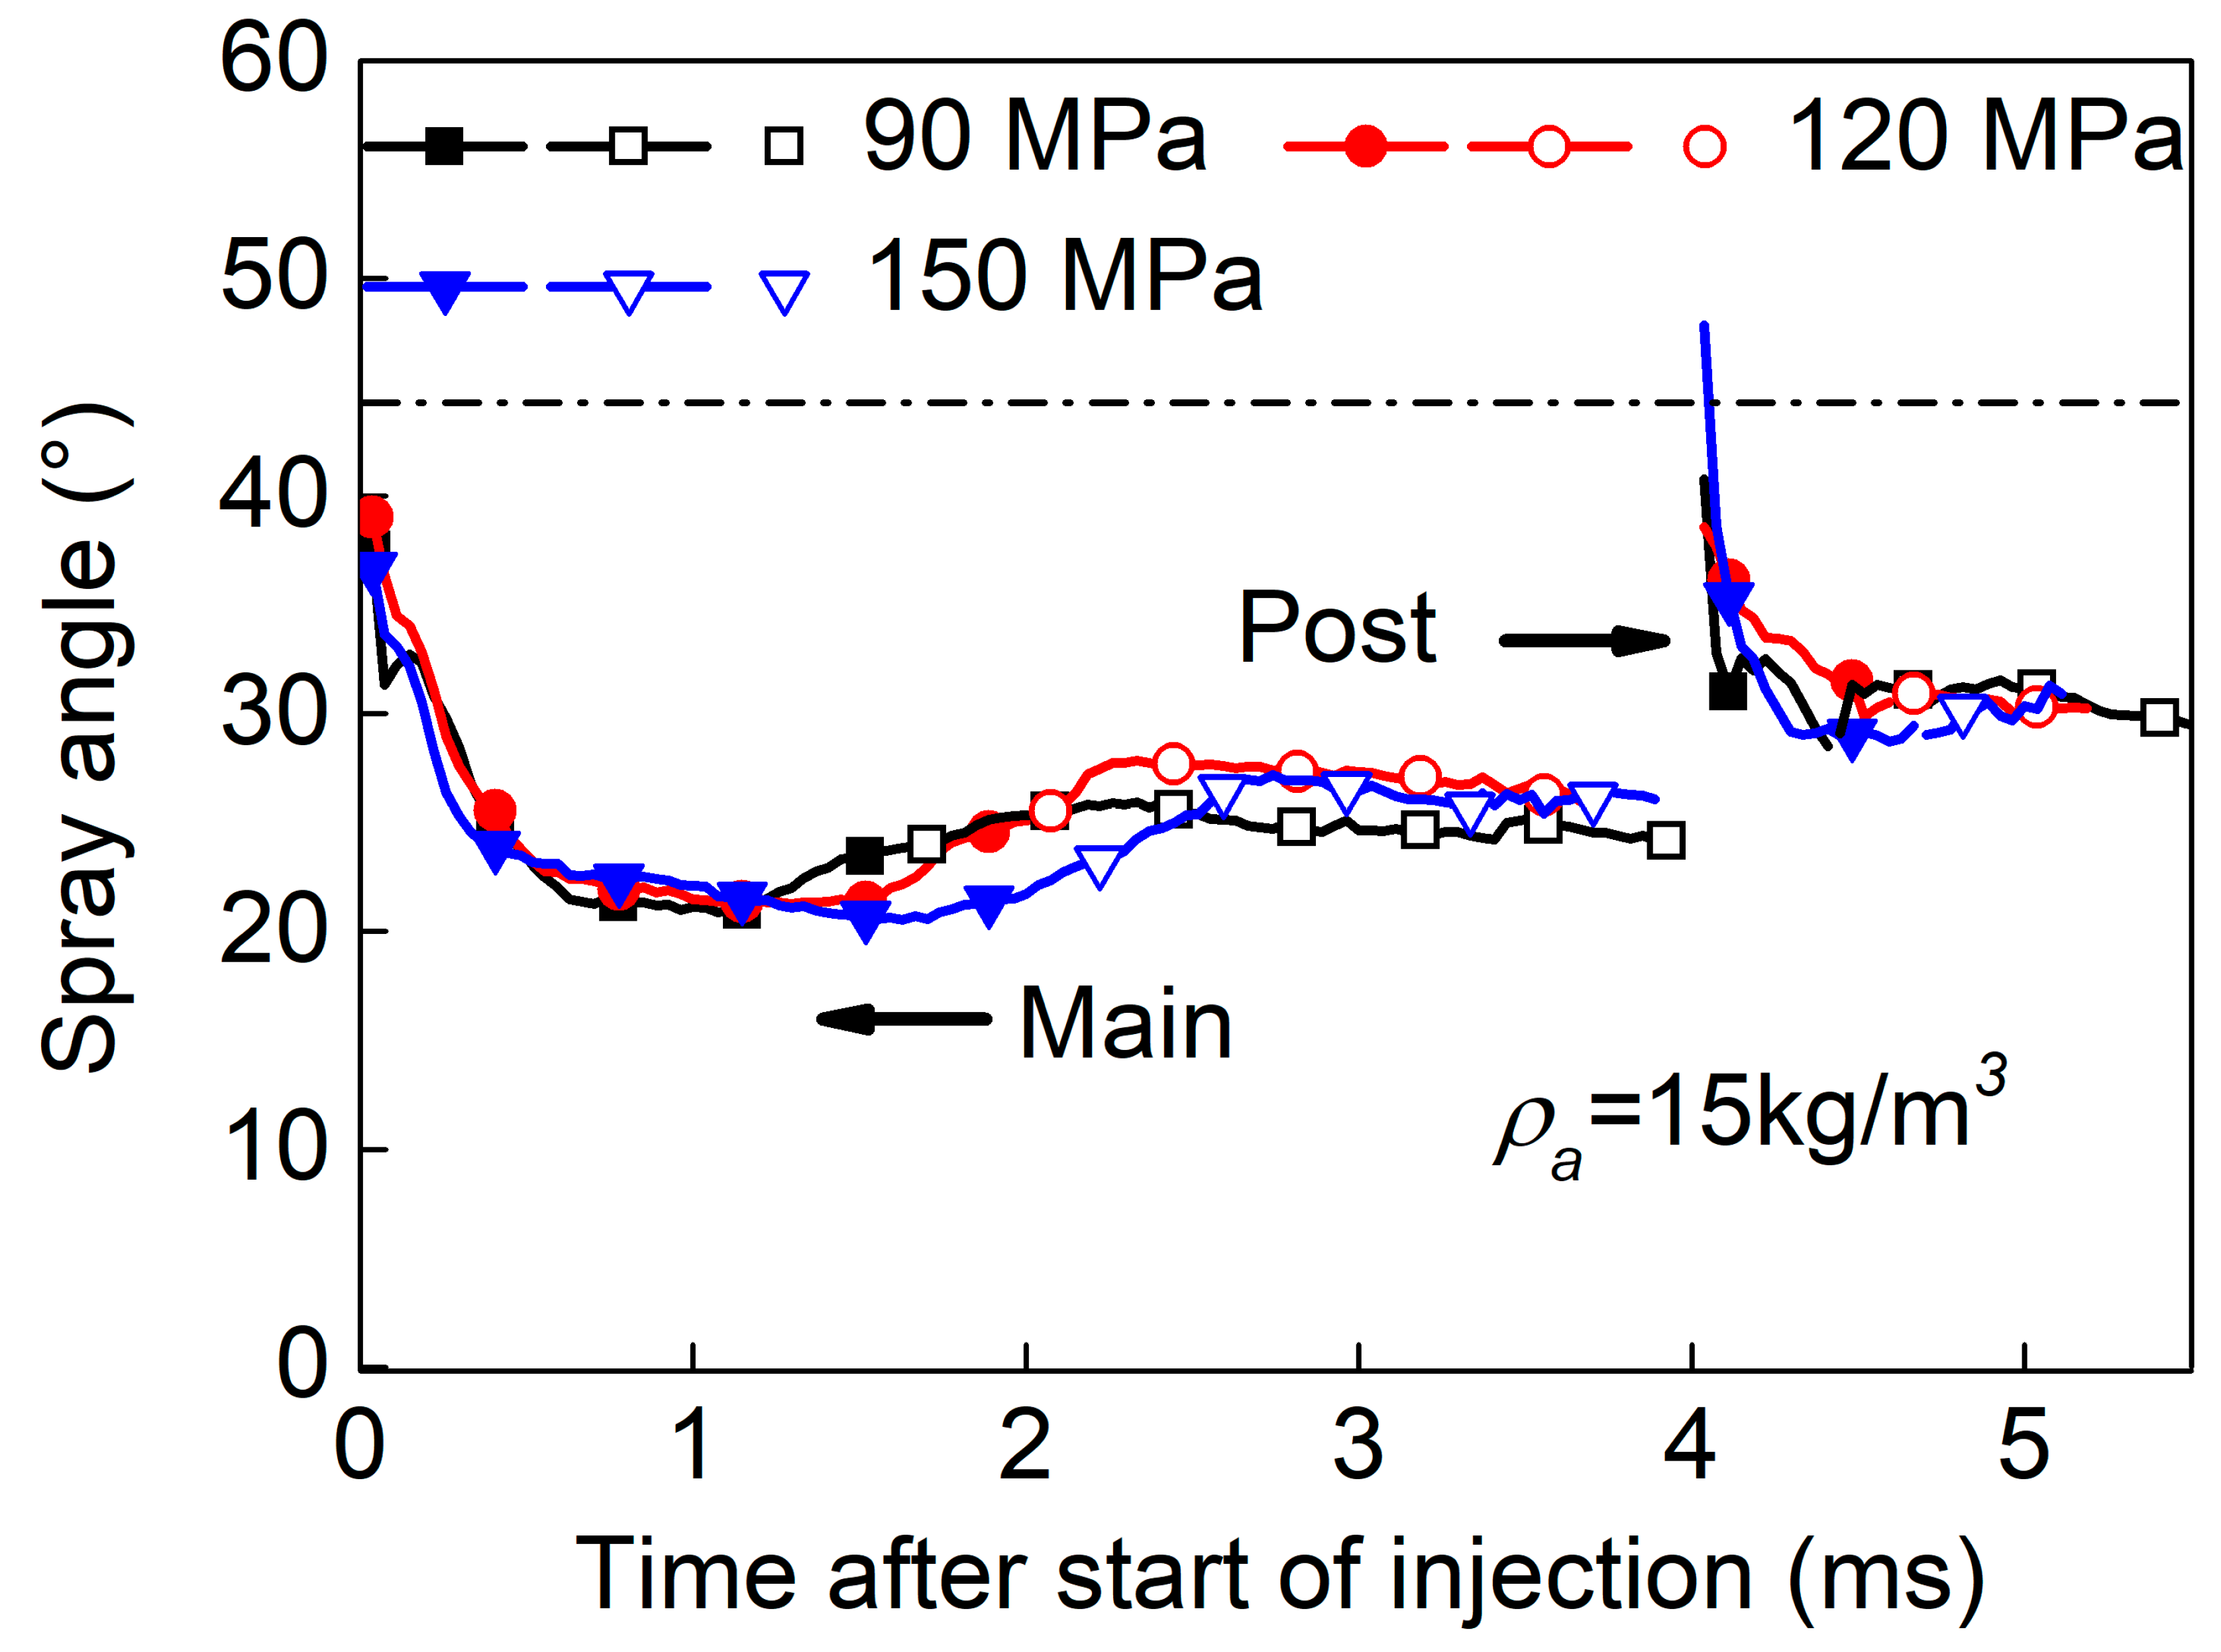
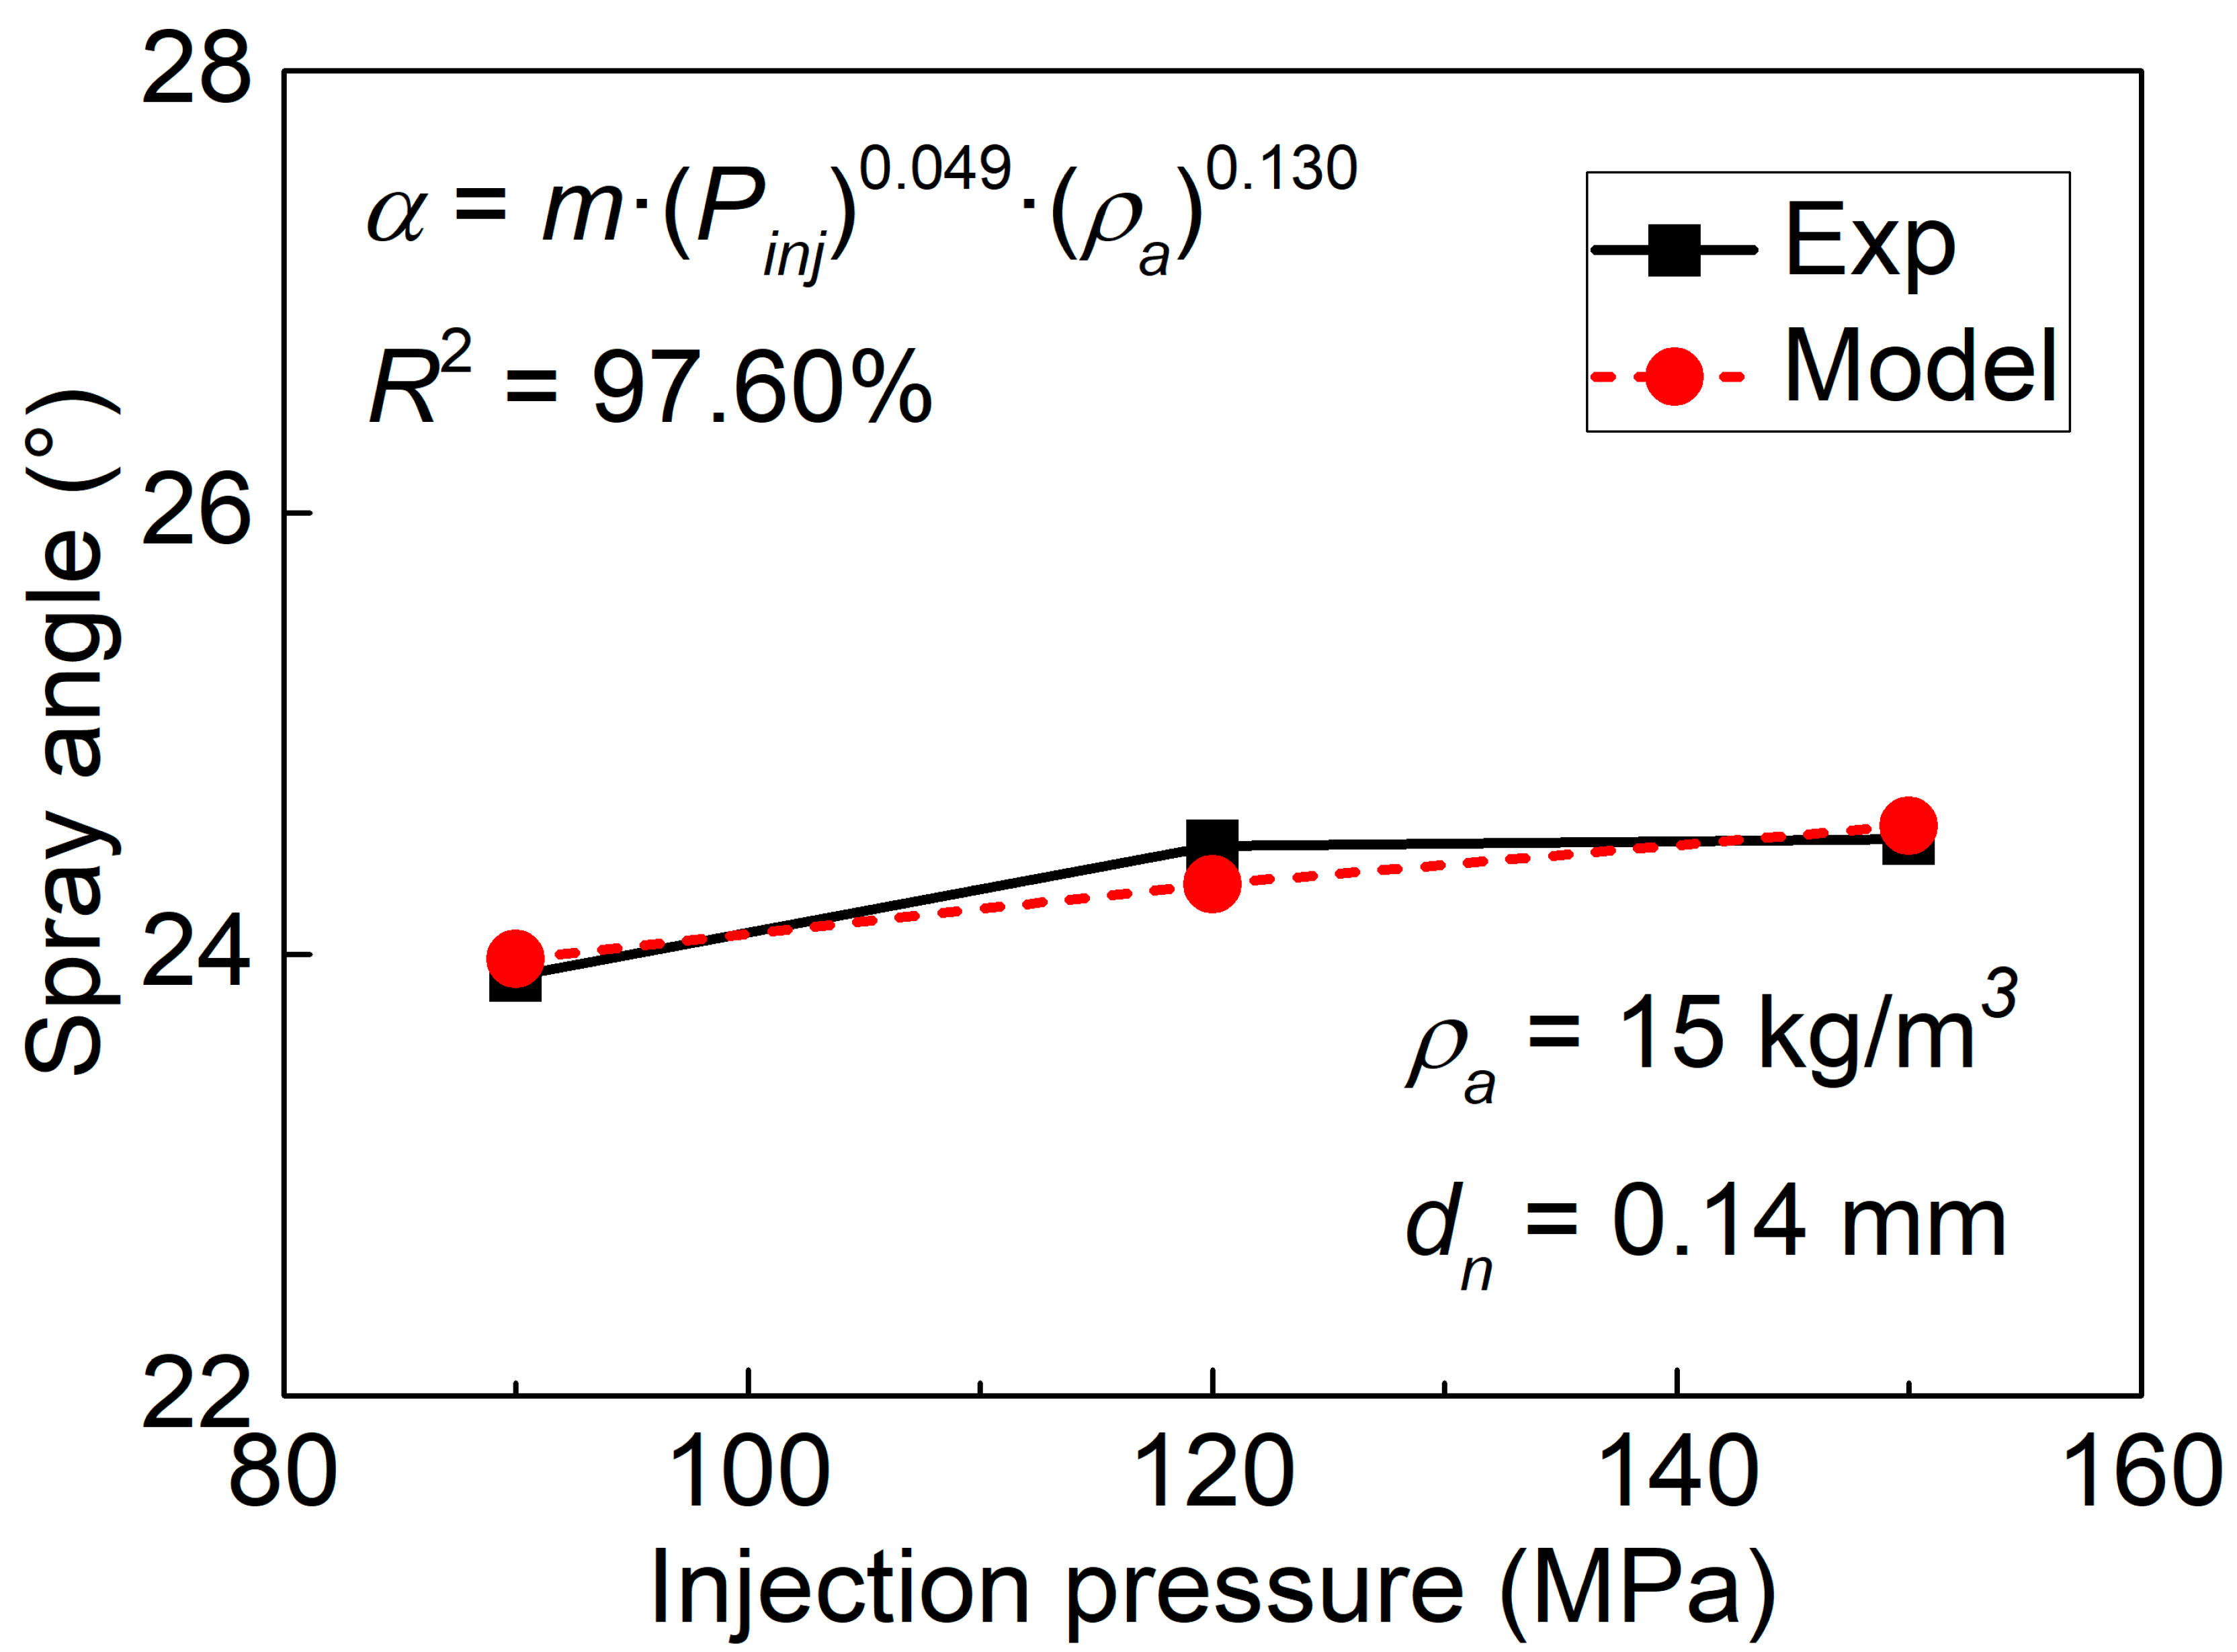
3.3. Effect of Split-Injection on Spray Tip Penetration
4. Summary and Conclusions
Author Contributions
Funding
Conflicts of Interest
Nomenclature
| AFstoich | Theoretical ratio of air to fuel | ρa | Surrounding gas density (kg/m3) |
| dn | Nozzle hole diameter (m) | ρf | Fuel density (kg/m3) |
| ln | Nozzle hole length (m) | As, S /2 | Spray area of half spray length (m2) |
| ma | Surrounding gas mass of spray area (kg) | As | Spray area (m2) |
| mf | Fuel mass of spray area (kg) | An | Nozzle hole area (m2) |
| m | Mass correlation coefficient (-) | h | Model constant |
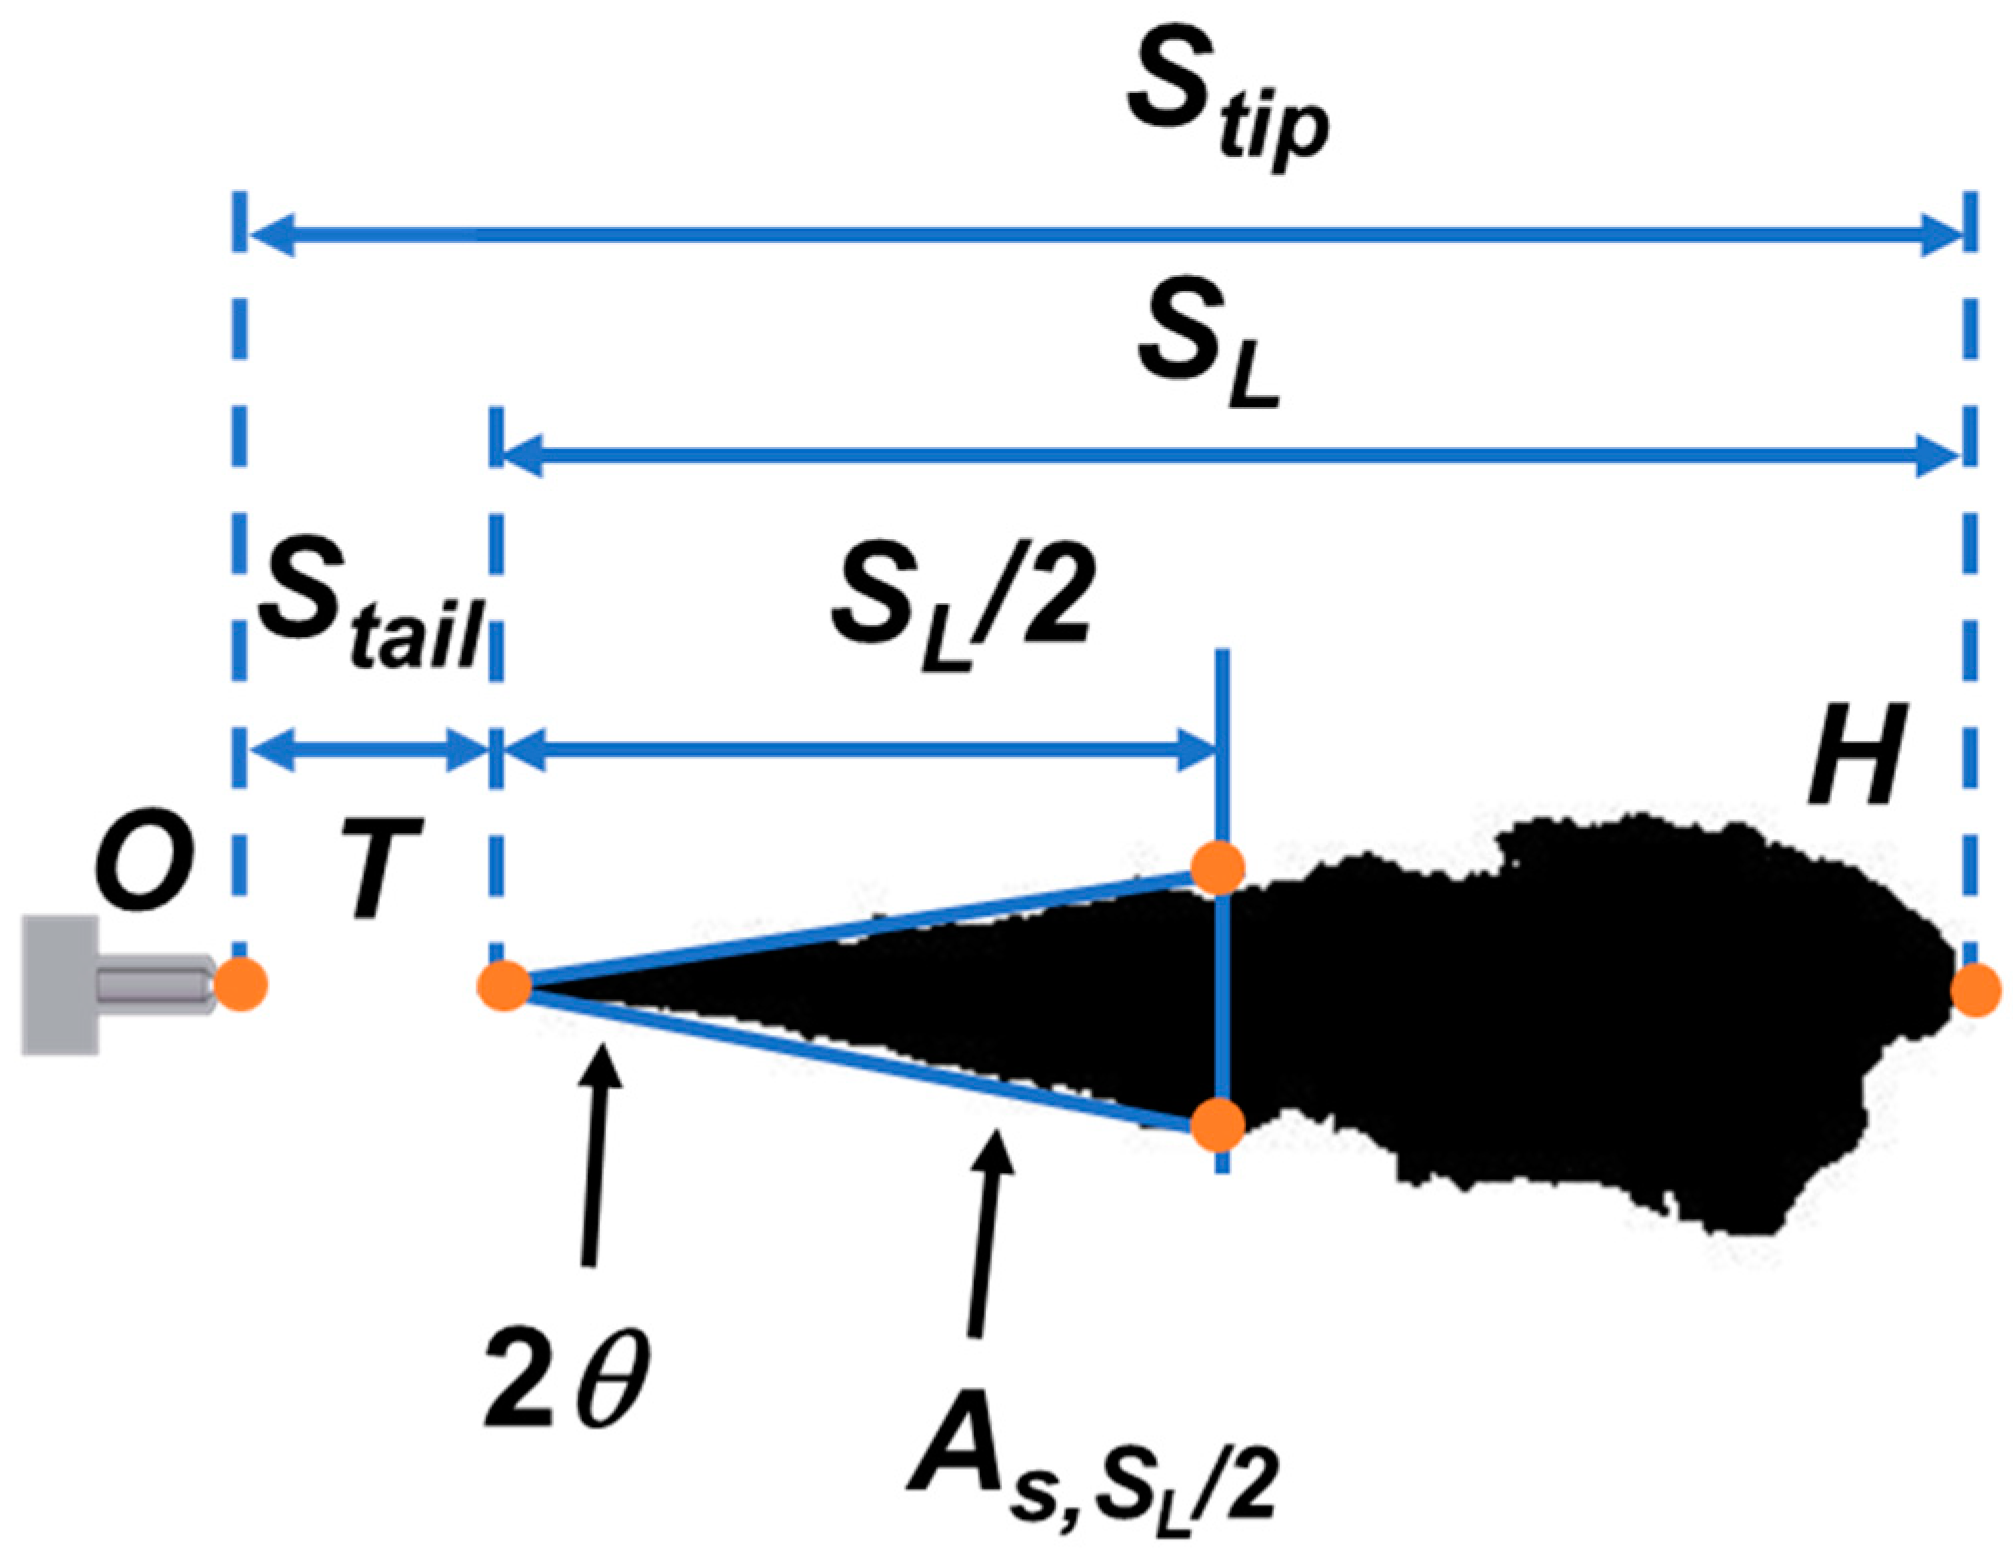
| SL | Spray length (m) | △P | Pressure difference between environment and injection (Pa) |
| Stail | Spray penetration in tail position (m) | H | The fore edge of the spray region |
| Stip | Spray penetration in tip position (m) | T | The upmost point in the spray image |
| T | Time after the start of injection (s) | O | Nozzle hole outlet position |
| ti | Fuel injection duration (s) | α | Spray angle (°) |
| ui | Injection rate of fuel (m/s) | EOI | End of injection |
| V(t) | Transient spray volume at time t (m3) | NOx | Nitrogen oxides |
| Φ | Mean equivalent ratio of fuel to air | CO | Carbon monoxide |
| μf | Viscosity of fuel (Pa·s) | UHC | Unburned hydrocarbon |
| θ | Fifty percent angle of spray (°) | SMD | Sauter mean diameter |
| Pinj | Injection pressure (MPa) | CMOS | Complementary metal oxide semiconductor |
References
- Park, S.H.; Yoon, S.H.; Lee, C.S. Effects of multiple-injection strategies on overall spray behavior, combustion, and emissions reduction characteristics of biodiesel fuel. Appl. Energy 2011, 88, 88–98. [Google Scholar] [CrossRef]
- Kim, G.; Moon, S.; Lee, S. Numerical Analysis of the Combustion and Emission Characteristics of Diesel Engines with Multiple Injection Strategies Using a Modified 2-D Flamelet Model. Energies 2017, 10, 1292. [Google Scholar] [CrossRef]
- MacMillan, D.J. Influences on the Cold Start Behaviour of a Diesel Engine at Reduced Compression Ratio. Ph.D. Thesis, University of Nottingham, Nottingham, UK, 2009. [Google Scholar]
- Wang, Z.; Jiang, C.; Xu, H.; Wyszynski, M. Macroscopic and microscopic characterization of diesel spray under room temperature and low temperature with split injection. Fuel Process. Technol. 2016, 142, 71–85. [Google Scholar] [CrossRef]
- Carlucci, P.; Ficarella, A.; Laforgia, D. Effects on combustion and emissions of early and pilot fuel injections in diesel engines. Int. J. Engine Res. 2005, 6, 43–60. [Google Scholar] [CrossRef]
- Lee, C.; Chung, J.; Lee, K. Emission Characteristics for a Homogeneous Charged Compression Ignition Diesel Engine with Exhaust Gas Recirculation Using Split Injection Methodology. Energies 2017, 10, 2146. [Google Scholar] [CrossRef]
- Moiz, A.; Ameen, M.; Lee, S.; Som, S. Study of soot production for double injections of n-dodecane in CI engine-like conditions. Combust. Flame 2016, 173, 123–131. [Google Scholar] [CrossRef]
- Mendez, S.; Thirouard, B. Using Multiple Injection Strategies in Diesel Combustion: Potential to Improve Emissions, Noise and Fuel Economy Trade-Off in Low CR Engines. SAE Int. J. Fuels Lubr. 2009, 1, 662–674. [Google Scholar] [CrossRef]
- Kourosh, K. Characterisation of Multiple-Injection Diesel Sprays at Elevated Pressures and Temperatures. Ph.D. Thesis, School of Engineering in University, Brighton, UK, 2007. [Google Scholar]
- Han, D.; Li, K.; Duan, Y.; Lin, H.; Huang, Z. Numerical study on fuel physical effects on the split injection processes on a common rail injection system. Energy Convers. Manag. 2017, 134, 47–58. [Google Scholar] [CrossRef]
- Hadadpour, A.; Jangi, M.; Bai, X. Jet-jet interaction in multiple injections: A large-eddy simulation study. Fuel 2018, 234, 286–295. [Google Scholar] [CrossRef]
- Yun, H.; Reitz, R. An experimental investigation on the effect of post-injection strategies on combustion and emissions in the low-temperature diesel combustion regime. J. Eng. Gas Turbines Power-Trans. Asme 2007, 129, 279–286. [Google Scholar] [CrossRef]
- Bobba, M.; Musculus, M.; Neel, W. Effect of post injections on in-cylinder and exhaust soot for low-temperature combustion in a heavy-duty diesel engine. SAE Int. J. Eng. 2010, 3, 496–516. [Google Scholar] [CrossRef]
- Arregle, J.; Pastor, J.; Lopez, J.; Garcia, A. Insights on postinjection-associated soot emissions in direct injection diesel engines. Combust. Flame 2008, 154, 448–461. [Google Scholar] [CrossRef]
- Hu, B.; Musculus, M.; Oefelein, J. The influence of large-scale structures on entrainment in a decelerating transient turbulent jet revealed by large eddy simulation. Phys. Fluids 2012, 24, 045106. [Google Scholar] [CrossRef]
- Huang, S.; Deng, P.; Huang, R.; Wang, Z.; Ma, Y.; Dai, H. Visualization research on spray atomization, evaporation and combustion processes of ethanol-diesel blend under LTC conditions. Energy Convers. Manag. 2015, 106, 911–920. [Google Scholar] [CrossRef]
- Wang, Z.; Xu, H.; Jiang, C. Experimental study on microscopic and macroscopic characteristics of diesel spray with split injection. Fuel 2016, 174, 140. [Google Scholar] [CrossRef]
- Wang, Z.; Ding, H.; Wyszynski, M. Experimental study on diesel fuel injection characteristics under cold start conditions with single and split injection strategies. Fuel Process. Technol. 2015, 131, 213–222. [Google Scholar] [CrossRef]
- Lee, C.; Lee, K.; Reitz, R.; Park, S. Effect of split injection on the macroscopic development and atomization characteristics of a diesel spray injected through a common-rail system. At. Sprays 2006, 16, 543–562. [Google Scholar] [CrossRef]
- Ma, S.; Zheng, Z.; Liu, H.; Zhang, Q.; Yao, M. Experimental investigation of the effects of diesel injection strategy on gasoline/diesel dual-fuel combustion. Appl. Energy 2013, 109, 202–212. [Google Scholar] [CrossRef]
- Lim, J.; Lee, S.; Min, K. Combustion modeling of split injection in hsdi diesel engines. Combust. Sci. Technol. 2011, 183, 180–201. [Google Scholar] [CrossRef]
- Hiroshi, H.; Motoo, O.; Toshikazu, K. Study on Performance Improvement of DI diesel Engine with pilot injection Method. SAE Int. J. Eng. 1991. Available online: https://saemobilus.sae.org/content/912462 (accessed on 30 October 2019).
- Imperato, M.; Kaario, O.; Sarjovaara, T. Split fuel injection and Miller cycle in a large-bore engine. Appl. Energy 2016, 162, 289. [Google Scholar] [CrossRef]
- Zhuang, J.; Qiao, X.; Bai, J. Effect of injection-strategy on combustion, performance and emission characteristics in a DI-diesel engine fueled with diesel from direct coal liquefaction. Fuel 2014, 121, 141. [Google Scholar] [CrossRef]
- Yao, M.; Wang, H.; Zheng, Z. Experimental study of n-butanol additive and multi-injection on HD diesel engine performance and emissions. Fuel 2010, 89, 2191. [Google Scholar] [CrossRef]
- Chen, S.K. Simultaneous reduction of NOx and particulate emissions by using multiple injections in a small diese engine. SAE Trans. 2000, 109, 2127–2136. [Google Scholar] [CrossRef]
- Han, Z.; Uludogan, A.; Hampson, J. Mechanism of soot and NOx emission reduction using multiple-injection in a diesel engine. SAE Trans. 1996, 105, 837–852. [Google Scholar] [CrossRef]
- Bosch, W. The Fuel Rate Indicator: A new measuring instrument for display of the characteristics of individual injection. SAE Tech. Pap. 1966. [Google Scholar] [CrossRef]
- Zhou, X.; Li, T.; Lai, Z.; Wang, B. Scaling fuel sprays for different size diesel engines. Fuel 2018, 225, 358–369. [Google Scholar] [CrossRef]
- Zhou, X.; Li, T.; Lai, Z.; Wei, Y. Modeling diesel spray tip and tail penetrations after end-of-injection. Fuel 2019, 237, 442–456. [Google Scholar] [CrossRef]
- Naber, D.; Siebers, L. Effects of gas density and vaporization on penetration and dispersion of diesel sprays. SAE Trans. 2000, 105, 82–111. [Google Scholar] [CrossRef]
- Takamura, A.; Ohta, T. Fukushima, S.; Kamimoto, T. A study on precise measurement of diesel fuel injection rate. SAE Tech. Pap. 1992. [Google Scholar] [CrossRef]
- Arai, M.; Amagai, K. Dynamic behavior of multi-stage injection diesel spray. SAE Tech. Pap. 1997. [Google Scholar] [CrossRef]
- Li, T.; Nishida, K.; Zhang, Y.; Hiroyasu, H. Effect of split injection on stratified charge formation of direct injection spark ignition engines. Int. J. Engine Res. 2007, 8, 205–219. [Google Scholar] [CrossRef]
- Doudou, A. Turbulent flow study of an isothermal diesel spray injected by a common rail system. Fuel 2005, 84, 287–298. [Google Scholar] [CrossRef]
- Gavaises, M.; Andriotis, A. Cavitation inside multi-hole injectors for large diesel enginesand its effect on the near-nozzle spray structure. SAE Tech. Pap. 2006. [Google Scholar] [CrossRef]
- Taşkiran, O.; Ergeneman, M. Experimental study on diesel spray characteristics and auto ignition process. J. Combust. 2011, 3, 1–20. [Google Scholar] [CrossRef]
- Zhou, X.; Li, T.; Wei, Y.; Wu, S. Scaling spray combustion processes in marine low-speed diesel engines. Fuel 2019, 258, 116133. [Google Scholar] [CrossRef]
- Inagaki, K.; Mizuta, J.; Kawamura, K. Theoretical study on spray design for small-bore diesel engine. SAE Tech. Pap. 2016. [Google Scholar] [CrossRef]
- Musculus, M.; Lachaux, T.; Pickett, L. End-of-injection over-mixing and unburned hydrocarbon emissions in low-temperature-combustion diesel engines. SAE Tech. Pap. 2007. [Google Scholar] [CrossRef]
- Lacoste, J. PDA characterisation of dense diesel sprays using a common rail injection system. SAE Trans. 2003, 112, 2074–2085. [Google Scholar] [CrossRef]


| Parameter | Value |
|---|---|
| Temperature of fuel (K) | 293 |
| Density of fuel (kg/m3) | 819 |
| Number of nozzle | 1 |
| Type of nozzle | Mini sac |
| Diameter of nozzle (mm) | 0.14 |
| Length of nozzle (mm) | 0.64 |
| Injection pressure (MPa) | 90.0, 120.0, 150.0 |
| Injection strategy | pilot-main, main-post |
| Surrounding gas pressure (MPa) | 4.0 |
| Surrounding gas temperature (K) | 293 |
| Parameter | Value |
|---|---|
| Fuel temperature (K). | 293 |
| Fuel density (kg/m3) | 819 |
| Hole number | 1 |
| Number of hole | Mini sac |
| Diameter of hole (mm) | 0.14 |
| Length of hole (mm) | 0.64 |
| Injection pressure (MPa) | 90.0, 120.0, 150.0 |
| Injection strategy | pilot-main, main-post |
| Imaging speed (fps) | 27,000 |
| Surrounding gas pressure (MPa) | 1.31, 1.57, 1.83 |
| Surrounding gas density (kg/m3) | 15, 18, 21 |
| Surrounding gas temperature (K) | 293 |
| Surrounding gas | Nitrogen |
| Injection Strategies | Pilot-Main | Main-Post |
|---|---|---|
| The first energized duration (ms) | 0.40 | 0.65 |
| The energized interval (ms) | 1.70 | 3.34 |
| The second energized duration (ms) | 0.65 | 0.40 |
© 2019 by the authors. Licensee MDPI, Basel, Switzerland. This article is an open access article distributed under the terms and conditions of the Creative Commons Attribution (CC BY) license (http://creativecommons.org/licenses/by/4.0/).
Share and Cite
Wu, G.; Zhou, X.; Li, T. Temporal Evolution of Split-Injected Fuel Spray at Elevated Chamber Pressures. Energies 2019, 12, 4284. https://doi.org/10.3390/en12224284
Wu G, Zhou X, Li T. Temporal Evolution of Split-Injected Fuel Spray at Elevated Chamber Pressures. Energies. 2019; 12(22):4284. https://doi.org/10.3390/en12224284
Chicago/Turabian StyleWu, Gang, Xinyi Zhou, and Tie Li. 2019. "Temporal Evolution of Split-Injected Fuel Spray at Elevated Chamber Pressures" Energies 12, no. 22: 4284. https://doi.org/10.3390/en12224284
APA StyleWu, G., Zhou, X., & Li, T. (2019). Temporal Evolution of Split-Injected Fuel Spray at Elevated Chamber Pressures. Energies, 12(22), 4284. https://doi.org/10.3390/en12224284