Article

Optimum Resilient Operation and Control DC Microgrid Based Electric Vehicles Charging Station Powered by Renewable Energy Sources

1
Faculty of Engineering, Sohag University, Sohag 82524, Egypt
2
Department of Electrical Engineering, College of Engineering, Majmaah University, Almajmaah 11952, Saudi Arabia
3
Department of Electrical Engineering, College of Engineering, Assuit University, Assuit 71515, Egypt
*
Author to whom correspondence should be addressed.
Energies 2019, 12(22), 4240; https://doi.org/10.3390/en12224240
Submission received: 25 September 2019 / Revised: 25 October 2019 / Accepted: 30 October 2019 / Published: 7 November 2019
(This article belongs to the Special Issue Microgrid Energy Management)

Abstract

:
This paper introduces an energy management and control method for DC microgrid supplying electric vehicles (EV) charging station. An Energy Management System (EMS) is developed to manage and control power flow from renewable energy sources to EVs through DC microgrid. An integrated approach for controlling DC microgrid based charging station powered by intermittent renewable energies. A wind turbine (WT) and solar photovoltaic (PV) arrays are integrated into the studied DC microgrid to replace energy from fossil fuel and decrease pollution from carbon emissions. Due to the intermittency of solar and wind generation, the output powers of PV and WT are not guaranteed. For this reason, the capacities of WT, solar PV panels, and the battery system are considered decision parameters to be optimized. The optimized design of the renewable energy system is done to ensure sufficient electricity supply to the EV charging station. Moreover, various renewable energy technologies for supplying EV charging stations to improve their performance are investigated. To evaluate the performance of the used control strategies, simulation is carried out in MATLAB/SIMULINK.

1. Introduction

Recently, electric vehicles (EVs) became more widespread, and thus, installing EV charger stations is substantial to satisfy the electrical energy demand of a large number of EVs [1]. However, due to the extended electrical grids, fast EV charger stations, parking lots, and residential areas can supply the electrical energy desired to charge EVs. Energy management control strategies are required for the charger stations for designing and calculating an optimal contracted ability to promote performance and operation [2,3,4]. Effective battery chargers represent a substantial role in the evolution of modern EVs. The characteristics of the battery charger affect the battery life and charging energy efficiency, as well as the charging time. EV battery chargers should have the key advantages of higher power density, higher efficiency, better reliability, smaller size, lighter weight, and cheaper cost. The operation of the charger circuit relies fundamentally on power circuit topology, power circuit passive and active devices, soft switching techniques and control schemes [5]. Mostly, the EV-charger control techniques can be carried out by using analog/digital controllers, digital signal processors, microcontrollers, and some particular integrated circuits. However, this depends upon the complexity of the power circuit topology, cost, and the power rating of converters. Although plug-in electric vehicles (PEVs) are being promoted in the market with the objective of reducing the pollution from conventional automobiles, the energy demands for charging the EV batteries are still supplied by power generated by conventional fossil fuel sources. For this reason, many researchers have proposed the solution of charging PEVs using renewable energy sources like photovoltaic (PV) and wind. Numerous pilot projects are also carried out to charge PEVs from solar PV and wind energy systems [4,5,6,7,8,9]. These projects are still in the development stage [10]. Moreover, due to the economic and social benefits, research work on charging stations powered by the PV system has engaged researchers worldwide. Generally, the use of solar energy charger is a dependable source for charging small scale electric vehicles, such as scooters, golf carts, and airport utility carriages [11]. The use of photovoltaic powered chargers in a parking lot is analyzed in [12]. A photovoltaic PV-based charging station that is connected with the utility grid is described in [13,14]. Solar PV parking lot chargers and other application models to supply PEVs with solar energy are explored in [15]. Economic studies of PV powered charging stations have been done by [16,17]. Reference [18] depicts how intelligent control algorithms can support PEVs and PV to integrate with the existing electrical power systems. PV system provides a potential source for PEV of median generation capacity, while PEVs represent a dispatchable load for low and extra PV generation during periods of light load demand.
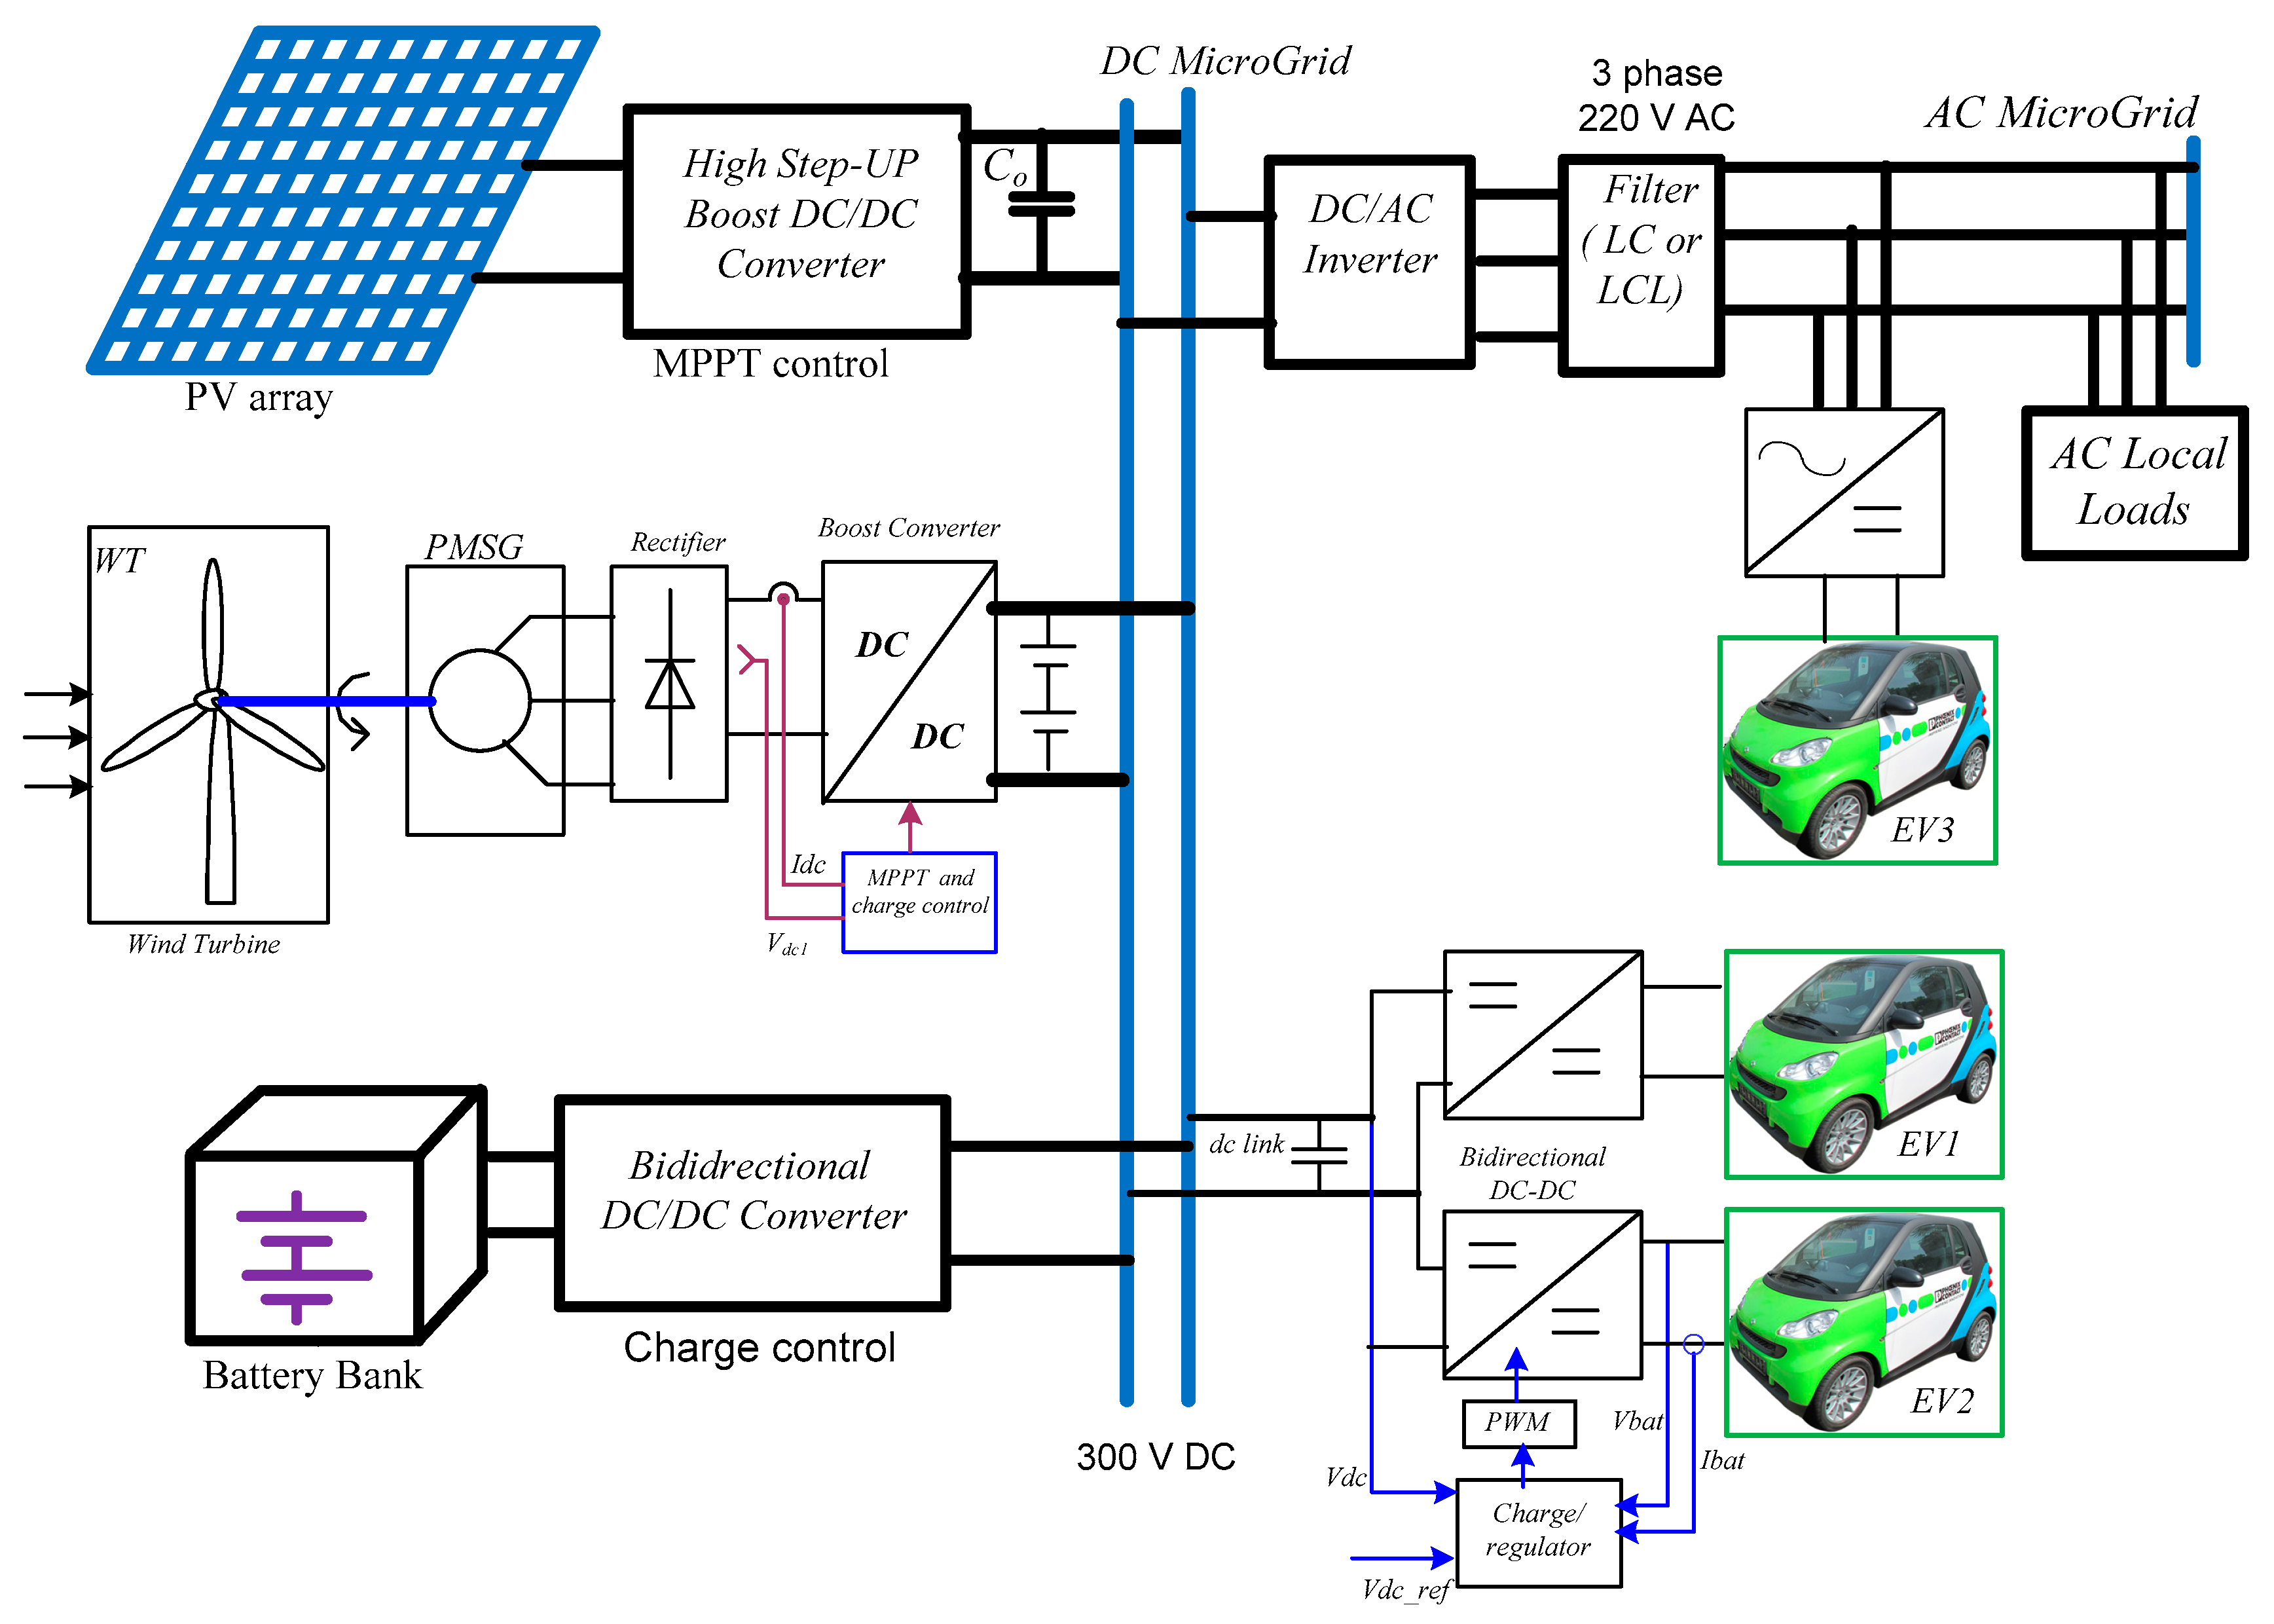
For the stand-alone microgrid, energy management system (EMS) can control demand/supply balance and maximize the environmental or economic benefits. EMS is a key technology for stable microgrid operation. For the stand-alone wind-diesel microgrid in [19], an optimal EMS strategy is proposed, which optimizes the charging/discharging cycles of storage system and system operation cost according to the prediction of wind turbine (WT) output and load demand. A novel EMS-based on a rolling horizon strategy for a renewable-based microgrid, which includes PV, WT generator, diesel generator, and energy storage system (ESS), is proposed in [20]. In [21], a control strategy to reduce power fluctuations is proposed, which utilizes the ESS to smooth the output power of the wind farm. DC microgrids have a less complex control strategy which only adopts P-V droop, mitigates the need for reactive power compensation, and reduce the circulating reactive power. Furthermore, elimination of frequency and phase angle would ease the resynchronization to the utility grid. Without reactive power and harmonics, DC microgrids could also offer a better quality of power [22]. They can feed the DC loads directly by avoiding the conversion losses.
Renewable energy-based charging stations (wind and solar) are friendly EV charging that reduces fossil fuel exhaustion, optimizes investment cost and accommodates fluctuations of generated power by renewable sources. The evaluation objectives of charging stations include operational performance and customer acceptance of charging equipment; pricing criteria to encourage off-peak charging; and grid impacts [23]. Hence, adopting a DC microgrid is presented for enhancing the resilience and optimum operation of microgrid, including distributed generation [24]. The broad problem considered in this research is the optimization of energy flows in the DC microgrid. For this reason, a stable, robust and optimal supervisory control algorithm is substantial for the large scale hybrid dynamical system of PEV charging station. Since the system is subjected to random variations in solar power and the connected vehicles in the parking lot, the system operation must be robust against these disturbances. In a DC-microgrid, buses can be classified into four types: Generation bus, DC load bus, batteries energy storage system (BESS) bus, and connection bus to AC-microgrid using voltage-source converters (VSCs). Moreover, these types of buses can be divided into two groups according to their contribution to microgrid operation and control, which are power bus and slack bus. The power bus absorbs power from/to the microgrid on its own. Typical examples are variable DC-loads and variable (non-dispatchable) generation, such as photovoltaic and wind turbines generation systems. In contrast, slack buses are responsible for balancing the power surplus/deficit resulting from power buses and maintaining stable operation of the microgrid.
Generally, in the largely inhibited parking lot, interventions are focused on removing fully charged EVs, to give non-charged EVs a chance to be an effective to realize powerful utilization of the charging infrastructure [25]. Specifically, two resilience measures are considered, the resilience related to the amount of energy delivered to EVs and the resilience related to the average charging time, are provided for the EV charging station. Resilience can be defined as the ability of the studied system to withstand disturbance state and return to a regular state quickly. It has become a new challenge facing the EV charging station design [26]. A related key performance indicator (KPI) is the percent of sessions with a low charging time ratio to the total charging time divided by the amount of total connection time [27,28]. However, these sessions are often a burden during peak hours and daytime. To increase availability for other EV users, the fully charged EVs should be removed.
References [29,30] propose power management strategies for an autonomous DC-microgrid based on a PV source, a supercapacitor, electrochemical storage, and a diesel generator. However, these papers have difficulties in achieving power balance, while accounting for the slow start-up characteristic of the diesel generator, the self-discharge of an SC. Moreover, the economic operating mode of the diesel generator can increase the total energy cost of the DC-microgrid. References [31,32] has studied a test bed to investigate the dynamic response of a DC-microgrid to major disturbances, but it did not calculate the resilience of the studied DC-microgrid. References [33,34] have investigated the dynamic response of microgrids powered by renewable energy sources, but they did not define resilience of the studied systems.
This paper presents the control strategy of an isolated standalone EV chargers station incorporated in a DC microgrid. This control strategy is investigated using proportional-integral controllers (PI). This controller will regulate the charging of EVs. The proposed EMS is considered promising, due to its robustness and simplicity that makes this suitable for applications in the future smart DC microgrid. A new resilience measurement is defined as the ratio of the normalized system, integrated within its maximum permissible recovery time after the disturbance to the performance integral in the ordinary state. This measure enables the resilience of various systems to be compared on the same comparative scale. To estimate the resilience of DC microgrid, a resilience measurement scheme is developed.

2. System Description

A DC microgrid is a low-voltage network that consists of several energy components, such as controllable loads and distributed energy resources (DERs). The standalone system can decrease the carbon footprint and reduce the losses of power transmission [35]. Figure 1 shows a standalone DC microgrid supplying EVs charging station. The studied system is composed of WT, photovoltaic (PV), and energy storage systems (ESS), such as battery bank. In this system, controllable loads include electric vehicles (EVs). The EVs are charged from DC microgrid through DC-DC converters controlled by a charging regulation control scheme. The battery bank has a dual power flow in the whole system that acts as the energy provider and consumer according to the condition of wind turbine and PV panels’ production. The configuration of the standalone charging station is shown in Figure 1. The PV connected to the DC microgrid through a DC-DC converter controlled by the maximum power point tracker (MPPT) scheme. The wind generator connected to the DC microgrid through an AC-DC and DC-DC converters. At the same time, the battery bank charged and discharged from DC microgrid using a bidirectional DC-DC converter.

2.1. Configuration of Electric Vehicle

The PEV has three major subsystems: Electric propulsion subsystem, Power source, and Auxiliary system. The electrical propulsion subsystem is composed of the electronic controller; DC-AC power converter; electric traction motor; driving wheels, and mechanical transmission. Based on the control input signals from the accelerator and brake pedals, the electronic or digital controller provides the required control commands to switch on or off the power converters which in turn coordinate the power flow between the electric motor and the EV battery source. However, the backward power flow is due to regenerative braking of the EV, and consequent regenerative energy can be maintained to charge EV Battery. The energy management unit (EMU) cooperates with the electronic controller to deal with regenerative braking and its recovered energy. Generally, the auxiliary power system supplies the necessary energy at various voltage levels to auxiliaries in EV, particularly the power steering units and temperature control. The successful utilization of EVs over the next decade is promoted according to international standards and regulations. Safety codes and standards define a wide range of issues related to EVs. For example, article 625-18 of the national electrical code [36], requires that cables and connectors for levels 2 and 3 be de-energized unless connected to an EV for charging. Typically, there are various types of charging systems for EVs, and generally, they are categorized as level 1, level 2 charging, and level 3 charging, as shown in Figure 2. All commercial EVs have the capability to charge using level 1 or level 2 charging systems. Level 1 and 2 charging are ranged from 2 to 20 kW single or three-phase to supply AC charging current of up to 80 A. Level 2 chargers are equipped with SAE J1772 AC charging port to charge the EV batteries. Level 3 charging, delivers a rapid DC charging method to charge the vehicle batteries at installed stations. This charging technique practices a 3-phase source with a DC output to the vehicle.

2.2. Capacity Sizing of the Charging Station

In this paper, the charging station is considered far away from a community. The charging point in the station provides four typical DC chargers and two fast DC chargers (the fast charger typically requires 20 min to complete charging 80%, while the standard charger requires about 11 h to complete 80% charging). For example, the Nissan leaf car has about 24 kWh lithium-ion battery banks to store and supply power for EV motor [37,38,39,40]. Hence, within 30 min it reaches about 80% of its capacity at level 3 charging condition.
In this paper, the maximum capacity of the charging station output power was assumed. The load demand is treated as a changeable parameter and pursues normal allocation. For a public charging station, the chargers should endorse standard chargers, in order to be utilized for various types of EVs. Home charging usually uses AC charging and it includes two types of charging; level 1 charging (120 V) and level 2 charging (240). On the other hand, DC faster chargers are largely used in the commercial chargers stations. The capital cost of the charging station will be cut-price as the prices of wind and solar PV generator apparatus come down. Any overabundant energy from WT and PV can be accumulated in the energy storage batteries. The optimal sizing of WT, PV and battery capacities could depend on the variance of wind velocities and solar irradiance. Table 1 shows the renewable sources-based specifications of the charging station.
The charging station is designed, such as the maximal output power is 150 kW. The daily operation time is 24 h and seven days a week. The typical battery bank capacity is 24 kWh (Nissan Leaf, 2014). The calculated maximal demand for the charging station is 4728 kWh every day. The most popular charging technology, based on Japan’s EV association standard [36,37], can deliver 50 kW output. However, the power rating of the charger is 90 kW at Tesla’s supercharger station. Then the car can travel about 240 km after charging for 30 min. In this paper, it is assumed that the DC fast charger rates 50 kW output.

3. Control Strategy for PV/Wind/Storage Hybrid System

3.1. Control Scheme of the Boost DC-DC Converter Interfacing PV Array

The boost conversion stage is used to regulate the voltage from the PV panel and extract the maximum power. The PV panel voltage Vpv and the input current Ipv are sensed frequently. Then the MPPT control algorithm utilizes these two values and calculates the reference power that the PV panel requires to be operated at MPP conditions. The MPPT is achieved using an inner current loop and an outer voltage loop, as shown in Figure 3. By increasing the current drawn from the boost converter, results in reducing the panel output voltage. Therefore, the outer voltage compared with a reference value and feedback is regulated using PI controller gains. Hence, the output voltage is prevented from exceeding the adjusted value. On the other hand, the resulting signal from the MPPT controller is regulated using a PI controller. Then the output of the internal loop is compared with the reference current produced by the outer loop to generate the PWM signal [38,39,40].

3.2. Control of the Boost DC-DC Converter Interfacing Wind Turbine

The control scheme of the WT generator includes maximum power point extractor for standalone variable speed WT with a permanent magnet synchronous generator (PMSG) and DC bus voltage control. The boost power converter is correctly adjusted to supply the maximum available generated power from the WT using the rectified DC voltage and current drawn from the rectifier output. The charging station works in standalone operation mode. Hence, the generated energy should be transferred through the DC microgrid to the electric vehicle loads. The power reference is generated from the comparison of the DC-link actual and reference values. The generated control signals are adjusted by using PI controllers to give power reference. For maintaining the DC microgrid voltage at its desired value, the PWM modulation signals of each converter are controlled regardless of variations in wind speeds and vehicles charging loads. The aim of using the boost converter is to regulate the rectified DC voltage to a higher voltage level for supplying generated power to the station DC microgrid. The DC microgrid voltage will be in the range of 280–320 V. DC-DC converters are controlled to obtain maximum power point operation MPP to maximize gathered wind power and to optimize the electrical energy produced by the PV panels. Figure 4 explains the control scheme of the boost converter. The parameters of PMSG are listed in Table 2. Thus, the measured input current and voltage values are used in the power optimizing algorithm or power tracker MPPT. The rectified DC voltage value (VDC) is provided to a look-up table that defines a predefined maximum power point (MPP) characteristic curve.

3.3. Control of Bidirectional DC-DC Converter Interfacing Battery Bank

As shown in Figure 5, the bidirectional converter consists of a high-frequency inductor L, filtering capacitor CDC and two half-bridge switches (S1 and S2), which enable a bidirectional flow of current. There are two voltage controllers with appropriate control blocks to realize the desired energy flow in various conditions. The controller produces a reference current of energy charging and discharging. The first controller is for DC-bus voltage regulation, and the second controller is for battery voltage control. To improve energy management in the charging station and the DC microgrid, backup energy storage batteries are used. The battery bank is connected to the DC-microgrid employing a bidirectional DC-DC power converter. This converter carries out double tasks: A battery charging regulator and a boost converter to supply power from the battery bank to the DC microgrid when the PV panels and wind sources have insufficient power to charge the electric vehicle loads. As a standalone charging station, the most convenient operating condition takes place when the electric vehicle power and the PV and wind extracted power agree. However, too deep discharge of the battery bank is not recommended, as, at a low battery bank voltage, there is a confined range of charging energy, which may cause over-voltage in DC microgrid during, e.g., energy recovery from the EVs side. On the other hand, there is a limited range of discharging energy, and the batteries have to be protected.

3.4. DC Microgrid Control Method

In the studied DC microgrid, a control scheme has been implemented to balance the DC voltage bus and to control the power supply to meet the load demand in islanded mode. In this control, one unit source acts as a master controlling the full system, while the rest of the units work as current sources (i.e., as “Slaves”). In this way, there will not be the voltage difference between the outputs of the DC sources, because the Master unit regulates the voltage values of all the output units; therefore, current will not circulate between the sources.
The DC microgrid is measured and compared with a predefined reference voltage, and the voltage error is processed through a compensator (PI block) to obtain the desired impedance current reference for the current loop. This compensator can be expressed in the following way [33]:
I L r e f = k p ( V r e f V M G ) + k i ( V r e f V M G ) d t
where ILref is the reference current for the DC-DC converter. Vref is the reference voltage for DC microgrid, and VMG is the actual voltage. Kp and ki are the proportional and integral controller coefficients for voltage loop. The power flow is controlled by a current controller who compares the impedance current in the master unit with the reference current desired to stabilize the system, the error is processed through another PI block to obtain the desired duty cycle for the converter which acts as a Master. The PI block can be expressed as:
d = k i p ( I L r e f I L ) + k i i ( I L r e f I L ) d t
where ILref is the reference current for the DC-DC converter. IL is the actual measured current. Kip and kii are the proportional and integral controller coefficients for the current loop. The problem of this control topology is the dependence on the master unit, and if there is a fault in this unit, the control will stop working properly [27]. To increase the reliability of the system, three different sources can act as a master unit, decreasing the chance to fault in the microgrid control. The energy storage system (ESS) can control the voltage level and the power flow through a bidirectional converter. When the microgrid is working in an islanded mode, this source will act as a “master” remaining the voltage at 300 V and meeting the load demand. If there is a fault in the ESS or the state of charge (SOC) level is not properly to control the microgrid in an islanded mode. There is a voltage controller implemented with a voltage and a current loop as it is shown in Figure 6.
The DG units are interfaced through DC-DC converters to the DC microgrid. The individual droop-based power-sharing in the DC microgrid is represented in Figure 6a. The DC-link voltage of each DC-DC power converter is drooped with the DC generated power (PDCJ) utilizing the droop coefficient mDCj as represented in the equation:
V o j * = V o j n m D C j P D C j
where V o j * , V o j n are the reference and no-load DC-link voltages of the DC-DC power converter, whereas the subscript j refers to a DG unit in the DC microgrid. The delivered DC power from each DG unit (Pacj) is wirelessly specified to supply the connected DC-load (PDCL), following the equality
mDC1PDC1 = mDC2PDC2
where PDCL = PDC1 + PDC2.
The primary requirement for a DC microgrid operation is to maintain the common DC-link voltage within a predefined range. Different measures shall be taken by each terminal of DC microgrid according to microgrid operation conditions. Therefore, a reliable and fast control scheme is essential for acknowledging system operation status. The DC-link voltage is a proper indicator of the DC microgrid’s operational condition. An equivalent circuit of the DC-mircogrid, including the BESS and PEV is simplified, as shown in Figure 7, where PDC and PAC represent to the total power flow on the DC side of microgrid (PV panel, Battery bank and DC/DC power converters) and the AC-side (inverter and the AC load). From Figure 7, the instantaneous power relationship in the DC-microgrid is described by
P d c ( t ) = P B E S S ( t ) + p c ( t ) + P P E V ( t ) + P a c ( t )
where PDC is the DC power delivered by the DC-DC converter to the DC-microgrid, PBESS is the power supplied to (or by) the BESS, Pc is the power to the DC-link capacitor, PPEV is the power required for charging the plug-in electric vehicles PEV, and PAC is the power required by the inverter for supplying the AC load.

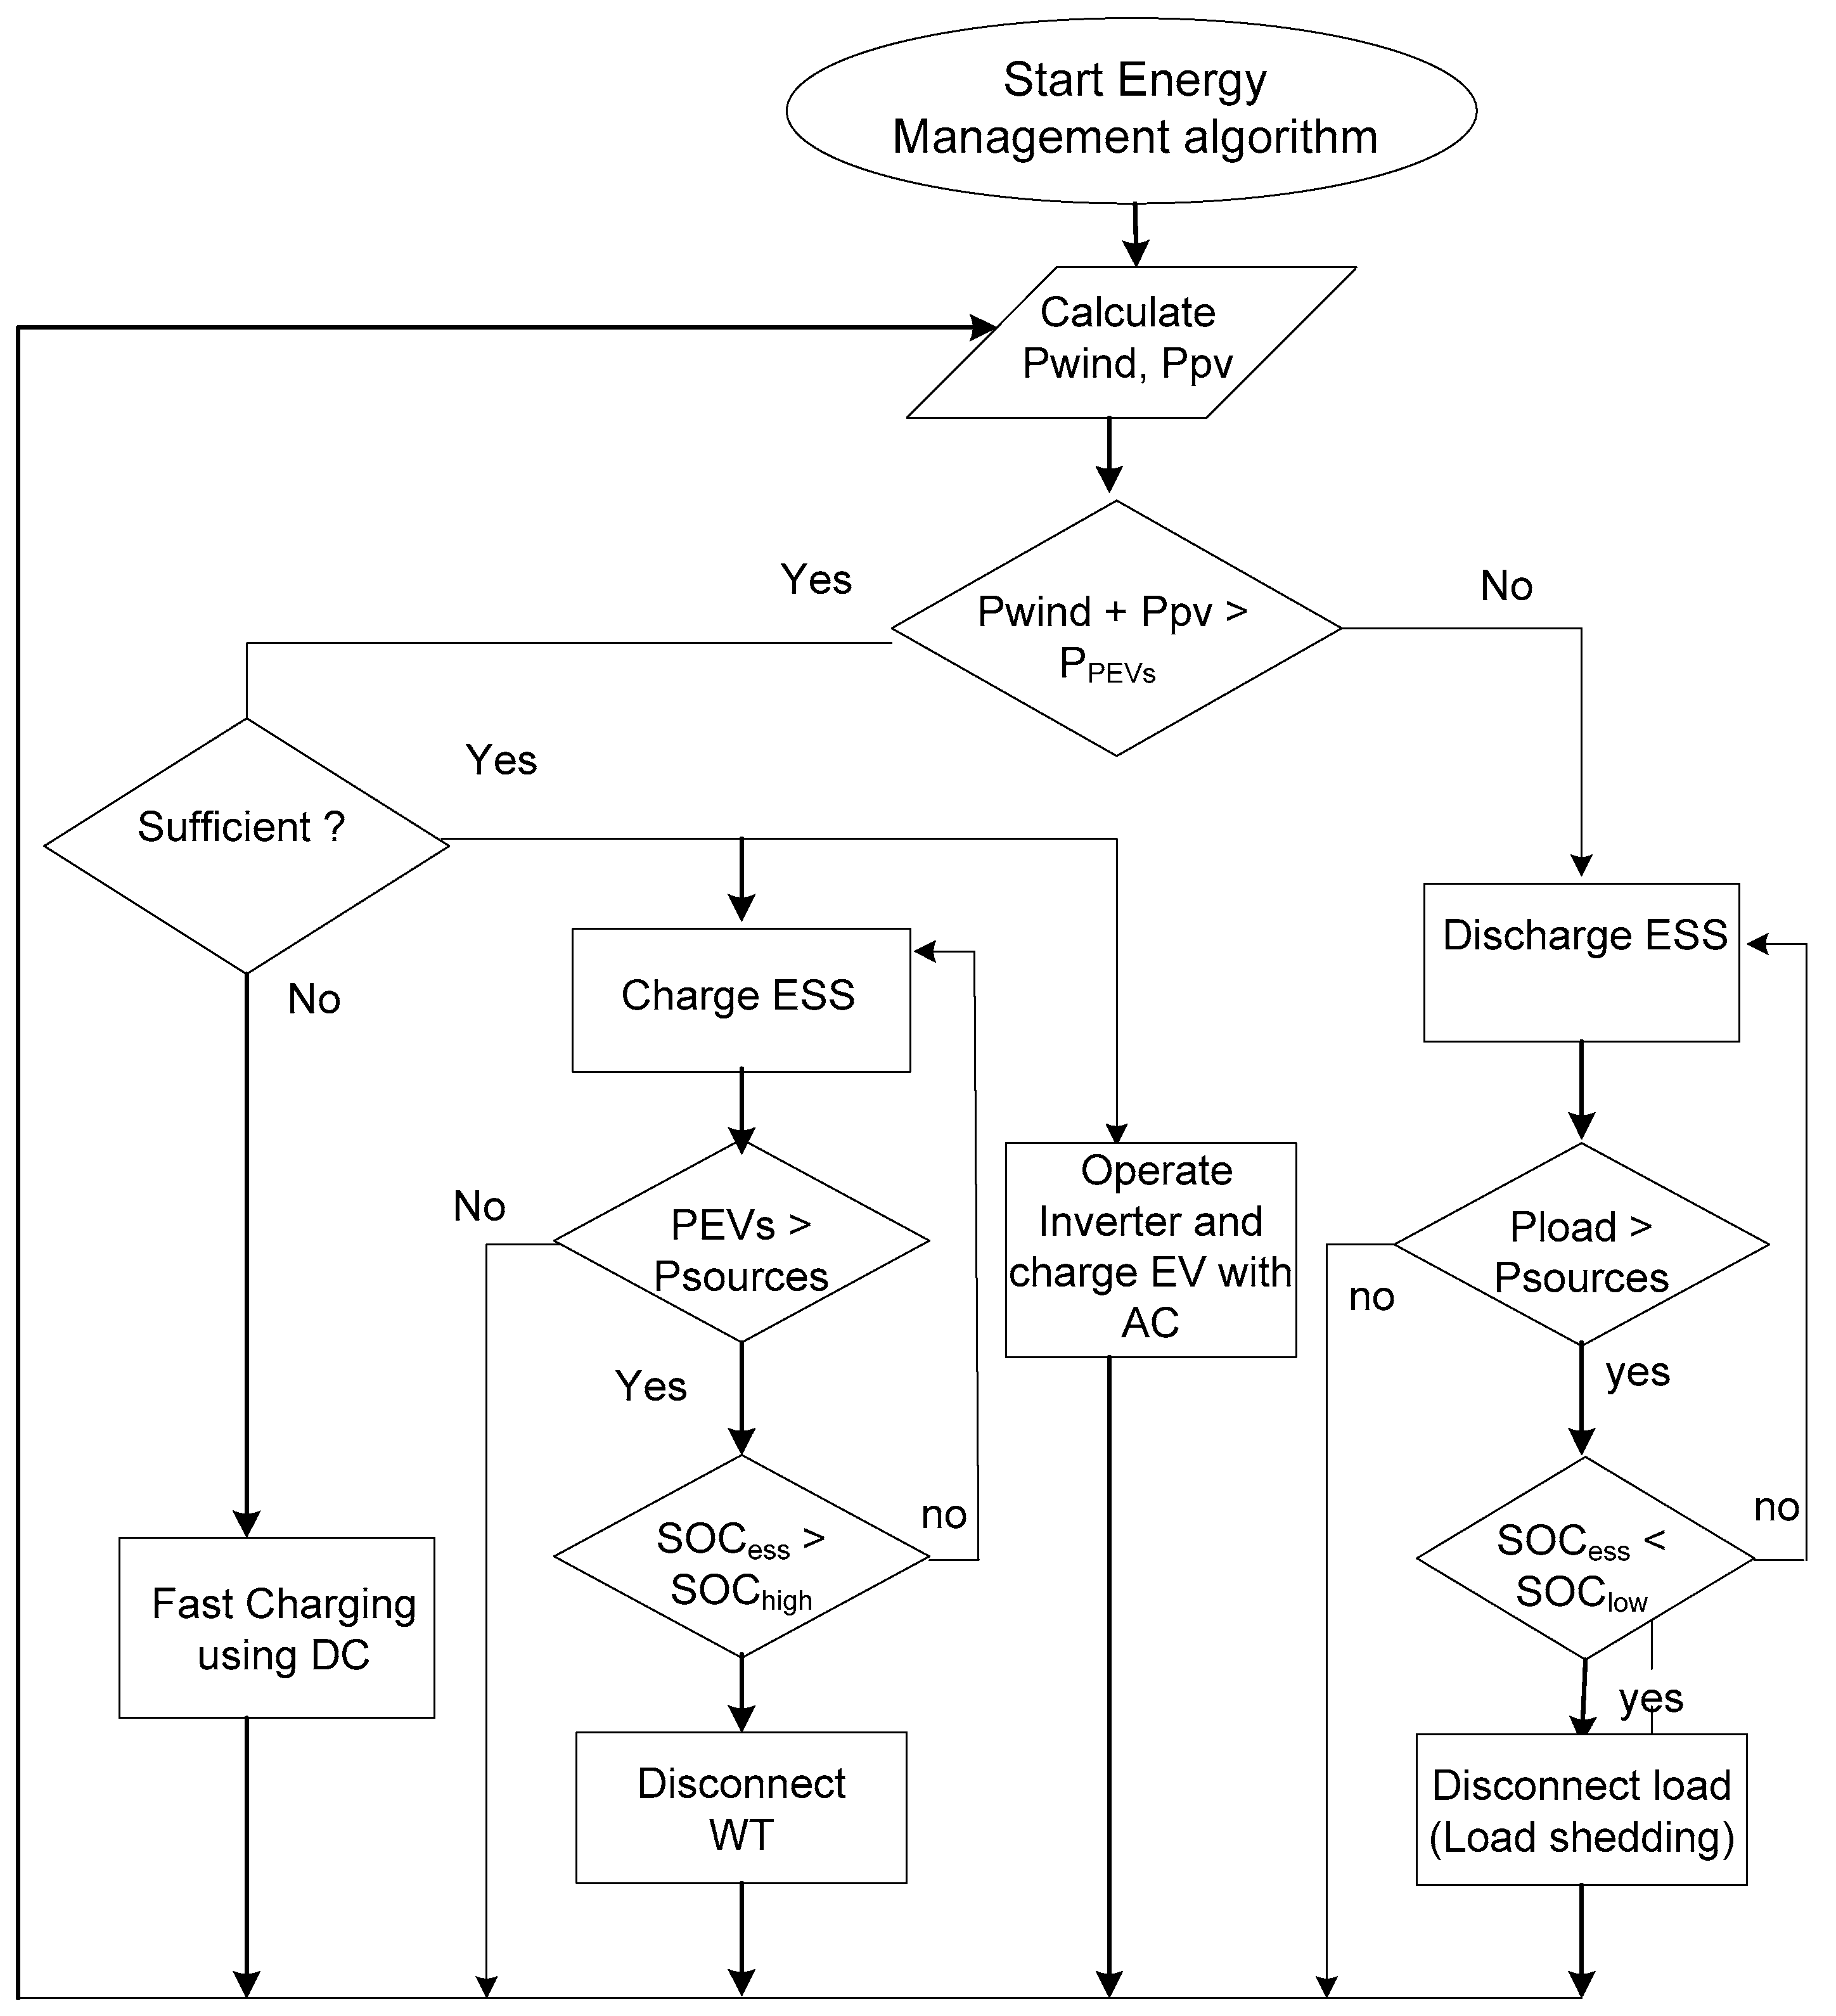
4. Energy Management Control Strategy

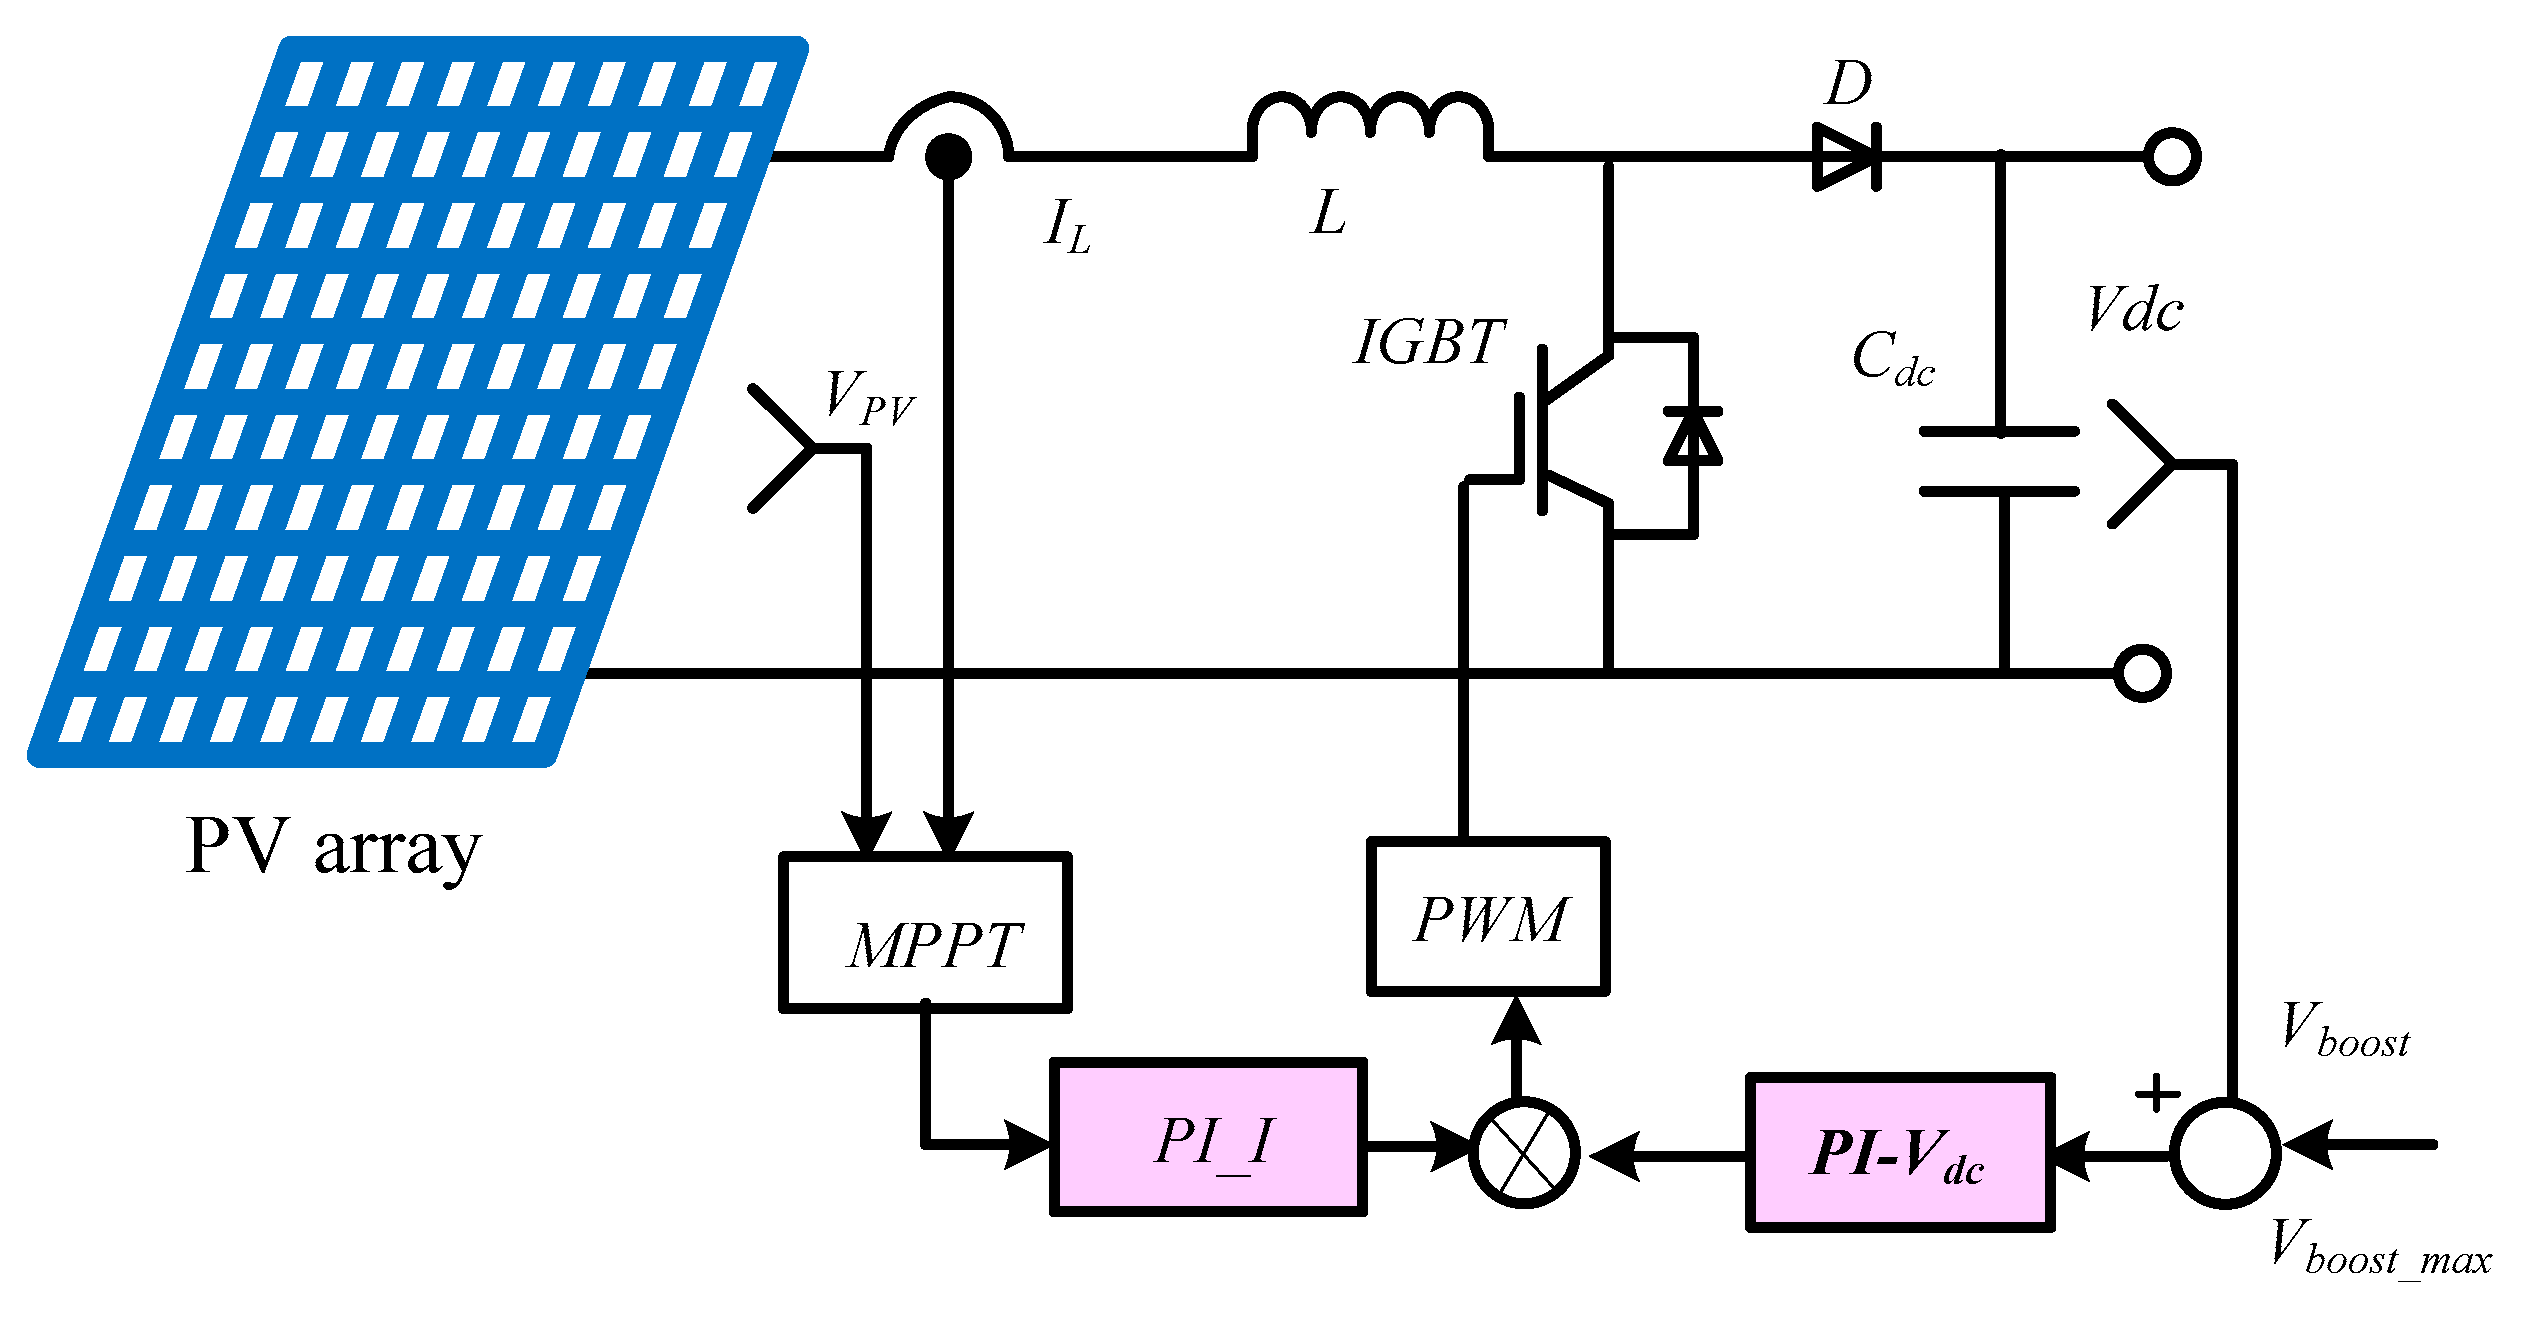
The amount of energy that can be produced by the PV or wind generator is calculated using the input data, such as hourly solar irradiance, wind speed, and ambient temperature. The total value of generated output power (Psources) is compared with the load demand energy (PPEVs) to estimate the energy flow distribution between the energy storage unit and the loads. Surplus energy is stored in the battery banks. The control strategy of the hybrid PV-wind charging station is described by the flowchart in Figure 8. According to Figure 8, the control strategy is applied according to four different cases as follows:
If Psourcs (Ppv + Pw) > PPEVs, then PESU = PsourcesPPEVs. If the irradiance level and wind speed are high enough, the output power empowers the connected electric vehicles, and the exceeding power is stored in the battery bank.
If Psourcs·(Ppv + Pw) = PPEVs, then PESU = 0. That is, if the irradiance level and wind speed are just enough, to empowers the connected electric vehicles and no excess power to charge the battery bank.
If Psources < PPEVs and PPEVsPsourcesPESU, then PPEVsPsources = PESU. That is, if the PV and wind generators cannot supply the load, then the load is supplied directly from the DC-microgrid, and the battery converter is switched on.
If Psources < PEVS and PEVSPsources > PESU, in this case, the energy stored in the battery bank is not enough to charge connected PEVs. Then the PEVS and battery bank are disconnected.
The supervisory controller is divided into two main functions. The first function identifies the mode of operation according to the conditions and situation of individual microgrid components. The second function is integrated into intelligent systems, such as converters and inverters that determine the performance of individual components in that mode of operation. The switch over in the battery charging mode takes place either when the state of charge of the battery is lower than the minimum SOClow or when there is a sudden decrease in the required power for load and state of charge of the battery is lower than maximum SOChigh. Therefore, when loading power decreases, the surplus power is utilized to charge the batteries if it is not fully charged. The individual components can be controlled easily using a built-in controller, such as the DC-DC converter controller. Thus, the energy management system (EMS) is responsible for achieving the optimal operation of the DC microgrid.
The energy management control algorithms overcome the unbalance between power produced from distributed generation (DG) units and load. This can be done when the SOCs of ESS are sufficient. In the case of ESS failure or an inappropriate SOC value, the master unit becomes the wind turbine. In case of that, the load is greater than the available energy production, and the controller of the DC-microgrid is not able to balance the power flow of the system, the solution will be the load shedding. In case that the power generated by the sources is bigger than the load consumption, one of the distributed generators will be disconnected from the microgrid.
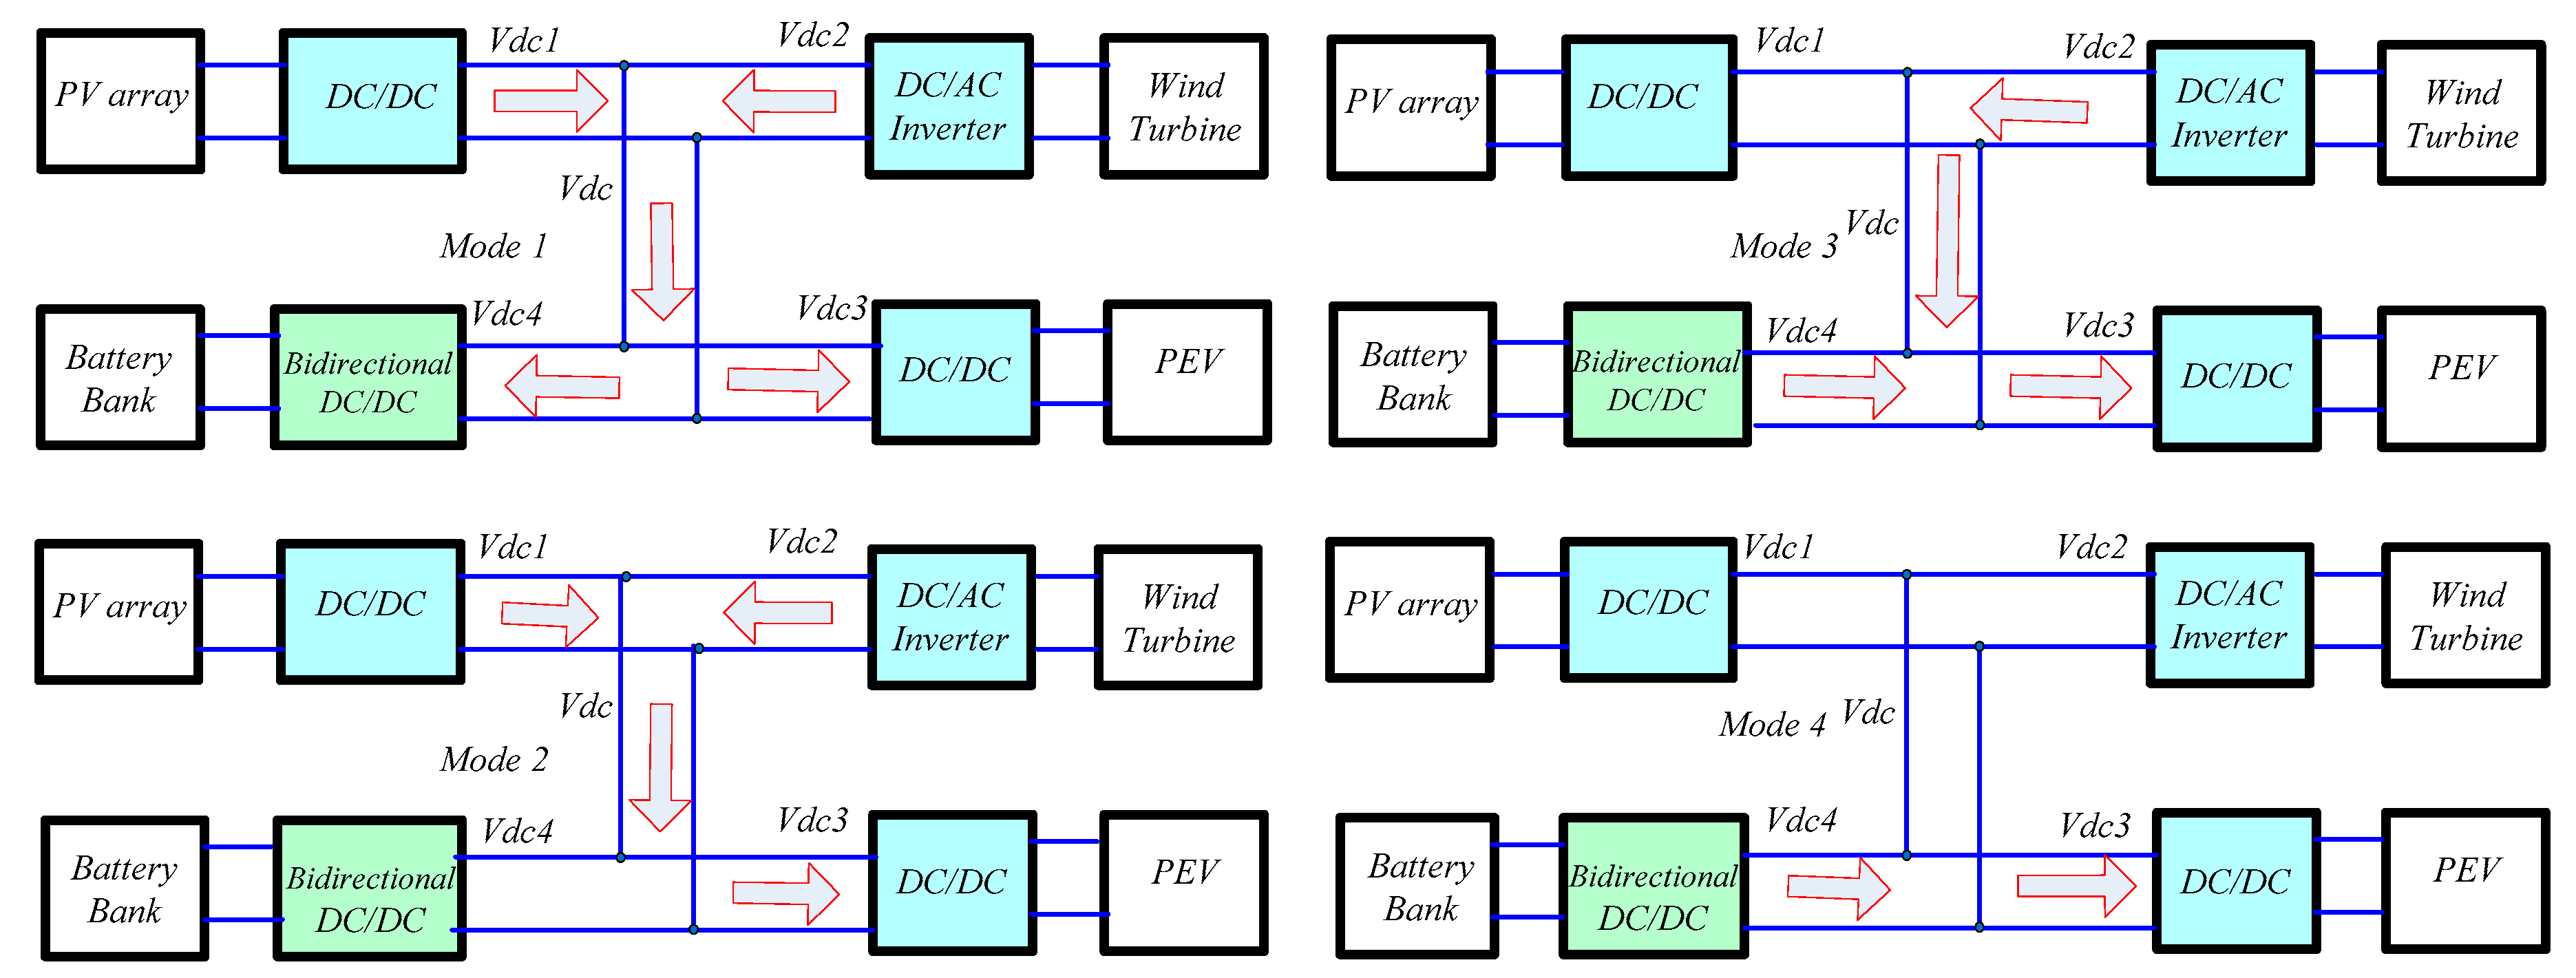
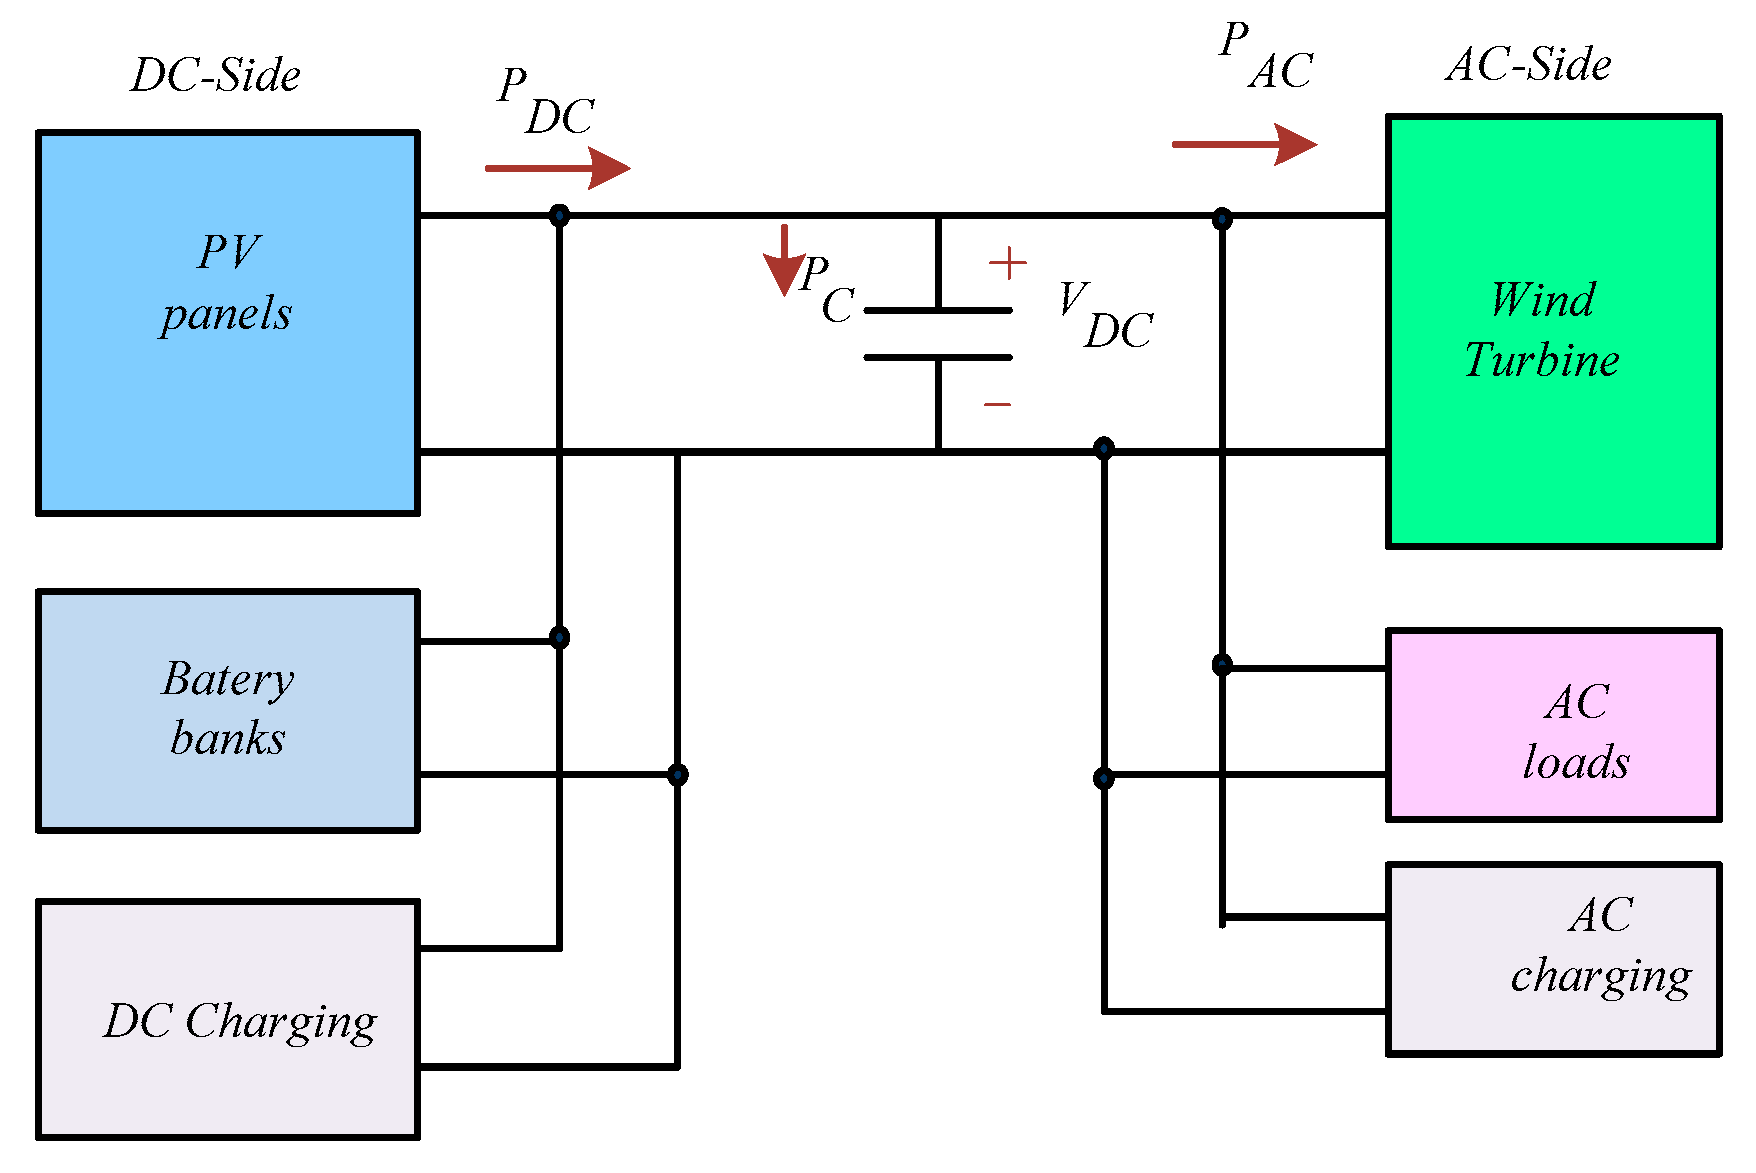
The operation of the charging station DC-microgrid can be divided into four operation modes. The power flow direction is changing during various operation modes of the DC-microgrid based charging station, as illustrated in Figure 9. These modes of operation can be explained as follows:
Mode 1: VDCVDC3: PEV charging and battery bank charging mode
The PV panels produce enough power, and this appears in an increase of the DC-link voltage to be higher than VDC3. This additional energy produced by the PV panels and the wind turbine is supplied to the batteries through a bidirectional DC-DC converter. As soon as the PEVs are fully charged, all the power produced by the PV and wind sources is delivered to the battery banks.
Mode 2: VDC1 > VDC > VDC3: Charging by PV power
At this operating mode, the PEV is charged using the power generated by the PV system. In this case, the controller ensures that the PEV battery is not exceeding the over-charging limit. Thus, the controller terminates PEV charging when PEV voltage exceeds VBH (the voltage relating to 95 % state of charge of the PEV battery). This interval continues as long as the value of DC-link voltage is in a range between VDC1 and VDC3.
Mode 3: VDC3VDC < VDC2: Wind turbine supplying power and battery bank discharging
During this mode, the power produced by the wind turbine is less than the required power for charging the PEV. Therefore, the whole power produced by the wind turbine is transferred to the PEV, and the additional amount is supplied by the battery bank. However, the DC-link voltage changes with the variation in solar irradiation and wind speed. Thus, any variation in the DC-link voltage at the DC-microgrid is monitored by the controller to produce a proper voltage at the output of the bidirectional DC-DC power converter. The renewable energy sources continue charging the PEV; whereas, the battery banks cover the peak load demand.
Mode 4: Case-1: VDC < VDC-1 and IDMD < IDMD-max
In this mode, the PV panels and wind turbines do not produce any power, due to inconvenient weather conditions. The boost DC-DC power converter is isolated, and the battery bank supplies the power required for charging PEVs. At any instant, during this mode, if the DC-link voltage VDC exceeds VDC-1, the controller moves the system to work in Mode 2. The bidirectional DC-DC power converter regulates the output current and voltage for charging the PEV battery. As the battery bank is at off-peak, it continues to supply energy until the vehicles are completely charged. The controller terminates the charging process of PEV by disabling the DC-DC converter when the battery voltage VBat exceeds its maximum value VBH.
Case-2: VDC < VDC-1 and IDMDIDMD-max
This case is similar to case 1, but local demand exceeds the maximum demand of the microgrid. During this period, the PEV can be charged using the stored energy in the BESS if it is enough to cater to the charging process of PEVs. This continues until the state of charge of BESS (battery bank) decreases below its minimum value (SOC < SOCmin). At this moment, the charging process of PEVs is stopped tentatively by de-activating the bidirectional DC-DC power converter. Once the renewable energy power is back to off-peak conditions (i.e., IDMD < IDMD-max) the charging process of the PEVs is restored, and the controller supervises charging parameters.
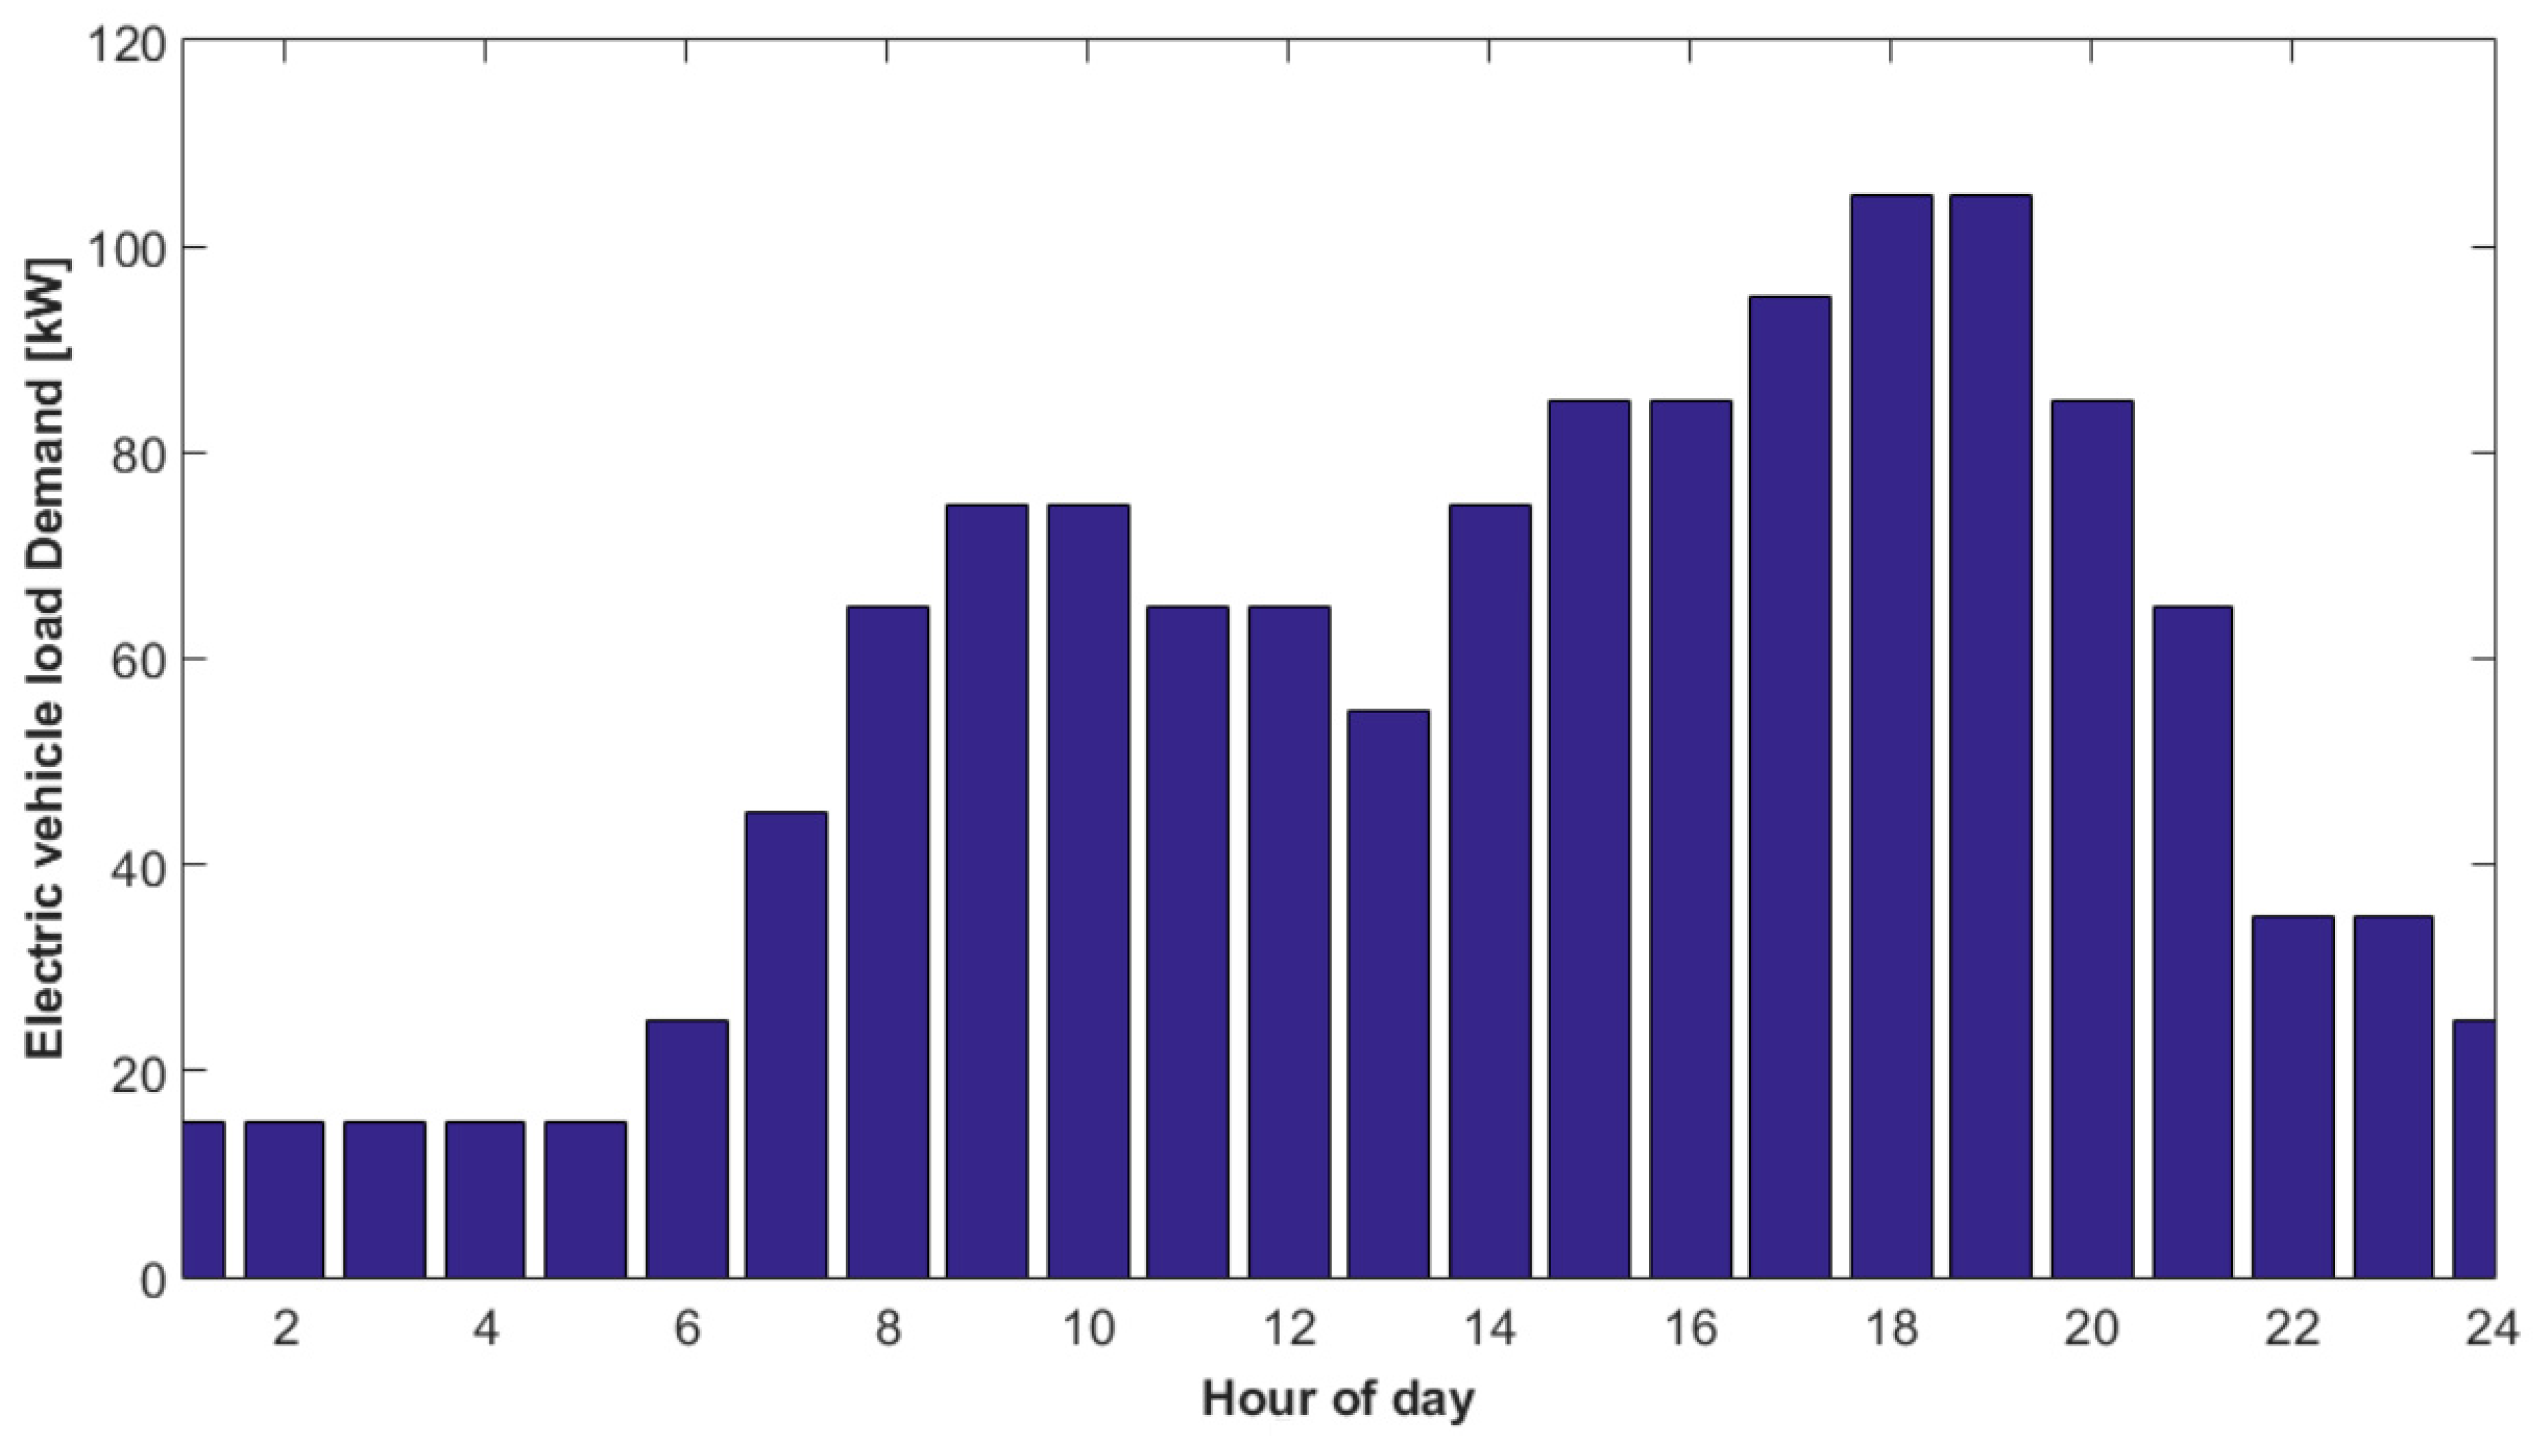
An example of the electric vehicle load supplied by the DC-microgrid is shown in Figure 10 for one day period. 
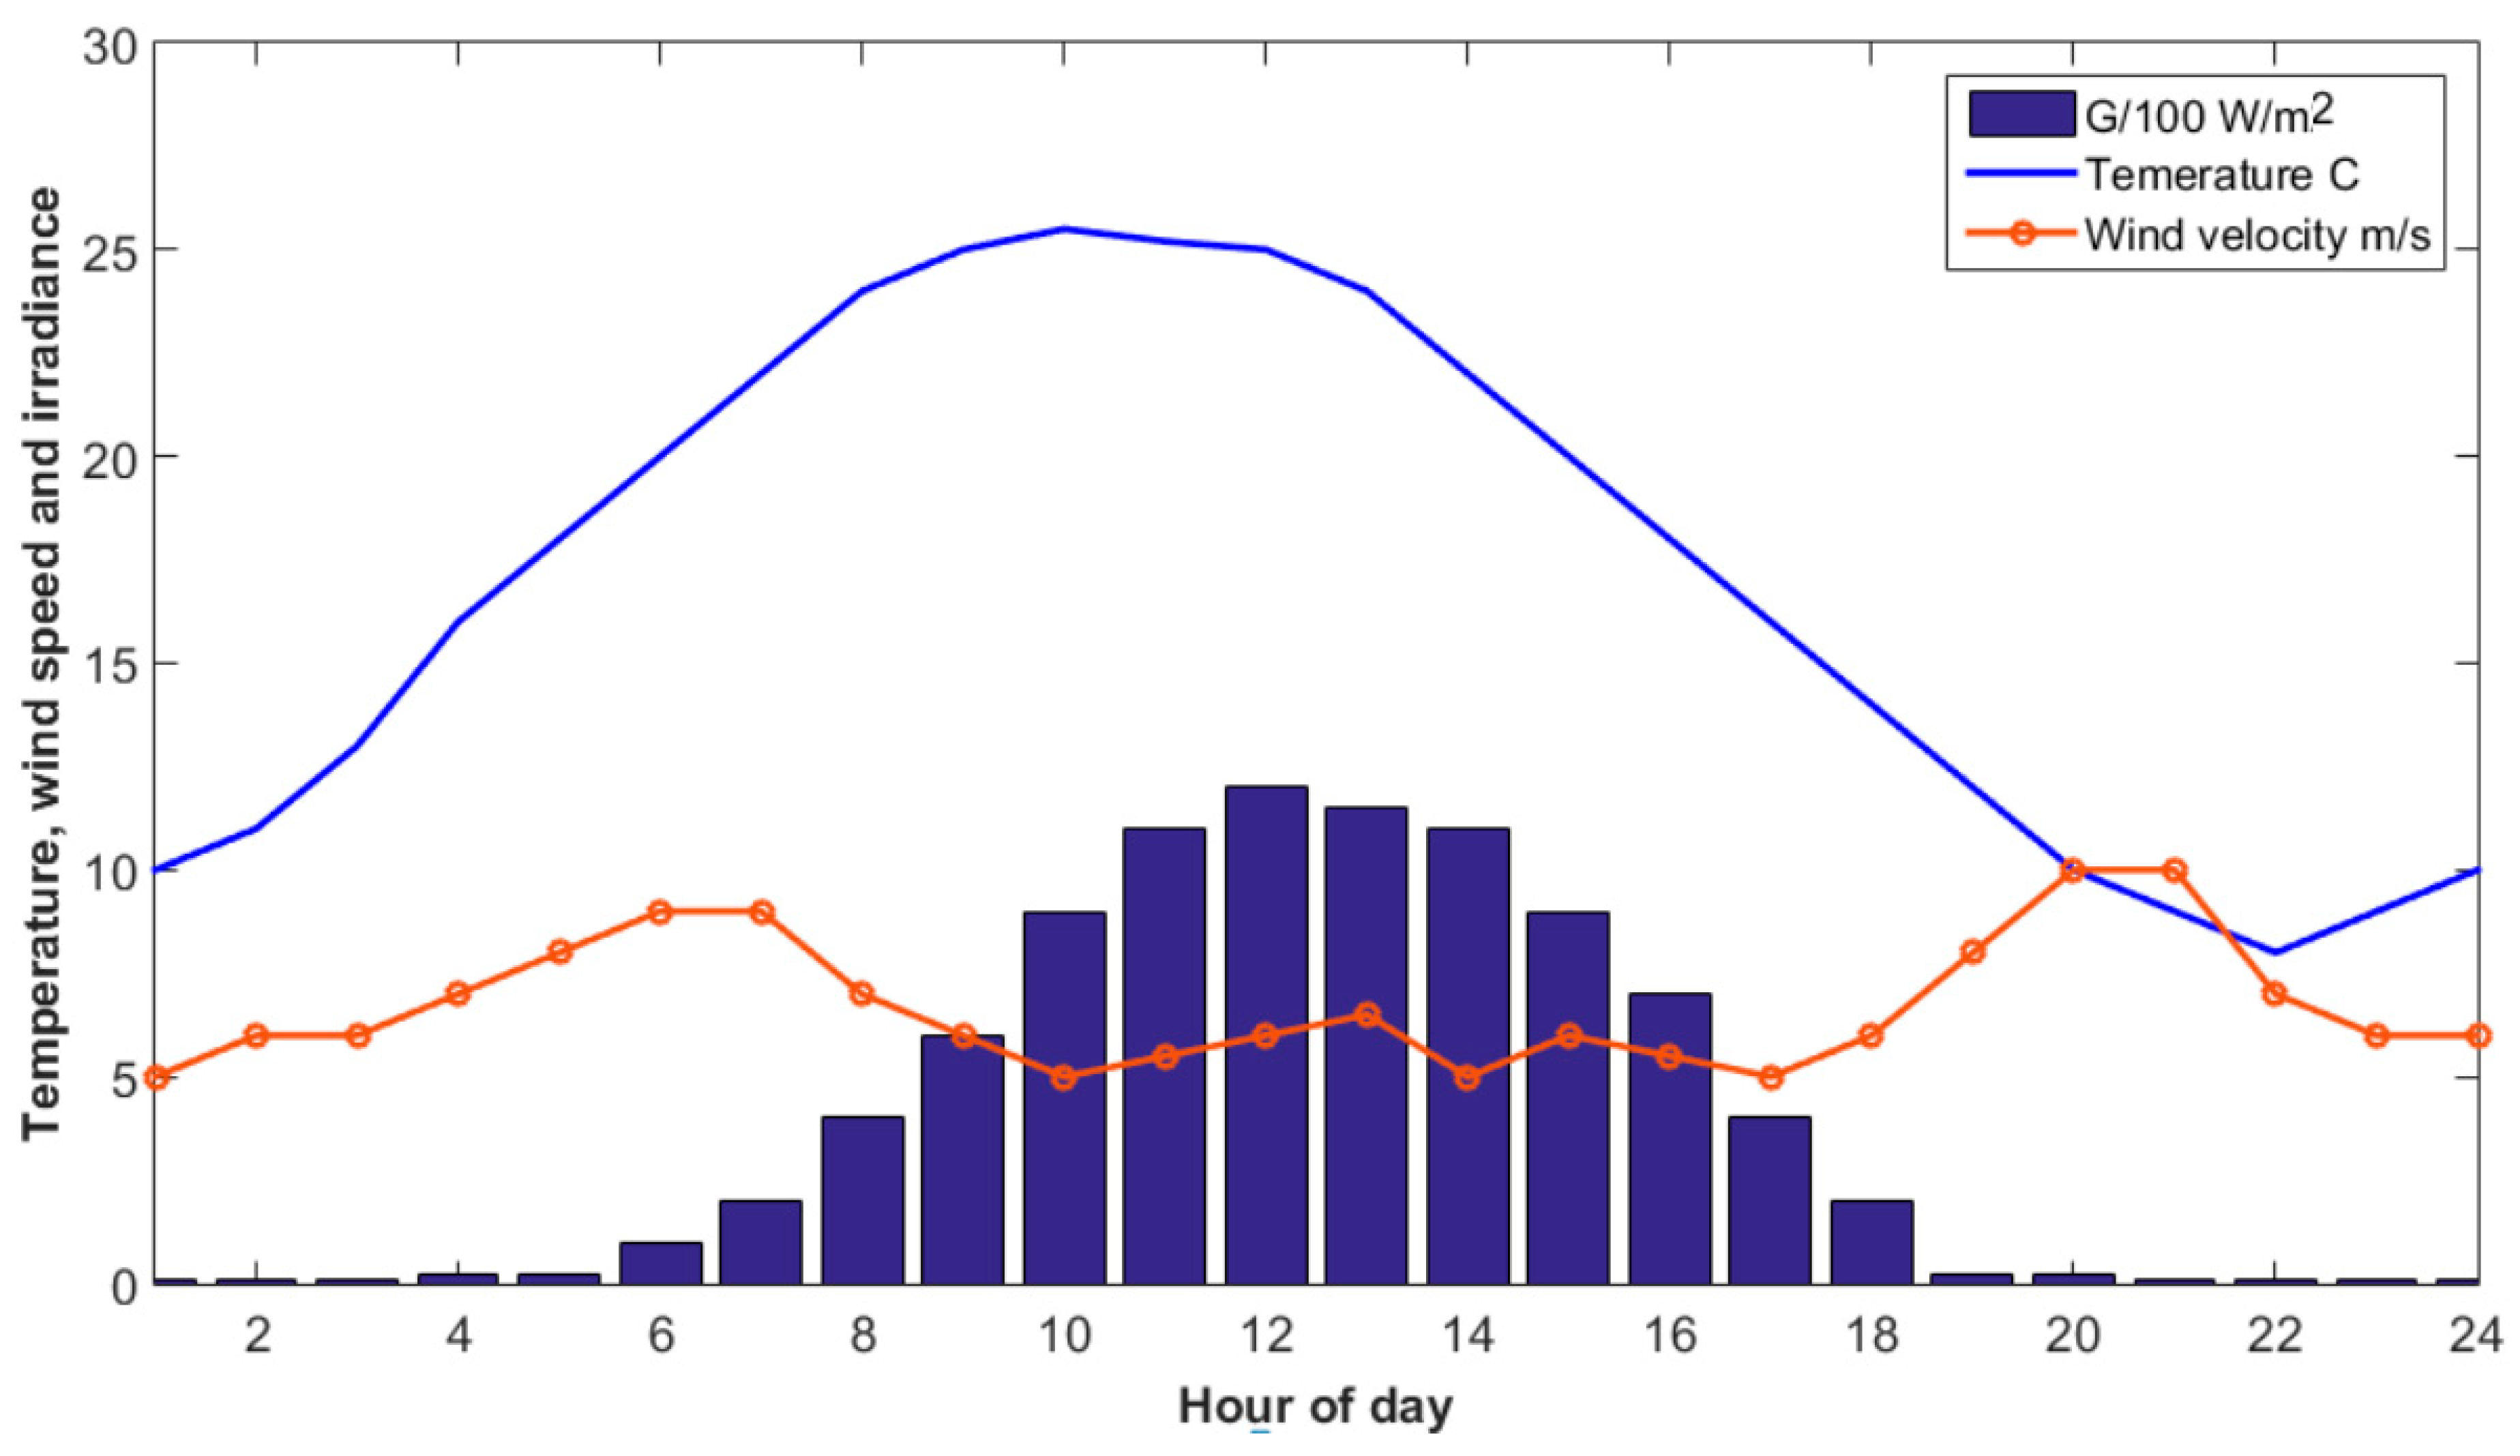
Figure 11 shows the solar irradiance, temperature and wind velocity profiles during a typical day in Sohag city, Egypt. The wind speed profile starts with 5 m/s at time 1 h, rises to 9 m/s at time 6 h, then falls down to 5 m/s at time 10 h, etc., as shown in Figure 11. The generators meet the load during the night. In the morning when the sun comes up, and the PV starts generating, the PV charges the BESS until the PV generation and the BESS state of charge are high enough that they can meet the load on their own without the generators. The load is then transferred to the PV/BESS system, and the generators turn off. The BESS and PV power the load together from 7–8 a.m. when PV generation is not yet high enough to meet the load by itself. At 8 a.m., when PV can fully meet the load, the BESS stops discharging. Excess PV generation is used first to charge the BESS and then remaining excess is curtailed. In the evening, PV generation decreases, until the PV and BESS can no longer meet the full load. Some of the PV generation is curtailed because the BESS is already fully charged. At this point, the generators turn on again and supply the load overnight.

5. Simulation Results and Discussion

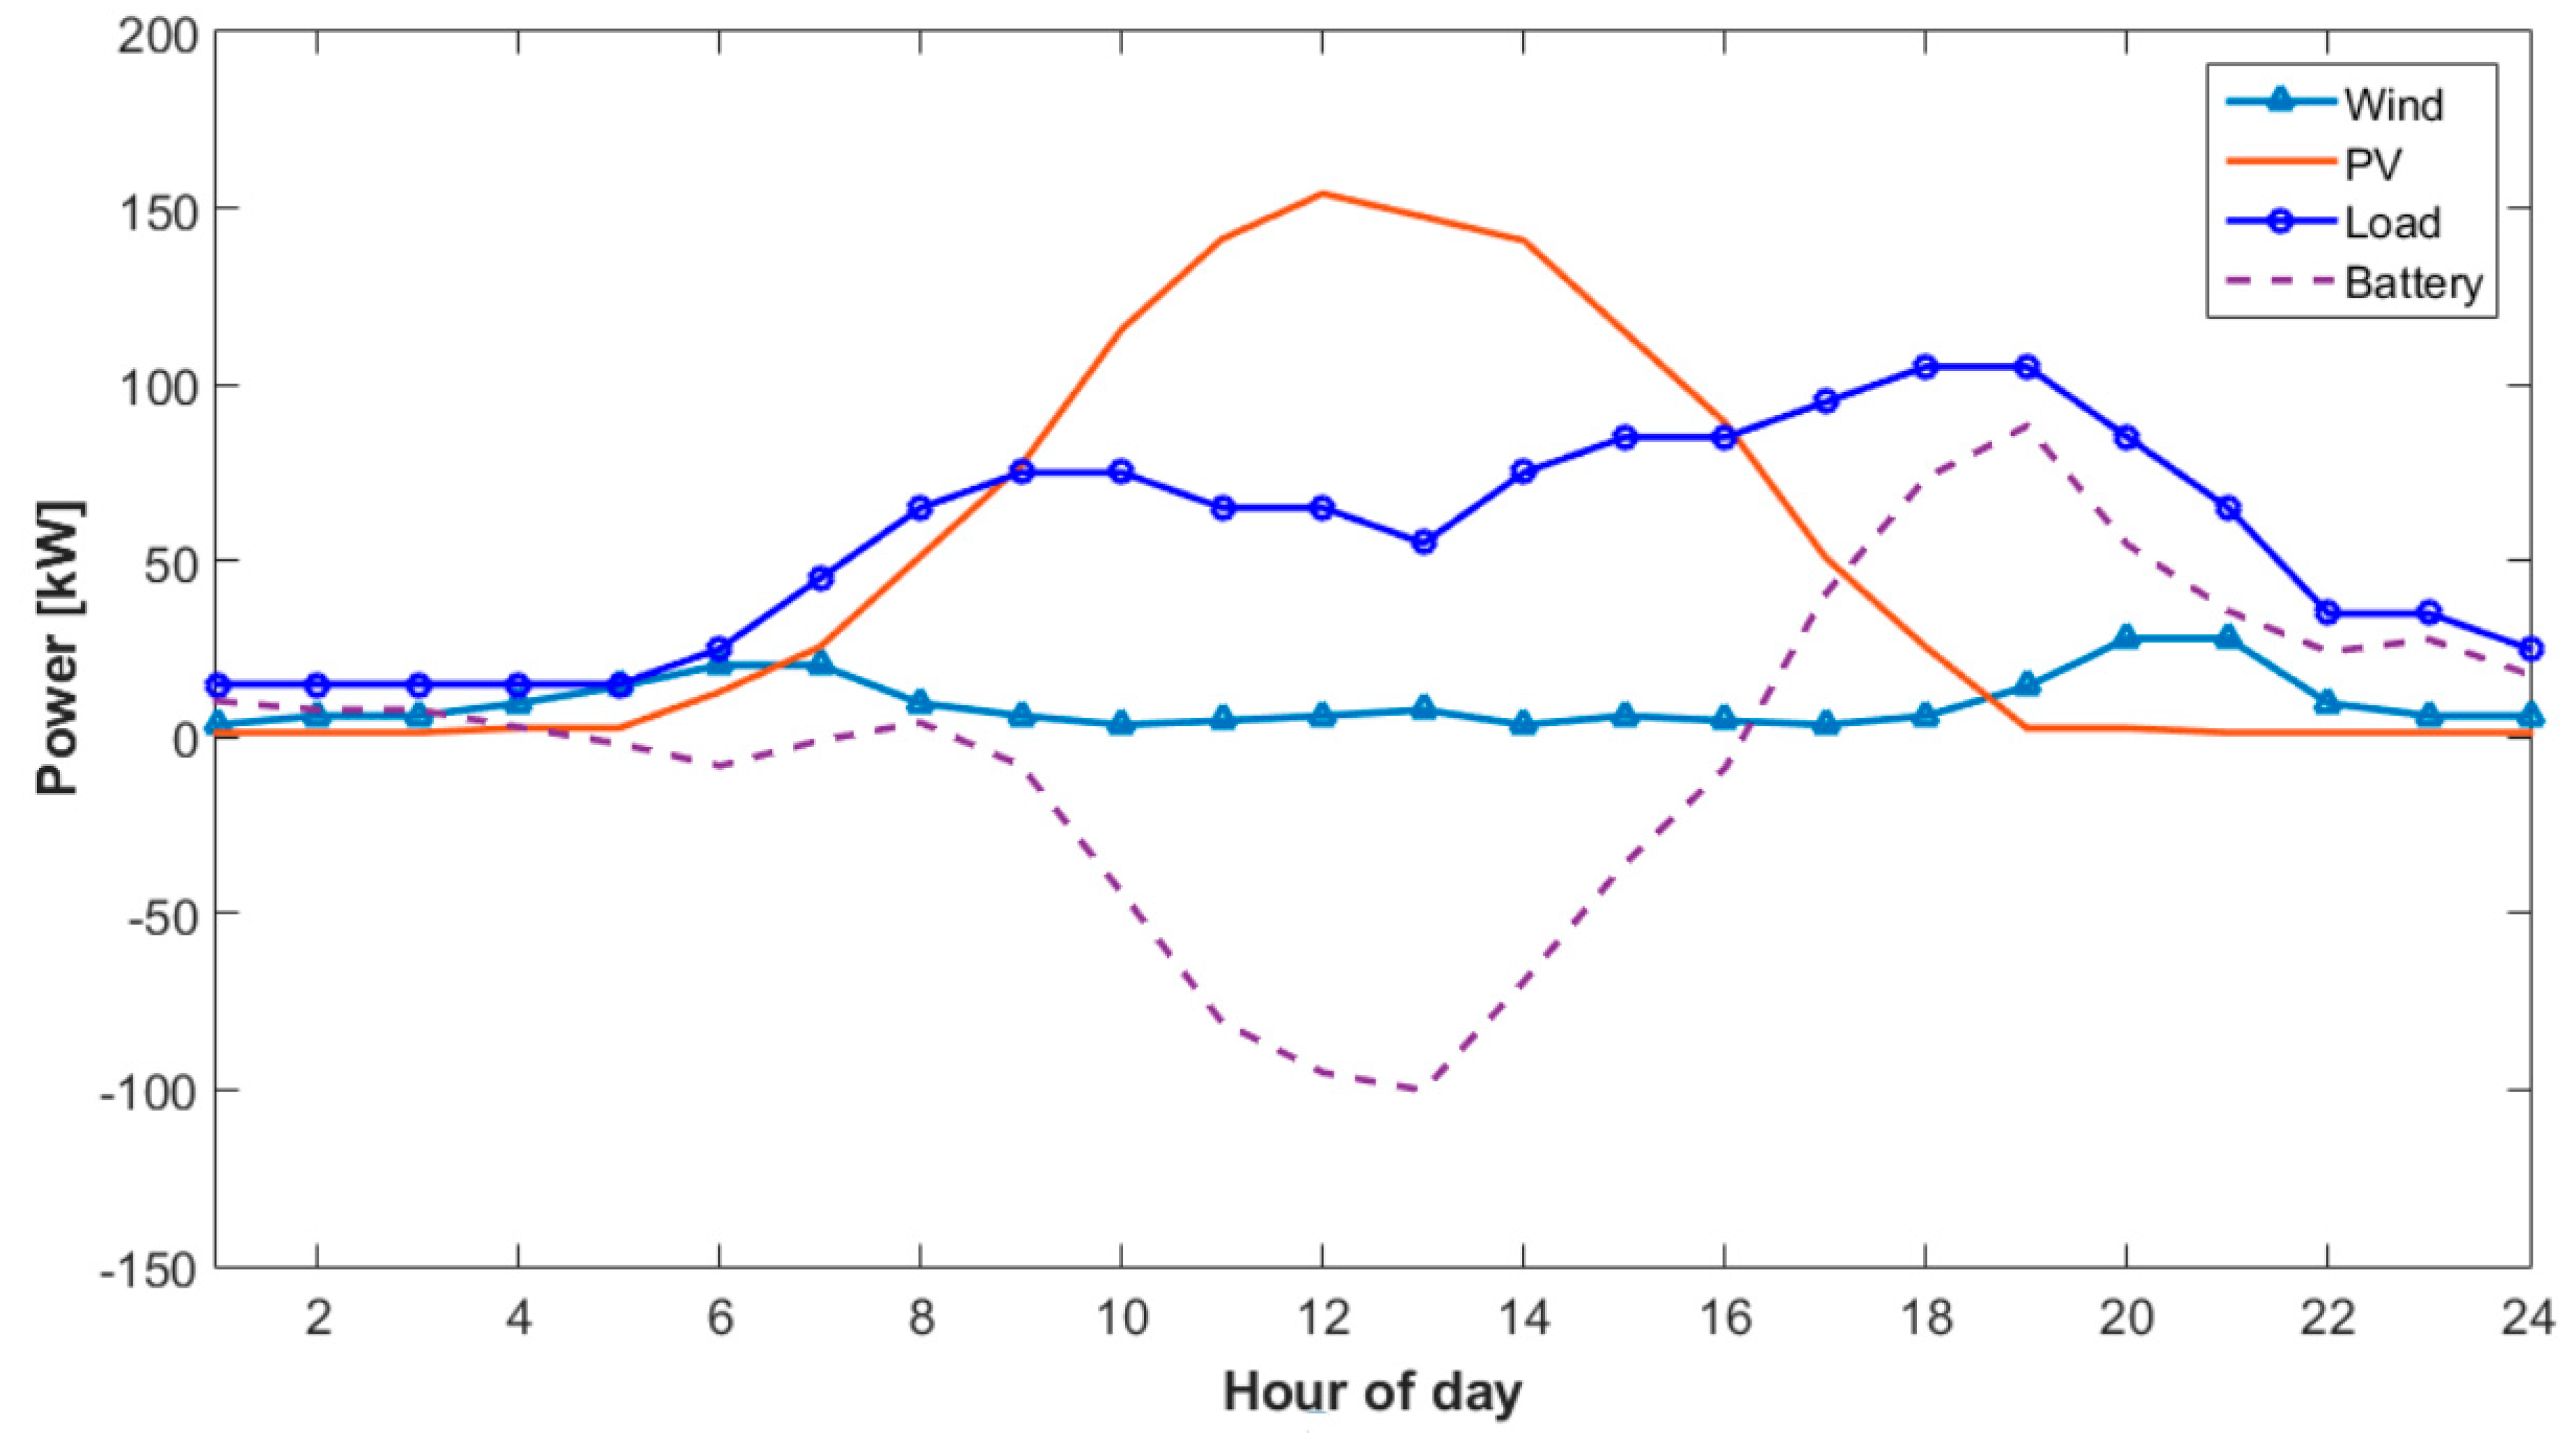
Simulation results are obtained based on the typical daily load profile of the studied EV presented in Figure 11. The calculated produced renewable power and load during a typical day in the studied system is shown in 
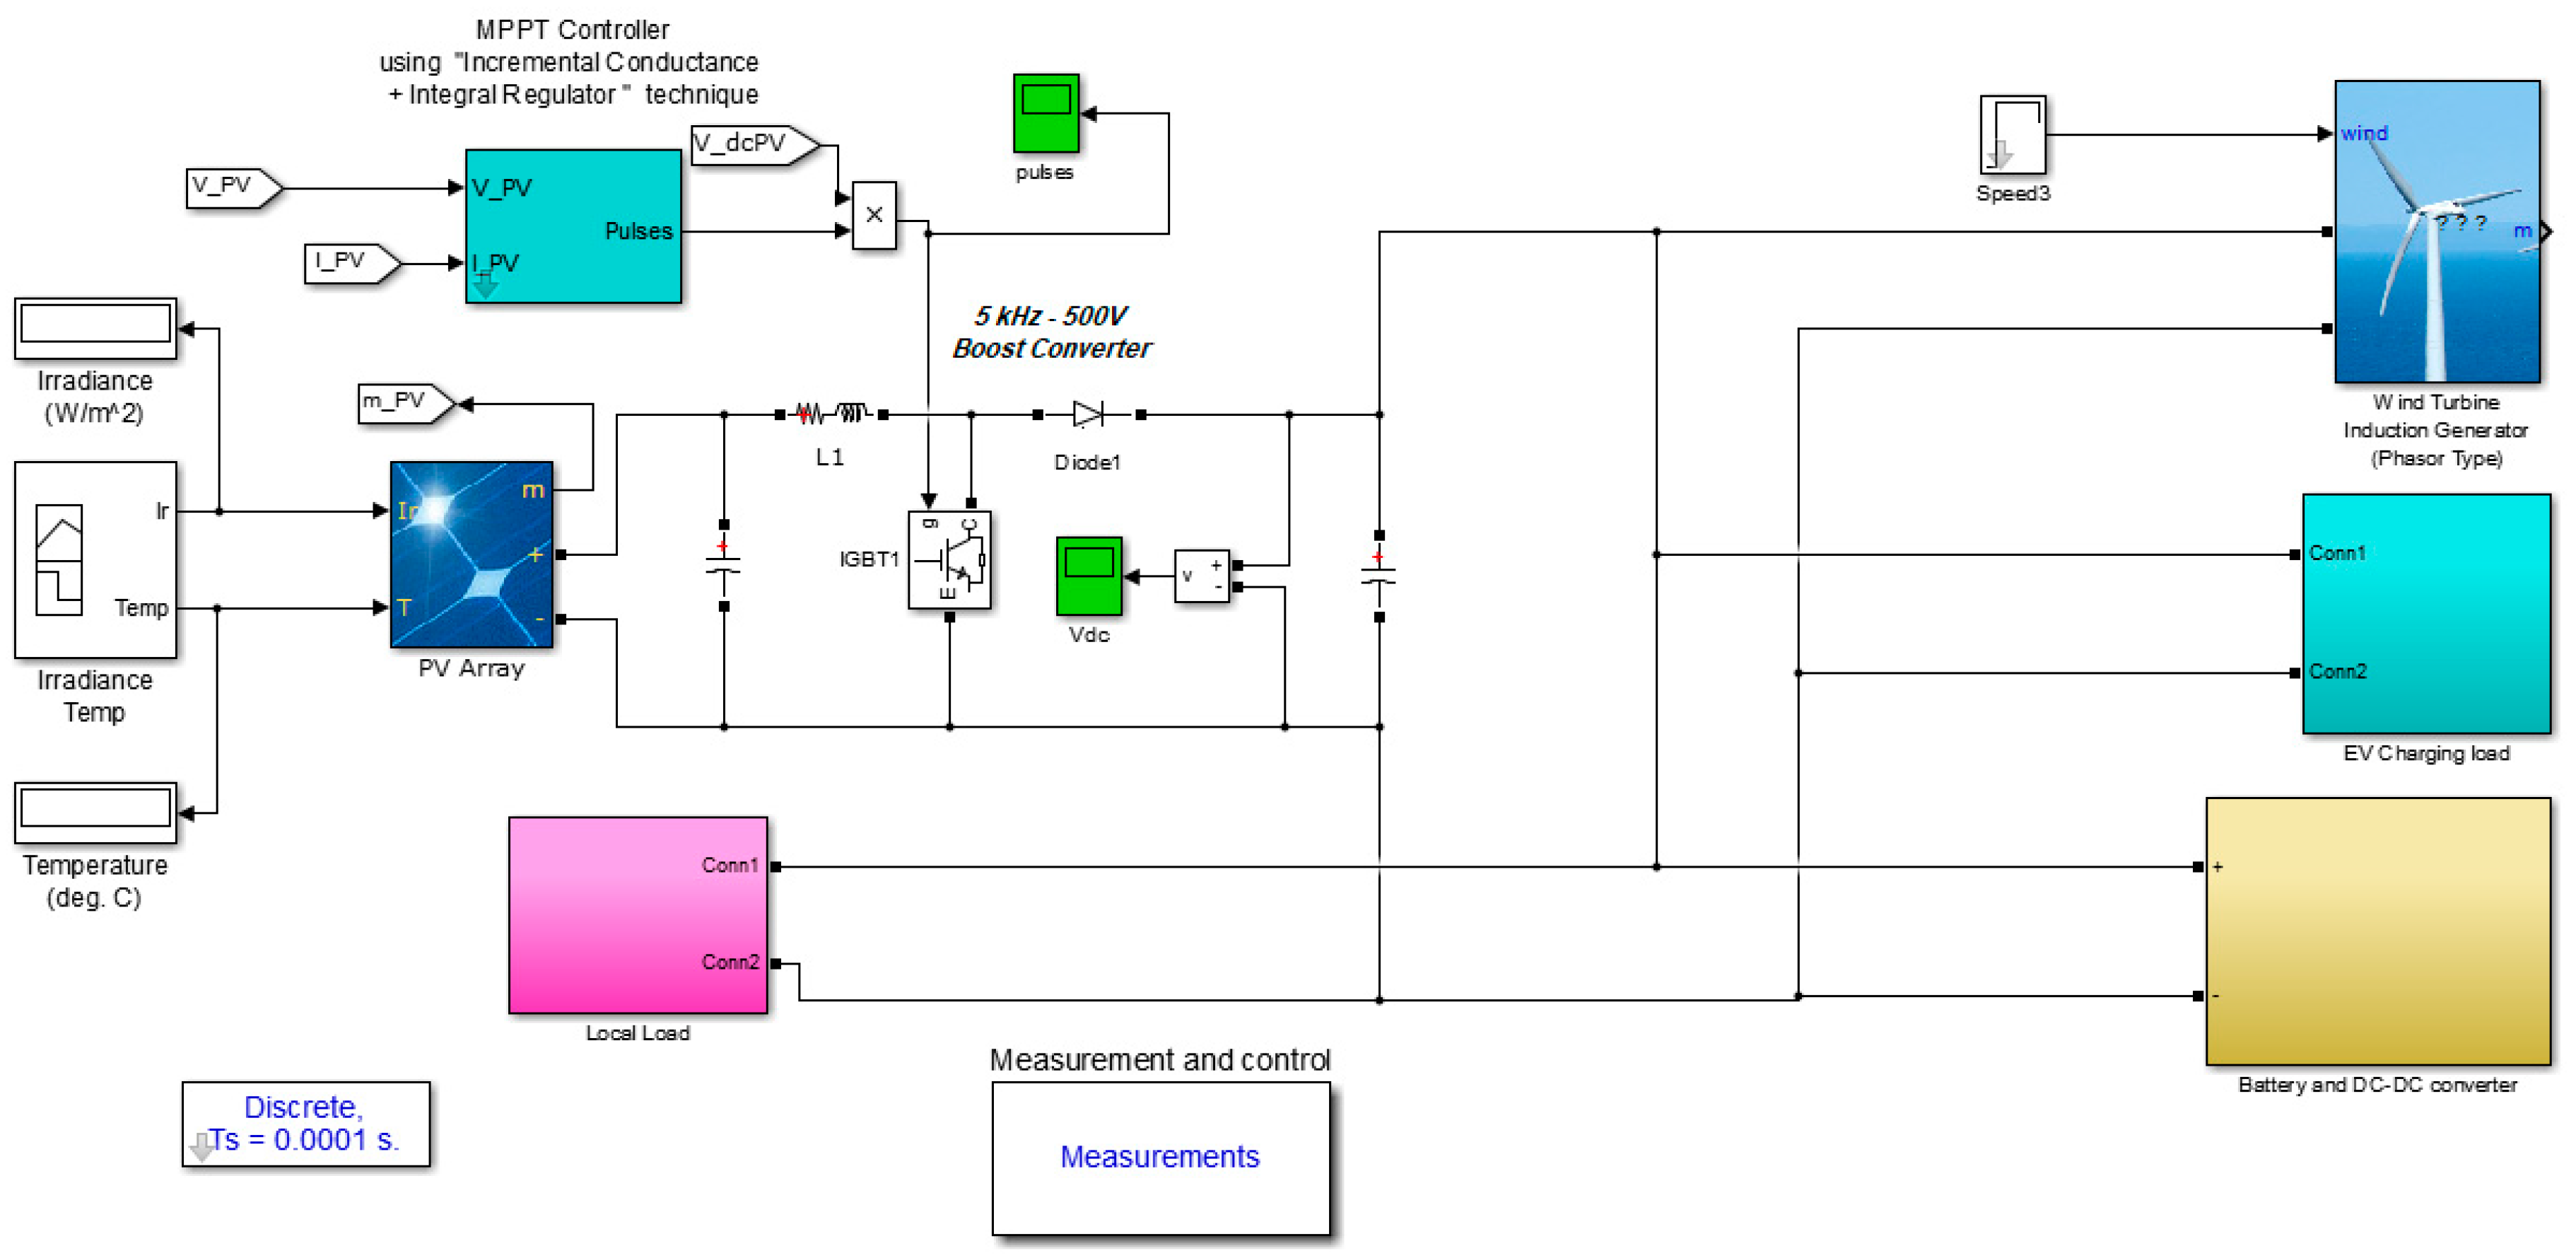
Figure 12. The hybrid system model is verified by implementing the detailed models in a MATLAB/ Simulink environment. This model presents an alternative emergency power system based on lithium-ion batteries. This model also features an energy management system for hybrid electric sources. The energy management system regulates the power between the energy sources and loads according to a predetermined control strategy. The Simulink model of the studied DC microgrid is shown in Figure 13. The specifications of the studied DC-microgrid are shown in Table 3:
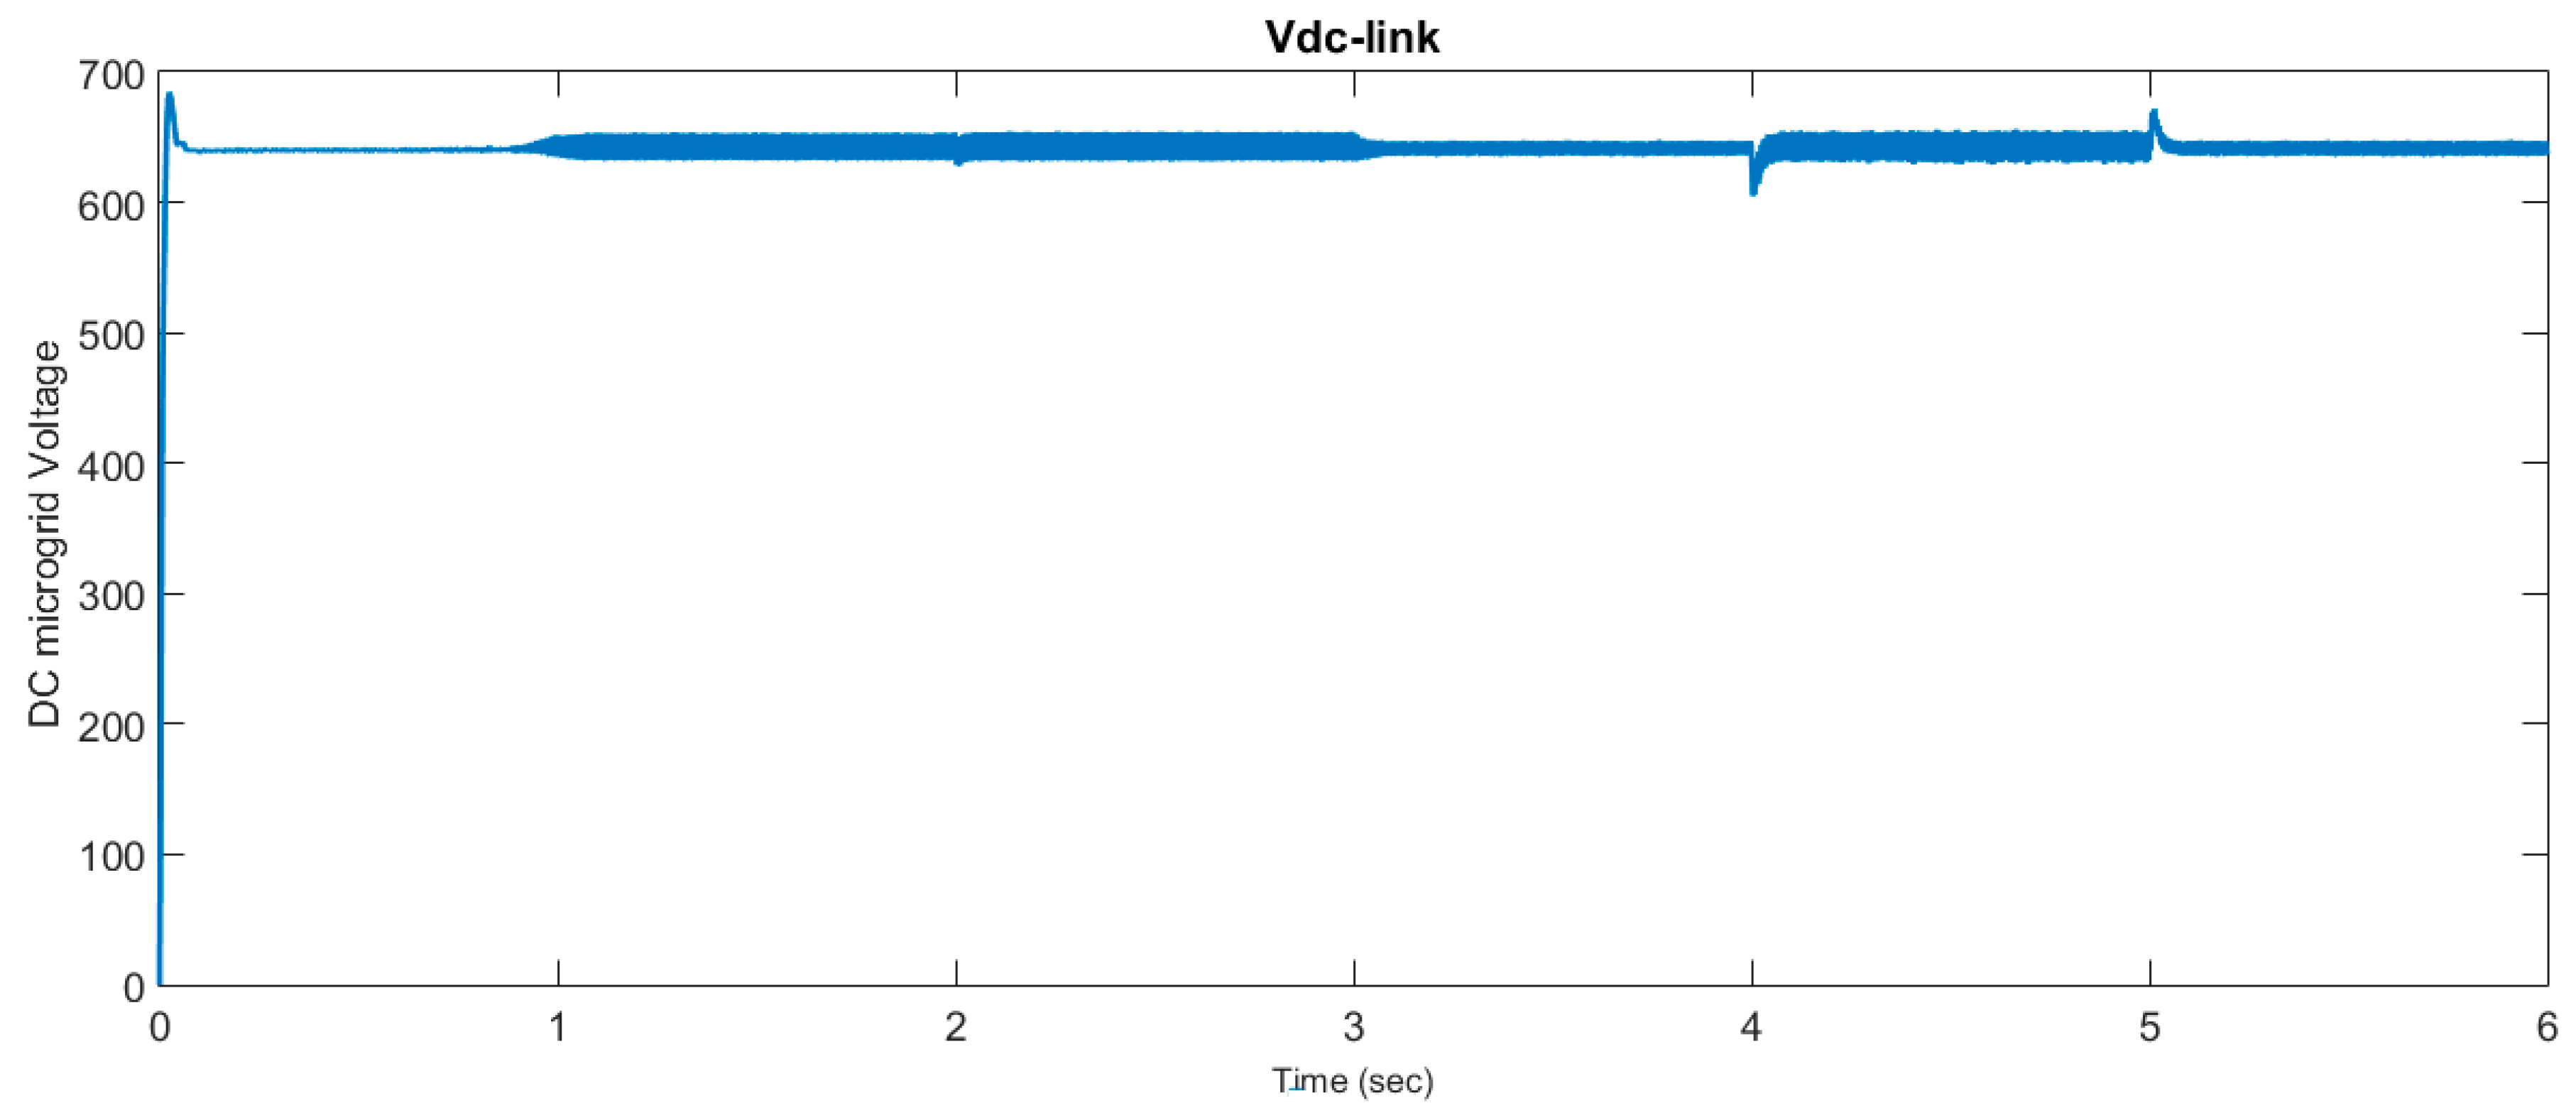
The DC microgrid voltage is shown in Figure 14. The DC-link voltage is an indication for the DC generated power. Figure 15 represents the output voltage and output current of PV panels. The photovoltaic power generation is set to the Maximal Power Point Tracking, which is proportional to the irradiance solar radiation and (W/m2). These typical weather data at intervals of one hour are collected. There is much meteorological software can estimate the solar radiation and the ambient temperature. In this figure, the solar irradiation is reduced from 1000 W m 2 to 850 W m 2 
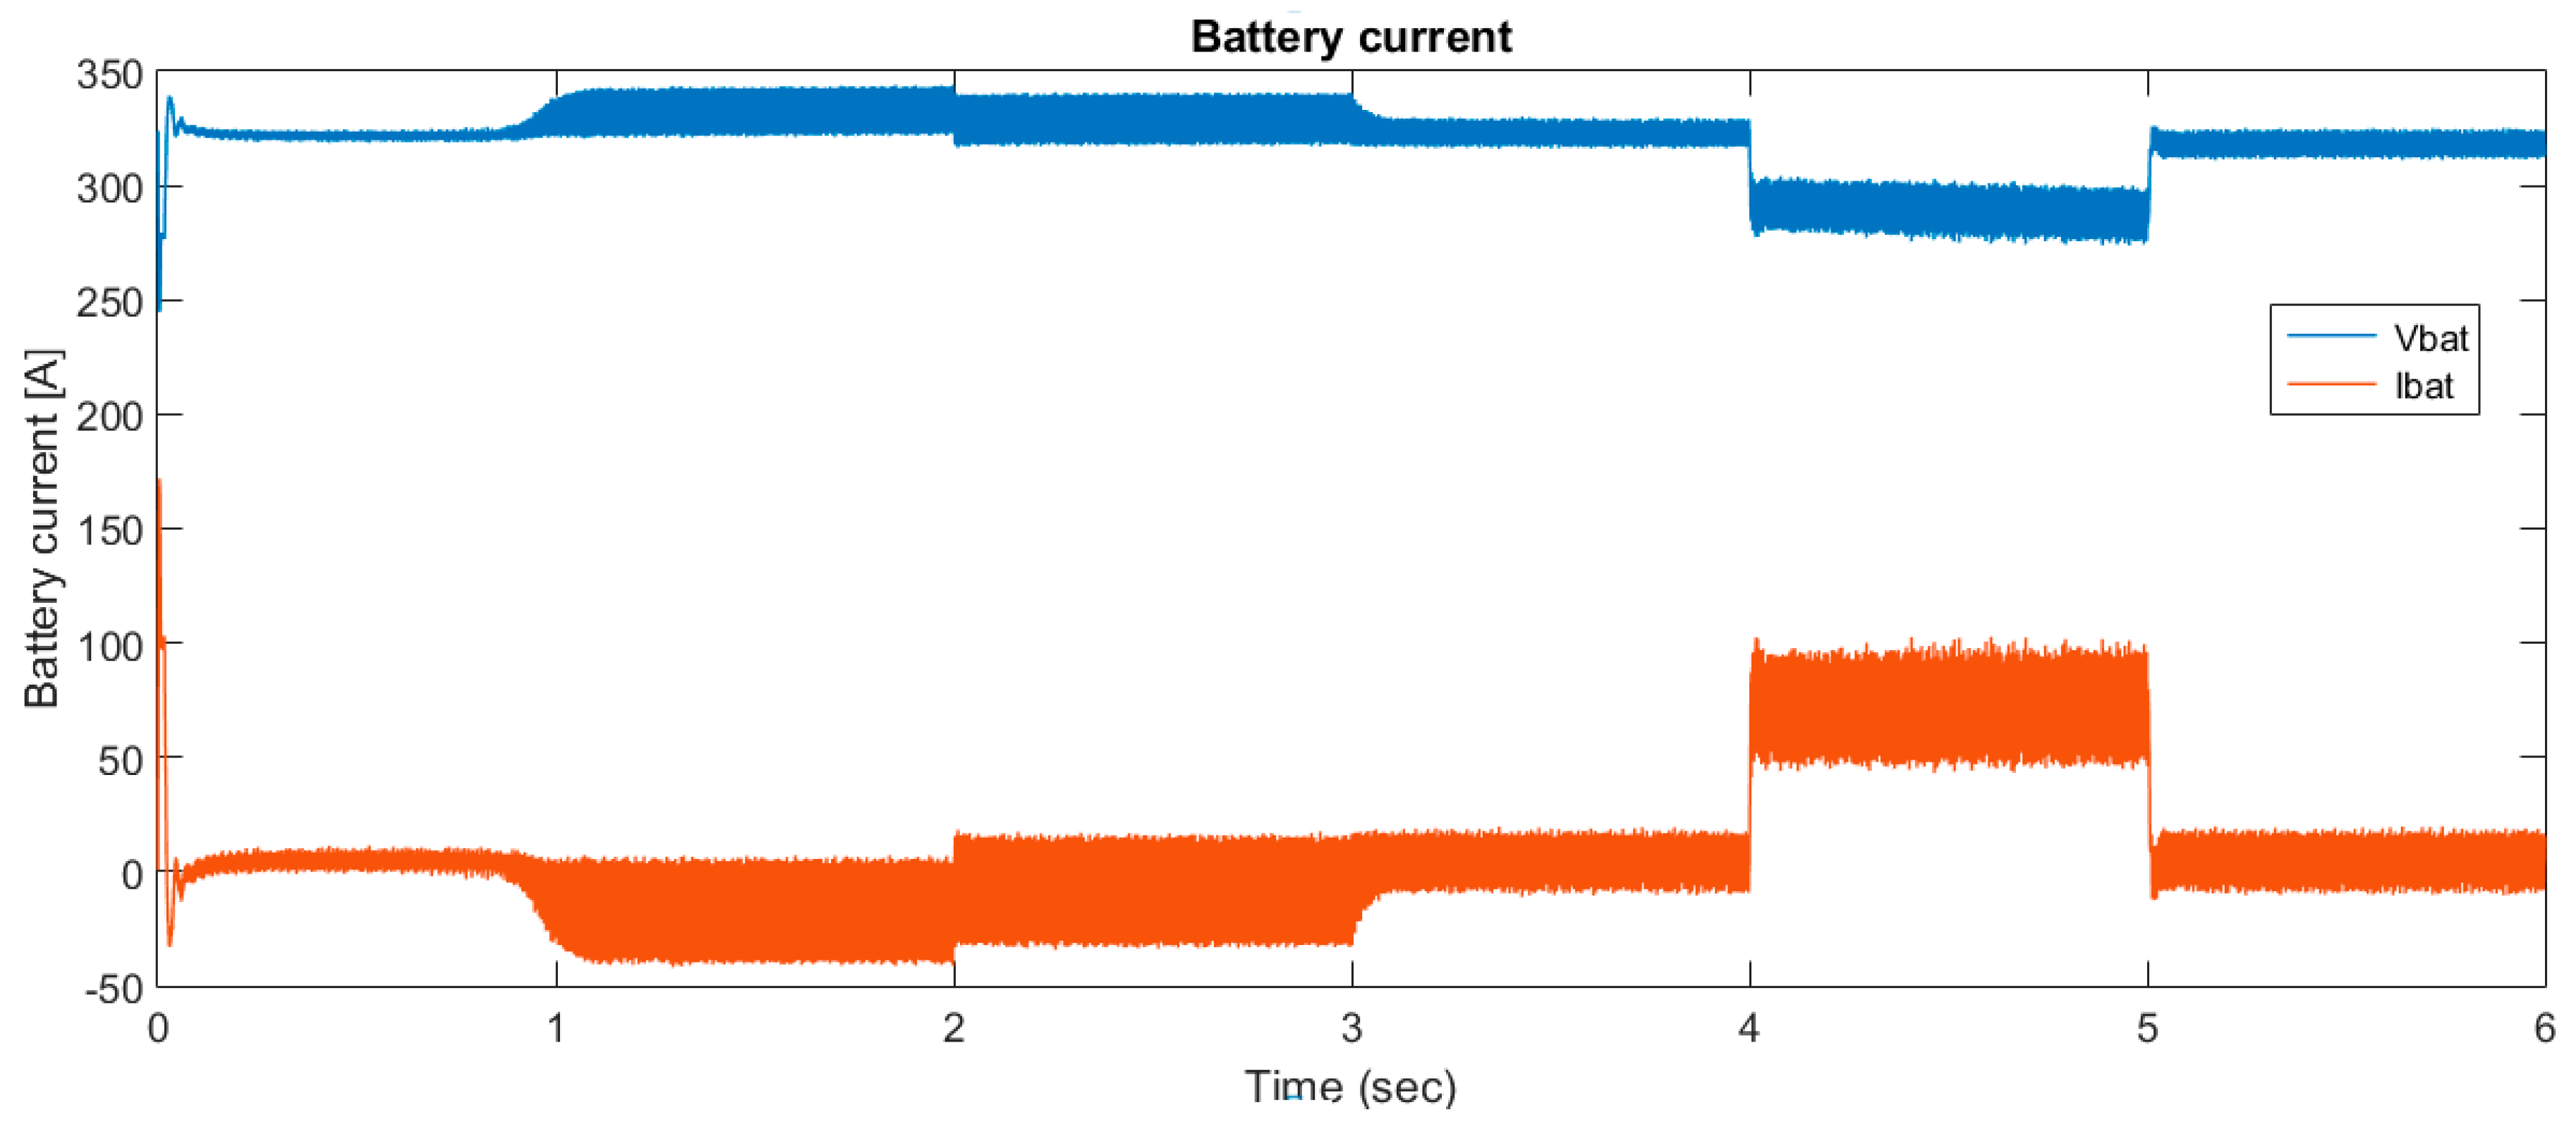
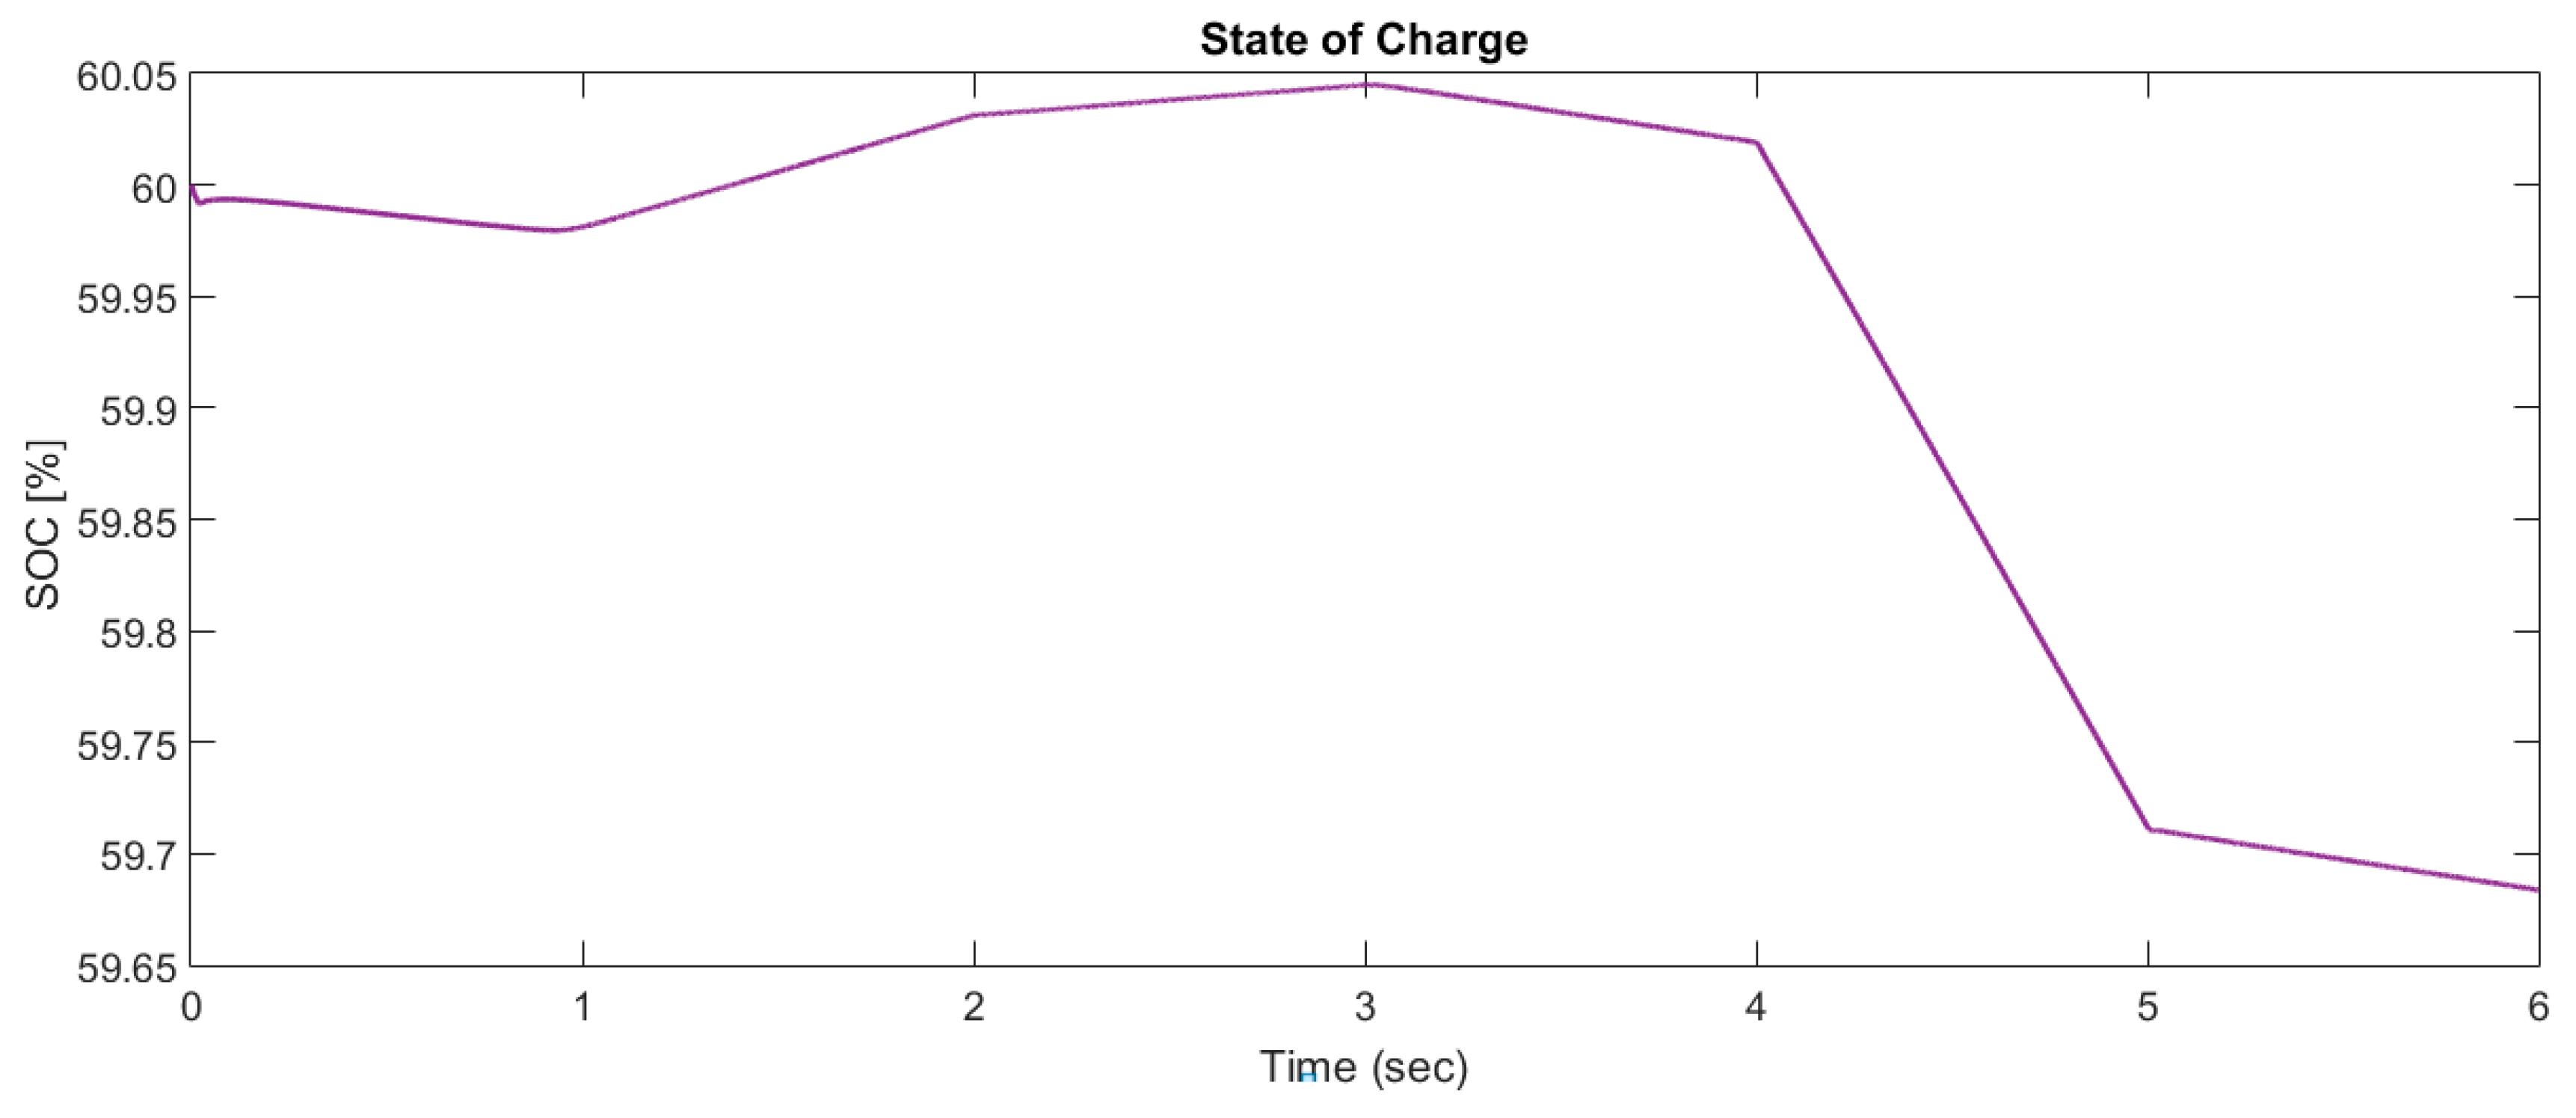
at time 2 s. Consequently, the total generated current from PV panels is reduced from 29.6 A to 25 A. The battery bank compensates the fluctuations of the difference between the microgrid reference power and all the passive power variations of the DC microgrid (PV/wind power and total loads). The battery bank voltage, charging and discharging current is shown in Figure 16. The corresponding state of charge SOC of the battery bank is shown in Figure 17.
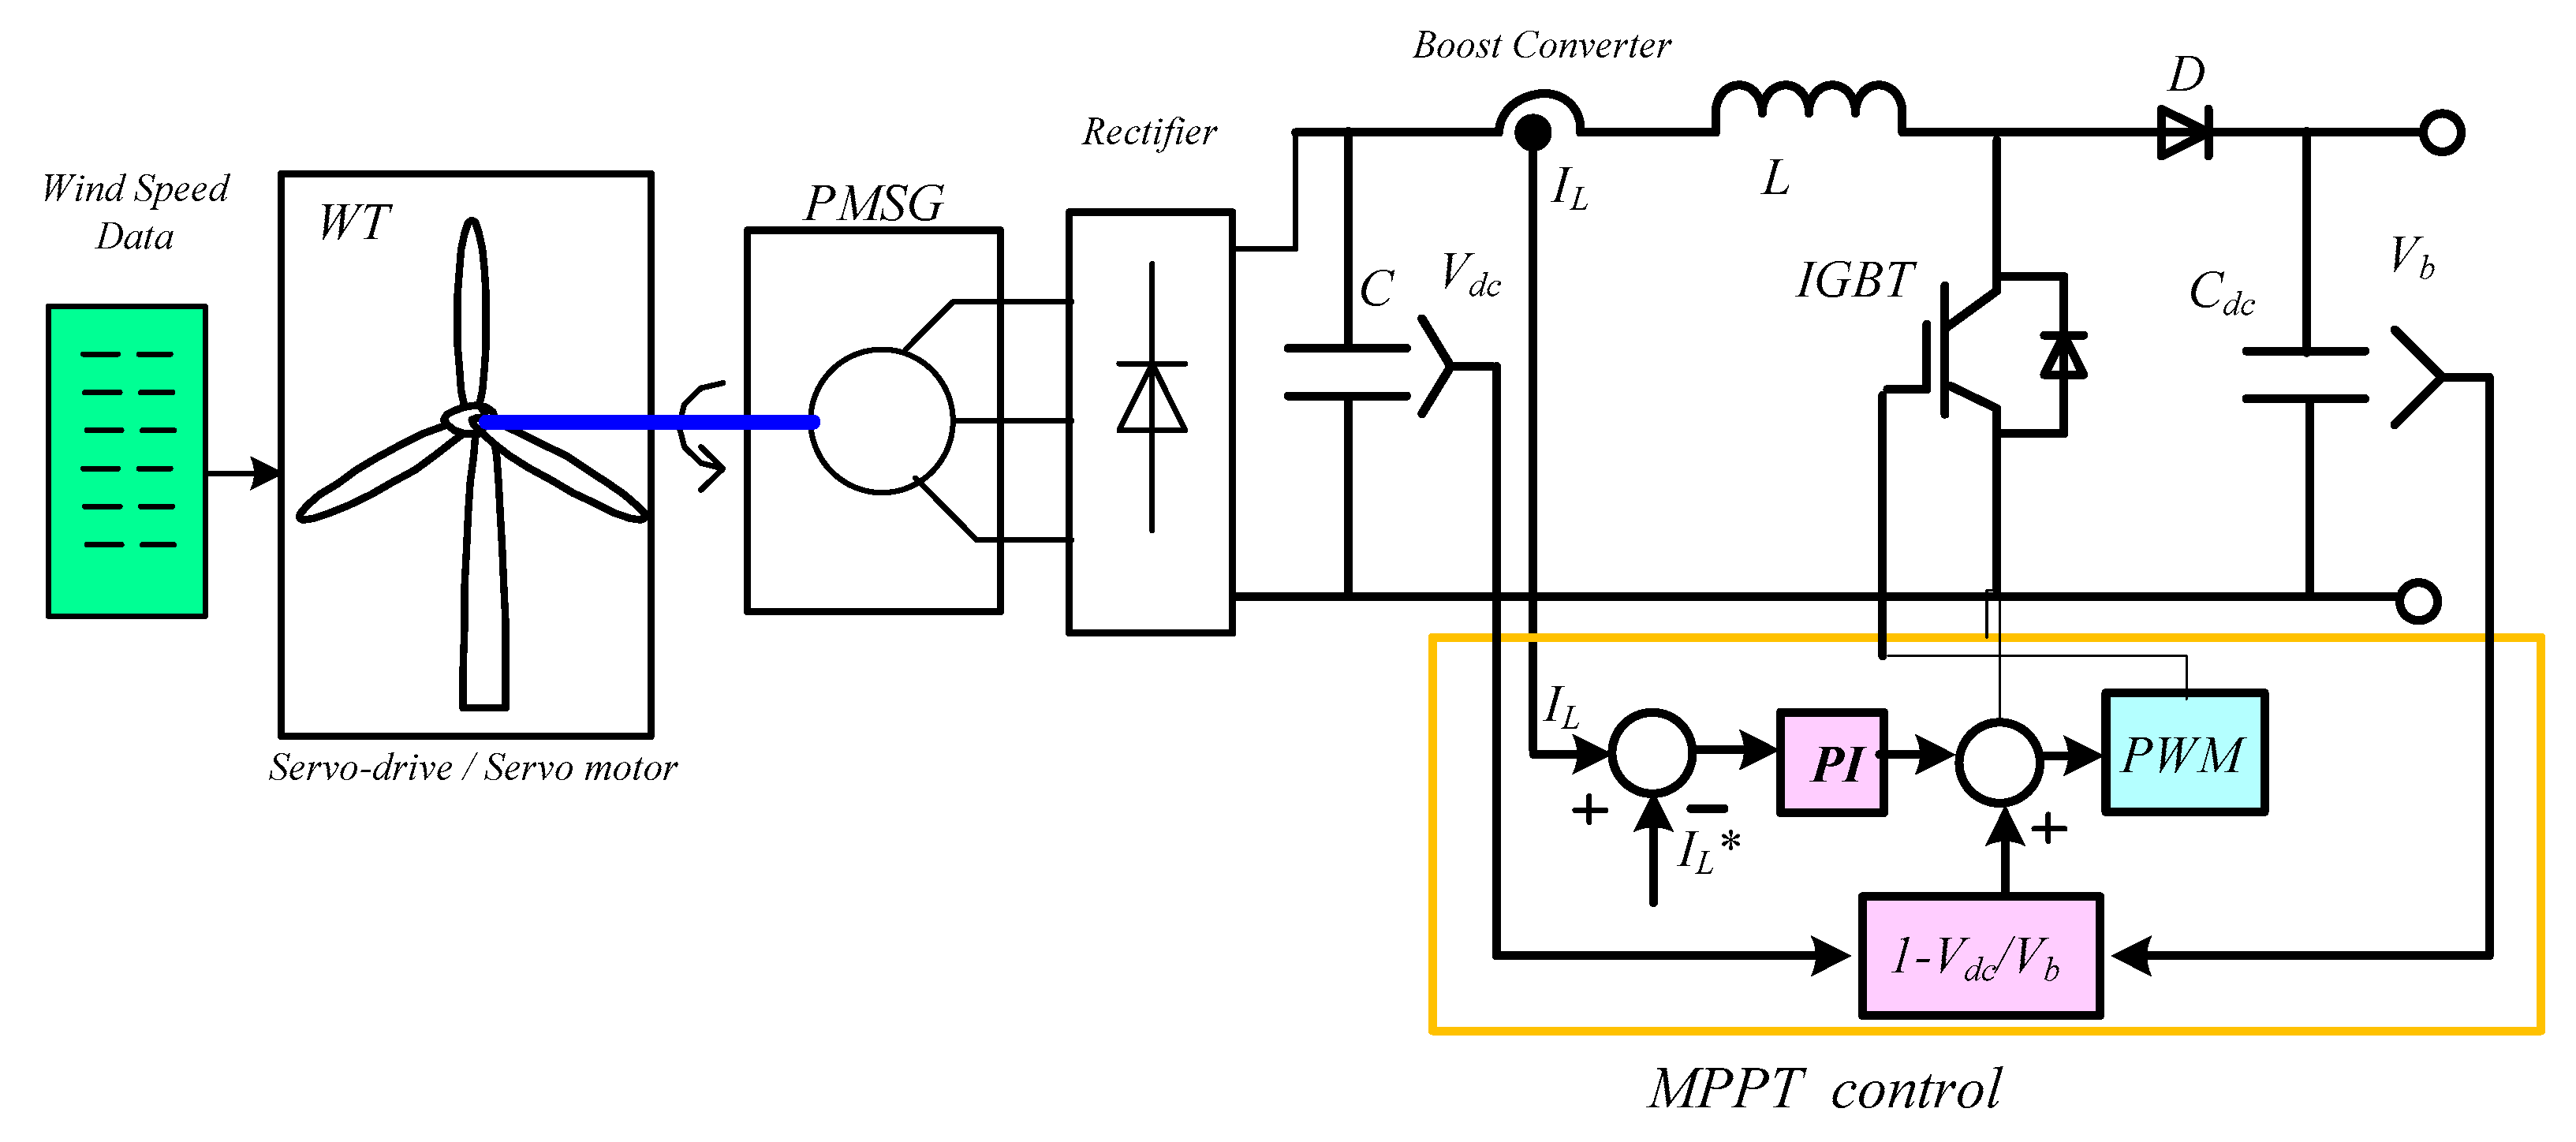
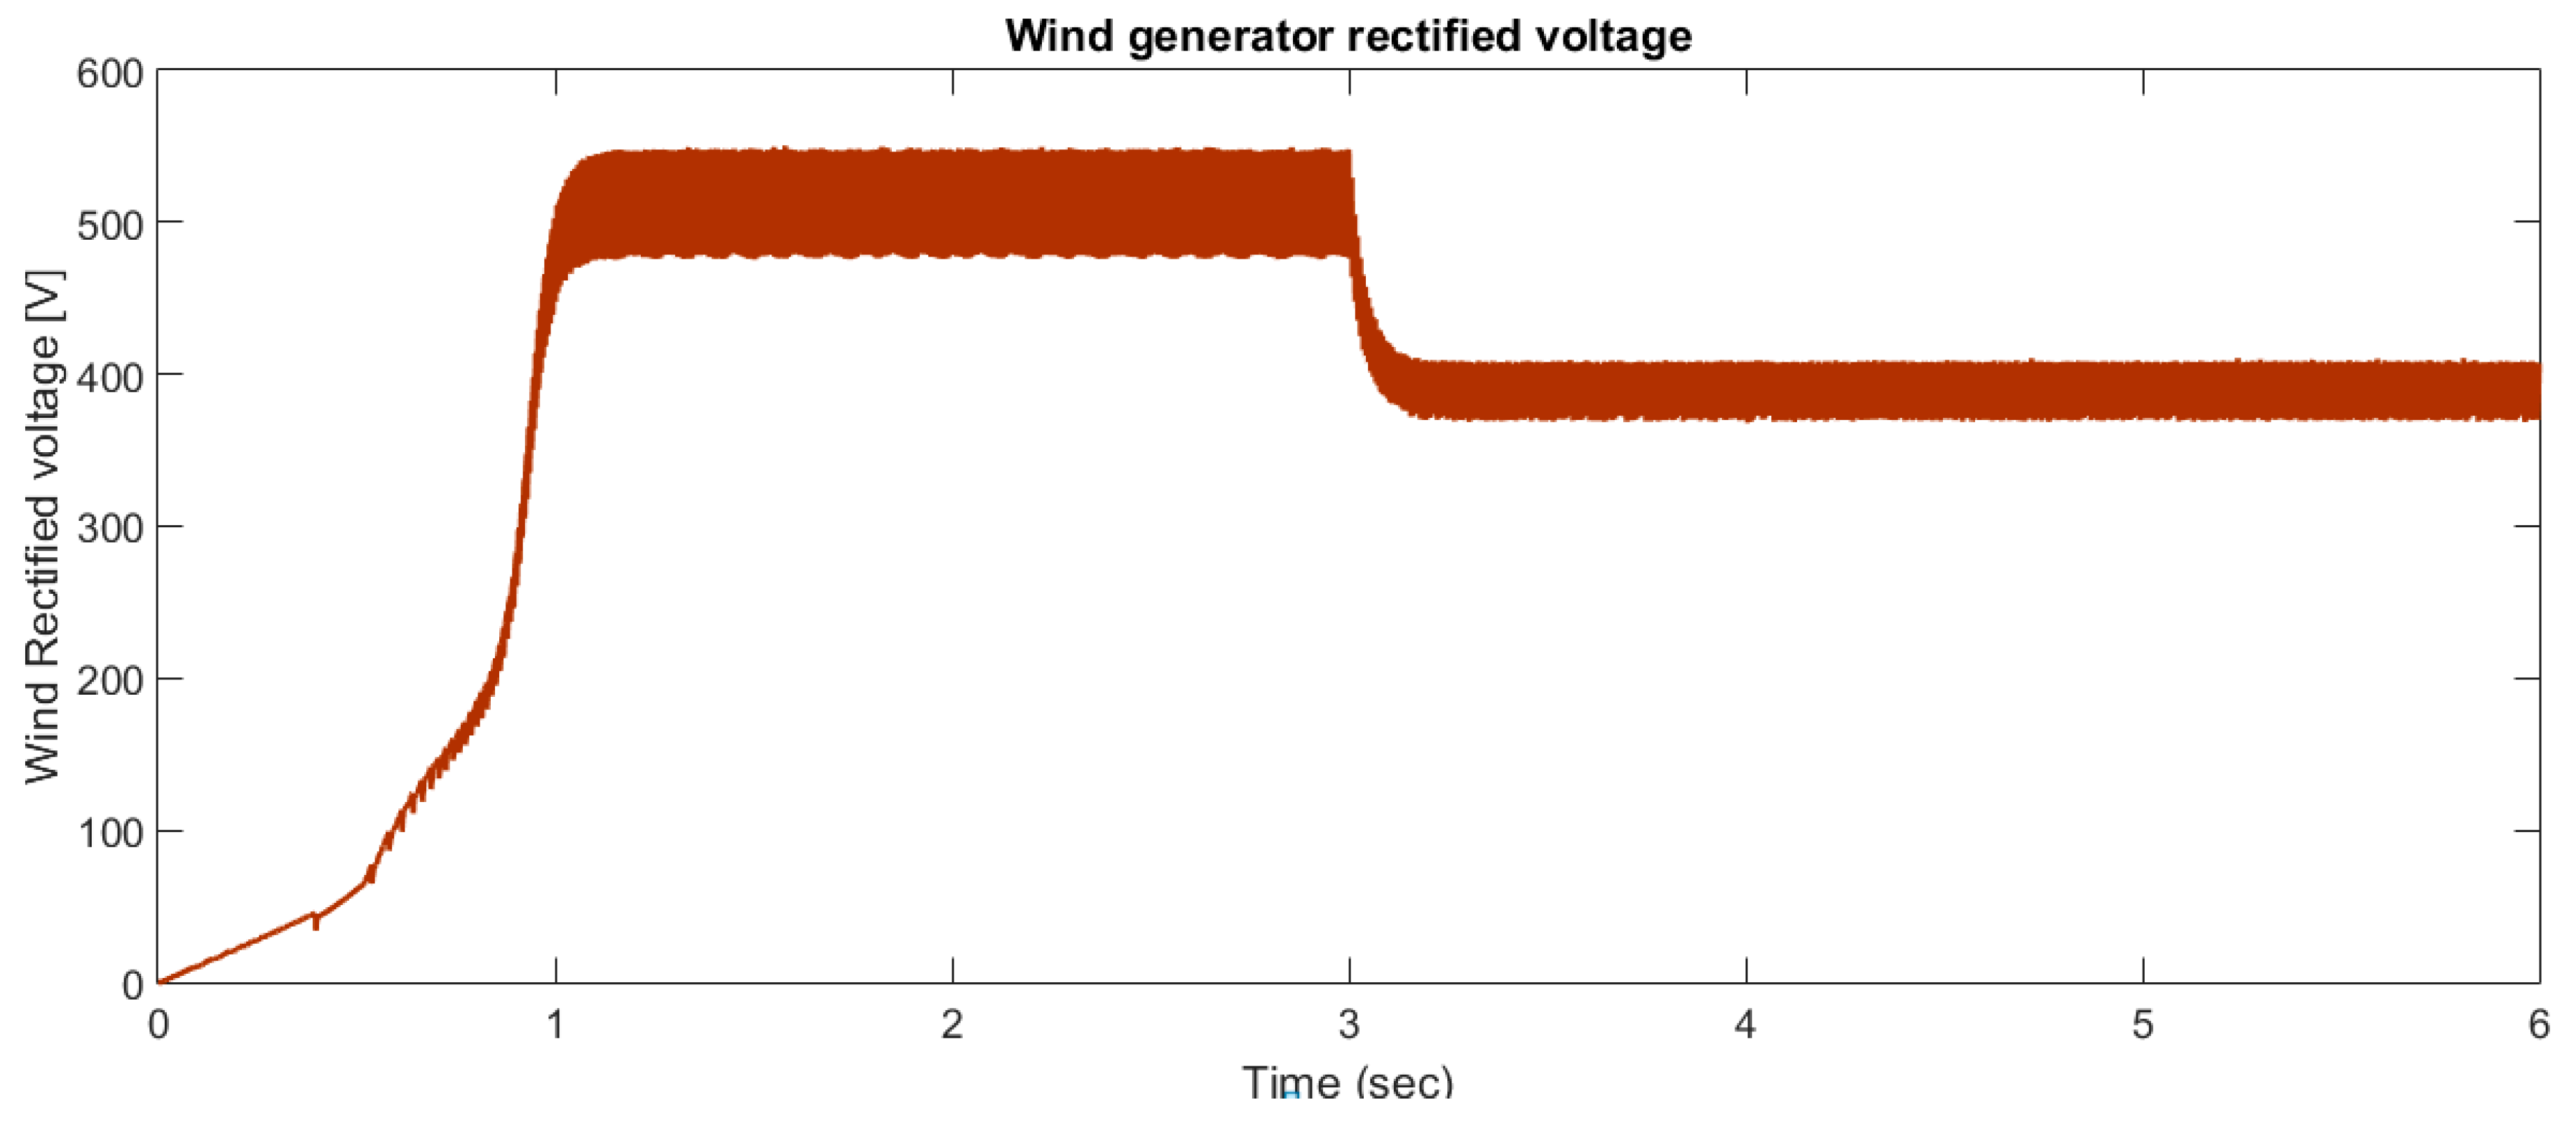
The wind turbine model comprises mathematical models of wind turbines and wind speed simulation. Figure 18 shows how the voltage at generator terminals (instantaneous value) changes with time. Figure 18 shows the corresponding generated current. The output power of the wind generator is proportional to the cube of the wind speed. A sudden variation of wind speed from 12 m/s to 9 m/s happens at a time of 3 s. However, the temporal variations of the PMSG rotational speed, torque, voltage, and output power follow that of the wind speed. The rectified output voltage of the wind generator is shown in Figure 19.
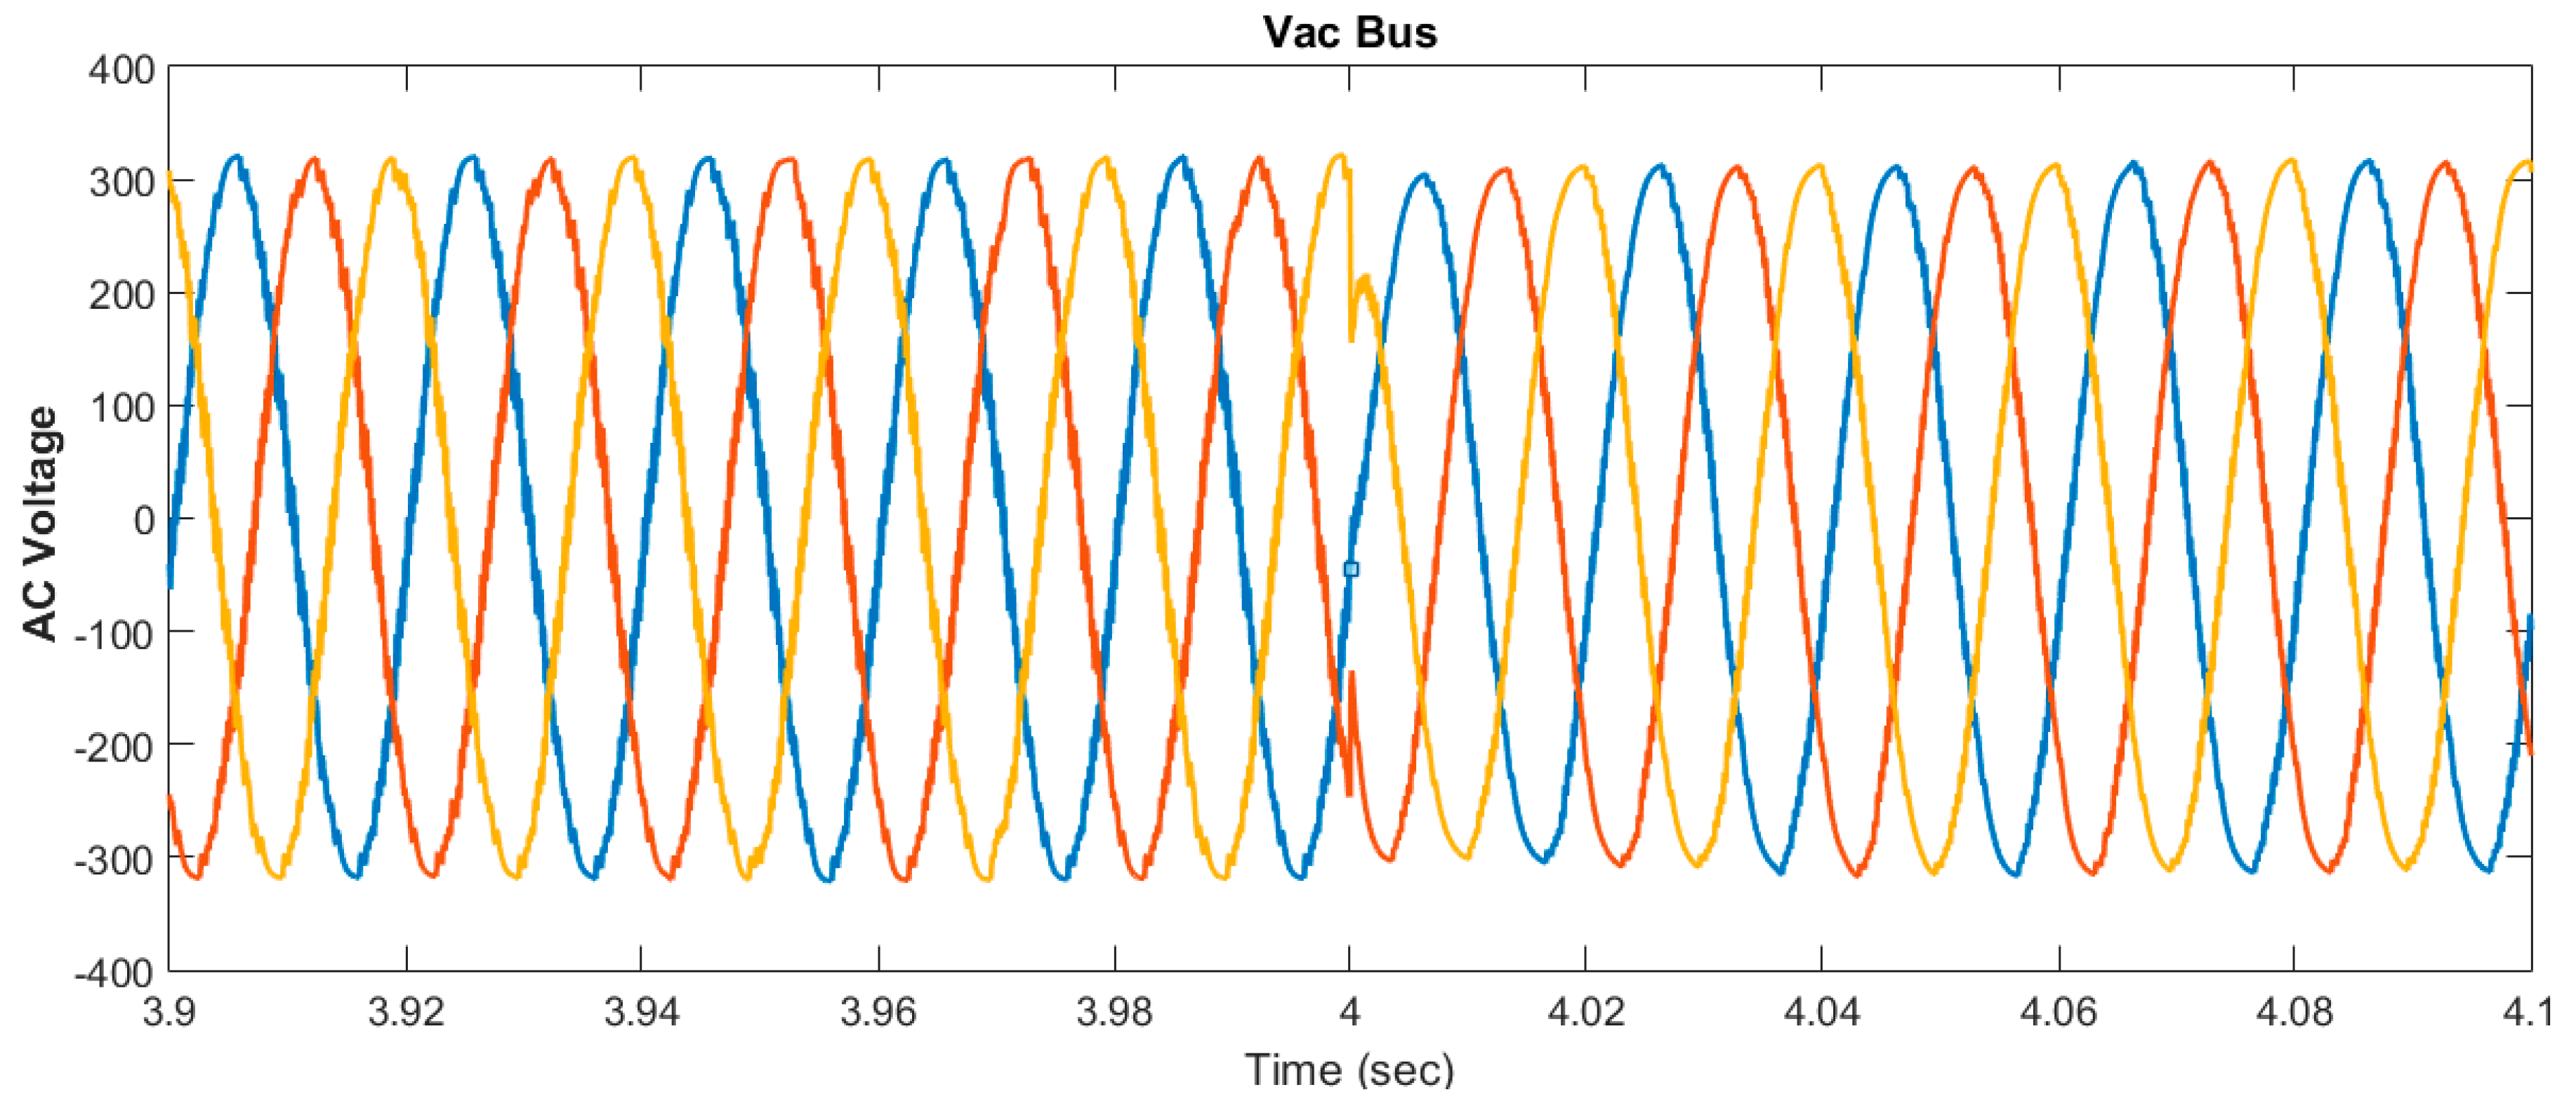
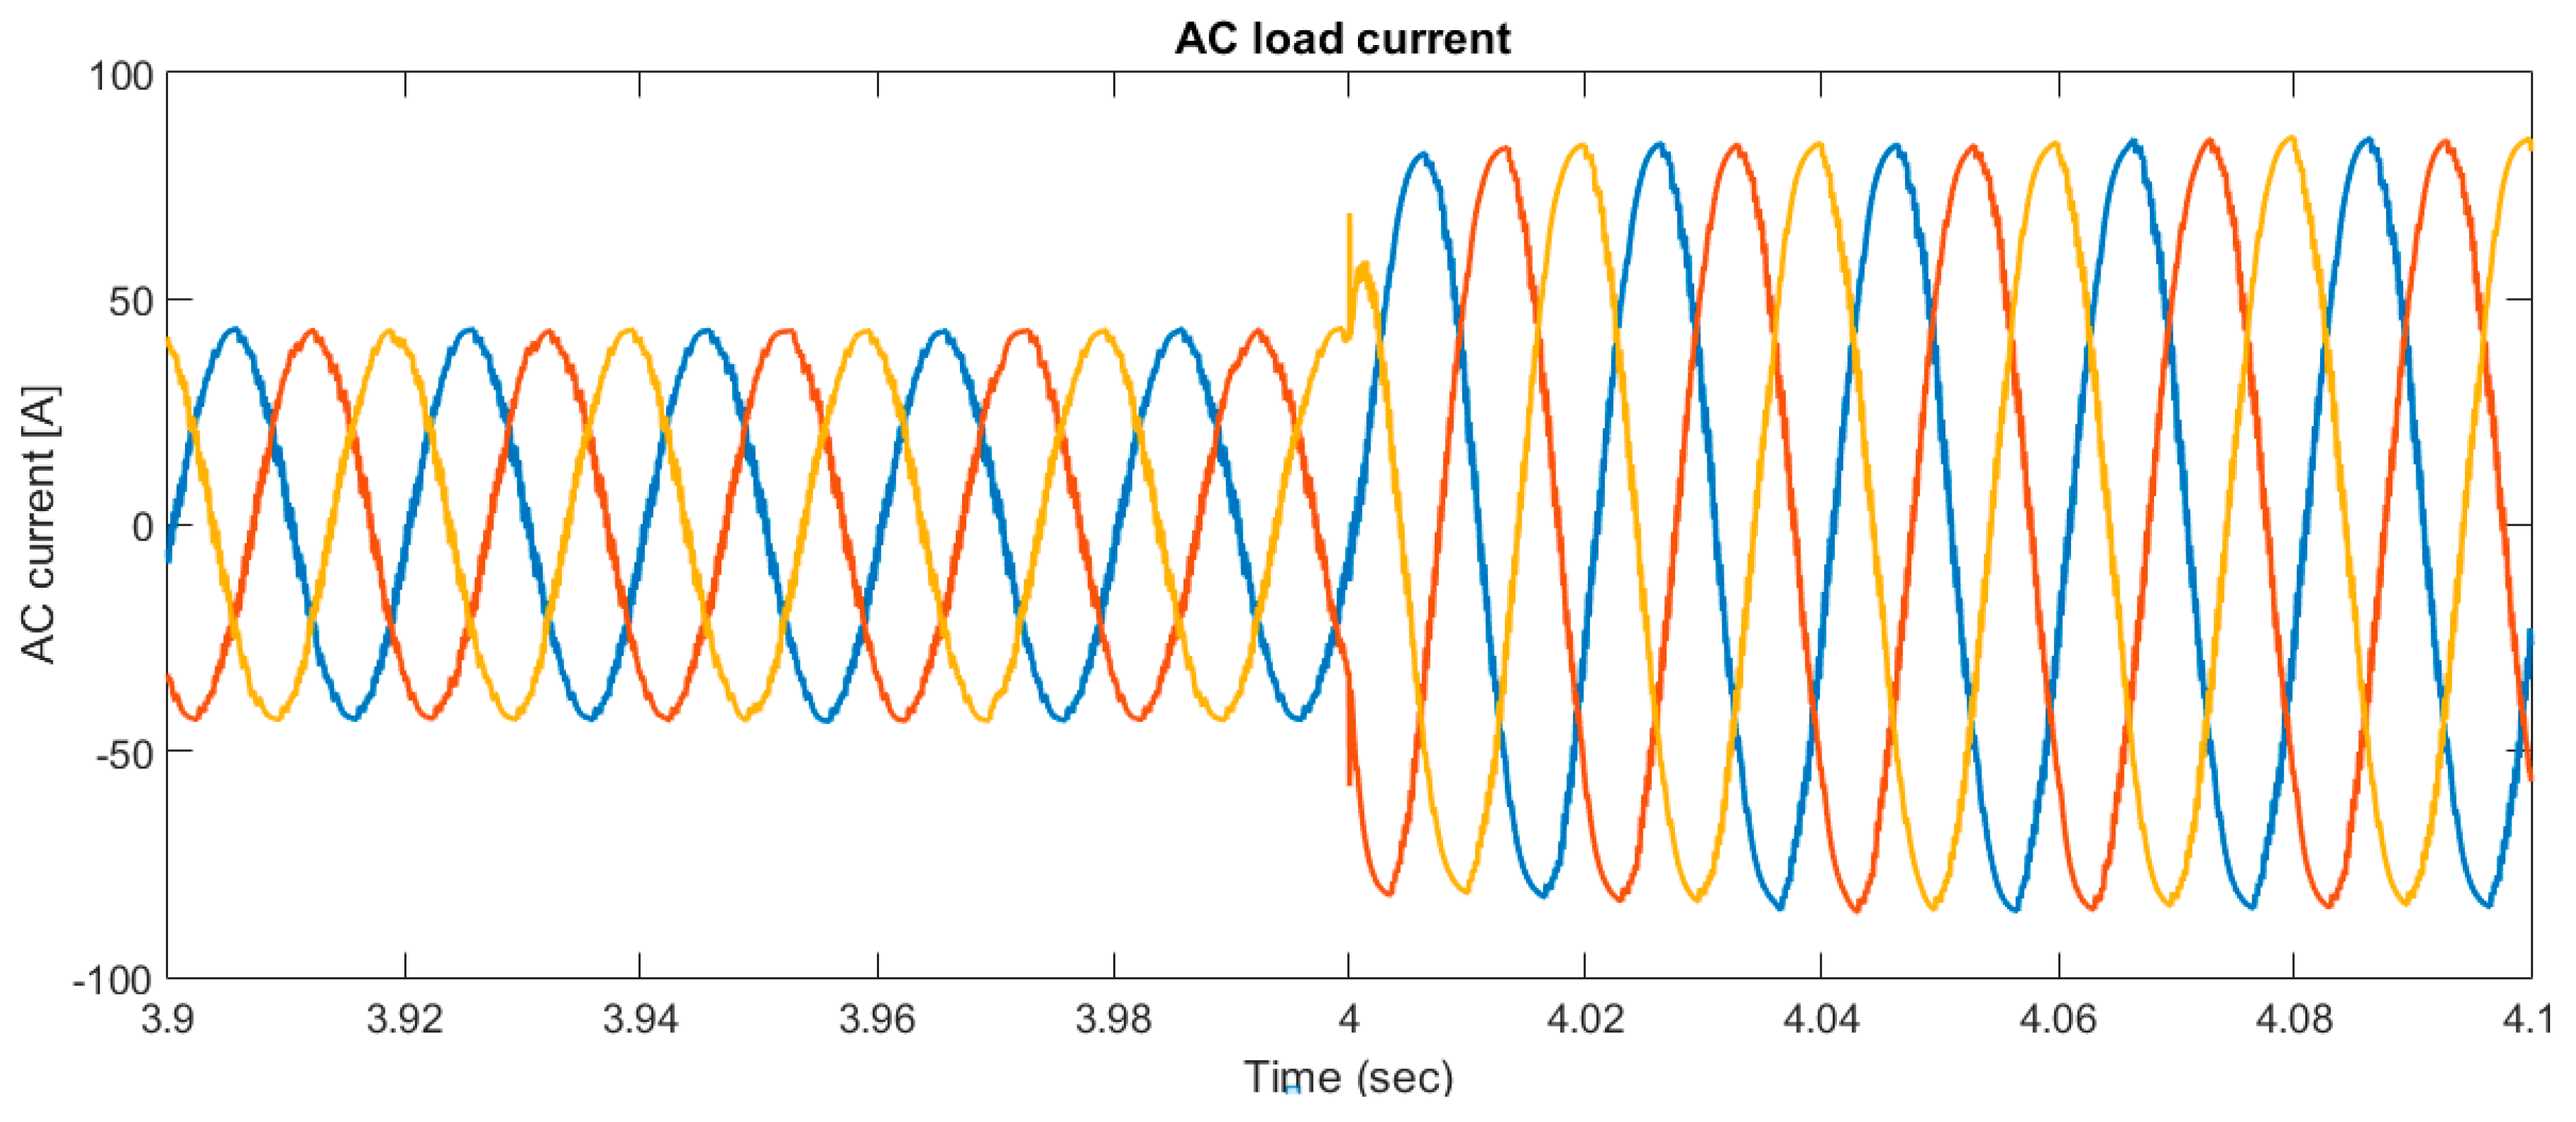
The voltage in the line and the current fed to the inverter for AC charging are shown in Figure 20 and 
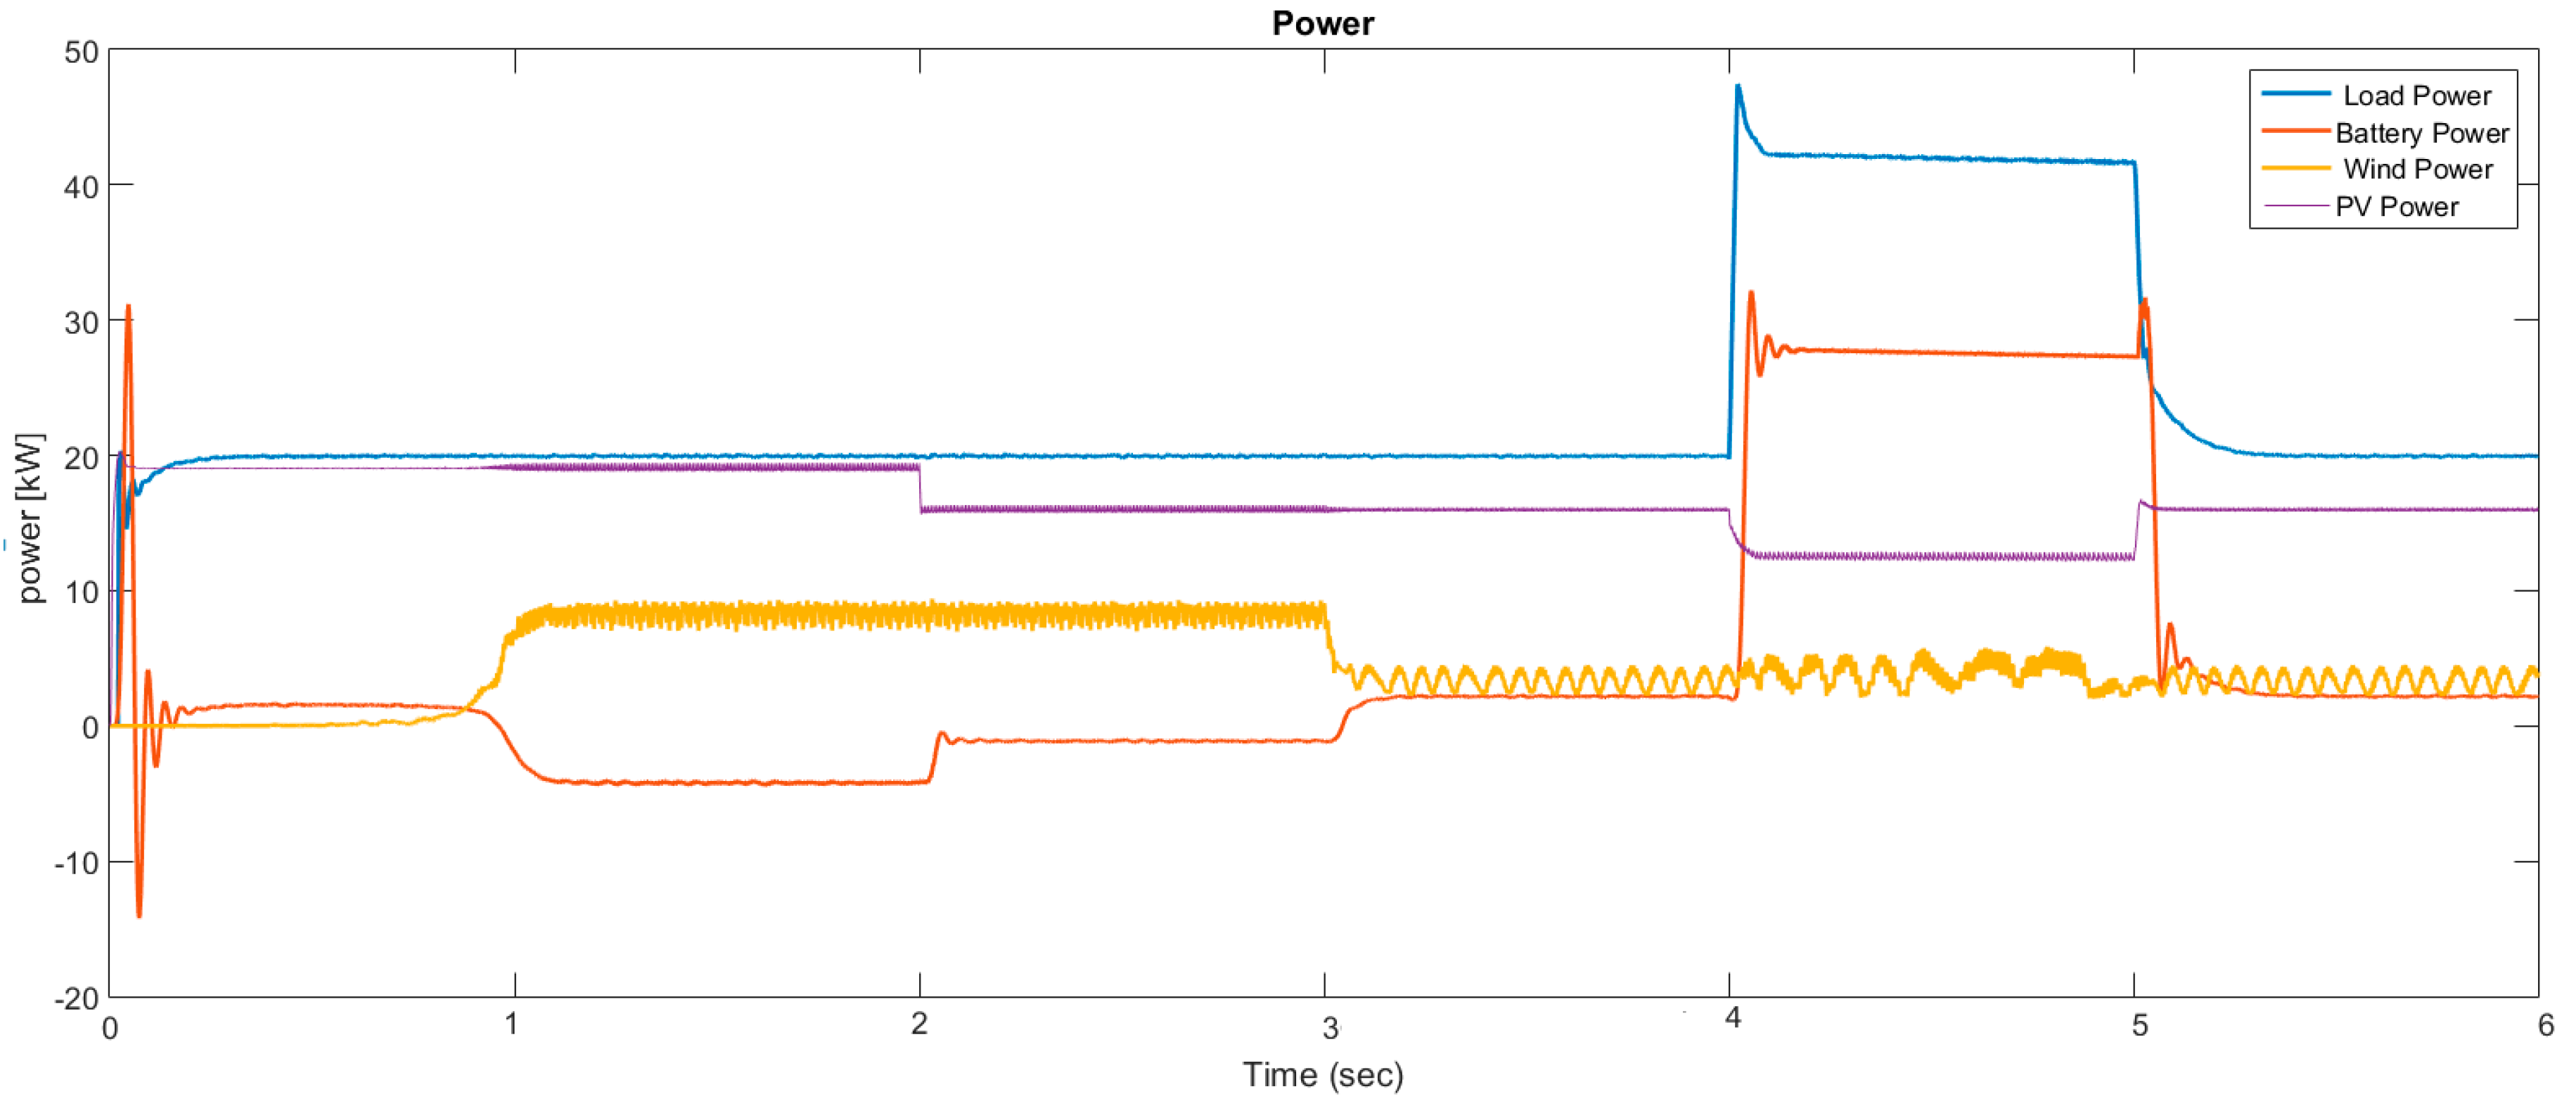
Figure 21, respectively. The current drawn from the AC system is sinusoidal, due to the AC filters employed. The lack of such AC filters will directly feed the harmonics into the grid source. A 3-phase AC load is used to emulate the EV charging load profile. The load profiles were generated using SIMULINK, and then the hourly energy results were configured into a suitable format. For each month, three day types were used to represent the annual load: Peak day, weekday, and weekend. The total powers from different sources and loads are shown in Figure 22. A step change in load power occurs at time 4–5 s from 20 kW to 60 kW. During this period, the peak power is compensated from the battery bank. The electrical power performance, current-voltage characteristics and system response confirm that the system has satisfactory performance under conditions of a step changing power reference and loads disturbances.

6. Resilient DC-Microgrid

DC microgrid configurations are evaluated that can be used to integrate PV and wind generators alongside existing batteries’ energy storage systems (BESS) to increase resiliency at the site. The BESS units are sized to support the charging station load for one hour in this operation condition. There will be cloudy intervals or early morning/ late afternoon hours when PV and wind generators will not be capable of delivering the required charging load. During those times, the BESS is required to supply the EV loads until PV or wind generation supplies the charging station load. An integrated solution was proposed so that all energy sources operate in an integrated manner and are centrally controlled. Therefore, the BESS does not require to be sized for the full load in this operation scenario. The DC-bus Voltage of microgrid effects time of charging. Then the time of charging can be calculated according to the voltage and capacity of the battery. This measure takes into account the robustness of the system against disturbances and the quickness of the recovery [27].
R = t 0 T a V d c b u s ( t ) d t T a
where VDC-bus is the DC bus voltage. R is the resiliency, Ta is the recovery time.
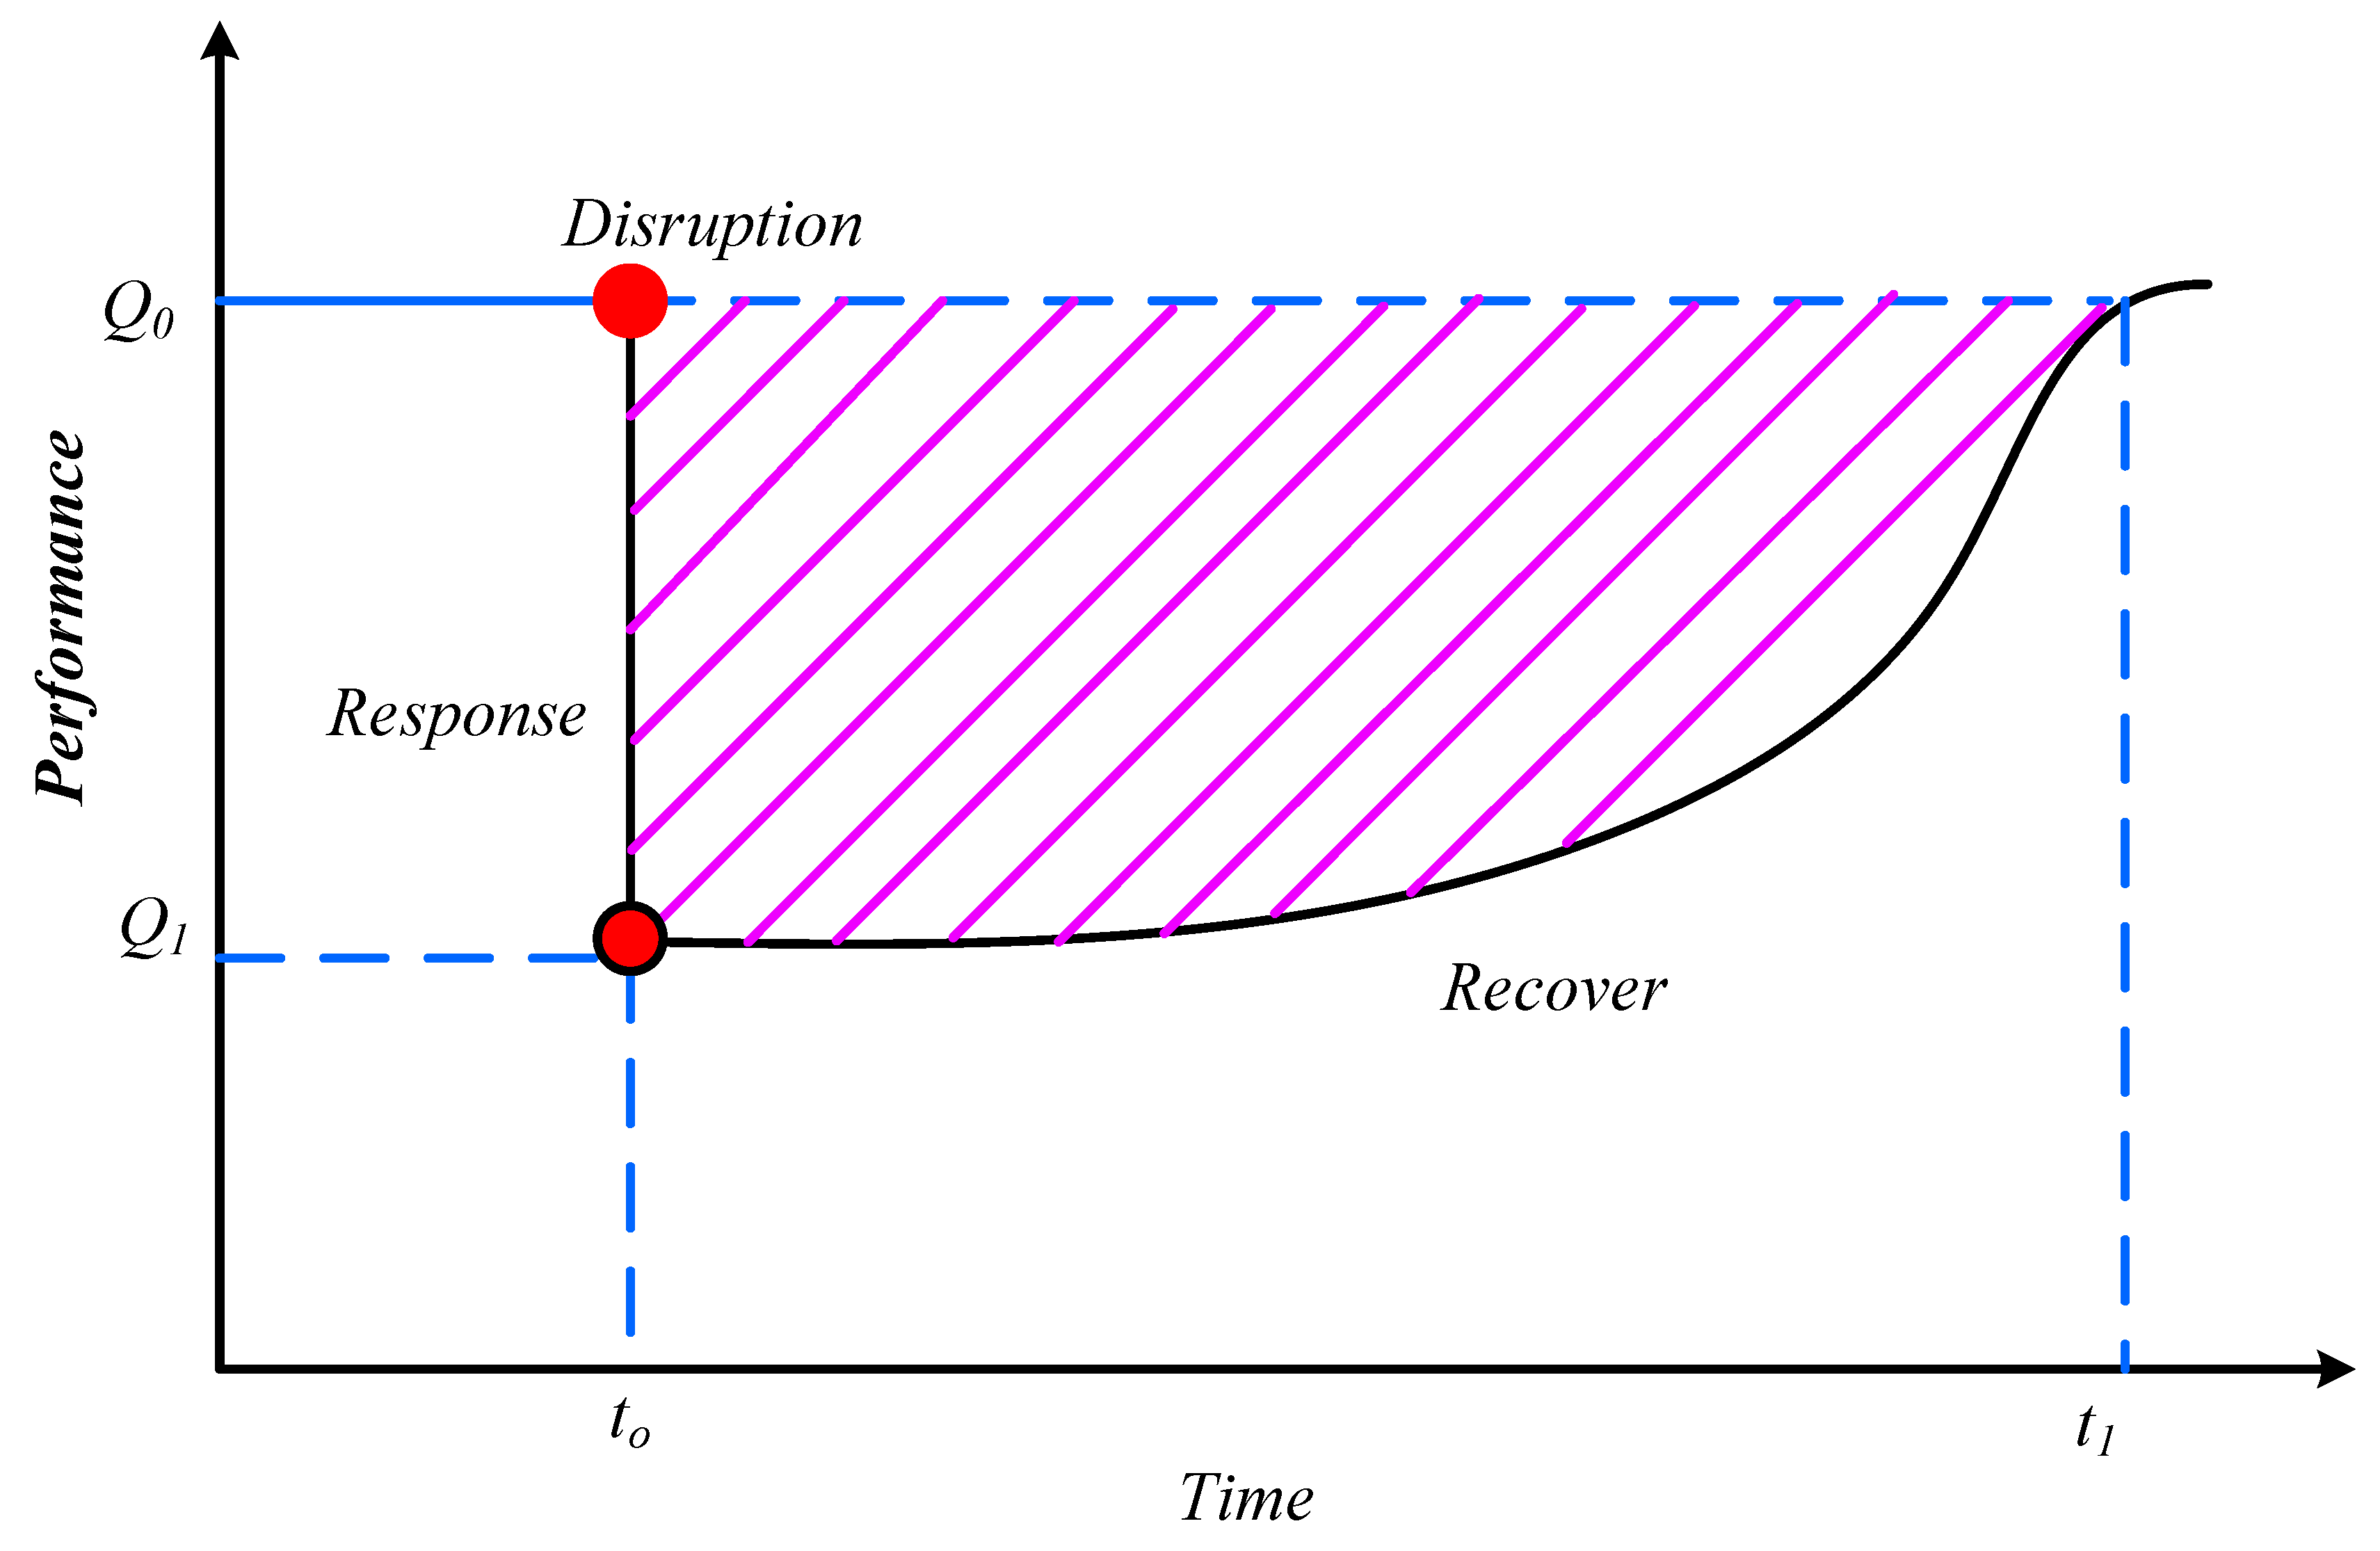
The resilience of an electrical microgrid can be defined as “the ability of the microgrid to sustain against disturbances and return to its normal state quickly”. This definition includes the two remarkable attributes, recovery and response, and is compatible with the definitions given in references [27,
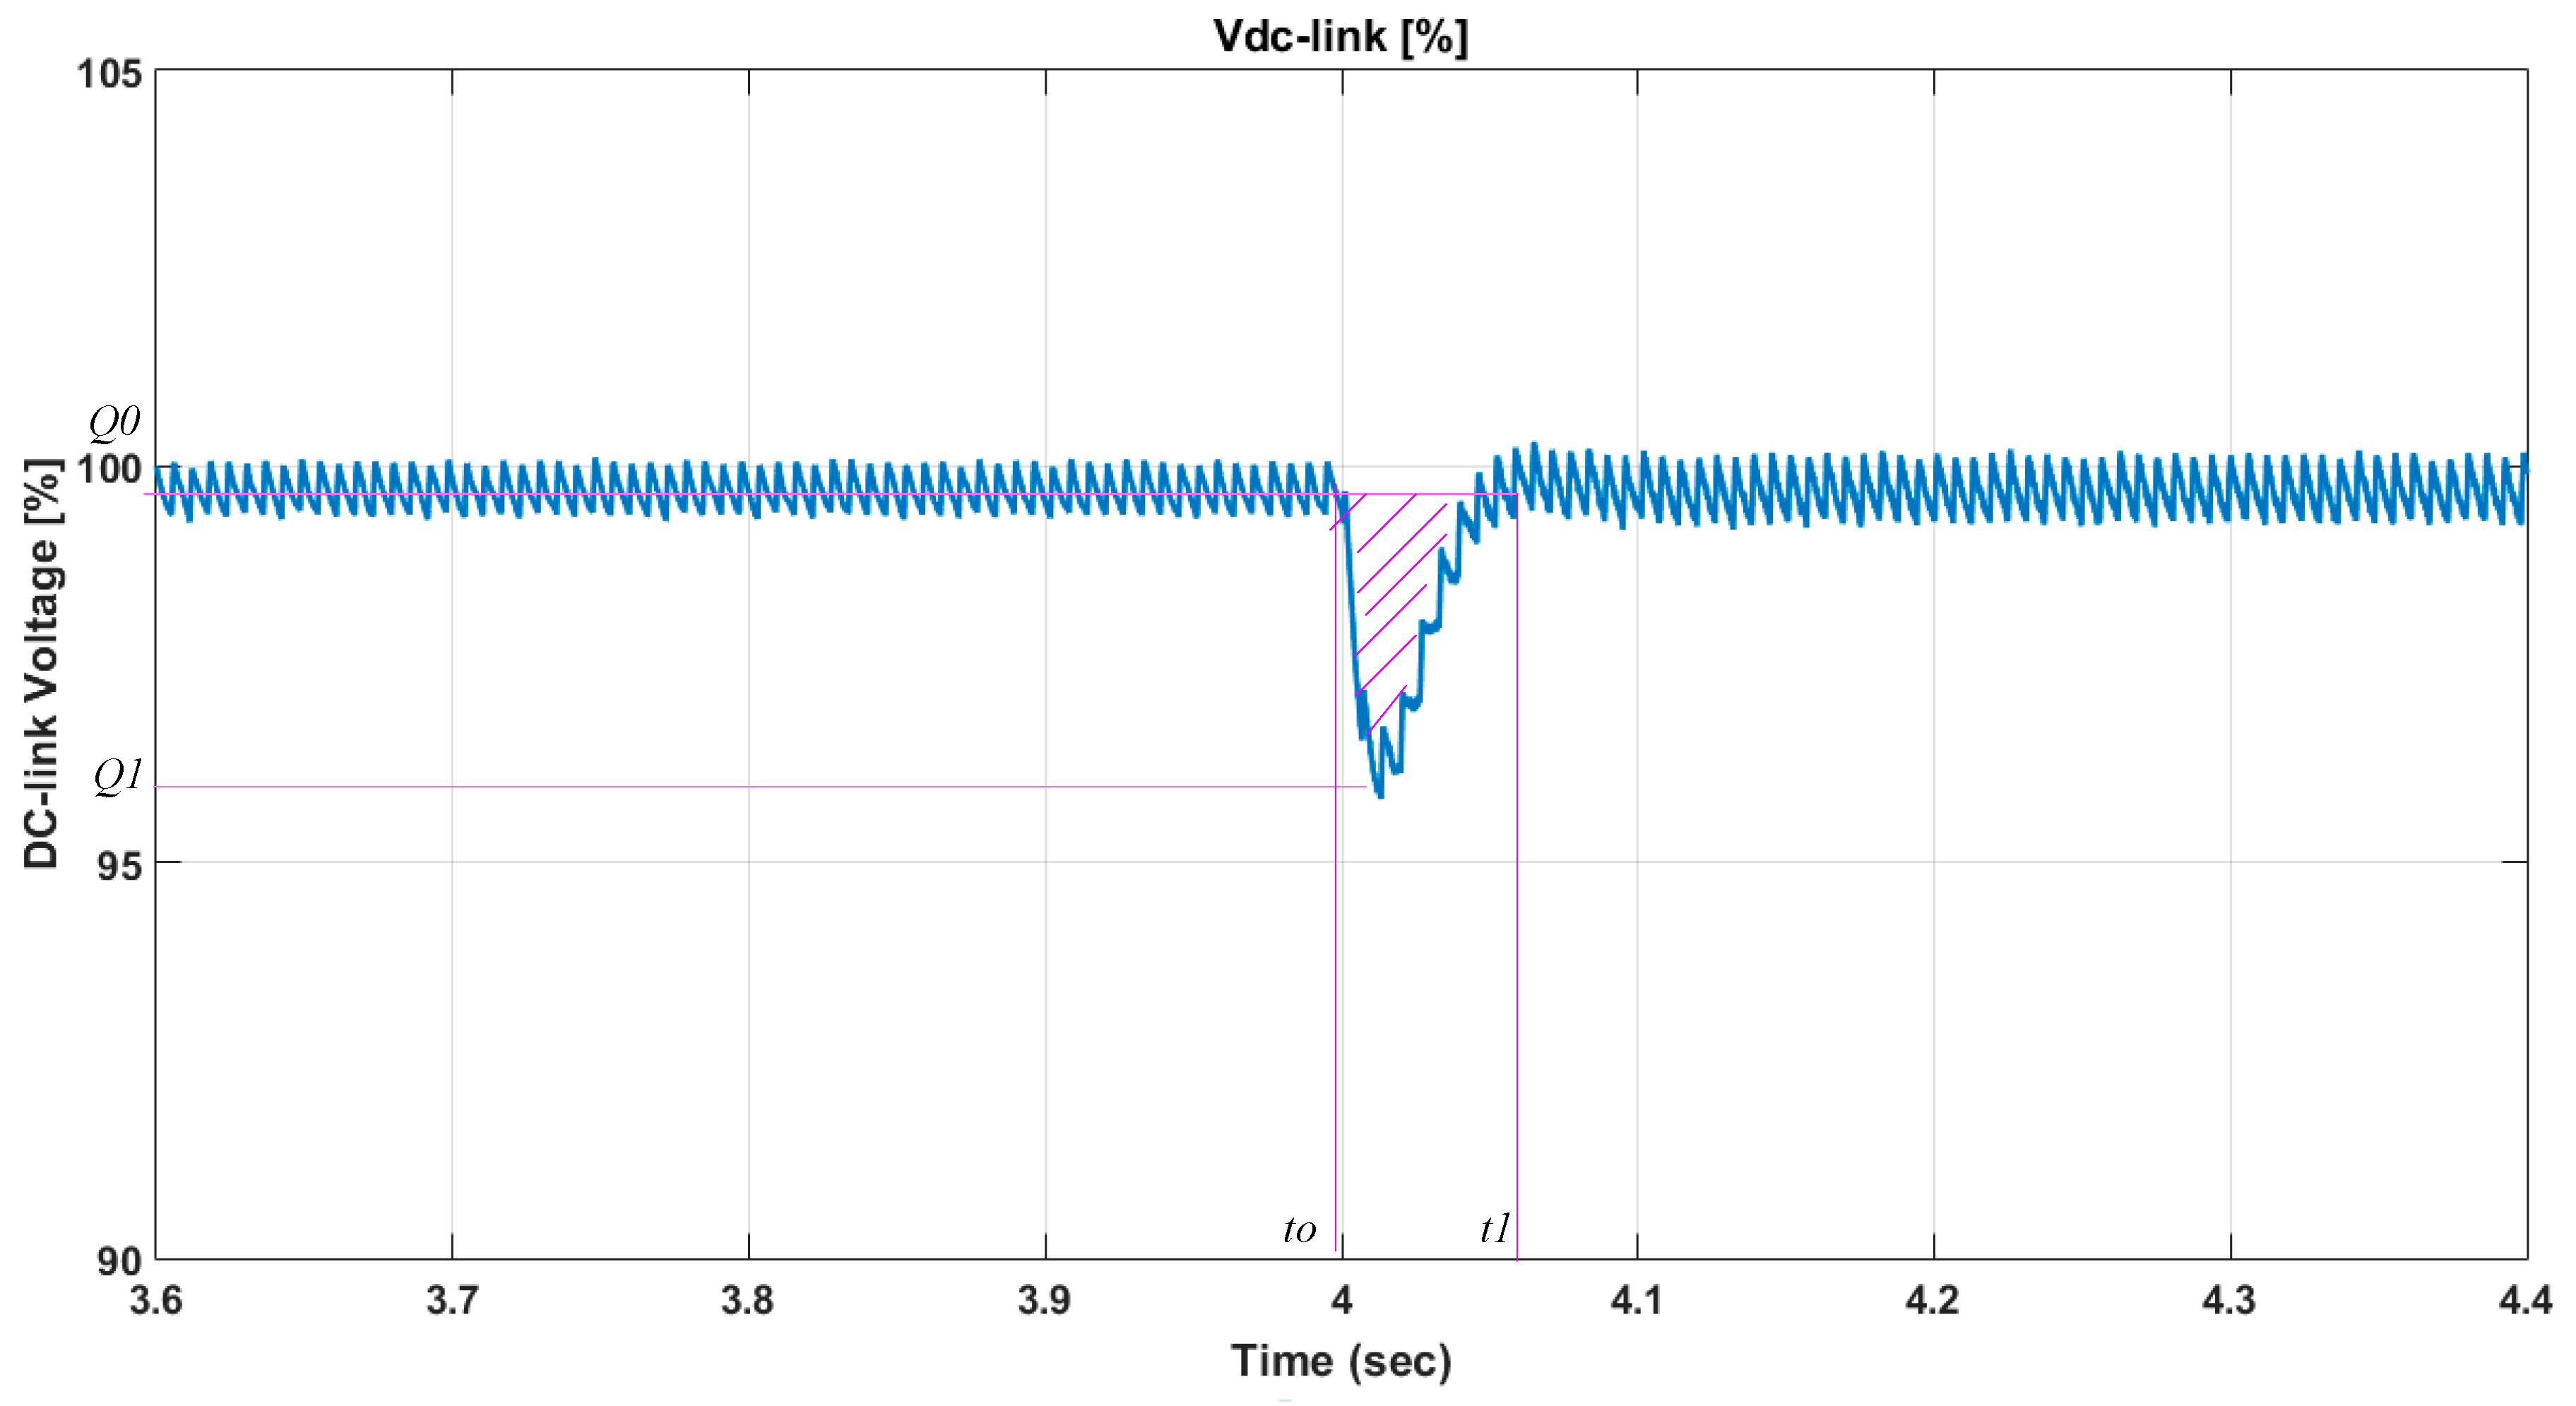
28]. The schematic diagram of the system’s resilience concept is illustrated in Figure 10. However, disruption occurs at time t0, as shown in this figure, and the system performance (DC bus voltage) falls from Q0 to Q1. By taking adequate action, the system returns finally to original DC-link voltage at time t1.
As shown in Equation (6), the resilience measure is able to comprehensively represent the ability of the system to withstand the disruption and recover rapidly. Here, 0 < R< 1. Therefore, when R = 1, it means that the system has perfect resilience: Either its performance degradation is 0, or it can recover from disruption instantaneously. In case R = 0, it designates that the system is completely troubled immediately upon disruption and cannot recover within the maximum permissible recovery time. It is obvious that systems with higher values of R are more resilient.
The performance curve Q(t) is used to describe the system resilience of microgrid. The performance loss function from disruption is defined by the integral of the curve, followed by a gradual recovery (i.e., the shadowed area in Figure 23). This measure achieves the robustness of the system versus disturbances (load disturbance and intermitted generated energy from renewable sources) and the quickness of the recovery action. By calculating the area under the curve of Figure 24, the DC-bus voltage is recovered from VDC = 96% to 100% and the time from 4 to 4.06 s and dividing this by time 0.06; then the resiliency will be 0.98. It means the system is near perfect resilient.
A new resilience measure is proposed in this paper for DC microgrid. It comprises using the maximum admissible recovery time as the considered time interval and enabling an estimation method. Resilience measurement scheme is used to estimate the resilience of different microgrid designs. It is also used to verify whether the resilience goal of microgrid can be satisfied, and choose a resilient method that can sustain the disruption and return the microgrid to the normal state as quickly as possible.

7. Conclusions

This paper has presented an energy management technique for an isolated DC-microgrid supplying EV charging station. The standalone DC microgrid is verified by implementing the charging station model in a MATLAB/Simulink environment. The EMS control system is designed to regulate renewable energy sources status, battery SOC, and load demand. For an accurate evaluation of EMS strategy, hourly variations of renewable generation and a typical EV load are utilized as input data. The solar irradiation is reduced from 1000 W/m2 to 850 W/m2 at time 2 s. A sudden variation of wind speed from 12 m/s to 9 m/s happened at a time of 3 s. However, the temporal variations of the PMSG rotational speed, torque, voltage, and output power follow that of the wind speed. A step change is applied in the load power then the battery bank compensates the fluctuations of the difference between the microgrid reference power and all power variations of the DC microgrid (PV/wind power and total loads). The electrical power performance, current-voltage characteristics and system response confirm that the system has satisfactory performance under conditions of a step-changing power reference and loads disturbances. The results indicated that the integration of intermittent wind and solar energy sources in microgrid should be designed carefully in standalone operation. The proposed control strategies can provide excellent performance under different operating conditions. BESSs can increase the reliability of the system because they can store excess renewable energy during low-demand periods and can supply during high-demand periods.

Author Contributions

Conceptualization, K.S.; Methodology, A.G.A.-K. and A.S.A.; Software, A.G.A.-K.; Validation, K.S.; Formal Analysis, A.S.A.; Investigation, A.G.A.-K.; Resources, A.S.A.; Data Curation, K.S.; Writing-Original Draft Preparation, A.G.A.-K.; Writing—Review and Editing, A.S.A.; Visualization, K.S.; Supervision; Project Administration, A.G.A.-K.; Funding Acquisition, A.S.A.

Funding

This research received no external funding.

Acknowledgments

The authors extend their appreciation to the Deanship of Scientific Research at Majmaah University for funding this work under project number No (RGP-2019-19).

Conflicts of Interest

The authors declare no conflict of interest.

Abbreviations

The following abbreviations are used in this manuscript:
DCDirect Current
ACAlternating Current
EMIElectromagnetic Interference
DGDistributed Generation
BMSBattery Management Systems
SOCState of charge
EVElectric vehicle
PMSGPermanent Magnet Synchronous Generator
IDMDMaximum demand current
PEVPlug in Electric Vehicle
BESSbatteries energy storage system
EMSEnergy management Strategy
EMUEnergy management unit
ESSEnergy Storage system
DGdistributed generation
MPPMaximum power point
MPPTMaximum power point tracking
PVPhotovoltaic
PIProportional-integral
WTWind Turbine
WTCSWind Turbine Conversion System
DERsDistributed Energy Resources
HVACheating, ventilation, and air conditioning
PWMpulse-width modulation
RERenewable Energy

References

  1. Sayed, K.; Gabbar, H.A. Electric Vehicle to Power Grid Integration Using Three-Phase Three-Level AC/DC Converter and PI-Fuzzy Controller. Energies 2016, 9, 532. [Google Scholar] [CrossRef]
  2. Sayed, K. Zero-voltage soft-switching DC–DC converter-based charger for LV battery in hybrid electric vehicles. IET Power Electron. 2019, 12, 3389–3396. [Google Scholar] [CrossRef]
  3. Long, B.; Lim, S.T.; Bai, Z.F.; Ryu, J.H.; Chong, K.T. Energy management and control of electric vehicles, using hybrid power source in regenerative braking operation. Energies 2014, 7, 4300–4315. [Google Scholar] [CrossRef]
  4. Fan, Y.; Zhu, W.; Xue, Z.; Zhang, L.; Zou, Z. A multi-function conversion technique for vehicle-to-grid applications. Energies 2015, 8, 7638–7653. [Google Scholar] [CrossRef]
  5. Lukic, S.M.; Cao, J.; Bansal, R.C.; Fernando, R.; Emadi, A. Energy storage systems for automotive applications. IEEE Trans. Ind. Electron. 2008, 55, 2258–2267. [Google Scholar] [CrossRef]
  6. EPRI. Tennessee Valley Authority Smart Modal Area Recharge Terminal (SMART) Station Project. 2012. Available online: http://www.epri.com/abstracts/Pages/ProductAbstract.aspx?ProductId=000000000001 026583 (accessed on 25 December 2012).
  7. Gorton, M. Solar-Powered Electric Vehicle Charging Stations Sprout up Nationally. 2011. Available online: http://www.renewableenergyworld.com/rea/news/article/2011/11/solar-powered-electric-vehiclecharging-stations-sprout-up-nationally. (accessed on 15 November 2011).
  8. Ibrahim, H.; Sayed, K.; Kassem, A.; Mostafa, R. A new power management strategy for battery electric vehicles. IET Electr. Syst. Transp. 2018, 9, 65–74. [Google Scholar]
  9. Savio, D.A.; Juliet, V.A.; Chokkalingam, B.; Padmanaban, S.; Holm-Nielsen, J.B.; Blaabjerg, F. Photovoltaic Integrated Hybrid Microgrid Structured Electric Vehicle Charging Station and Its Energy Management Approach. Energies 2019, 12, 168. [Google Scholar] [CrossRef]
  10. Jha, M.; Blaabjerg, F.; Khan, M.A.; Kurukuru, V.S.B.; Haque, A. Intelligent Control of Converter for Electric Vehicles Charging Station. Energies 2019, 12, 2334. [Google Scholar] [CrossRef]
  11. Liu, K.; Makaran, J. Design of a solar powered battery charger. In Proceedings of the Electrical Power and Energy Conference (EPEC), Montreal, QC, Canada, 22–23 October 2009. [Google Scholar]
  12. Neumann, H.; Schar, D.; Baumgartner, F. The potential of photovoltaic carports to cover the energy demand of road passenger transport. Prog. Photovolt. Res. Appl. 2012, 20, 639–649. [Google Scholar] [CrossRef]
  13. Ingersoll, J.G.; Perkins, C.A. The 2.1 kW photovoltaic electric vehicle charging station in the city of Santa Monica, California. In Proceedings of the Twenty Fifth IEEE Photovoltaic Specialist’s Conference, Washington, DC, USA, 13–17 May 1996. [Google Scholar]
  14. Locment, F.; Sechilariu, M.; Forgez, C. Electric vehicle charging system with PV grid-connected configuration. In Proceedings of the IEEE Vehicle Power and Propulsion Conference (VPPC), Lille, France, 1–3 September 2010. [Google Scholar]
  15. Letendre, S. Solar electricity as a fuel for light vehicles. In Proceedings of the 2009 American Solar Energy Society Annual Conference, Boulder, CO, USA, 11−16 May 2009. [Google Scholar]
  16. Tulpule, P.J.; Marano, V.; Yurkovich, S.; Rizzoni, G. Economic and environmental impacts of a PV powered workplace parking garage charging station. J. Appl. Energy 2013, 108, 323–332. [Google Scholar] [CrossRef]
  17. Birnie, D.P., III. Solar-to-vehicle (S2 V) systems for powering commuters of the future. J. Power Sources 2009, 186, 539–542. [Google Scholar] [CrossRef]
  18. Zhang, Q.; Tezuka, T.; Ishihara, K.N.; Mclellan, B.C. Integration of PV power into future low-carbon smart electricity systems with EV and HP in Kansai Area, Japan. J. Renew. Energy 2012, 44, 99–108. [Google Scholar] [CrossRef]
  19. Ross, M.; Hidalgo, R.; Abbey, C.; Joos, G. Energy storage system scheduling for an isolated microgrid. IET Trans. Renew. Power Gener. 2011, 5, 117–123. [Google Scholar] [CrossRef]
  20. Guo, L.; Liu, W.; Li, X.; Liu, Y.; Jiao, B.; Wang, W.; Wang, C.; Li, F. Energy Management System for Stand-Alone Wind-Powered-Desalination Microgrid. IEEE Trans. Smart Grid 2016, 7, 1079–1087. [Google Scholar] [CrossRef]
  21. Kim, J.-Y.; Jeon, J.-H.; Kim, S.-K.; Cho, C.; Park, J.H.; Kim, H.-M.; Nam, K.-Y. Cooperative control strategy of energy storage system and microsources for stabilizing the microgrid during islanded operation. IEEE Trans. Power Electron. 2010, 25, 3037–3048. [Google Scholar]
  22. Lu, X.; Guerrero, J.M.; Sun, K.; Vasquez, J.C. An improved droop control method for DC microgrids based on low bandwidth communication with dc bus voltage restoration and enhanced current sharing accuracy. IEEE Trans. Power Electron. 2014, 29, 1800–1812. [Google Scholar] [CrossRef]
  23. Denholm, P.; Kuss, M.; Margolis, R.M. Co-benefits of large scale plug-in hybrid electric vehicle and solar PV deployment. J. Power Sources 2012, 236, 350–356. [Google Scholar] [CrossRef]
  24. Energy Resilience: Operations, Maintenance, & Testing (OM&T) Strategy and Implementation Guidance; Office of the Assistant Secretary of Defense (Energy, Installations, & Environment): Washington, DC, USA, March 2017.
  25. Helmus, J.; van den Hoed, R. Key Performance Indicators of Charging Infrastructure. In Proceedings of the EVS29 Symposium, Montréal, QC, Canada, 19–22 June 2016. [Google Scholar]
  26. Bahramirad, S.; Khodaei, A.; Svachula, J.; Aguero, J.R. Building Resilient Integrated Grids. IEEE Electrif. Mag. 2015, 3, 48–55. [Google Scholar] [CrossRef]
  27. Li, R.; Dong, Q.; Jin, C.; Kang, R. A New Resilience Measure for Supply Chain Networks. Sustainability 2017, 9, 144. [Google Scholar] [CrossRef]
  28. Zobel, C.W. Representing perceived tradeoffs in defining disaster resilience. Decis. Support Syst. 2011, 50, 394–403. [Google Scholar] [CrossRef]
  29. Yin, C.; Wu, H.; Sechilariu, M.; Locment, F. Power Management Strategy for an Autonomous DC Microgrid. Appl. Sci. 2018, 8, 2202. [Google Scholar] [CrossRef]
  30. Al-Sakkaf, S.; Kassas, M.; Khalid, M.; Abido, M.A. An Energy Management System for Residential Autonomous DC Microgrid Using Optimized Fuzzy. Energies 2019, 12, 1457. [Google Scholar] [CrossRef]
  31. Farzin, H.; Fotuhi-Firuzabad, M.; Moeini-Aghtaie, M. Enhancing Power System Resilience Through Hierarchical Outage Management in Multi-Microgrids. IEEE Trans. Smart Grid 2016, 7, 2869–2879. [Google Scholar] [CrossRef]
  32. Che, L.; Zhang, X.; Shahidehpour, M. Resilience Enhancement with DC Microgrids. In Proceedings of the 2015 IEEE Power & Energy Society General Meeting, Denver, CO, USA, 26–30 July 2015. [Google Scholar] [CrossRef]
  33. Sayed, K.; Gabbar, H. Supervisory Control of a Resilient DC Microgrid for Commercial Buildings. Int. J. Process. Syst. Eng. 2017, 4, 99–118. [Google Scholar] [CrossRef]
  34. Sayed, K.; Abdel-Salam, M. Dynamic performance of wind turbine conversion system using PMSG-based wind simulator. Electr. Eng. J. 2017, 99, 431–439. [Google Scholar] [CrossRef]
  35. Sayed, K.; Gabbar, H.; Nishida, K.; Nakaoka, M. A New Circuit Topology for Battery Charger from 200V DC Source to 12V for Hybrid Automotive Applications. In Proceedings of the 2016 IEEE Smart Energy Grid Engineering (SEGE), Oshawa, ON, Canada, 21–24 August 2016; pp. 317–321. [Google Scholar]
  36. Nissan Leaf. Available online: https://en.wikipedia.org/wiki/Nissan_Leaf / (accessed on 20 October 2018).
  37. Japan Electric Vehicle Association Standards JEVS. Available online: http://www.evaap.org/ (accessed on 16 October 2018).
  38. Abo-Khalil, A.G.; Alyami, S.; Sayed, K.; Alhejji, A. Dynamic Modeling of Wind Turbines Based on Estimated Wind Speed under Turbulent Conditions. Energies 2019, 12, 1907. [Google Scholar] [CrossRef]
  39. Sayed, K.; Kwon, S.; Nishida, K.; Nakaoka, M. New DC Rail Side Soft-Switching PWM DC-DC Converter with Voltage Doubler Rectifier for PV Generation Interface. In Proceedings of the 2014 International Power Electronics Conference IPEC, Hiroshima, Japan, 18–21 May 2014; pp. 2359–2365. [Google Scholar]
  40. Kumar, M.; Srivastava, S.C.; Singh, S.N. Control Strategies of a DC Microgrid for Grid Connected and Islanded Operations. IEEE Trans. Smart Grid 2015, 6, 1588–1601. [Google Scholar] [CrossRef]
Figure 1. Configuration of the proposed DC microgrid based charging station.
Energies 12 04240 g001
Figure 2. Block diagram of different types of charging systems.
Energies 12 04240 g002
Figure 3. Maximum power point tracker (MPPT)control of boost DC-DC converter.
Energies 12 04240 g003
Figure 4. Control of the wind turbine (WT) boost converter interfacing DC microgrid.
Energies 12 04240 g004
Figure 5. Control scheme of battery energy storage.
Energies 12 04240 g005
Figure 6. Representation of DC droop (a) The particular droop of two DG units; (b) v-I droop for the DC microgrid.
Energies 12 04240 g006
Figure 7. DC power flow diagram.
Energies 12 04240 g007
Figure 8. Flow chart of energy management control for the PV/wind/storage system.
Energies 12 04240 g008
Figure 9. Different modes of operation.
Energies 12 04240 g009
Figure 10. Electric vehicle load profile supplied by the DC-microgrid.
Energies 12 04240 g010
Figure 11. The solar radiation, temperature and wind velocity profiles during a typical day.
Energies 12 04240 g011
Figure 12. Daily profiles of renewable power generation and load in the studied system.
Energies 12 04240 g012
Figure 13. The Simulink model of the studied DC microgrid.
Energies 12 04240 g013
Figure 14. DC-microgrid DC-link voltage.
Energies 12 04240 g014
Figure 15. PV panels output voltage and current.
Energies 12 04240 g015
Figure 16. Battery bank voltage and current.
Energies 12 04240 g016
Figure 17. Battery bank SOC.
Energies 12 04240 g017
Figure 18. Wind generator output voltage and current.
Energies 12 04240 g018
Figure 19. The rectified voltage of PMSG output.
Energies 12 04240 g019
Figure 20. AC side voltage for AC charging.
Energies 12 04240 g020
Figure 21. AC side charging current.
Energies 12 04240 g021
Figure 22. Different power values for sources and loads.
Energies 12 04240 g022
Figure 23. The schematic representation of resilience [27].
Energies 12 04240 g023
Figure 24. Dc-link voltage for calculating the resilience.
Energies 12 04240 g024
Table 1. The output of the charging station.
Output QtyWorking Hours
Faster DC charger50 kW224
DC standard charger10 kW424
Lights and other loads10 kW 12
The total output150 kW
Table 2. PMSG parameters [29].
ParameterValueUnit
Stator resistance0.02
d-axis inductance Ld7mH
q-axis inductance7mH
Vpk/krpm98.7
No. of poles (P)8
Moment of inertia8 × 10−3N-msec2
Mechanical time constant0.04
Table 3. System parameters.
ItemDescription
PV Arraycomposed of 330 modules SunPower SPR-305E-WHT-D with series and parallel combination (Nser = 5 Npar = 66) rating 100 kW
Wind turbineRated output power = 10 kW
Wind speed base = 12 m/s
Base rotational speed = 500 rpm
Initial rotational speed = 200 rpm
Moment of inertia = 0.08 p.u
Li-ion batteryA 48 V, 500 Ah, system
Battery state of chargeSOCmin–SOCmax: 60–90 [%]
Bidirectional DC-DC converterA 50 kW, A controlled voltage/current outputs
Inverter systemA 150 kVA, 270 V DC in, 200 V AC, 60 Hz

