Article

Innovative Membrane Electrode Assembly (MEA) Fabrication for Proton Exchange Membrane Water Electrolysis

Department of Mechanical Engineering of Yuan Ze University, Taoyuan City 32003, Taiwan
*
Author to whom correspondence should be addressed.
Energies 2019, 12(21), 4218; https://doi.org/10.3390/en12214218
Submission received: 1 October 2019 / Revised: 25 October 2019 / Accepted: 1 November 2019 / Published: 5 November 2019

Abstract

:
In order to increase the hydrogen production rate as well as ozone production at the anode side, increased voltage application and more catalyst utilization are necessary. The membrane electrode assembly (MEA) produces hydrogen/ozone via proton exchange membrane water electrolysis (PEMWE)s which gives priority to a coating method (abbreviation: ML). However, coating takes more effort and is labor-consuming. This study will present an innovative preparation method, known as flat layer (FL), and compare it with ML. FL can significantly reduce efforts and largely improve MEA production. Additionally, MEA with the FL method is potentially durable compared to ML.

1. Introduction

The greenhouse effect of this century is increasing and hence, a reduction of carbon dioxide emission through various methods is the global consensus. Developing clean and renewable energy has been the main target until now. However, the major issue of renewable energy is the unstable output of power that is affected by seasonal and environmental factors, which results in electric grid management difficulties. The advantages of proton exchange membrane water electrolysis (PEMWE) as energy storage are its high current density, high purity gas production, and compact system. The membrane electrode assembly (MEA), including anode/electrolyte/cathode, is a key component of PEMWE. If the anode is composed of noble metal oxide-IrO2, PEMWE produces hydrogen and oxygen at the cathode and anode side during the off-peak period for energy storage. The supply of stored hydrogen and oxygen gas for the fuel cell is used to generate power during the peak-hour period. If the anode of the MEA is composed of low-cost PbO2 accompanied with a higher operating voltage, ozone gas will be generated in addition to oxygen. The PEMWE technique which uses MEA produces three kinds of gases (H2, O2, O3) and will expand the application area [1,2,3,4,5,6].
In PEMWE, an anode with a proper catalyst enables a hydrogen production rate at a voltage of 2 V or less (Equation (1)). When seeking a higher production of hydrogen, the applied voltage is increased accompanied by a higher generated current as well as hydrogen (proton) according to the Faraday laws. Moreover, the anode catalyst is replaced by anti-corrosion material (ex. lead oxide) accompanied by a higher voltage applied, and ozone will be generated at the cathode in addition to oxygen (Equation (2)). Principles of PEMWE generating oxygen (ozone)/hydrogen and oxygen/hydrogen production are shown in the reaction equations are as follows: Anode:
2H2O → O2 + 4H+ + 4e (1.23 V)
3H2O → O2(O3)+ 6H+ + 6e (1.51 V)
Cathode:
2H+ + 2e → H2
To prepare MEA for traditional proton exchange membrane fuel cells (PEMFC), spray catalyst ink on a gas diffusion layer (GDL) to form a gas diffusion electrode (GDE), and then stack the GDE of both cathode and anode with proton exchange membrane (as electrolyte) for hot pressing to form a complete three-layer MEA [7]. In addition, common methods to fabricate MEAs include the catalyst-coated membrane (CCM) process and the decal method. CCM means spraying catalyst inks directly on different sides of the membrane, and the decal method means coating catalyst inks on substrate to further transfer to both sides of the membrane. The three fabricated layers are then incorporated with two GDLs to form the complete MEA [8,9,10,11,12,13,14]. The MEA of PEMWE for hydrogen/oxygen production is mainly prepared [15,16,17,18,19,20] with the above methods. The CCM method is a small scale recommended for producing MEAs in the laboratory, and the decal method can be scaled-up as a pilot plant [21,22]. Common to these three methods described above is both cathode and anode catalysts are bonded strongly with the membrane and is named as membrane layer and abbreviated as ML. Use of ML to manufacture oxygen (ozone)/hydrogen and oxygen/hydrogen MEA is time-consuming and labor-intensive and can be a challenge to mass production. In this study, a new method called flat layer (FL) is proposed. The dried anode ink is flat-layer (FL) deposited and confined onto the membrane, whereas the cathode is hot pressed on the membrane the same as with ML. A characteristic of the FL method is to form a loose interface between the anode and membrane to avoid change during wet-operation or dry-closedown of PEMWE. FL, will not only be effective in significantly enhancing MEA production but it will also potentially improve the durability of PEMWE.

2. Materials and Methods

The electrolyte used for MEA production is DuPont’s Nafion 117, a perfluorinated sulfonic acid membrane with a 40 × 40 mm2 area. The cathode gas diffusion electrode is from Yangtze Corporation (40% Pt/C catalyst, Pt loading 0.5 mg/cm2). The electrolyzer housing is purchased from China Guangyuan Instrument (GQ-DJ800). The electrolyzer housing is to conduct both mass transfer as well as electric transfer of the MEA. The mass transfer includes injection of water to the anode while generating hydrogen and oxygen (or ozone) from the anode and cathode, respectively. The electric transfer includes an applied voltage to or generated current from the MEA. The assembly torque is 30 kgf/cm2. The only difference lies in the anode preparation method for comparison. The ambient temperature is maintained at 20 °C via water cooling throughout the water electrolysis process.

2.1. Anode Preparation

For ML, coat the anode catalyst ink to the transfer substrate layer by layer and then dry it gradually. Once the dry anode catalyst ink on the transfer substrate reaches the set amount (35 mg/cm2), it is then transferred to the membrane with hot pressing (left of Figure 1). The reaction area is 30 × 30 mm2. After completion of the coating, the two-layer structure (anode/electrolyte) is stacked with the commercial cathode in a sandwich method for 2 min hot pressing at 135 °C resulting in a three-layer MEA. For the FL method, the commercial cathode and membrane are hot-pressed first to generate a two-layer structure. The prepared anode catalyst ink is dried at 90 °C for 50 min, then it is filled in a confined area onto the membrane side of the two-layer membrane/cathode structure (right of Figure 1). The amount of fill is equivalent to that of coating used in the previous ML. The time required for the two methods is very different. ML takes about 30 min to prepare an MEA, while FL only requires about 5 min to complete, so FL is superior in terms of production rate.

2.2. Electrolysis Test

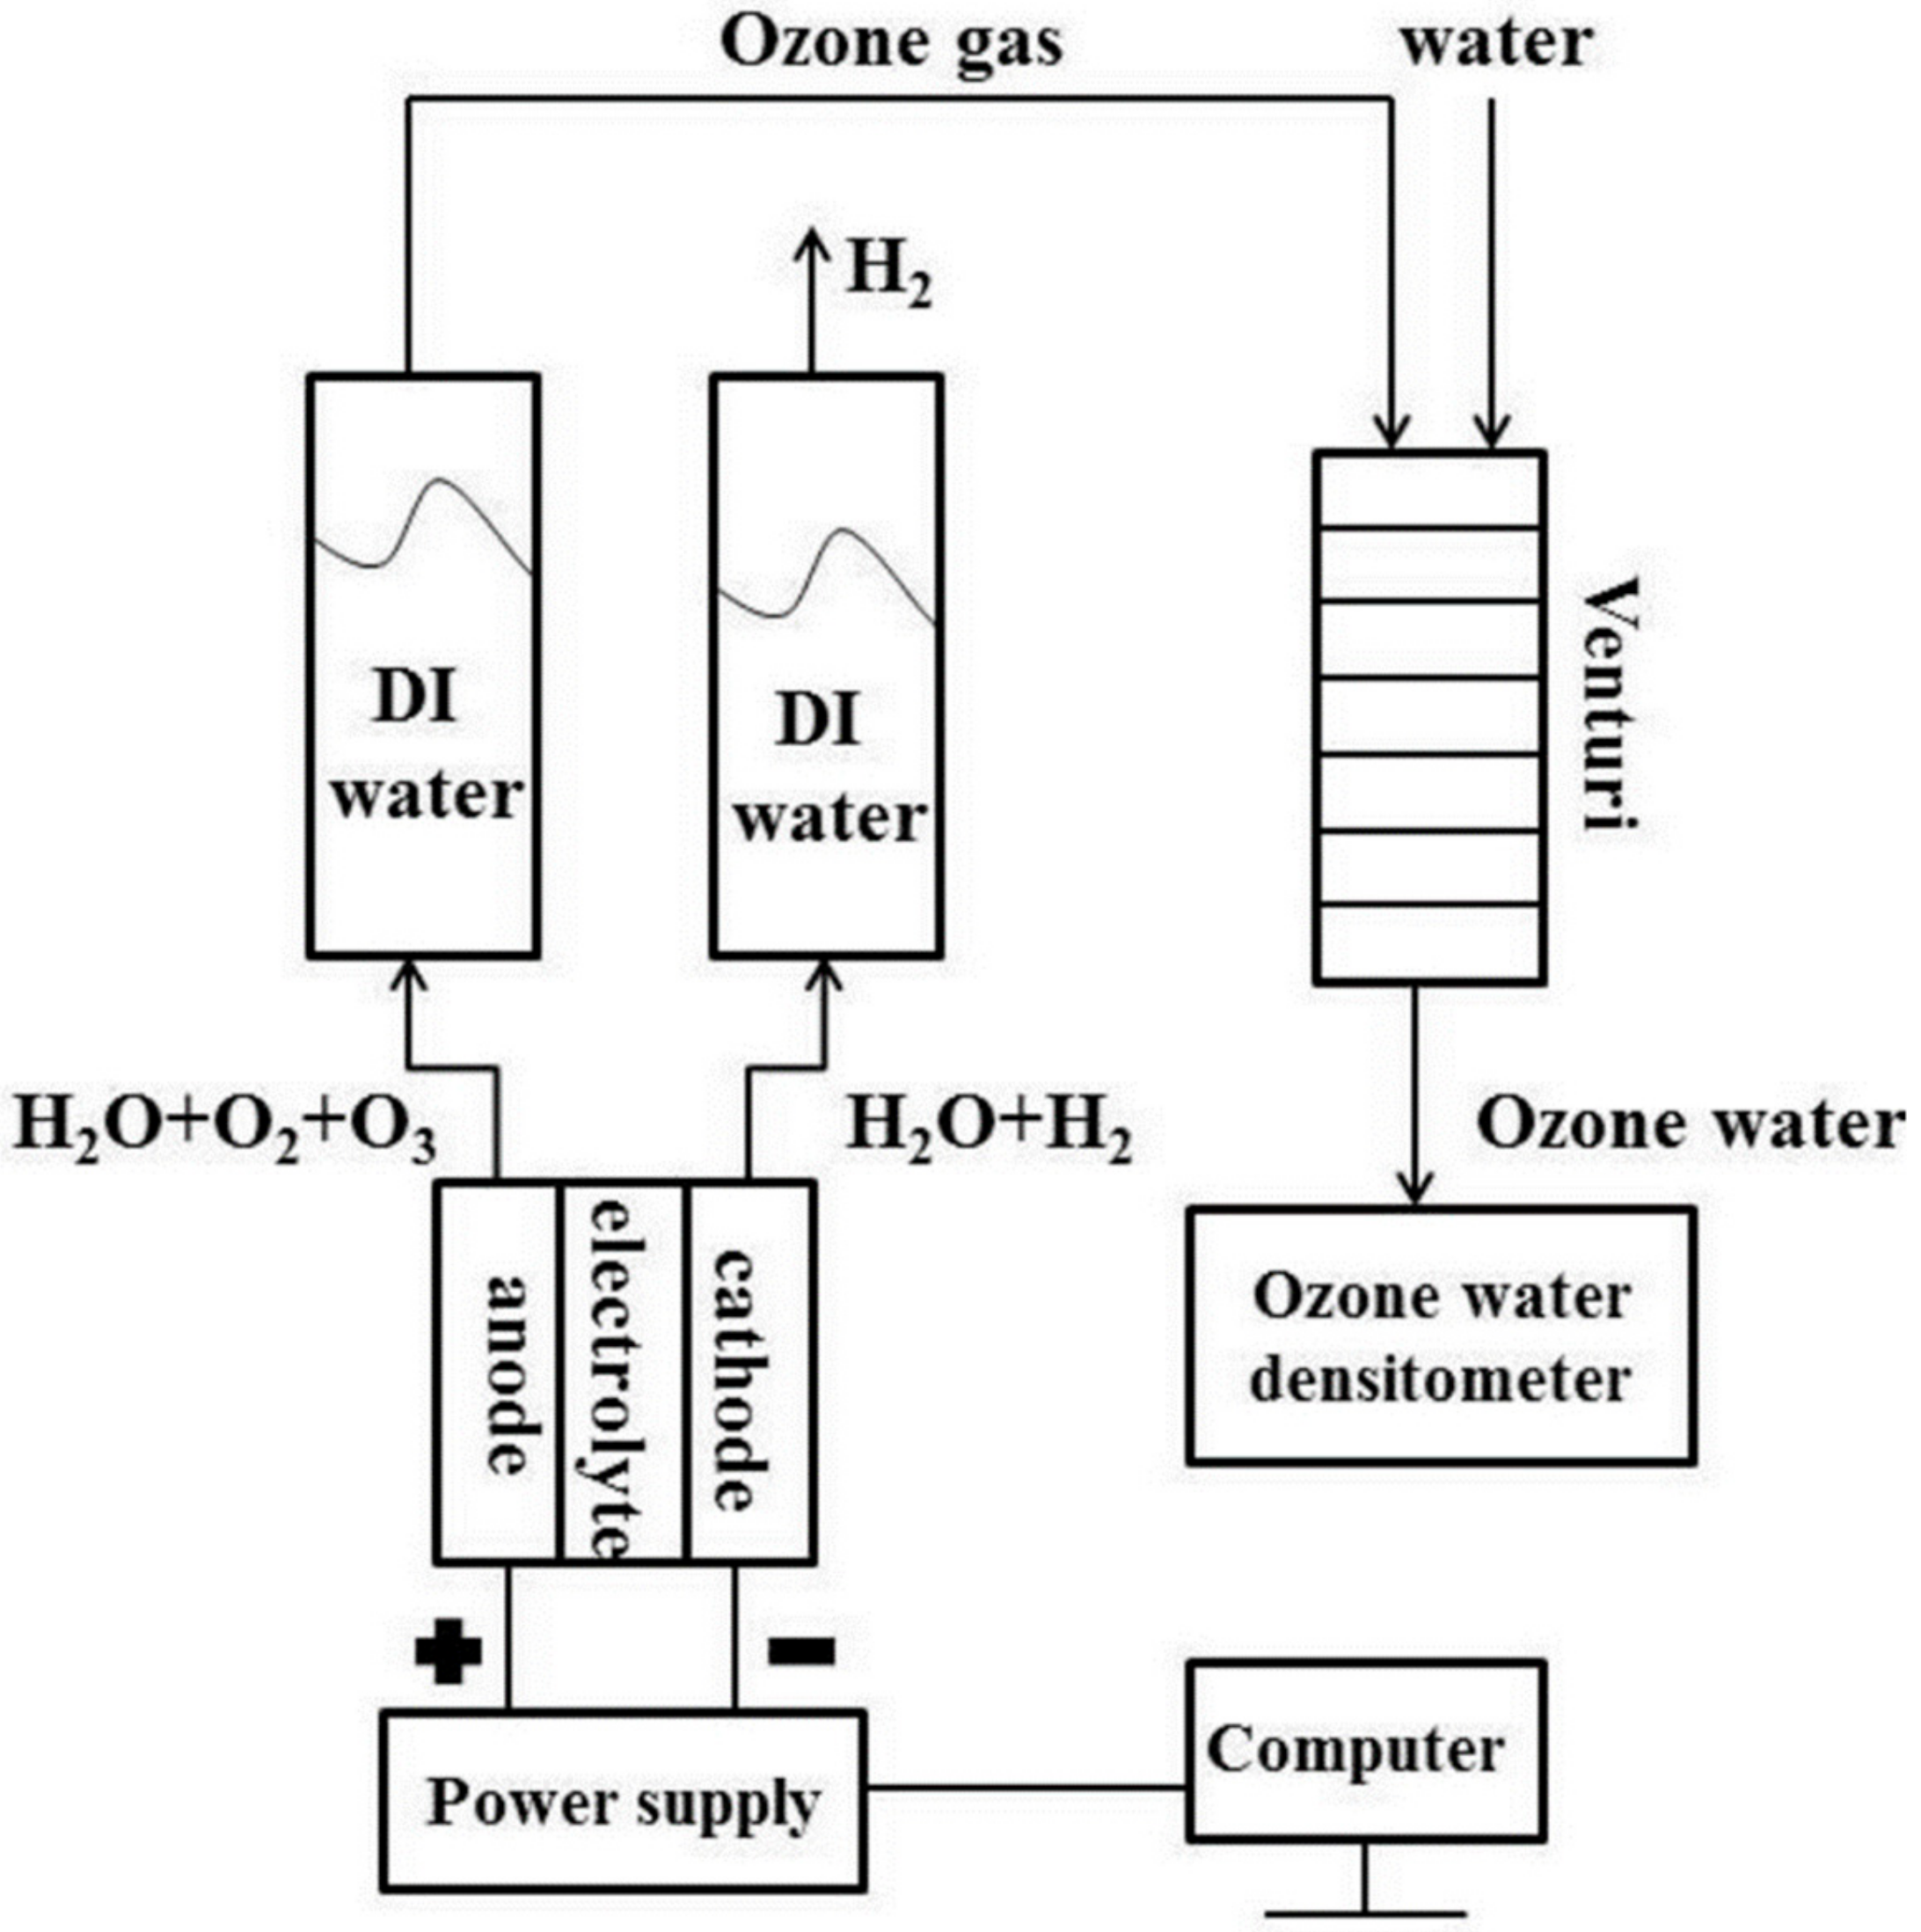
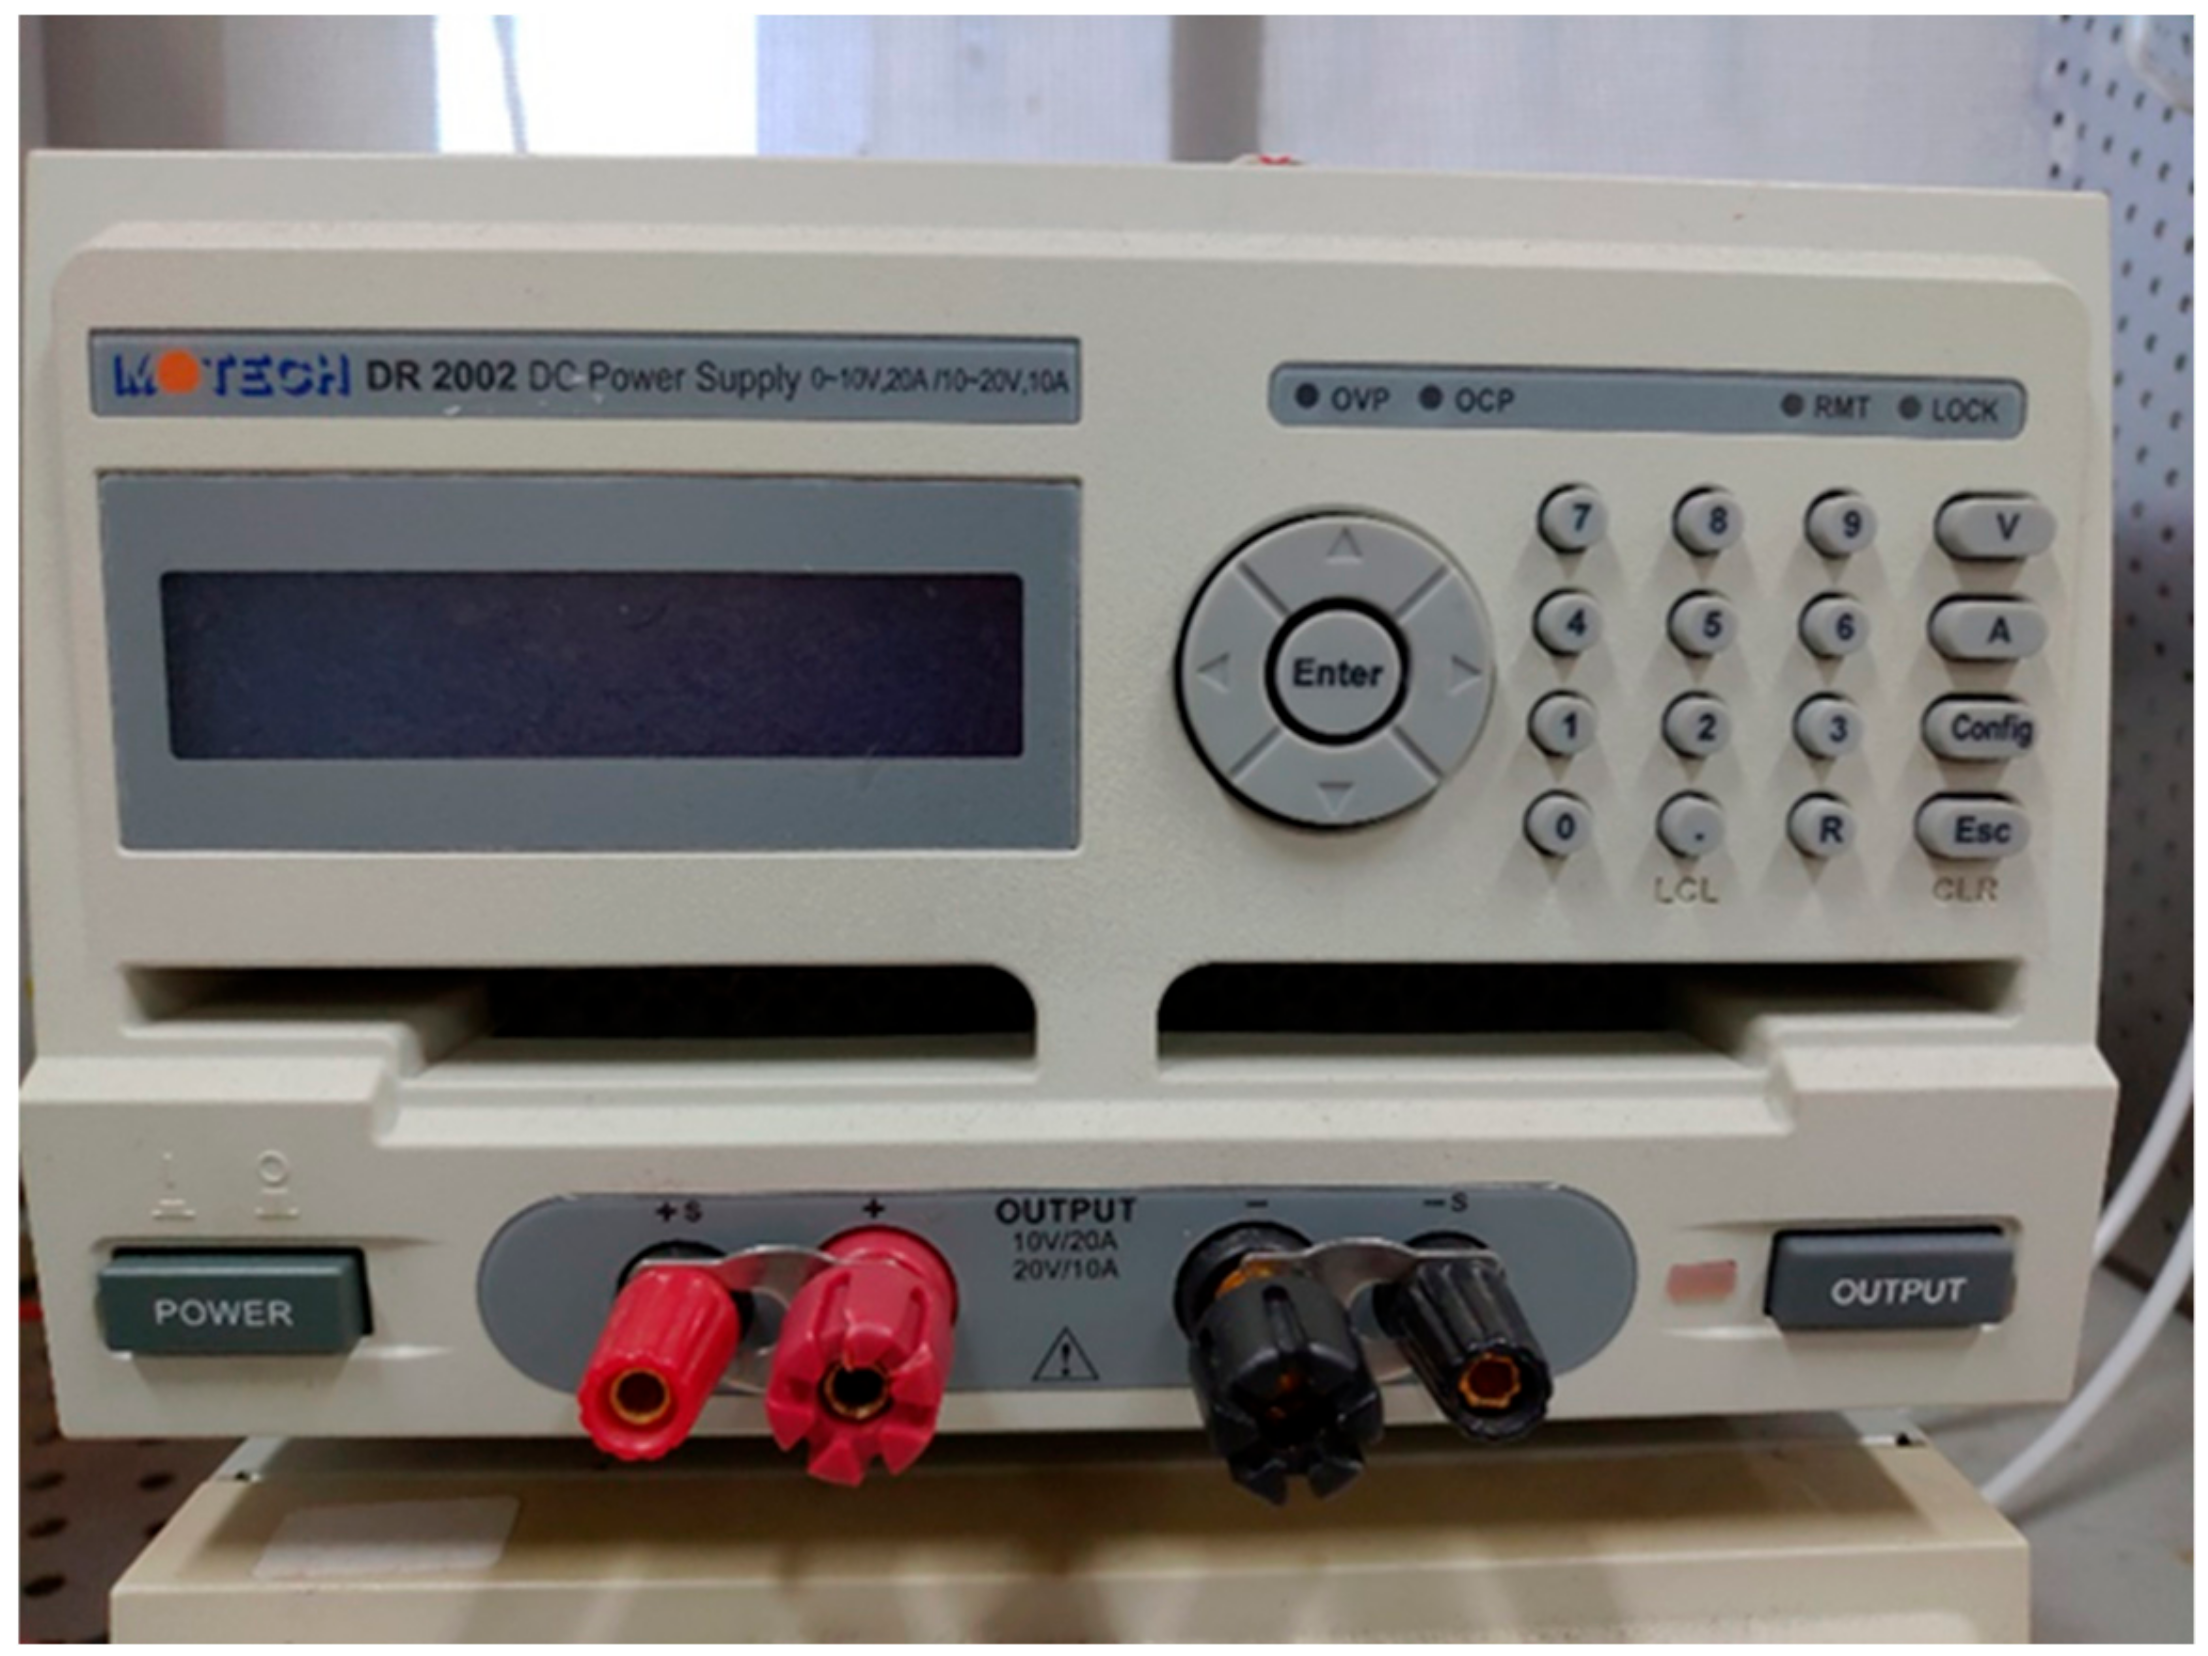
Figure 2 shows the PEMWE test system. A constant-voltage of 4.5 V is applied to the electrolyzer (MEA + 2 End Plates), and the MEA performance is evaluated according to the generated current. It is operated by a power supplier (DR2002, MOTECH Corp., TAIWAN) which is shown in Figure 3. The higher the current, the more hydrogen and oxygen (ozone) is generated. In addition, according to the study noted by Onda et al., to produce hydrogen and oxygen (ozone) via PEMWE, MEA will reach a steady-state after 8 hours of activation, but the current will drop when power is interrupted and restored [23]. In this study, the MEA is powered by 4.5 V with a continuous 12-hour operation as activation. After the activation, the power is cut for 1 min, 10 min, and 1 h. After 1 min, 10 min, and 1 h, the MEA is restored at 4.5 V for 1 h to observe the current recovery (retaining the moisture of anode and cathode throughout the experiment).

2.3. Electrochemical Impedance Analysis

Use of electrochemical impedance spectroscopy to compare the MEA impedance of the two methods. The electrical resistance and charge transfer resistance of the MEAs fabricated with different methods are compared at high and low-frequency regions, respectively.

2.4. Accelerated Aging

2.4.1. High-Temperature Effect

Millet et al. reported the performance decline of electrolyzer caused by degradation while a high temperature will cause a perforated membrane and thus, a dangerous mix of hydrogen and oxygen [24]. Therefore, in this study after the 12 h MEA activation at 4.5 V, the MEA (as well as the end-plates) will be dried for 1 h at 150 °C (160 °C) and then powered for 10 min repeatedly so that the MEA (including membrane and the catalyst layer) are in harsh environments. The impacts of high temperature on the performance of the MEAs fabricated from the two methods are observed.

2.4.2. High-Voltage Effect

Theoretically, the voltages are 1.23 and 1.56 V for hydrogen/oxygen production and for hydrogen/oxygen(ozone) production, respectively [16]. In reality, the voltages needed are 2.0 V and 3.0 V for hydrogen/oxygen production and for hydrogen/oxygen(ozone) production, respectively. Although the higher the voltage and the higher the current, the more hydrogen and oxygen (ozone) is produced. The higher voltage and higher hydrogen/oxygen generated lead to harsh conditions encountered by the anode catalyst and both electrode structures. In this study, a higher voltage of 4.5~6.0 V is applied in order to learn the response of the MEAs fabricated from the two methods (ML and FL) through performance and durability tests.

3. Results and Discussion

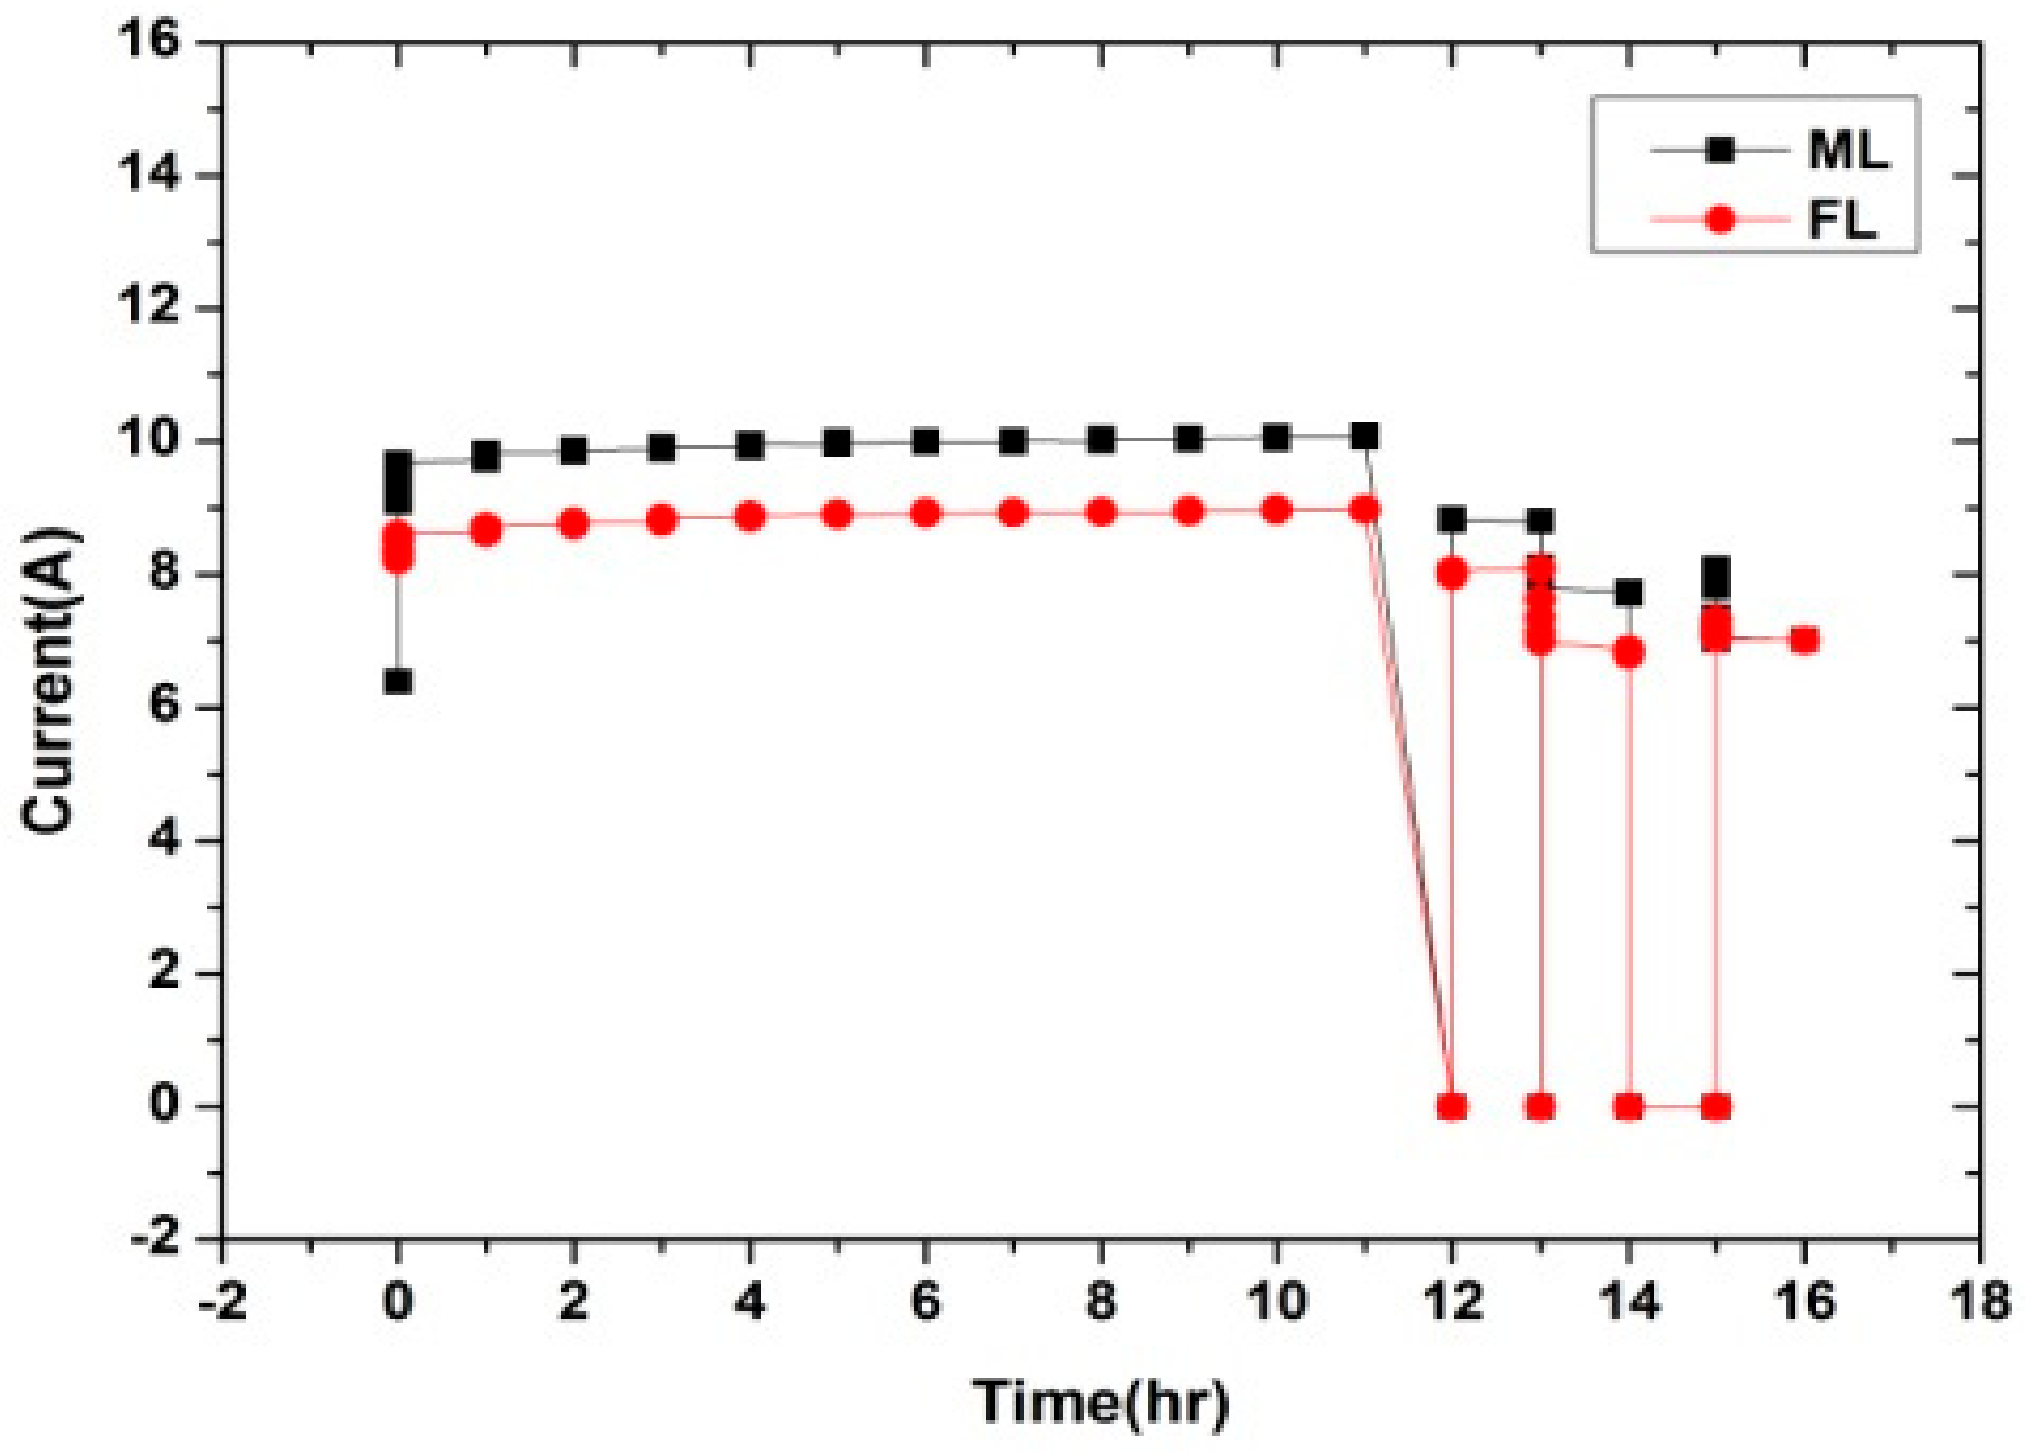
A high voltage of 4.5 V is applied to the assembled electrolyzer and the ambient temperature is maintained at 20 °C during activation stages. High voltage is utilized in order to generate higher current as well as more generated oxygen/ozone gas. More generated oxygen/ozone gas will create harsh conditions to the anode structure as they penetrate through it. During the activation stages (0–12 h), the current of ML is slightly higher than that of FL, as shown in Figure 4. The currents of the two MEAs, ML and FL, at the end of the activation stages are 9.79 and 8.79 A, respectively. The performance of FL is 10.3% lower compared to that of ML. Both ML and FL exhibit a slow increase and stable state which proves the feasibility of FL. After power interruption and restoration, the currents of ML and FL decline by 30.5% and 22.4%, respectively. Similar trends had been reported by Onda et al. [23]. FL shows better resistance to lower performance compared to that of ML due to the dynamic state of the anode catalyst layer. A characteristic of the FL method is to form a loose interface between the anode and membrane to avoid change during wet-operation or dry-closedown of PEMWE. Therefore, FL can not only significantly enhance MEA production but also improve the durability of PEMWE after power interruption and restoration.
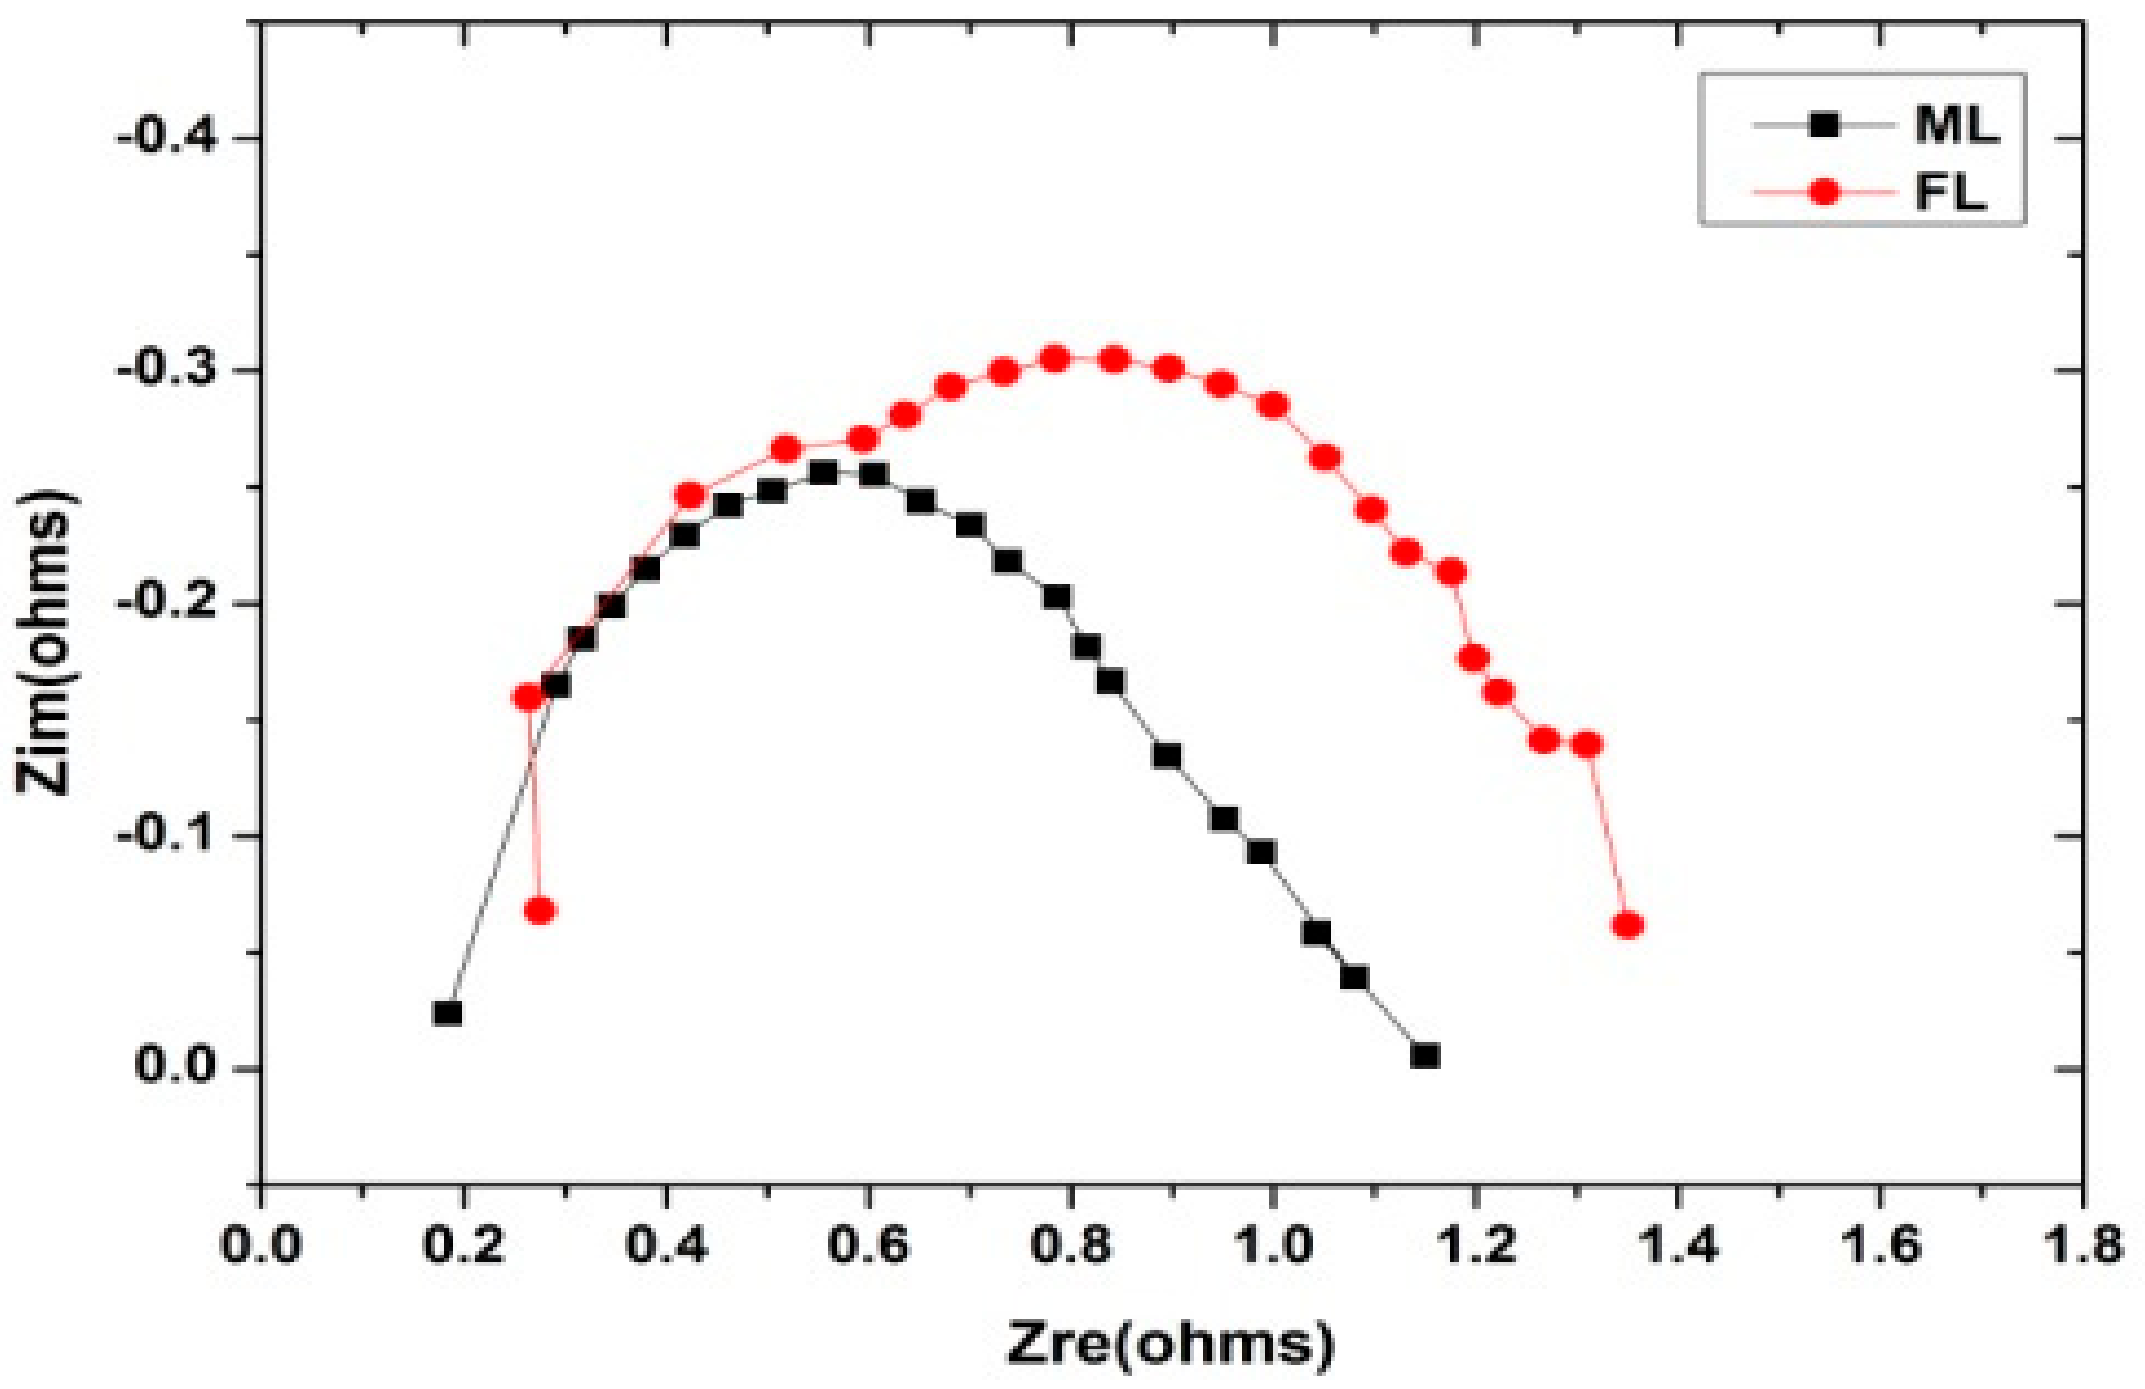
Figure 5 shows the analysis and comparison of the electrochemical impedance of ML and FL and the input voltage at 4.5 V. In the high-frequency portion, the impedance of ML is 0.18 Ω and that of FL is 0.27 Ω, indicating that the ohmic resistance of ML is less than that of FL. The lower the ohmic resistance, the higher the electrolytic current, which matches the current results from the activation stages as shown in Figure 4. In the low-frequency portion, the curve radius of ML (1.20 Ω) is less than that of FL (1.39 Ω), indicating that its catalytic reaction rate is better than that of FL [16]. Higher resistance of FL is due to its loose structure compared with ML, this will lead to lower conductivity resulting in a lower catalytic reaction rate.
Under an accelerating test with high voltage (4.5 V) and high-temperature drying, both the currents of the MEAs of the two different methods after high-temperature and power restoration are much lower than the activation current as shown in Figure 6. Figure 6 shows the currents of the two methods decline by 81% (ML) and 90% (FL) when the power is restored after the first high temperature (drying), which indicates that neither of the two methods is able to work properly after high-temperature drying. After eight cycles, the current of ML declines by 90%, and that of FL declines by 97%, showing that in this operating environment, ML is slightly better than FL. The structure is fixed in the hot pressing process of ML at 135 °C, and only some flakes will peel off even after the high-temperature drying (left of Figure 7). The structure of FL after drying shows more cracks, as shown in the right of Figure 7. Furthermore, after disassembling the electrolyzer, we found that the structure of ML is fairly complete, while some areas of FL are white molten (right of Figure 7), which is due to the partial melting of polytetrafluoroethylene [18].
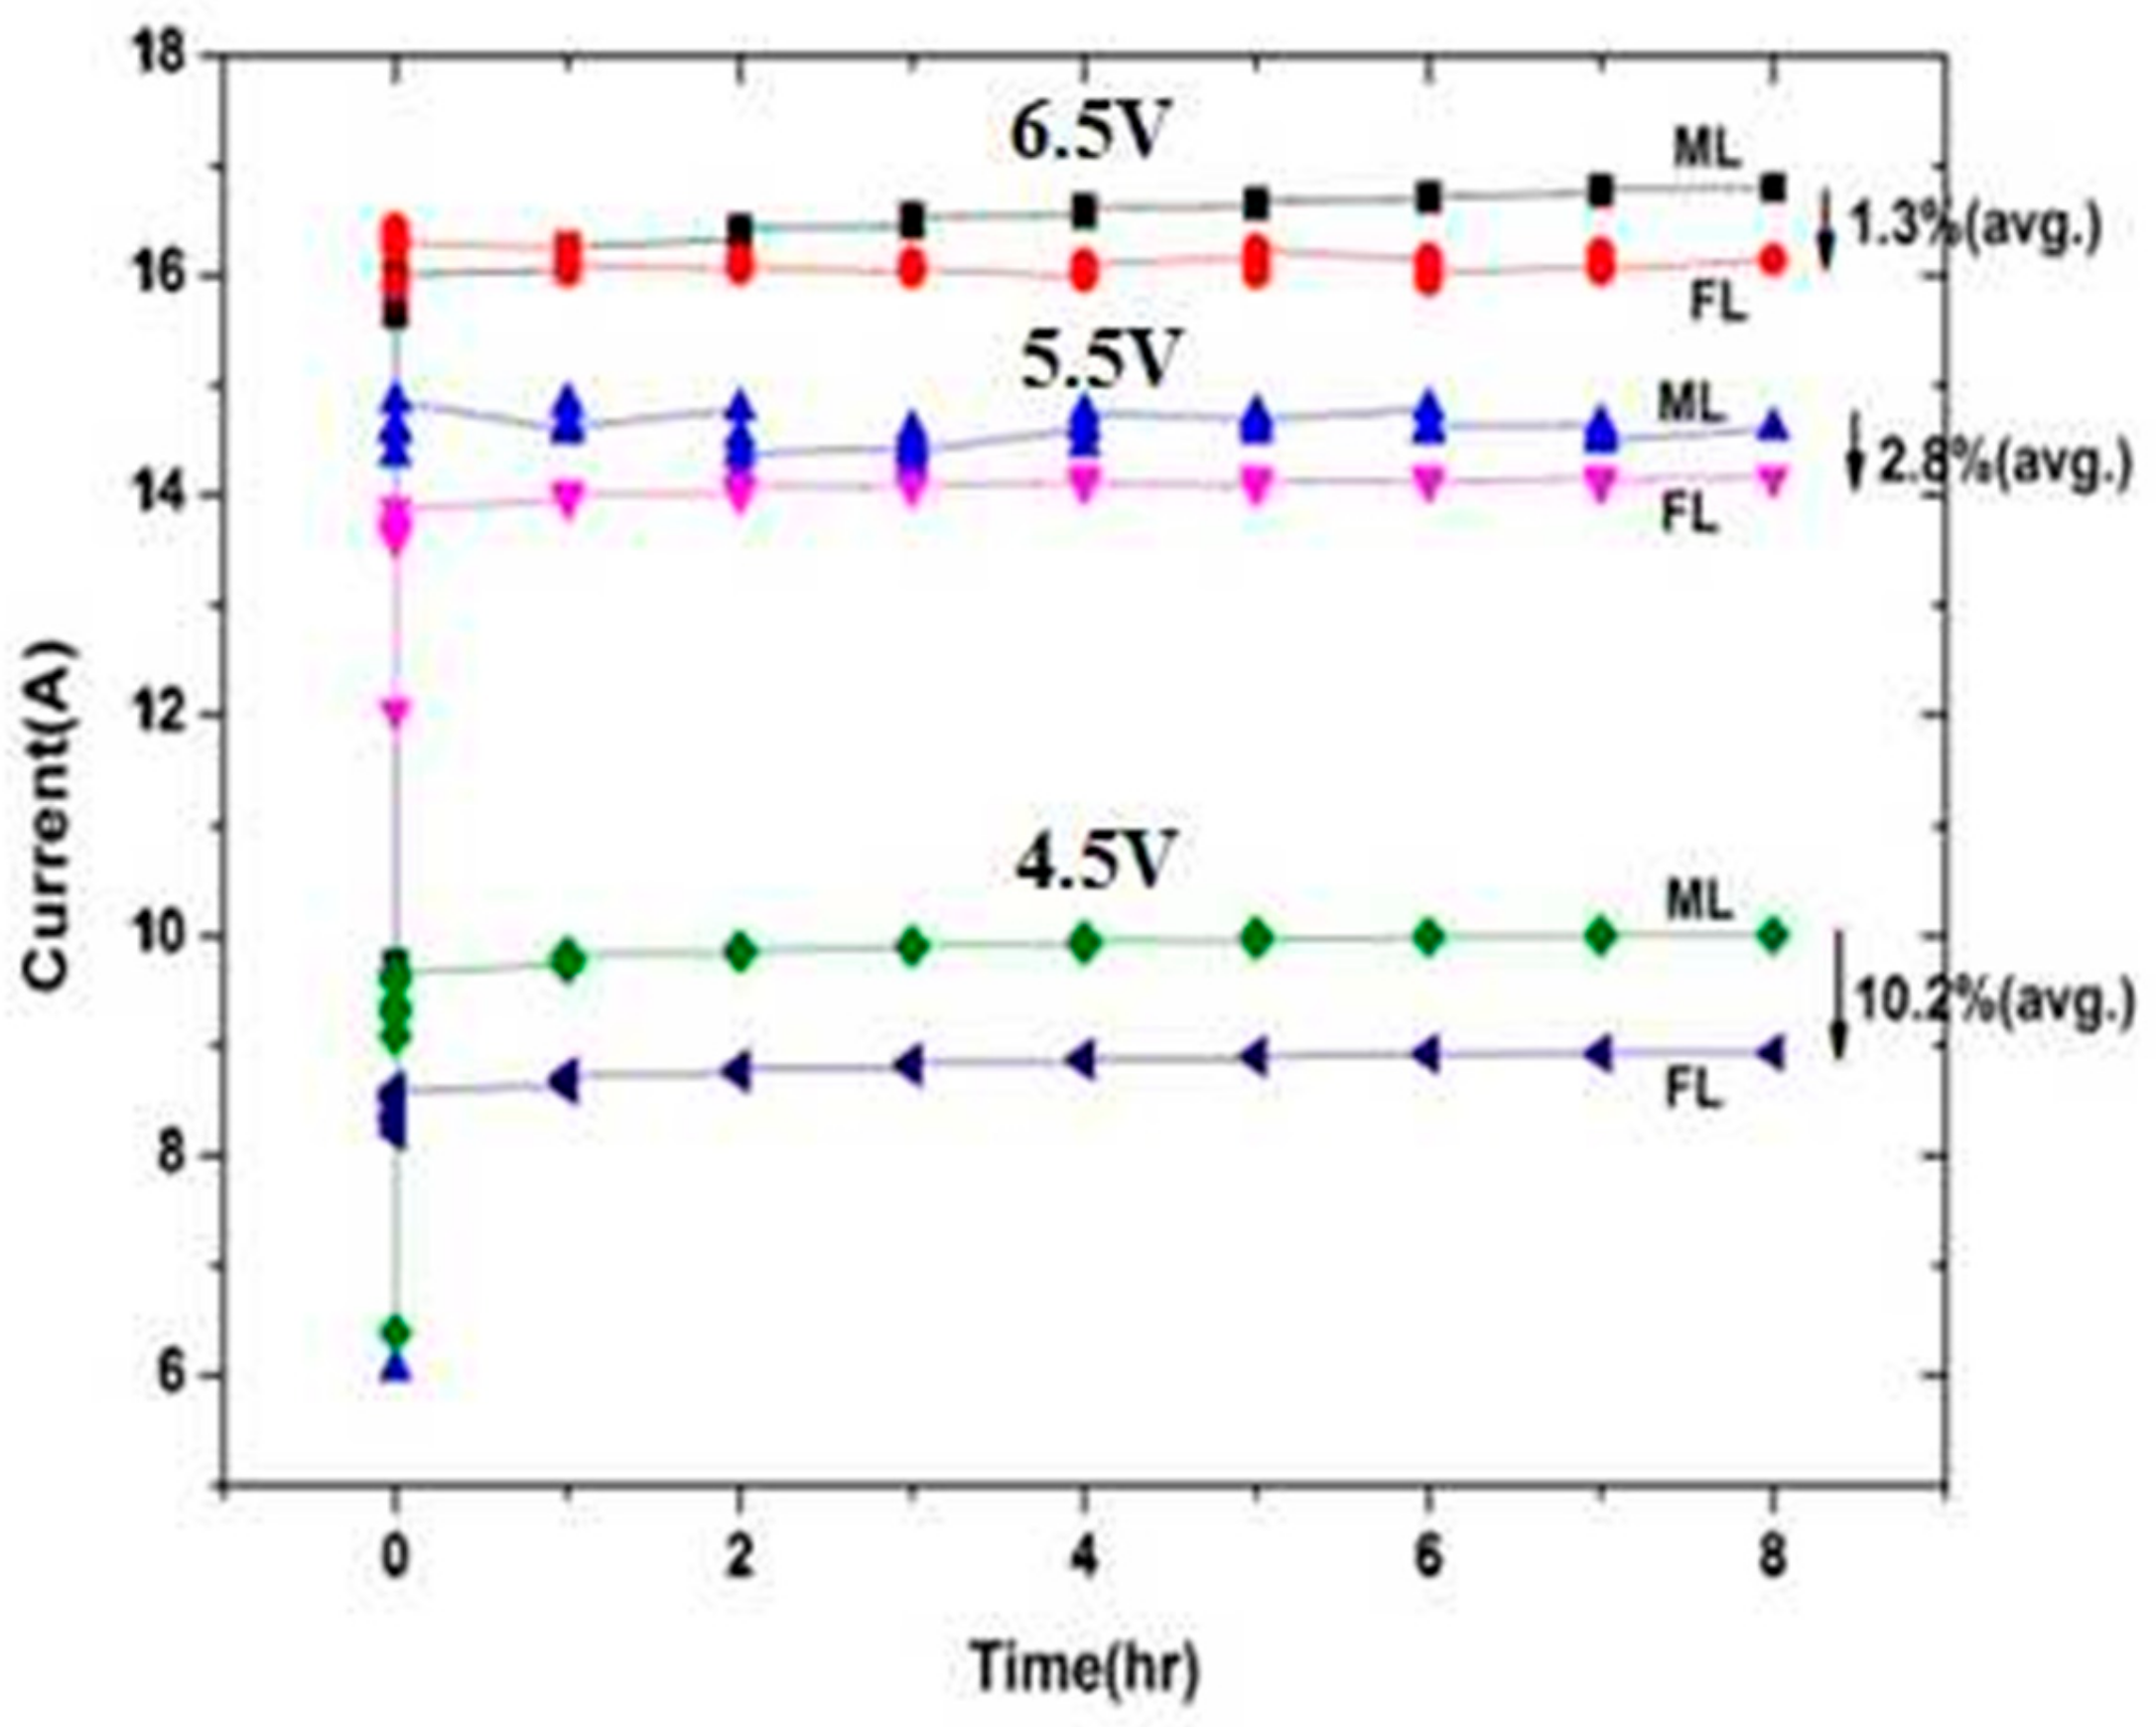
The applied voltage is further increased from 4.5, 5.5, to 6 V, and the generated current of ML and FL after 12 h activation are shown in Figure 8. When the voltage is 4.5 V, the average current of FL is approximately 10.2% lower than that of FL. As it increases to 5.5 V and 6.0V, the difference is 2.8% and 1.3%, respectively. The results indicate that in the case of high voltage, the performance of FL is lower than that of ML. With the voltage further increased and thus, the deterioration of the environment, FL narrows the gap with ML. The performance of electrolysis increases with voltage, indicating the increased anode ozone and oxygen production and increased overall gas output will cause more structural damage to ML compared to that of FL. The results show that in the case of ultra-high voltage and large anode gas production, the process of FL will be better than that of ML.
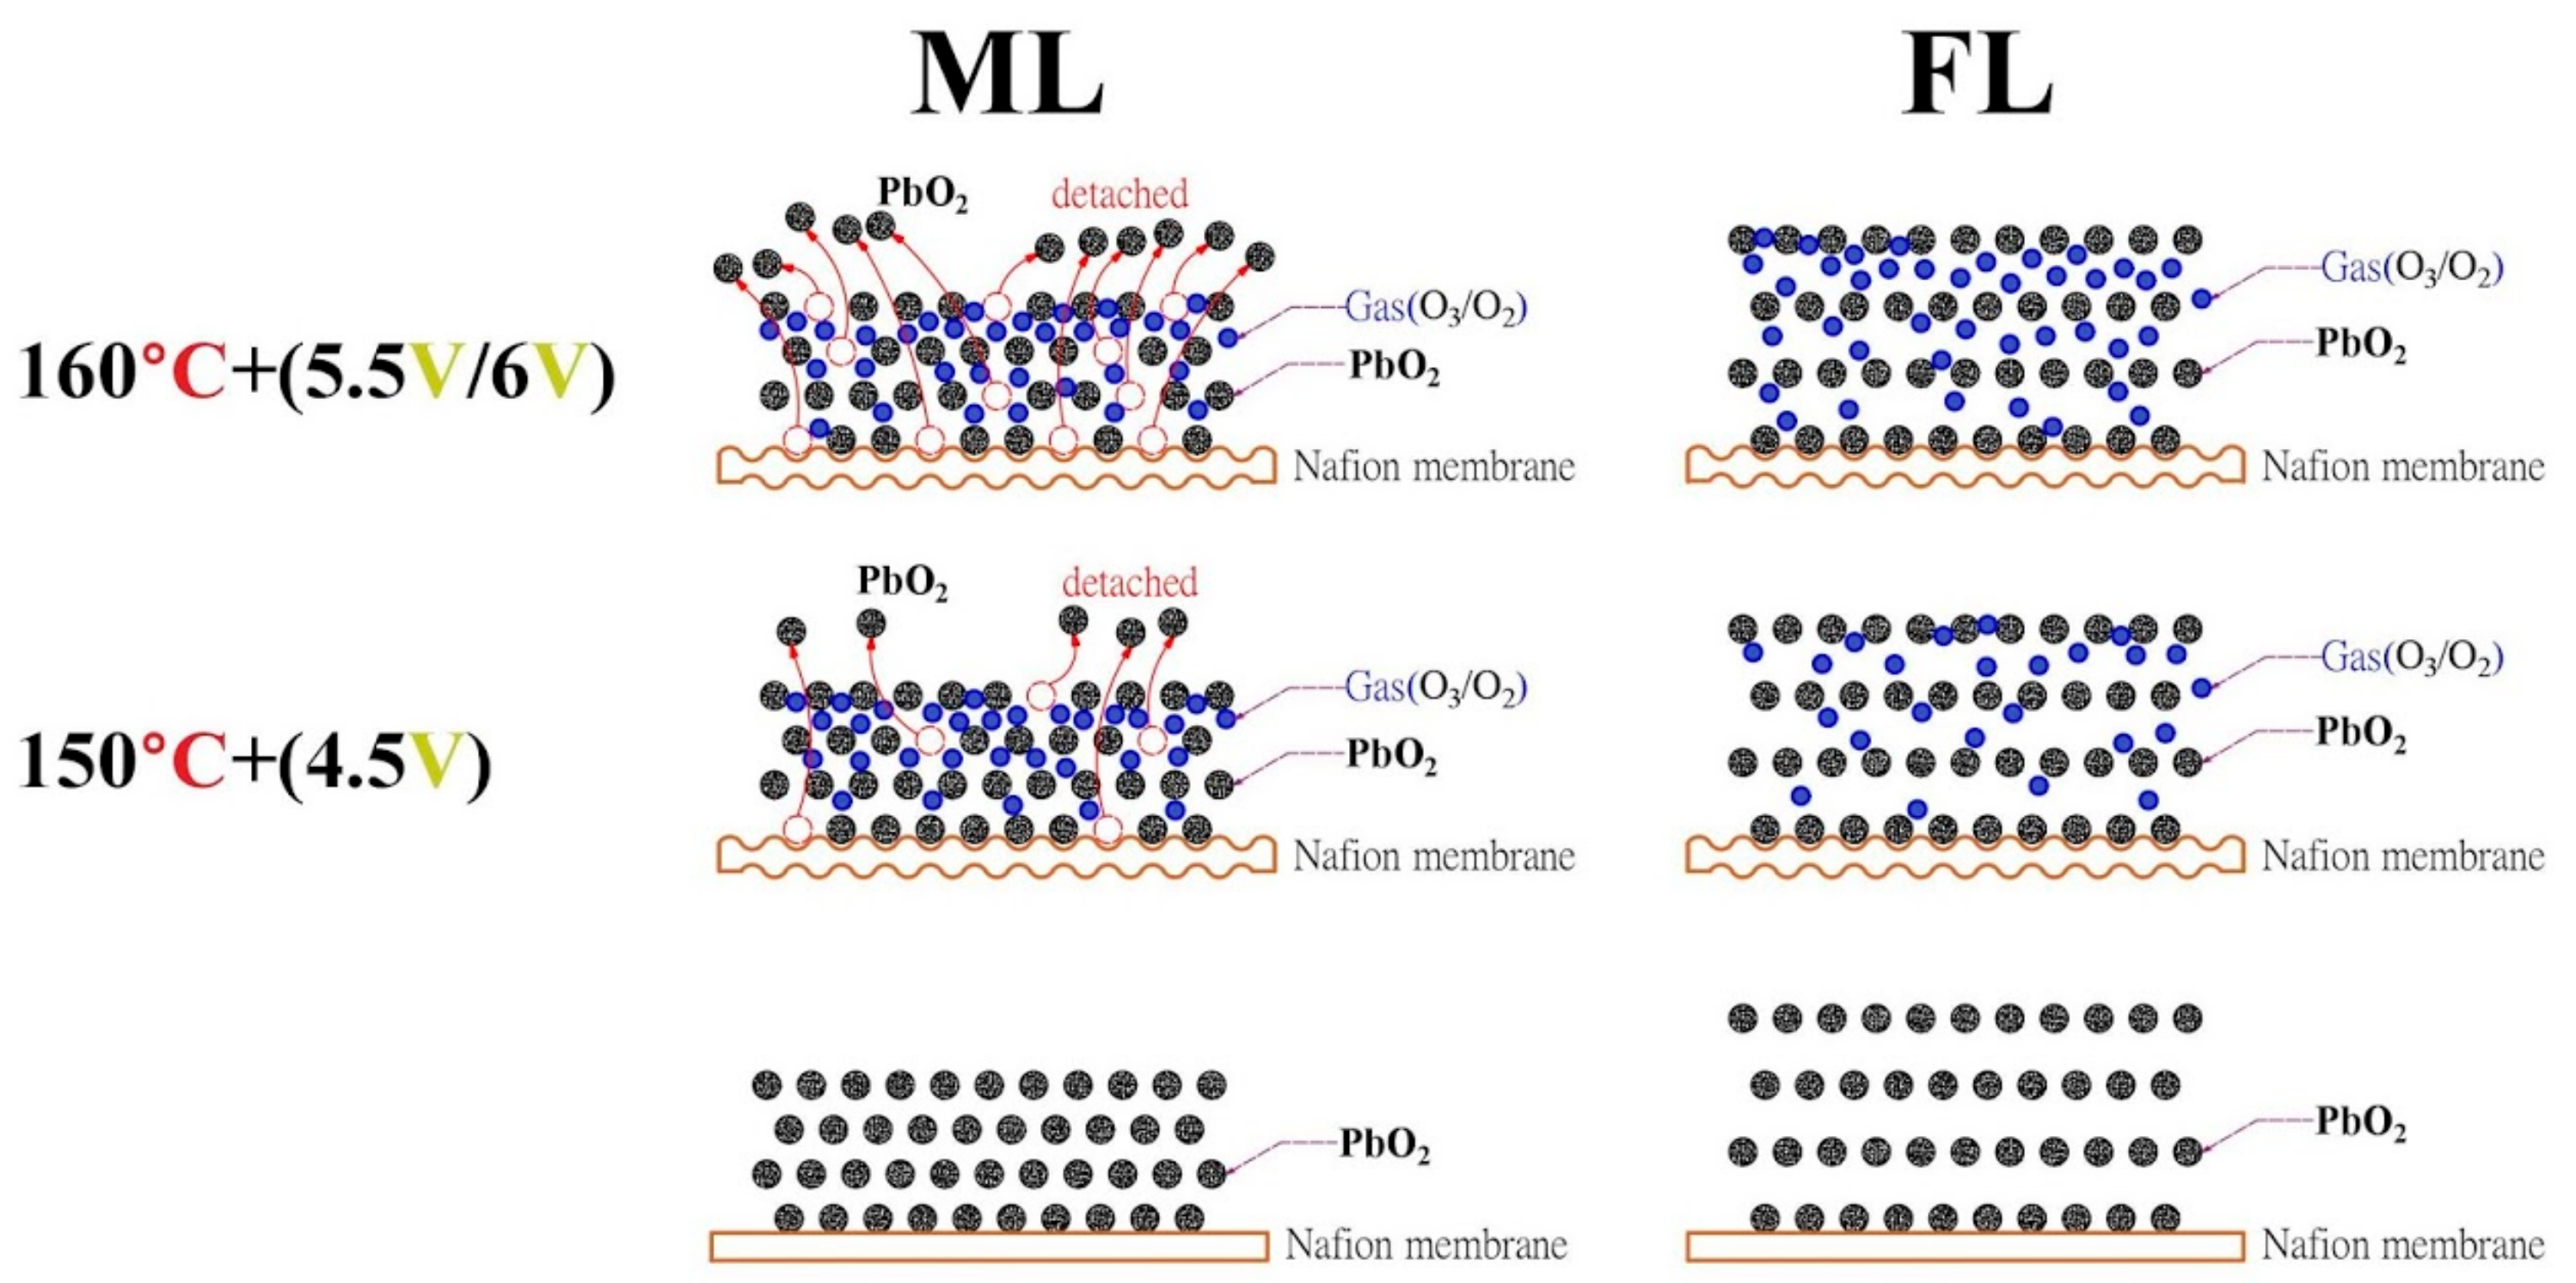
According to the experimental results from Figure 4, Figure 5, Figure 6, Figure 7 and Figure 8, structural simulation of both ML and FL after the accelerating test (high-temperature drying + high-voltage applied) is shown in Figure 9. Before the accelerating test, the anode structure (PbO2) of ML (bottom left) is arranged closely to the Nafion membrane (electrolyte) compared to loosely contacted in that of FL (bottom right). During the accelerating test (high voltage applied + high-temperature drying), the interface between anode and Nafion is weakened during high-temperature drying and wet operation, whereas some PbO2 particles are carried away from their position due to high O2/O3 flow rate (center left). If the temperature and voltage are further increased, the anode structure will be more greatly deteriorated (top left). Due to the loose contact between anode and Nafion membrane (electrolyte) accompanied by a weak connection between anode particles (PbO2), the effect of high-temperature drying and high-voltage applied on the change of the anode structure is minor (center right, top right) compared to that ML.

4. Conclusions

MEA preparation in the PEMWE technology is time consuming and labour-intensive, and the experimental test will damage the anode structure of the traditional ML and thus, its performance. The innovative FL thereby derived is proven to have a better preparation rate than ML in practical tests and can effectively save more than 80% labor time. The anode catalyst layer of FL retains a loose and unstable/flowable structure, thus its conductivity is lower compared to the solid and stable structure as in the traditional ML. Therefore, for operation of electrolyzer under normal voltage or temperature, performance/durability of ML is better than that of FL. For operation of electrolyzer under a higher voltage or temperature for more production of hydrogen and oxygen (ozone), the solid and stable structure of ML would be a resistance for more generated hydrogen and oxygen (ozone) to penetrate. However, the higher the voltage and the harsher the operation conditions, the current of FL gradually approaches that of ML.
In summary, FL is slightly inferior to ML in terms of electrolytic effect in the general environment, but in the face of harsher operation conditions, the performance of FL gradually approaches or is more superior than that of ML, which also provides a better alternative for medical purposes and sterilization that require high oxygen and ozone concentrations.

Author Contributions

Conceptualization, G.-B.J. and C.-C.Y.; Methodology, G.-B.J. and S.-H.C.; Validation, G.-B.J. and S.-H.C.; Formal Analysis, G.-B.J., C.-C.Y. and C.-J.L.; Investigation, G.-B.J., C.-C.Y. and J.-W.Y.; Data Curation, C.-J.L.; Writing-Original Draft Preparation, J.-W.Y. and G.-B.J.; Writing-Review & Editing, J.-W.Y. and G.-B.J.; Visualization, J.-W.Y.; Supervision, Shih-Hung Chan; Project Administration, S.-H.C.; Funding Acquisition, G.-B.J.

Funding

The authors are grateful to the Ministry of Science and Technology of Taiwan, under contracts MOST106-2221-E-155-042, MOST108-3116-F-155-001 and MOST108-2221-E-155-002 for their financial support.

Conflicts of Interest

The authors declare no conflict of interest.

References

  1. Buttler, A.; Spliethoff, H. Current status of water electrolysis for energy storage, grid balancing and sector coupling via power-to-gas and power-to-liquids: A review. Renew. Sustain. Energy Rev. 2018, 82, 2440–2454. [Google Scholar] [CrossRef]
  2. Fallisch, A.; Schellhase, L.; Fresko, J.; Zechmeister, M.; Zedda, M.; Ohlmann, J.; Zielke, L.; Paust, N.; Smolinka, T. Investigation on pem water electrolysis cell design and components for a hycon solar hydrogen generator. Int. J. Hydrogen Energy 2017, 42, 13544–13553. [Google Scholar] [CrossRef]
  3. Kopp, M.; Coleman, D.; Scheppat, B.; Stiller, C.; Scheffer, K.; Aichinger, J. Energiepark mainz: Technical and economic analysis of the worldwide largest power-to-gas plant with pem electrolysis. Int. J. Hydrogen Energy 2017, 42, 13311–13320. [Google Scholar] [CrossRef]
  4. Barbir, F. Pem electrolysis for production of hydrogen from renewable energy sources. Sol. Energy 2005, 78, 661–669. [Google Scholar] [CrossRef]
  5. Carmo, M.; Fritz, D.L.; Mergel, J.; Stolten, D. A comprehensive review on pem water electrolysis. Int. J. Hydrogen Energy 2013, 38, 4901–4934. [Google Scholar] [CrossRef]
  6. Chen, S.; Jiang, F.; Xie, X.; Zhou, Y.; Hu, X. Synthesis and application of lead dioxide nanowires for a pem ozone generator. Electrochim. Acta 2016, 192, 357–362. [Google Scholar] [CrossRef]
  7. Bussayajarn, N.; Ming, H.; Hoong, K.K.; Ming Stephen, W.Y.; Hwa, C.S. Planar air breathing pemfc with self-humidifying mea and open cathode geometry design for portable applications. Int. J. Hydrogen Energy 2009, 34, 7761–7767. [Google Scholar] [CrossRef]
  8. Hu, M.; Sui, S.; Zhu, X.; Yu, Q.; Cao, G.; Hong, X.; Tu, H. A 10 kw class pem fuel cell stack based on the catalyst-coated membrane (ccm) method. Int. J. Hydrogen Energy 2006, 31, 1010–1018. [Google Scholar] [CrossRef]
  9. Chun, J.H.; Park, K.T.; Park, S.H.; Jo, D.H.; Lee, E.S.; Lee, J.Y.; Kim, S.G.; Kim, S.H.; Jyoung, J.-Y. Development of a novel hydrophobic/hydrophilic double micro porous layer for use in a cathode gas diffusion layer in pemfc. Int. J. Hydrogen Energy 2011, 36, 8422–8428. [Google Scholar] [CrossRef]
  10. Liu, C.-H.; Ko, T.-H.; Shen, J.-W.; Chang, S.-I.; Chang, S.-I.; Liao, Y.-K. Effect of hydrophobic gas diffusion layers on the performance of the polymer exchange membrane fuel cell. J. Power Sources 2009, 191, 489–494. [Google Scholar] [CrossRef]
  11. Zhao, X.; Fu, Y.; Li, W.; Manthiram, A. Effect of non-active area on the performance of subgasketed meas in pemfc. Int. J. Hydrogen Energy 2013, 38, 7400–7406. [Google Scholar] [CrossRef]
  12. Kim, K.-H.; Kim, H.-J.; Lee, K.-Y.; Lee, S.-Y.; Cho, E.; Lim, T.-H.; Yoon, S.P.; Hwang, I.C.; Jang, J.H. The effects of nafion® ionomer content in pemfc meas prepared by a catalyst-coated membrane (ccm) spraying method. Int. J. Hydrogen Energy 2010, 35, 2119–2126. [Google Scholar] [CrossRef]
  13. Kim, K.-H.; Lee, K.-Y.; Lee, S.-Y.; Cho, E.; Lim, T.-H.; Kim, H.-J.; Yoon, S.P.; Kim, S.H.; Lim, T.W.; Jang, J.H. The effects of relative humidity on the performances of pemfc meas with various nafion® ionomer contents. Int. J. Hydrogen Energy 2010, 35, 13104–13110. [Google Scholar] [CrossRef]
  14. Yang, T.-F.; Cheng, C.-H.; Su, A.; Yu, T.-L.; Hourng, L.-W. Numerical analysis of the manipulated high performance catalyst layer design for polymer electrolyte membrane fuel cell. Int. J. Energy Res. 2014, 38, 1937–1948. [Google Scholar] [CrossRef]
  15. Xu, W.; Scott, K. The effects of ionomer content on pem water electrolyser membrane electrode assembly performance. Int. J. Hydrogen Energy 2010, 35, 12029–12037. [Google Scholar] [CrossRef]
  16. Song, S.; Zhang, H.; Ma, X.; Shao, Z.; Baker, R.T.; Yi, B. Electrochemical investigation of electrocatalysts for the oxygen evolution reaction in pem water electrolyzers. Int. J. Hydrogen Energy 2008, 33, 4955–4961. [Google Scholar] [CrossRef]
  17. Su, H.; Linkov, V.; Bladergroen, B.J. Membrane electrode assemblies with low noble metal loadings for hydrogen production from solid polymer electrolyte water electrolysis. Int. J. Hydrogen Energy 2013, 38, 9601–9608. [Google Scholar] [CrossRef] [Green Version]
  18. Xu, J.; Miao, R.; Zhao, T.; Wu, J.; Wang, X. A novel catalyst layer with hydrophilic–hydrophobic meshwork and pore structure for solid polymer electrolyte water electrolysis. Electrochem. Commun. 2011, 13, 437–479. [Google Scholar] [CrossRef]
  19. Rozain, C.; Mayousse, E.; Guillet, N.; Millet, P. Influence of iridium oxide loadings on the performance of pem water electrolysis cells: Part I—Pure iro2-based anodes. Appl. Catal. B Environ. 2016, 182, 153–160. [Google Scholar] [CrossRef]
  20. Yu, J.-W.; Jung, G.-B.; Su, Y.-J.; Yeh, C.-C.; Kan, M.-Y.; Lee, C.-Y.; Lai, C.-J. Proton exchange membrane water electrolysis system-membrane electrode assembly with additive. Int. J. Hydrogen Energy 2019, 44, 15721–15726. [Google Scholar] [CrossRef]
  21. Burdzik, A.; Stähler, M.; Friedrich, I.; Carmo, M.; Stolten, D. Homogeneity analysis of square meter-sized electrodes for pem electrolysis and pem fuel cells. J. Coat. Technol. Res. 2018, 15, 1423–1432. [Google Scholar] [CrossRef]
  22. Mauger, S.A.; Neyerlin, K.C.; Yang-Neyerlin, A.C.; More, K.L.; Ulsh, M. Gravure coating for roll-to-roll manufacturing of proton-exchange-membrane fuel cell catalyst layers. J. Electrochem. Soc. 2018, 165, 1012–1018. [Google Scholar] [CrossRef]
  23. Onda, K.; Ohba, T.; Kusunoki, H.; Takezawa, S.; Sunakawa, D.; Araki, T. Improving characteristics of ozone water production with multilayer electrodes and operating conditions in a polymer electrolyte water electrolysis cell. J. Electrochem. Soc. 2005, 152, 177–183. [Google Scholar] [CrossRef]
  24. Millet, P.; Ranjbari, A.; De Guglielmo, F.; Grigoriev, S.A.; Auprêtre, F. Cell failure mechanisms in pem water electrolyzers. Int. J. Hydrogen Energy 2012, 37, 17478–17487. [Google Scholar] [CrossRef]
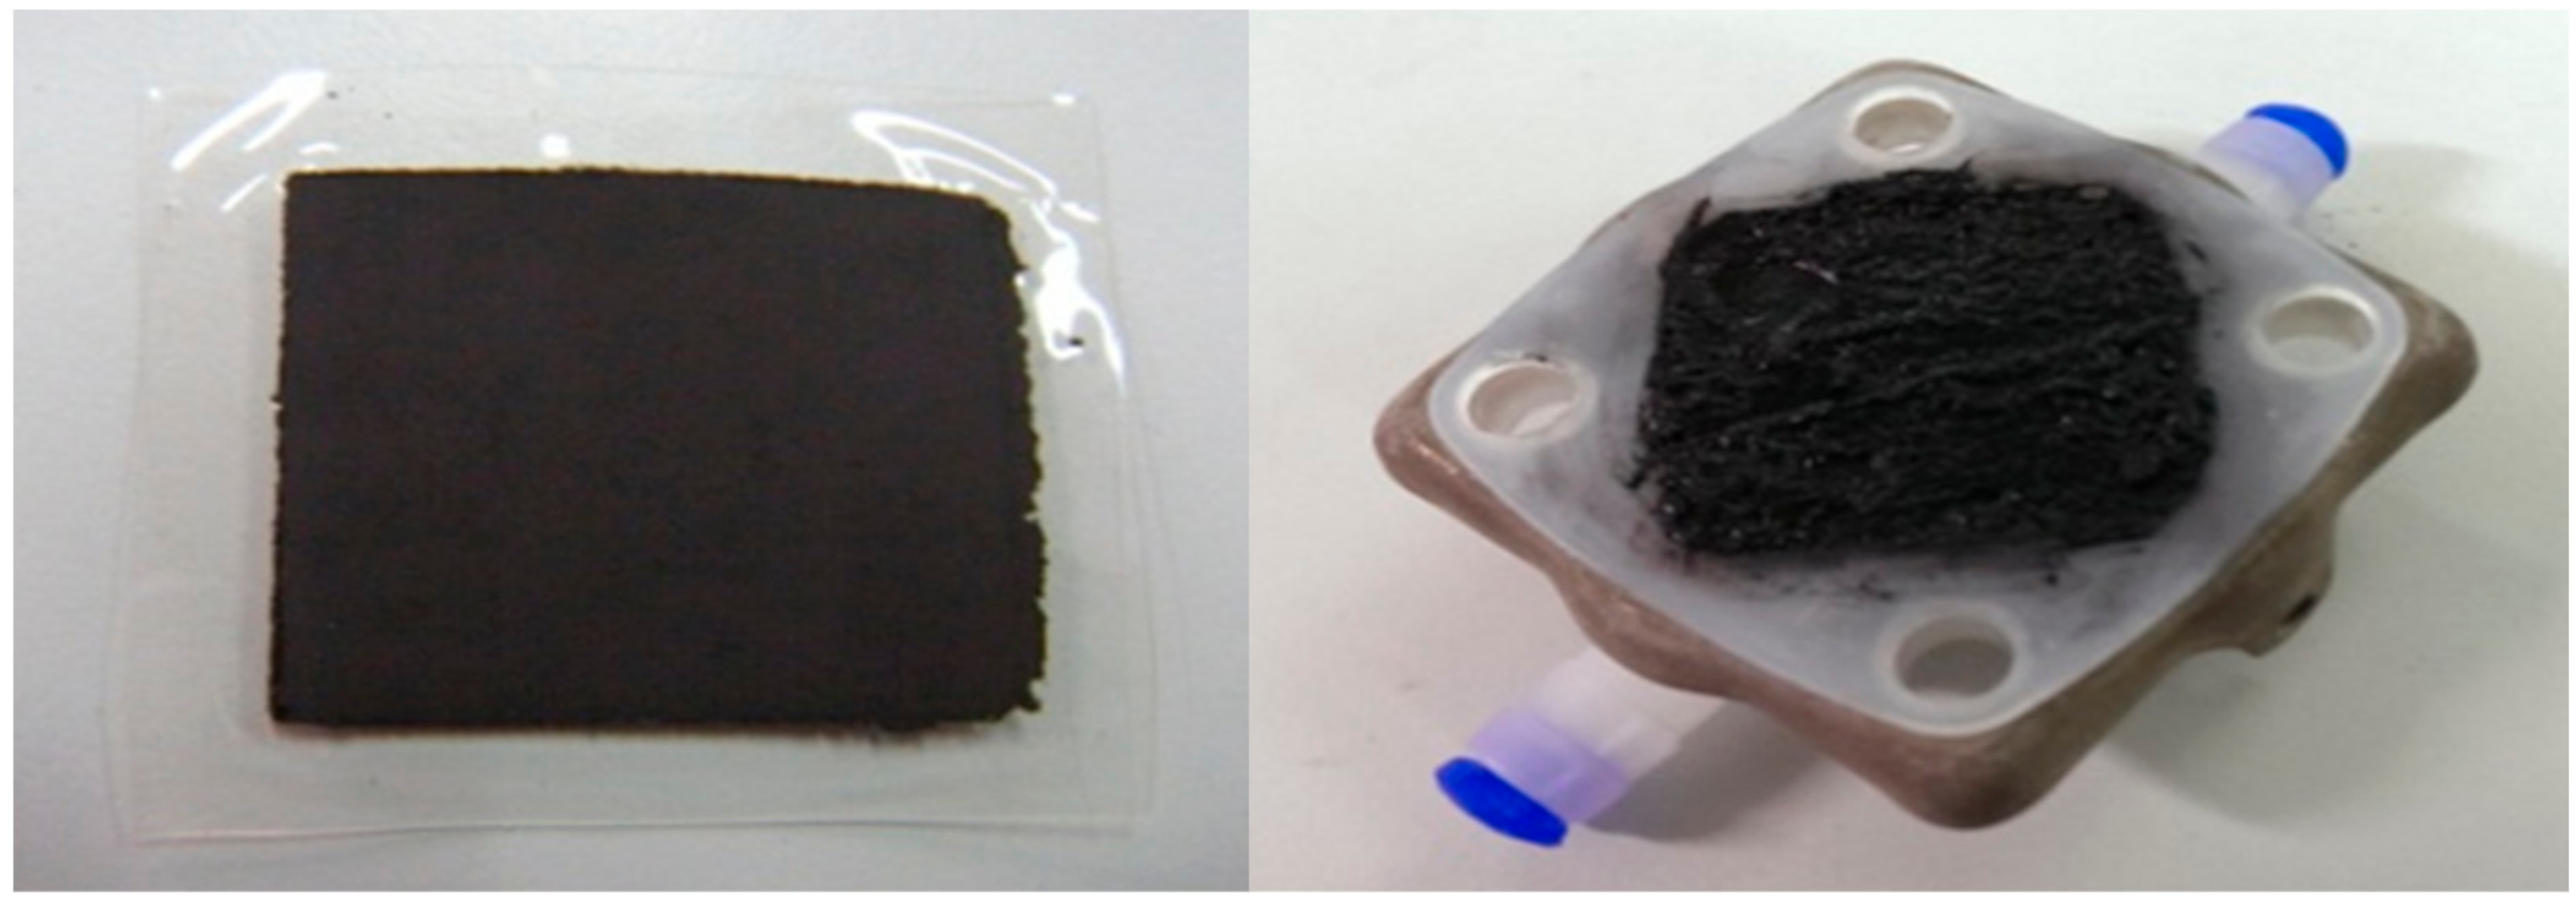
Figure 1. Anode side of (a) membrane-layer (ML) (left) and (b) flat-layer (FL) (right)
Energies 12 04218 g001
Figure 2. Proton exchange membrane water electrolysis (PEMWE) test system.
Energies 12 04218 g002
Figure 3. DR2002 power supplier.
Energies 12 04218 g003
Figure 4. Accelerating test – high voltage with power interruption and restoration (4.5 V).
Energies 12 04218 g004
Figure 5. Electrochemical impedance analysis.
Energies 12 04218 g005
Figure 6. Accelerating electrolysis test—high voltage (4.5 V) and high-temperature drying (160 °C).
Energies 12 04218 g006
Figure 7. Anode structure after experiments (a) for ML and (b) for FL.
Energies 12 04218 g007
Figure 8. Current differences under different applied voltages.
Energies 12 04218 g008
Figure 9. Structural simulation after accelerating test for ML (left) and for FL (right).
Energies 12 04218 g009