Article

A Chance-Constrained Multistage Planning Method for Active Distribution Networks

by
Nikolaos Koutsoukis
and
Pavlos Georgilakis
*
School of Electrical and Computer Engineering, National Technical University of Athens, 15780 Zografou, Greece
*
Author to whom correspondence should be addressed.
Energies 2019, 12(21), 4154; https://doi.org/10.3390/en12214154
Submission received: 10 October 2019 / Revised: 28 October 2019 / Accepted: 30 October 2019 / Published: 31 October 2019

Abstract

:
This paper introduces a multistage planning method for active distribution networks (ADNs) considering multiple alternatives. The uncertainties of load, wind and solar generation are taken into account and a chance constrained programming (CCP) model is developed to handle these uncertainties in the planning procedure. A method based on a k-means clustering technique is employed for the modelling of renewable generation and load demand. The proposed solution methodology, which is based on a genetic algorithm, considers multiple planning alternatives, such as the reinforcement of substations and distribution lines, the addition of new lines, and the placement of capacitors and it aims at minimizing the net present value of the total operation cost plus the total investment cost of the reinforcement and expansion plan. The active network management is incorporated into planning method in order to exploit the control capabilities of the output power of the distributed generation units. To validate its effectiveness and performance, the proposed method is applied to a 24-bus distribution system.

Graphical Abstract

1. Introduction

Distribution network planning (DNP) aims at determining the optimum location, capacity and time of the investments in new network components and equipment in order to minimize the total investment and operation cost and to ensure the safe operation of the network for a forecasted load growth demand during a planning period. Over recent years, due to the increasing penetration of renewable energy sources (RES), the installation of advanced metering infrastructure (AMI) to distribution networks and the development of information and communication technologies (ICT), distribution networks are being transformed from passive to active distribution networks (ADNs). In ADNs, the control of the active and reactive power output of the available distributed generation (DG) units is enabled to deal with technical challenges, such as line congestion and voltage rise issues [1]. Hence, the planning of ADNs, in which the control capabilities of the DG units are exploited, becomes a very challenging problem. Furthermore, the complexity of the DNP problem increases significantly, since the uncertainties of load demand and RES generation should be considered and appropriately modeled.
DNP problems can be formulated as a mixed integer nonlinear programming (MINLP) problem. The solution methods of DNP problems can be divided into two categories: (1) static methods or (2) multistage methods [2]. The static methods do not calculate the time of the network investments and they assume that all investments are implemented at the start of the planning period. On the contrary, the multistage methods determine the time the network investments are necessary, providing the capability to electric utilities to implement the network investment decisions gradually during the planning period. A thorough literature review of the DNP methods and models is presented in [2,3,4].
DG penetration in distribution networks has a great impact on network planning, since the network’s end users can be characterized as nodes with load demand as well as with potential generation [5,6]. The effect of dispatchable DG (DDG) units on the solution of the multistage DNP problem is examined in [7] and [8]. More specifically, in [7] and [8], the locations of DDG units are considered as planning alternatives in order to deal with the increasing load demand apart from the reinforcement of substations and distribution lines. The location of DDG units as a planning alternative is also considered in [9], in which the DNP problem is formulated as a simplified mixed integer linear programming problem. In [10] and [11], the allocation of renewable DG units along with DDG units is co-optimized for the network reinforcement and expansion in order to minimize the total investment and operational cost. The advantages of the active management of renewable DG units for the solution of the DNP problem in distribution networks with high penetration of RES are examined in the multistage planning method of [12]. The uncertainties of the output power of wind-based DG units and demand response are considered in the static planning method of ADNs in [13]. In [14,15,16], the uncertainties of load demand and wind generation are also considered to find the optimal solution of the DNP problem. Furthermore, agent-based models are increasingly being used to model and analyze the complex nature of multi-carrier energy networks [17]. In [18], an agent-based approach is proposed for modelling a smart grid with microgrids. A multi-layer agent-based model is developed in [19] in order to examine the impact of RES on distribution network planning.
In [7,8,9], only DDG units are considered and they are assumed as investments of the distribution system operator (DSO) in order to decrease the peak load demand ignoring the technical challenges rising by the high penetration of RES in distribution network. Renewable generation and its effect on the solution of the DNP problem is examined in [10,11,12,13,14,15,16]. However, in [10,11,12], the DNP problem is solved deterministically, ignoring the uncertainties of renewable generation and load demand, while in [13,14,15,16] the uncertainties of the stochastic input data are taken into account. The static planning method for ADNs in [13] considers only a few planning alternatives and incorporates only the control of the active power output of DG units and demand response schemes. In the multistage methods of [14,15,16], the planning alternatives that are considered are the reinforcement and addition of substation and distribution lines, while the control capabilities of the DG units in ADNs are ignored.
Several aspects of the DNP problem have been examined by the aforementioned papers. However, the effect of uncertainties of the stochastic behavior of the load and renewable DG in combination with the active DG management on a DNP model that considers multiple planning alternatives have not been thoroughly examined. Furthermore, when considering the uncertainties of load demand and renewable generation and the constraints of the DNP are strictly formulated, the investment decisions that are calculated may be overestimated in some cases.
This paper introduces a comprehensive multistage planning framework of ADNs, which considers multiple planning alternatives. First, a method based on a k-means clustering technique is proposed for the modelling of the uncertainties of renewable generation and load demand. Afterwards, a DNP model based on chance constrained programming (CCP) [20] is developed to handle the probability of technical constraint violations imposed by the uncertain renewable generation and load demand. A problem specific genetic algorithm (GA) combined with a nonlinear programming (NLP) optimization model is employed for the optimal solution of the DNP problem considering high penetration of RES generation. The proposed DNP method considers multiple planning alternatives, such as the reinforcement of existing substations and distribution lines, the addition of new distribution lines for network expansion and the placement of capacitors. Furthermore, the active management of the active and reactive power output of DG unit is incorporated into the planning method in order to exploit the control capabilities of the DG units. The effectiveness of the proposed method is evaluated using a 24-bus distribution system. The main goals and contributions of this paper are:
(1)
To introduce a CCP methodology for the planning of ADN considering the uncertainties of load demand, wind and solar generation.
(2)
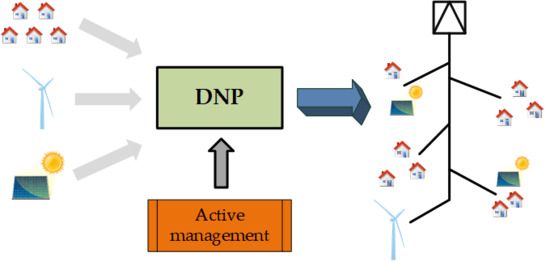
To develop a multistage planning framework that calculates the optimal location, capacity and time of the investments on substation, distribution lines and capacitors, while examine the effect of the active DG management on the optimal solution of the DNP problem.
This paper is organized as follows: Section 2 describes the modelling of the stochastic behavior of load demand and renewable generation. The formulation of the proposed CCP DNP model is given in Section 3. Section 4 provides the solution method. The method is applied to a 24-bus distribution network and the results are analyzed in Section 5. In Section 6, conclusions are drawn.

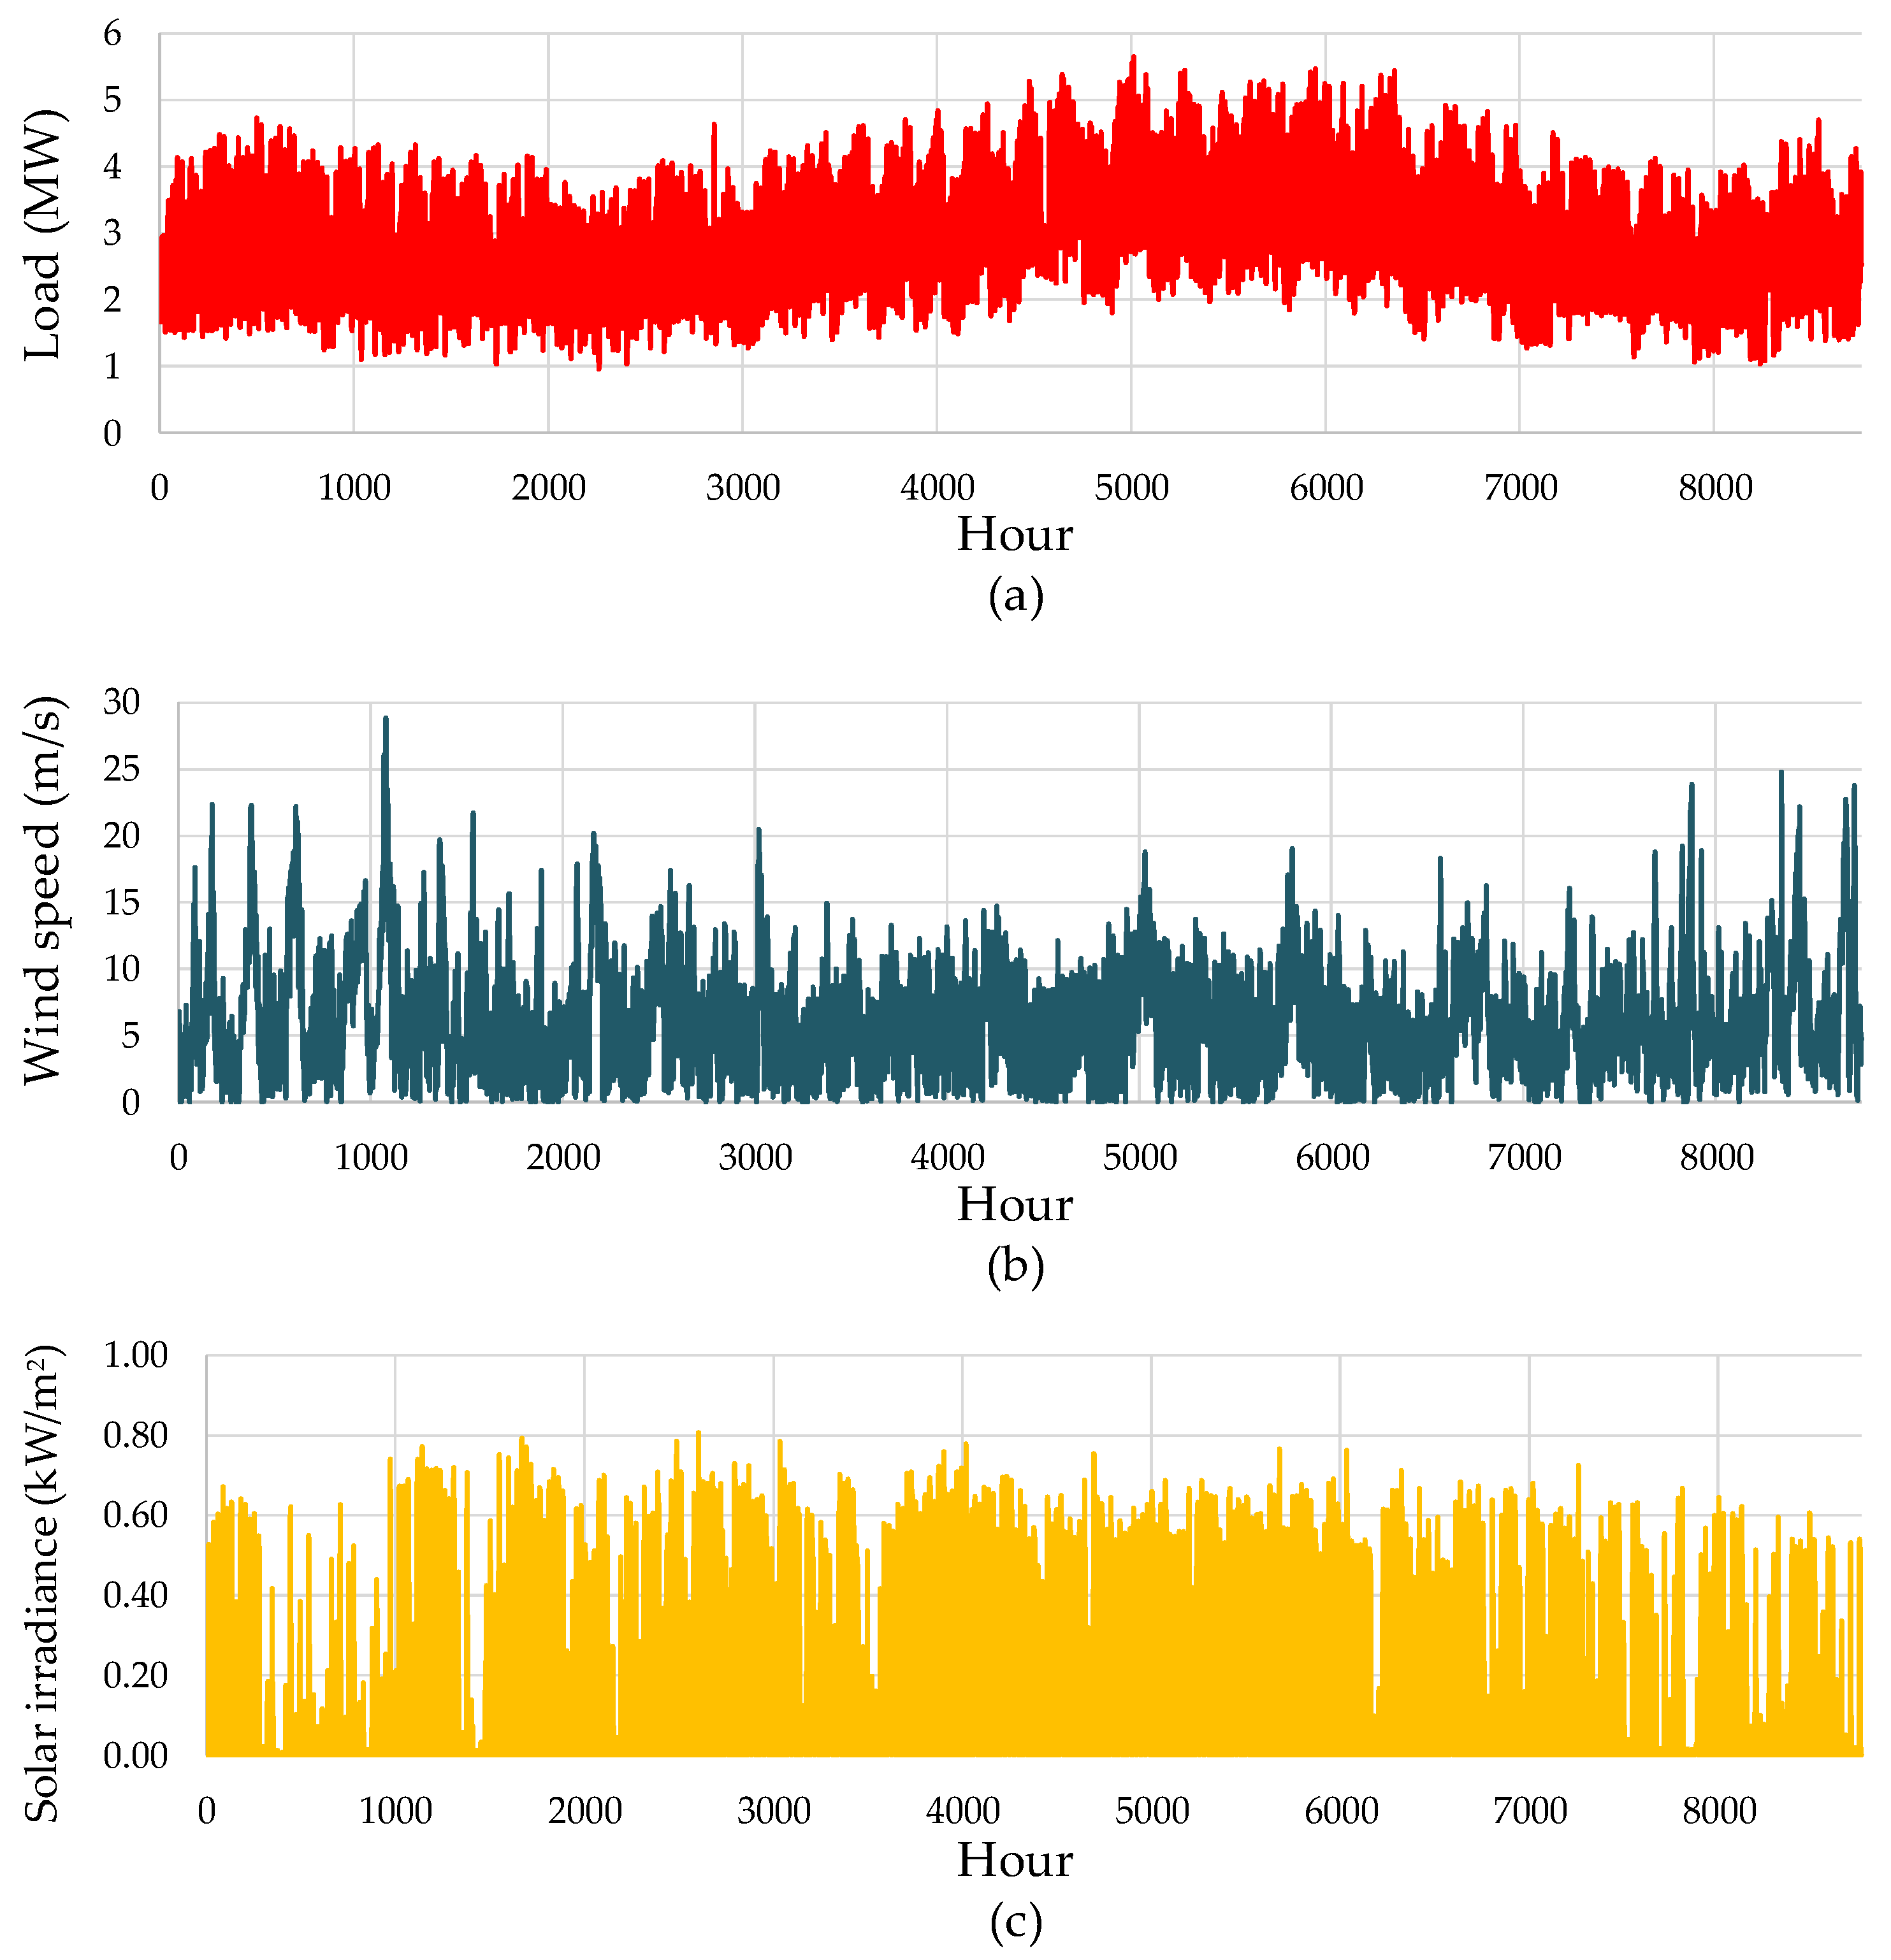
2. Load and Renewable Generation Data Modeling

Distribution networks are, in general, planned in order to ensure the safe network operation under any possible loading conditions over the planning period. In distribution networks with no or low penetration of RES, in which power flows from the high voltage (HV) / medium voltage (MV) substation to the MV/low voltage (LV) substations, the reinforcement and expansion plan of a distribution network was determined based on a given forecast of the maximum load demand of each year of the planning period without taking into account the variability of the output power of RES. However, in distribution networks with high penetration of RES, the aforementioned approach is not adequate, since reverse power flows occur quite often during every year of the planning period, especially in periods of low demand and high RES generation, creating new technical challenges that need to be solved at the planning stage, such as line congestion and voltage rise issues [1].
Thus, a planning method for ADNs with high penetration of DERs, especially RES, has to take into account a proper dataset of load demand and RES generation during each stage of the planning period in order to determine the optimal reinforcement and expansion plan. It is important that the dataset of load demand and RES generation that will be incorporated into the planning process contains the possible combinations of load demand and RES generation. Furthermore, each set of this dataset should be different from the rest in order to avoid the unnecessary repetition of similar load-generation sets.
The first feature of this dataset is the quality. A high quality dataset for the planning of a distribution network needs to be created in a way that it adequately considers the uncertainties of load demand and RES generation during each stage of the planning period. The dataset’s second feature is its proper size. A large dataset will increase significantly the computation time of the solution of the DNP problem, making it sometimes impractical to solve. However, a small dataset would deteriorate the dataset’s quality.
This paper proposes a method that is based on a k-means clustering method [21] to generate probabilistic load-generation sets for each stage of the planning period in order to model accurately the load and renewable generation uncertainties. The k-means method is an established clustering method, which has been widely employed for the classification of large volumes of data [22]. The probabilistic load-generation sets are determined based on historical data of wind speed, solar irradiance and load demand variability in order to be used as the input data of the proposed multistage planning method of ADNs.

2.1. The k-Means Clustering Method

Data clustering is a process that allocates a set of individual data into smaller groups (clusters) such that (a) the individual data with similar features are grouped into the same cluster and (b) the dissimilarity of each created cluster compared to the rest is high enough making each cluster distinct [23]. The k-means clustering method is a partitioning clustering technique that employs an iterative process to optimize the quality, i.e., the dissimilarity, of a predetermined number of distinct clusters [24,25,26].
The k-means clustering method is initialized by specifying the number of clusters (k) and selecting randomly individual data from the whole dataset as the cluster centroids. The optimal number of clusters can be determined by the method presented in [27,28]. The k-means method allocates the remaining individual data between clusters so that the Euclidean distance of an individual vector data ( m i ) from its corresponding cluster centroid ( c k ) is minimized as shown in (1). The k-means clustering method has been widely used for data management of power systems related problems [29,30,31,32]:
min k = 1 K i = 1 N m i c k 2
Then, the average of all the individual data that are the members of a cluster is set as the new centroid of that cluster. Overall, the k-means method determines the clusters’ centroids so that the sum of squared distances of each individual vector data from its corresponding cluster centroid is minimized. This iterative process is terminated when a convergence criterion is fulfilled. The convergence criterion is that there is no change in the clusters’ centroids or after a certain number of iterations the change in the clusters’ centroids is below a threshold. After the data clustering is terminated, the occurrence probability of each cluster’s centroid can be calculated, as follows:
Pr { c k } = N c k N

2.2. Probabilistic Load-Generation Sets

The incorporation of variable DG, such as RES, combined with the variation of load demand into the DNP problem, increases significantly the problem’s complexity. Considering all possible scenarios of load and RES generation that can occur during every year of the planning period would make the solution process of the DNP problem almost impractical due to the high computational burden. To diminish the number the scenarios of load and RES generation that should be considered at every year of the planning period, while preserving the stochastic behavior and interrelationship between load demand and RES generation, a method based on k-means clustering method is proposed. The output of the proposed method is a specific number of load-generation sets, where each set has its own occurrence probability and is characterized by a load state (level), an output power state of wind DG and an output power state of solar DG unit. The steps of the proposed method that determine these probabilistic load-generation sets are as follows:
Step 1: The success of a clustering method, like the k-means method, depends on the development of a wide range dataset that adequately represents the majority of the distribution network operating states. Thus, the basis of the proposed method is the collection of historical data of load demand, wind speed and solar irradiance of the area of the distribution network that will be studied. For example, in Figure 1, the hourly data of load demand, wind speed and solar irradiance of one year for a distribution network [29] are presented.
Step 2: After the collection of historical data of load demand, wind speed and solar irradiance, these data are adapted in order to represent the yearly profile of load demand, the yearly generation profile of wind DG units and the yearly generation profile of solar DG units. The yearly profile of load demand is determined by dividing the hourly load demand with the maximum load of each year. Based on the hourly wind speed data, the generation profile of a wind DG unit can be determined using the wind turbine power curve as presented in Equation (3):
P w d g ( v ) = { 0 ,    0 v v c i P W D G r a t e d ( v v c i ) ( v n v c i ) ,    v c i v v n P W D G r a t e d ,    v n v v c o 0 ,    v c o < v
Similarly, based on the hourly solar irradiance data, the generation profile of a solar DG unit can be determined using the PV power curve as given by Equation (4):
P s d g ( s ) = { P S D G r a t e d s s n ,   0 s s n P S D G r a t e d ,   s n s
Hence, the historical data of Figure 1 are transformed into the data presented in Figure 2.
Step 3: After processing the historical data, as described in Step 2, the k-means clustering method is applied and the input data are divided into K clusters. The centroids of the derived clusters represent the average behavior of the data that are included in each cluster. Thus, the clusters’ centroids are considered as the probabilistic load-generation sets. Each clusters’ centroid represents a load level, an output power state of wind DG and an output power state of solar DG, as shown in (5) and its occurrence probability is calculated according to Equation (2).
c k = [ P d , k , P w d g , k , P s d g , k ]

3. Problem Formulation

The long-term DNP problem is a complicated optimization problem that requires the consideration of many decision variables and many constraints related to distribution network operation as well as to the investment decisions. Furthermore, in this paper, the DNP problem solved is not only to meet a load growth rate, but what is also solved is considering how the distribution networks will accommodate high capacities of renewable DG. The DG units are assumed to be private investments and their type, installation location, installed capacity and installation time are pre-determined. Moreover, it is assumed that all the necessary information and communication technology (ICT) infrastructures have been already installed in the distribution network facilitating the coordinated control of the active and reactive power output of the DG units for the safe operation of the network.

3.1. Objective Function

The DNP problem is formulated as a MINLP problem that aims at minimizing the net present value of the total operation cost plus the total investment cost of the reinforcement and expansion plan of ADNs considering multiple planning alternatives, while ensuring its safe operation during the whole planning period, as follows:
min T C = I N V + O P C
The objective function (6) consists of two terms. The first term (INV) denotes the investment cost and it accounts for the net present value of the investment cost for: (i) HV/MV substation reinforcement, (ii) line reinforcement, i.e., reconductoring of existing lines, (iii) installation of new lines for the connection of future loads to the network and (iv) placement of capacitors, as follows:
I N V = t = 1 T ( 1 + I n f 1 + I n t ) t ( I C S R , t + I C L R , t + I C L A , t + I C C B , t )
where:
I C S R , t = i Φ S S a Ψ S S C S S , a i d i , a , t S S
I C L R , t = i j Φ L R b Ψ c d C c d , b l i j i d i j , b , t L
I C L A , t = i j Φ L A b Ψ c d C c d , b l i j i d i j , b , t L
I C C B , t = i Φ C B c Ψ C B C C B , c i d i , c , t C B
The binary variables i d i , a , t S S , i d i j , b , t L and i d i , c , t C B are the investment variables and they are equal to 1, when an investment is decided at a part of the network at the period t of the planning period. For example, the variable i d i j , b , t L is equal to 1, when the installation of type b conductor at the line ij is decided at period t.
The second term (OPC) of the objective function denotes the distribution network’s operational cost and it accounts for the total annual energy losses during the planning period, as follows:
O P C = t = 1 T ( 1 + I n f 1 + I n t ) t C L o s s k = 1 K P l o s s k , t Pr { c k } 8760

3.2. Constraints

For the solution of the DNP problem, several constraints should be considered to represent the steady state operation of the distribution network. These constraints ensure that the distribution network will operate within its limits during the whole planning period, while the investment constraints are related to the investment decision variables.
To incorporate the investment decision variables ( i d i , a , t S S , i d i j , b , t L and i d i , c , t C B ) into the operational constraints, the auxiliary variables ( u z i , a , t S S , u z i j , b , t L and u z i , c , t C B ) are employed and their relation to the corresponding investment variables is described by Equations (13)–(15):
u z i , a , t S S = τ = 1 t i d i , a , τ S S i Φ S S ,   t T
u z i j , b , t L = τ = 1 t i d i j , b , τ L ( i , j ) Φ L R Φ L A ,   t T
u z i , c , t C B = τ = 1 t i d i , c , τ C B i Φ C B ,   t T
Constraints (13)–(15) represent the operation status of an investment decision, which is made at a certain stage of the planning period. For example, suppose that it is decided the reinforcement of line ij with type b conductor at year 10 of the planning period, i.e., i d i j , b , 10 L = 1 . According to (14), u z i j , b , t L will be equal to zero from year 1 to year 9, which means that the technical characteristics of line ij for that period will be the same with its initial ones, whereas, u z i j , b , t L will be equal to 1 from year 10 to the end of the planning period, meaning that the technical characteristics of line ij will change and they will be the same with the technical characteristics of a type b conductor. The operational constraints considering the investment decisions are the following:
P s s , i , k , t + P W D G , i , t r a t e d P w d g , k C F i , k , t + P S D G , i , t r a t e d P s d g , k C F i , k , t P d , i , k , t = j : j ~ i P i j , k , t
Q s s , i , k , t + Q w d g , i , k , t + Q s d g , i , k , t c Ψ C B Q C B , c u z i , c , t C B Q d , i , k , t = j : j ~ i Q i j , k , t
P i j , k , t = g i j , t V i , k , t 2 g i j , t V i , k , t V j , k , t cos θ i j , k , t b i j , t V i , k , t V j , k , t sin θ i j , k , t
Q i j , k , t = b i j , t V i , k , t 2 + b i j , t V i , k , t V j , k , t cos θ i j , k , t g i j , t V i , k , t V j , k , t sin θ i j , k , t
g i j , t = b Ψ c d g b l i j u z i j , b , t L
b i j , t = b Ψ c d b b l i j u z i j , b , t L
V min V i , k , t V max
P i j , k , t 2 + Q i j , k , t 2 b Ψ c d ( S L , b max ) 2 u z i j , b , t L
P s s , i , k , t 2 + Q s s , i , k , t 2 a Ψ S S ( S S S , a max ) 2 u z i , a , t S S
The active and reactive power flow balance in every bus of the distribution network at the load-generation set k during the planning stage t is given by Equations (16) and (17), respectively. The active and reactive power flow of each line ij at the load-generation set k during the planning stage t is calculated by (18) and (19), respectively, while the conductance and the susceptance of line ij at the planning stage t is presented in (20) and (21), respectively. The voltage magnitude of bus i at the load-generation set k during the planning stage t should vary within specific limits, as shown in (22). The apparent power flow limit of line ij at the planning stage t is given in (23). Furthermore, the apparent power that flows through the HV/MV substation at bus i at the load-generation set k during the planning stage t should be lower than the capacity of the type a HV/MV substation (24).
At every stage t of the planning period, the network configuration should be radial. To ensure the radial operation of the network, the distribution network is represented as a spanning tree [33], which can be expressed by the following constraints:
r d i j , t + r d j i , t = 1 ( i , j ) Ω L \ Φ L A
r d i j , t + r d j i , t = b Ψ c d u z i j , b , t L ( i , j ) Φ L A
j Ω N r d j i , t = 1 i Ω N \ Ω S S
r d j i , t = 0 i Ω S S
In a spanning tree, every node except the root (HV/MV substation bus) has exactly one parent. If line ij is part of the spanning tree, then bus i is the parent of bus j ( r d i j , t = 1 ) or bus j is parent of bus i ( r d j i , t = 1 ), according to (25) and (26). Every bus can have only one parent bus (27), except for the HV/MV substation bus, which is considered as the root of the spanning tree (28).
Line congestion and voltage rise are the most common issues of the distribution networks with high penetration of RES [1,12]. To deal with these issues, in this paper the control capabilities of the DG units in ADNs are exploited. More specifically, the control of the active and reactive power output is incorporated into the formulation of the DNP problem and the effect of the active network management on the solution of the DNP problem is examined.
Based on the P-Q capability curve [34], which is shown in Figure 3, the reactive output power that a DG unit can absorb or inject to the distribution at the load-generation set k during the planning stage t is, as follows:
  • If 0 P d g , i , k , t 0.05 P D G , i r a t e d , then:
    Q d g , i , k , t = 0
  • If 0.05 P D G , i r a t e d P d g , i , k , t 0.2 P D G , i r a t e d , then:
    2.42 P d g , i , k , t Q d g , i , k , t 2.42 P d g , i , k , t
  • If 0.2 P D G , i r a t e d P d g , i , k , t P D G , i r a t e d , then:
    0.484 P D G , i r a t e d Q d g , i , k , t 0.484 P D G , i r a t e d
Furthermore, the curtailment of the active power output of the DG units is enabled, in case the output power of the DG unit is higher than 20% of its rated power. This can be described by the following constraints:
  • If 0 P d g , i , k , t 0.2 P D G r a t e d , then:
    C F i , k , t = 1
  • If 0.2 P D G , i r a t e d P d g , i , k , t P D G , i r a t e d , then:
    C F i , k , t P d g , i , k , t 0.2 P D G , i r a t e d
    C F i min C F i , k , t 1
It should be noted that the curtailment of the active power output of the DG units is considered as last resort and it should be limited, since it has financial implications on the owners of the DG units.

3.3. Chance Constrained DNP Formulation

When the uncertainties of load demand and renewable generation are considered in the solution of the DNP problem, investments for the reinforcement and expansion of the network may be overestimated in the occasions of maximum RES generation and minimum load. Taking into account the low probability of occurrence of this occasion, it would be a reasonable choice to accept a minor violation for short time periods of the voltage constraints (22) and the thermal capacity of the distribution lines (23) [34,35,36,37]. Therefore, a chance constrained DNP formulation is proposed. The voltage limit constraint (22) is transformed into the chance constraint (35):
Pr { V min V i , k , t V max } 1 β V i Ω N
According to (35), if the probability of the voltage limits violation is lower than a specified threshold ( β V ), then it is considered that the network operates within its limits.
Similarly, the line capacity limit (23) is transformed into the chance constraint (36). According to (36), if the overload probability of the distribution line is lower than a specified threshold ( β S L ), then it is considered that the network operates within its limits:
Pr { P i j , k , t 2 + Q i j , k , t 2 b Ψ c d ( S L , b max ) 2 u z i j , b , t L } 1 β S L ( i , j ) Ω L

4. Solution Method

In this paper, a solution methodology that is based on GA is proposed to solve the DNP problem. GA is a meta-heuristic optimization algorithm involving iterative search procedures [38] and it has been widely used for the solution of mixed integer optimization problems [39]. Moreover, the GA has been proved very powerful in solving various DNP problems [13,40,41,42].
The DNP problem is a MINLP problem due to the binary investment decision variables and the nonlinear power flow equations. The consideration of multiple planning alternatives, such as the reinforcement of existing network components (e.g., distribution lines, HV/MV substations) and the placement of new equipment (e.g., capacitors), results in a more cost-efficient planning solution, which handles more efficiently both capacity limit and voltage limit constraints. The proposed method is applied to distribution networks with high RES penetration and the control of the output power of the DG units is incorporated into the solution method. Furthermore, the proposed solution method is a multistage DNP method, which means that the time period of the installation of the new network investments is determined.
The proposed planning framework aims at calculating the investment decision variables ( i d i , a , t S S , i d i j , b , t L and i d i , c , t C B ). Certain features of the GA, such as chromosome structure, initial population, selection, crossover and mutation operators are discussed in the following.

4.1. Input Data

The solution of the DNP problem requires a significant amount of input data. Apart from the techno-economic characteristics of the planning alternatives, in every reinforcement and expansion plan of a distribution network, a load growth rate should be considered, and the available candidate routes for the connection of future loads should be known in advance as well as the installed DG capacity in every stage of the planning period. Furthermore, K probabilistic load-generation sets are considered, as described in Section 2, to represent the load demand variability and RES generation in every stage of the planning period. Hence, the investment decision variables should be calculated in such way that they guarantee the safe operation of the network in every year of the planning period.

4.2. Chromosome Structure

The coding of the potential solutions is essential for the effective implementation of the GA. Every potential solution (chromosome) can be depicted as a four part vector, in which the first part represents the decision for the reinforcement of the HV/MV substation, the second part represents the decision for the reinforcement of an existing distribution line, the third part represents the decision of the candidate routes for the connection of the future loads and the fourth part represents the installation bus of the capacitors. Each part of the chromosome is represented by a binary string as in common GAs. Figure 4 illustrates a simple example of the proposed encoding. Figure 4a presents the topology of a 6-bus distribution network in the reference year of the planning period. In Figure 4a, the dashed lines represent the candidate routes for the connection of the future load of bus 5 and bus 6; all distribution lines are assumed to be candidate for reinforcement; buses 2–4 are candidate for the installation of capacitors. Figure 4b illustrates the binary-coded candidate solution. The first part of the candidate solution of Figure 4b denotes the reinforcement of substation at bus 1, since the corresponding gene is equal to 1. Similarly, the second part of the candidate solution of Figure 4b denotes that only line 2 is reinforced with the immediately next higher type of conductor, i.e., type 2, since the corresponding gene is equal to 1. The conductor type of lines 1 and 3 are the same with the initial network topology (Figure 4a), since their corresponding genes are equal to zero. Moreover, the third part of Figure 4b denotes the addition of lines 4 and 6, while the fourth part denotes the installation of a capacitor at bus 4. Figure 4c illustrates the topology of the decoded candidate solution of Figure 4b.

4.3. Chromosome Evaluation

Each chromosome is decoded using the procedure described in Section 4.2 and for their evaluation the fitness function (37) is used:
min f f = I N V + O P C + t = 1 T f p e n , t
To handle the violation of the constraints in the GA at every stage of the planning period, while searching for the optimal solution, a penalty function ( f p e n , t ) is incorporated into the fitness function and it is calculated as follows:
f p e n , t = k = 1 K m = 1 N c o n s C c o n , m D c o n k , m
The penalty function (38) calculates the Euclidean distance ( D c o n k , m ) from the upper or lower limit, in case constraint m is violated during load-generation set k [43]. To calculate (37) it is necessary to determine the time (installation period) of the investments, which is given by the decoding of the chromosome, using the following steps:
Step 1: The investment decisions given by the decoding of the chromosome are stored in set {I} and it is assumed that the installation period of all elements of set {I} is t = 1.
Step 2: Select from set {I} an investment decision, which its installation period is equal to t. Consider as network topology the network configuration without the selected investment decision, and solve the NLP problem with objective function the fitness function (37) subject to constraints (13)–(21) and (24)–(36). If the penalty function (38) is equal to zero, it means that the distribution network operates within its specified limits and the selected investment decision is needed in a later stage of the planning period. Hence, the installation period of the selected investment decision is set as t = t + 1. This step is repeated until all available investment decisions of set {I} are examined for stage t.
Step 3: Set t = t + 1 and repeat Step 2 until t = T.

4.4. Initial Population

GA’s effectiveness depends significantly on the selection of the initial population. To create diverse and high quality initial solutions for the GA, two procedures are followed. The first procedure aims at creating radial distribution networks. More specifically, the type of the existing substations and distribution lines is randomly selected. Furthermore, for the connection of a new load to the distribution network, first an available candidate route is randomly chosen and then its conductor type is randomly selected. The second procedure is based on the Prim’s algorithm, which is a minimum spanning tree algorithm, to create radial distribution network. Then, the type of the substation capacity and the conductor type of the distribution lines are randomly selected. The first procedure is used to create the 70% of the initial population, while the second procedure is employed to yield the remaining 30% of the initial population.

4.5. Selection, Crossover, Mutation, and Next Generations

The initial population is evaluated and the genetic operators, i.e., selection, crossover and mutation, are employed next to create a new population. A stochastic tournament selection operator is employed for the choice of Npop population. Initially, two solutions pi and pj are randomly chosen from the population and the solution with the better fitness function value, i.e., with the lower total cost, is selected to be Parent 1. Parent 2 is selected with the same procedure. If Parent 1 and 2 are different, the selection procedure is considered successful. In fact, with the selection operator, two network topologies (Parent 1 and Parent 2) are selected from the initial population in order to be combined and to create a new network topology, i.e., a new candidate solution.
The combination of the two parent candidate solutions is performed by the crossover operator. In each parent chromosome a one-point crossover operator is employed and the cross-site is chosen randomly. Thus, the combination of the parent solutions yields two new candidate solutions, which contain features of both parent solutions. If the crossover operation is used in the pc% of the mating pool population, the mutation operator will be used in the rest (100 − pc)%. During the mutation operation, if the gene that is randomly chosen is equal to one, it will be set equal to zero and vice versa. For example, if the last gene of the fourth part of the candidate solution of Figure 4b is selected for mutation, it means that there will be no capacitors in the network topology of the newly derived candidate solution. After crossover and mutation, a set with the best candidate solutions is selected, which forms the new population. The process is terminated after a maximum number of generations is reached.

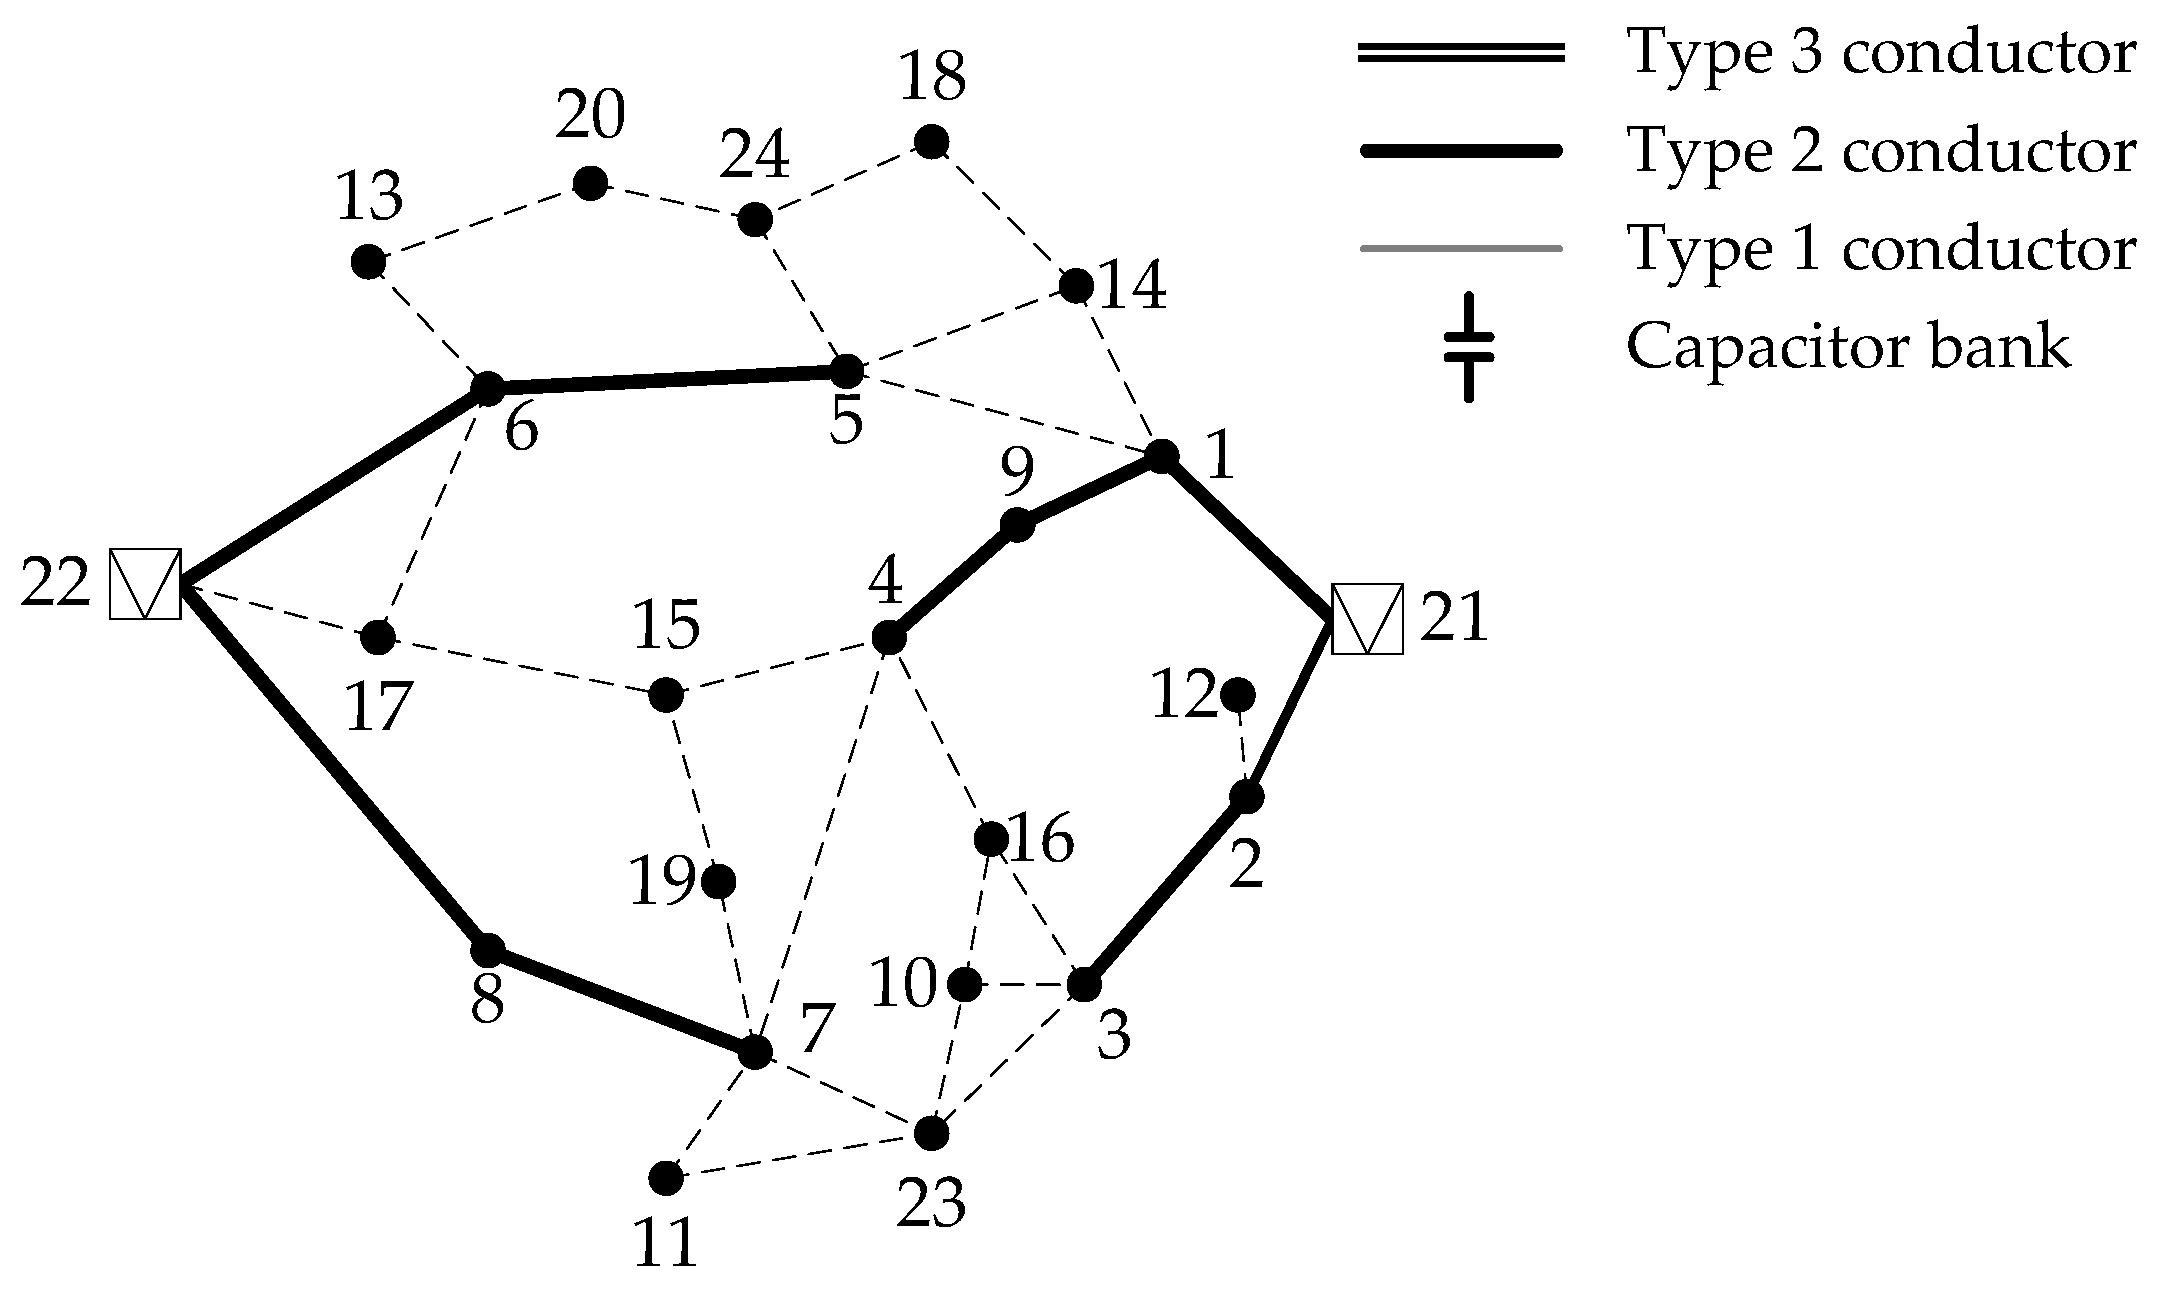
5. Results and Discussion

To validate the performance of the proposed methodology, a modified 24-bus distribution test system [9] is used. The load data in the start of the planning period are presented in Table A1 of Appendix A. The 24-bus distribution network is a 20 kV network and it consists of 2 substations, 20 load buses and 34 branches, illustrated in Figure 5, where the dashed lines stand for the candidate routes for network expansion. The duration of the planning period is equal to 20 years. The future loads that are planned to be connected to the network, as well as the DG units that are planned to be installed are shown in Table 1 and Table 2, respectively. The power factor of the future load is 0.90 lagging. All buses of the initial topology are candidate for the placement of capacitors. The costs associated with the planning procedure and techno-economic characteristics of the available planning alternatives are presented in Table 3. Voltage limits are ±5% of the nominal voltage and the capacity of the existing substations is 15 MVA. The hourly data of load demand, wind and solar generation of Figure 2, i.e., 3 × 8760 values, are grouped into 50 clusters. Three cases are considered as follows:
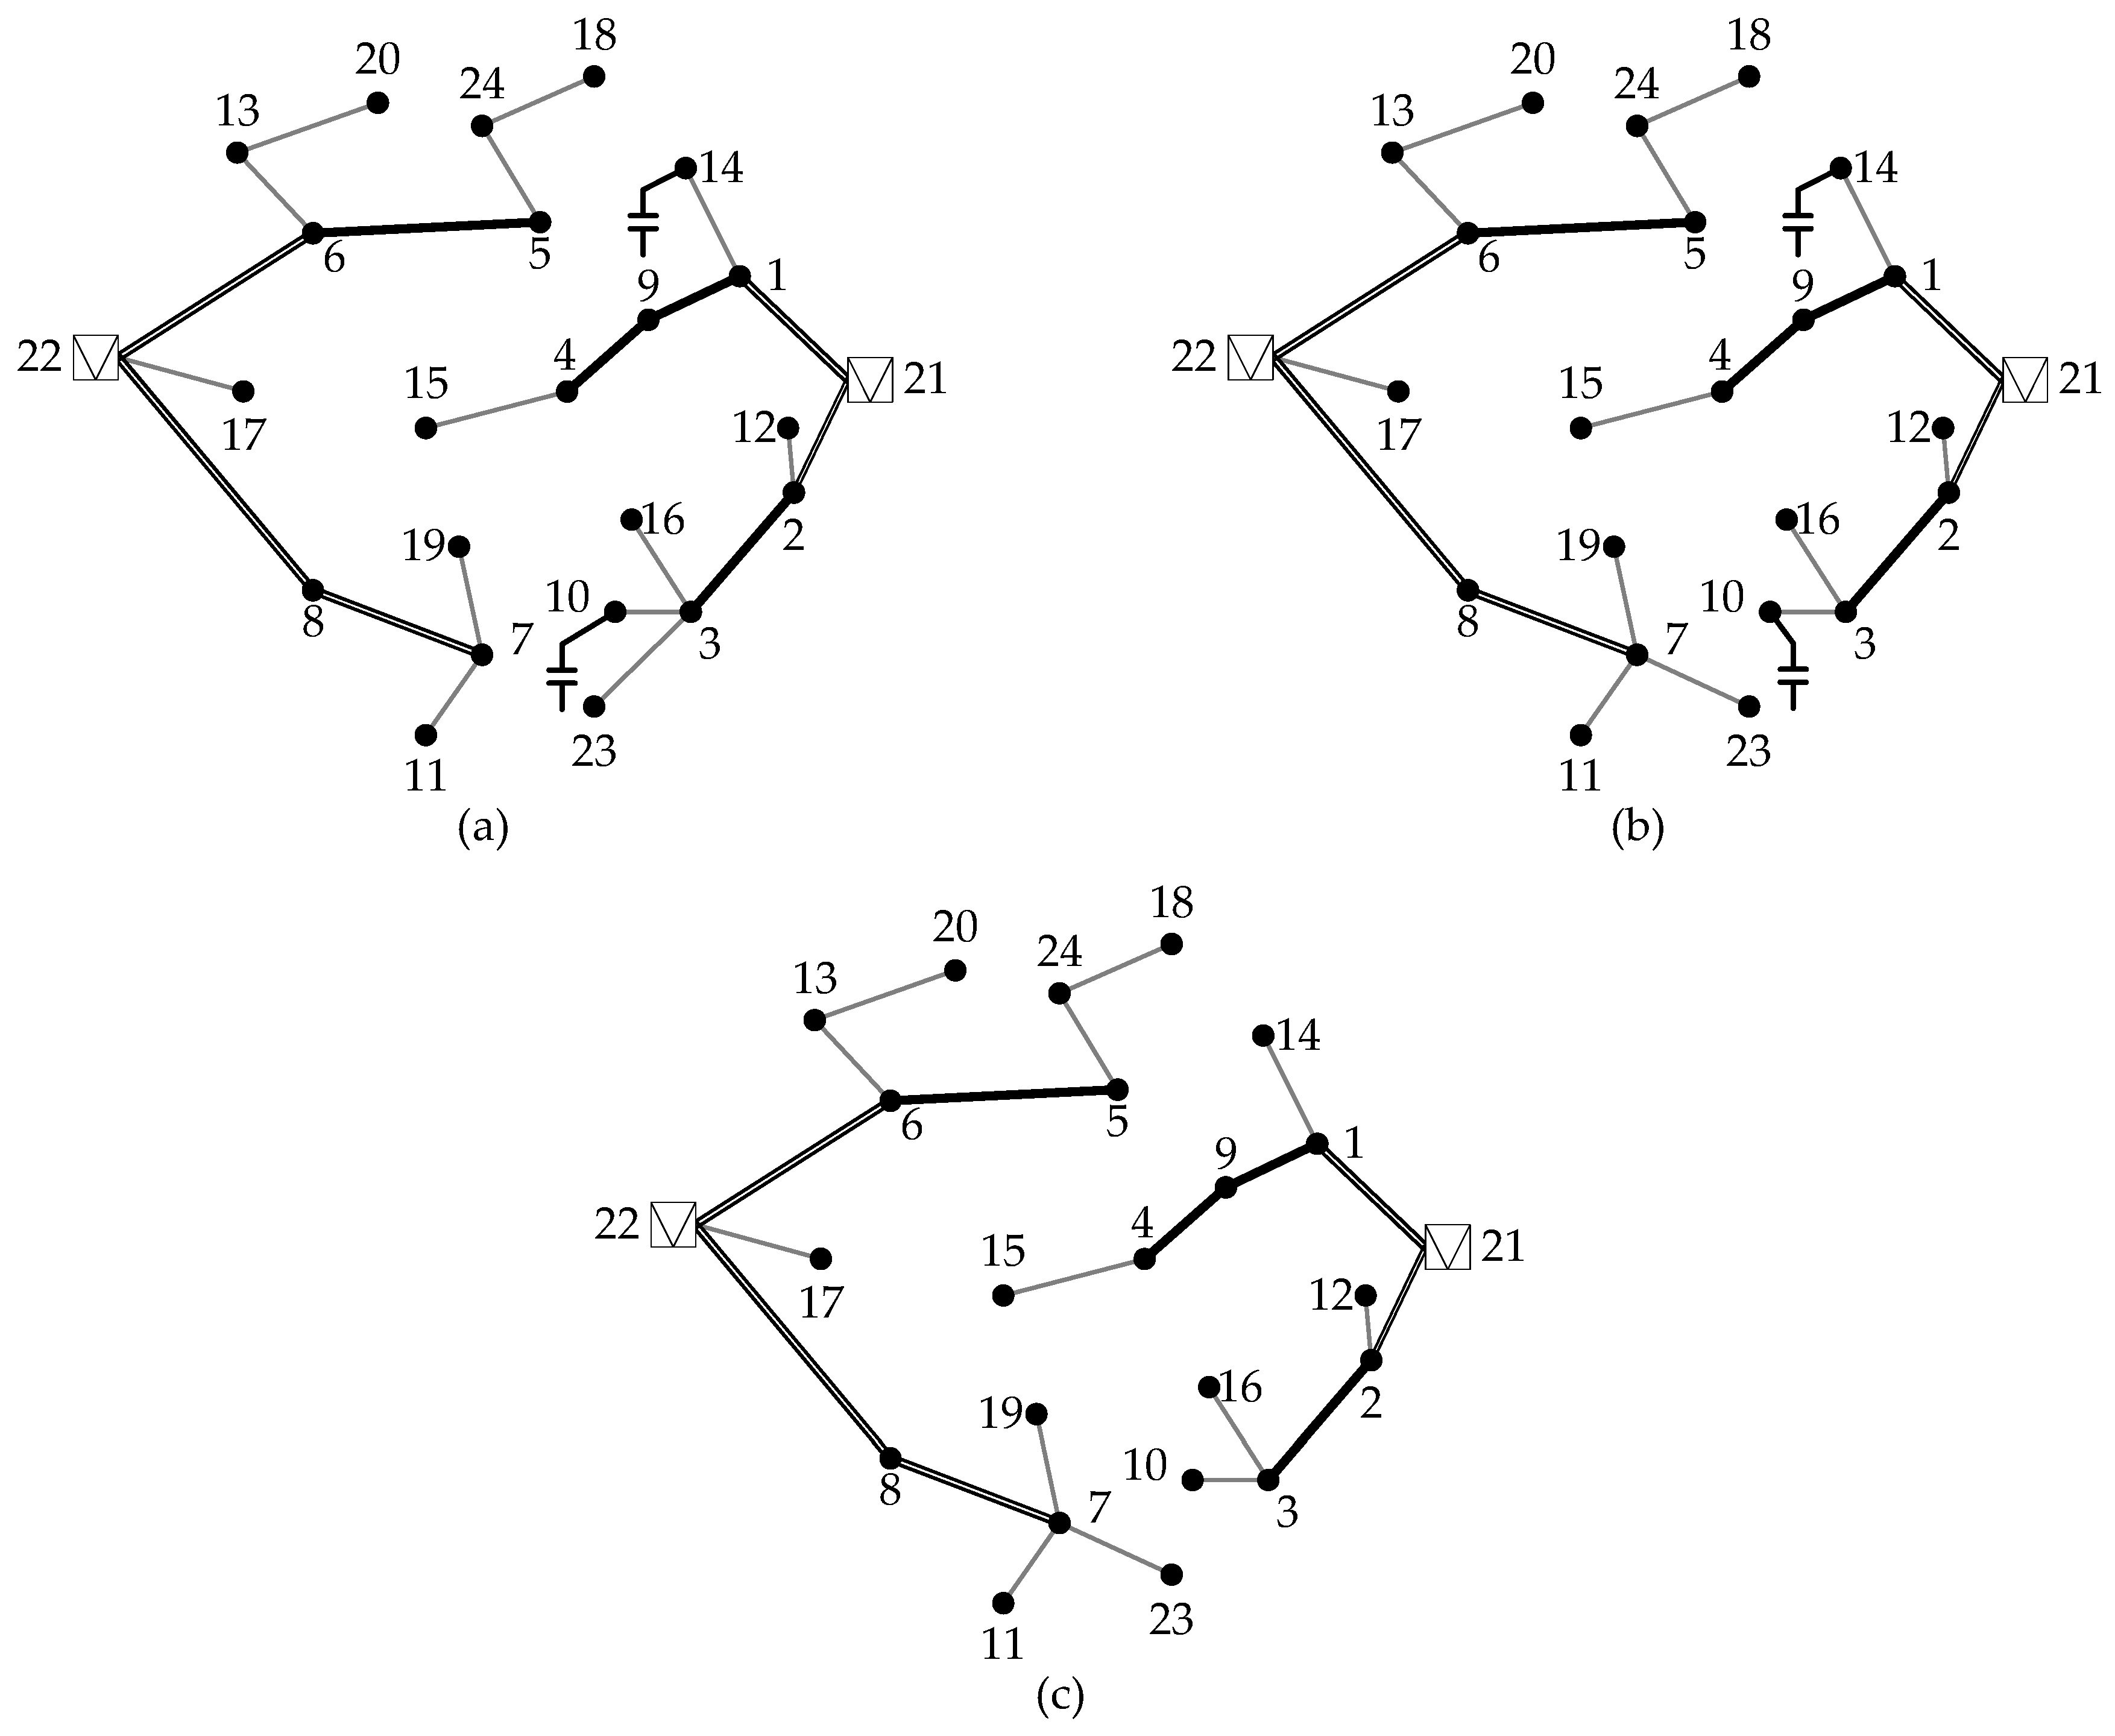
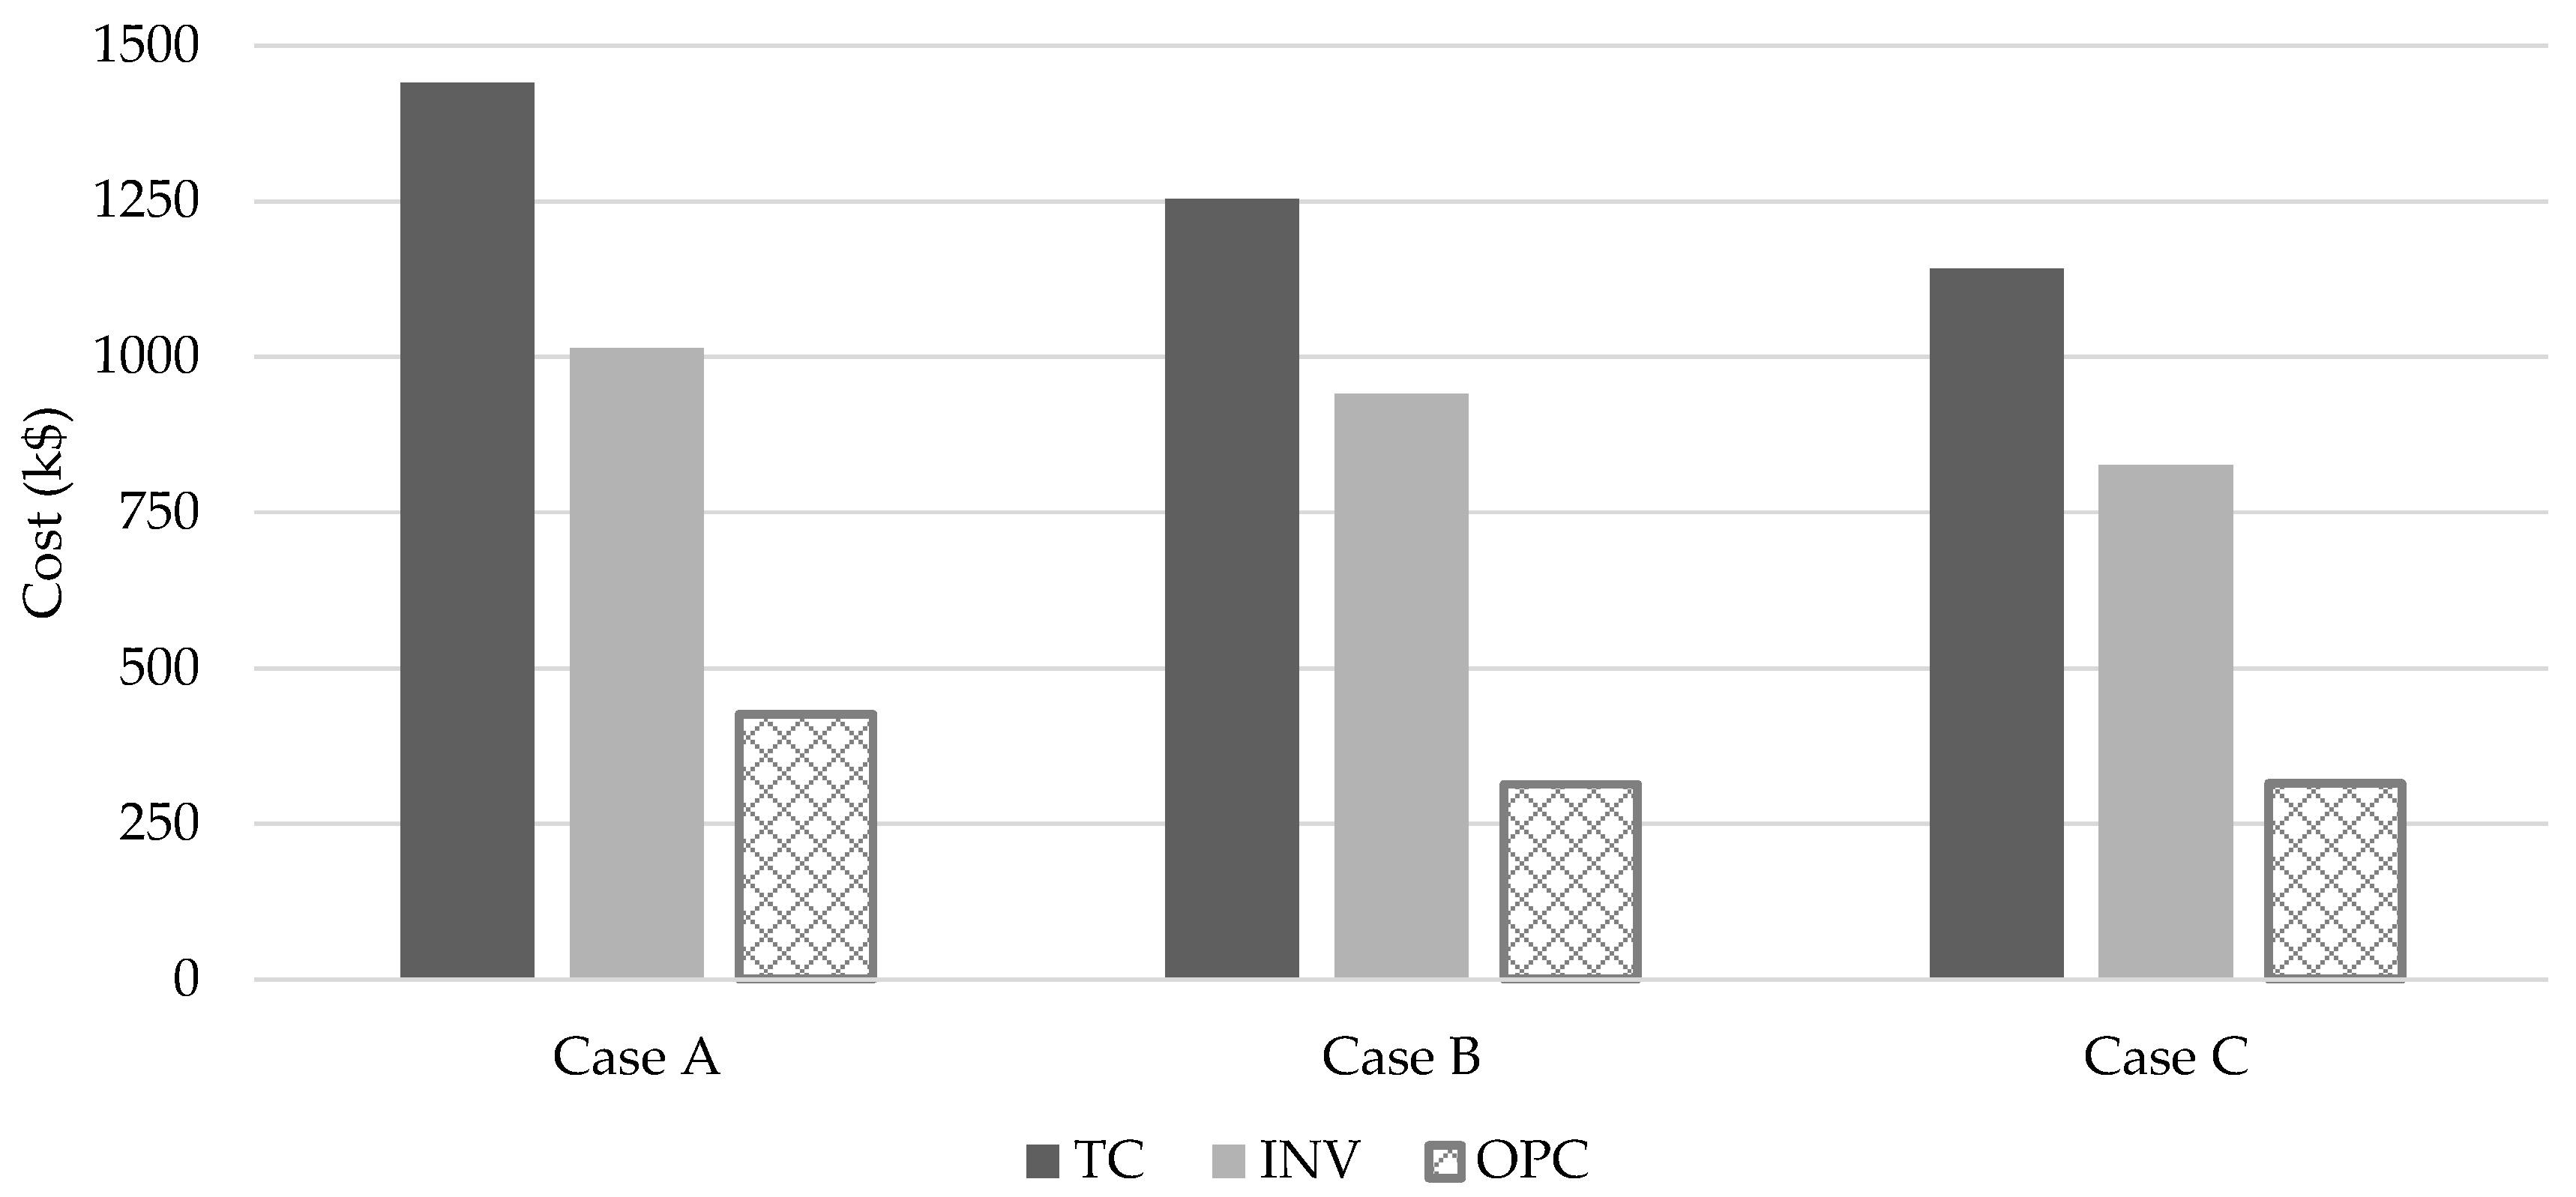
  • Case A: The DNP problem is solved considering that the DG units operate with unity power factor (i.e., there is no control of the output power of the DG units). Furthermore, the violation of the voltage and line capacity constraints is not allowed (i.e., β V = β S L = 0 ).
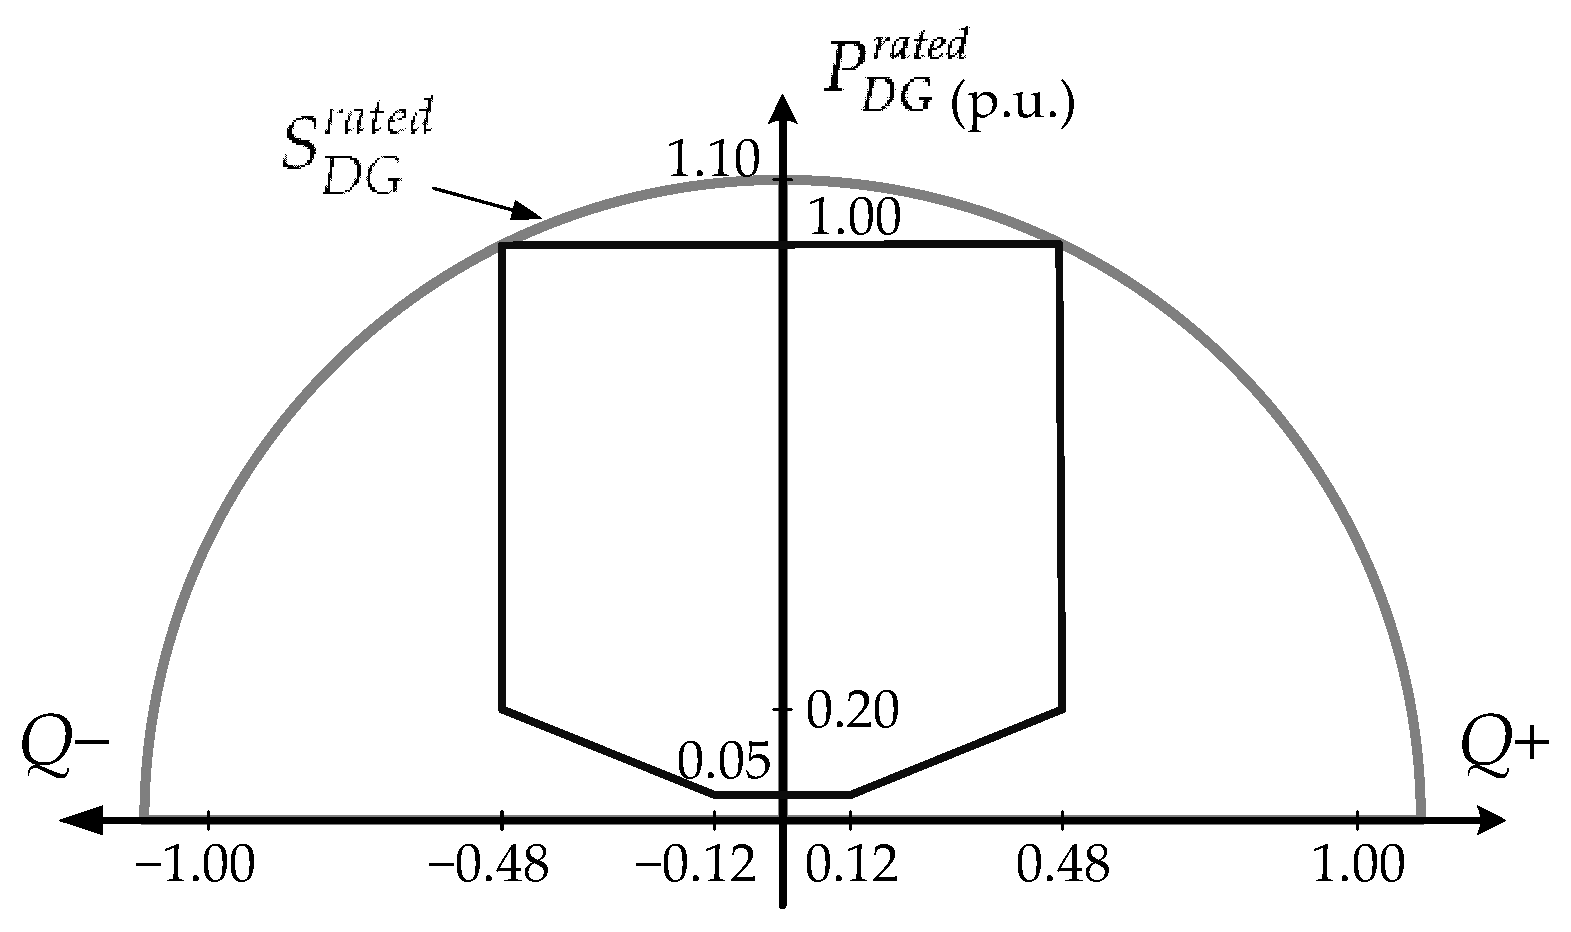
  • Case B: The DNP problem is solved considering the active management of the DG, while the violation of the voltage and line capacity constraints is not allowed (i.e., β V = β S L = 0 ).
  • Case C: The DNP problem is solved using the proposed multistage CCP planning method. The active management of DG is incorporated into the planning process and the minor violation of the voltage and line capacity constraints is allowed ( β V = 5 % , β S L = 10 % ).
The network topologies at the end of the planning period for Cases A–C are presented in Figure 6. Figure 7 presents the total cost (TC) of the reinforcement and expansion plan in Cases A–C, along with the investment (INV) and operational costs (OPC) in each case.
Case A: The net present value of the total cost of the reinforcement and expansion plan is 1440.17 k$ and the network topology at the end of the planning period is shown in Figure 6a. Due to the increase of renewable generation in the first two years of the planning period, distribution lines 21–2 and 22–8 are reinforced with a type 3 conductor at year 1 and year 2, respectively, of the planning period. To meet the load growth demand, distribution line 21–1 is reinforced with a type 3 conductor 390 at year 3; distribution line 8–7 is reinforced with a type 3 conductor at year 6; and distribution line 21–1 is reinforced with a type 3 conductor at year 11. The capacity of the substations at bus 21 and bus 22 is increased to 25 MVA at year 13 in order to ensure that the substations will operate within their capacity limits during the whole planning period. The network operation within their voltage limits is guaranteed by the installation of two capacitors at bus 10 at year 18 and at bus 14 at year 19.
Case B: Figure 6b presents the network topology at the end of the planning period considering the active management of the DG units. In this case, the net present value of the total cost is 1253.75 k$. The main differences between the network topology of Case A and Case B are the deferral of the investments on the reinforcement of distribution lines 21–2 and 22–8 due to the active management of the DG units. More specifically, the distribution line 22–8 is reinforced with type 3 conductor at year 4 and the distribution line 21–2 is reinforced with type 3 conductor at year 11 in order to meet the load demand. Furthermore, the distribution line 7–23, which has smaller length than line 3–23, is added to connect the wind DG unit at bus 23 to the network. Moreover, as shown in Figure 7, the incorporation of the active management of the DG units into the planning process results in the decrease of the operational cost of the planning solution compared with the operational cost of the planning solution in Case A.
Case C: Considering the CCP planning framework, the network topology at the end of the planning period is illustrated in Figure 6c. In this case, the net present value of the total cost is 1141.50 k$. Due to the proposed CCP framework, the main differences between Cases B and C are the deferral of the investments on the reinforcement of distribution lines and the placement of capacitors for later years of the planning period. More specifically, distribution line 21–1 is reinforced with a type 3 conductor at year 7; distribution lines 21–8 and 8–7 are reinforced with a type 3 conductor at year 8; distribution line 22–6 is reinforced with a type 3 conductor at year 14; distribution line 21–2 is reinforced with a type 3 conductor at year 15; no capacitors are installed in bus 10 and bus 14.
As is shown in Figure 7, the planning solution with the lowest total cost is obtained in case the active management of the DG units and the CCP framework are incorporated into the planning process (Case C). More specifically, the exploitation of the control capabilities of the DG units results in the deferral of the network investments, which are necessary for the connection of the DG units to the network, while adopting the CCP planning framework results in the deferral of the network investments, which are necessary due the increase of the load demand. Hence, the total cost of the planning solution of Case C, which is the proposed one, is 21% lower than the cost of the planning solution of Case A and 9% lower than the cost of the planning solution of Case B.

6. Conclusions

This paper proposes a multistage planning method of ADNs. The uncertainties of load, wind and solar generation are modeled using a method based on the k-means clustering technique and they are incorporated into the optimization procedure. A chance constrained DNP optimization model is introduced to efficiently handle these uncertainties and the objective function of the proposed methodology is to minimize the operational cost and the investment costs for the reinforcement of substations and distribution lines, the addition of distribution lines and the placement of capacitors. A problem specific GA is proposed for the solution of the DNP optimization problem. The effect of the active network management on the optimal solution of the DNP problem is investigated. To demonstrate the performance of the proposed planning methodology a 24-bus distribution test system is used. Results clearly show that the consideration of active management of the active and reactive power output of the DG units achieves a significant deferral of the investment cost compared with the traditional planning approaches. Furthermore, the proposed CCP model provides valuable information about the relationship between the investment cost, the risk of distribution lines’ overload probability and the risk of voltage limit violation.

Author Contributions

Conceptualization, N.K. and P.G.; methodology, N.K. and P.G.; software, N.K.; validation, N.K. and P.G.; formal analysis, N.K. and P.G.; investigation, N.K. and P.G.; resources, N.K. and P.G.; data curation, N.K.; writing—original draft preparation, N.K.; writing—review and editing, P.G.; visualization, N.K.; supervision, P.G.; project administration, P.G.; funding acquisition, P.G.

Funding

This research has been co-financed by the European Union and Greek national funds through the Operational Program Competitiveness, Entrepreneurship and Innovation, under the call RESEARCH–CREATE–INNOVATE (project code: T1EDK-00450).

Conflicts of Interest

The authors declare no conflict of interest.

Nomenclature

A. Sets
ΚLoad-generation sets.
TPlanning period.
Ω N Set of system buses.
Ω L Set of distribution lines.
Φ C B Set of candidate buses for capacitor.
Φ L A Set of candidate lines to be added.
Φ L R Set of candidate lines to be reinforced.
Φ S S Set of substation buses.
Ψ C B Set of available capacitors.
Ψ c d Set of available conductors.
Ψ S S Set of available substations.
B. Parameters
C C B , c Cost of type c capacitor.
C c d , b Cost of type b conductor.
C S S , a Cost of type a substation.
C L o s s Cost of losses.
I n f Inflation rate.
I n t Interest rate.
l i j Length of line ij.
P d , i , k , t / Q d , i , k , t Active/reactive load demand of bus i at the load-generation set k during stage t.
P d g , i , k , t Active power of the distributed generation (DG) unit at bus i at the load-generation set k during stage t.
P D G , i , t r a t e d Rated active power of the DG unit at bus i during stage t.
P S D G , i , t r a t e d Rated active power of the solar DG unit at bus i during stage t.
P s d g , k Solar DG at load-generation set k.
P W D G , i , t r a t e d Rated active power of the wind DG unit at bus i during stage t.
P w d g , k Wind DG at load-generation set k.
Q C B , i Nominal reactive power of the capacitor at bus i.
g b / b b Conductance/susceptance of type b conductor.
S D G , i r a t e d Maximum apparent power of the DG unit at bus i.
S L , b max Thermal limit of type b conductor.
S S S , a max Capacity of type a substation.
s , s n Solar irradiance, nominal solar irradiance.
V min / V max Minimum/maximum voltage magnitude limits.
v , v n , v c i , v c o Wind speed, nominal wind speed, cut-in wind speed, cut-out wind speed.
C. Variables
C F i , k , t Curtailment factor of the active power output of the DG unit at bus i at the load-generation set k during stage t.
P i j , k , t / Q i j , k , t Active/reactive power flow of line ij at the load-generation set k during stage t.
P l o s s , k , t Power losses at the load-generation set k during stage t.
P S S , i , k , t / Q S S , i , k , t Active/reactive power flow of substation at bus i at the load-generation set k during stage t.
Q d g , i , k , t Reactive power of the DG unit of bus i at the load-generation set k during stage t.
Q s d g , i , k , t Reactive power of the solar DG unit of bus i at the load-generation set k during stage t.
Q w d g , i , k , t Reactive power of the wind DG unit of bus i at the load-generation set k during stage t.
V i , k , t Voltage magnitude of bus i at the load-generation set k during stage t.
θ i j , k , t Voltage angle difference between bus i and j at the load-generation set k during stage t.
D. Binary Variables
i d i , a , t S S Investment decision variable for the reinforcement of substation at bus i using type a substation at period t.
i d i j , b , t L Investment decision variable for the installation of line ij using type b conductor at period t.
i d i , c , t C B Investment decision variable for the installation of type c capacitor at bus i at period t.
r d i j , t Spanning tree variable. It is equal to 1 if bus i is the parent of bus j at period t; otherwise it is equal to 0.
u z i , a , t S S , u z i j , b , t L , u z i , c , t C B Auxiliary variables associated with the investment decision variable for the reinforcement of substation at bus i, the installation of line ij using type b conductor, and the installation of type c capacitor at bus i, respectively, at period t.

Appendix A

Table A1 presents the load of the 24-bus distribution network at the reference year.
Table A1. Load data of the 24-bus distribution network at the reference year.
BusP (MW)Q (Mvar)BusP (MW)Q (Mvar)
13.331.6160.770.37
20.520.2572.951.43
32.431.1880.470.23
40.300.1490.820.40
50.190.09

References

  1. Lopes, J.P.; Hatziargyriou, N.; Mutale, J.; Djapic, P.; Jenkins, N. Integrating distributed generation into electric power systems: A review of drivers, challenges and opportunities. Electr. Power Syst. Res. 2007, 77, 1189–1203. [Google Scholar] [CrossRef] [Green Version]
  2. Khator, S.K.; Leung, L.C. Power distribution planning: A review of models and issues. IEEE Trans. Power Syst. 1997, 12, 1151–1159. [Google Scholar] [CrossRef]
  3. Georgilakis, P.S.; Hatziargyriou, N.D. A review of power distribution planning in the modern power systems era: Models, methods and future research. Electr. Power Syst. Res. 2015, 121, 89–100. [Google Scholar] [CrossRef]
  4. Li, R.; Wang, W.; Chen, Z.; Jiang, J.; Zhang, W. A review of optimal planning active distribution system: Models, methods, and future researches. Energies 2017, 10, 1715. [Google Scholar] [CrossRef]
  5. Fichera, A.; Volpe, R.; Frasca, M. Assessment of the energy distribution in urban areas by using the framework of complex network theory. Int. J. Heat Technol. 2016, 34, S430–S434. [Google Scholar] [CrossRef]
  6. Fichera, A.; Frasca, M.; Volpe, R. The centralized energy supply in a network of distributed energy systems: A cost-based mathematical approach. Int. J. Heat Technol. 2016, 35, S191–S195. [Google Scholar] [CrossRef]
  7. Ziari, I.; Ledwich, G.; Ghosh, A.; Platt, G. Optimal distribution network reinforcement considering load growth, line loss, and reliability. IEEE Trans. Power Syst. 2012, 28, 587–597. [Google Scholar] [CrossRef]
  8. Humayd, A.S.B.; Bhattacharya, K. Comprehensive multi-year distribution system planning using back-propagation approach. IET Gener. Transm. Distrib. 2013, 7, 1415–1425. [Google Scholar] [CrossRef]
  9. Tabares, A.; Franco, J.F.; Lavorato, M.; Rider, M.J. Multistage long-term expansion planning of electrical distribution systems considering multiple alternatives. IEEE Trans. Power Syst. 2015, 31, 1900–1914. [Google Scholar] [CrossRef]
  10. Zeng, B.; Zhang, J.; Yang, X.; Wang, J.; Dong, J.; Zhang, Y. Integrated planning for transition to low-carbon distribution system with renewable energy generation and demand response. IEEE Trans. Power Syst. 2013, 29, 1153–1165. [Google Scholar] [CrossRef]
  11. Muñoz-Delgado, G.; Contreras, J.; Arroyo, J.M. Joint expansion planning of distributed generation and distribution networks. IEEE Trans. Power Syst. 2014, 30, 2579–2590. [Google Scholar] [CrossRef]
  12. Koutsoukis, N.C.; Georgilakis, P.S.; Hatziargyriou, N.D. Multistage coordinated planning of active distribution networks. IEEE Trans. Power Syst. 2017, 33, 32–44. [Google Scholar] [CrossRef]
  13. Martins, V.F.; Borges, C.L. Active distribution network integrated planning incorporating distributed generation and load response uncertainties. IEEE Trans. Power Syst. 2011, 26, 2164–2172. [Google Scholar] [CrossRef]
  14. Asensio, M.; de Quevedo, P.M.; Muñoz-Delgado, G.; Contreras, J. Joint distribution network and renewable energy expansion planning considering demand response and energy storage—Part I: Stochastic programming model. IEEE Trans. Smart Grid 2016, 9, 655–666. [Google Scholar] [CrossRef]
  15. Asensio, M.; de Quevedo, P.M.; Muñoz-Delgado, G.; Contreras, J. Joint distribution network and renewable energy expansion planning considering demand response and energy storage—Part II: Numerical results. IEEE Trans. Smart Grid 2016, 9, 667–675. [Google Scholar] [CrossRef]
  16. Asensio, M.; Muñoz-Delgado, G.; Contreras, J. Bi-level approach to distribution network and renewable energy expansion planning considering demand response. IEEE Trans. Power Syst. 2017, 32, 4298–4309. [Google Scholar] [CrossRef]
  17. De Durana, J.M.G.; Barambones, O.; Kremers, E.; Varga, L. Agent based modeling of energy networks. Energy Convers. Manag. 2014, 82, 308–319. [Google Scholar] [CrossRef] [Green Version]
  18. Kremers, E.; de Durana, J.G.; Barambones, O. Multi-agent modeling for the simulation of a simple smart microgrid. Energy Convers. Manag. 2013, 75, 643–650. [Google Scholar] [CrossRef]
  19. Fichera, A.; Pluchino, A.; Volpe, R. A multi-layer agent-based model for the analysis of energy distribution networks in urban areas. Physica A 2018, 508, 710–725. [Google Scholar] [CrossRef] [Green Version]
  20. Charnes, A.; Cooper, W.W. Chance-constrained programming. Manag. Sci. 1959, 6, 73–79. [Google Scholar] [CrossRef]
  21. Jain, A.K. Data clustering: 50 years beyond k-means. Pattern Recognit. Lett. 2010, 31, 651–666. [Google Scholar] [CrossRef]
  22. Oshnoei, A.; Khezri, R.; Tarafdar Hagh, M.; Techato, K.; Muyeen, S.M.; Sadeghian, O. Direct probabilistic load flow in radial distribution systems including wind farms: An approach based on data clustering. Energies 2018, 11, 310. [Google Scholar] [CrossRef]
  23. Jain, A.K.; Murty, M.N.; Flynn, P.J. Data clustering: A review. ACM Comput. Survey 1999, 31, 264–323. [Google Scholar] [CrossRef]
  24. Kanungo, T.; Mount, D.M.; Netanyahu, N.S.; Piatko, C.D.; Silverman, R.; Wu, A.Y. An efficient k-means clustering algorithm: Analysis and implementation. IEEE Trans. Pattern Anal. Mach. Intell. 2002, 24, 881–892. [Google Scholar] [CrossRef]
  25. Steinley, D. K-means clustering: A half-century synthesis. Br. J. Math. Stat. Psychol. 2006, 59, 1–34. [Google Scholar] [CrossRef] [Green Version]
  26. Hartigan, J.A.; Wong, M.A. A K-means clustering algorithm. Appl. Stat. 2012, 28, 100–108. [Google Scholar] [CrossRef]
  27. Calinski, T.; Harabasz, J. A dendrite method for cluster analysis. Commun. Stat. Theory Methods 1974, 3, 1–27. [Google Scholar] [CrossRef]
  28. Milligan, G.W.; Cooper, M.C. An examination of procedures for determining the number of clusters in a dataset. Psychometrika 1985, 50, 159–179. [Google Scholar] [CrossRef]
  29. Koutsoukis, N.C.; Siagkas, D.O.; Georgilakis, P.S.; Hatziargyriou, N.D. Online reconfiguration of active distribution networks for maximum integration of distributed generation. IEEE Trans. Autom. Sci. Eng. 2018, 14, 437–448. [Google Scholar] [CrossRef]
  30. Nick, M.; Cherkaoui, R.; Paolone, M. Optimal allocation of dispersed energy storage systems in active distribution networks for energy balance and grid support. IEEE Trans. Power Syst. 2014, 29, 2300–2310. [Google Scholar] [CrossRef]
  31. Sadeghian, O.; Oshnoei, A.; Kheradmandi, M.; Khezri, R.; Mohammadi-Ivatloo, B. A robust data clustering method for probabilistic load flow in wind integrated radial distribution networks. Int. J. Electr. Power Energy Syst. 2020, 115, 105392. [Google Scholar] [CrossRef]
  32. Kalyani, S.; Swarup, K.S. Particle swarm optimization based K-means clustering approach for security assessment in power systems. Expert Syst. Appl. 2011, 38, 10839–10846. [Google Scholar] [CrossRef]
  33. Jabr, R.A.; Singh, R.; Pal, B.C. Minimum loss network reconfiguration using mixed-integer convex programming. IEEE Trans. Power Syst. 2012, 27, 1106–1115. [Google Scholar] [CrossRef]
  34. Koutsoukis, N.; Georgilakis, P.; Hatziargyriou, N. Service restoration of active distribution systems with increasing penetration of renewable distributed generation. IET Gener. Trans. Distrib 2019, 13, 3177–3187. [Google Scholar] [CrossRef]
  35. Liu, Z.; Wen, F.; Ledwich, G. Optimal siting and sizing of distributed generators in distribution systems considering uncertainties. IEEE Trans. Power Deliv. 2011, 26, 2541–2551. [Google Scholar] [CrossRef]
  36. Yu, H.; Chung, C.Y.; Wong, K.P.; Zhang, J.H. A chance constrained transmission network expansion planning method with consideration of load and wind farm uncertainties. IEEE Trans. Power Syst. 2009, 24, 1568–1576. [Google Scholar] [CrossRef]
  37. Franco, J.F.; Rider, M.J.; Romero, R. Robust multi-stage substation expansion planning considering stochastic demand. IEEE Trans. Power Syst. 2015, 31, 2125–2134. [Google Scholar] [CrossRef]
  38. Goldberg, D.E.; Holland, J.H. Genetic algorithms and machine learning. Mach. Learn. 1988, 3, 95–99. [Google Scholar] [CrossRef]
  39. Deb, K. Multi-Objective Optimization Using Evolutionary Algorithms; John Wiley & Sons: Chichester, UK, 2001. [Google Scholar]
  40. Miranda, V.; Ranito, J.V.; Proenca, L.M. Genetic algorithms in optimal multistage distribution network planning. IEEE Trans. Power Syst. 1994, 9, 1927–1933. [Google Scholar] [CrossRef]
  41. Ramirez-Rosado, I.J.; Bernal-Agustin, J.L. Genetic algorithms applied to the design of large power distribution systems. IEEE Trans. Power Syst. 1998, 13, 696–703. [Google Scholar] [CrossRef]
  42. Carrano, E.G.; Soares, L.A.E.; Takahashi, R.H.C.; Saldanha, R.R.; Neto, O.M. Electric distribution network multiobjective design using a problem-specific genetic algorithm. IEEE Trans. Power Deliv. 2006, 21, 995–1005. [Google Scholar] [CrossRef]
  43. Yehiay, O. Penalty function methods for constrained optimization with genetic algorithms. Math. Comput. Appl. 2005, 10, 45–56. [Google Scholar]
Figure 1. Hourly data of: (a) load demand, (b) wind speed, and (c) solar irradiance of a year.
Energies 12 04154 g001
Figure 2. Hourly profile of: (a) load demand, (b) wind generation, and (c) solar generation of a year.
Energies 12 04154 g002
Figure 3. P-Q capability curve of DG units.
Energies 12 04154 g003
Figure 4. (a) Illustrative 6-bus distribution network, (b) Encoded candidate solution, (c) Decoded candidate solution.
Energies 12 04154 g004
Figure 5. 24-bus distribution network.
Energies 12 04154 g005
Figure 6. DNP solutions of the 24-bus distribution network in: (a) Case A, (b) Case B, and (c) Case C.
Energies 12 04154 g006
Figure 7. Total cost (TC), investment cost (INV), operational cost (OPC) for the planning solutions in Case A, Case B and Case C.
Energies 12 04154 g007
Table 1. Future load points.
BusLoad (MVA)YearBusLoad (MVA)Year
101.561160.873
111.912172.162
120.932181.503
131.152191.293
153.052202.713
Table 2. Future DG units.
BusTypeRated Power (MW)Year
3Solar4.002
7Solar2.001
15Wind5.003
23Wind5.001
24Solar2.002
Table 3. Techno-economic data.
Inflation rate2%
Interest rate8%
Losses cost ($/kWh)0.01
A. Substations
TypeCapacity (MVA)Cost (k$)
12550
B. Conductors
TypeR (Ohm/km)X (Ohm/km)Ampacity (A)Cost (k$/km)
11.270.4215025
20.580.3928050
30.220.3340075
C. Capacitors
TypeCapacity (Mvar)Cost (k$)
11.230

